Attached files
| file | filename |
|---|---|
| EX-32.2 - EXHIBIT 32.2 - FALCONSTOR SOFTWARE INC | ex322-2015.htm |
| EX-23.2 - EXHIBIT 23.2 - FALCONSTOR SOFTWARE INC | ex232-2015.htm |
| EX-23.1 - EXHIBIT 23.1 - FALCONSTOR SOFTWARE INC | ex231-2015.htm |
| EX-31.1 - EXHIBIT 31.1 - FALCONSTOR SOFTWARE INC | ex311-2015.htm |
| EX-31.2 - EXHIBIT 31.2 - FALCONSTOR SOFTWARE INC | ex312-2015.htm |
| EX-32.1 - EXHIBIT 32.1 - FALCONSTOR SOFTWARE INC | ex321-2015.htm |
SECURITIES AND EXCHANGE COMMISSION
Washington, D.C. 20549
FORM 10-K
ý | ANNUAL REPORT PURSUANT TO SECTION 13 OR 15(d) OF THE SECURITIES EXCHANGE ACT OF 1934 |
For the fiscal year ended December 31, 2015.
OR
¨ | TRANSITION REPORT TO SECTION 13 OR 15(d) OF THE SECURITIES EXCHANGE ACT OF 1934 |
For the transition period from __________ to __________
Commission file number 0-23970
FALCONSTOR SOFTWARE, INC.
(Exact name of registrant as specified in its charter)
DELAWARE | 77-0216135 |
(State or other jurisdiction of | (I.R.S. Employer |
incorporation or organization) | Identification No.) |
2 Huntington Quadrangle, Suite 2S01 | 11747 |
Melville, New York | (Zip code) |
(Address of principal executive offices) | |
Registrant's telephone number, including area code: 631-777-5188
Securities registered pursuant to Section 12(b) of the Act:
Name of Each Exchange on Which | |
Title of Each Class | the Securities are Registered |
Common Stock, $.001 par value | NASDAQ Global Market |
Securities registered pursuant to Section 12(g) of the Act: None
Indicate by check mark if the registrant is a well-known seasoned issuer, as defined in Rule 405 of the Securities Act. Yes ¨ No ý
Indicate by check mark if the registrant is not required to file reports pursuant to Section 13 or Section 15(d) of the Act. Yes ¨ No ý
Indicate by check mark whether the registrant (1) has filed all reports required to be filed by Section 13 or 15(d) of the Securities Exchange Act of 1934 during the preceding 12 months (or for such shorter period that the Registrant was required to file such reports), and (2) has been subject to such filing requirements for the past 90 days. Yes ý No ¨
Indicate by check mark whether the registrant has submitted electronically and posted on its corporate Web site, if any, every Interactive Data File required to be submitted and posted pursuant to Rule 405 of Regulation S-T (§232.405 of this chapter) during the preceding 12 months (or for such shorter period that the registrant was required to submit and post such files). Yes ý No ¨
Indicate by check mark if disclosure of delinquent filers pursuant to Item 405 of Regulation S-K is not contained herein, and will not be contained, to the best of registrant's knowledge, in definitive proxy or information statements incorporated by reference in Part III of this Form 10-K or any amendment to this Form 10-K. ¨
Indicate by check mark whether the registrant is a large accelerated filer, an accelerated filer, a non-accelerated filer, or a smaller reporting company. See definition of “large accelerated filer”, “accelerated filer”, and “smaller reporting company” in Rule 12b-2 of the Exchange Act.
Large accelerated filer | ¨ | Accelerated filer | ý | |
Non-accelerated filer | ¨ | Smaller Reporting Company | o | |
Indicate by check mark whether the registrant is a shell company (as defined in Rule 12b-2 of the Exchange Act). Yes ¨ No ý
The aggregate market value of Common Stock held by non-affiliates of the Registrant as of June 30, 2015 was $55,272,418 which value, solely for the purposes of this calculation excludes shares held by Registrant's officers and directors. Such exclusion should not be deemed a determination by Registrant that all such individuals are, in fact, affiliates of the Registrant. The number of shares of Common Stock issued and outstanding as of January 31, 2016 was 57,298,017 and 41,769,947, respectively.
Documents Incorporated by Reference:
The information required by Part III of Form 10-K will be incorporated by reference to certain portions of a definitive proxy statement which is expected to be filed by the Company pursuant to Regulation 14A within 120 days after the close of its fiscal year.
FALCONSTOR SOFTWARE, INC. AND SUBSIDIARIES
2015 ANNUAL REPORT ON FORM 10-K
TABLE OF CONTENTS
Page | ||
2
PART I
Item 1. Business
OVERVIEW
FalconStor Software, Inc. (“FalconStor”, the “Company”, “we”, “our” or “us”) is a leading Software-Defined Storage ("SDS") company offering a converged data services software platform that is hardware agnostic. Founded in 2000, the Company celebrated its 15th year in business with the launch of its new flagship platform, FreeStor®, which was made generally available in May, 2015. As a global company, our vision is to deliver enterprise class, software-defined, intelligent data services combined with predictive analytics across any primary or secondary storage hardware; in the cloud or on premise. The Company mission is to help IT organizations realize more economic value out of existing environments and any future storage investments while reducing complexity, maximizing flexibility and improving operational efficiency. Our award-winning solutions are available and supported worldwide by OEMs as well as leading service providers, system integrators, resellers and FalconStor.
FalconStor was incorporated in Delaware as Network Peripherals, Inc., in 1994. Pursuant to a merger with FalconStor Inc., in 2001, the former business of Network Peripherals, Inc., was discontinued, and the newly re-named FalconStor Software, Inc., continued the storage software business started in 2000 by FalconStor, Inc. FalconStor’s headquarters are located at 2 Huntington Quadrangle, Suite 2S01, Melville, NY 11747. The Company also maintains offices throughout Europe and Asia Pacific.
FREESTOR
FreeStor is a milestone product for FalconStor, leading the industry with what we believe to be the most complete, software-defined, hardware agnostic platform to deliver a truly heterogeneous data services approach. While virtualization has streamlined some common tasks associated with managing data resources, the introduction of a virtualization layer can introduce a whole new level of complexity to the protection, recovery and integration of both virtual and non-virtualized resources. FreeStor helps IT organizations minimize and eliminate that complexity with the delivery of migration, continuity, protection, recovery and optimization services for any storage environment through a single management interface - all for a single price based on managed capacity across arrays, servers, hypervisors, data centers, and the cloud.
FalconStor accomplishes this through the introduction of its Intelligent Abstraction® core, which provides a scalable storage hypervisor, coupled with a data services engine and automation, to ease the provisioning and management of storage resources with the right level of performance, protection and recovery. The Intelligent Abstraction core optimizes storage resources regardless of type, connectivity, brand or speed, into a storage resource pool that can be provisioned to physical or virtual applications, along with common, unified data services across that pool. FreeStor is designed to eliminate the complexity and incompatibilities of point solutions along with the time involved in managing disparate underlying storage found in today’s enterprise.
PRODUCT STRATEGY
FalconStor’s stated strategy is to focus on the development of the integrated FreeStor platform going forward. However, FalconStor’s point solutions are also built upon FreeStor technology and our Intelligent Abstraction core IO engine. As previously stated, our existing point products will continue to be made available. Our Business Continuity and Disaster Recovery products include Network Storage Server (NSS) and Continuous Data Protector (CDP) and feature what we believe is the industry’s most automated and complete recovery tool, RecoverTrac. These solutions set themselves apart by supporting physical, virtual, hybrid and private cloud environments. We believe a key differentiator is our ability to allow users to manage and to convert across these environments dynamically, giving them the freedom to optimize their IT infrastructure and to eliminate costly vendor and form-factor lock-in. Our Optimized Backup and Deduplication (OBD) product merges our industry-leading Virtual Tape Library (VTL) and File-interface Deduplication System (FDS) solutions to help customers optimize the performance of their existing backup infrastructure, while reducing the cost of underlying storage and data replication. From Fortune 100 enterprises to medium-size businesses, customers across a vast range of industries worldwide have implemented FalconStor solutions in their production IT environments. Whether it is to meet their recovery time objectives (RTO) or their recovery point objectives (RPO), FalconStor helps end users manage their storage infrastructures with minimal total cost of ownership (TCO) and with optimal return on investment (ROI).
3
FalconStor’s commitment to an open, software-based approach continues. In October 2015, we introduced a new Cinder driver to the OpenStack community. This driver allows users of OpenStack, a free, open source infrastructure virtualization software platform, to utilize FreeStor APIs to deliver proven, enterprise-class data services and stability to this newly emerging platform. FalconStor believes that as open-source projects mature, as a company, we have an opportunity to provide our thought leadership and expertise to help the open source community deliver mature, stable capabilities to everyone. We also continue to support open storage networking for any-to-any connectivity via native support for industry standards (including Fibre Channel (FC), iSCSI, SCSI, SAS, SATA and Fibre Channel over Ethernet (FCOE)). The result delivers unified support for multiple storage architectures. FalconStor solutions provide companies of almost any size and complexity with the freedom to implement their choice of state-of-the-art equipment based on any standard protocol from any storage manufacturer, without rendering their existing or future investments obsolete.
FalconStor’s products have been certified by many industry leaders which are available on our website at: www.falconstor.com/certification-matrix.
Deployment options
FalconStor sells its solutions primarily as standalone software, or as virtual appliances. An option to deliver the software pre-installed on FalconStor-supplied hardware appliances is also available upon request.
Solutions
FalconStor is focused on offering solutions in four core areas:
• | Data Migration |
• | Continuous Availability |
• | Data Protection + Recovery |
• | Optimization |
Our core products enable these solutions as follows:
• | FreeStor® - An integrated software-defined platform that provides, migration, continuity, protection, recovery and optimization for any storage environment through a single management interface |
• | FalconStor® NSS - Migration, storage virtualization, provisioning, and management |
• | FalconStor® CDP - Bootable snapshots, zero-impact backup and both local and remote disaster recovery |
• | FalconStor® RecoverTrac - Automated, policy based recovery for local and remote physical, virtual, private cloud and hybrid environments |
• | FalconStor® OBD - Optimized backup, archive to tape, and block-based deduplication, file-based deduplication and storage capacity optimization |
FalconStor solutions are scalable in order to address the needs of medium businesses, large organizations, and global enterprises. Our solutions offer high availability (HA) through RAID, synchronous and asynchronous mirroring, HA failover, and clustering technologies.
FreeStor®
FreeStor is an industry leading software-defined, completely hardware agnostic platform that delivers a truly heterogeneous data services approach. FreeStor helps IT organizations minimize and eliminate that complexity with the delivery of migration, continuity, protection, recovery and optimization services for any storage environment through a single management interface - all for a single price based on managed capacity across arrays, servers, hypervisors, data centers, and the cloud.
This is accomplished through the introduction of its Intelligent Abstraction® core IO engine, which provides a scalable storage hypervisor, coupled with a data services engine and automation, to ease the provisioning and management of storage resources with the right level of performance, protection and recovery. The Intelligent Abstraction core optimizes storage resources regardless of type, connectivity, brand or speed, into a storage resource pool that can be provisioned to physical or virtual applications, along with common, unified data services across that pool. FreeStor is designed to eliminate the complexity and incompatibilities of point solutions along with the time involved in managing disparate underlying storage found in today’s enterprise
4
FalconStor® Network Storage Server (NSS)
FalconStor NSS is a scalable, highly available solution that enables storage virtualization and business continuity in heterogeneous environments. Supporting existing third-party disk arrays, FalconStor NSS eliminates storage boundaries and vendor lock-in, providing fast and easy data storage provisioning and migration. From a small iSCSI virtual server lab to an enterprise-class Fibre Channel SAN running Tier-1 database applications, FalconStor NSS is designed to meet all of the storage needs of any organization.
Moving data between different storage platforms can be complex, time consuming, and disruptive to business operations. FalconStor’s core storage virtualization technology provides a non-disruptive and simple approach to data mobility across different SAN protocols and vendors. With FalconStor NSS, we believe it becomes a simple operation to move data from older platforms to newer ones or to introduce new storage tiers. This allows organizations to respond to evolving performance and capacity requirements.
By virtualizing storage on any disk array, FalconStor NSS provides the ability to pool and tier disk assets, simplifying provisioning, reducing allocation errors, and maximizing resource utilization. This allows IT organizations to avoid overprovisioning of disk resources and to bring new servers and projects online quickly and efficiently. FalconStor NSS incorporates a full set of application-aware data protection services, including real-time synchronous mirroring, volume snapshots, and site-to-site WAN-optimized data replication, and leverages the RecoverTrac tool for automated disaster recovery.
When deployed in high availability clusters, FalconStor NSS offers HA functionality. FalconStor NSS can also be implemented as a highly available stretch cluster (also known as a metro-cluster). A stretch cluster provides automatic failover of storage services between different physical locations or geographic sites up to 100 KM apart. Stretch clusters typically are used to create “active/active” data centers in order to provide business continuity with bi-directional replication and dynamic workload balancing across sites. FalconStor NSS stretch clusters enable enterprise-level HA and uninterrupted service for organizations requiring the most stringent level of protection and automation for DR.
Virtual server environments are well-served by virtualized storage. FalconStor NSS is designed to make it easy to create a new disk resource to house virtual machine files, and disk resources are re-allocated to different servers or shared among servers to facilitate virtual machine high-availability operations that require shared disk. Specific integration tools allow FalconStor NSS to service virtual server environments in an optimal manner providing rapid and effective recovery processes of a virtual machine or entire virtual server farms. Specifically, FalconStor NSS integrates with and enhances VMware technologies such as VMware vSphere, VMware vCenter, and VMware vCenter Site Recovery Manager. Support of VMware vStorage APIs for Array Integration (VAAI) extends VMware integration into any storage environment and optimizes VMware deployments with comprehensive, flexible storage virtualization and data protection functionality.
In addition, FalconStor NSS enables and automates server-less backup processes. FalconStor backup server integration tools offload backup processes from the server to the FalconStor NSS repository, freeing up the application host server and eliminating the backup window.
The FalconStor NSS Virtual Appliance enables cost-effective server virtualization by converting internal or external server storage resources into shared storage resources to enable high availability options across virtual servers. The solution is designed to reduce infrastructure cost and complexity while maximizing customers’ return on investment. The FalconStor NSS Virtual Appliance brings all the benefits and features of server and storage virtualization to the remote and branch office to reduce costs and to enable effective data protection and recovery solutions across the enterprise.
FalconStor® Continuous Data Protector (CDP)
FalconStor CDP technology reinvents the way data backup and recovery are implemented and performed. Moving beyond failure-prone once-a-day tape backup models, FalconStor CDP combines local and remote protection into a cost-effective, unified, disk-based solution that allows organizations to recover data back to the most recent transaction. Combining application-aware snapshot agents and continuous journaling functions, FalconStor CDP enables customers to recover data to any point in time.
5
In addition, FalconStor CDP delivers instant data availability and reliable recovery, bringing business applications back on line in a matter of minutes after a failure. FalconStor CDP protects application-specific data for Microsoft, Oracle, SAP, and other business applications, ensuring high performance and stability for even the most complex business environments. Using a wealth of sophisticated technologies - including application integration, physical-to-virtual recovery, WAN-optimized replication, and disaster recovery automation via the FalconStor RecoverTrac tool - entire systems can be restored in under ten minutes. Lost files can be recovered in as little as two minutes. Data is protected in its native format and is instantly accessible. With FalconStor CDP, the RTO changes from hours to minutes, minimizing system downtime and economic impact.
Further, FalconStor CDP enables and automates server-less backup processes with our Zero-Impact backup features and eliminates application and system disruption during data protection. Our backup server integration tools offload backup processes from the server to the FalconStor CDP repository, freeing up the application host server and completely eliminating the backup window.
The FalconStor CDP Virtual Appliance is a pre-configured, ready-to-run software application packaged for quick, easy deployment in virtual environments. The solution reduces infrastructure cost and complexity while maximizing customers’ return on investment. The FalconStor CDP Virtual Appliance provides all the benefits and features of FalconStor CDP to the remote and branch office to enable comprehensive and effective data protection and recovery solutions across the enterprise.
FalconStor® RecoverTrac Disaster Recovery Automation Tool
The FalconStor RecoverTrac disaster recovery automation tool is included as a standard feature of the FalconStor NSS and the FalconStor CDP solutions to automate complex, time-consuming and error-prone failover and failback operations of systems, applications, services, and entire data centers. The RecoverTrac tool streamlines the implementation, testing and execution of DR operations. It minimizes service failover time between sites and reduces DR costs by offering full recovery from physical-to-physical, virtual-to-virtual, and physical-to-virtual server infrastructures. This tool can also convert across those environments, enabling organizations to seamlessly migrate locally, remotely or to and from cloud environments.
FalconStor® Optimized Backup and Deduplication (OBD)
The FalconStor OBD solution takes the functionality of two of FalconStor’s existing products, VTL (Virtual Tape Library) and FDS (File-interface Deduplication System), and combines them into a single platform with a common user interface. OBD solution is one of the industry’s leading virtual tape solutions, and we believe it is unmatched in terms of performance and scalability. With virtual tape, backups complete faster and more reliably, with little or no change needed to the backup environment. It enhances backup operations seamlessly without changing any backup processes or policies. Sophisticated physical tape integration and data security complete the solution. Designed from the start as an enterprise-class application, FalconStor OBD can achieve sustained backup speeds of 20TB per hour per node. Up to eight nodes can combine into a single logical unit, scaling performance to a remarkable 160 TB per hour. This sustained performance allows users to solve the single biggest issue in backup: meeting the backup window. To put that in context, with our latest version 8.x product releases, existing customers can now do the same backup job in 2.8 hours vs. what previously took 8 hours. Unlike our competitors who report peak speeds using multiple nodes, FalconStor notes sustained speeds on a single node and on multiple nodes to ensure customers can achieve real-world performance and do more actual work in less time.
Built-in data deduplication significantly reduces the amount of data needed to be stored on disk. Combined with the latest high-speed protocols, including 8Gb Fibre Channel (FC) and 10Gb Ethernet, we believe FalconStor OBD demonstrates the fastest sustained deduplication speeds in the industry: more than 28 terabytes per hour with inline deduplication and more than 40 terabytes per hour with post processing. Because not all data is alike, we believe FalconStor OBD is the only deduplication solution to offer flexible, deduplication options, letting the customer choose from any combination of four deduplication methods (inline, post-process, concurrent, and no deduplication) to align deduplication processes with business goals and unique requirements. By eliminating redundant backup data, the storage footprint can be reduced by as much as 95%, allowing organizations to keep weeks or even months of data on disk for fast, dependable restore without any of the reliability concerns of a tape-based restore.
FalconStor OBD presents network-attached storage (NAS) interface accessibility to a block-level deduplication repository through common LAN-based file-access protocols such as CIFS and NFS. In addition, FalconStor OBD provides a shared deduplication repository that spans multiple application sources, environments, and storage protocols, maximizing space savings. This allows for backup data from any node to be deduplicated against all data in the repository, for true global deduplication. This improves and accelerates data restores, making it easier to meet or exceed service level agreements.
6
While deduplication can eliminate or greatly reduce the need for physical tapes, many organizations still require tape for long-term, offsite, or archival storage. FalconStor OBD has the industry’s broadest and most sophisticated integration with physical tape libraries, allowing companies to export data directly to physical tape, leveraging the speed of FalconStor OBD without impacting the backup network.
FalconStor OBD also supports small and remote office environments through FalconStor OBD storage appliances and small footprint virtual appliances.
BUSINESS STRATEGY
FalconStor continues to position itself as a leader in the Software-Defined Storage market serving enterprise IT organizations and service providers worldwide. FalconStor intends to achieve this objective through the following strategies.
Modernize Existing Enterprise Storage Environments While Protecting Investments
As IT organizations look to modernize existing infrastructure (either refreshing existing technology or introducing new technologies such as All Flash Arrays (AFAs)), they are challenged by the cost, risk, and the disruption upgrades and migrations can cause. Because FreeStor abstracts the data services from the physical storage infrastructure, additional capabilities can be added to legacy hardware, eliminating the need and cost to replace that hardware. This delivers discrete value in terms of lowering capital and operational costs, reduced risk and disruption and significantly faster time to deployment. For IT organizations needing to deploy new hardware or storage paradigms such as all AFAs, FreeStor enables the migration of data and workloads to those new platforms, versus being forced to start with a new or “greenfield” deployment required by many of the new HW vendors. FreeStor offers these organizations a path forward with an approach that minimizes or eliminates risk and disruption to business processes and workflows, while lowering both capital and operational costs.
FalconStor intends to continue to leverage the protocol-independent, unified architecture, and robust open data services technology of its solution to maintain a leadership position in the enterprise storage software market. FalconStor plans to continue its leadership in this market through its deep commitment to research and development and through continued rapid technology innovation. For information on our research and development expenditures, please see “Management’s Discussion and Analysis of Financial Condition and Results of Operations” and our audited consolidated financial statements.
Enable Service Providers
As the service provider segment continues to grow, they increasingly have a need to support heterogeneous storage environments across their own datacenters and their customer’s environments. Further, they often have different hardware and software capabilities, making it significantly challenging to offer consistent data services across these environments. FreeStor offers several strategic benefits for service providers:
• | Seamlessly and non-disruptively move data from the customer premise to the service provider’s hosted environment; |
• | Offers common data services across customer’s environments regardless of underlying hardware or technology; |
• | Allows for the introduction and ability to monetize additional data services they may not have previously been able to offer; |
• | Provides a low-cost growth opportunity due to the flexibility of FreeStor licensing, while eliminating the need to have multiple feature licenses array by array; |
• | Realize reduced storage management complexity and costs within their own infrastructure by eliminating silos, reducing licensing costs and optimizing hardware with FreeStor; and |
• | Optimize storage hardware based on price/performance needs of customers. |
Expand Software and Hardware Strategic Alliances with Industry Leaders
The Flash/SSD market should be a key opportunity for us on two fronts: targeting customers wanting to integrate new Flash/SSD technology into existing IT environments; and OEMs needing to enhance their software stack in order to offer data movement and protection services on their platform. Cloud Service Providers (CSPs) also represent a growth opportunity. They need help moving data from the customer site to their own facilities as well as a way to deliver common data services across disparate and often incompatible hardware typically found across the provider and end customer environments. FalconStor is strongly positioned to continue to take advantage of these key opportunities in the global marketplace. Our strategic relationships with Dell, DSI, Fujitsu, Hitachi Data Systems, HP, Huawei, Kaminario, X-IO and others should fuel growth across all three major geographies.
7
Expanded Existing Product Offerings
In 2015, FalconStor introduced its next generation data services platform, FreeStor, and continued to update its existing portfolio to address the needs of customers and leverage newer technologies. Product release updates include:
• | FreeStor |
All new software defined storage platform that unifies date services across a heterogeneous storage pool that is managed via a single console to simplify storage management across entire storage infrastructures, both local and remote. FreeStor leverages the Intelligent Abstraction core IO engine, all enhancements to NSS/CDP, plus additional unique capabilities:
• | Full set of REST APIs and centralized database; |
• | HTML5 based central management interface; |
• | Active/Active, always-on availability; |
• | 4-Way Clusters that can be deployed as 2+2 configurations in both local and stretch modes; |
• | Inline deduplication for improved storage efficiency; |
• | Scalable infrastructure allows for expansion of up to 128 nodes managed through a single interface; |
• | Integrates all data services in a single platform with a single license; and |
• | Simple licensing - all data services, 24x7 support, future upgrades, and basic installation are all included on a subscription basis. Users only pay for the capacity managed in a simple $/TB model. |
• | FalconStor NSS/CDP versions 8.0, 8.1 |
Multiple major enhancements were made to the core IO engine to reduce latency, and improve performance, security and reliability. Those improvements include but are not limited to:
• | Improved IO performance to over 500K IOps per node, over 1 million per cluster; |
• | Improved HA, new active/active availability; |
• | 4-Way Clusters that can be deployed as 2+2 configurations in both local and stretch modes; |
• | Improved TimeMark™ quiescent flag optimizes application protection while minimizing disruption; |
• | Improved storage failure detection; and |
• | REST APIs introduced for enhanced management, monitoring and reporting. |
• | FalconStor OBD version 8.2 |
Multiple security enhancements were made to harden the product for today’s enterprise environment requirements.
• | Updated to Linux 6.5 kernel to take advantage of OS security improvements; |
• | Strong password and account lockout; |
• | Improved password expiration management and SA512 password hashing; and |
• | VTL-VA virtual appliance and numerous usability enhancements. |
• | Various Agents |
• | DiskSafe - Both Windows and Linux versions upgraded to work with NSS/CDP and FreeStor. |
• | RecoverTrack 2.9 - added Microsoft Hyper-V support, multiple DNS entries and multiple enhancements for migration jobs. |
• | Snapshot Agents - Snapshot Director for vSphere 5.5 and 6.0 ready, Oracle v12 support. |
Market Approach
FalconStor continues to focus on enterprise customers, managed, service providers, cloud service providers, as well as OEM partners. These markets offer the greatest opportunity and are best suited to realize the value of FalconStor products.
The Company continues to utilize Corporate Marketing and Regional Field Marketing teams to better address market differences. The Corporate Marketing team focuses on company branding, industry analysts, public relations, key messaging, product positioning, and sales enablement. The Field Marketing teams have been organized and funded to focus on go-to-market efforts and marketing activities, lead generation, promotions and event execution. These teams are now empowered to tailor go-to-market efforts and optimize marketing effectiveness for local markets and geographies, moving away from a “one-size-fits-all” approach.
8
Growth Drivers
As the adoption of new technologies such as All Flash Arrays and the move to consuming solutions as a service, the IT market continues to show growth in several key market segments. FalconStor continues to focus on and pursue these market segments to deliver software defined storage data services, shifting away from slower growing, traditional Back-up and Data Protection markets.
According to IDC*, the traditional Business Continuity and Disaster Recovery (BCDR) markets are slowing to just under 6% growth CAGR over the next 3 years. That market is crowded with many incumbent vendors, all fighting for the same customer IT spend. However, the SDS market continues to grow and offers a cumulative CAGR of over 62% over the next 3 years.
*(Source: IDC Enterprise Storage Software Forecast 2015)
SALES ROUTES TO MARKET
FalconStor continues to sell products in a number of ways:
• | Direct to customers |
• | Through authorized partners, value-added resellers (VARs), solution providers, and large system integrators |
• | Direct to Direct Market Resellers (DMRs) and Distributors |
• | Direct to Managed Service Providers (MSPs) and Cloud Service Providers (CSPs) |
• | Direct to Original Equipment Manufacturers (OEMs) |
VAR and Distributor Relationships: FalconStor has entered into VAR and distributor agreements to help sell our products in various geographic areas. FalconStor’s VARs and distributors market various FalconStor products and receive a discount off of the list price on products sold. FalconStor’s scalable solutions are also being deployed by MSPs and CSPs to deliver online data protection and recovery services across different vertical markets.
Strategic Alliances: FalconStor has agreements with strategic partners to utilize FalconStor products for use in the strategic partners’ special-purpose storage appliances.
OEM Relationships: OEMs collaborate with FalconStor to integrate FalconStor technology into their own product offerings or to resell FalconStor technology under their own label.
Professional Services: FalconStor’s Professional Services personnel are also available to assist customers and partners throughout the lifecycle of FalconStor solution deployments. The Professional Services team includes experienced Storage Architects (expert field engineers) who can assist in the assessment, planning/design, deployment, and test phases of the deployment project, and a Technical Support Group for post-deployment assistance and ongoing support.
In a limited number of circumstances, FalconStor has entered into software license agreements directly with end users.
MARKETING
The efforts to increase awareness and demand for FreeStor provided solid results in 2015. According to 2015 TrendKite* summary reports, FalconStor and FreeStor “share of voice” grew from a combined 11% in 2014 to a combined 27% in 2015. This either surpassed key competitors or put the Company on par with others in the SDS segment. AR/PR efforts yielded a 65% year-over-year increase in the amount of Company coverage in print and online media. Advertising campaigns drove a 176% year-over-year increase in lift, or ad recall rates according to Nielson Research**. When compared to competitors, on average they realized a lift of 1.0 or less compared to FalconStor with an average lift of 4.4 for ad recall.
*TrendKite is an independent media coverage service to which FalconStor subscribes to capture and report on global and regional media and social coverage.
** Nielson Research conducted an awareness and ad recall study on behalf of FalconStor based on 2015 advertising campaigns.
9
COMPETITION
As data has become as critical an asset as capital and labor, the entrants into the data management and data protection segments continue to rise, as does the demand for services and integration with emerging technologies. Although there are several companies attempting to offer data protection for specific environments, FalconStor believes that only software-defined storage providers are capable of delivering a high level of data protection services across the data center, crossing the infrastructure boundaries between virtual, physical and hybrid environments. FalconStor holds multiple patents on key technologies that enable and optimize our snapshots, data protection, and data reduction platform. We believe that our integrated services and products based on our common storage virtualization platform - including CDP, NSS, OBD, WAN-optimized replication for remote offices and data centers, and disaster recovery automation - are unique to the industry.
Although some of FalconStor’s products provide capabilities that put them in competition with products from a number of companies, FalconStor is not aware of any other software company providing the same level of data protection and recovery capabilities for both physical and virtual infrastructures in a common solution. FalconStor believes that the principle competitive factors enhancing its marketability include product features, such as scalability, high availability, price, reliability, hardware/platform neutrality, and customer service and support.
As FalconStor refines its focus on enterprise and service provider market segments, the products and services offered by its partners may compete with existing or new products and services offered by current and new entrants to the market.
FalconStor’s future and existing competitors could conceivably introduce products with superior features, scalability and functionality at lower prices than FalconStor products. They could also bundle existing or new products with other more established products to compete with FalconStor. Increased competition could result in price reductions and reduced gross margins, which in turn could impact FalconStor’s business. FalconStor’s success will depend largely on its ability to generate market demand and awareness of its products and to enhance or develop new products and services in a timely manner.
When we sell to customers, the competitors we encounter most frequently are HP, EMC, IBM, DataCore, Nexenta and a number of niche players. Many of these competitors have significantly greater resources than we do.
INTELLECTUAL PROPERTY
FalconStor’s success is dependent in part upon its proprietary technology. The IPStor platform forms the core of this proprietary technology. FalconStor currently has twenty-four patents and numerous pending patent applications. The Company has multiple registered trademarks - including “FalconStor Software”, “IPStor”, “FreeStor” and “Intelligent Abstraction” - as well as pending trademark applications related to FalconStor and its products.
FalconStor seeks to protect its proprietary rights and other intellectual property through a combination of copyright, patents, trademark, and trade secret protection, as well as through contractual protections such as proprietary information agreements and nondisclosure agreements. The technological and creative skills of its personnel, new product developments, frequent product enhancements, and reliable product maintenance are essential to establishing and maintaining a technology leader position.
FalconStor generally enters into confidentiality or license agreements with employees, consultants, and corporate partners and generally controls access to and distribution of its software, documentation, and other proprietary information. Despite the Company’s efforts to protect its proprietary rights, unauthorized parties may attempt to copy or otherwise obtain and use FalconStor’s products or technology. Monitoring unauthorized use of FalconStor’s products is difficult, and there can be no assurance that the steps FalconStor has taken will prevent misappropriation of its technology, particularly in foreign countries where laws may not protect its proprietary rights as fully as do the laws of the United States.
MAJOR CUSTOMERS
For the year ended December 31, 2015, 2014 and 2013, we had one customer, Hitachi Data Systems, which accounted for 10%, 11% and 14% of our total revenue, respectively. The loss of this customer, or a significant reduction in revenue from this customer, could have a material adverse effect on our results of operations. In addition, for the year ended December 31, 2015 we had one customer, Violin Memory, Inc., which accounted for 23% of our total revenue. This revenue related to our joint development agreement with Violin Memory, Inc. and is not expected to repeat in the future. If the Company is unable to receive revenue from other sources to replace the revenue from Violin Memory, Inc., it may have a material adverse impact on the results of operations. As of December 31, 2015, Hitachi Data Systems and Datang Telecom International Technology Co., Ltd's accounts receivable balance was greater than 10% of our gross accounts receivable balance. As of December 31, 2014, Huawei Technologies Co., Ltd's accounts receivable balance was 11% of our gross accounts receivable balance.
10
EMPLOYEES
As of December 31, 2015, we had 226 full-time and part-time employees, consisting of 71 in research & development, 74 in sales & marketing, 55 in service, and 26 in general and administrative. We are not subject to any collective bargaining agreements and we believe that our employee relations are good.
INTERNET ADDRESS AND AVAILABILTY OF FILINGS
Our internet address is www.falconstor.com. The Company makes available free of charge, on or through its Internet website, the Company’s Annual Report on Form 10-K, Quarterly Reports on Form 10-Q, current Reports on Form 8-K, and amendments to those reports filed or furnished pursuant to Sections 13(a) or (15)(d) of the Securities Exchange Act of 1934, as amended, as soon as reasonably practicable after the Company electronically files such material with, or furnishes it to, the Securities and Exchange Commission. The Company complied with this policy for every Securities Exchange Act of 1934, as amended, report filed during the year ended December 31, 2015.
Item 1A. Risk Factors
We are affected by risks specific to us as well as factors that affect all businesses operating in a global market. The significant factors known to us that could materially adversely affect our business, financial condition, or operating results are set forth below.
We recently released our latest version of CDP/NSS, version 8.0 and our new FreeStor® platform. Our future business, financial and operating results are substantially dependent on the market acceptance of both of these products.
On February 18, 2015, we released the latest version of our CDP/NSS product, CDP/NSS 8.0 and on May 6, 2015 we released our new FreeStor platform. We have spent considerable resources, both financially and in our research and development efforts, developing CDP/NSS 8.0 and FreeStor. We currently do not have any other products in our pipeline with the same expectations or which we believe have the same potential for market acceptance as CDP/NSS 8.0 and FreeStor. If (i) either CDP/NSS 8.0 or FreeStor do not gain market acceptance, (ii) sales of either CDP/NSS 8.0 or FreeStor are significantly below our expectations, or (iii) the ongoing future feature/functionality sets of both products are delayed, our results may suffer and it could have a material adverse effect on our business, financial condition and operating results.
We have a significant number of outstanding preferred stock and options, the conversion and exercise of which would dilute the then-existing stockholders’ percentage ownership of our common stock, and a smaller number of restricted shares of stock, the vesting of which will also dilute the then-existing stockholders’ percentage ownership of our common stock.
As of December 31, 2015, we had outstanding options to purchase 4,855,941 shares of our common stock, we had an aggregate of 3,116,400 outstanding unvested restricted shares and outstanding Series A redeemable convertible preferred stock convertible into 8,781,516 shares of our common stock. If all of the outstanding options were exercised, the proceeds to the Company would average $3.53 per share. In addition, over the next five years up to an additional 4,390,760 shares of common stock are potentially issuable as dividends with respect to the Series A redeemable convertible preferred stock (based on an assumed dividend rate of 10% per annum). We also had 3,124,559 shares of our common stock reserved for issuance under our stock plans with respect to options (or restricted stock or restricted stock units) that have not been granted. In addition, if, on July 1st of any calendar year in which our 2006 Incentive Stock Plan, as amended (the “2006 Plan”), is in effect, the number of shares of stock to which options, restricted shares and restricted stock units may be granted is less than five percent (5%) of the number of outstanding shares of stock, then the number of shares of stock available for issuance under the 2006 Plan shall be increased so that the number equals five percent (5%) of the shares of common stock outstanding. In no event shall the number of shares of common stock subject to the 2006 Plan in the aggregate exceed twenty million shares, subject to adjustment as provided in the 2006 Plan.
The exercise of all of the outstanding options and/or the vesting of all outstanding restricted shares, the conversion of our outstanding Series A redeemable convertible preferred stock into common stock, the payment of dividends on our Series A redeemable convertible preferred stock through the issuance of common stock and/or the grant and exercise of additional options and/or the grant and vesting of restricted stock and restricted stock units would dilute the then-existing stockholders’ percentage ownership of common stock, and any sales in the public market of the common stock issuable upon such exercise could adversely affect prevailing market prices for the common stock. Moreover, the terms upon which we would be able to obtain additional equity capital could be adversely affected because the holders of such securities can be expected to exercise or convert them at a time when we would, in all likelihood, be able to obtain any needed capital on terms more favorable than those provided by such securities.
11
We have undertaken a restructuring to reduce our expenses and to better align our expenses with our business. There can be no assurance that we have made enough reductions or the right reductions.
In the third quarter of 2013, we began an effort to reduce our expenses significantly in an attempt to help return the Company to profitability. Among the actions we have taken are: A reduction in personnel of 30%; closing offices in geographic locations where our expenses have continued to outpace our revenue; and reducing other expenditures. There can be no guarantee that we have reduced our expenses enough to return the Company to profitability or that the reductions we have made are the right reductions for our business going forward. There is a risk that the restructuring and reduction in personnel will make it more difficult to grow the business and service our customers.
We continue to have turnover in our senior management.
During the second quarter of 2014, the General Manager of our Asia/Pacific region resigned. We have not hired a new general manager for the Asia/Pacific region. We have determined the best management structure for the region currently is for each country manager to be responsible for their respective territories with direct reporting responsibilities to the Corporate headquarters.
On January 21, 2015, our Executive Vice President, General Counsel and Secretary resigned from all of his positions in the Company to pursue other opportunities. For now, we have chosen not to hire a new Executive Vice President, General Counsel and Secretary and we will outsource this function while we determine the best management structure for the Company.
In addition to our Executive Vice President, General Counsel and Secretary's resignation, in the past few years we have had turnover in other senior positions. We have filled these positions with highly qualified individuals with extensive storage and software company experience. However, there can be no guarantee that the new senior management will be able to get up to speed and successfully manage the Company. In addition, with the exception of Gary Quinn, we have no employment agreements with any of our senior management and there can be no assurance that we will be able to retain any or all of the members of the senior management team.
We are dependent on a significant customer.
For the year ended December 31, 2015, 2014 and 2013, we had one customer, Hitachi Data Systems, which accounted for 10%, 11% and 14% of our total revenue, respectively. The loss of this customer, or a significant reduction in revenue from this customer, could have a material adverse effect on our results of operations. In addition, for the year ended December 31, 2015 we had one customer, Violin Memory, Inc., which accounted for 23% of our total revenue. This revenue related to our joint development agreement with Violin Memory, Inc. and is not expected to repeat in the future. If the Company is unable to receive revenue from other sources to replace the revenue from Violin Memory, Inc., it may have a material adverse impact on the results of operations.
A significant portion of our receivables is concentrated with two customers.
As of December 31, 2015 Hitachi Data Systems and Datang Telecom International Technology Co., Ltd's accounts receivable balance was greater than 10% of our gross accounts receivable balance. We currently have no reason to expect that Hitachi or Datang will fail to pay the amounts invoiced, nor do we have any history of non-payment with these customers, but the concentration of these receivables means that any failure by these customers to pay us all or a significant portion of these receivables would have a material impact on us.
We have had only three profitable quarters since 2009. There is no guarantee that we will be able to return to, or to maintain, profitability.
While we were profitable in the first quarter of 2015, the second quarter of 2014 and the fourth quarter of 2013, our profitability for such periods was the result of the acceleration of the deferred revenue related to our joint development agreement with Violin in the first quarter of 2015, a gain recorded from the settlement with the Estate of ReiJane Huai in the second quarter of 2014, and a gain recorded from a sale of an investment in the fourth quarter of 2013, respectively, none of which we expect to recur. We incurred losses in the second, third and fourth quarters of 2015 and the first, third and fourth quarters of 2014 and in each of the seventeen quarters preceding the fourth quarter of 2013. We have taken steps to try to reduce or to eliminate the chance of future losses - such as reducing headcount and other expenses and trying to replace lost OEM sales with sales of FalconStor-branded products - but there is no guarantee that we will be able to return to or to maintain profitability. In addition, our future profitability could be negatively impacted by the decrease of bookings to $38.9 million for the year ended December 31, 2015 as compared with $50.3 million for the year ended December 31, 2014. As of December 31, 2015, we had approximately $13.4 million in cash, cash equivalents and marketable securities. If losses recur, we will deplete our available cash and we may not be able to continue to fund effective sales and marketing or research and development activities on which we are dependent.
12
Due to the uncertain and shifting development of the data protection and network storage software markets and our reliance on our partners, we may have difficulty accurately predicting revenue for future periods and appropriately budgeting for expenses.
The rapidly evolving nature of the data protection and network storage software markets in which we sell our products, the degrees of effort and success of our partners’ sales and marketing efforts, and other factors that are beyond our control, reduce our ability to accurately forecast our quarterly and annual revenue. However, we must use our forecasted revenue to establish our expense budget. Most of our expenses are fixed in the short term or incurred in advance of anticipated revenue. As a result, we may not be able to decrease our expenses in a timely manner to offset any shortfall in revenue.
If we are unable to develop and manufacture new products that achieve acceptance in the data protection and the network storage software markets, our operating results may suffer.
The data protection and the network storage software markets continue to evolve and as a result there is continuing demand for new products. Accordingly, we may need to develop and manufacture new products that address additional data protection or network storage software market segments and emerging technologies to remain competitive in the data storage software industry. We are uncertain whether we will successfully qualify new data protection or network storage software products with our customers by meeting customer performance and quality specifications. Any failure to address additional market segments could harm our business, financial condition and operating results.
Our products must conform to industry standards in order to be accepted by customers in our markets.
Our current products are only one part of a storage system. All components of these systems must comply with the same industry standards in order to operate together efficiently. We depend on companies that provide other components of these systems to conform to industry standards. Some industry standards may not be widely adopted or implemented uniformly, and competing standards may emerge that may be preferred by OEM customers or end users. If other providers of components do not support the same industry standards as we do, or if competing standards emerge, our products may not achieve market acceptance, which would adversely affect our business.
Our products handle mission-critical data for our end-customers and are highly technical in nature. If our products have defects, failures occur or end-customer data is lost or corrupted, our reputation and business could be harmed.
Our products are highly technical and complex and are involved in storing and replicating mission-critical data for our end-customers. Our products may contain undetected defects and failures when they are first introduced or as new versions are released. We have in the past and may in the future discover software errors in new versions of our existing products, new products or product enhancements after their release or introduction, which could result in lost revenue. Despite testing by us and by current and potential end-customers, errors might not be found in new releases or products until after commencement of commercial shipments, resulting in loss of or delay in market acceptance. Our products may have security vulnerabilities and be subject to intentional attacks by viruses that seek to take advantage of these bugs, errors or other weaknesses. If defects or failures occur in our products, a number of negative effects in our business could result, including:
• | lost revenue or lost end-customers; |
• | increased costs, including warranty expense and costs associated with end-customer support; |
• | delays, cancellations, reductions or rescheduling of orders or shipments; |
• | product returns or discounts; |
• | diversion of management resources; |
• | legal claims for breach of contract, product liability, tort or breach of warranty; and |
• | damage to our reputation and brand. |
Because our end-customers use our products to manage and protect their data, we could face claims resulting from any loss or corruption of our end-customers’ data due to a product defect. While our sales contracts contain provisions relating to warranty disclaimers and liability limitations, these provisions might not be upheld. Defending a lawsuit, regardless of its merit, is costly and may divert management’s attention from our business and could result in public perception that our products are not effective, even if the occurrence is unrelated to the use of our products. In addition, our business liability insurance coverage might not be adequate to cover such claims. If any data is lost or corrupted in connection with the use or support of our products, our reputation could be harmed and market acceptance of our products could suffer.
13
Issues with the hardware on which our software products are installed could increase our support costs and result in lower sales of our products.
We deliver some of our products, both through our resellers and directly to end-users, installed on third party hardware. If the hardware does not function properly, our support costs will go up. We will have to arrange or pay for the repair or replacement of the broken hardware and we may have to increase the size of our support operations. Hardware reliability issues could also cause resellers and end-users to refuse to make purchases from us, even if our software products function properly.
We rely on our resellers and our OEM customers for most of our sales.
The vast majority of our sales come from sales to end users of our products by our resellers and by our OEM customers. These resellers and OEM customers have limited resources and sales forces and sell many different products, both in the data protection and the network storage software markets and in other markets. The resellers and OEM customers may choose to focus their sales efforts on other products in the data protection and the network storage software markets or other markets. The OEM customers might also choose not to continue to develop or to market products which include our products. This would likely result in lower revenue to us and would impede our ability to grow our business.
The failure of our resellers to sell our products effectively could have a material adverse effect on our revenue and results of operations.
We rely significantly on our value-added resellers, direct market resellers, systems integrators and corporate resellers, which we collectively refer to as resellers, for the marketing and distribution of our software products and our services. However, our agreements with resellers are generally not exclusive, are generally renewable annually and in many cases may be terminated by either party without cause. Many of our resellers carry products that are competitive with ours. These resellers may give a higher priority to other products, including those of our competitors, or may not continue to carry our products at all. If a number of resellers were to discontinue or reduce the sales of our products, or were to promote our competitors’ products in lieu of ours, it would have a material adverse effect on our future revenue. Events or occurrences of this nature could seriously harm our sales and results of operations. In addition, we expect that a significant portion of our sales growth will depend upon our ability to identify and attract new reseller partners. The use of resellers is an integral part of our distribution network. We believe that our competitors also use reseller arrangements. Our competitors may be more successful in attracting reseller partners and could enter into exclusive relationships with resellers that make it difficult to expand our reseller network. Any failure on our part to expand our network of resellers could impair our ability to grow revenue in the future.
Our growth depends in part on the success of our strategic relationships with third parties.
Our future growth will depend on our ability to enter into successful strategic relationships with third parties. For example, our strategic relationships with Dell, DSI, Fujitsu, Hitachi Data Systems, HP, Huawei, Kaminario and X-IO are intended to for the Flash/SSD market targeting customers wanting to integrate new Flash/SSD technology into existing IT environments and OEMs needing to enhance their software stack in order to offer data movement and protection services on their platform. In addition, we work with global distributors to streamline and grow our sales channel. These relationships may not result in additional customers or enable us to generate significant revenue. These relationships are typically non-exclusive and do not prohibit the other party from working with our competitors or from offering competing services. If we are unsuccessful in establishing or maintaining our relationships with these third parties, our ability to compete in the marketplace or to grow our revenue could be impaired and our operating results could suffer.
We rely on channel partners to sell our solutions, and disruptions to, or our failure to develop and manage our channel partners would harm our business.
Our future success is partially dependent upon establishing and maintaining successful relationships with the right channel partners. A majority of our revenue is generated by sales through our channel partners, and we expect channel sales to continue to make up the majority of our total revenue in the future. Accordingly, our revenue are largely dependent on the effective sales and lead generation activities of these channel partners.
14
Recruiting and retaining qualified channel partners and training them in our technology and product offerings requires significant time and resources. In order to develop and expand our distribution channel, we must continue to scale and improve our processes and procedures that support our channel, including investment in systems and training. Those processes and procedures may become increasingly complex and difficult to manage as we grow our organization. We have no minimum purchase commitments from any of our channel partners, and our contracts with these channel partners do not prohibit them from offering products or services that compete with ours. Our competitors may provide incentives to existing and potential channel partners to favor their products or to prevent or reduce sales of our solutions. Our channel partners may choose not to offer our solutions exclusively or at all. Establishing relationships with channel partners who have a history of selling our competitors’ products may also prove to be difficult. In addition, some of our channel partners are also competitors. Our failure to establish and maintain successful relationships with channel partners would harm our business and operating results.
We face intense competition in our market, especially from larger, well-established companies, and we may lack sufficient financial or other resources to maintain or improve our competitive position.
A number of very large corporations have historically dominated the data management market. We consider our primary competitors to be companies that provide enterprise storage products, including EMC Corporation, Hewlett-Packard Company (“HPE”), IBM, DataCore and Nexenta. We also compete to a lesser extent with a number of other private companies and certain well-established companies. Some of our competitors have made acquisitions of businesses that allow them to offer more directly competitive and comprehensive solutions than they had previously offered. In addition, the emergence of cloud computing and software-defined-storage may impact both short-term and long-term growth patterns in the markets in which we compete. We expect to encounter new competitors domestically and internationally as other companies enter our market or if we enter new markets.
Many of our existing competitors have, and some of our potential competitors could have, substantial competitive advantages such as:
• | potential for broader market acceptance of their storage architectures and solutions; |
• | greater name recognition and longer operating histories; |
• | larger sales and marketing and customer support budgets and resources; |
• | broader distribution and established relationships with distribution partners and end-customers; |
• | the ability to bundle storage products with other technology products and services, or offer a broader range of storage solutions to better fit certain customers’ needs; |
• | lower labor and development costs; |
• | larger and more mature intellectual property portfolios; |
• | substantially greater financial, technical and other resources; and |
• | greater resources to make acquisitions. |
Our ability to sell our products is highly dependent on the quality of our services offerings, and our failure to offer high quality support and professional services would have a material adverse affect on our sales of our products and results of operations.
Our services include the assessment and design of solutions to meet our customers’ data protection and storage management requirements and the efficient installation and deployment of our products based on specified business objectives. Further, once our products are deployed, our customers depend on us to resolve issues relating to our products. A high level of service is critical for the successful marketing and sale of our software. If our partners or we do not effectively install or deploy our applications, or succeed in helping our customers quickly resolve post-deployment issues, it would adversely affect our ability to sell software products to existing customers and could harm our reputation with potential customers. As a result, our failure to maintain high quality support and professional services would have a material adverse effect on our sales of our products and results of operations.
Failure to achieve anticipated growth could harm our business and operating results.
Achieving our anticipated growth will depend on a number of factors, some of which include:
•retention of key management, marketing and technical personnel;
•our ability to increase our customer base and to increase the sales of our products; and
•competitive conditions in the network storage infrastructure software market.
We cannot assure you that the anticipated growth will be achieved. The failure to achieve anticipated growth could harm our business, financial condition and operating results.
15
Adverse economic conditions or reduced IT spending may adversely impact our business.
Our business depends on the overall demand for IT and on the economic health of our current and prospective customers. In general, worldwide economic conditions remain unstable, and these conditions make it difficult for our current and prospective customers and us to forecast and plan future business activities accurately, and they could cause our customers or prospective customers to reevaluate their decision to purchase our products or services. Weak global economic conditions, or a reduction in IT spending even if economic conditions improve, could adversely impact our business and operating results in a number of ways, including longer sales cycles, lower prices for our products, reduced bookings and lower or no growth.
The timing of revenue recognition may be impacted by the use of flexible terms.
On occasion the Company may enter into sales arrangements that include flexible pricing and payment terms, and the timing of our revenue recognition for these arrangements may vary from our historical recognition methods. This may result in lower upfront revenue recognition for the current period and an increase in deferred revenue that is recognized over time. This could lead to further operating losses and prevent us from meeting our forecasted revenue targets until the revenue recognized from these types of deals stabilizes. There is no guarantee that the use of flexible terms will increase our sales.
Our future quarterly results may fluctuate significantly, which could cause our stock price to decline.
Our previous results are not necessarily indicative of our future performance and our future quarterly results may fluctuate significantly. Our future performance will depend on many factors, including:
• | fluctuations in the economy; |
• | the timing of securing software license contracts and the delivery of software and related revenue recognition; |
• | the seasonality of information technology, including network storage products, spending; |
• | the average unit selling price of our products; |
• | existing or new competitors introducing better products at competitive prices before we do; |
• | our ability to manage successfully the complex and difficult process of qualifying our products with our customers; |
• | new products or enhancements from us or our competitors; |
• | our ability to release new and innovative products; |
• | import or export restrictions on our proprietary technology; and |
• | personnel changes. |
Many of our expenses are relatively fixed and difficult to reduce or modify. As a result, the fixed nature of our expenses will magnify any adverse effect of a decrease in revenue on our operating results.
16
Our stock price may be volatile and if it falls below $1.00 per share, our common stock could be subject to delisting from NASDAQ.
The market price of our common stock has been volatile in the past and may be volatile in the future. For example, during the twelve months ended December 31, 2015, the closing market price of our common stock as quoted on the NASDAQ Global Market fluctuated between $1.32 and $2.20. The NASDAQ Global Market requires that our common stock maintain a trading price of at least $1.00 per share. To the extent that the market price of our common stock closes below $1.00 per share, for thirty consecutive trading days and if the stock then does not trade at a $1.00 or more per share for ten consecutive days during the next ninety days, our common stock could be subject to delisting from the NASDAQ Global Market. If our common stock is delisted from the NASDAQ Global Market, the liquidity of our common stock could be materially impacted and it may be more difficult to make transaction in our common stock. In addition, because we have a stockholder deficit, the NASDAQ Global Market requires the market value of our common stock to be at least $50.0 million. If the market value of our common stock falls below $50.0 million, trading of our common stock may move from the NASDAQ Global Market to the NASDAQ Capital Market. The market price of our common stock may be significantly affected by the following factors:
• | actual or anticipated fluctuations in our operating results, including changes in the timing of when we recognize revenue; |
• | failure to meet financial estimates; |
• | changes in market valuations of other technology companies, particularly those in the network storage software market; |
• | the announcement of any strategic alternatives; |
• | announcements by us or our competitors of significant technical innovations, acquisitions, strategic partnerships, strategic alternatives, joint ventures or capital commitments; |
• | loss of one or more key customers; |
• | the issuance of additional shares of the Series A redeemable convertible preferred stock pursuant to dividend rights; and |
• | departures of key personnel. |
The stock market has experienced extreme volatility that often has been unrelated to the performance of particular companies. These market fluctuations may cause our stock price to fall regardless of our performance.
Our marketable securities portfolio could experience a decline in market value which could materially and adversely affect our financial results.
As of December 31, 2015, we held short-term marketable securities aggregating $7.4 million. We invest in a mixture of corporate bonds, government securities and marketable debt securities, the majority of which are high investment grade, and we limit the amount of credit exposure through diversification and investment in highly rated securities. However, investing in highly rated securities does not entirely mitigate the risk of potential declines in market value. A deterioration in the economy, tightening of credit markets or significant volatility in interest rates, could cause our marketable securities to decline in value or could impact the liquidity of the portfolio. If market conditions deteriorate significantly, our results of operations or financial condition could be materially and adversely affected.
The ability to predict our future effective tax rates could impact our ability to accurately forecast future earnings.
We are subject to income taxes in both the United States and the various foreign jurisdictions in which we operate. Judgment is required in determining our provision for income taxes and there are many transactions and calculations where the tax determination may be uncertain. Our future effective tax rates could be affected by changes in our (i) earnings or losses; (ii) changes in the valuation of our deferred tax assets; (iii) changes in tax laws; and (iv) other factors. Our ability to correctly predict our future effective tax rates based upon these possible changes could significantly impact our forecasted earnings.
17
The likelihood of a change of control in our company could be impacted by the fact that we have a significant amount of authorized but unissued preferred stock, outstanding Series A redeemable convertible preferred stock, a staggered Board of Directors and change of control agreements as well as certain provisions under Delaware law.
Our Board of Directors has the authority, without further action by our common stockholders, to issue up to an additional 1,100,000 shares of preferred stock on such terms and with such rights, preferences and designations, including, without limitation restricting dividends on our common stock, dilution of the voting power of our common stock and impairing the liquidation rights of the holders of our common stock, as the Board may determine without any vote of our common stockholders. Issuance of such preferred stock, depending upon the rights, preferences and designations thereof may have the effect of delaying, deterring or preventing a change in control. Moreover, our outstanding Series A redeemable convertible preferred stock provides the holders with certain rights in the event of a merger with a third party and if we are unable to redeem the Series A redeemable convertible preferred stock prior to August 5, 2007. In addition, certain “anti-takeover” provisions of the Delaware General Corporation Law, among other things, may restrict the ability of our stockholders to authorize a merger, business combination or change of control. Further, we have a staggered Board of Directors and have entered into change of control agreements through either employment agreements or our 2005 Key Executive Severance Protection Plan with certain executives. As a result, our stockholders may lose opportunities to dispose of their shares at favorable prices generally available in takeover attempts or that may be available under a merger proposal and the market price of our commons tock and the voting and other rights of our stockholders may also be affected.
Our business could be materially affected as a result of a natural disaster, terrorist acts, or other catastrophic events.
While our headquarters facilities contain redundant power supplies and generators, our domestic and foreign operations, and the operations of our industry partners, remain susceptible to fire, floods, power loss, power shortages, telecommunications failures, break-ins and similar events. Terrorist actions domestically or abroad could lead to business disruptions or to cancellations of customer orders or a general decrease in corporate spending on information technology, or could have direct impact on our marketing, administrative or financial functions and our financial condition could suffer. In 2011, floods in Thailand impacted our supply of hardware components. We continually look for alternatives to help mitigate any supply chain disruptions due to natural disasters, terrorist acts or other catastrophic events. However, our failure to mitigate these supply chain disruptions could impact our ability to procure and deliver products to our customers, which could adversely impact our overall financial condition.
We are dependent on a variety of IT and telecommunications systems, and any failure of these systems could adversely impact our business and operating results.
We depend on IT and telecommunications systems for our operations. These systems support a variety of functions including order processing, shipping, shipment tracking, billing, support center and internal information exchange.
Failures or significant downtime of our IT or telecommunications systems could prevent us from taking customer orders, shipping products, billing customers, handling support calls, or communication among our offices. The Internet and individual websites have experienced a number of disruptions and slowdowns, some of which were caused by organized attacks. In addition, some websites have experienced security breakdowns. If we were to experience a security breakdown, disruption or breach that compromised sensitive information, it could harm our relationship with our customers. Our support centers are dependent upon telephone and data services provided by third party telecommunications service vendors and our IT and telecommunications system. Any significant increase in our IT and telecommunications costs or temporary or permanent loss of our IT or telecommunications systems could harm our relationships with our customers. The occurrence of any of these events could have an adverse effect on our operations and financial results.
United States Government export restrictions could impede our ability to sell our software to certain end users.
Certain of our products include the ability for the end user to encrypt data. The United States, through the Bureau of Industry Security, places restrictions on the export of certain encryption technology. These restrictions may include: the requirement to have a license to export the technology; the requirement to have software licenses approved before export is allowed; and outright bans on the licensing of certain encryption technology to particular end users or to all end users in a particular country. Certain of our products are subject to various levels of export restrictions. These export restrictions could negatively impact our business.
The international nature of our business could have an adverse affect on our operating results.
We sell our products worldwide. Accordingly, our operating results could be materially adversely affected by various factors including regulatory, political, or economic conditions in a specific country or region, trade protection measures and other regulatory requirements, and acts of terrorism and international conflicts.
18
Additional risks inherent in our international business activities generally include, among others, longer accounts receivable payment cycles, difficulties in managing international operations, decreased flexibility in matching workforce needs as compared with the U.S., and potentially adverse tax consequences. Such factors could materially adversely affect our future international sales and, consequently, our operating results.
Foreign currency fluctuations may impact our revenue.
Our licenses and services in Japan are sold in Yen. Many of our licenses and services in Australia, Canada, and in Europe are sold in Australian dollars, Canadian dollars and European Monetary Units (“Euros”), respectively. Changes in economic or political conditions globally and in any of the countries in which we operate could result in exchange rate movements, new currency or exchange controls or other restrictions being imposed on our operations.
Fluctuations in the value of the U.S. dollar may adversely affect our results of operations. Because our consolidated financial results are reported in U.S. dollars, translation of sales or earnings generated in other currencies into U.S. dollars can result in a significant increase or decrease in the reported amount of those sales or earnings. Significant changes in the value of these foreign currencies relative to the U.S. dollar could have a material adverse effect on our financial condition or results of operations. For example, the Euro has weakened against the U.S. dollar by 11% from December 31, 2014 to December 31, 2015.
Fluctuations in currencies relative to currencies in which our earnings are generated make it more difficult to perform period-to-period comparisons of our reported results of operations. For purposes of accounting, the assets and liabilities of our foreign operations, where the local currency is the functional currency, are translated using period-end exchange rates, and the revenue, expenses and cash flows of our foreign operations are translated using average exchange rates during each period.
In addition to currency translation risks, we incur currency transaction risk whenever we enter into either a purchase or a sales transaction using a currency other than the local currency of the transacting entity. Given the volatility of exchange rates, we cannot be assured we will be able to effectively manage our currency transaction and/or translation risks. Volatility in currency exchange rates may have a material effect on our financial condition or results of operations. Currency exchange rate fluctuations have not, in the past, resulted in a material impact on earnings. However, we may experience at times in the future an impact on earnings as a result of foreign currency exchange rate fluctuations.
Because we conduct operations in China, risks associated with economic, political and social events in China could negatively affect our business and operating results.
China is a significant market for our products. We have an OEM agreement with Huawei which has historically provided us with significant revenue. As of December 31, 2015 we have 18 employees in China. Our operations in China are subject to a number of risks relating to China’s economic and political systems, including:
•government controlled foreign exchange rate and limitations on the convertibility of the Chinese Renminbi;
•extensive government regulation;
•changing governmental policies relating to tax benefits available to foreign-owned businesses;
•the telecommunications infrastructure;
•relatively uncertain legal system; and
•uncertainties related to continued economic and social reform.
Any significant interruption in our China operations, whether resulting from any of the above uncertainties, natural disasters or otherwise, could result in delays or disruptions in our revenue and our research development operations, either of which could cause our business and operating results to suffer.
If we are unable to protect our intellectual property, our business will suffer.
Our success is dependent upon our proprietary technology. We have 24 patents issued, and numerous pending patent applications, numerous trademarks registered and multiple pending trademark applications related to our products. We cannot predict whether we will receive patents for our pending or future patent applications, and any patents that we own or that are issued to us may be invalidated, circumvented or challenged. In addition, the laws of certain countries in which we sell and manufacture our products, including various countries in Asia, may not protect our products and intellectual property rights to the same extent as the laws of the United States.
19
We also rely on trade secret, copyright and trademark laws, as well as the confidentiality and other restrictions contained in our respective sales contracts and confidentiality agreements to protect our proprietary rights. These legal protections afford only limited protection and if we are unable to protect our intellectual property our business and operating results may suffer.
Our efforts to protect our intellectual property may cause us to become involved in costly and lengthy litigation, which could seriously harm our business.
In recent years, there has been significant litigation in the United States involving patents, trademarks and other intellectual property rights.
We were already subject to one action, which alleged that our technology infringed on patents held by a third party. While we settled this litigation, the fees and expenses of the litigation as well as the litigation settlement were expensive and the litigation diverted management’s time and attention. Any additional litigation, regardless of its outcome, would likely be time consuming and expensive to resolve and would divert management’s time and attention and might subject us to significant liability for damages or invalidate our intellectual property rights. Any potential intellectual property litigation against us could force us to take specific actions (any of which could have a material adverse effect on our business), including:
• | cease selling our products that use the challenged intellectual property; |
• | obtain from the owner of the infringed intellectual property right a license to sell or use the relevant technology or trademark, which license may not be available on reasonable terms, or at all; or |
• | redesign those products that use infringing intellectual property or cease to use an infringing product or trademark. |
Developments limiting the availability of Open Source software could impact our ability to deliver products and could subject us to costly litigation.
Many of our products are designed to include software or other intellectual property licensed from third parties, including “Open Source” software. At least one intellectual property rights holder has alleged that it holds the rights to software traditionally viewed as Open Source. In addition, United States courts have not interpreted the terms of many open source licenses, and there is a risk that such licenses could be construed in a manner that could impose unanticipated conditions or restrictions on our ability to commercialize our appliances. We could be required to seek licenses from third parties in order to continue offering our software, to re-engineer our software, to discontinue the sale of our software in the event re-engineering cannot be accomplished on a timely basis or to litigate any disputes relating to our use of open source software, any of which could harm our business. There can be no assurance that the necessary licenses would be available on acceptable terms, if at all. The inability to obtain certain licenses or other rights or to obtain such licenses or rights on favorable terms, or the need to engage in litigation regarding these matters, could have a material adverse effect on our business, operating results, and financial condition. Moreover, the inclusion in our products of software or other intellectual property licensed from third parties on a nonexclusive basis could limit our ability to protect our proprietary rights in our products.
The loss of any of our key personnel could harm our business.
Our success depends upon the continued contributions of our key employees, many of whom would be extremely difficult to replace. We do not have key person life insurance on any of our personnel. Worldwide competition for skilled employees in the network storage software industry is extremely intense. In particular our success is dependent on our executive management team, including Gary Quinn, our President and Chief Executive Officer, whose employment agreement is expiring in July 2016. If we are unable to retain existing employees or to hire and integrate new employees, our business, financial condition and operating results could suffer. In addition, companies whose employees accept positions with competitors often claim that the competitors have engaged in unfair hiring practices. We may be the subject of such claims in the future as we seek to hire qualified personnel and could incur substantial costs defending ourselves against those claims.
We may not successfully integrate the products, technologies or businesses from, or realize the intended benefits of acquisitions.
We have made, and may continue to make, acquisitions of other companies or their assets. Integration of the acquired products, technologies and businesses, could divert management’s time and resources though we have no agreements, commitments or understanding with respect to any acquisition. Further, we may not be able to properly integrate the acquired products, technologies or businesses, with our existing products and operations, train, retain and motivate personnel from the acquired businesses, or combine potentially different corporate cultures. If we are unable to fully integrate the acquired products, technologies or businesses, or train, retain and motivate personnel from the acquired businesses, we may not receive the intended benefits of the acquisitions, which could harm our business, operating results and financial condition.
20
If actual results or events differ materially from our estimates and assumptions, our reported financial condition and results of operations for future periods could be materially affected.
The preparation of consolidated financial statements and related disclosure in accordance with generally accepted accounting principles requires management to establish policies that contain estimates and assumptions that affect the amounts reported in the consolidated financial statements and the accompanying notes. Note 1 to the Consolidated Financial Statements in our Annual Report on Form 10-K for the fiscal year ended December 31, 2015 describes the significant accounting policies and estimates essential to preparing our financial statements. The preparation of these financial statements requires us to make estimates and judgments that affect the reported amounts of assets, liabilities, revenue and expenses, and related disclosures. We base our estimates on historical experience and assumptions that we believe to be reasonable under the circumstances. Actual future results may differ materially from these estimates. We evaluate, on an ongoing basis, our estimates and assumptions.
Our agreements with the holders of the Series A redeemable convertible preferred stock contain covenants that could limit our ability to obtain financing using our equity. In addition, if we engage in future financings, we may have to use the proceeds to redeem the preferred stock held by such holders. This could cause us to have difficulty in obtaining capital necessary to run our business.
Our agreements with the holders of the Series A redeemable convertible preferred stock give such holders veto power over certain future financings, and give such holders certain rights to participate in any subsequent financing, whether through debt or equity (subject to certain exclusions). These participation rights could discourage a potential investor or a potential lender from making financing available to us on favorable terms. Because of these covenants, if we determine that we are in need of additional capital, we might not be able to obtain it. In addition, our agreements with the holders of the Series A redeemable convertible preferred stock provide that if, at the time of certain future debt or equity financings, the proceeds of which exceed $5 million, the holders of the Series A redeemable convertible preferred stock still have outstanding Series A redeemable convertible preferred stock, then we must offer to repurchase their Series A redeemable convertible preferred stock. The holders of the Series A redeemable convertible preferred stock have the right to accept the offer or to retain their Series A redeemable convertible preferred stock. If we do a financing, and the holders of the Series A redeemable convertible preferred stock elect to have their Series A redeemable convertible preferred stock repurchased, then the capital raised in excess of $5 million will go to repurchase the holders’ Series A redeemable convertible preferred stock, instead of being able to be used for our business.
Our agreements with the holders of the Series A redeemable convertible preferred stock prevent us from undertaking certain transactions or incurring certain indebtedness without such holders’ consent or unless the Series A redeemable convertible preferred stock held by such holders is repurchased. This could hurt our ability to sell underperforming assets or lines of business or to obtain financing.
Our agreements with the holders of the Series A redeemable convertible preferred stock prevent us from undertaking certain transactions or incurring certain debt without such holders’ consent or unless the Series A redeemable convertible preferred stock held by such holders’ is repurchased. These transactions include, but are not limited to:
•A merger with, or the sale of substantially all of the Company’s assets or capital stock, to a third party;
•Assumption of indebtedness in excess of 80% of the Company’s accounts receivable; and
•The sale, license or other disposition of 10% or more of the tangible assets or capital stock of the Company.
This could limit our ability to sell off underperforming assets or business lines. It could also prevent us from obtaining financing we may need to run or to grow our business.
21
The holders of the Series A redeemable convertible preferred stock are entitled to dividends on the Series A redeemable convertible preferred stock they hold. Depending on whether these dividends are paid in cash or stock, the payment of these dividends will either decrease cash that is available to us to invest in our business or dilute the holdings of all other stockholders.
Our agreements with the holders of the Series A redeemable convertible preferred stock provide that such holders will receive quarterly dividends on the Series A redeemable convertible preferred stock at prime rate plus 5%, subject to a maximum dividend rate of 10%. If we do not have at least $1.0 million in positive cash flow for any calendar quarter after giving effect to the payment of such dividends, then we can, at our election, pay such dividends in whole or in part in cash, provided that cash flow from operations is not negative, and the remainder can be accrued or paid in common stock to the extent certain equity conditions are satisfied. We also have the ability to accrue and roll over dividends. During the first quarter of 2015 we were not in compliance with the cash flow requirement to pay dividends in cash. We obtained a waiver from the holders of the Series A redeemable convertible preferred stock related to the $1.0 million positive cash flow requirement which allowed us to pay the first quarter 2015 dividend in cash. There can be no assurance that the holders of the Series A redeemable convertible preferred stock will waive this requirement in the future. In addition, we accrued our second and third quarter 2015 dividends and the holder of the Series A redeemable convertible preferred stock ultimately elected to exercise its right to convert the accrued dividends into an aggregate of 227,345 shares of our common stock. The payment of future dividends in cash will reduce the cash that we have available to invest in our business. There can be no assurance that we will have enough cash to pay future dividends in cash. If any future dividends are paid in common stock, this will dilute the holdings of all other stockholders.
If we breach various provisions of our agreements with the holders of the Series A redeemable convertible preferred stock, such holders may be entitled to demand redemption of the preferred stock and to gain majority control of our Board of Directors. This would decrease the capital available for our business and give the holders of the Series A redeemable convertible preferred stock control of the Company. There can be no assurance that we will not breach the relevant provisions or that if we do breach the provisions, that we will be able to redeem the preferred stock.
Our agreements with the holders of the Series A redeemable convertible preferred stock provide that if we breach certain provisions of the agreements, a “Breach Event” will have occurred. If a Breach Event were to occur, the holders of the Series A redeemable convertible preferred stock would be entitled to demand the redemption of any outstanding Series A redeemable convertible preferred stock that they hold. If we did not have the cash necessary to redeem the Series A redeemable convertible preferred stock, the dividends accruing on any outstanding Series A redeemable convertible preferred stock would increase to prime plus 10% (from prime plus 5%). For each six months that the Series A redeemable convertible preferred stock remained unredeemed, the dividend rate would increase by 1%, subject to a maximum dividend rate of 19%. Paying these increased dividends could further decrease the amount of capital we have available to run and to invest in our business. In addition, if a Breach Event were to occur and the Company is in default under or has breached any provision in respect of its obligations to redeem the Series A redeemable convertible preferred stock, our Board of Directors would automatically be increased, with the holders of the Series A redeemable convertible preferred stock having the right to appoint the new directors, so that the holders of the Series A redeemable convertible preferred stock would have appointed a majority of the Board of Directors. This would give the holders of the Series A redeemable convertible preferred stock control of the Company. There can be no assurance that a Breach Event will not occur and that if a Breach Event does occur, that we will be able to redeem the Series A redeemable convertible preferred stock.
22
The holders of the Series A redeemable convertible preferred stock have the right to require redemption of the Series A redeemable convertible preferred stock after August 5, 2017. If we are not able to redeem the Series A redeemable convertible preferred stock following a redemption request, the dividends on the Series A redeemable convertible preferred stock will increase. These increased dividends could further reduce the amount of capital available for use in our business. In addition, if we are not able to redeem the Series A redeemable convertible preferred stock then the holders of the Series A redeemable convertible preferred stock will be entitled to appoint a majority of our Board of Directors, which will give the holders of the Series A redeemable convertible preferred stock control of the Company. There can be no assurance that we will be able to redeem the Series A redeemable convertible preferred stock after August 5, 2017.
After August 5, 2017, the holders of the Series A redeemable convertible preferred stock have the right to demand redemption of any of the outstanding Series A redeemable convertible preferred stock that they still hold. If we do not have the funds necessary to redeem the Series A redeemable convertible preferred stock, the dividends accruing on any outstanding Series A redeemable convertible preferred stock will increase to prime plus 10% (from prime plus 5%). For each six months that the Series A redeemable convertible preferred stock remains unredeemed, the dividend rate increases by 1%, subject to a maximum dividend rate of 19%. Paying these increased dividends could further decrease the amount of capital we have available to run and to invest in our business. In addition, our failure to redeem the Series A redeemable convertible preferred stock would be considered a “Breach Event” under the agreements with the holders of the Series A redeemable convertible preferred stock. If a Breach Event were to occur, then, under the agreements with the holders of our Series A redeemable convertible preferred stock, our Board of Directors would automatically be increased, with the holders of the Series A redeemable convertible preferred stock having the right to appoint the new directors, so that the holders of the Series A redeemable convertible preferred stock would have appointed a majority of the Board of Directors. This would give the holders of the Series A redeemable convertible preferred stock control of the Company. There can be no assurance that we will be able to redeem the Series A redeemable convertible preferred stock after August 5, 2017 should the holders of our Series A redeemable convertible preferred stock request such redemption.
We defaulted under a covenant in the Stock Purchase Agreement covering our Series A redeemable convertible preferred stock. While we obtained a waiver of default, there can be no assurance that we will not default again in the future or that the holders of the Series A redeemable convertible preferred stock will provide waivers of default in the future.
As of December 31, 2015, we were not in compliance with certain financial covenants related to billings and cash related to our Series A redeemable convertible preferred stock because we did not reach the agreed upon targets for two consecutive quarters. Under the agreement, this default would allow the Series A redeemable convertible preferred stockholders to require us to redeem any of the Series A redeemable convertible preferred stock for the greater of 100% of the stated value plus accrued and unpaid dividends or the product of the number of shares of common stock underlying the Series A redeemable convertible preferred stock and the closing price as of December 31, 2015. We were able to obtain a waiver of the holders' rights arising from the default, from the Series A redeemable convertible preferred stockholders. There can be no guarantee that we will meet the financial covenants going forward or that the Series A redeemable convertible preferred stockholders will grant a waiver if we fail to meet the financial covenants. If we breach a financial covenant, and if we are unable to obtain a waiver of that default, the Series A redeemable convertible preferred stockholders would be able to redeem their holdings. If the Series A redeemable convertible preferred stock were to be redeemed, it would negatively impact our total cash and cash equivalents.
Unknown Factors
Additional risks and uncertainties of which we are unaware or which currently we deem immaterial also may become important factors that affect us.
Item 1B. Unresolved Staff Comments
None
Item 2. Properties
The Company’s headquarters are located in an approximately 55,000 square foot facility in Melville, New York. Offices are also leased for development, support, and sales and marketing personnel, which total an aggregate of approximately 34,000 square feet in La Garenne, France; Reading, UK; Munich, Germany; Taichung, Taiwan; Tokyo, Japan; Beijing and Shanghai, China; Seoul, Korea; Kuala Lumpur, Malaysia; and Singapore. Initial lease terms range from one to six years, with multiple renewal options.
23
Item 3. Legal Proceedings
In view of the inherent difficulty of predicting the outcome of litigation, particularly where the claimants seek very large or indeterminate damages, we generally cannot predict what the eventual outcome of the pending matters will be, what the timing of the ultimate resolution of these matters will be, or what the eventual loss, fines or penalties related to each pending matter may be.
In accordance with the authoritative guidance issued by the FASB on contingencies, we accrue anticipated costs of settlement, damages and losses for claims to the extent specific losses are probable and estimable. We record a receivable for insurance recoveries when such amounts are probable and collectable. In such cases, there may be an exposure to loss in excess of any amounts accrued. If, at the time of evaluation, the loss contingency related to a litigation is not both probable and estimable, the matter will continue to be monitored for further developments that would make such loss contingency both probable and estimable and, we will expense these costs as incurred. If the estimate of a probable loss is a range and no amount within the range is more likely, we will accrue the minimum amount of the range.
Stockholder Litigation
Company stockholders filed actions in the Suffolk County Division of the Supreme Court of the State of New York, putatively derivatively on behalf of the Company, against the Company, each of the Company’s Directors, Mr. Weber, the former Chief Financial Officer and Vice President of Operations of the Company, Wayne Lam, a former Vice president of the Company, the estate of Mr. Huai, the former Chairman, President and Chief Executive Officer of the Company, and Jason Lin, a former employee of the Company (the “Derivative Action”). The consolidated amended Derivative Action complaint alleged that the defendants breached their duties to the Company by: (1) causing or allowing the dissemination of false and misleading information; (2) failing to maintain internal controls; (3) failing to manage the Company properly; (4) unjustly enriching themselves; (5) abusing their control of the Company; and (6) wasting Company assets.
On March 5, 2013, the Suffolk County Division of the Supreme Court of the State of New York granted a motion made by all of the defendants in the Derivative Action, except Mr. Lin, and dismissed the Derivative Action as to all defendants other than Mr. Lin. The stockholders appealed the dismissal of the Derivative Action and on March 18, 2015, the Appellate Division, Second Department unanimously affirmed the New York Supreme Court’s decision dismissing the Derivative Action. The Plaintiffs have not timely sought leave to appeal the Appellate Division’s decision to the New York Court of Appeals, and thus we believe this matter has been finally resolved.
We have insurance policies that were purchased to cover, among other things, lawsuits like the Derivative Action and a class action lawsuit that has been settled by the Company (the "Class Action"). Our Directors and Officers (“D&O”) Insurance, is composed of more than one layer, with each layer written by a different insurance company. However, the events that gave rise to the claims in the Derivative Action and the Class Action caused our insurers to reserve their rights to disclaim, rescind, or otherwise not be obligated to provide coverage to us and certain other insureds under the policies. In light of these uncertainties, the Company entered into settlements with two of its insurers. Pursuant to these settlements, we will not receive repayment of all amounts it might otherwise have received.
Other Claims
We are subject to various legal proceedings and claims, asserted or unasserted, which arise in the ordinary course of business. While the outcome of any such matters cannot be predicted with certainty, such matters are not expected to have a material adverse effect on our financial condition or operating results.
We continue to assess certain litigation and claims to determine the amounts, if any, that we believe may be paid as a result of such claims and litigation and, therefore, additional losses may be accrued and paid in the future, which could materially adversely impact our financial results, cash flows and cash reserves.
Item 4. Mine Safety Disclosures
Not applicable
24
PART II
Item 5. Market for Registrant’s Common Equity, Related Stockholder Matters and Issuer Purchases of Equity Securities
Market Information
Our Common Stock is listed on The Nasdaq Global Market (“Nasdaq”) under the symbol “FALC”. The following table sets forth the range of high and low closing sales prices of our Common Stock for the periods indicated as reported by Nasdaq:
2015 | 2014 | |||||||||||||||
High | Low | High | Low | |||||||||||||
Fourth Quarter | $ | 2.07 | $ | 1.80 | $ | 1.37 | $ | 1.01 | ||||||||
Third Quarter | $ | 2.20 | $ | 1.39 | $ | 1.70 | $ | 1.12 | ||||||||
Second Quarter | $ | 1.61 | $ | 1.37 | $ | 1.79 | $ | 1.44 | ||||||||
First Quarter | $ | 1.65 | $ | 1.32 | $ | 1.73 | $ | 1.32 | ||||||||
Holders
We had approximately 343 holders of record of Common Stock as of January 31, 2016. This does not reflect persons or entities that hold Common Stock in nominee or “street” name through various brokerage firms.
Dividends
We have not paid any cash dividends on our common stock since inception. We expect to reinvest any future earnings to finance growth, and therefore do not intend to pay cash dividends on our common stock in the foreseeable future. In addition, the terms of our Series A redeemable convertible preferred stock restrict our ability to pay dividends on our common stock. Our board of directors may determine to pay future cash dividends on our common stock if it determines that dividends are an appropriate use of Company capital.
Holders of the Series A redeemable convertible preferred stock are entitled to receive quarterly dividends at the Prime Rate (Wall Street Journal Eastern Edition) plus 5% (up to a maximum amount of 10%), payable in cash, provided, that if we will not have at least $1.0 million in positive cash flow for any calendar quarter after giving effect to the payment of such dividends, we, at our election, can pay such dividends in whole or in part in cash, provided that cash flow from operations is not negative, and the remainder can be accrued or paid in common stock to the extent certain equity conditions are satisfied. As of December 31, 2014, due to the lack of sufficient surplus to pay dividends as required by the Delaware General Business Corporation Law, we were not permitted to pay the fourth quarter dividend in cash and accrued our fourth quarter 2014 dividend. As of March 31, 2015, we had sufficient surplus to pay dividends as required by the Delaware General Business Corporation law; however, we were not in compliance with the positive cash flow requirement to pay dividends in cash which would have required us to pay these dividends in kind through additional shares of this Series A redeemable convertible preferred stock. As a result, on April 20, 2015, we obtained a waiver from the holders to allow us to pay the fourth quarter 2014 and first quarter 2015 quarterly dividends in cash. These dividends were paid in cash in April 2015. We subsequently accrued the dividends payable for the periods ended Jun 30, 2015 and September 30, 2015. In December 2015, the holder of the Series A redeemable convertible preferred stock exercised its right to convert such accrued dividends into 227,345 shares of our common stock. For the year-ended December 31, 2015, we paid cash dividends totaling $0.4 million to Series A redeemable convertible preferred stock holders. In January 2016, we issued 103,200 shares of our common stock as payment for the fourth quarter 2015 dividend.
25
Equity Compensation Plan Information
Number of securities to be issued upon exercise of outstanding options, warrants and rights (1) | Weighted-average exercise price of outstanding options, warrants and rights (1) | Number of securities remaining available for future issuance under equity compensation plans (excluding securities reflected in column (a)) (1) | ||||
Plan Category | (a) | (b) | (c) | |||
Equity compensation plans approved by security holders | 7,972,341 | $2.15 | 3,124,559 | |||
(1) | As of December 31, 2015 we had 3,124,559 shares of our common stock reserved for issuance under our stock plans with respect to options (or restricted stock or restricted stock units) that have not been granted. In addition, if, on July 1st of any calendar year in which our 2006 Plan is in effect, the number of shares of stock to which options may be granted is less than five percent (5%) of the number of outstanding shares of stock, then the number of shares of stock available for issuance under the 2006 Plan shall be increased so that the number equals five percent (5%) of the shares of stock outstanding. See Note (10) Share-Based Payment Arrangements to our consolidated financial statements for further information. |
Performance graph
The following graph compares, for each of the periods indicated, the percentage change in the Company’s cumulative total stockholder return on the Company’s common stock with the cumulative total return of a) Morningstar Data Storage companies, a peer group index and b) the Russell 3000 Index, a broad equity market index.
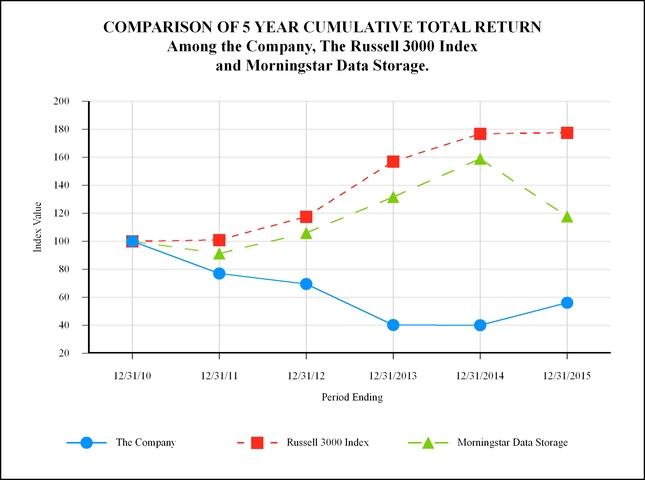
26
ASSUMES $100 INVESTED ON JANUARY 1, 2011
ASSUMES DIVIDEND REINVESTED
FISCAL YEAR ENDING DECEMBER 31, 2015
Fiscal Year Ending | ||||||||||||||||||||||||
12/31/2010 | 12/31/2011 | 12/31/2012 | 12/31/2013 | 12/31/2014 | 12/31/2015 | |||||||||||||||||||
The Company | $ | 100.00 | $ | 77.01 | $ | 69.55 | $ | 40.30 | $ | 40.00 | $ | 56.12 | ||||||||||||
Russell 3000 Index | $ | 100.00 | $ | 101.03 | $ | 117.61 | $ | 157.07 | $ | 176.79 | $ | 177.64 | ||||||||||||
Morningstar Data Storage | $ | 100.00 | $ | 91.35 | $ | 105.99 | $ | 131.68 | $ | 158.95 | $ | 117.78 | ||||||||||||
There can be no assurance that the Company's common stock performance will continue with the same or similar trends depicted in the graph above.
Issuer Purchases of Equity Securities
None
Unregistered Sales of Equity Securities and Use of Proceeds
In connection with the right of the holder of the Series A redeemable convertible preferred stock to convert accrued dividends into common stock for the periods ended June 30, 2015 and September 30, 2015, due owing to the holder, the Company issued an aggregate of 227,345 shares of Common Stock, to the holder. The conversion and the related issuance was in accordance with the terms of the Certificate of Designations, Preferences and Rights of Series A Convertible Preferred Stock (the “Certificate of Designation”), and the Company has no further obligations to the holder with respect to the accrued dividends.
In addition, in January 2016, in accordance with the terms of the Certificate of Designation, the Company elected to pay the dividend payable to the holders of the Series A redeemable convertible preferred stock for the period ended December 31, 2015 through the issuance to HCP of 103,200 shares of Common Stock.
The Common Stock issued in the forgoing transactions was issued in accordance with the exemption provided by Section 4(2) of the Securities Act of 1933, as amended.
27
Item 6. Selected Financial Data
The selected financial data appearing below have been derived from our audited consolidated financial statements, and should be read in conjunction with these consolidated financial statements and the notes thereto and the information contained in Item 7, “Management’s Discussion and Analysis of Financial Condition and Results of Operations.”
CONSOLIDATED STATEMENTS OF OPERATIONS DATA: | ||||||||||||||||||||
Year Ended December 31, | ||||||||||||||||||||
2015 (a) | 2014 (a), (b) | 2013 (a), (c), (d) | 2012 | 2011 | ||||||||||||||||
(In thousands, except per share data) | ||||||||||||||||||||
Revenue: | ||||||||||||||||||||
Product revenue | $ | 24,848 | $ | 17,723 | $ | 27,339 | $ | 41,359 | $ | 49,470 | ||||||||||
Support and services revenue | 23,723 | 28,551 | 31,298 | 34,052 | 33,400 | |||||||||||||||
Total revenue | 48,571 | 46,274 | 58,637 | 75,411 | 82,871 | |||||||||||||||
Cost of revenue: | ||||||||||||||||||||
Product | 1,943 | 2,792 | 4,156 | 8,215 | 8,387 | |||||||||||||||
Support and service | 7,739 | 7,839 | 11,000 | 12,447 | 13,130 | |||||||||||||||
Total cost of revenue | 9,682 | 10,631 | 15,156 | 20,662 | 21,517 | |||||||||||||||
Gross profit | $ | 38,889 | $ | 35,643 | $ | 43,481 | $ | 54,749 | $ | 61,354 | ||||||||||
Operating expenses | ||||||||||||||||||||
Research and development costs | 12,788 | 12,453 | 15,613 | 18,950 | 21,509 | |||||||||||||||
Selling and marketing | 18,022 | 24,426 | 25,223 | 35,695 | 39,289 | |||||||||||||||
General and administrative | 9,181 | 9,106 | 12,265 | 13,334 | 11,697 | |||||||||||||||
Investigation, litigation, and settlement related costs (benefits) | 9 | (5,418 | ) | 374 | (326 | ) | 10,257 | |||||||||||||
Restructuring costs | 173 | 1,135 | 3,606 | 771 | 822 | |||||||||||||||
Total operating expenses | 40,173 | 41,702 | 57,081 | 68,424 | 83,574 | |||||||||||||||
Operating loss | (1,284 | ) | (6,059 | ) | (13,600 | ) | (13,675 | ) | (22,220 | ) | ||||||||||
Interest and other (loss) income, net | (270 | ) | (643 | ) | 1,094 | (523 | ) | 60 | ||||||||||||
Loss before income taxes | (1,554 | ) | (6,702 | ) | (12,506 | ) | (14,198 | ) | (22,160 | ) | ||||||||||
Provision (benefit) for income taxes | 375 | 510 | (1,574 | ) | 786 | 1,208 | ||||||||||||||
Net loss | $ | (1,929 | ) | $ | (7,212 | ) | $ | (10,932 | ) | $ | (14,984 | ) | $ | (23,368 | ) | |||||
Less: Accrual of Series A redeemable convertible preferred stock dividends | 765 | 748 | 216 | — | — | |||||||||||||||
Less: Accretion to redemption value of Series A redeemable convertible preferred stock | 588 | 493 | 128 | — | — | |||||||||||||||
Net loss attributable to common stockholders | $ | (3,282 | ) | $ | (8,453 | ) | $ | (11,276 | ) | $ | (14,984 | ) | $ | (23,368 | ) | |||||
Basic net loss per share attributable to common stockholders | $ | (0.08 | ) | $ | (0.18 | ) | $ | (0.24 | ) | $ | (0.32 | ) | $ | (0.50 | ) | |||||
Diluted net loss per share attributable to common stockholders | $ | (0.08 | ) | $ | (0.18 | ) | $ | (0.24 | ) | $ | (0.32 | ) | $ | (0.50 | ) | |||||
Weighted average basic shares outstanding | 41,094 | 46,265 | 47,979 | 47,409 | 46,649 | |||||||||||||||
Weighted average diluted shares outstanding | 41,094 | 46,265 | 47,979 | 47,409 | 46,649 | |||||||||||||||
(a) | On September 16, 2013, we issued to Hale Capital Partners, LP 900,000 shares of the Company’s Series A redeemable convertible preferred stock. We included a deduction of $0.6 million, $0.5 million and $0.1 million as an adjustment to net loss attributable to common stockholders on the statement of operations and in determining loss per share for the years ended December 31, 2015, 2014 and 2013, respectively. This amount represents the accretion of the transaction costs of $0.3 million, beneficial conversion feature of $2.0 million and fair value allocated to the embedded derivatives of $0.2 million at the time of issuance. We also included a deduction of $0.8 million, $0.8 million and $0.2 million as an adjustment to net loss attributable to common shareholders on the statement of operations and in determining loss per share for the years ended December 31, 2015, 2014 and 2013, respectively, for accrued dividends on the Series A redeemable convertible preferred stock. See note (8) Series A Redeemable Convertible Preferred Stock to our consolidated financial statements for further information. |
28
(b) | Included within investigation, litigation, and settlement related costs (benefits) for 2014 is a non-recurring gain of $5.3 million related to the settlement of the Estate litigation. |
(c) | Included within interest and other (loss) income, net for 2013 is a non-recurring gain of $2.1 million related to the sale of our cost-method investment. |
(d) | Included within provision (benefit) for income taxes for 2013 is a non-recurring benefit of $2.3 million related to the reversal of unrecognized tax benefits due to the expiration of applicable statutes of limitations partly offset by withholding taxes of $0.2 million recorded on the gain of our cost-method investment. |
CONSOLIDATED BALANCE SHEET DATA: | ||||||||||||||||||||
2015 | 2014 | 2013 | 2012 | 2011 | ||||||||||||||||
(In thousands) | ||||||||||||||||||||
Cash, cash equivalents, restricted cash and marketable securities | $ | 13,433 | $ | 21,775 | $ | 28,111 | $ | 29,932 | $ | 37,763 | ||||||||||
Working capital (deficit) | (2,345 | ) | 1,330 | 14,327 | 10,613 | 20,382 | ||||||||||||||
Total assets | 30,426 | 42,323 | 53,218 | 59,705 | 73,047 | |||||||||||||||
Long-term obligations | 9,884 | 13,954 | 12,413 | 9,099 | 10,285 | |||||||||||||||
Series A redeemable convertible preferred stock | 7,819 | 7,231 | 6,738 | — | — | |||||||||||||||
Stockholders' (deficit) equity | (11,709 | ) | (10,471 | ) | 6,218 | 13,253 | 22,817 | |||||||||||||
29
ITEM 7. Management’s Discussion and Analysis of Financial Condition and Results of Operations
The following Management’s Discussion and Analysis of Financial Condition and Results of Operations contains “forward-looking statements” within the meaning of Section 27A of the Securities Act of 1933 and Section 21E of the Securities Exchange Act of 1934. These forward-looking statements can be identified by the use of predictive, future-tense or forward-looking terminology, such as “believes,” “anticipates,” “expects,” “estimates,” “plans,” “may,” “intends,” “will,” or similar terms. Investors are cautioned that any forward-looking statements are not guarantees of future performance and involve significant risks and uncertainties, and that actual results may differ materially from those projected in the forward-looking statements. The following discussion should be read together with the consolidated financial statements and notes to those financial statements included elsewhere in this report.
OVERVIEW
Calendar 2015 continued to be a year of innovation and introduction of new product offerings to our customers. During the second quarter, we released for general availability a new and innovative solution which is agnostic to any server hardware or storage hardware manufacturer; a horizontal software-defined storage platform inclusive of converged data services called FreeStor®. FreeStor addresses heterogeneous storage portfolios, all-flash array and hybrid flash array hardware manufacturers which do not have a software stack or do not have an enterprise-ready software stack, and solutions for managed service providers. FreeStor provides management, monitoring, reporting and provisioning through a web browser, tablet or smartphone which gives end-users or storage administrators the ability to be completely mobile when managing their virtual storage portfolio. During the third quarter, we announced that we acquired an exclusive source code and distribution license from Cumulus Logic for a next-generation intelligent cloud-based predictive analytics monitoring system for FreeStor. The exclusive source code license will provide the FreeStor product with core intelligence to the Software Defined Data Center - Intelligent Abstraction® and Intelligent Predictive Analytics that work in real-time for visualization, analysis and action as well as “smart rules” based tools for performance monitoring, capacity planning, and other insights to maximize storage resources - which many hardware vendors lack - the cloud-based engine will also enable secure multi-tenancy for service providers that manage their customers’ data and infrastructure, and support private cloud infrastructures. Additionally, in February of 2015, we announced the general availability of our Continuous Data Protection ("CDP") and Network Storage Server ("NSS") version 8.0. The CDP/NSS v. 8.0 product includes re-architecting the IPStor® core engine, IO paths, HA logic, a new IP Cluster engine, and overall data management and change tracking.
Since the introduction and release of FreeStor in mid-2015, FreeStor has won five SDS product-of-the-year awards at various leading industry publications, including three publications servicing the Asia markets and two publications servicing the America’s and European marketplace. Additionally, FreeStor has been nominated for product-of-the-year at two other leading industry publications which are expected to be announced later during the first quarter of 2016. We believe these awards highlight and validate FreeStor as a leader within the newly emerging SDS marketplace in such a short period of time.
Over the past two-years, we began to redefine and to refocus our products. At its core, we believe we offer customers “freedom” from the constraints of traditional data management products and the overinflated costs of data protection. We focused product developments on updating our existing portfolio to address the needs of customers and newer technologies. Through optimizing the underlying technology and core engines, we were better able to prepare to deliver our next generation unified data management platform, which is what we delivered in 2015 including our re-architected IPStor® core engine and our FreeStor platform.
As we stated since the beginning of 2015, one of the key indicators of the initial success of our new product offerings will be our ability to secure new OEM all-flash array manufacturers, managed service providers and finally enterprise-class customers by the end of 2015. As of December 31, 2015, we added six new OEM all-flash array manufacturers, eight new service providers and seven enterprise-class customers who have contracted for and/or implemented our FreeStor technology into their services portfolios. In addition, we have over one-hundred and fifty customers currently using the underlying FreeStor technology in various production environments, which has validated the production readiness of our FreeStor technology today.
30
Our results in 2015 may not be directly comparable with prior results of the Company. Since our inception as a Company through the third quarter of 2013, we used the “up front” revenue model for revenue from nearly all sales of product licenses and hardware. 2015 is the second full year whereby we offer more flexibility in licensing and payment structures, and as a result the product revenue for some transactions are being recognized ratably over the contractual maintenance term. We expect to continue this flexibility going forward, and also expect that the number of transactions with flexible sales terms will increase over time, which could result in variable periods for recognizing the revenue. Furthermore, our FreeStor platform is sold on a subscription based offering with ratable revenue recognition recorded over the term of the subscription. Our support and maintenance revenue has always been recognized ratably over the term of the support and maintenance agreement and this will not change. Our professional services revenue will continue to be recognized upon delivery of the professional services unless it is sold as part of a bundled arrangement for which we have not established fair value for all undelivered elements which would require the revenue from the entire arrangement be recognized over the longest service term which would be the maintenance term.
One consequence of offering the flexibility in licensing, payment structures and subscription based offerings, which result in ratable revenue recognition, is that our GAAP revenue number will likely show greater fluctuations on a quarterly basis. Some transactions that would have been recognized into revenue in one period, will now be recognized over a longer period of time. For this reason, we look to our quarterly and our annual bookings, rather than to our quarterly and our annual revenue numbers, to gauge our progress.
We believe that the flexibility in licensing, payment structures and subscription based offerings has made and will continue to make us more competitive in the marketplace by allowing us more flexibility to work with end users to design licensing and payment terms that meet their needs.
In July, 2013, we entered into a joint development agreement with Violin Memory, Inc., ("Violin") that provided us with $12.0 million of payments based on milestone deliverables that were completed by December 31, 2014. As of December 31, 2014, all of the milestone deliverables were met under our agreement with Violin, and we received the entire $12.0 million, of which $11.3 million was classified as deferred revenue. During the fourth quarter of 2014, we entered into a two-year maintenance and support agreement associated with the final deliverables, and as a result the remaining $11.3 million of deferred revenue associated with the milestone payments, or $1.4 million per quarter, was to be recognized as revenue over the two-year agreement. During the first quarter of 2015, Violin notified the Company that they elected to terminate their maintenance and support agreement and that there are no future services deliverables under any agreement, which resulted in the acceleration of the remaining deferred revenue, as of March 31, 2015, of approximately $9.9 million which was recognized as product revenue during the quarter.
Overall, total revenue increased 5% from $46.3 million for the year ended December 31, 2014 to $48.6 million for the year ended December 31, 2015. Excluding $11.3 million of revenue attributable to the joint-development agreement recognized during the first quarter of 2015, total revenue decreased 18% to $37.3 million for the year ended December 31, 2015. We attribute the decline in total revenues to several factors. First, although we have updated and introduced new versions of our point-solutions to address the needs of customers and the marketplace, the volume of new product licenses sales, both for expansion of our existing installed base and in the acquisition of new customers declined from the prior year. Second, as partners and customers evaluate and plan for the transition to our re-architected core platforms and/or evaluate our new licensing and product offering of FreeStor, we have experienced elongated evaluation process by IT decision makers for both existing customer expansions and in some cases renewals of existing maintenance agreements. We believe that our engineering efforts throughout the year and the release of new and innovative technology which addresses the software-defined-storage marketplace will enable us to capitalize on the rapidly evolving technology landscape and industry standards in 2016. Finally, to a lesser extent, as discussed above, we continue to provide our customers with more flexibility in licensing and payment structures, resulting in lower revenue in the current year and increased revenue in future periods when compared to our standard “up-front” model.
Support and services revenue decreased 17% from $28.6 million for the year ended December 31, 2014 to $23.7 million for the same period in 2015. A primary driver in the decline was related to the impact of decreased number of new product license sales related to our legacy products over the past twelve to eighteen months prior to the release of our new product offerings during the first half of 2015. The winding up of support contracts from our legacy OEM sales also contributed to the decline in our support and services revenues.
Net loss for the year ended December 31, 2015 was $1.9 million, compared with a net loss of $7.2 million for the year ended December 31, 2014. Typically, we look to operating income as another measure of our progress. This number enables us to measure and to compare our results of operations from one year to the next. Operating loss for 2015 was $1.3 million, compared with an operating loss of $6.1 million in 2014. Included in our operating loss for 2015 was $11.3 million of revenue attributable to the joint-development agreement. Included in our operating loss for 2014 was a benefit of $5.4 million of investigation, litigation and settlement related costs.
31
Overall, our operating expenses decreased 4% or $1.5 million to $40.2 million in 2015 from $41.7 million in 2014. Included in our operating results for 2014 was a benefit of $5.4 million related to our investigation, litigation and settlement related costs.
Our gross margins improved to 80% for 2015 as compared with 77% in 2014. The increase in gross margin was primarily attributable to the product revenue recorded in 2015 related to our joint development agreement. Excluding the joint development agreement revenue, gross margin decreased to 74% from 77% for the years ended December 31, 2015 and 2014, respectively. The decrease in gross margin was primarily attributable to a decrease in the percentage of our product revenue from sales of our stand-alone software applications, which have higher gross margins than sales of our fully integrated solutions with hardware appliances, compared with the same period in 2014. Our new flagship product offering, FreeStor, is a subscription-based product offering, is primarily sold as a software only solution, which we anticipate will drive higher product gross margins in the future.
Operating margin is a measure of operating efficiency. We incur research and development expenses before the product is offered for licensing. These expenses consist primarily of personnel costs for engineering and testing, but also include other items such as the depreciation and amortization of hardware and software used in development. We also have expenses for software support, sales and marketing, and general and administrative functions. While our operating margins continue to be impacted by one-time items, impacts from changes in our licensing model and product transitions, our results are not reflective of our internal targets and we continue to look for ways to improve our operating efficiencies.
Most of our revenue comes from sales to customers through resellers. As service providers to companies, resellers’ reputations are dependent on satisfying their customers’ needs efficiently and effectively. Resellers have wide choices in fulfilling their customers’ needs. If resellers determine that a product they have been providing to their customers is not functioning as promised, or is not providing adequate return on investment, or if the customers are not satisfied with the level of support they are receiving from the suppliers, the resellers will move quickly to offer different solutions to their customers. Additional sales by resellers are therefore an important indicator of our business prospects.
Our “Business Partner” program for our resellers provides financial incentives, for those resellers that are willing to make a commitment to FalconStor through training, marketing and revenue. As part of our review of all of our operations to maximize savings without sacrificing sales, and in connection with our Business Partner program, we continually review our relationship with each of our resellers in all regions. We decided to focus on only those resellers who have the expertise, personnel and networks to identify potential customers and to service our end users.
As of December 31, 2015 and 2014, excluding deferred revenue related to our joint-development agreement, approximately 73% and 78% of our deferred revenue consists of amounts attributable to future support and maintenance of our products, respectively, and approximately 27% and 22% of deferred revenue consists of amounts attributable to product revenues, respectively. As we entered into more flexible transactions during 2015, we experienced a growth in deferred product revenues that will be recognized ratably over time. The level of deferred revenue is an important indicator of our success. Maintenance and support for our products is sold for fixed periods of time. Excluding the impact from our joint-development agreement, our deferred revenue increased 2% from $25.2 million in 2014 to $25.7 million in 2015. Deferred revenue will be an important key metric to measure our success in growing our business from a top line perspective as we anticipate certain product sales in 2016 to be recognized ratably under the terms of the arrangements and the licensing model of FreeStor as a subscription-based term license.
We continue to recognize share-based compensation expense in connection with the issuance of equity-based awards as part of our normal business operations. On an on-going basis we weigh the impact of the expense on our consolidated financial statements against the impact of discontinuing the grant of equity-based compensation to our worldwide workforce. It continues to be our view that the opportunity to participate in the growth of our Company is an important motivating and retention tool for our current employees and a valuable recruiting tool for new employees. We will thus continue to apply the criteria and the methodology we have used in the past to determine grants of stock options or other equity-based awards to our employees. For the management of our business and the review of our progress, we will continue to look to our results excluding share-based compensation expense and other limited non-operating focused expenses of the business. We will use these non-GAAP financial measures in making operating decisions because they measure the results of our day-to-day operations and because they provide a more consistent basis for evaluating and comparing our results across different periods.
32
RESULTS OF OPERATIONS – FOR THE YEAR ENDED DECEMBER 31, 2015 COMPARED WITH THE YEAR ENDED DECEMBER 31, 2014
Total revenue for the year ended December 31, 2015 increased 5% to $48.6 million, compared with $46.3 million for the year ended December 31, 2014. This increase was mainly attributable to $11.3 million of revenue recorded during 2015 associated with our joint development agreement compared with $0.7 million of revenue recorded during 2014. Excluding the revenue related to our joint development agreement, total revenue decreased 18% to $37.3 million for the year ended December 31, 2015, compared with $45.5 million for the year ended December 31, 2014. Our cost of revenue decreased 9% to $9.7 million for the year ended December 31, 2015, compared with $10.6 million for the year ended December 31, 2014. Our operating expenses decreased 4% from $41.7 million for the year ended December 31, 2014 to $40.2 million for the year ended December 31, 2015. Our operating expenses for the year ended December 31, 2014, benefited from a litigation settlement of $5.3 million associated with the Estate litigation. Also included in the operating results for the years ended December 31, 2015 and 2014 were; (i) $1.9 million and $1.5 million, respectively, of share-based compensation expense; and (ii) $0.2 million and $1.1 million, respectively, of restructuring costs. Net loss for the year ended December 31, 2015 was $1.9 million, compared with a net loss of $7.2 million for the year ended December 31, 2014. Net loss attributable to common stockholders, which includes the effects of the Series A redeemable convertible preferred stock dividends (including accrued dividends) and accretion, was $3.3 million for the year ended December 31, 2015, compared with $8.5 million for the year ended December 31, 2014.
Overall, our total operating expenses, excluding the $5.3 million gain recorded on the Estate litigation settlement for the year ended December 31, 2014, decreased $6.8 million, or 15%, to $40.2 million for the year ended December 31, 2015, compared with $47.0 million for the year ended December 31, 2014. This decrease was primarily attributable to our tighter expense controls and overall operational efficiencies which better align our current business plan on a run-rate basis. These efficiencies include among other items, a stream-lined personnel related costs, global overhead costs and efficiencies realized on our redesigned go-to-market coverage models. In addition, the decrease is attributable to a decrease in professional fees primarily related to an investment made in 2014 to penetrate certain market verticals under a one-year arrangement, which ended at March 31, 2015, as well as a decrease in our restructuring costs of $0.9 million compared with the year ended December 31, 2014. We will continue to evaluate the appropriate headcount levels to properly align our resources with our current and long-term outlook and to take actions in areas of the Company that may be underperforming.
Revenue
Year ended December 31, | ||||||||
2015 | 2014 | |||||||
Revenue: | ||||||||
Product revenue | $ | 24,847,724 | $ | 17,723,000 | ||||
Support and services revenue | 23,723,267 | 28,550,515 | ||||||
Total Revenue | $ | 48,570,991 | $ | 46,273,515 | ||||
Year-over-year percentage change | ||||||||
Product revenue | 40% | (35)% | ||||||
Support and services revenue | (17)% | (9)% | ||||||
Total percentage change | 5% | (21)% | ||||||
Product revenue
Product revenue is comprised of sales of both licenses for our software solutions and sales of the platforms on which the software is installed. This includes stand-alone software applications and software integrated with industry standard hardware, sold as one complete integrated solution or sold on a subscription or consumption basis. The products are sold through our OEMs, and through (i) value-added resellers, (ii) distributors, and/or (iii) directly to end-users (collectively “non-OEMs”). These revenues are recognized when all the applicable criteria under Generally Accepted Accounting Principles in the United States are met.
33
Product revenue increased 40% from $17.7 million for the year ended December 31, 2014 to $24.8 million for the year ended December 31, 2015, primarily due to a total of $11.3 million of product revenue recognized during 2015 related to our joint development agreement compared with $0.6 million of product revenue recognized during 2014. These amounts are net of benefits of less than $0.1 million and $0.1 million recognized during the years ended December 31, 2015 and 2014, respectively, resulting from the impact of our collection efforts of previously reserved accounts receivable. Product revenue represented 51% and 38% of our total revenue for the years ended December 31, 2015 and 2014, respectively. Excluding the product revenue recognized related to our joint development agreement, product revenue decreased $3.6 million or 21% to $13.6 million for the year ended December 31, 2015 compared with $17.2 million for the year ended December 31, 2014.
Excluding the joint development agreement revenue, product revenue from our OEM partners decreased $0.6 million, while product revenue from non-OEM partners decreased $2.9 million for the year ended December 31, 2015, compared with the same period in 2014. The decrease in OEM product revenue was due to a decrease in sales volume from one of our largest OEM partners in China, partly offset by the contribution of three new private-label OEMs in China during 2015. The decline in product revenue from our non-OEM partners was primarily due to, (i) a decrease in the volume of sales from our legacy product line(s) as partners and customers evaluate and plan for the transition to our re-architectured version 8.0 suite of products and the recently released FreeStor platform, (ii) challenges in obtaining new customer agreements, and (iii) the mix of deals where revenue is recognized ratably over the term of the associated maintenance agreement, rather than upon transaction completion and product delivery. Product revenue from our non-OEM partners represented 44% and 78% of our total product revenue for the years ended December 31, 2015 and 2014, respectively. Product revenue from our OEM partners represented 56% and 22% of our total product revenue for the years ended December 31, 2015 and 2014, respectively. Excluding the joint development agreement product revenue, our non-OEM partners and OEM partners represented 80% and 20%, respectively, of our total product revenue for both of the years ended December 31, 2015 and 2014, respectively.
We continue to invest in our product portfolio by refreshing and updating our existing product lines and developing our next generation of innovative product offerings to drive our sales volume in support of our long-term outlook.
Support and services revenue
Support and services revenue is comprised of revenue from (i) maintenance and technical support services, (ii) professional services primarily related to the implementation of our software, and (iii) engineering services. Revenue derived from maintenance and technical support contracts are deferred and recognized ratably over the contractual maintenance term. Professional services revenue is recognized in the period that the related services are performed or over the contractual term if VSOE does not exist for all undelivered elements. Engineering services are recognized upon customer acceptance or over the remaining contract term if vendor-specific objective evidence ("VSOE") does not exist for the remaining deliverables upon acceptance. Support and services revenue decreased 17% from $28.6 million for the year ended December 31, 2014 to $23.7 million for the year ended December 31, 2015. The decrease in support and services revenue was attributable to decreases in both maintenance and technical support services revenue and professional services revenue.
Maintenance and technical support services revenue decreased from $27.2 million for the year ended December 31, 2014 to $22.7 million for the same period in 2015. Our maintenance and technical support service revenue results primarily from (i) the purchase of maintenance and support contracts by our customers, and (ii) the renewal of maintenance and support contracts by our existing and new customers after their initial contracts expire. During the year ended December 31, 2015, the decline in maintenance and technical support services revenue was primarily attributable to a decrease of $3.7 million in maintenance revenue from our non-OEM partners primarily driven by the softness in our legacy product portfolio sales over the past twelve months prior to the release of our new product offerings during the first half of 2015 and the continued wind-down in maintenance revenue from certain legacy OEM partners which decreased $0.8 million. In addition, for the year ended December 31, 2014, we recorded maintenance and technical support services revenue of approximately $0.2 million related to our joint development agreement.
Professional services revenue decreased from $1.4 million for the year ended December 31, 2014 to $1.0 million for the year ended December 31, 2015. Professional services revenue varies from period to period based upon (i) the number of solutions sold during the existing and previous periods, (ii) the number of customers who elect to purchase professional services, (iii) the number of professional services contracts that are performed during the period, and (iv) the number of customers who elect to purchase engineering services and the timing of acceptance from the customer. We expect professional services revenue to continue to vary from period to period based upon the number of customers who elect to utilize our professional services upon purchasing any of our solutions.
34
Cost of revenue
Year ended December 31, | ||||||||
2015 | 2014 | |||||||
Cost of revenue: | ||||||||
Product | $ | 1,942,985 | $ | 2,791,950 | ||||
Support and service | 7,739,149 | 7,838,766 | ||||||
Total cost of revenue | $ | 9,682,134 | $ | 10,630,716 | ||||
Total Gross Profit | $ | 38,888,857 | $ | 35,642,799 | ||||
Gross Margin: | ||||||||
Product | 92% | 84% | ||||||
Support and service | 67% | 73% | ||||||
Total gross margin | 80% | 77% | ||||||
Cost of revenue, gross profit and gross margin
Cost of product revenue consists primarily of industry standard hardware we purchase and integrate with our software for turn-key integrated solutions, personnel costs, amortization of capitalized software and shipping and logistics costs. Cost of support and service consists primarily of personnel and other costs associated with providing software implementations, technical support under maintenance contracts and training.
Cost of product revenue for the year ended December 31, 2015 decreased $0.8 million, or 30%, to $1.9 million, compared with $2.8 million for the same period in 2014. Product gross margin increased to 92% for the year ended December 31, 2015, compared with 84% for the same period in 2014. The increase in product gross margin was primarily attributable to the product revenue recorded in 2015 related to our joint development agreement. Excluding the joint development agreement revenue, product gross margin increased to 86% from 84% for the years ended December 31, 2015 and 2014, respectively. The increase in product gross margin was primarily attributable to an increase in the percentage of our product revenue from sales of our stand-alone software applications, which have higher gross margins than sales of our fully integrated solutions with hardware appliances, compared with the same period in 2014. Our new flagship product offering, FreeStor, is a subscription-based product offering, is primarily sold as a software only solution, which we anticipate will drive higher product gross margins in the future. Our cost of support and service revenue for the year ended December 31, 2015 decreased $0.1 million, or 1%, to $7.7 million, compared with $7.8 million for the same period in 2014. Support and service gross margin decreased to 67% for the year ended December 31, 2015 from 73% for the same period in 2014. The decrease in support and service gross margin was primarily attributable to the decrease in our support and services revenues.
Total gross profit increased $3.2 million, or 9%, from $35.7 million for the year ended December 31, 2014, to $38.9 million for the year ended December 31, 2015. Total gross margin increased to 80% for the year ended December 31, 2015, compared with 77% for the year ended December 31, 2014. Total gross margin excluding the joint development agreement revenue was 74% and 77% for the years ended December 31, 2015 and 2014, respectively. The decrease in our total gross margin, excluding the joint development agreement revenue, was primarily due to the decrease in revenue, excluding the joint development agreement revenue and the mix of sales. Generally, our total gross profits and total gross margins fluctuate based on several factors, including (i) revenue growth levels, (ii) changes in personnel headcount and related costs, and (iii) our product offerings and mix of sales.
Share-based compensation expense included in both cost of product revenue and cost of support and service was less than 1% of total revenue for each of the years ended December 31, 2015 and 2014.
35
Operating Expenses
Research and Development Costs
Research and development costs consist primarily of personnel costs for product development personnel, share-based compensation expense, and other related costs associated with the development of new products, enhancements to existing products, quality assurance and testing. Research and development costs increased $0.3 million, or 3%, to $12.8 million for the year ended December 31, 2015, from $12.5 million in 2014. The increase in research and development costs was primarily related to costs associated with our exclusive source code license and distribution agreement we entered into during 2015 as we continue to re-invest in research and development by adding new and innovative functionalities to our product portfolio, which totaled approximately $1.5 million ($0.5 million of which was included in stock compensation expenses as discussed below). We expect to continue to incur additional costs associated with our exclusive source code license and distribution agreement over the next twelve months as part of our investment strategy. This increase was partly offset by a decrease in personnel related costs during the year ended December 31, 2015 as compared with the same period in 2014, as a result of the on-going new product development performed throughout 2014. We believe we continue to provide adequate levels of resources in support of our research and development activities to continue to enhance and to test our core products and in the development of new innovative products, features and options. Share-based compensation expense included in research and development costs increased to $0.8 million from $0.3 million for the years ended December 31, 2015 and December 31, 2014, respectively. Included in share-based compensation expense was $0.5 million related to costs associated with our exclusive source code license and distribution agreement which were paid through the issuance of our common stock.
Selling and Marketing
Selling and marketing expenses consist primarily of sales and marketing personnel and related costs, share-based compensation expense, travel, public relations expense, marketing literature and promotions, commissions, trade show expenses, and the costs associated with our foreign sales offices. Selling and marketing expenses decreased $6.4 million, or 26%, to $18.0 million for the year ended December 31, 2015, from $24.4 million for the year ended December 31, 2014. The decrease in selling and marketing expenses was primarily attributable to a decrease in personnel related costs, including commission expense as a result of decreased bookings for the year ended December 31, 2015 compared with the same period in 2014, as well as a decrease in our sales and marketing headcount as we continue to define our optimized go-to-market coverage models around the world. In addition, the decrease is attributable to a decrease in professional fees of $1.7 million primarily related to an investment made in 2014 to penetrate certain market verticals under a one-year arrangement, which ended at March 31, 2015. Share-based compensation expense included in selling and marketing expenses was $0.3 million for both the year ended December 31, 2015 and December 31, 2014.
General and Administrative
General and administrative expenses consist primarily of personnel costs of general and administrative functions, share-based compensation expense, public company related costs, directors and officers insurance, legal and professional fees and other general corporate overhead costs. General and administrative expenses increased $0.1 million, or 1%, to $9.2 million for the year ended December 31, 2015, from $9.1 million for the year ended December 31, 2014. The increase in general and administrative expenses was primarily related to $0.5 million of termination costs incurred by the Company during 2015 due to the termination of a contract with an internet communication provider compared with costs of $0.4 million with this provider during 2014 as well as an increase in one-time personnel costs associated with the departure of certain employees in 2015. These increases were partly offset by a decrease in various general and administrative costs as a result of our expense realignment over the past twenty-four months. Share-based compensation expense included in general and administrative expenses was $0.7 million and $0.8 million for the years ended December 31, 2015 and 2014, respectively.
Investigation, Litigation and Settlement Related Costs
During the year ended December 31, 2015, our investigation, litigation, and settlement related costs totaled less than $0.1 million, which was comprised of legal expenses, net of expenses expected to be recoverable through insurance, related to the derivative lawsuit against the Company, and, its Directors and certain former Officers which was dismissed last year for all parties other than one former officer (the “Derivative Action”). During the year ended December 31, 2014, our investigation, litigation, and settlement related costs totaled a benefit of $5.4 million primarily related to a gain of $5.3 million recorded for the settlement of the Estate litigation and insurance recoveries, partly offset by legal expenses related to the Derivative Action and a class action lawsuit, and legal fees associated with other settlement related activities. Refer to Part I, Item 3 – Legal Proceedings of this annual report on Form 10-K, for a more detailed description of the litigations.
36
Restructuring costs
From time to time, we have undertaken restructuring and expense control measures to support our business performance and to align our cost structure with our resources. In the third quarter of 2013, we adopted a restructuring plan intended to better align our cost structure with the skills and resources required to more effectively execute our long-term growth strategy and to support revenue levels we expect to achieve on a go forward basis (the "2013 Plan"). In connection with the 2013 Plan, we eliminated over 100 positions worldwide, implemented tighter expense controls, ceased non-core activities and closed or downsized several facilities. Restructuring costs incurred during the years ended December 31, 2015 and 2014, under the 2013 Plan, were $0.2 million and $1.1 million, respectively. For further information, refer to Note (15) Restructuring Costs, to our consolidated financial statements.
Interest and Other (Loss) Income
We invest our cash primarily in money market funds, commercial paper, government securities, and corporate bonds. As of December 31, 2015, our cash, cash equivalents, and marketable securities totaled $13.4 million, compared with $21.8 million as of December 31, 2014. Interest and other (loss) income decreased $0.4 million to a loss of $0.3 million for the year ended December 31, 2015, compared with a loss of $0.6 million for 2014. Interest and other (loss) income was comprised of foreign currency losses of $0.4 million, partly offset by interest income, gains on our embedded derivatives and sublease income totaling $0.1 million for the year ended December 31, 2015, compared with foreign currency losses of $0.7 million, partly offset by interest income and gains on our embedded derivatives totaling $0.1 million for the year ended December 31, 2014.
Income Taxes
Our provision for income taxes consists of federal, state and local, and foreign taxes. For the year ended December 31, 2015, we recorded an income tax provision of $0.6 million, consisting primarily of state and local and foreign taxes offset by a tax benefit of $0.2 million related to certain AMT tax credits that became realizable on a more-likely-than-not basis as a result of recent federal tax legislation enacted in December 2015. During 2014, the Company recorded a tax provision of $0.5 million, related to state and local and foreign taxes. As of December 31, 2015, the Company considered the impact of new legislation regarding potential refunds of its AMT tax credits and determined that there is sufficient positive evidence to conclude that it is more-likely-than-not that AMT credits of $0.2 million are realizable which resulted in a reduction to the valuation allowance and a benefit to income tax expense. With respect to the Company’s other net domestic deferred tax assets, the Company’s conclusion did not change, and therefore, the Company did not record any benefit for its net domestic deferred tax assets for 2015 and 2014.
RESULTS OF OPERATIONS – FOR THE YEAR ENDED DECEMBER 31, 2014 COMPARED WITH THE YEAR ENDED DECEMBER 31, 2013
Total revenue for the year ended December 31, 2014 decreased 21% to $46.3 million, compared with $58.6 million for the year ended December 31, 2013. Our cost of revenue decreased 30% to $10.6 million for the year ended December 31, 2014, compared with $15.2 million for the year ended December 31, 2013. Our operating expenses decreased 27% from $57.1 million for the year ended December 31, 2013 to $41.7 million for the year ended December 31, 2014. Included in the operating results for the years ended December 31, 2014 and 2013 were; (i) a benefit of $5.4 million and an expense of $0.4 million, respectively, of investigation, litigation and settlement related costs; (ii) $1.5 million and $1.7 million, respectively, of share-based compensation expense; and (iii) $1.1 million and $3.6 million, respectively, of restructuring costs. Net loss for the year ended December 31, 2014 was $7.2 million, compared with a net loss of $10.9 million for the year ended December 31, 2013. Included in our net loss for the year ended December 31, 2014 was an income tax provision of $0.5 million compared with an income tax benefit of $1.6 million for the year ended December 31, 2013. In addition, included in our net loss for the year ended December 31, 2013 was a gain on the sale of a cost-method investment of $2.1 million. No tax benefits were recognized during either period for our domestic losses due to the full valuation allowance over our domestic deferred tax assets. Net loss attributable to common stockholders, which includes the effects of the Series A redeemable convertible preferred stock dividends and accretion, was $8.5 million for the year ended December 31, 2014, compared to $11.3 million for the year ended December 31, 2013.
Overall, our total operating expenses decreased $15.4 million or 27%, attributable to; (i) the $5.3 million benefit recorded related to the settlement of the Estate litigation; (ii) the decrease in restructuring costs of $2.5 million; and (iii) our restructuring efforts and to tighter expense controls which commenced during the second half of 2013 to better align our current business plan on a run-rate basis. These expense controls included a decrease in salary and personnel costs and the closure or downsizing of certain foreign offices based on our redesigned go-to-market coverage model.
37
Revenue
Year ended December 31, | ||||||||
2014 | 2013 | |||||||
Revenue: | ||||||||
Product revenue | $ | 17,723,000 | $ | 27,338,557 | ||||
Support and services revenue | 28,550,515 | 31,297,947 | ||||||
Total Revenue | $ | 46,273,515 | $ | 58,636,504 | ||||
Year-over-year percentage change | ||||||||
Product revenue | (35)% | (34)% | ||||||
Support and services revenue | (9)% | (8)% | ||||||
Total percentage change | (21)% | (22)% | ||||||
Product revenue
Product revenue decreased 35% from $27.3 million for the year ended December 31, 2013 to $17.7 million for the year ended December 31, 2014. These amounts are net of benefits of $0.1 million and less than $0.1 million recognized during the years ended December 31, 2014 and 2013, respectively, resulting from the impact of our collection efforts of previously reserved accounts receivable. Product revenue represented 38% and 47% of our total revenue for the years ended December 31, 2014 and 2013, respectively. Product revenue from OEM partners increased $2.7 million, while product revenue from non-OEM partners decreased $12.4 million for the year ended December 31, 2014, compared with the same period in 2013. The decline in product revenue from our non-OEM channel was primarily due to (i) a decrease in the volume of new product licenses sales, both for expansion of our existing installed base and in the acquisition of new customers, and (ii) the timing of deals closing and elongated sales cycles associated with the more significant transactions, across all of our regions, compared with the same period in 2013. In addition, commencing in 2013, we began to offer revenue arrangements that provide our customers with more flexibility in licensing and payment structures, which resulted in product revenue from some transactions being recognized ratably over the term of the associated maintenance agreement, rather than upon transaction completion and product delivery as with our standard model. We anticipate that as we continue to focus on bookings achievements, our revenue recognized each quarter may lag behind our bookings for the near-term. The increase in OEM product revenue was primarily the result of an increase in sales volume from one of our largest OEM partners in China. In addition, upon the successful completion of all milestones associated with our agreement with Violin Memory, the Company began recognizing the total contract amount of $12.0 million, all of which has been collected, over the estimated ongoing maintenance term since VSOE of fair value could not be demonstrated for the undelivered maintenance. For the year ended December 31, 2014, we recognized approximately $0.7 million of revenue associated with the Violin agreement, of which we classified approximately $0.6 million as product revenue and $0.2 million as support and services revenue. Product revenue from our non-OEM channel represented 78% and 96% of our total product revenue for the years ended December 31, 2014 and 2013, respectively. Product revenue from our OEM partners represented 22% and 4% of our total product revenue for the years ended December 31, 2014 and 2013, respectively.
Support and services revenue
Support and services revenue decreased 9% from $31.3 million for the year ended December 31, 2013 to $28.6 million for the same period in 2014. The decrease in support and services revenue was attributable to decreases in both maintenance and technical support services revenue and professional services revenue.
Maintenance and technical support services revenue decreased from $29.2 million for the year ended December 31, 2013 to $27.2 million for the same period in 2014. Our maintenance and technical support service revenue results primarily from (i) the purchase of maintenance and support contracts by our customers, and (ii) the renewal of maintenance and support contracts by our existing and new customers after their initial contracts expire. During the year ended December 31, 2014, the decline in maintenance and technical support services revenue was primarily attributable to the continued wind-down in maintenance revenue from certain legacy OEM partners of $1.3 million and, to a lesser degree, competitive pricing on products and maintenance in the current environments. In addition, for the year ended December 31, 2014, we recorded maintenance and technical support services revenue of approximately $0.2 million related to our agreement with Violin Memory.
38
Professional services revenue decreased from $2.1 million for the year ended December 31, 2013 to $1.4 million for the year ended December 31, 2014. Professional services revenue varies from period to period based upon (i) the number of solutions sold during the existing and previous periods, (ii) the number of our customers who elect to purchase professional services, (iii) the number of professional services contracts that are performed during the period, and (iv) the number of customers who elect to purchase engineering services and the timing of acceptance from the customer.
Cost of Revenue
Year ended December 31, | ||||||||
2014 | 2013 | |||||||
Cost of revenue: | ||||||||
Product | $ | 2,791,950 | $ | 4,155,413 | ||||
Support and service | 7,838,766 | 11,000,401 | ||||||
Total cost of revenue | $ | 10,630,716 | $ | 15,155,814 | ||||
Total Gross Profit | $ | 35,642,799 | $ | 43,480,690 | ||||
Gross Margin: | ||||||||
Product | 84% | 85% | ||||||
Support and service | 73% | 65% | ||||||
Total gross margin | 77% | 74% | ||||||
Cost of revenue, gross profit and gross margin
Cost of product revenue for the year ended December 31, 2014 decreased $1.4 million, or 33%, to $2.8 million, compared with $4.2 million for the same period in 2013. Product gross margin decreased slightly to 84% for the year ended December 31, 2014, compared with 85% for the same period in 2013. The decrease in product gross margin was primarily attributable to a decrease in the percentage of our product revenue from sales of our stand-alone software applications, which have higher gross margins than sales of our fully integrated solutions with hardware appliances, compared with the same period in 2013. Our cost of support and service revenue for the year ended December 31, 2014 decreased $3.2 million, or 29%, to $7.8 million, compared with $11.0 million for the same period in 2013. Support and service gross margin increased to 73% for the year ended December 31, 2014 from 65% for the same period in 2013. The increase in support and service gross margin was primarily attributable to the streamlining of our support functions globally as part of the rebalancing efforts that commenced in the second half of 2013 which resulted in a decrease in personnel and facility costs.
Total gross profit decreased $7.8 million, or 18%, from $43.5 million for the year ended December 31, 2013, to $35.7 million for the year ended December 31, 2014. Total gross margin increased to 77% for the year ended December 31, 2014, compared with 74% for the year ended December 31, 2013. While our total gross profit decreased for the year ended December 31, 2014, compared with 2013, we improved our gross margin because we reduced our expense structure. Generally, our total gross profits and total gross margins fluctuate based on several factors, including (i) revenue growth levels, (ii) changes in personnel headcount and related costs, and (iii) our product offerings and mix of sales.
Share-based compensation expense included in both cost of product revenue and cost of support and service was less than 1% of total revenue for each of the years ended December 31, 2014 and 2013.
Operating Expenses
Research and Development Costs
Research and development costs decreased $3.2 million, or 20%, to $12.5 million for the year ended December 31, 2014, from $15.6 million in 2013. The decrease in research and development costs was primarily the result of a decline in personnel related costs due to the reduction in headcount as we discontinued the development efforts on our small-to-medium business product line and re-focused our engineering efforts on our core enterprise class solutions as part of the rebalancing efforts that commenced in the second half of 2013. This decrease was partly offset by a decrease of $0.8 million in capitalized research and development costs for the year ended December 31, 2014 compared with the year ended December 31, 2013. We believe we continue to provide adequate levels of resources in support of our research and development activities to continue to enhance and to test our core products and in the development of new innovative products, features and options. Share-based compensation expense included in research and development costs decreased to $0.3 million from $0.4 million for the years ended December 31, 2014 and December 31, 2013, respectively.
39
Selling and Marketing
Selling and marketing expenses decreased $0.8 million, or 3%, to $24.4 million for the year ended December 31, 2014, from $25.2 million for the year ended December 31, 2013. The decrease in selling and marketing expenses was primarily attributable to a decrease in personnel costs as a result of lower sales and marketing headcount as we closed or downsized several of our foreign office locations during the second half of 2013. In those geographic regions where we closed our physical locations, we now service our customers through our partners or other regional locations in order to be more cost effective. These decreases were partly offset by an increase in marketing and advertising costs associated with our new brand awareness campaigns and investments in new verticals. Share-based compensation expense included in selling and marketing expenses decreased to $0.3 million for the year ended December 31, 2014 from $0.4 million for the year ended December 31, 2013.
General and Administrative
General and administrative expenses decreased $3.2 million, or 26%, to $9.1 million for the year ended December 31, 2014, from $12.3 million for the year ended December 31, 2013. The decrease in general and administrative expenses was primarily due to a decrease in personnel related costs as a result of streamlining our consolidation and reporting process through the implementation of a global ERP system, a decrease in overall general and administrative expenses as a result of the rebalancing efforts that commenced in the second half of 2013 and the continued reduction of non-essential general and administrative expenses. Share-based compensation expense included in general and administrative expenses was $0.8 million for both the years ended December 31, 2014 and 2013.
Investigation, Litigation and Settlement Related Costs
During the year ended December 31, 2014, our investigation, litigation, and settlement related costs totaled a benefit of $5.4 million primarily related to a gain of $5.3 million recorded for the settlement of the Estate litigation and insurance recoveries, partly offset by legal expenses related to the class action lawsuit and the Derivative Action, and legal fees associated with other settlement related activities. During 2013, our total investigation, litigation, and settlement related costs totaled $0.4 million, which was comprised of $0.9 million of legal expenses related to the class action lawsuit and the Derivative Action, and legal fees associated with other settlement related activities, partially offset by $0.5 million of expenses that are expected to be recoverable through insurance.
Restructuring costs
From time to time, we have undertaken restructuring and expense control measures to support our business performance and to align our cost structure with our resources. In the third quarter of 2013, we adopted a restructuring plan intended to better align our cost structure with the skills and resources required to more effectively execute our long-term growth strategy and to support revenue levels we expect to achieve on a go forward basis. In connection with the 2013 Plan, we eliminated over 100 positions worldwide, implemented tighter expense controls, ceased non-core activities and closed or downsized several facilities. Restructuring costs incurred during the years ended December 31, 2014 and 2013, under the 2013 Plan, were $1.1 million and $3.6 million, respectively.
Interest and Other (Loss) Income
We invest our cash primarily in money market funds, commercial paper, government securities, and corporate bonds. As of December 31, 2014, our cash, cash equivalents, and marketable securities totaled $21.8 million, compared with $28.1 million as of December 31, 2013. Interest and other (loss) income decreased $1.7 million to a loss of $0.6 million for the year ended December 31, 2014, compared with income of $1.1 million for the year ended December 31, 2013. Interest and other (loss) income was comprised of foreign currency losses of $0.7 million, partly offset by interest income and gains on our embedded derivatives totaling $0.1 million for the year ended December 31, 2014, compared with a gain on the sale of a cost-method investment of $2.1 million, partly offset by foreign currency losses of $1.1 million for the year ended December 31, 2013.
40
Income Taxes
Our provision for income taxes consists of federal, state and local, and foreign taxes. For the year ended December 31, 2014, we recorded an income tax provision of $0.5 million on our pre-tax loss of $6.7 million, consisting primarily of state, local and foreign taxes. For the year ended December 31, 2013, we recorded an income tax benefit of $1.6 million on our pre-tax loss of $12.5 million, consisting primarily of a $2.3 million reversal of unrecognized tax benefits due to the expiration of applicable statutes of limitations partly offset by withholding taxes recorded on the gain of our investment in Blue Whale and state, local and foreign taxes. Our domestic deferred tax assets are not realizable on a more-likely-than-not basis and, therefore, we recorded a full valuation allowance against our domestic deferred tax assets. During the years ended December 31, 2014 and 2013, our conclusion did not change with respect to our domestic deferred tax assets and therefore, we have not recorded any benefit for our net domestic deferred tax assets for the full years of 2014 and 2013.
LIQUIDITY AND CAPITAL RESOURCES
Cash flow information is as follows:
Years Ended December 31, | ||||||||||||
2015 | 2014 | 2013 | ||||||||||
Cash (used in) provided by: | ||||||||||||
Operating activities | $ | (6,323,483 | ) | $ | 491,246 | $ | (11,134,925 | ) | ||||
Investing activities | 2,423,907 | (3,175,773 | ) | 2,572,090 | ||||||||
Financing activities | (456,306 | ) | (5,437,808 | ) | 9,429,177 | |||||||
Effect of exchange rate changes | (504,627 | ) | (292,114 | ) | (229,470 | ) | ||||||
Net (decrease) increase in cash and cash equivalents | $ | (4,860,509 | ) | $ | (8,414,449 | ) | $ | 636,872 | ||||
Our principal sources of liquidity are our cash, cash equivalents, and marketable securities balances generated from operating, investing and financing activities. Our cash, cash equivalents and marketable securities balance as of December 31, 2015 totaled $13.4 million, compared with $21.8 million as of December 31, 2014. Cash and cash equivalents totaled $6.0 million and marketable securities totaled $7.4 million at December 31, 2015. Cash and cash equivalents totaled $10.9 million and marketable securities totaled $10.9 million at December 31, 2014.
Our current assets exceeded our current liabilities, excluding deferred revenue, by $14.2 million as of December 31, 2015. While we currently have a working capital deficiency and a stockholders' deficit (which is primarily due to our current deferred revenue balance of $16.6 million) we believe we continue to have sufficient liquidity to meet our operating requirements which includes marketing our new product offering FreeStor, and expanding our existing suite of software offerings. While there can be no assurance, we believe this marketing and expansion should result in the growth of our customer base and drive increased customer acquisitions, bookings and ultimately revenue streams.
Upon certain triggering events, such as bankruptcy, insolvency or a material adverse effect, failure to achieve minimum financial covenants or failure of the Company to issue shares upon conversion of the Series A redeemable convertible preferred stock in accordance with its obligations, the Series A redeemable convertible preferred stockholders may require us to redeem all or some of the Series A redeemable convertible preferred stock at a price equal to the greater of 100% of the stated value plus accrued and unpaid dividends or the product of the number of shares of common stock underlying the Series A redeemable convertible preferred stock and the closing price as of the occurrence of the triggering event. On or after August 5, 2017, each Series A redeemable convertible preferred stockholder can require us to redeem its Series A redeemable convertible preferred stock in cash at a price equal to 100% of the stated value being redeemed plus accrued and unpaid dividends. As of December 31, 2015, we were not in compliance with the financial covenant based on billings for two consecutive quarters and the financial covenant based on cash for the fourth quarter of 2015, which provided the redeemable convertible preferred stockholders the right to require us to redeem any of the Series A redeemable convertible preferred stock at the greater of 100% of the stated value plus accrued and unpaid dividends or the product of the number of shares of common stock underlying the Series A redeemable convertible preferred stock and the closing price as of December 31, 2015. On January 27, 2016, we obtained a waiver from the holders of the Series A redeemable convertible preferred stock waiving the holders' rights arising from the covenant violation as of December 31, 2015. We believe we will be in compliance with the 2016 quarterly financial covenants with respect to the Series A redeemable convertible preferred stock. However, if we are unable to maintain compliance with the 2016 covenants, we intend to work with the holders of the Series A redeemable convertible preferred stock to obtain additional waivers, as necessary. As of December 31, 2015, we did not fail any other financial or non-financial covenants related to our Series A redeemable convertible preferred stock.
41
In addition, as of December 31, 2015, our liability for dividends to preferred stockholders totaled $0.2 million which was paid through the issuance of 103,200 shares of common stock in January 2016. Holders of the Series A redeemable convertible preferred stock are entitled to receive quarterly dividends at the Prime Rate (Wall Street Journal Eastern Edition) plus 5% (up to a maximum amount of 10%), payable in cash, provided, that if we will not have at least $1.0 million in positive cash flow for any calendar quarter after giving effect to the payment of such dividends, we, at our election, can pay such dividends in whole or in part in cash, provided that cash flow from operations is not negative, and the remainder can be accrued or paid in common stock to the extent certain equity conditions are satisfied. As of December 31, 2014, due to the lack of sufficient surplus to pay dividends as required by the Delaware General Business Corporation Law, we were not permitted to pay the fourth quarter dividend in cash and accrued our fourth quarter 2014 dividend. As of March 31, 2015, we had sufficient surplus to pay dividends as required by the Delaware General Business Corporation law; however, we were not in compliance with the positive cash flow requirement to pay dividends in cash which would have required us to pay these dividends in kind through additional shares of this Series A redeemable convertible preferred stock. As a result, on April 20, 2015, we obtained a waiver from the holders to allow us to pay the fourth quarter 2014 and first quarter 2015 quarterly dividends in cash. These dividends were paid in cash in April 2015. We subsequently accrued the dividends payable for the periods ended June 30, 2015 and September 30, 2015. In December 2015, the holder of the Series A redeemable convertible preferred stock exercised its right to convert such accrued dividends into 227,345 shares of our common stock.
Net cash (used in) provided by operating activities totaled ($6.3) million, $0.5 million and ($11.1) million for the years ended December 31, 2015, 2014 and 2013, respectively. The changes in net cash (used in) provided by operating activities for each of the years ended December 31, 2015, 2014 and 2013, was primarily due to our net loss and adjustments for net changes in operating assets and liabilities, primarily changes in our accounts receivable, deferred revenue, prepaid expenses, inventory, other assets, accounts payable, accrued expenses and other long-term liabilities contributed to the decrease. During both 2014 and 2013 we received $6.0 million related to our agreement with Violin Memory. In addition, during 2013 we made cash payments of $1.7 million and $5.0 million related to the settlement of the shareholder litigation and final DPA payment, respectively, which were incurred in prior years.
Net cash provided by (used in) investing activities totaled $2.4 million, ($3.2) million and $2.6 million for the years ended December 31, 2015, 2014 and 2013, respectively. Included in investing activities for each year are the sales and purchases of our marketable securities, purchases of property and equipment, capitalized software development costs, cash used (received) for security deposits and purchases of intangible assets. In addition, we received proceeds from the sale of a cost-method investment of $3.0 million for the year ended December 31, 2013. The cash transferred from restricted cash was $0.8 million million for the year ended December 31, 2014. We continually evaluate potential software license purchases and acquisitions, and we may continue to make such investments if we find opportunities that would benefit our business. We anticipate continued capital expenditures, including capitalized software costs, as we continue to invest in our infrastructure and expand and enhance our product offerings. As of the date of this filing, we have no agreements, commitments or understandings with respect to any such license purchases or acquisitions.
Net cash (used in) provided by financing activities totaled ($0.5) million, ($5.4) million and $9.4 million for the years ended December 31, 2015, 2014 and 2013, respectively. During 2015 and 2014 we repurchased shares of our common stock at an aggregate cost of $0.1 million and $4.7 million, respectively. In addition, during 2015 and 2014 we paid cash dividends to holders of our Series A redeemable convertible preferred stock of $0.4 million and $0.8 million, respectively. The primary cash inflow from financing activities for 2013 related to the $8.7 million of proceeds from the issuance of our Series A redeemable convertible preferred stock, net of issuance costs. Additionally, cash inflows from financing activities represent proceeds received from the exercise of stock options of $0.1 million, less than $0.1 million and $0.7 million for the years ended December 31, 2015, 2014 and 2013, respectively.
We currently do not have any debt and our significant commitments are related to (i) our employment agreement with Gary Quinn, our President and Chief Executive Officer, (ii) our office leases, (iii) dividends on our Series A redeemable convertible preferred stock, (iv) the potential redemption of the Series A redeemable convertible preferred stock as discussed above, and (v) the potential issuance of up to 2.55 million shares of restricted Company common stock which vest based on certain milestone achievements and/or transactions over a twenty-four month period in accordance with an Independent Marketing Agreement with RFN Prime Marketing Inc.
42
We have an operating lease covering our corporate office facility that expires in April 2021. We also have several operating leases related to offices in both the United States and foreign countries. The expiration dates for these leases range from 2016 through 2017. The following is a schedule of future minimum lease payments for all operating leases as of December 31, 2015:
2016 | $ | 1,919,172 | |
2017 | 1,570,236 | ||
2018 | 1,361,341 | ||
2019 | 1,402,181 | ||
2020 | 1,444,247 | ||
Thereafter | 491,020 | ||
$ | 8,188,197 | ||
In addition, as of December 31, 2015, our liability for uncertain tax positions totaled $0.3 million. Due to the uncertainty relating to the timing of future payments, such amounts are not presented in the above schedule.
We believe that our current balance of cash, cash equivalents and marketable securities, and our expected cash flows from operations, will be sufficient to meet our cash requirements for at least the next twelve months. However, any projections of future cash needs and cash flows are subject to substantial uncertainty. See Part I, Item 1A - Risk Factors.
Off-Balance Sheet Arrangements
As of December 31, 2015 and 2014, we had no off-balance sheet arrangements.
Critical Accounting Policies and Estimates
Our critical accounting policies and estimates are those related to revenue recognition, accounts receivable allowances, deferred income taxes, accounting for share-based payments, goodwill and other intangible assets, software development costs, fair value measurements and litigation.
Revenue Recognition. As discussed further in Note (1) Summary of Significant Accounting Policies, to our consolidated financial statements, we recognize revenue in accordance with the authoritative guidance issued by the FASB on revenue recognition. We recognize revenue when persuasive evidence of an arrangement exists, the fee is fixed or determinable, delivery has occurred, and collection of the resulting receivable is deemed probable. Products delivered to a customer on a trial basis are not recognized as revenue until the trial period has ended and acceptance has occurred by the customer. Reseller and distributor customers typically send us a purchase order when they have an end user identified. For bundled arrangements that include either maintenance or both maintenance and professional services, we use the residual method to determine the amount of product revenue to be recognized. Under the residual method, consideration is allocated to the undelivered elements based upon VSOE of the fair value of those elements, with the residual of the arrangement fee allocated to and recognized as product revenue. If VSOE does not exist for all undelivered elements of an arrangement, we recognize total revenue from the arrangement ratably over the term of the maintenance agreement. Our long-term portion of deferred revenue consists of (i) payments received for maintenance contracts with terms in excess of one year as of the balance sheet date, and (ii) payments received for product sales bundled with multiple years of maintenance but for which VSOE did not exist for all undelivered elements of the arrangement. We provide an allowance for product returns as a reduction of revenue, based upon historical experience and known or expected trends.
When more than one element, such as hardware, software and services are contained in a single arrangement, we will first allocate revenue based upon the relative selling price into two categories: (1) non-software components, such as hardware and any hardware-related items, as required system software that functions with the hardware to deliver the essential functionality of the hardware and related post-contract customer support, and software as service subscriptions and (2) software components and applications, such as post-contract customer support and other services. We will then allocate revenue within the non-software category to each element based upon their relative selling price using a hierarchy of VSOE, third-party evidence of selling price (“TPE”) or estimated selling prices (“ESP”), if VSOE or TPE does not exist. We will allocate revenue within the software category to the undelivered elements based upon their fair value using VSOE with the residual revenue allocated to the delivered elements. If we cannot objectively determine the VSOE of the fair value of any undelivered software element, we will defer revenue for all software components until all elements are delivered and services have been performed, until fair value can objectively be determined for any remaining undelivered elements, or until software maintenance is the only undelivered element which we do not have VSOE for, in which case revenue is recognized over the maintenance term for all software elements.
43
Revenues associated with maintenance services are deferred and recognized as revenue ratably over the term of the contract. Revenues associated with software implementation and software engineering services are recognized when the services are performed. Costs of providing these services are included in cost of support and services.
We have entered into various distribution, licensing and joint promotion agreements with OEMs, whereby we have provided to the OEM a non-exclusive software license to install our software on certain hardware or to resell our software in exchange for payments based on the products distributed by these OEMs. Such payments from the OEM or distributor are recognized as revenue in the period reported by the OEM.
From time to time we will enter into funded software development arrangements. Under such arrangements, revenue recognition will not commence until final delivery and/or acceptance of the product. For arrangements where we have VSOE for the undelivered elements, the Company will follow the residual method and recognize product revenue upon final delivery and/or acceptance of the product. For arrangements where we do not have VSOE for the undelivered elements, we will recognize the entire arrangement fee ratably commencing at the time of final delivery and/or acceptance through the end of the service period in the arrangement. Certain arrangements, for which VSOE of fair value for the undelivered maintenance elements cannot be established, are accounted for as a single unit of account. The revenue recognized from single units of accounting are typically allocated and classified on the consolidated statements of operations as product revenue and support and services revenue. Since VSOE cannot be established, VSOE of similar maintenance offerings provides the basis for the support and services revenue classification, and the remaining residual consideration provides the basis for the product revenue classification. In 2013, we entered into a joint development agreement whereby final acceptance of the software delivered under the joint development agreement occurred on November 16, 2014. During 2014, we began to recognize the total committed fee as revenue ratably over a twenty-five and a half month period which began on November 16, 2014 which included a contractual twenty-four month maintenance period. During 2015, the customer elected to terminate its maintenance agreement and as such all unrecognized deferred revenue was accelerated and recognized as product revenue during 2015. During the years ended December 31, 2015 and 2014, we recorded total revenue of approximately $11.3 million and $0.7 million related to this agreement, respectively. As of December 31, 2015, there is no deferred revenue or undelivered services remaining related to this agreement.
Accounts Receivable. We review accounts receivable to determine which receivables are doubtful of collection. In making the determination of the appropriate allowance for uncollectible accounts and returns, we consider (i) historical return rates, (ii) specific past due accounts, (iii) analysis of our accounts receivable aging, (iv) customer payment terms, (v) historical collections, write-offs and returns, (vi) changes in customer demand and relationships, (vii) actual cash collections on our accounts receivables and (viii) concentrations of credit risk and customer credit worthiness. When determining the appropriate allowance for uncollectable accounts and returns each period, the actual customer collections of outstanding account receivable balances impact the required allowance for returns. We recorded a benefit of less than $0.1 million, $0.1 million and $0.3 million for the years ended December 31, 2015, 2014 and 2013, respectively. These amounts are included within our consolidated statement of operations in each respective year. Changes in the product return rates, credit worthiness of customers, general economic conditions and other factors may impact the level of future write-offs, revenue and our general and administrative expenses.
Income Taxes. As discussed further in Note (6) Income Taxes, to our consolidated financial statements, in accordance with the authoritative guidance issued by the FASB on income taxes, we regularly evaluate our ability to recover deferred tax assets, and report such deferred tax assets at the amount that is determined to be more-likely-than-not recoverable. The Company records income taxes under the asset and liability method. Deferred tax assets and liabilities are recognized for future tax consequences attributable to differences between the financial statement carrying amounts of existing assets and liabilities and their respective tax bases. Deferred tax assets and liabilities are measured using enacted tax rates expected to apply to taxable income in the years in which those temporary differences are expected to be realized or settled. The effect on deferred tax assets and liabilities of a change in tax rates is recognized in income in the period that includes the enactment date. In determining the period in which related tax benefits are realized for financial reporting purposes, excess share-based compensation deductions included in net operating losses are realized after regular net operating losses are exhausted.
We account for uncertain tax positions in accordance with the authoritative guidance issued by the FASB on income taxes, which addresses the determination of whether tax benefits claimed or expected to be claimed on a tax return, should be recorded in the financial statements. Pursuant to the authoritative guidance, we may recognize the tax benefit from an uncertain tax position only if it meets the “more likely than not” threshold that the position will be sustained on examination by the taxing authority, based on the technical merits of the position or under statute expirations. The tax benefits recognized in the financial statements from such a position should be measured based on the largest benefit that has a greater than fifty percent likelihood of being realized upon ultimate settlement. In addition, the authoritative guidance addresses de-recognition, classification, interest and penalties on income taxes, accounting in interim periods, and also requires increased disclosures.
44
Accounting for Share-Based Payments. As discussed further in Note (10) Share-Based Payment Arrangements, to our consolidated financial statements, we account for share-based awards in accordance with the authoritative guidance issued by the FASB on stock compensation.
We have used and expect to continue to use the Black-Scholes option-pricing model to compute the estimated fair value of share-based compensation expense. We have used the Monte Carlo simulation model to compute the estimated fair value of share-based compensation expense for awards with a market condition. The Black-Scholes option-pricing model includes assumptions regarding dividend yields, expected volatility, expected option term and risk-free interest rates. The Monte Carlo simulation model includes assumptions regarding expected volatility, expected option term and risk-free interest rates. The assumptions used in computing the fair value of share-based compensation expense reflect our best estimates, but involve uncertainties relating to market and other conditions, many of which are outside of our control. We estimate expected volatility based primarily on historical daily price changes of our stock and other factors. The expected option term is the number of years that we estimate that the stock options will be outstanding prior to exercise. The estimated expected term of the stock awards issued has been determined pursuant to SEC Staff Accounting Bulletin SAB No. 110. Additionally, we estimate forfeiture rates based primarily upon historical experience, adjusted when appropriate for known events or expected trends. We may adjust share-based compensation expense on a quarterly basis for changes to our estimate of expected equity award forfeitures based on our review of these events and trends and recognize the effect of adjusting the forfeiture rate for all expense amortization in the period in which we revised the forfeiture estimate. If other assumptions or estimates had been used, the share-based compensation expense that was recorded for the years ended December 31, 2015, 2014 and 2013 could have been materially different. Furthermore, if different assumptions or estimates are used in future periods, share-based compensation expense could be materially impacted in the future.
Goodwill. As discussed further in Note (1) Summary of Significant Accounting Policies, to our consolidated financial statements, we account for goodwill and other intangible assets in accordance with the authoritative guidance issued by the FASB on goodwill and other intangibles. The authoritative guidance requires an impairment-only approach to accounting for goodwill and other intangibles with an indefinite life. Absent any prior indicators of impairment, we perform an annual impairment analysis during the fourth quarter of each of our fiscal years.
As of each of December 31, 2015 and 2014, we had $4.2 million of goodwill. As of each of December 31, 2015 and 2014, we had $0.2 million (net of accumulated amortization), of other identifiable intangible assets. We do not amortize goodwill, but we assess for impairment at least annually and more often if a trigger event occurs. We assess qualitative factors for our reporting unit. If the qualitative assessment results in a conclusion that it is more likely than not that the fair value of a reporting unit exceeds the carrying value, then no further testing is performed. When the qualitative assessment is not used, or if the qualitative assessment is not conclusive and it is necessary to calculate the fair value of a reporting unit, then the impairment analysis for goodwill is performed using a two-step approach based on an evaluation of the reporting unit. The first step involves a comparison of a reporting unit’s fair value to its carrying value. In the second step, if the reporting unit’s carrying value exceeds its fair value, we compare the goodwill’s implied fair value and its carrying value. If the goodwill’s carrying value exceeds its implied fair value, we recognize an impairment loss in an amount equal to such excess.
Software Development Costs. As discussed further in Note (1) Summary of Significant Accounting Policies, to our consolidated financial statements, we account for software development costs in accordance with the authoritative guidance issued by the FASB on costs of software to be sold, leased or marketed.
As of December 31, 2015 and 2014, we had $1.1 million and $1.5 million, respectively, of software development costs, net of amortization. The authoritative guidance requires that the costs associated with the development of new software products and enhancements to existing software products be expensed as incurred until technological feasibility of the product has been established. Once technological feasibility is established, all software costs are capitalized until the product is available for general release to customers. Judgment is required in determining when technological feasibility of a product is established and assumptions are used that reflect our best estimates. If other assumptions had been used in the current period to estimate technological feasibility, the reported product development and enhancement expense could have been affected. Annual amortization of capitalized software costs is the greater of the amount computed using the ratio that current gross revenue for a product bear to the total of current and anticipated future gross revenue for that product or the straight-line method over the remaining estimated economic life of the software product, generally estimated to be five years from the date the product became available for general release to customers. Software development costs are reported at the lower of amortized cost or net realizable value. Net realizable value is computed as the estimated gross future revenue from each software solution less the amount of estimated future costs of completing and disposing of that product. Because the development of projected net future revenue related to our software solutions used in our net realizable value computation is based on estimates, a significant reduction in our future revenue could impact the recovery of our capitalized software development costs.
45
Fair Value Measurement. As discussed further in Note (3) Fair Value Measurements, to our consolidated financial statements, we determine fair value measurements of both financial and nonfinancial assets and liabilities in accordance with the authoritative guidance issued by the FASB on fair value measurements and disclosures. The FASB authoritative guidance establishes three levels of inputs that may be used to measure fair value. Each level of input has different levels of subjectivity and difficulty involved in determining fair value.
Level 1—Valuations based on quoted prices for identical assets and liabilities in active markets.
Level 2—Valuations based on observable inputs other than quoted prices included in Level 1, such as quoted prices for similar assets and liabilities in active markets, quoted prices for identical or similar assets and liabilities in markets that are not active, or other inputs that are observable or can be corroborated by observable market data.
Level 3—Valuations based on unobservable inputs reflecting our own assumptions, consistent with reasonably available assumptions made by other market participants. These valuations require significant judgment.
Other-Than-Temporary Impairment
After determining the fair value of our available-for-sale debt instruments, gains or losses on these investments are recorded to other comprehensive income, until either the investment is sold or we determine that the decline in value is other-than-temporary. Determining whether the decline in fair value is other-than-temporary requires management judgment based on the specific facts and circumstances of each investment. For investments in debt instruments, these judgments primarily consider the financial condition and liquidity of the issuer, the issuer’s credit rating, and any specific events that may cause us to believe that the debt instrument will not mature and be paid in full; and our ability and intent to hold the investment to maturity.
Litigation. As discussed further in Note (14) Litigation, to our consolidated financial statements, in accordance with the authoritative guidance issued by the FASB on contingencies, we accrue anticipated costs of settlement, damages and losses for claims to the extent specific losses are probable and estimable. We record a receivable for insurance recoveries when such amounts are probable and collectable. In such cases, there may be an exposure to loss in excess of any amounts accrued. If, at the time of evaluation, the loss contingency related to a litigation is not both probable and estimable, the matter will continue to be monitored for further developments that would make such loss contingency both probable and estimable and, we will expense these costs as incurred. If the estimate of a probable loss is a range and no amount within the range is more likely, we will accrue the minimum amount of the range.
Impact of Recently Issued Accounting Pronouncements
See Item 8 of Part II, Consolidated Financial Statements – Note (1) Summary of Significant Accounting Policies – Recently Issued Accounting Pronouncements.
Item 7A. Quantitative and Qualitative Disclosures About Market Risk
Interest Rate Risks. Our cash, cash equivalents and marketable securities aggregated $13.4 million as of December 31, 2015. Our exposure to market risk for changes in interest rates relates primarily to our investment portfolio. All of our cash equivalent and marketable securities are designated as available-for-sale and, accordingly, are presented at fair value on our consolidated balance sheets. We regularly assess these risks and have established policies and business practices to manage the market risk of our marketable securities. We generally invest our excess cash in investment grade short- to intermediate-term fixed income securities and AAA-rated money market funds. Fixed rate securities may have their fair market value adversely affected due to a rise in interest rates, and we may suffer losses in principal if forced to sell securities that have declined in market value due to changes in interest rates prior to their maturity. Due to the short-term nature of the majority of our investments, the already severely suppressed interest rates we currently earn, and the fact that over 40% of our total cash, cash equivalents and marketable securities are comprised of money market funds and cash, we do not believe we are subject to any material interest rate risks on our investment balances levels at December 31, 2015.
46
Foreign Currency Risk. We have several offices outside the United States. Accordingly, we are subject to exposure from adverse movements in foreign currency exchange rates. For the years ended December 31, 2015, 2014 and 2013, approximately 52%, 63% and 62%, respectively, of our sales were from outside North America. Not all of these transactions were made in foreign currencies. Our primary exposure is to fluctuations in exchange rates for the U.S. Dollar versus the Euro and the Japanese Yen, and to a lesser extent the Canadian Dollar and the British Pound. Changes in exchange rates in the functional currency for each geographic area’s revenues are primarily offset by the related expenses associated with such revenues. However, changes in exchange rates of a particular currency could impact the re-measurement of such balances on our balance sheets.
If foreign currency exchange rates were to change adversely by 10% from the levels at December 31, 2015, the effect on our results before taxes from foreign currency fluctuations on our balance sheet would be approximately $1.5 million. The above analysis disregards the possibility that rates for different foreign currencies can move in opposite directions and that losses from one currency may be offset by gains from another currency.
47
Item 8. Financial Statements and Supplementary Data
Index to Consolidated Financial Statements | Page | ||
Reports of Independent Registered Public Accounting Firms | 49 | ||
Consolidated Balance Sheets as of December 31, 2015 and 2014 | |||
Consolidated Statements of Operations for the years ended December 31, 2015, 2014 and 2013 | |||
Consolidated Statements of Comprehensive Loss for the years ended December 31, 2015, 2014 and 2013 | |||
Consolidated Statements of Stockholders’ (Deficit) Equity for the years ended December 31, 2015, 2014 and 2013 | |||
Consolidated Statements of Cash Flows for the years ended December 31, 2015, 2014 and 2013 | |||
Notes to Consolidated Financial Statements | |||
48
Report of Independent Registered Public Accounting Firm
Board of Directors and Stockholders
FalconStor Software, Inc.
Melville, New York
We have audited the accompanying consolidated balance sheet of FalconStor Software, Inc. and subsidiaries as of December 31, 2015 and the related consolidated statements of operations, comprehensive loss, stockholders’ deficit, and cash flows for the year then ended. These financial statements are the responsibility of the Company’s management. Our responsibility is to express an opinion on these financial statements based on our audit.
We conducted our audit in accordance with the standards of the Public Company Accounting Oversight Board (United States). Those standards require that we plan and perform the audit to obtain reasonable assurance about whether the financial statements are free of material misstatement. An audit includes examining, on a test basis, evidence supporting the amounts and disclosures in the financial statements, assessing the accounting principles used and significant estimates made by management, as well as evaluating the overall financial statement presentation. We believe that our audit provides a reasonable basis for our opinion.
In our opinion, the consolidated financial statements referred to above present fairly, in all material respects, the financial position of FalconStor Software, Inc. and subsidiaries at December 31, 2015, and the results of their operations and their cash flows for the year then ended, in conformity with accounting principles generally accepted in the United States of America.
We also have audited, in accordance with the standards of the Public Company Accounting Oversight Board (United States), FalconStor Software, Inc. and subsidiaries internal control over financial reporting as of December 31, 2015, based on criteria established in Internal Control - Integrated Framework (2013) issued by the Committee of Sponsoring Organizations of the Treadway Commission (COSO) and our report dated February 17, 2016 expressed an unqualified opinion thereon.
/s/ BDO USA, LLP
Melville, New York
February 17, 2016
49
Report of Independent Registered Public Accounting Firm
The Board of Directors and Stockholders
FalconStor Software, Inc.:
We have audited the accompanying consolidated balance sheet of FalconStor Software, Inc. and subsidiaries as of December 31, 2014, and the related consolidated statements of operations, comprehensive loss, stockholders’ (deficit) equity, and cash flows for each of the years in the two-year period ended December 31, 2014. These consolidated financial statements are the responsibility of the Company’s management. Our responsibility is to express an opinion on these consolidated financial statements based on our audits.
We conducted our audits in accordance with the standards of the Public Company Accounting Oversight Board (United States). Those standards require that we plan and perform the audit to obtain reasonable assurance about whether the financial statements are free of material misstatement. An audit includes examining, on a test basis, evidence supporting the amounts and disclosures in the financial statements. An audit also includes assessing the accounting principles used and significant estimates made by management, as well as evaluating the overall financial statement presentation. We believe that our audits provide a reasonable basis for our opinion.
In our opinion, the consolidated financial statements referred to above present fairly, in all material respects, the financial position of FalconStor Software, Inc. and subsidiaries as of December 31, 2014, and the results of their operations and their cash flows for each of the years in the two-year period ended December 31, 2014, in conformity with U.S. generally accepted accounting principles.
/s/ KPMG LLP
Melville, New York,
February 25, 2015
50
Report of Independent Registered Public Accounting Firm
Board of Directors and Stockholders
FalconStor Software, Inc.
Melville, New York
We have audited FalconStor Software, Inc.’s internal control over financial reporting as of December 31, 2015, based on criteria established in Internal Control - Integrated Framework (2013) issued by the Committee of Sponsoring Organizations of the Treadway Commission (the COSO criteria). FalconStor Software, Inc.’s management is responsible for maintaining effective internal control over financial reporting and for its assessment of the effectiveness of internal control over financial reporting, included in the accompanying Management’s Report on Internal Control Over Financial Reporting. Our responsibility is to express an opinion on the company’s internal control over financial reporting based on our audit.
We conducted our audit in accordance with the standards of the Public Company Accounting Oversight Board (United States). Those standards require that we plan and perform the audit to obtain reasonable assurance about whether effective internal control over financial reporting was maintained in all material respects. Our audit included obtaining an understanding of internal control over financial reporting, assessing the risk that a material weakness exists, and testing and evaluating the design and operating effectiveness of internal control based on the assessed risk. Our audit also included performing such other procedures as we considered necessary in the circumstances. We believe that our audit provides a reasonable basis for our opinion.
A company’s internal control over financial reporting is a process designed to provide reasonable assurance regarding the reliability of financial reporting and the preparation of financial statements for external purposes in accordance with generally accepted accounting principles. A company’s internal control over financial reporting includes those policies and procedures that (1) pertain to the maintenance of records that, in reasonable detail, accurately and fairly reflect the transactions and dispositions of the assets of the company; (2) provide reasonable assurance that transactions are recorded as necessary to permit preparation of financial statements in accordance with generally accepted accounting principles, and that receipts and expenditures of the company are being made only in accordance with authorizations of management and directors of the company; and (3) provide reasonable assurance regarding prevention or timely detection of unauthorized acquisition, use, or disposition of the company’s assets that could have a material effect on the financial statements.
Because of its inherent limitations, internal control over financial reporting may not prevent or detect misstatements. Also, projections of any evaluation of effectiveness to future periods are subject to the risk that controls may become inadequate because of changes in conditions, or that the degree of compliance with the policies or procedures may deteriorate.
In our opinion, FalconStor Software, Inc. maintained, in all material respects, effective internal control over financial reporting as of December 31, 2015, based on the COSO criteria.
We also have audited, in accordance with the standards of the Public Company Accounting Oversight Board (United States), the consolidated balance sheet of FalconStor Software, Inc. and subsidiaries as of December 31, 2015, and the related consolidated statements of operations, comprehensive loss, stockholders’ deficit, and cash flows for the year ended December 31, 2015 and our report dated February 17, 2016 expressed an unqualified opinion thereon.
/s/ BDO USA, LLP
Melville, New York
February 17, 2016
51
FALCONSTOR SOFTWARE, INC. AND SUBSIDIARIES
CONSOLIDATED BALANCE SHEETS
December 31, | ||||||||
2015 | 2014 | |||||||
Assets | ||||||||
Current assets: | ||||||||
Cash and cash equivalents | $ | 6,013,382 | $ | 10,873,891 | ||||
Marketable securities | 7,420,042 | 10,900,722 | ||||||
Accounts receivable, net of allowances of $191,285 and $119,530, respectively | 6,635,262 | 8,898,680 | ||||||
Prepaid expenses and other current assets | 1,742,668 | 1,596,916 | ||||||
Inventory | 70,534 | 352,493 | ||||||
Deferred tax assets, net | 205,816 | 316,586 | ||||||
Total current assets | 22,087,704 | 32,939,288 | ||||||
Property and equipment, net of accumulated depreciation of $17,947,675 and $16,867,911, respectively | 1,565,932 | 2,147,188 | ||||||
Deferred tax assets, net | 110,060 | 7,503 | ||||||
Software development costs, net | 1,116,816 | 1,508,517 | ||||||
Other assets | 1,139,377 | 1,373,964 | ||||||
Goodwill | 4,150,339 | 4,150,339 | ||||||
Other intangible assets, net | 256,137 | 196,037 | ||||||
Total assets | $ | 30,426,365 | $ | 42,322,836 | ||||
Liabilities and Stockholders' Deficit | ||||||||
Current liabilities: | ||||||||
Accounts payable | $ | 1,005,944 | $ | 1,266,504 | ||||
Accrued expenses | 6,783,514 | 6,939,198 | ||||||
Deferred tax liabilities, net | 89,343 | 23,307 | ||||||
Deferred revenue, net | 16,553,519 | 23,380,012 | ||||||
Total current liabilities | 24,432,320 | 31,609,021 | ||||||
Other long-term liabilities | 735,089 | 630,444 | ||||||
Deferred tax liabilities, net | 27,069 | 226,443 | ||||||
Deferred revenue, net | 9,122,289 | 13,097,215 | ||||||
Total liabilities | 34,316,767 | 45,563,123 | ||||||
Commitments and contingencies (Note 12) | ||||||||
Series A redeemable convertible preferred stock, $.001 par value, 2,000,000 shares authorized, 900,000 shares issued and outstanding, redemption value of $9,000,000 | 7,818,554 | 7,230,941 | ||||||
Stockholders' equity: | ||||||||
Common stock - $.001 par value, 100,000,000 shares authorized, 57,194,817 and 56,360,222 shares issued, respectively and 41,666,747 and 40,924,313 shares outstanding, respectively | 57,195 | 56,360 | ||||||
Additional paid-in capital | 167,953,871 | 166,933,291 | ||||||
Accumulated deficit | (120,983,891 | ) | (119,054,530 | ) | ||||
Common stock held in treasury, at cost (15,528,070 and 15,435,909 shares, respectively) | (57,032,917 | ) | (56,895,059 | ) | ||||
Accumulated other comprehensive loss, net | (1,703,214 | ) | (1,511,290 | ) | ||||
Total stockholders' deficit | (11,708,956 | ) | (10,471,228 | ) | ||||
Total liabilities and stockholders' deficit | $ | 30,426,365 | $ | 42,322,836 | ||||
See accompanying notes to consolidated financial statements.
52
FALCONSTOR SOFTWARE, INC. AND SUBSIDIARIES
CONSOLIDATED STATEMENTS OF OPERATIONS
Years Ended December 31, | ||||||||||||
2015 | 2014 | 2013 | ||||||||||
Revenue: | ||||||||||||
Product revenue | $ | 24,847,724 | $ | 17,723,000 | $ | 27,338,557 | ||||||
Support and services revenue | 23,723,267 | 28,550,515 | 31,297,947 | |||||||||
Total revenue | 48,570,991 | 46,273,515 | 58,636,504 | |||||||||
Cost of revenue: | ||||||||||||
Product | 1,942,985 | 2,791,950 | 4,155,413 | |||||||||
Support and service | 7,739,149 | 7,838,766 | 11,000,401 | |||||||||
Total cost of revenue | 9,682,134 | 10,630,716 | 15,155,814 | |||||||||
Gross profit | $ | 38,888,857 | $ | 35,642,799 | $ | 43,480,690 | ||||||
Operating expenses: | ||||||||||||
Research and development costs | 12,787,606 | 12,452,528 | 15,613,543 | |||||||||
Selling and marketing | 18,021,989 | 24,426,438 | 25,222,954 | |||||||||
General and administrative | 9,181,289 | 9,105,545 | 12,265,038 | |||||||||
Investigation, litigation, and settlement related costs (benefits) | 8,842 | (5,417,925 | ) | 373,619 | ||||||||
Restructuring costs | 172,995 | 1,135,310 | 3,606,020 | |||||||||
Total operating expenses | 40,172,721 | 41,701,896 | 57,081,174 | |||||||||
Operating loss | (1,283,864 | ) | (6,059,097 | ) | (13,600,484 | ) | ||||||
Interest and other (loss) income, net | (269,954 | ) | (642,633 | ) | 1,094,126 | |||||||
Loss before income taxes | (1,553,818 | ) | (6,701,730 | ) | (12,506,358 | ) | ||||||
Provision (benefit) for income taxes | 375,543 | 510,091 | (1,573,768 | ) | ||||||||
Net loss | $ | (1,929,361 | ) | $ | (7,211,821 | ) | $ | (10,932,590 | ) | |||
Less: Accrual of Series A redeemable convertible preferred stock dividends | 765,203 | 747,616 | 216,379 | |||||||||
Less: Accretion to redemption value of Series A redeemable convertible preferred stock | 587,613 | 493,363 | 127,504 | |||||||||
Net loss attributable to common stockholders | $ | (3,282,177 | ) | $ | (8,452,800 | ) | $ | (11,276,473 | ) | |||
Basic net loss per share attributable to common stockholders | $ | (0.08 | ) | $ | (0.18 | ) | $ | (0.24 | ) | |||
Diluted net loss per share attributable to common stockholders | $ | (0.08 | ) | $ | (0.18 | ) | $ | (0.24 | ) | |||
Weighted average basic shares outstanding | 41,093,644 | 46,265,225 | 47,979,467 | |||||||||
Weighted average diluted shares outstanding | 41,093,644 | 46,265,225 | 47,979,467 | |||||||||
See accompanying notes to consolidated financial statements.
53
FALCONSTOR SOFTWARE, INC. AND SUBSIDIARIES
CONSOLIDATED STATEMENTS OF COMPREHENSIVE LOSS
Years Ended December 31, | ||||||||||||
2015 | 2014 | 2013 | ||||||||||
Net loss | $ | (1,929,361 | ) | $ | (7,211,821 | ) | $ | (10,932,590 | ) | |||
Other comprehensive (loss) income, net of applicable taxes: | ||||||||||||
Foreign currency translation | (190,499 | ) | 157,410 | (92,767 | ) | |||||||
Net unrealized loss on marketable securities | (1,998 | ) | (4,818 | ) | (2,800 | ) | ||||||
Net minimum pension liability | 573 | 98,505 | (16,770 | ) | ||||||||
Total other comprehensive (loss) income, net of applicable taxes: | (191,924 | ) | 251,097 | (112,337 | ) | |||||||
Total comprehensive loss | $ | (2,121,285 | ) | $ | (6,960,724 | ) | $ | (11,044,927 | ) | |||
Less: Accrual of Series A redeemable convertible preferred stock dividends | 765,203 | 747,616 | 216,379 | |||||||||
Less: Accretion to redemption value of Series A redeemable convertible preferred stock | 587,613 | 493,363 | 127,504 | |||||||||
Total comprehensive loss attributable to common stockholders | $ | (3,474,101 | ) | $ | (8,201,703 | ) | $ | (11,388,810 | ) | |||
See accompanying notes to consolidated financial statements.
54
FALCONSTOR SOFTWARE, INC. AND SUBSIDIARIES
CONSOLIDATED STATEMENTS OF STOCKHOLDERS' (DEFICIT) EQUITY
Years Ended December 31, | ||||||||||||
2015 | 2014 | 2013 | ||||||||||
Common stock, beginning of year | $ | 56,360 | $ | 56,037 | $ | 55,616 | ||||||
Exercise of stock awards | 354 | 323 | 421 | |||||||||
Shares issued for Series A redeemable convertible preferred stock dividend payment | 227 | — | — | |||||||||
Share-based compensation to non-employees | 254 | — | — | |||||||||
Common stock, end of year | 57,195 | 56,360 | 56,037 | |||||||||
Additional paid-in capital, beginning of year | 166,933,291 | 166,683,726 | 162,673,833 | |||||||||
Exercise of stock awards | 58,888 | 24,361 | 697,081 | |||||||||
Beneficial conversion feature | — | — | 1,951,266 | |||||||||
Shares issued for Series A redeemable convertible preferred stock dividend payment | 385,385 | — | — | |||||||||
Accretion of Series A redeemable convertible preferred stock | (587,613 | ) | (493,363 | ) | (127,504 | ) | ||||||
Dividends on Series A redeemable convertible preferred stock | (765,203 | ) | (747,616 | ) | (216,379 | ) | ||||||
Share-based compensation to non-employees | 577,820 | 1,173 | 37,379 | |||||||||
Share-based compensation to employees | 1,351,303 | 1,465,010 | 1,668,050 | |||||||||
Additional paid-in capital, end of year | 167,953,871 | 166,933,291 | 166,683,726 | |||||||||
Accumulated deficit, beginning of year | (119,054,530 | ) | (111,842,709 | ) | (100,910,119 | ) | ||||||
Net loss | (1,929,361 | ) | (7,211,821 | ) | (10,932,590 | ) | ||||||
Accumulated deficit, end of year | (120,983,891 | ) | (119,054,530 | ) | (111,842,709 | ) | ||||||
Treasury stock, beginning of year | (56,895,059 | ) | (46,916,339 | ) | (46,916,339 | ) | ||||||
Shares received for Estate litigation settlement | — | (5,293,319 | ) | — | ||||||||
Purchase of shares | (137,858 | ) | (4,685,401 | ) | — | |||||||
Treasury stock, end of year | (57,032,917 | ) | (56,895,059 | ) | (46,916,339 | ) | ||||||
Accumulated other comprehensive loss, net beginning of year | (1,511,290 | ) | (1,762,387 | ) | (1,650,050 | ) | ||||||
Other comprehensive (loss) income, net | (191,924 | ) | 251,097 | (112,337 | ) | |||||||
Accumulated other comprehensive loss, net end of year | (1,703,214 | ) | (1,511,290 | ) | (1,762,387 | ) | ||||||
Total stockholders' (deficit) equity | $ | (11,708,956 | ) | $ | (10,471,228 | ) | $ | 6,218,328 | ||||
See accompanying notes to consolidated financial statements.
55
FALCONSTOR SOFTWARE, INC. AND SUBSIDIARIES
CONSOLIDATED STATEMENTS OF CASH FLOWS
Years Ended December 31, | ||||||||||||
2015 | 2014 | 2013 | ||||||||||
Cash flows from operating activities: | ||||||||||||
Net loss | $ | (1,929,361 | ) | $ | (7,211,821 | ) | $ | (10,932,590 | ) | |||
Adjustments to reconcile net loss to net cash (used in) provided by operating activities: | ||||||||||||
Depreciation and amortization | 1,988,924 | 2,503,762 | 2,660,826 | |||||||||
Share-based payment compensation | 1,351,303 | 1,465,010 | 1,668,050 | |||||||||
Non-cash professional services expenses | 578,074 | 1,173 | 37,379 | |||||||||
Gain on Estate litigation settlement | — | (5,293,319 | ) | — | ||||||||
Restructuring costs | 172,995 | 921,895 | 3,580,731 | |||||||||
Payment of restructuring costs | (469,248 | ) | (1,199,473 | ) | (2,274,716 | ) | ||||||
Realized gain on marketable securities | — | — | (826 | ) | ||||||||
Gain on sale of cost method investment | — | — | (2,096,364 | ) | ||||||||
Loss on disposal of fixed assets | 45,578 | — | — | |||||||||
Provision for returns and doubtful accounts | (6,745 | ) | (64,904 | ) | (294,074 | ) | ||||||
Deferred income tax provision | (126,640 | ) | 121,694 | 110,203 | ||||||||
Changes in operating assets and liabilities: | ||||||||||||
Accounts receivable | 2,232,538 | 2,394,162 | 3,327,614 | |||||||||
Prepaid expenses and other current assets | (202,147 | ) | (11,072 | ) | 1,129,742 | |||||||
Inventory | 281,959 | 566,897 | (276,571 | ) | ||||||||
Other assets | 15,978 | 168,042 | (95,052 | ) | ||||||||
Accounts payable | (231,598 | ) | 280,170 | (1,809,000 | ) | |||||||
Accrued expenses and other long-term liabilities | 674,603 | (1,142,903 | ) | (11,758,230 | ) | |||||||
Deferred revenue | (10,699,696 | ) | 6,991,933 | 5,887,953 | ||||||||
Net cash (used in) provided by operating activities | (6,323,483 | ) | 491,246 | (11,134,925 | ) | |||||||
Cash flows from investing activities: | ||||||||||||
Sales of marketable securities | 15,200,100 | 39,131,215 | 33,982,164 | |||||||||
Purchases of marketable securities | (11,863,108 | ) | (41,958,829 | ) | (31,527,129 | ) | ||||||
Proceeds from sale of cost method investment | — | — | 3,000,000 | |||||||||
Transfer from restricted cash | — | 750,000 | — | |||||||||
Purchases of property and equipment | (796,654 | ) | (758,906 | ) | (1,536,167 | ) | ||||||
Proceeds from sale of fixed assets | 3,153 | — | — | |||||||||
Capitalized software development costs | (134,100 | ) | (184,215 | ) | (973,842 | ) | ||||||
Security deposits | 229,016 | (16,723 | ) | (244,814 | ) | |||||||
Purchase of intangible assets | (214,500 | ) | (138,315 | ) | (128,122 | ) | ||||||
Net cash provided by (used in) investing activities | 2,423,907 | (3,175,773 | ) | 2,572,090 | ||||||||
Cash flows from financing activities: | ||||||||||||
Proceeds from exercise of stock options | 59,242 | 24,684 | 697,500 | |||||||||
Repurchase of common stock | (137,858 | ) | (4,685,401 | ) | — | |||||||
Dividends paid on Series A redeemable convertible preferred stock | (377,690 | ) | (777,091 | ) | — | |||||||
Proceeds from issuance of Series A redeemable convertible preferred stock, net of issuance costs | — | — | 8,731,677 | |||||||||
Net cash (used in) provided by financing activities | (456,306 | ) | (5,437,808 | ) | 9,429,177 | |||||||
Effect of exchange rate changes on cash and cash equivalents | (504,627 | ) | (292,114 | ) | (229,470 | ) | ||||||
Net (decrease) increase in cash and cash equivalents | (4,860,509 | ) | (8,414,449 | ) | 636,872 | |||||||
Cash and cash equivalents, beginning of period | 10,873,891 | 19,288,340 | 18,651,468 | |||||||||
Cash and cash equivalents, end of period | $ | 6,013,382 | $ | 10,873,891 | $ | 19,288,340 | ||||||
Supplemental Disclosures: | ||||||||||||
Cash paid for income taxes, net | $ | 195,895 | $ | 186,194 | $ | 95,593 | ||||||
Non-cash financing activities: | ||||||||||||
Undistributed Series A redeemable convertible preferred stock dividends | $ | 188,805 | $ | 186,904 | $ | 216,379 | ||||||
Shares issued for Series A redeemable convertible preferred stock dividend payment | $ | 385,612 | $ | — | $ | — | ||||||
The Company did not pay any interest for the three years ended December 31, 2015. | ||||||||||||
See accompanying notes to consolidated financial statements.
56
FALCONSTOR SOFTWARE, INC. AND SUBSIDIARIES
Notes to Consolidated Financial Statements
December 31, 2015
(1) Summary of Significant Accounting Policies
(a) | The Company and Nature of Operations |
FalconStor Software, Inc., a Delaware Corporation (the "Company"), is a leading software-defined storage company offering a converged data services software platform that is hardware agnostic. The Company develops, manufactures and sells data migration, business continuity, disaster recovery, optimized backup and de-duplication solutions and provides the related maintenance, implementation and engineering services.
The Company currently has a working capital deficiency of $2.3 million, which is inclusive of current deferred revenue of $16.6 million, and a stockholders' deficit and covenants associated with its Preferred Stock that are mutually agreed to annually. The Company believes it continues to have sufficient liquidity to meet its operating requirements which includes marketing its new product offering FreeStor, and expanding its existing suite of software offerings. The Company also believes that its covenants are achievable, however, if they are not met, the Series A redeemable convertible preferred stock could be redeemed by the holder.
(b) | Principles of Consolidation |
The consolidated financial statements include the accounts of the Company and its wholly-owned subsidiaries. All significant intercompany balances and transactions have been eliminated in consolidation.
(c) | Use of Estimates |
The preparation of financial statements in conformity with accounting principles generally accepted in the United States of America requires management to make estimates and assumptions that affect the reported amounts of assets and liabilities and disclosure of contingent assets and liabilities at the date of the financial statements and the reported amounts of revenues and expenses during the reporting period. The Company’s significant estimates include those related to revenue recognition, accounts receivable allowances, share-based payment compensation, marketable securities, valuation of embedded derivatives, software development costs, goodwill and other intangible assets and income taxes. Actual results could differ from those estimates.
The financial market volatility, both in the U.S. and in many other countries where the Company operates, has impacted and may continue to impact the Company’s business. Such conditions could have a material impact to the Company’s significant accounting estimates discussed above.
(d) | Cash Equivalents and Marketable Securities |
The Company considers all highly liquid investments with maturities of three months or less when purchased to be cash equivalents. The Company records its cash equivalents and marketable securities at fair value in accordance with the authoritative guidance issued by the Financial Accounting Standards Board (“FASB”) on fair value measurements and disclosures. As of December 31, 2015 and 2014, the Company’s cash equivalents consisted of money market funds and commercial paper. At December 31, 2015 and 2014, the fair value of the Company’s cash equivalents amounted to approximately $2.7 million and $2.0 million, respectively.
As of December 31, 2015 and 2014, the Company’s marketable securities consisted of corporate bonds and government securities with a fair value of approximately $7.4 million and $10.9 million, respectively. All of the Company’s marketable securities are classified as available-for-sale, and accordingly, unrealized gains and losses on marketable securities, net of tax, are reflected as a component of accumulated other comprehensive loss in stockholders’ deficit. Any other-than-temporary impairments are recorded within interest and other (loss) income, net in the consolidated statement of operations. See Note (4) Marketable Securities for additional information.
57
(e) | Fair Value of Financial Instruments |
Fair value is defined as the price that would be received to sell an asset or paid to transfer a liability in an orderly transaction between market participants at the measurement date. To increase the comparability of fair value measurements, a three-tier fair value hierarchy, which prioritizes the inputs used in the valuation methodologies, is as follows:
Level 1—Valuations based on quoted prices for identical assets and liabilities in active markets.
Level 2—Valuations based on observable inputs other than quoted prices included in Level 1, such as quoted prices for similar assets and liabilities in active markets, quoted prices for identical or similar assets and liabilities in markets that are not active, or other inputs that are observable or can be corroborated by observable market data.
Level 3—Valuations based on unobservable inputs reflecting our own assumptions, consistent with reasonably available assumptions made by other market participants. These valuations require significant judgment.
As of December 31, 2015 and 2014, the fair value of the Company’s financial instruments including cash and cash equivalents, accounts receivable, accounts payable and accrued expenses approximated carrying value due to the short maturity of these instruments. See Note (3) Fair Value Measurements for additional information.
(f) | Derivative Financial Instruments |
The Company does not use derivative instruments to hedge exposures to cash flow, market or foreign currency risk. Terms of convertible preferred stock are reviewed to determine whether or not they contain embedded derivative instruments that are required under FASB ASC 815 “Derivatives and Hedging” (“ASC 815”) to be accounted for separately from the host contract, and recorded on the balance sheet at fair value. The fair value of derivatives are required to be revalued at each reporting date, with corresponding changes in fair value recorded in current period operating results. See Note (13) Derivative Financial Instruments for additional information.
(g) | Revenue Recognition |
The Company derives its revenue from sales of its products, support and services. Product revenue consists of the Company’s software integrated with industry standard hardware and sold as complete turn-key integrated solutions, as stand-alone software applications or sold on a subscription or consumption basis. Depending on the nature of the arrangement revenue related to turn-key solutions and stand-alone software applications are generally recognized upon shipment and delivery of license keys. For certain arrangements revenue is recognized based on usage or ratably over the term of the arrangement. Support and services revenue consists of both maintenance revenues and professional services revenues. Revenue is recorded net of applicable sales taxes.
In accordance with the authoritative guidance issued by the FASB on revenue recognition, the Company recognizes revenue when persuasive evidence of an arrangement exists, the fee is fixed or determinable, delivery has occurred, and collection of the resulting receivable is deemed probable. Products delivered to a customer on a trial basis are not recognized as revenue until the trial period has ended and acceptance has occurred by the customer. Reseller and distributor customers typically send the Company a purchase order when they have an end user identified. For bundled arrangements that include either maintenance or both maintenance and professional services, the Company uses the residual method to determine the amount of product revenue to be recognized. Under the residual method, consideration is allocated to the undelivered elements based upon vendor-specific objective evidence (“VSOE”) of the fair value of those elements, with the residual of the arrangement fee allocated to and recognized as product revenue. If VSOE does not exist for all undelivered elements of an arrangement, the Company recognizes total revenue from the arrangement ratably over the term of the maintenance agreement. The Company's long-term portion of deferred revenue consists of (i) payments received for maintenance contracts with terms in excess of one year as of the balance sheet date, and (ii) payments received for product sales bundled with multiple years of maintenance but for which VSOE did not exist for all undelivered elements of the arrangement. The Company provides an allowance for product returns as a reduction of revenue, based upon historical experience and known or expected trends.
58
When more than one element, such as hardware, software and services are contained in a single arrangement, the Company will first allocate revenue based upon the relative selling price into two categories: (1) non-software components, such as hardware and any hardware-related items, as required system software that functions with the hardware to deliver the essential functionality of the hardware and related post-contract customer support, and software as service subscriptions and (2) software components and applications, such as post-contract customer support and other services. The Company will then allocate revenue within the non-software category to each element based upon their relative selling price using a hierarchy of VSOE, third-party evidence of selling price (“TPE”) or estimated selling prices (“ESP”), if VSOE or TPE does not exist. The Company will allocate revenue within the software category to the undelivered elements based upon their fair value using VSOE with the residual revenue allocated to the delivered elements. If the Company cannot objectively determine the VSOE of the fair value of any undelivered software element, the Company will defer revenue for all software components until all elements are delivered and services have been performed, until fair value can objectively be determined for any remaining undelivered elements, or until software maintenance is the only undelivered element which the Company does not have VSOE for, in which case revenue is recognized over the maintenance term for all software elements.
Revenues associated with maintenance services are deferred and recognized as revenue ratably over the term of the contract. Revenues associated with software implementation and software engineering services are recognized when the services are performed. Costs of providing these services are included in cost of support and services.
The Company has entered into various distribution, licensing and joint promotion agreements with OEMs, whereby the Company has provided to the OEM a non-exclusive software license to install the Company’s software on certain hardware or to resell the Company’s software in exchange for payments based on the products distributed by these OEMs. Such payments from the OEM or distributor are recognized as revenue in the period reported by the OEM.
From time to time the Company will enter into funded software development arrangements. Under such arrangements, revenue recognition will not commence until final delivery and/or acceptance of the product. For arrangements where the Company has VSOE for the undelivered elements, the Company will follow the residual method and recognize product revenue upon final delivery and/or acceptance of the product. For arrangements where the Company does not have VSOE for the undelivered elements, the Company will recognize the entire arrangement fee ratably commencing at the time of final delivery and/or acceptance through the end of the service period in the arrangement. Certain arrangements, for which VSOE of fair value for the undelivered maintenance elements cannot be established, are accounted for as a single unit of account. The revenue recognized from single units of accounting are typically allocated and classified on the consolidated statements of operations as product revenue and support and services revenue. Since VSOE cannot be established, VSOE of similar maintenance offerings provides the basis for the support and services revenue classification, and the remaining residual consideration provides the basis for the product revenue classification. In 2013, the Company entered into a joint development agreement whereby final acceptance of the software delivered under the joint development agreement occurred on November 16, 2014. During 2014, the Company began to recognize the total committed fee as revenue ratably over a twenty-five and a half month period which began on November 16, 2014 and included a contractual twenty-four month maintenance period. During 2015, the customer elected to terminate its maintenance agreement and as such all unrecognized deferred revenue was accelerated and recognized as product revenue during the year. As of December 31, 2015 and 2014, the Company recorded product revenue of approximately $11.3 million and $0.6 million, respectively, and maintenance revenue of approximately $0.2 million related to this agreement for the year ended December 31, 2014. As of December 31, 2015, there is no deferred revenue or undelivered services remaining related to this agreement.
(h) | Property and Equipment |
Property and equipment are recorded at cost. Depreciation is recognized using the straight-line method over the estimated useful lives of the assets (3 to 7 years). Leasehold improvements are amortized on a straight-line basis over the terms of the respective leases or over their estimated useful lives, whichever is shorter.
(i) | Goodwill and Other Intangible Assets |
Goodwill represents the excess of the purchase price over the estimated fair value of net tangible and identifiable intangible assets acquired in business combinations. The Company has not amortized goodwill related to its acquisitions, but instead tests the balance for impairment. The Company evaluates goodwill for impairment annually or more frequently when an event occurs or circumstances change that indicate that the carrying value may not be recoverable. The Company tests goodwill for impairment by first comparing the book value of net assets to the fair value of the reporting unit. If the fair value is determined to be less than the book value or qualitative factors indicate that it is more likely than not that goodwill is impaired, a second step is performed to compute the amount of impairment as the difference between the estimated fair value of goodwill and the carrying value.
59
The Company’s annual impairment assessment is performed during the fourth quarter of each year, and the Company has determined there to be no impairment for any of the periods presented. Based on the Company’s analysis, the fair value of its reporting unit substantially exceeds the carrying value of its goodwill balances as of December 31, 2015 and 2014. Identifiable intangible assets include (i) assets acquired through business combinations, which include customer contracts and intellectual property, and (ii) patents amortized over three years using the straight-line method.
The gross carrying amount and accumulated amortization of other intangible assets as of December 31, 2015 and 2014 are as follows:
December 31, 2015 | December 31, 2014 | |||||||
Goodwill | $ | 4,150,339 | $ | 4,150,339 | ||||
Other intangible assets: | ||||||||
Gross carrying amount | $ | 3,609,524 | $ | 3,395,024 | ||||
Accumulated amortization | (3,353,387 | ) | (3,198,987 | ) | ||||
Net carrying amount | $ | 256,137 | $ | 196,037 | ||||
For the years ended December 31, 2015, 2014 and 2013, amortization expense was $154,400, $121,874 and $122,951, respectively. As of December 31, 2015, amortization expense for existing identifiable intangible assets is expected to be $136,434, $95,083 and $24,620 for the years ended December 31, 2016, 2017 and 2018, respectively. Such assets will be fully amortized at December 31, 2018.
(j) | Software Development Costs and Purchased Software Technology |
In accordance with the authoritative guidance issued by the FASB on costs of software to be sold, leased, or marketed, costs associated with the development of new software products and enhancements to existing software products are expensed as incurred until technological feasibility of the product has been established. Based on the Company’s product development process, technological feasibility is established upon completion of a working model. Amortization of software development costs is recorded at the greater of the straight-line basis over the product’s estimated life, or the ratio of current period revenue of the related products to total current and anticipated future revenue of these products. The gross carrying amount and accumulated amortization of software development costs as of December 31, 2015 and 2014 are as follows:
December 31, 2015 | December 31, 2014 | |||||||
Software development costs: | ||||||||
Gross carrying amount | $ | 3,037,215 | $ | 2,903,115 | ||||
Accumulated amortization | (1,920,399 | ) | (1,394,598 | ) | ||||
Software development costs, net | $ | 1,116,816 | $ | 1,508,517 | ||||
During the years ended December 31, 2015, 2014 and 2013, the Company recorded $525,801, $471,773 and $339,589, respectively, of amortization expense related to capitalized software costs. As of December 31, 2015, amortization expense for software development costs is expected to be $467,257, $292,144, $247,095, $79,174 and $31,146 for the years ended December 31, 2016, 2017, 2018, 2019 and 2020, respectively. Such assets will be fully amortized at December 31, 2020.
(k) | Income Taxes |
The Company records income taxes under the asset and liability method. Deferred tax assets and liabilities are recognized for future tax consequences attributable to differences between the financial statement carrying amounts of existing assets and liabilities and their respective tax bases. Deferred tax assets and liabilities are measured using enacted tax rates expected to apply to taxable income in the years in which those temporary differences are expected to be realized or settled. The effect on deferred tax assets and liabilities of a change in tax rates is recognized in income in the period that includes the enactment date. In determining the period in which related tax benefits are realized for financial reporting purposes, excess share-based compensation deductions included in net operating losses are realized after regular net operating losses are exhausted.
60
The Company accounts for uncertain tax positions in accordance with the authoritative guidance issued by the FASB on income taxes, which addresses the determination of whether tax benefits claimed or expected to be claimed on a tax return, should be recorded in the financial statements. Pursuant to the authoritative guidance, the Company may recognize the tax benefit from an uncertain tax position only if it meets the “more likely than not” threshold that the position will be sustained on examination by the taxing authority, based on the technical merits of the position or expiration of statutes. The tax benefits recognized in the financial statements from such a position should be measured based on the largest benefit that has a greater than fifty percent likelihood of being realized upon ultimate settlement. In addition, the authoritative guidance addresses de-recognition, classification, interest and penalties on income taxes, accounting in interim periods, and also requires increased disclosures. The Company includes interest and penalties related to its uncertain tax positions as part of income tax expense within its consolidated statement of operations. See Note (6) Income Taxes for additional information.
(l) | Long-Lived Assets |
The Company reviews its long-lived assets for impairment whenever events or changes in circumstances indicate that the carrying amount of the asset may not be recoverable. If the sum of the expected future cash flows, undiscounted and without interest, is less than the carrying amount of the asset, an impairment loss is recognized as the amount by which the carrying amount of the asset exceeds its fair value.
(m) | Share-Based Payments |
The Company accounts for share-based payments in accordance with the authoritative guidance issued by the FASB on share-based compensation, which establishes the accounting for transactions in which an entity exchanges its equity instruments for goods or services. Under the provisions of the authoritative guidance, share-based compensation expense is measured at the grant date, based on the fair value of the award, and is recognized as an expense over the requisite employee service period (generally the vesting period), net of estimated forfeitures. For share-based payment awards that contain performance criteria share-based compensation expense is recorded when the achievement of the performance condition is considered probable of achievement and is recorded straight-line over the requisite service period. If such performance criteria are not met, no compensation cost is recognized and any recognized compensation cost is reversed. The Company estimates the fair value of share-based payments using the Black-Scholes option-pricing model or the Monte Carlo simulation model if a market condition exists. Share-based compensation expense for a share-based payment award with a market condition is recorded straight-line over the longer of the explicit service period or the service period derived from the Monte Carlo simulation. The estimation of share-based awards that will ultimately vest requires judgment, and to the extent actual results or updated estimates differ from the Company’s current estimates, such amounts will be recorded as a cumulative adjustment in the period estimates are revised. The Company considers many factors when estimating expected forfeitures, including types of awards, employee class and historical experience. Additionally, share-based awards to non-employees are expensed over the period in which the related services are rendered at their fair value. All share-based awards are expected to be fulfilled with new shares of common stock. See Note (10) Share-Based Payment Arrangements for additional information.
(n) | Foreign Currency |
Assets and liabilities of foreign operations are translated at rates of exchange at the end of the period, while results of operations are translated at average exchange rates in effect for the period. Gains and losses from the translation of foreign assets and liabilities from the functional currency of the Company’s subsidiaries into the U.S. dollar are classified as accumulated other comprehensive loss in stockholders’ deficit. Gains and losses from foreign currency transactions are included in the consolidated statements of operations within interest and other income (loss), net. During the years ended December 31, 2015, 2014 and 2013, foreign currency transactional losses totaled approximately $0.4 million, $0.7 million and $1.1 million, respectively.
(o) | Earnings Per Share (EPS) |
Basic EPS is computed based on the weighted average number of shares of common stock outstanding. Diluted EPS is computed based on the weighted average number of common shares outstanding increased by dilutive common stock equivalents, attributable to stock option awards, restricted stock awards and Series A redeemable convertible preferred stock outstanding.
61
The following represents the common stock equivalents that were excluded from the computation of diluted shares outstanding because their effect would have been anti-dilutive for the years ended December 31, 2015, 2014 and 2013:
Year Ended December 31, | |||||||||
2015 | 2014 | 2013 | |||||||
Stock options and restricted stock | 7,972,341 | 7,800,293 | 8,150,032 | ||||||
Series A redeemable convertible preferred stock | 8,781,516 | 8,781,516 | 8,781,516 | ||||||
Total anti-dilutive common stock equivalents | 16,753,857 | 16,581,809 | 16,931,548 | ||||||
The following represents a reconciliation of the numerators and denominators of the basic and diluted EPS computation:
Year Ended December 31, | ||||||||||||
2015 | 2014 | 2013 | ||||||||||
Numerator: | ||||||||||||
Net Loss | $ | (1,929,361 | ) | $ | (7,211,821 | ) | $ | (10,932,590 | ) | |||
Effects of Series A redeemable convertible preferred stock: | ||||||||||||
Less: Series A redeemable convertible preferred stock dividends | 765,203 | 747,616 | 216,379 | |||||||||
Less: Accretion to redemption value of Series A redeemable convertible preferred stock | 587,613 | 493,363 | 127,504 | |||||||||
Net loss attributable to common stockholders | $ | (3,282,177 | ) | $ | (8,452,800 | ) | $ | (11,276,473 | ) | |||
Denominator: | ||||||||||||
Weighted average basic shares outstanding | 41,093,644 | 46,265,225 | 47,979,467 | |||||||||
Effect of dilutive securities: | ||||||||||||
Stock options and restricted stock | — | — | — | |||||||||
Series A redeemable convertible preferred stock | — | — | — | |||||||||
Weighted average diluted shares outstanding | 41,093,644 | 46,265,225 | 47,979,467 | |||||||||
EPS: | ||||||||||||
Basic net loss per share attributable to common stockholders | $ | (0.08 | ) | $ | (0.18 | ) | $ | (0.24 | ) | |||
Diluted net loss per share attributable to common stockholders | $ | (0.08 | ) | $ | (0.18 | ) | $ | (0.24 | ) | |||
(p) | Investments |
As of December 31, 2015 and 2014, the Company did not have any cost-method investments. During 2013, the Company sold its interest in Tianjin Zhongke Blue Whale Information Technologies Co., Ltd. (“Blue Whale”), a Chinese joint venture, for $3.0 million. The Company recorded a gain of $2.1 million within "interest and other (loss) income, net" in the accompanying consolidated statements of operations.
(q) | Treasury Stock |
The Company accounts for treasury stock under the cost method and includes treasury stock as a component of stockholders’ deficit.
(r) Recently Issued Accounting Pronouncements
In November 2015, the FASB issued new guidance which requires an entity to classify deferred tax liabilities and assets, along with any related valuation allowance, as non-current in its consolidated balance sheet. The amendments in this update may be applied either prospectively to all deferred tax liabilities and assets or retrospectively to all periods presented. The new standard is effective for fiscal years, and interim periods within those fiscal years, beginning after December 15, 2016, which for the Company will be the annual period ending December 31, 2017. Early adoption, including adoption in an interim period, is permitted. The Company has not yet adopted this guidance and currently does not expect the adoption of the new guidance by the Company to have a significant impact on our financial results.
62
In November 2014, the FASB issued new guidance which requires an entity to determine whether the host contract in a hybrid financial instrument issued in the form of a share is more akin to debt or to equity by considering the economic characteristics and risks of the entire hybrid financial instrument, including the embedded derivative feature that is being evaluated for separate accounting from the host contract. The effects of initially adopting the amendments in this update should be applied on a modified retrospective basis to existing hybrid financial instruments issued in the form of a share as of the beginning of the fiscal year for which the amendments are effective. The new standard is effective for fiscal years, and interim periods within those fiscal years, beginning after December 15, 2015, which for the Company will be the annual period ending December 31, 2016. Early adoption, including adoption in an interim period, is permitted. The Company has not yet adopted this guidance and currently does not expect the adoption of the new guidance by the Company to have a significant impact on our financial results.
In August 2014, the FASB issued new guidance which requires an entity to evaluate whether there are conditions or events, in the aggregate, that raise substantial doubt about the entity's ability to continue as a going concern within one year after the date that the financial statements are issued (or within one year after the financial statements are available to be issued when applicable), and to provide related footnote disclosures in certain circumstances. The new standard is effective for the annual period ending after December 15, 2016, and for annual and interim periods thereafter, which for the Company will be the annual period ending December 31, 2016. Early adoption is permitted. The Company has not yet adopted this guidance and currently does not expect the adoption of the new guidance by the Company to have a significant impact on our financial reporting or disclosures.
In May 2014, the FASB issued new guidance which requires an entity to recognize the amount of revenue to which it expects to be entitled for the transfer of promised goods or services to customers. This new guidance will replace most existing revenue recognition guidance in Generally Accepted Accounting Principles in the United States when it becomes effective. The new standard is effective for the annual period ending after December 15, 2017, including interim reporting period within that period, which for the Company will be the annual period ending December 31, 2018. Early adoption as of January 1, 2017 is permitted. The standard permits the use of either the retrospective or cumulative effect transition method. The Company is evaluating the effect that this new guidance will have on its consolidated financial statements and related disclosures. The Company has not yet selected a transition method nor has it determined the effect of the standard on its financial reporting.
(2) Property and Equipment
Property and equipment consist of the following:
December 31, 2015 | December 31, 2014 | |||||||
Computer hardware and software | $ | 16,607,596 | $ | 16,065,087 | ||||
Furniture and equipment | 961,712 | 939,475 | ||||||
Leasehold improvements | 1,931,291 | 1,997,529 | ||||||
Automobile | 13,008 | 13,008 | ||||||
Property and Equipment, Gross | 19,513,607 | 19,015,099 | ||||||
Less accumulated depreciation | (17,947,675 | ) | (16,867,911 | ) | ||||
Property and Equipment, Net | $ | 1,565,932 | $ | 2,147,188 | ||||
During the year ended December 31, 2015, the Company wrote off approximately $214,000 of fixed assets and approximately $161,000 of related accumulated depreciation related to assets that were no longer in use. During the year ended December 31, 2014, the Company wrote off approximately $0.7 million of fully depreciated assets and related accumulated depreciation related to assets that were no longer in use. During the year ended December 31, 2014, in connection with the Company's 2013 restructuring plan, the Company wrote-off gross property and equipment of $0.6 million and the associated accumulated depreciation of $0.3 million related to assets that were no longer in use as a result of the closure of foreign facilities.
Depreciation expense was $1.3 million, $1.7 million and $2.2 million in 2015, 2014 and 2013, respectively.
63
(3) Fair Value Measurements
The Company measures its cash equivalents, marketable securities and derivative instruments at fair value. Fair value is an exit price, representing the amount that would be received on the sale of an asset or that would be paid to transfer a liability in an orderly transaction between market participants. As a basis for considering such assumptions, the Company utilizes a three-tier fair value hierarchy, which prioritizes the inputs used in the valuation methodologies in measuring fair value.
Fair Value Hierarchy
The methodology for measuring fair value specifies a hierarchy of valuation techniques based upon whether the inputs to those valuation techniques reflect assumptions other market participants would use based upon market data obtained from independent sources (observable inputs) or reflect the Company’s own assumptions of market participant valuation (unobservable inputs). As a result, observable and unobservable inputs have created the following fair value hierarchy:
• | Level 1 – Quoted prices in active markets that are unadjusted and accessible at the measurement date for identical, unrestricted assets or liabilities. The Level 1 category includes money market funds and commercial paper, which at December 31, 2015 and 2014 totaled $2.7 million and $2.0 million, respectively, which are included within “cash and cash equivalents” in the consolidated balance sheets. |
• | Level 2 – Quoted prices for identical assets and liabilities in markets that are not active, quoted prices for similar assets and liabilities in active markets or financial instruments for which significant inputs are observable, either directly or indirectly. The Level 2 category includes government securities and corporate debt securities, which at December 31, 2015 and 2014 totaled $7.4 million and $10.9 million, respectively, which are included within “marketable securities” in the consolidated balance sheets. |
• | Level 3 – Prices or valuations that require inputs that are both significant to the fair value measurement and unobservable. The Level 3 category includes derivatives, which at both December 31, 2015 and 2014 totaled $0.1 million which are included in "other long-term liabilities" in the consolidated balance sheets with the change in fair value from the period included in "interest and other (loss) income, net" in the consolidated statement of operations. The Company did not hold any cash, cash equivalents or marketable securities categorized as Level 3 as of December 31, 2015 or 2014. |
Measurement of Fair Value
The Company measures fair value as an exit price using the procedures described below for all assets and liabilities measured at fair value. When available, the Company uses unadjusted quoted market prices to measure fair value and classifies such items within Level 1. If quoted market prices are not available, fair value is based upon financial models that use, when possible, current market-based or independently-sourced market parameters such as interest rates and currency rates. Items valued using financial generated models are classified according to the lowest level input or value driver that is significant to the valuation. Thus, an item may be classified in Level 3 even though there may be inputs that are readily observable. If quoted market prices are not available, the valuation model used generally depends on the specific asset or liability being valued. The determination of fair value considers various factors including interest rate yield curves and time value underlying the financial instruments.
The fair value of the Company’s investments in corporate debt and government securities have been determined utilizing third party pricing services and reviewed by management. The pricing services use inputs to determine fair value which are derived from observable market sources including reportable trades, benchmark curves, credit spreads, broker/dealer quotes, bids, offers, and other industry and economic events. These investments are included in Level 2 of the fair value hierarchy.
The fair value of the Company’s derivatives were valued using the Black-Scholes pricing model adjusted for probability assumptions, with all significant inputs, except for the probability and volatility assumptions, derived from or corroborated by observable market data such as stock price and interest rates. The probability and volatility assumptions are both significant to the fair value measurement and unobservable. These embedded derivatives are included in Level 3 of the fair value hierarchy.
64
Items Measured at Fair Value on a Recurring Basis
The following table presents the Company’s assets and liabilities that are measured at fair value on a recurring basis at December 31, 2015:
Fair Value Measurements at Reporting Date Using | ||||||||||||||||
Total | Quoted Prices in Active Markets for Identical Assets (Level 1) | Significant other Inputs (Level 2) | Significant Unobservable Inputs (Level 3) | |||||||||||||
Cash equivalents: | ||||||||||||||||
Money market funds and commercial paper | $ | 2,725,094 | $ | 2,725,094 | $ | — | $ | — | ||||||||
Total cash equivalents | 2,725,094 | 2,725,094 | — | — | ||||||||||||
Marketable securities: | ||||||||||||||||
Corporate debt and government securities | 7,420,042 | — | 7,420,042 | — | ||||||||||||
Total marketable securities | 7,420,042 | — | 7,420,042 | — | ||||||||||||
Derivative liabilities: | ||||||||||||||||
Derivative Instruments | 82,024 | — | — | 82,024 | ||||||||||||
Total derivative liabilities | 82,024 | — | — | 82,024 | ||||||||||||
Total assets and liabilities measured at fair value | $ | 10,227,160 | $ | 2,725,094 | $ | 7,420,042 | $ | 82,024 | ||||||||
The following table presents the Company’s assets that are measured at fair value on a recurring basis at December 31, 2014:
Fair Value Measurements at Reporting Date Using | ||||||||||||||||
Total | Quoted Prices in Active Markets for Identical Assets (Level 1) | Significant other Inputs (Level 2) | Significant Unobservable Inputs (Level 3) | |||||||||||||
Cash equivalents: | ||||||||||||||||
Money market funds and commercial paper | $ | 2,049,972 | $ | 2,049,972 | $ | — | $ | — | ||||||||
Total cash equivalents | 2,049,972 | 2,049,972 | — | — | ||||||||||||
Marketable securities: | ||||||||||||||||
Corporate debt and government securities | 10,900,722 | — | 10,900,722 | — | ||||||||||||
Total marketable securities | 10,900,722 | — | 10,900,722 | — | ||||||||||||
Derivative liabilities: | ||||||||||||||||
Derivative Instruments | 137,171 | — | — | 137,171 | ||||||||||||
Total derivative liabilities | 137,171 | — | — | 137,171 | ||||||||||||
Total assets and liabilities measured at fair value | $ | 13,087,865 | $ | 2,049,972 | $ | 10,900,722 | $ | 137,171 | ||||||||
65
The following table presents the Company’s assets measured at fair value on a recurring basis using significant unobservable inputs (Level 3) as of each of the years ended December 31, 2015 and 2014:
Fair Value Measurements Using Significant Unobservable Inputs (Level 3) | ||||||||||||
December 31, 2015 | December 31, 2014 | December 31, 2013 | ||||||||||
Beginning Balance | $ | 137,171 | $ | 159,134 | $ | — | ||||||
Issuance of Derivative Instruments | — | — | 170,337 | |||||||||
Total gains recognized in earnings | (55,147 | ) | (21,963 | ) | (11,203 | ) | ||||||
Ending Balance | $ | 82,024 | $ | 137,171 | $ | 159,134 | ||||||
(4) Marketable Securities
The Company’s marketable securities consist of available-for-sale securities, which are carried at fair value, with unrealized gains and losses reported as a separate component of stockholders’ equity. Unrealized gains and losses are computed on the specific identification method. Realized gains, realized losses and declines in value judged to be other-than-temporary, are included in interest and other income (loss), net. The cost of available-for-sale securities sold is based on the specific identification method and interest earned is included in interest and other income.
The cost and fair values of the Company’s available-for-sale marketable securities as of December 31, 2015, were as follows:
Aggregate Fair Value | Cost or Amortized Cost | Net Unrealized Losses | ||||||||||
Government securities | $ | 6,560,303 | $ | 6,562,792 | $ | (2,489 | ) | |||||
Corporate debt securities | 859,739 | 860,656 | (917 | ) | ||||||||
$ | 7,420,042 | $ | 7,423,448 | $ | (3,406 | ) | ||||||
The cost and fair values of the Company’s available-for-sale marketable securities as of December 31, 2014, were as follows:
Aggregate Fair Value | Cost or Amortized Cost | Net Unrealized Losses | ||||||||||
Government securities | $ | 6,740,825 | $ | 6,741,466 | $ | (641 | ) | |||||
Corporate debt securities | 4,159,897 | 4,160,664 | (767 | ) | ||||||||
$ | 10,900,722 | $ | 10,902,130 | $ | (1,408 | ) | ||||||
The cost and fair values of available-for-sale securities by contractual maturity as of December 31, 2015, were as follows:
Fair Value | Cost | |||||||
Due within one year | $ | 7,420,042 | $ | 7,423,448 | ||||
Due after one year | — | — | ||||||
$ | 7,420,042 | $ | 7,423,448 | |||||
66
(5) Accrued Expenses
Accrued expenses are comprised of the following:
December 31, 2015 | December 31, 2014 | |||||||
Accrued compensation | $ | 2,236,494 | $ | 2,320,238 | ||||
Accrued consulting and professional fees | 1,561,425 | 594,580 | ||||||
Accrued marketing and promotion | 69,258 | 27,390 | ||||||
Other accrued expenses | 588,746 | 1,008,760 | ||||||
Accrued income taxes | 106,270 | 137,191 | ||||||
Accrued other taxes | 1,247,596 | 1,117,053 | ||||||
Accrued hardware purchases | 67,280 | 580,932 | ||||||
Accrued restructuring costs | 717,640 | 959,270 | ||||||
Accrued investigation, litigation, and settlement costs | — | 6,880 | ||||||
Accrued Series A redeemable convertible preferred stock dividends | 188,805 | 186,904 | ||||||
$ | 6,783,514 | $ | 6,939,198 | |||||
(6) Income Taxes
Information pertaining to the Company’s loss before income taxes and the applicable provision for income taxes is as follows:
December 31, | ||||||||||||
2015 | 2014 | 2013 | ||||||||||
Loss before income taxes: | ||||||||||||
Domestic loss | $ | (2,310,565 | ) | $ | (7,638,422 | ) | $ | (13,466,322 | ) | |||
Foreign income | 756,747 | 936,692 | 959,964 | |||||||||
Total loss before income taxes: | (1,553,818 | ) | (6,701,730 | ) | (12,506,358 | ) | ||||||
Provision (benefit) for income taxes: | ||||||||||||
Current: | ||||||||||||
Federal | $ | 3,939 | $ | (843 | ) | $ | (1,823,192 | ) | ||||
State and local | 16,002 | 26,145 | (209,079 | ) | ||||||||
Foreign | 482,242 | 400,407 | 348,300 | |||||||||
502,183 | 425,709 | (1,683,971 | ) | |||||||||
Deferred: | ||||||||||||
Federal | $ | (167,634 | ) | $ | 14,878 | $ | 14,875 | |||||
State and local | 7,006 | (3,027 | ) | 981 | ||||||||
Foreign | 33,988 | 72,531 | 94,347 | |||||||||
(126,640 | ) | 84,382 | 110,203 | |||||||||
Total provision (benefit) for income taxes: | $ | 375,543 | $ | 510,091 | $ | (1,573,768 | ) | |||||
During 2015, the Company recorded a tax provision of $0.6 million related to state and local and foreign taxes offset by a tax benefit of $0.2 million related to certain AMT tax credits that became realizable on a more-likely-than-not basis as a result of recent federal tax legislation enacted in December 2015. During 2014, the Company recorded a tax provision of $0.5 million related to state and local and foreign taxes. During 2013, the Company recorded a tax benefit of $1.6 million primarily related to the reversal of unrecognized tax benefits of $2.3 million due to the expiration of applicable statutes of limitations partly offset by state and local and foreign taxes, withholding taxes on the gain on the sale of our cost-method investment and interest related to federal uncertain tax positions.
67
Deferred income taxes reflect the net tax effects of temporary differences between the carrying amounts of assets and liabilities for financial reporting purposes and for income tax purposes. Significant components of the Company’s deferred tax assets and liabilities are as follows:
December 31, | ||||||||
2015 | 2014 | |||||||
Deferred Tax Assets: | ||||||||
Allowance for receivables | $ | 72,539 | $ | 42,861 | ||||
Deferred revenue | 2,939,462 | 4,198,465 | ||||||
Share-based compensation | 3,095,723 | 3,099,636 | ||||||
Accrued expenses and other liabilities | 307,565 | 362,721 | ||||||
Domestic net operating loss carryforwards | 26,023,318 | 23,386,049 | ||||||
Foreign net operating loss carryforwards | 99,544 | 7,503 | ||||||
Tax credit carryforwards | 574,997 | 574,998 | ||||||
AMT tax credit carryforwards | 483,285 | 484,077 | ||||||
Capital loss carryforwards | 77,586 | 75,607 | ||||||
Fixed assets | 554,154 | 527,881 | ||||||
Intangibles | 1,762,519 | 2,051,230 | ||||||
Sub-total | 35,990,692 | 34,811,028 | ||||||
Valuation allowance | (35,121,608 | ) | (34,625,398 | ) | ||||
Total Deferred Tax Assets | 869,084 | 185,630 | ||||||
Deferred Tax Liabilities: | ||||||||
Deferred state income tax | (541,359 | ) | — | |||||
Foreign withholding taxes | (128,261 | ) | (111,291 | ) | ||||
Total Deferred Tax Liabilities | (669,620 | ) | (111,291 | ) | ||||
Net Deferred Tax Assets | $ | 199,464 | $ | 74,339 | ||||
As of each reporting date, the Company considers new evidence, both positive and negative, that could affect its view of the future realization of deferred tax assets. As of December 31, 2015, the Company considered the impact of new legislation regarding potential refunds of its AMT tax credits and determined that there is sufficient positive evidence to conclude that it is more-likely-than-not that AMT credits of $0.2 million are realizable which resulted in a reduction to the valuation allowance and a benefit to income tax expense. With respect to the Company’s other net domestic deferred tax assets, the Company’s conclusion did not change and, therefore, the Company did not record any benefit for its net domestic deferred tax assets for 2015 and 2014.
As of December 31, 2015, the Company had federal net operating loss carryforwards of approximately $74.0 million which are set to expire beginning in 2030 through 2035, if not utilized. As of December 31, 2015, the Company had approximately $1.1 million of various tax credit carryforwards, of which, approximately $0.6 million related to research and development tax credit carryforwards which expire at various dates beginning in 2020 through 2029, if not utilized. As of December 31, 2015, the Company had approximately $0.5 million related to AMT credit carryforwards, which may be carried forward indefinitely.
As of December 31, 2015, the Company has not provided for the United States income or additional foreign withholding taxes on approximately $4.1 million of undistributed earnings of its subsidiaries operating outside of the United States, with the exception of China. It is the Company’s practice and intention to reinvest those earnings permanently. Generally, such amounts become subject to United States taxation upon remittance of dividends and under certain other circumstances. Determination of the amount of any unrecognized deferred tax liability related to investments in these foreign subsidiaries is not practicable.
68
The effective tax rate before income taxes varies from the current statutory federal income tax rate as follows:
December 31, | ||||||||||||
2015 | 2014 | 2013 | ||||||||||
Tax at Federal statutory rate | $ | (543,836 | ) | $ | (2,345,606 | ) | $ | (4,377,225 | ) | |||
Increase (reduction) in income taxes resulting from: | ||||||||||||
State and local taxes | 3,195 | 10,182 | 8,948 | |||||||||
Non-deductible expenses | (31,199 | ) | 52,565 | 25,295 | ||||||||
Settlement costs | — | (80,406 | ) | 56,882 | ||||||||
Net effect of foreign operations | 235,850 | 129,003 | 552,855 | |||||||||
Uncertain tax positions | 26,814 | 28,485 | (2,173,905 | ) | ||||||||
Change in valuation allowance | 680,780 | 2,715,868 | 4,333,382 | |||||||||
Other | 3,939 | — | — | |||||||||
$ | 375,543 | $ | 510,091 | $ | (1,573,768 | ) | ||||||
A reconciliation of the beginning and ending amount of unrecognized tax benefits, excluding interest and penalties, is as follows:
2015 | 2014 | |||||||
Balance at January 1, | $ | 224,637 | $ | 217,237 | ||||
Increases to tax positions taken in prior years | 9,306 | 7,400 | ||||||
Decreases to tax positions taken in prior years | — | — | ||||||
Increase for tax positions taken during the current year | — | — | ||||||
Expiration of statutes of limitation | — | — | ||||||
Translation | (16,654 | ) | — | |||||
Balance at December 31, | $ | 217,289 | $ | 224,637 | ||||
At December 31, 2015, $0.3 million including interest, if recognized, would reduce the Company’s annual effective tax rate. As of December 31, 2015, the Company had approximately $0.1 million of accrued interest. The Company believes it is reasonably possible that $14,265 of its unrecognized tax benefits will reverse within the next 12 months. The Company records any interest and penalties related to unrecognized tax benefits in income tax expense.
The Company files federal, state, and foreign income tax returns in jurisdictions with varying statutes of limitations. The 2012 through 2015 tax years generally remain subject to examination by federal and most state tax authorities. In addition to the U.S., the Company’s major taxing jurisdictions include China, Taiwan, Japan, South Korea, France and Germany.
(7) Accumulated Other Comprehensive Loss
The changes in Accumulated Other Comprehensive Loss, net of applicable tax, for December 31, 2015 are as follows:
Foreign Currency Translation | Net Unrealized Losses on Marketable Securities | Net Minimum Pension Liability | Total | |||||||||||||
Accumulated other comprehensive (loss) income at December 31, 2014 | $ | (1,536,495 | ) | $ | (1,408 | ) | $ | 26,613 | $ | (1,511,290 | ) | |||||
Other comprehensive (loss) income | ||||||||||||||||
Other comprehensive loss before reclassifications | (190,499 | ) | (1,549 | ) | (5,997 | ) | (198,045 | ) | ||||||||
Amounts reclassified from accumulated other comprehensive (loss) income | — | (449 | ) | 6,570 | 6,121 | |||||||||||
Total other comprehensive (loss) income | (190,499 | ) | (1,998 | ) | 573 | (191,924 | ) | |||||||||
Accumulated other comprehensive (loss) income at December 31, 2015 | $ | (1,726,994 | ) | $ | (3,406 | ) | $ | 27,186 | $ | (1,703,214 | ) | |||||
69
The changes in Accumulated Other Comprehensive Loss, net of applicable tax, for December 31, 2014 are as follows:
Foreign Currency Translation | Net Unrealized Gains (Losses) on Marketable Securities | Net Minimum Pension Liability | Total | |||||||||||||
Accumulated other comprehensive (loss) income at December 31, 2013 | $ | (1,693,905 | ) | $ | 3,410 | $ | (71,892 | ) | $ | (1,762,387 | ) | |||||
Other comprehensive (loss) income | ||||||||||||||||
Other comprehensive income (loss) before reclassifications | 157,410 | (844 | ) | 85,744 | 242,310 | |||||||||||
Amounts reclassified from accumulated other comprehensive (loss) income | — | (3,974 | ) | 12,761 | 8,787 | |||||||||||
Total other comprehensive income (loss) | 157,410 | (4,818 | ) | 98,505 | 251,097 | |||||||||||
Accumulated other comprehensive (loss) income at December 31, 2014 | $ | (1,536,495 | ) | $ | (1,408 | ) | $ | 26,613 | $ | (1,511,290 | ) | |||||
The changes in Accumulated Other Comprehensive Loss, net of applicable tax, for December 31, 2013 are as follows:
Foreign Currency Translation | Net Unrealized Gains (Losses) on Marketable Securities | Net Minimum Pension Liability | Total | |||||||||||||
Accumulated other comprehensive (loss) income at December 31, 2012 | $ | (1,601,138 | ) | $ | 6,210 | $ | (55,122 | ) | $ | (1,650,050 | ) | |||||
Other comprehensive (loss) income | ||||||||||||||||
Other comprehensive loss before reclassifications | (92,767 | ) | (1,974 | ) | (25,320 | ) | (120,061 | ) | ||||||||
Amounts reclassified from accumulated other comprehensive (loss) income | — | (826 | ) | 8,550 | 7,724 | |||||||||||
Total other comprehensive loss | (92,767 | ) | (2,800 | ) | (16,770 | ) | (112,337 | ) | ||||||||
Accumulated other comprehensive (loss) income at December 31, 2013 | $ | (1,693,905 | ) | $ | 3,410 | $ | (71,892 | ) | $ | (1,762,387 | ) | |||||
For the year ended December 31, 2015 and 2014, the amounts reclassified to net loss related to the Company’s defined benefit plan and sale of marketable securities. These amounts are included within “Operating loss" within the consolidated statement of operations.
(8) Series A Redeemable Convertible Preferred Stock
On September 16, 2013, the Company issued to Hale Capital Partners, LP (“Hale”) 900,000 shares of the Company’s Series A redeemable convertible preferred stock, par value $0.001 per share, at a price of $10 per share, for an aggregate purchase consideration of $9.0 million, which was subsequently transferred to HCP-FVA LLC. Each share of Series A redeemable convertible preferred stock is convertible into common stock equivalents, at the option of the holder and upon certain mandatory conversion events described below, at a conversion rate of $1.02488 (as adjusted for stock splits, stock dividends, reverse stock splits, stock combinations, reclassifications and similar events). The Company received net proceeds of approximately $8.7 million from the issuance of the redeemable convertible preferred stock in 2013, net of transaction costs.
If the volume weighted average price of common stock for each trading day of any 60 consecutive trading days exceeds 250% of the conversion price and exceeds 225% of the conversion price through the conversion date, and certain equity conditions are met such that shares of common stock issued upon conversion can be immediately saleable by the redeemable convertible preferred stockholders, the Company can convert the redeemable convertible preferred stock up to an amount equal to the greater of 25% of the daily trading volume for the 20 consecutive trading days immediately preceding the conversion date or the amount of an identified bona fide block trade at a price reasonably acceptable to the applicable redeemable convertible preferred stockholder, but which price is not less than the arithmetic average of the weighted average prices of the common stock for the five trading days immediately preceding such sale.
70
The holders of the Series A redeemable convertible preferred stock have veto power over certain future financings, and certain rights to participate in any subsequent financing, whether through debt or equity (subject to certain exclusions). In addition, the Company's agreements with the holders of the Series A redeemable convertible preferred stock provide that if, at the time of certain future debt or equity financings, the proceeds of which exceed $5.0 million, the holders of the Series A redeemable convertible preferred stock still have outstanding Series A redeemable convertible preferred stock, then the Company must offer to repurchase their Series A redeemable convertible preferred stock. The holders of the Series A redeemable convertible preferred stock have the right to accept the offer or to retain their Series A redeemable convertible preferred stock. If the Company does a financing, and the holders of the Series A redeemable convertible preferred stock elect to have their Series A redeemable convertible preferred stock repurchased, then the capital raised in excess of $5.0 million will go to repurchase the holders’ Series A redeemable convertible preferred stock, instead of being able to be used for our business.
Upon consummation of a fundamental sale transaction, the Series A redeemable convertible preferred stock shall be redeemed at a per share redemption price equal to the greater of 250% of the per share purchase price of the Series A redeemable convertible preferred stock or the product of the number of shares of common stock underlying the Series A redeemable convertible preferred stock and the closing price immediately prior to such fundamental sale transaction.
Upon certain triggering events, such as bankruptcy, insolvency or a material adverse effect, failure to achieve minimum financial covenants or failure of the Company to issue shares upon conversion of the Series A redeemable convertible preferred stock in accordance with its obligations, the Series A redeemable convertible preferred stockholders may require the Company to redeem all or some of the Series A redeemable convertible preferred stock at a price equal to the greater of 100% of the stated value plus accrued and unpaid dividends or the product of the number of shares of common stock underlying the Series A redeemable convertible preferred stock and the closing price as of the occurrence of the triggering event. On or after August 5, 2017, each Series A redeemable convertible preferred stockholder can require the Company to redeem its Series A redeemable convertible preferred stock in cash at a price equal to 100% of the stated value being redeemed plus accrued and unpaid dividends. If the Company does not have the funds necessary to redeem the Series A redeemable convertible preferred stock, the dividends accruing on any outstanding Series A redeemable convertible preferred stock will increase to prime plus 10% (from prime plus 5%). For each six months that the Series A redeemable convertible preferred stock remains unredeemed, the dividend rate increases by 1%, subject to a maximum dividend rate of 19%. In addition, the Company's failure to redeem the Series A redeemable convertible preferred stock would be considered a “Breach Event” under the agreements with the holders of the Series A redeemable convertible preferred stock. If a Breach Event were to occur and the Company is in default under or has breached any provision in respect of its obligations to redeem the Series A redeemable convertible preferred stock, then, under the agreements with the holders of our Series A redeemable convertible preferred stock, the Company's Board of Directors would automatically be increased, with the holders of the Series A redeemable convertible preferred stock having the right to appoint the new directors, so that the holders of the Series A redeemable convertible preferred stock would have appointed a majority of the Board of Directors. This would give the holders of the Series A redeemable convertible preferred stock control of the Company. As of December 31, 2015, the Company was not in compliance with the financial covenant based on billings for two consecutive quarters and the financial covenant based on cash for the fourth quarter of 2015, which provided the redeemable convertible preferred stockholders the right to require the Company to redeem any of the Series A redeemable convertible preferred stock at the greater of 100% of the stated value plus accrued and unpaid dividends or the product of the number of shares of common stock underlying the Series A redeemable convertible preferred stock and the closing price as of December 31, 2015. On January 27, 2016, the Company obtained a waiver from the holders of the Series A redeemable convertible preferred stock waiving the holders' rights arising from the covenant violation as of December 31, 2015. The Company believes it will be in compliance with the 2016 quarterly financial covenants with respect to the holders of the Series A redeemable convertible preferred stock. However, if the Company is unable to maintain compliance with the 2016 covenants, the Company intends to work with the holders of the Series A redeemable convertible preferred stock to obtain additional waivers, as necessary. As of December 31, 2015, the Company did not fail any other financial or non-financial covenants related to the Company's Series A redeemable convertible preferred stock.
71
Holders of the Series A redeemable convertible preferred stock are entitled to receive quarterly dividends at the Prime Rate (Wall Street Journal Eastern Edition) plus 5% (up to a maximum amount of 10%), payable in cash, provided, that if the Company will not have at least $1.0 million in positive cash flow for any calendar quarter after giving effect to the payment of such dividends, the Company, at its election, can pay such dividends in whole or in part in cash, provided that cash flow from operations is not negative, and the remainder can be accrued or paid in common stock to the extent certain equity conditions are satisfied. As of December 31, 2014, due to the lack of sufficient surplus to pay dividends as required by the Delaware General Business Corporation Law, the Company was not permitted to pay the fourth quarter dividend in cash and accrued its fourth quarter 2014 dividend. As of March 31, 2015, the Company had sufficient surplus to pay dividends as required by the Delaware General Business Corporation law; however, the Company was not in compliance with the positive cash flow requirement to pay dividends in cash which would have required the Company to pay these dividends in kind through additional shares of this Series A redeemable convertible preferred stock. As a result, on April 20, 2015, the Company obtained a waiver from the holders to allow the Company to pay the fourth quarter 2014 and first quarter 2015 quarterly dividends in cash. These dividends were paid in cash in April 2015. The Company subsequently accrued the dividends payable for the periods ended June 30, 2015 and September 30, 2015. In December 2015, the holder of the Series A redeemable convertible preferred stock exercised its right to convert such accrued dividends into 227,345 shares of the Company's common stock. In January 2016, the Company issued 103,200 shares of the Company's common stock as payment for the fourth quarter 2015 dividend.
Each share of redeemable convertible preferred stock has a vote equal to the number of shares of common stock into which the redeemable convertible preferred stock would be convertible as of the record date of September 13, 2013. The Company’s closing stock price on the record date was $1.23 per share which results in voting power of an aggregate of 7,317,073 shares. In addition, holders of a majority of the redeemable convertible preferred stock must approve certain actions, including any amendments to the Company's charter or bylaws that adversely affects the voting powers, preferences or other rights of the redeemable convertible preferred stock; payment of dividends or distributions; any liquidation, capitalization, reorganization or any other fundamental transaction of the Company; issuance of certain equity securities senior to or in parity with the redeemable convertible preferred stock as to dividend rights, redemption rights, liquidation preference and other rights; issuances of equity below the conversion price; any liens or borrowings other than non-convertible indebtedness from standard commercial lenders which does not exceed 80% of the Company’s accounts receivable; and the redemption or purchase of any capital stock of the Company.
The Company has classified the Series A redeemable convertible preferred stock as temporary equity in the financial statements as it is subject to redemption at the option of the holder under certain circumstances. As a result of the Company’s analysis of all the embedded conversion and put features within the Series A redeemable convertible preferred stock, the contingent redemption put options in the Series A redeemable convertible preferred stock were determined to not be clearly and closely related to the debt-type host and also did not meet any other scope exceptions for derivative accounting. Therefore the contingent redemption put options are being accounted for as derivative instruments and the fair value of these derivative instruments were bifurcated from the Series A redeemable convertible preferred stock and recorded as a liability. As of December 31, 2015 and 2014 the fair value of these derivative instruments was $82,024 and $137,171, respectively. The gain on the change in fair value of these derivative instruments for 2015 and 2014 of $55,147 and $21,963, respectively, was included in “Interest and other (loss) income, net” within the consolidated statement of operations.
At the time of issuance the Company recorded transaction costs of $0.3 million, a beneficial conversion feature of $2.0 million and fair value allocated to the embedded derivatives of $0.2 million. These amounts were recorded as discounts to the Series A redeemable convertible preferred stock and are being accreted to the Series A redeemable convertible preferred stock using the effective interest method through the stated redemption date of August 5, 2017, which represents the earliest redemption date of the instrument. The Company included deductions of $0.6 million and $0.5 million as accretion adjustments to net loss attributable to common stockholders on the statement of operations and in determining loss per share for the years ended December 31, 2015 and 2014, respectively. The Company also included deductions of $0.8 million and $0.7 million as adjustments to net loss attributable to common shareholders on the statement of operations and in determining loss per share for the years ended December 31, 2015 and 2014, respectively, for dividends (including accrued dividends) on the Series A redeemable convertible preferred stock during the period.
72
(9) Stockholders’ Equity
Stock Repurchase Activity
On April 22, 2015, the Company’s Board of Directors (the "Board") approved a new stock buy-back program (the "Repurchase Program"). The Repurchase Program authorizes management to repurchase in the aggregate up to five million shares of the Company's common stock. Repurchases may be made by the Company from time to time in open-market or privately-negotiated transactions as permitted by securities laws and other legal requirements, and subject to market conditions and other factors. The Repurchase Program superseded and replaced the Company's prior stock buy-back program. The Repurchase Program does not obligate the Company to make repurchases at any specific time or situation. The Company was required to obtain approvals from the Series A redeemable convertible preferred stockholders for the Repurchase Program. The Repurchase Program does not have an expiration date and may be amended or terminated by the Board at any time without prior notice.
During the year ended December 31, 2015, the Company repurchased 92,161 shares of its common stock at an aggregate purchase price of $137,858 or $1.50 per share. As of December 31, 2015, the Company had the authorization to repurchase 4,907,839 shares of its common stock based upon its judgment and market conditions. During the year ended December 31, 2014, the Company entered into a purchase agreement to acquire 4,298,533 shares of the Company's common stock held by the Estate of ReiJane Huai (the "Estate") for $4.7 million and the shares were transferred to the Company's treasury account.
On June 12, 2014, the Company entered into an agreement to settle the action it filed against the Estate in Surrogates Court, Nassau County, State of New York. Mr. Huai was the former Chairman, President and Chief Executive Officer of the Company. Effective June 27, 2014, pursuant to the settlement agreement, the Estate transferred 3,132,141 shares of FalconStor common stock to the Company. The Company recorded these shares within treasury and recorded a gain of $5.3 million within "Investigation, litigation, and settlement related costs (benefits)" in the consolidated statement of operations based upon the closing price of the Company's stock price on June 26, 2014 of $1.69 per share.
Independent Marketing Agreement
On July 24, 2015, the Company entered into an Independent Marketing Agreement with RFN Prime Marketing Inc., to provide among other items, certain sales and marketing deliverables to the Company in exchange for up to 2.55 million shares of restricted Company common stock which will be issued based on certain milestone achievements and/or transactions over a twenty-four month period. The restricted Company common stock will be valued as they are earned, and the resulting value will be recorded as an expense in the period in which the performance milestone is met and the stock is earned. As of December 31, 2015, none of the performance milestones have been met, and therefore no restricted Company common stock has been issued.
(10) Share-Based Payment Arrangements
The following table summarizes the plans under which the Company granted equity compensation as of December 31, 2015:
Name of Plan | Shares Authorized | Shares Available for Grant | Shares Outstanding | Last Date for Grant of Shares | ||||
FalconStor Software, Inc., 2006 Incentive Stock Plan | 13,455,546 | 2,914,559 | 7,310,270 | May 17, 2016 | ||||
FalconStor Software, Inc., 2013 Outside Directors Equity Compensation Plan | 400,000 | 210,000 | 133,900 | May 9, 2016 | ||||
On July 1, 2015, the total shares available for issuance under the FalconStor Software, Inc., 2006 Incentive Stock Plan (the “2006 Plan”) totaled 3,246,122. Pursuant to the 2006 Plan, as amended, if, on July 1st of any calendar year in which the 2006 Plan is in effect, the number of shares of stock as to which options, restricted shares and restricted stock units may be granted under the 2006 Plan is less than five percent (5)% of the number of outstanding shares of stock, then the number of shares of stock available for issuance under the 2006 Plan is automatically increased so that the number equals five percent (5)% of the shares of stock outstanding. In no event shall the number of shares of stock subject to the 2006 Plan in the aggregate exceed twenty million shares, subject to adjustment as provided in the 2006 Plan. On July 1, 2015, the total number of outstanding shares of the Company’s common stock totaled 40,920,192. Pursuant to the 2006 Plan, as amended, the total shares available for issuance under the 2006 Plan were not increased as of July 1, 2015.
73
The following table summarizes the Company’s equity plans that have expired but that still have equity awards outstanding as of December 31, 2015:
Name of Plan | Shares Available for Grant | Shares Outstanding | ||
FalconStor Software, Inc., 2000 Stock Option Plan | — | 328,171 | ||
2004 Outside Directors Stock Option Plan | — | 40,000 | ||
FalconStor Software, Inc., 2007 Outside Directors Equity Compensation Plan | — | 160,000 | ||
All outstanding options granted under the Company’s equity plans have terms of ten years
A summary of the Company’s stock option activity for 2015 is as follows:
Number of Options | Weighted Average Price | Weighted Average Remaining Contractual Life (Years) | Aggregate Intrinsic Value | ||||||||||
Options Outstanding at December 31, 2014 | 5,466,936 | $ | 3.93 | 5.51 | $ | 7,350 | |||||||
Granted | 340,000 | $ | 1.81 | ||||||||||
Exercised | (43,560 | ) | $ | 1.36 | |||||||||
Forfeited | (666,185 | ) | $ | 5.00 | |||||||||
Expired | (241,250 | ) | $ | 6.50 | |||||||||
Options Outstanding at December 31, 2015 | 4,855,941 | $ | 3.53 | 4.76 | $ | 632,581 | |||||||
Options Exercisable at December 31, 2015 | 4,046,871 | $ | 3.92 | 4.13 | $ | 374,972 | |||||||
Options Expected to Vest after December 31, 2015 (1) | 566,349 | $ | 1.60 | 7.88 | $ | 180,326 | |||||||
(1) Options expected to vest after December 31, 2015 reflect an estimated forfeiture rate | |||||||||||||
Stock option exercises are fulfilled with new shares of common stock. The total cash received from stock option exercises for the years ended December 31, 2015, 2014 and 2013 was $59,242, $24,684 and $697,500, respectively. The total intrinsic value of stock options exercised during the years ended December 31, 2015, 2014 and 2013 was $9,970, $3,836 and $121,819, respectively.
The Company recognized share-based compensation expense for all awards issued under the Company’s stock equity plans in the following line items in the consolidated statement of operations:
Years ended December 31, | ||||||||||||
2015 | 2014 | 2013 | ||||||||||
Cost of revenue - Product | $ | — | $ | — | $ | 181 | ||||||
Cost of revenue - Support and Service | 98,776 | 91,197 | 136,975 | |||||||||
Research and development costs | 806,348 | 282,416 | 363,296 | |||||||||
Selling and marketing | 285,787 | 327,694 | 397,967 | |||||||||
General and administrative | 738,466 | 764,876 | 807,010 | |||||||||
$ | 1,929,377 | $ | 1,466,183 | $ | 1,705,429 | |||||||
The Company did not recognize any tax benefits related to share-based compensation expense during the years ended December 31, 2015, 2014 and 2013.
74
The Company has the ability to issue both restricted stock and restricted stock units. The fair value of the restricted stock awards and restricted stock units are expensed at either (i) the fair value per share at date of grant (directors, officers and employees), or (ii) the fair value per share as of each reporting period (non-employee consultants). A summary of the total stock-based compensation expense related to restricted stock awards and restricted stock units, which is included in the Company’s total share-based compensation expense for each respective year, is as follows:
Years ended December 31, | ||||||||||||
2015 | 2014 | 2013 | ||||||||||
Directors, officers and employees | $ | 827,055 | $ | 602,889 | $ | 257,843 | ||||||
Non-employee consultants | — | — | — | |||||||||
$ | 827,055 | $ | 602,889 | $ | 257,843 | |||||||
A summary of the Company’s restricted stock activity for 2015 is as follows:
Number of Restricted Stock Awards | |||
Non-Vested at December 31, 2014 | 2,333,357 | ||
Granted | 1,493,555 | ||
Vested | (310,155 | ) | |
Forfeited | (400,357 | ) | |
Non-Vested at December 31, 2015 | 3,116,400 | ||
On July 28, 2015 the Company granted 500,000 shares of restricted stock to the President and Chief Executive Officer of the Company. The restricted shares have terms of 10 years. The restrictions of the restricted stock lapse upon the Company's achievement of performance criteria related to the Company's Common Stock closing trading price. The fair value of the common stock price market condition was calculated using the Monte Carlo simulation model resulting in a weighted average fair value of $1.05 per share. Share-based compensation expense for the common stock price market condition is being recorded straight-line over the service period derived from the Monte Carlo simulation since the awards exercisability depends entirely on achieving a market condition. The explicit service period and the service period derived from the Monte Carlo simulation were the same for the grant.
Restricted stock and restricted stock units are fulfilled with new shares of common stock. The total intrinsic value of restricted stock for which the restrictions lapsed during the years ended December 31, 2015, 2014 and 2013 was $0.4 million, $0.5 million and $0.2 million, respectively.
Options granted to non-employee consultants have exercise prices equal to the fair market value of the stock on the date of grant and a contractual term of ten years. Restricted stock awards granted to non-employee consultants have a contractual term equal to the lapse of restriction(s) of each specific award. Vesting periods for share-based awards granted to non-employee consultants range from immediate vesting to three years depending on service requirements. A summary of the total stock-based compensation expense related to share-based awards granted to non-employee consultants, which is included in the Company’s total share-based compensation expense for each respective period, is as follows:
Years ended December 31, | ||||||||||||
2015 | 2014 | 2013 | ||||||||||
Non-qualified stock options | $ | 73,539 | $ | 1,173 | $ | 37,379 | ||||||
Restricted stock awards | — | — | — | |||||||||
$ | 73,539 | $ | 1,173 | $ | 37,379 | |||||||
On October 29, 2015, the Company issued 253,535 shares of its common stock to Cumulus Logic, LLC, as a milestone payment related to the Software License and Development Agreement between the Company and Cumulus Logic, LLC. The Company recorded stock compensation expense of $504,535 related to this transaction based on the fair value of the common stock on the date of issue of $1.99. This expense was included in "research and development costs" in the accompanying consolidated statements of operations.
75
The Company estimates the fair value of share-based payments using the Black-Scholes option-pricing model. For awards with market conditions the Company utilizes the Monte Carlo simulation model to estimate the fair value. The Company believes that these valuation techniques and the approach utilized to develop the underlying assumptions are appropriate in estimating the fair value of the Company’s share-based payments granted during the years ended December 31, 2015, 2014 and 2013. Estimates of fair value are not intended to predict actual future events or the value ultimately realized by the employees who receive equity awards.
The per share weighted average fair value of share-based payments granted during the years ended December 31, 2015, 2014 and 2013 was $1.32, $1.26 and $0.84, respectively. In addition to the exercise and grant date prices of the awards, certain weighted average assumptions that were used to estimate the fair value of share-based payment grants in the respective periods are listed in the table below:
Years ended December 31, | ||||||
2015 | 2014 | 2013 | ||||
Expected dividend yield | 0% | 0% | 0% | |||
Expected volatility | 55 - 56% | 55 - 57% | 61 - 64% | |||
Risk-free interest rate | 1.35 - 1.67% | 1.20 - 1.84% | 0.84 - 1.64% | |||
Expected term (years) | 5.5 | 3.4 - 5.5 | 5.5 | |||
Discount for post-vesting restrictions | N/A | N/A | N/A | |||
Options granted to officers, employees and directors during fiscal 2015, 2014, and 2013 have exercise prices equal to the fair market value of the stock on the date of grant, a contractual term of ten years, and a vesting period generally of three years. Based on each respective group’s historical vesting experience and expected trends, the estimated forfeiture rate for officers, employees, and directors, as adjusted, for fiscal years 2015, 2014 and 2013 was 30%, 30% and 0%, respectively. The impact of the change in the forfeiture rates from 2012 to 2013 was a reduction to share-based compensation expense of $0.1 million.
The Company estimates expected volatility based primarily on historical daily volatility of the Company’s stock and other factors, if applicable. The risk-free interest rate is based on the United States treasury yield curve in effect at the time of grant. The expected option term is the number of years that the Company estimates that options will be outstanding prior to exercise. The expected term of the awards was determined based upon an estimate of the expected term of “plain vanilla” options as prescribed in SEC Staff Accounting Bulletin (“SAB”) No. 110.
As of December 31, 2015, there was approximately $1.9 million total unrecognized compensation cost related to the Company’s unvested stock options, restricted stock and restricted stock unit awards granted under the Company’s stock plans. The unrecognized compensation cost is expected to be recognized over a weighted-average period of 1.85 years.
As of December 31, 2015, the Company had 11,096,900 shares of common stock reserved for issuance upon the exercise of stock options, restricted stock and restricted stock units.
(11) Inventories
Inventories consist of component materials and finished systems. Inventories are stated at the lower of cost (first-in, first-out) or market, not in excess of net realizable value. Component material consists of certain key replacement parts for the finished systems. Inventories are as follows:
December 31, 2015 | December 31, 2014 | |||||||
Finished systems | $ | 70,534 | $ | 352,493 | ||||
Total Inventory | $ | 70,534 | $ | 352,493 | ||||
As of December 31, 2015 and 2014, the Company had not recorded any reserve for excess and/or obsolete inventories in arriving at estimated net realizable value of its inventory.
76
(12) Commitments and Contingencies
The Company has an operating lease covering its corporate office facility that expires in April 2021. The Company also has several additional operating leases related to offices in foreign countries. The expiration dates for these leases range from 2016 through 2017. The following is a schedule of future minimum lease payments for all operating leases as of December 31, 2015:
2016 | $ | 1,919,172 | |
2017 | 1,570,236 | ||
2018 | 1,361,341 | ||
2019 | 1,402,181 | ||
2020 | 1,444,247 | ||
Thereafter | 491,020 | ||
$ | 8,188,197 | ||
These leases require the Company to pay its proportionate share of real estate taxes and other common charges. Total rent expense for operating leases was $2.4 million, $3.0 million and $3.3 million for the years ended December 31, 2015, 2014 and 2013, respectively.
The Company typically provides its customers a warranty on its software products for a period of no more than 90 days. Such warranties are accounted for in accordance with the authoritative guidance issued by the FASB on contingencies. For the year ended December 31, 2015, the Company has not incurred any costs related to warranty obligations.
Under the terms of substantially all of its software license agreements, the Company has agreed to indemnify its customers for all costs and damages arising from claims against such customers based on, among other things, allegations that the Company’s software infringes the intellectual property rights of a third party. In most cases, in the event of an infringement claim, the Company retains the right to (i) procure for the customer the right to continue using the software; (ii) replace or modify the software to eliminate the infringement while providing substantially equivalent functionality; or (iii) if neither (i) nor (ii) can be reasonably achieved, the Company may terminate the license agreement and refund to the customer a pro-rata portion of the license fee paid to the Company. Such indemnification provisions are accounted for in accordance with the authoritative guidance issued by the FASB on guarantees. From time to time, in the ordinary course of business, the Company receives claims for indemnification, typically from OEMs. The Company is not currently aware of any material claims for indemnification.
Upon certain triggering events, such as bankruptcy, insolvency or a material adverse effect, failure to achieve minimum financial covenants or failure of the Company to issue shares upon conversion of the Series A redeemable convertible preferred stock in accordance with its obligations, the Series A redeemable convertible preferred stockholders may require the Company to redeem all or some of the Series A redeemable convertible preferred stock at a price equal to the greater of 100% of the stated value plus accrued and unpaid dividends or the product of the number of shares of common stock underlying the Series A redeemable convertible preferred stock and the closing price as of the occurrence of the triggering event. On or after August 5, 2017, each Series A redeemable convertible preferred stockholder can require the Company to redeem its Series A redeemable convertible preferred stock in cash at a price equal to 100% of the stated value being redeemed plus accrued and unpaid dividends. As of December 31, 2015, the Company was not in compliance with the financial covenant based on billings for two consecutive quarters and the financial covenant based on cash for the fourth quarter of 2015, which provided the redeemable convertible preferred stockholders the right to require the Company to redeem any of the Series A redeemable convertible preferred stock at the greater of 100% of the stated value plus accrued and unpaid dividends or the product of the number of shares of common stock underlying the Series A redeemable convertible preferred stock and the closing price as of December 31, 2015. On January 27, 2016 the Company obtained a waiver from the holders of the Series A redeemable convertible preferred stock waiving the holders' rights arising from the billings covenant violation as of December 31, 2015. The Company believes it will be in compliance with the 2016 quarterly financial covenants with respect to the Series A redeemable convertible preferred stock. However, if the Company is unable to maintain compliance with the 2016 covenants, the Company intends to work with the holders of the Series A redeemable convertible preferred stock to obtain additional waivers, as necessary. As of December 31, 2015, the Company did not fail any other financial or non-financial covenants related to the Company's Series A redeemable convertible preferred stock. However, as described under Note (8) Series A Redeemable Convertible Preferred Stock, the Company obtained a waiver on April 20, 2015 to enable it to pay the required quarterly dividends on the Series A redeemable convertible preferred stock in cash for the fourth quarter of 2014 and the first quarter of 2015 and accrued its dividend payments for the required quarterly dividends on the Series A redeemable convertible preferred stock for the second, third and fourth quarters of 2015. The second and third quarter 2015 dividends were paid with Company common stock during December 2015.
77
On July 24, 2015, the Company entered into an Independent Marketing Agreement with RFN Prime Marketing Inc., to provide among other items, certain sales and marketing deliverables to the Company in exchange for up to 2.55 million shares of restricted Company common stock which will be issued based on certain milestone achievements and/or transactions over a twenty-four month period. The restricted Company common stock will be valued as they are earned, and the resulting value will be recorded as an expense in the period in which the performance milestone is met and the stock is earned. As of December 31, 2015, none of the performance milestones have been met, and therefore no restricted Company common stock has been issued.
On July 24, 2015, the Company renewed its Employment Agreement (“Quinn Employment Agreement”) with Gary Quinn. Pursuant to the Quinn Employment Agreement, the Company agreed to continue to employ Mr. Quinn as President and Chief Executive Officer of the Company effective July 24, 2015, at an annual salary of $0.5 million per annum, which will automatically renew every twelve (12) months unless either party gives notice to the other that it will not renew at least sixty (60) days prior to the end of the term. Among other items, The Quinn Employment Agreement also provided for the grant of 500,000 restricted shares which vest 50% and 50% based upon the achievement of two predetermined milestones of the Company’s Common Stock closing trading price for ninety (90) consecutive trading days. The 500,000 restricted shares were granted to Mr. Quinn by the Company’s Compensation Committee on July 28, 2015.
From time to time, the Company has undertaken restructuring and expense control measures to support its business performance and to align the Company’s cost structure with its resources. During the third quarter of 2013, the Company adopted a restructuring plan intended to better align the Company’s cost structure with the skills and resources required to more effectively execute the Company’s long-term growth strategy and to support revenue levels the Company expects to achieve on a go forward basis (the "2013 Plan"). In connection with the 2013 Plan, the Company eliminated over 100 positions worldwide, implemented tighter expense controls, ceased non-core activities and closed or downsized several facilities. As of December 31, 2015 the restructuring accrual totaled $0.7 million. The 2013 Plan was substantially completed by December 31, 2014; however, the Company expects the majority of the remaining accrued severance related costs to be paid once final settlement litigation is completed, which can be at various times over the next three to twenty-four months
In addition, as of December 31, 2015, our liability for uncertain tax positions totaled $0.3 million.
(13) Derivative Financial Instruments
The Company from time to time will use derivative financial instruments, such as foreign currency forward contracts, as economic hedges to reduce exchange rate risks arising from the change in fair value of certain foreign currency denominated assets and liabilities (i.e., receivables and payables). The purpose of the Company’s foreign currency risk management program is to reduce volatility in earnings caused by exchange rate fluctuations. In accordance with the authoritative guidance issued by the FASB on derivatives and hedging, companies are required to recognize all of the derivative financial instruments as either assets or liabilities at fair value in their balance sheets. The Company does not use derivative financial instruments for trading or speculative purposes. As of December 31, 2015, 2014 and 2013, the Company had no foreign currency forward contracts outstanding. The Company did not utilize foreign currency forward contracts during the years ended December 31, 2015, 2014 and 2013.
As a result of the Company’s analysis of all the embedded conversion and put features within its Series A redeemable convertible preferred stock, the contingent redemption put options in the Series A redeemable convertible preferred stock were determined to not be clearly and closely related to the debt-type host and also did not meet any other scope exceptions for derivative accounting. Therefore the contingent redemption put options are being accounted for as derivative instruments and the fair value of these derivative instruments were bifurcated from the Series A redeemable convertible preferred stock and recorded as a liability. At the time of issuance of the Series A redeemable convertible preferred stock the fair value of these derivative instruments were recorded as a reduction to preferred stock. As of December 31, 2015 and 2014, the fair value of these derivative instruments was $82,024 and $137,171, respectively. The gain on the change in fair value of these derivative instruments for the years ended December 31, 2015, 2014 and 2013 of $55,147, $21,963 and $11,203, respectively, was included in “Interest and other (loss) income, net” within the consolidated statement of operations.
78
(14) Litigation
In view of the inherent difficulty of predicting the outcome of litigation, particularly where the claimants seek very large or indeterminate damages, the Company generally cannot predict what the eventual outcome of the pending matters will be, what the timing of the ultimate resolution of these matters will be, or what the eventual loss, fines or penalties related to each pending matter may be.
In accordance with the authoritative guidance issued by the FASB on contingencies, the Company accrues anticipated costs of settlement, damages and losses for claims to the extent specific losses are probable and estimable. The Company records a receivable for insurance recoveries when such amounts are probable and collectable. In such cases, there may be an exposure to loss in excess of any amounts accrued. If, at the time of evaluation, the loss contingency related to a litigation is not both probable and estimable, the matter will continue to be monitored for further developments that would make such loss contingency both probable and estimable and, the Company will expense these costs as incurred. If the estimate of a probable loss is a range and no amount within the range is more likely, the Company will accrue the minimum amount of the range.
Stockholder Litigation
Company stockholders filed actions in the Suffolk County Division of the Supreme Court of the State of New York, putatively derivatively on behalf of the Company, against the Company, each of the Company’s Directors, Mr. Weber, the former Chief Financial Officer and Vice President of Operations of the Company, Wayne Lam, a former Vice president of the Company, the estate of Mr. Huai, the former Chairman, President and Chief Executive Officer of the Company, and Jason Lin, a former employee of the Company (the “Derivative Action”). The consolidated amended Derivative Action complaint alleged that the defendants breached their duties to the Company by: (1) causing or allowing the dissemination of false and misleading information; (2) failing to maintain internal controls; (3) failing to manage the Company properly; (4) unjustly enriching themselves; (5) abusing their control of the Company; and (6) wasting Company assets.
On March 5, 2013, the Suffolk County Division of the Supreme Court of the State of New York granted a motion made by all of the defendants in the Derivative Action, except Mr. Lin, and dismissed the Derivative Action as to all defendants other than Mr. Lin. The stockholders appealed the dismissal of the Derivative Action and on March 18, 2015, the Appellate Division, Second Department unanimously affirmed the New York Supreme Court’s decision dismissing the Derivative Action. The Plaintiffs have not timely sought leave to appeal the Appellate Division’s decision to the New York Court of Appeals, and thus the Company believes this matter has been finally resolved.
The Company has insurance policies that were purchased to cover, among other things, lawsuits like the Derivative Action and a class action lawsuit that has been settled by the Company (the "Class Action"). The Company’s Directors and Officers (“D&O”) Insurance, is composed of more than one layer, with each layer written by a different insurance company. However, the events that gave rise to the claims in the Derivative Action and the Class Action caused the Company’s insurers to reserve their rights to disclaim, rescind, or otherwise not be obligated to provide coverage to the Company and certain other insureds under the policies. In light of these uncertainties, the Company entered into settlements with two of its insurers. Pursuant to these settlements, the Company will not receive repayment of all amounts it might otherwise have received.
During 2015 and 2014, the Company recorded an expense of less than $0.1 million and a benefit of $5.4 million, respectively, of investigation, litigation and settlement related legal costs, net of expected recoveries, related to expenses related to the Class Action and Derivative Action lawsuits, the Estate settlement and other settlement related activities that are not recoverable through insurance.
Other Claims
The Company is subject to various legal proceedings and claims, asserted or unasserted, which arise in the ordinary course of business. While the outcome of any such matters cannot be predicted with certainty, such matters are not expected to have a material adverse effect on the Company’s financial condition or operating results.
The Company continues to assess certain litigation and claims to determine the amounts, if any, that the Company believes may be paid as a result of such claims and litigation and, therefore, additional losses may be accrued and paid in the future, which could materially adversely impact the Company’s financial results, its cash flows and its cash reserves.
79
(15) Restructuring Costs
From time to time, the Company has undertaken restructuring and expense control measures to support its business performance and to align the Company’s cost structure with its resources. In the third quarter of 2013, the Company adopted the 2013 Plan to better align the Company’s cost structure with the skills and resources required to more effectively execute the Company’s long-term growth strategy and to support revenue levels the Company expects to achieve on a go forward basis. In connection with the 2013 Plan, the Company eliminated over 100 positions worldwide, implemented tighter expense controls, ceased non-core activities and closed or downsized several facilities. The 2013 Plan was substantially completed by December 31, 2014; however, we expect the majority of the severance related costs to be paid once final settlement litigation is completed, which can be at various times over the next three to twenty-four months. The total amount incurred under the 2013 Plan for the years ended December 31, 2015 and 2014, was $0.2 million and $1.1 million, respectively.
Accrued restructuring costs as of December 31, 2015 associated with the 2013 Plan is as follows:
Severance related costs | Facility and other costs | Total | ||||||||||
Original charge | $ | 3,179,131 | $ | 426,889 | $ | 3,606,020 | ||||||
Utilized/Paid | (2,067,554 | ) | (231,973 | ) | (2,299,527 | ) | ||||||
Balance at December 31, 2013 | $ | 1,111,577 | $ | 194,916 | $ | 1,306,493 | ||||||
Provisions/Additions | 365,174 | 770,136 | 1,135,310 | |||||||||
Utilized/Paid | (653,325 | ) | (759,563 | ) | (1,412,888 | ) | ||||||
Balance at December 31, 2014 | $ | 823,426 | $ | 205,489 | $ | 1,028,915 | ||||||
Provisions/Additions | 55,527 | 117,468 | 172,995 | |||||||||
Utilized/Paid | (161,313 | ) | (307,935 | ) | (469,248 | ) | ||||||
Balance at December 31, 2015 | $ | 717,640 | $ | 15,022 | $ | 732,662 | ||||||
Included in facility and other costs for the year ended December 31, 2014 and 2013, is a charge of $0.2 million and less than $0.1 million, respectively, related to the write-off of property and equipment that were no longer in use due to the closure of certain of the Company's foreign facilities. The severance related liabilities and facility and other liabilities are included within “accrued expenses” and "accounts payable" in the accompanying consolidated balance sheet for 2015. The expenses under the 2013 Plan are included within “restructuring costs” in the accompanying consolidated statements of operations.
(16) Employee Benefit Plans
Defined Contribution Plan
Effective July 2002, the Company established a voluntary savings and defined contribution plan (the “Plan”) under Section 401(k) of the Internal Revenue Code. This Plan covers all U.S. employees meeting certain eligibility requirements and allows participants to contribute a portion of their annual compensation. Employees are 100% vested in their own contributions. For the years ended December 31, 2015, 2014 and 2013, the Company did not make any contributions to the Plan.
Effective July 1, 2007, the Company, in accordance with the labor pension system in Taiwan, contributes 6% of salaries to individual pension accounts managed by the Bureau of Labor Insurance. The plan covers all Taiwan employees that elect the new pension system and all employees hired after July 1, 2005. For the years ended December 31, 2015, 2014 and 2013, the Company contributed approximately $77,000, $97,000 and $115,000, respectively.
Defined Benefit Plan
The Company has a defined benefit plan covering employees in Taiwan. The Company accounts for its defined benefit plan in accordance with the authoritative guidance issued by the FASB on retirement benefits, which requires the Company to recognize the funded status of its defined benefit plan in the accompanying consolidated balance sheet, with the corresponding adjustment to accumulated other comprehensive income, net of tax.
80
At December 31, 2015 and 2014, $27,186 and $26,613, respectively, is included in accumulated other comprehensive (loss) income for amounts that have not yet been recognized in net periodic pension cost. These amounts include the following: unrecognized transition obligation of $15,615 and $21,590 at December 31, 2015 and 2014, respectively, and unrecognized actuarial (gain) loss of ($42,800) and ($48,203) at December 31, 2015 and 2014, respectively. During 2015, the total amount recorded in other comprehensive (loss) income related to the pension plan was $573 (net of tax), which consisted of an actuarial loss of ($4,827) and the recognition of $5,400 of transition obligations recognized during 2015 as a component of net periodic pension cost. The transition obligation and actuarial gain included in accumulated other comprehensive loss and expected to be recognized in net periodic pension cost for the year ended December 31, 2016, is $5,400 and $1,618 respectively.
Pension information for the years ended December 31, 2015 and 2014, is as follows:
2015 | 2014 | |||||||
Accumulated benefit obligation | $ | 149,932 | $ | 145,004 | ||||
Changes in projected benefit obligation: | ||||||||
Projected benefit obligation at beginning of year | 193,144 | 288,845 | ||||||
Interest cost | 4,348 | 6,439 | ||||||
Actuarial loss (gain) | 2,549 | (92,394 | ) | |||||
Benefits paid | — | — | ||||||
Service cost | 1,240 | 2,223 | ||||||
Currency translation and other | (7,183 | ) | (11,969 | ) | ||||
Projected benefit obligation at end of year | $ | 194,098 | $ | 193,144 | ||||
Changes in plan assets: | ||||||||
Fair value of plan assets at beginning of year | $ | 120,018 | $ | 114,791 | ||||
Actual return on plan assets | 3,129 | 2,583 | ||||||
Benefits paid | — | — | ||||||
Employer contributions | 7,864 | 9,480 | ||||||
Currency translation and other | (4,677 | ) | (6,836 | ) | ||||
Fair value of plan assets at end of year | $ | 126,334 | $ | 120,018 | ||||
Funded status | $ | 67,764 | $ | 73,126 | ||||
Components of net periodic pension cost: | ||||||||
Interest cost | $ | 4,348 | $ | 6,439 | ||||
Expected return on plan assets | (2,702 | ) | (2,312 | ) | ||||
Amortization of net loss | 3,684 | 6,411 | ||||||
Service cost | 1,240 | 2,223 | ||||||
Net periodic pension cost | $ | 6,570 | $ | 12,761 | ||||
The Company makes contributions to the plan so that minimum contribution requirements, as determined by government regulations, are met. Company contributions of approximately $8,000 are expected to be made during 2016. Benefit payments of approximately $209,000 are expected to be paid in 2016 through 2025.
The Company utilized the following assumptions in computing the benefit obligation at December 31, 2015 and 2014 as follows:
Years ended December 31, | ||||||
2015 | 2014 | |||||
Discount rate | 1.75 | % | 2.25 | % | ||
Rate of increase in compensation levels | 2.00 | % | 2.00 | % | ||
Expected long-term rate of return on plan assets | 1.75 | % | 2.25 | % | ||
81
(17) Segment Reporting and Concentrations
The Company is organized in a single operating segment for purposes of making operating decisions and assessing performance. Revenues from the United States to customers in the following geographical areas for the years ended December 31, 2015, 2014 and 2013, and the location of long-lived assets as of December 31, 2015 and 2014, are summarized as follows:
Years ended December 31, | ||||||||||||
2015 | 2014 | 2013 | ||||||||||
Revenues: | ||||||||||||
Americas | $ | 23,308,240 | $ | 16,935,743 | $ | 22,538,045 | ||||||
Asia Pacific | 12,934,261 | 14,154,568 | 17,128,902 | |||||||||
Europe, Middle East, Africa and Other | 12,328,490 | 15,183,204 | 18,969,557 | |||||||||
Total Revenues | $ | 48,570,991 | $ | 46,273,515 | $ | 58,636,504 | ||||||
December 31, | ||||||||||||
2015 | 2014 | |||||||||||
Long-lived assets: | ||||||||||||
Americas | $ | 7,519,787 | $ | 8,327,602 | ||||||||
Asia Pacific | 650,633 | 822,277 | ||||||||||
Europe, Middle East, Africa and Other | 168,241 | 233,669 | ||||||||||
Total long-lived assets | $ | 8,338,661 | $ | 9,383,548 | ||||||||
For the year ended December 31, 2015, the Company had two customers that accounted for 10% or more of total revenue. For the years ended December 31, 2014 and 2013, the Company had one customer that accounted for 11% and 14% of total revenue, respectively. As of December 31, 2015, the Company had two customers that accounted for 10% or more of the gross accounts receivable balance. As of December 31, 2014, the Company had one customer that accounted for 11% of gross accounts receivable balances.
(18) Valuation and Qualifying Accounts – Allowance for Returns and Doubtful Accounts
Period Ended | Balance at Beginning of Period | Benefits to Expenses / Revenue | (Increases) Deductions | Balance at End of Period | ||||||||||
December 31, 2015 | $ | 119,530 | (6,745 | ) | (78,500 | ) | $ | 191,285 | ||||||
December 31, 2014 | $ | 276,302 | (64,904 | ) | 91,868 | $ | 119,530 | |||||||
December 31, 2013 | $ | 940,101 | (294,074 | ) | 369,725 | $ | 276,302 | |||||||
Note: Benefits to the allowance for doubtful accounts are recorded within “general and administrative expenses” within the consolidated statements of operations. Benefits to the return reserve for product and service are recorded within “product revenue” within the consolidated statements of operations.
Due to cash collections of previously reserved accounts receivable balances, the Company recorded a benefit of less than $0.1 million, $0.1 million and less than $0.1 million during the years ended December 31, 2015, 2014 and 2013 respectively. These amounts are within “benefits to expenses/revenue” above, and are included within revenue in each respective period in the accompanying consolidated statements of operations.
82
(19) Quarterly Financial Data (Unaudited)
The following is a summary of selected quarterly financial data for the years ended December 31, 2015 and 2014:
Quarter | ||||||||||||||||
2015 | First | Second | Third | Fourth | ||||||||||||
Revenue (a) | $ | 19,939,876 | $ | 9,552,589 | $ | 9,683,226 | $ | 9,395,300 | ||||||||
Gross profit | 17,529,634 | 6,893,803 | 7,257,275 | 7,208,145 | ||||||||||||
Net income (loss) attributable to common stockholders | 4,934,176 | (2,998,645 | ) | (2,922,694 | ) | (2,295,014 | ) | |||||||||
Basic net income (loss) per share attributable to common stockholders | $ | 0.12 | $ | (0.07 | ) | $ | (0.07 | ) | $ | (0.06 | ) | |||||
Diluted net income (loss) per share attributable to common stockholders | $ | 0.10 | $ | (0.07 | ) | $ | (0.07 | ) | $ | (0.06 | ) | |||||
Quarter | ||||||||||||||||
2014 | First | Second | Third | Fourth | ||||||||||||
Revenue | $ | 12,001,499 | $ | 11,302,667 | $ | 11,175,440 | $ | 11,793,909 | ||||||||
Gross profit | 9,327,124 | 8,595,004 | 8,583,096 | 9,137,575 | ||||||||||||
Net (loss) income attributable to common stockholders (b) | (3,104,078 | ) | 1,023,512 | (3,545,218 | ) | (2,827,016 | ) | |||||||||
Basic net (loss) income per share attributable to common stockholders | $ | (0.06 | ) | $ | 0.02 | $ | (0.08 | ) | $ | (0.06 | ) | |||||
Diluted net (loss) income per share attributable to common stockholders | $ | (0.06 | ) | $ | 0.02 | $ | (0.08 | ) | $ | (0.06 | ) | |||||
The sum of the quarterly net income (loss) per share amounts do not necessarily equal the annual amount reported, as per share amounts are computed independently for each quarter and the annual period based on the weighted average common shares outstanding in each period.
(a) | Revenue in the first quarter of 2015 includes revenue of $11.3 million from our joint development agreement. |
(b) | Net income attributable to common stockholders in the second quarter of 2014 includes a gain of $5.3 million related to the Estate litigation settlement. |
83
Item 9. Changes in and Disagreements with Accountants on Accounting and Financial Disclosure
On June 12, 2015, the Audit Committee (the “Audit Committee”) of the Board of Directors of FalconStor Software, Inc., a Delaware corporation (the “Company”), approved the engagement of BDO USA, LLP (“BDO”) as the Company’s independent registered public accounting firm for the Company’s fiscal year ended December 31, 2015, effective immediately, and dismissed KPMG LLP (“KPMG”) as the Company's independent registered public accounting firm.
KPMG’s audit reports on the Company’s consolidated financial statements as of and for the fiscal years ended December 31, 2014 and 2013 did not contain an adverse opinion or a disclaimer of opinion and were not qualified or modified as to uncertainty, audit scope or accounting principles.
During the fiscal years ended December 31, 2014 and 2013, and the subsequent interim periods through June 12, 2015, there were (i) no disagreements (as described in Item 304(a)(1)(iv) of Regulation S-K and the related instructions) between the Company and KPMG on any matter of accounting principles or practices, financial statement disclosure, or auditing scope or procedure, which, if not resolved to KPMG’s satisfaction, would have caused KPMG to make reference thereto in their reports on the financial statements for such years, and (ii) no “reportable events” within the meaning of Item 304(a)(1)(v) of Regulation S-K except that KPMG LLP advised the Company of the existence of a material weakness as of September 30, 2014 relating to the precision of the Company’s contract review control over revenue which was remediated by the Company as of December 31, 2014. Accordingly, KPMG’s report on the effectiveness of the Company’s internal control over financial reporting as of December 31, 2014, which was included in the Company’s Form 10-K for the fiscal year ended December 31, 2014, did not contain an adverse opinion thereon.
The Company provided KPMG with a copy of the disclosures it made in its Current Report on Form 8-K dated June 12, 2015 and requested that KPMG furnish a letter addressed to the Securities and Exchange Commission stating whether or not it agrees with the statements made. A copy of KPMG’s letter dated June 16, 2015, was filed as Exhibit 16.1 to the registant's From 8-K dated June 12, 2015.
During the fiscal years ended December 31, 2014 and 2013, and the subsequent interim periods through June 12, 2015, neither the Company nor anyone acting on its behalf has consulted with BDO regarding (i) the application of accounting principles to a specific transaction, either completed or proposed, or the type of audit opinion that might be rendered on the Company’s financial statements or the effectiveness of internal control over financial reporting, and neither a written report or oral advice was provided to the Company that BDO concluded was an important factor considered by the Company in reaching a decision as to any accounting, auditing, or financial reporting issue, (ii) any matter that was the subject of a disagreement within the meaning of Item 304(a)(1)(iv) of Regulation S-K, or (iii) any reportable event within the meaning of Item 304(a)(1)(v) of Regulation S-K.
Item 9A. Controls and Procedures
Disclosure Controls and Procedures
The Company maintains “disclosure controls and procedures,” as such term is defined in Rules 13a-15e and 15d-15e of the Securities and Exchange Act of 1934, as amended (the “Exchange Act”), that are designed to ensure that information required to be disclosed in its reports, pursuant to the Exchange Act, is recorded, processed, summarized and reported within the time periods specified in the SEC’s rules and forms, and that such information is accumulated and communicated to its management, including its Chief Executive Officer and Chief Financial Officer, as appropriate, to allow timely decisions regarding the required disclosures. In designing and evaluating the disclosure controls and procedures, management has recognized that any controls and procedures, no matter how well designed and operated, can provide only reasonable assurances of achieving the desired control objectives, and management necessarily is required to apply its judgment in evaluating the cost benefit relationship of possible controls and procedures.
The Company’s Chief Executive Officer (its principal executive officer) and Chief Financial Officer (its principal finance officer and principal accounting officer) have evaluated the effectiveness of its “disclosure controls and procedures” as of the end of the period covered by this Annual Report on Form 10-K. Based on their evaluation, the principal executive officer and principal financial officer concluded that its disclosure controls and procedures are effective as of the end of the period covered by this report.
84
Internal Control Over Financial Reporting
Management’s Report on Internal Control Over Financial Reporting
The Company’s management is responsible for establishing and maintaining adequate internal control over financial reporting for the Company; as such term is defined in Rules 13a-15(f) under the Securities and Exchange Act of 1934, as amended. To evaluate the effectiveness of the Company’s internal control over financial reporting, the Company’s management uses the Integrated Framework (2013) adopted by the Committee of Sponsoring Organizations of the Treadway Commission (“COSO”).
The Company’s management has assessed the effectiveness of the Company’s internal control over financial reporting as of December 31, 2015, using the COSO framework (2013). The Company’s management has determined that the Company’s internal control over financial reporting is effective as of that date.
There were no changes in the Company’s internal controls over financial reporting during the Company’s last fiscal quarter that have materially affected, or are reasonably likely to materially affect, the Company’s internal control over financial reporting.
The registered public accounting firm that audited the financial statements included in this annual report has issued an attestation report on the Company’s internal control over financial reporting.
Item 9B. Other Information
On February 12, 2016, the Compensation Committee of the Company’s Board of Directors granted stock awards to the following named executive officers with an effective grant date two business days subsequent to the Company’s publicly announced fourth quarter and full-year 2015 results:
1. | Gary Quinn, President and Chief Executive Officer and Louis J. Petrucelly, Executive Vice President, Chief Financial Officer and Treasurer of the Company each were granted 100,000 shares of restricted stock, one-third of which vest on each of the next three anniversaries of the grant date. |
2. | Alan Komet, Executive Vice President, Global Field Operations of the Company was granted 100,000 non-qualified stock options, one-third of which vest on each of the next three anniversaries of the grant date. |
On February 15, 2016, the Company’s Board of Directors approved the following salary increases to the following named executive officers:
1. | Louis J. Petrucelly, Executive Vice President, Chief Financial Officer and Treasurer of the Company. Mr. Petrucelly’s salary was increased to $275,000 per year, retro-active to January 1, 2016. |
2. | Alan Komet, Executive Vice President, Global Field Operations of the Company. Mr. Komet’s salary was increased to $225,000 per year, retro-active to January 1, 2016 and Mr. Komet has the ability to earn $225,000 in commissions based upon the Company achieving its 2016 sales targets. |
85
PART III
Item 10. | Directors, Executive Officers and Corporate Governance |
Information called for by Part III, Item 10, regarding the Registrant’s directors will be included in our Proxy Statement relating to our annual meeting of stockholders scheduled to be held in April 2016, and is incorporated herein by reference. The information appears in the Proxy Statement under the captions “Election of Directors”, “Management”, “Executive Compensation”, “Section 16 (a) Beneficial Ownership Reporting Compliance”, and “Committees of the Board of Directors.” The Proxy Statement will be filed within 120 days of December 31, 2015, our year-end.
Item 11. | Executive Compensation |
Information called for by Part III, Item 11, will be included in our Proxy Statement relating to our annual meeting of stockholders scheduled to be held in April 2016, and is incorporated herein by reference. The information appears in the Proxy Statement under the captions “Executive Compensation”, “Director Compensation”, “Compensation Committee Interlocks and Insider Participation”, Compensation Committee Report” and “Committees of the Board of Directors.” The Proxy Statement will be filed within 120 days of December 31, 2015, our year-end.
Item 12. | Security Ownership of Certain Beneficial Owners and Management and Related Stockholder Matters |
Information regarding Securities Authorized for Issuance Under Equity Compensation Plans is included in Item 4 and is incorporated herein by reference. All other information called for by Part III, Item 12, will be included in our Proxy Statement relating to our annual meeting of stockholders scheduled to be held in April 2016, and is incorporated herein by reference. The information appears in the Proxy Statement under the caption “Beneficial Ownership of Shares.” The Proxy Statement will be filed within 120 days of December 31, 2015, our year-end.
Item 13. | Certain Relationships and Related Transactions, and Director Independence |
Information regarding our relationships and related transactions will be included in our Proxy Statement relating to our annual meeting of stockholders scheduled to be held in April 2016, and is incorporated by reference. The information appears in the Proxy Statement under the caption “Certain Relationships and Related Transactions.” The Proxy Statement will be filed within 120 days of December 31, 2015, our year-end.
Item 14. | Principal Accountant Fees and Services |
Information called for by Part III, Item 14, will be included in our Proxy Statement relating to our annual meeting of stockholders scheduled to be held in April 2016, and is incorporated herein by reference. The information appears in the Proxy Statement under the caption “Principal Accountant Fees and Services.” The Proxy Statement will be filed within 120 days of December 31, 2015, our year-end.
86
PART IV
Item 15. Exhibits and Financial Statement Schedules
The information required by subsections (a)(1) and (a)(2) of this item are included in the response to Item 8 of Part II of this annual report on Form 10-K.
(b) Exhibits
3.1 | Restated Certificate of Incorporation, incorporated herein by reference to Exhibit 3.1 to the Registrant’s registration statement on Form S-1 (File no. 33-79350), filed on April 28, 1994. |
3.2 | Amended and Restated By-Laws of FalconStor Software, Inc., incorporated herein by reference to Exhibit 3.2 to the Registrant’s annual report on Form 10-K for the year ended December 31, 2010, filed on March 14, 2011. |
3.3 | Certificate of Amendment to the Restated Certificate of Incorporation, incorporated herein by reference to Exhibit 3.3 to the Registrant’s annual report on Form 10-K for the year ended December 31, 1998, filed on March 22, 1999. |
3.4 | Certificate of Amendment to the Restated Certificate of Incorporation, incorporated herein by reference to Exhibit 3.4 to the Registrant’s annual report on Form 10-K for the year ended December 31, 2001, filed on March 27, 2002. |
3.5 | Certificate of Designations, Preferences and Rights of Series A Convertible Preferred Stock, incorporated herein by reference to Exhibit 4.1 to the Registrant's report on Form 8-K dated September 16, 2013. |
4.1s | 2000 Stock Option Plan, as amended May 14, 2004, incorporated herein by reference to Exhibit 4.3 to the Registrant’s Annual Report on Form 10-K for the year ended December 31, 2004, filed on March 16, 2005. |
4.2s | 2004 Outside Directors Stock Option Plan, incorporated herein by reference to Exhibit 4.5 to the Registrant’s Annual Report on Form 10-K for the year ended December 31, 2004, filed on March 16, 2005. |
4.3s | Amended and Restated 2006 Incentive Stock Plan incorporated herein by reference to Exhibit 4.1 to the Registrant’s quarterly report on Form 10-Q for the quarter ended March 31, 2007, filed on May 9, 2007. |
4.4s | Form of Restricted Stock Letter Agreement for Executive Officers, incorporated herein by reference to Exhibit 99.1 to the Registrant’s quarterly report on Form 10-Q for the period ended March 31, 2008, filed May 9, 2008. |
4.5s | Form of Restricted Stock Letter Agreement, incorporated herein by reference to Exhibit 4.1 to the Registrant’s current report on Form 8-K filed on April 7, 2014. |
4.6s | FalconStor Software Inc., 2013 Outside Directors Equity Compensation Plan, incorporated herein by reference to the Registrant's Proxy Statement on Schedule 14a for the 2013 Annual meeting of Stockholders, filed on March 29, 2013. |
10.1s | Amended and Restated FalconStor Software, Inc., 2005 Key Executive Severance Protection Plan, incorporated herein by reference to Exhibit 99.2 to Registrant’s current report on Form 8-K filed on April 7, 2014. |
10.2s | FalconStor Software, Inc., Director Compensation Deferral Plan, effective January 1, 2011, incorporated herein by reference to Registrant’s annual report on Form 10-K, for the year ended December 31, 2010, filed, on March 14, 2011. |
10.3 | Agreement of Lease between Huntington Quadrangle 2 LLC and FalconStor Software Inc., dated May 30, 2013, with a commencement date of March 1, 2014, incorporated herein by reference to Exhibit 99.1 to the Registrant's quarterly report on Form 10-Q for the period ended September 30, 2013 filed on November 7, 2013. |
10.4s | Employment Agreement dated July 24, 2015 between the Company and Gary Quinn, incorporated herein by reference to Exhibit 10.1 to the Registrant's quarterly report on Form 10-Q dated July 30, 2015. |
10.5 | Preferred Stock Purchase Agreement dated as of September 16, 2013 between the Company and Hale Capital Partners, LP, incorporated herein by reference to Exhibit 10.1 to the Registrant's report on Form 8-K dated September 16, 2013. |
10.6 | Independent Contractor Agreement dated July 24, 2015 between the Company and RFN Prime Marketing Inc., incorporated herein by reference to Exhibit 10.2 to the Registrant's quarterly report on Form 10-Q dated July 30, 2015. |
87
10.7 | Change in Registrant's Certifying Accountant, Letter of KPMG LLP, incorporated herein by reference to Exhibit 16.1 to the Registrant's report on Form 8-K dated June 16, 2015. |
21.1 | Subsidiaries of Registrant – FalconStor, Inc., FalconStor AC, Inc., FalconStor Software (Korea), Inc. |
23.1* | Consent of BDO USA, LLP |
23.2* | Consent of KPMG LLP |
31.1* | Certification of the Chief Executive Officer |
31.2* | Certification of the Chief Financial Officer |
32.1* | Certification of Chief Executive Officer pursuant to Section 906 of the Sarbanes-Oxley Act of 2002 (18 U.S.C. § 1350) |
32.2* | Certification of Chief Financial Officer pursuant to Section 906 of the Sarbanes-Oxley Act of 2002 (18 U.S.C. § 1350) |
101.1 | The following financial statements from FalconStor Software, Inc’s Annual Report on Form 10-K for the year ended December 31, 2015, formatted in XBLR (eXtensible Business Reporting Language): | |
(i) Consolidated Balance Sheets – December 31, 2015 and December 31, 2014
(ii) Consolidated Statements of Operations – Years Ended December 31, 2015, 2014 and 2013.
(iii) Consolidated Statements of Comprehensive Loss – Years Ended December 31, 2015, 2014 and 2013.
(iv) Consolidated Statements of Stockholders’ (Deficit) Equity – Years Ended December 31, 2015, 2014 and 2013.
(v) Consolidated Statements of Cash Flows – Years Ended December 31, 2015, 2014 and 2013.
(vi) Notes to Consolidated Financial Statements – December 31, 2015.
*- Filed herewith.
s- Denotes management contract or compensatory plan or arrangement.
88
SIGNATURES
Pursuant to the requirements of Section 13 or 15(d) of the Securities Exchange Act of 1934, the registrant has duly caused this report to be signed on its behalf by the undersigned, thereunto duly authorized in Melville, State of New York on February 17, 2016.
FALCONSTOR SOFTWARE, INC. | ||||
By: | /s/ Gary Quinn | Date: | February 17, 2016 | |
Gary Quinn, President and Chief Executive Officer of FalconStor Software, Inc. | ||||
POWER OF ATTORNEY
FalconStor Software, Inc. and each of the undersigned do hereby appoint Gary Quinn and Louis J. Petrucelly, and each of them severally, its or his true and lawful attorney to execute on behalf of FalconStor Software, Inc. and the undersigned any and all amendments to this Annual Report on Form 10-K and to file the same with all exhibits thereto and other documents in connection therewith, with the Securities and Exchange Commission; each of such attorneys shall have the power to act hereunder with or without the other.
Pursuant to the requirements of the Securities Exchange Act of 1934, this report has been signed below by the following persons on behalf of the registrant and in the capacities and on the date indicated.
By: | /s/ Gary Quinn | February 17, 2016 | |
Gary Quinn, President and Chief Executive Officer and Director (principal executive officer) | Date | ||
By: | /s/ Louis J. Petrucelly | February 17, 2016 | |
Louis J. Petrucelly, Executive Vice President, Chief Financial Officer and Treasurer (principal financial and accounting officer) | Date | ||
By: | /s/ Steven R. Fischer | February 17, 2016 | |
Steven R. Fischer, Director | Date | ||
By: | /s/ Alan W. Kaufman | February 17, 2016 | |
Alan W. Kaufman, Director | Date | ||
By: | /s/ Irwin Lieber | February 17, 2016 | |
Irwin Lieber, Director | Date | ||
By: | /s/ Eli Oxenhorn | February 17, 2016 | |
Eli Oxenhorn, Chairman of the Board | Date | ||
By: | /s/ Barry Rubenstein | February 17, 2016 | |
Barry Rubenstein, Director | Date | ||
89
By: | /s/ Martin Hale Jr. | February 17, 2016 | |
Martin Hale Jr., Director | Date | ||
By: | /s/ Michael Kelly | February 17, 2016 | |
Michael Kelly, Director | Date | ||
90