Attached files
| file | filename |
|---|---|
| 8-K - CHIMERA INVESTMENT CORPORATION 8-K - CHIMERA INVESTMENT CORP | a51281044.htm |
| EX-99.1 - EXHIBIT 99.1 - CHIMERA INVESTMENT CORP | a51281044ex99_1.htm |
Exhibit 99.2
CONFERENCEN AM EGOESHERE0
0Informationisun aud it ed, estimated and subject to change.
WWW.ANNALY.C OMWWW.CHIMERAREIT.COM Q4 2015 Supplemental Financial
Information February 17, 2016
CONFERENCEN AM EGOESHERE1
1Information isun audit ed, estimated and subject to change. Disclaimer
This material is not intended to be exhaustive, is preliminary in nature
and may be subject to change. In addition, much of the information
contained herein is based on various assumptions (some of which are
beyond the control of Chimera Investment Corporation, the “Company”) and
may be identified by reference to a future period or periods or by the
use of forward-looking terminology, such as “believe,” “expect,”
“anticipate,” “estimate,” “plan,” “continue,” “intend,” “should,” “may,”
“would,” “projected,” “will” or similar expressions, or variations on
those terms or the negative of those terms. The Company’s
forward-looking statements are subject to numerous risks, uncertainties
and other factors. Furthermore, none of the financial information
contained in this material has been audited or approved by the Company’s
independent registered public accounting firm.1
CIOnNfFoErmREaNtCioEn N
iAsM uEn GaOuEdSit HeEdR, Eestimated and subject to change. 22 Portfolio
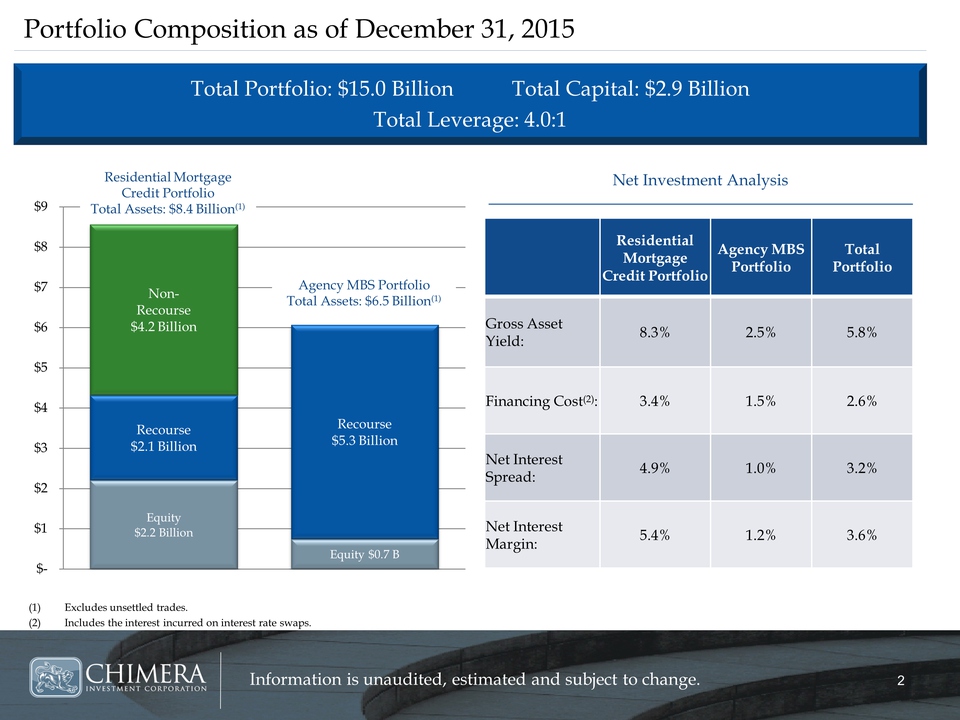
Composition as of December 31, 2015 Residential Mortgage Credit
Portfolio Agency MBS Portfolio Total Portfolio Gross Asset Yield: 8.3%
2.5% 5.8% Financing Cost(2): 3.4% 1.5% 2.6% Net Interest Spread: 4.9%
1.0% 3.2% Net Interest Margin: 5.4% 1.2% 3.6% (1) Excludes unsettled
trades. (2) Includes the interest incurred on interest rate swaps. Total
Portfolio: $15.0 Billion Total Capital: $2.9 Billion Total Leverage:
4.0:1 Net Investment Analysis Equity $2.2 Billion Equity $0.7 B Recourse
$2.1 Billion Recourse $5.3 Billion Non-Recourse $4.2 Billion $- $1 $2 $3
$4 $5 $6 $7 $8 $9 Residential Mortgage Credit Portfolio Total Assets:
$8.4 Billion(1) Agency MBS Portfolio Total Assets: $6.5 Billion(1)2
CIOnNfFoErmREaNtCioEn N
iAsM uEn GaOuEdSit HeEdR, Eestimated and subject to change. 33 December
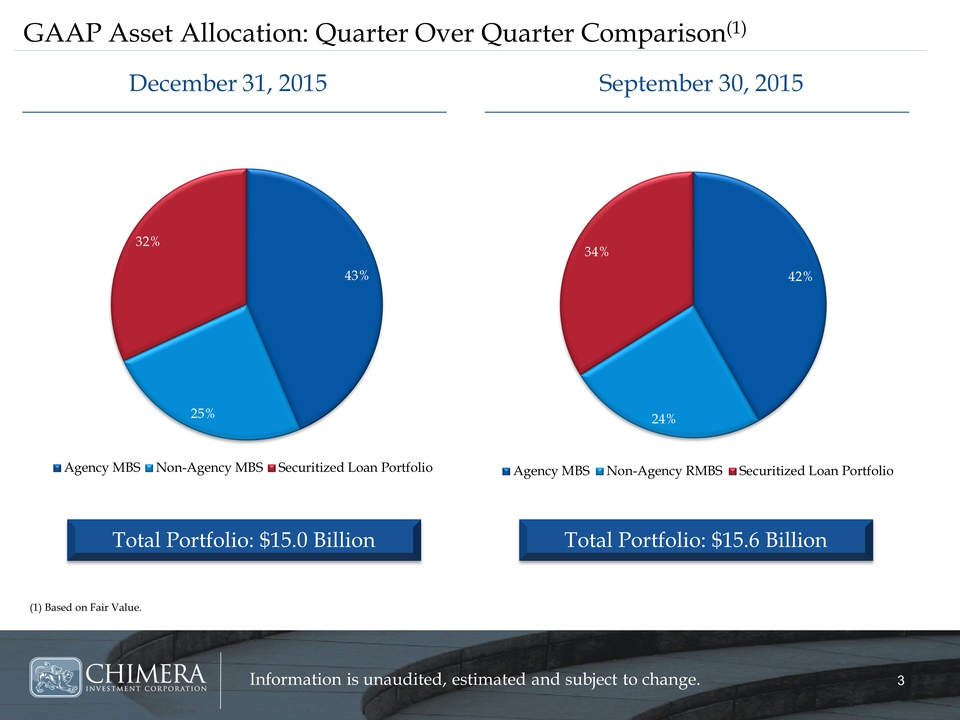
31, 2015 September 30, 2015 GAAP Asset Allocation: Quarter Over Quarter
Comparison(1) (1) Based on Fair Value. 42% 24% 34% Agency MBS Non-Agency
RMBS Securitized Loan Portfolio Total Portfolio: $15.6 Billion 43% 25%
32% Agency MBS Non-Agency MBS Securitized Loan Portfolio Total
Portfolio: $15.0 Billion3
CIOnNfFoErmREaNtCioEn N
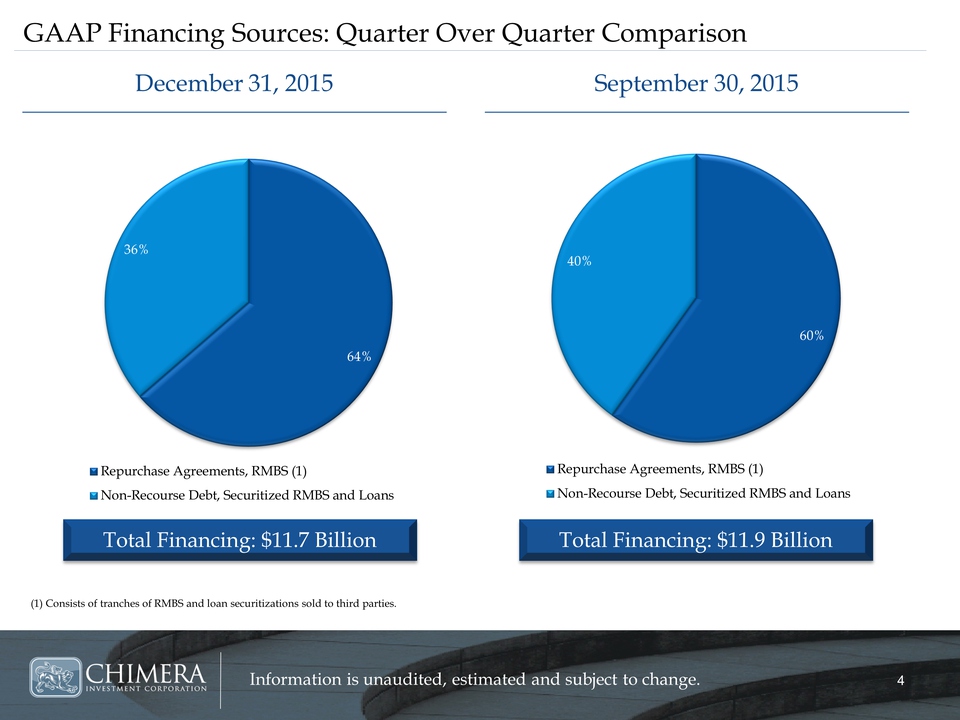
iAsM uEn GaOuEdSit HeEdR, Eestimated and subject to change. 44 (1)
Consists of tranches of RMBS and loan securitizations sold to third
parties. December 31, 2015 September 30, 2015 GAAP Financing Sources:
Quarter Over Quarter Comparison Total Financing: $11.7 Billion 60% 40%
Repurchase Agreements, RMBS (1) Non-Recourse Debt, Securitized RMBS and
Loans Total Financing: $11.9 Billion 64% 36% Repurchase Agreements, RMBS
(1) Non-Recourse Debt, Securitized RMBS and Loans4
CIOnNfFoErmREaNtCioEn N
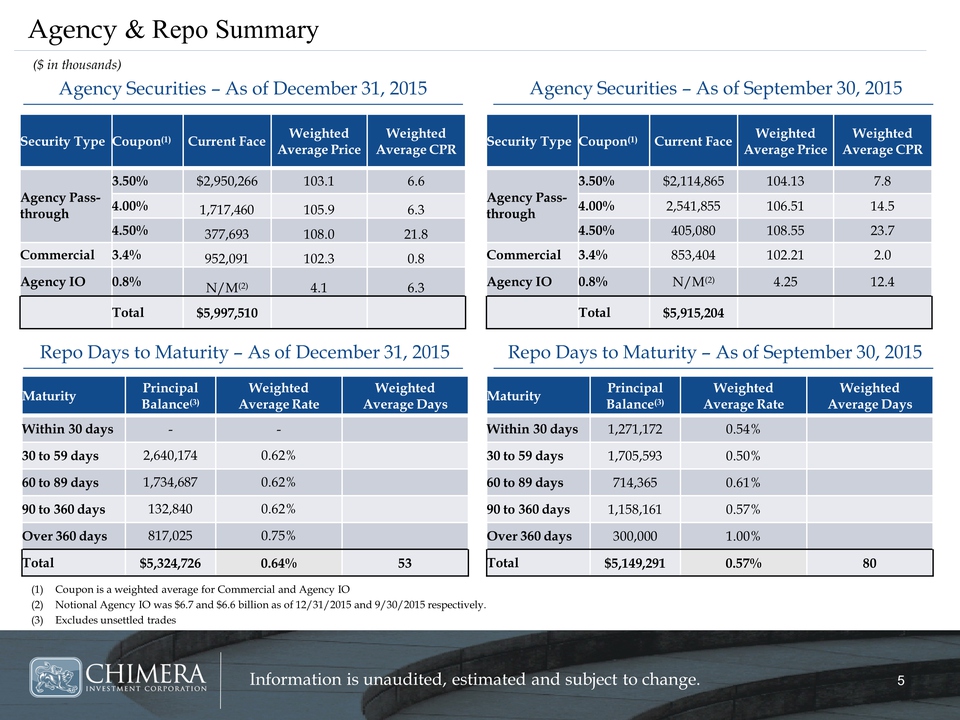
iAsM uEn GaOuEdSit HeEdR, Eestimated and subject to change. 55 Agency &
Repo Summary Agency Securities – As of December 31, 2015 Repo Days to
Maturity – As of December 31, 2015 Agency Securities – As of September
30, 2015 Repo Days to Maturity – As of September 30, 2015 ($ in
thousands) Maturity Principal Balance(3) Weighted Average Rate Weighted
Average Days Within 30 days 1,271,172 0.54% 30 to 59 days 1,705,593
0.50% 60 to 89 days 714,365 0.61% 90 to 360 days 1,158,161 0.57% Over
360 days 300,000 1.00% Total $5,149,291 0.57% 80 (1) Coupon is a
weighted average for Commercial and Agency IO (2) Notional Agency IO was
$6.7 and $6.6 billion as of 12/31/2015 and 9/30/2015 respectively. (3)
Excludes unsettled trades Security Type Coupon(1) Current Face Weighted
Average Price Weighted Average CPR Agency Pass-through 3.50% $2,950,266
103.1 6.6 4.00% 1,717,460 105.9 6.3 4.50% 377,693 108.0 21.8 Commercial
3.4% 952,091 102.3 0.8 Agency IO 0.8% N/M(2) 4.1 6.3 Total $5,997,510
Maturity Principal Balance(3) Weighted Average Rate Weighted Average
Days Within 30 days - - 30 to 59 days 2,640,174 0.62% 60 to 89 days
1,734,687 0.62% 90 to 360 days 132,840 0.62% Over 360 days 817,025 0.75%
Total $5,324,726 0.64% 53 Security Type Coupon(1) Current Face Weighted
Average Price Weighted Average CPR Agency Pass-through 3.50% $2,114,865
104.13 7.8 4.00% 2,541,855 106.51 14.5 4.50% 405,080 108.55 23.7
Commercial 3.4% 853,404 102.21 2.0 Agency IO 0.8% N/M(2) 4.25 12.4 Total
$5,915,204 5
CIOnNfFoErmREaNtCioEn N
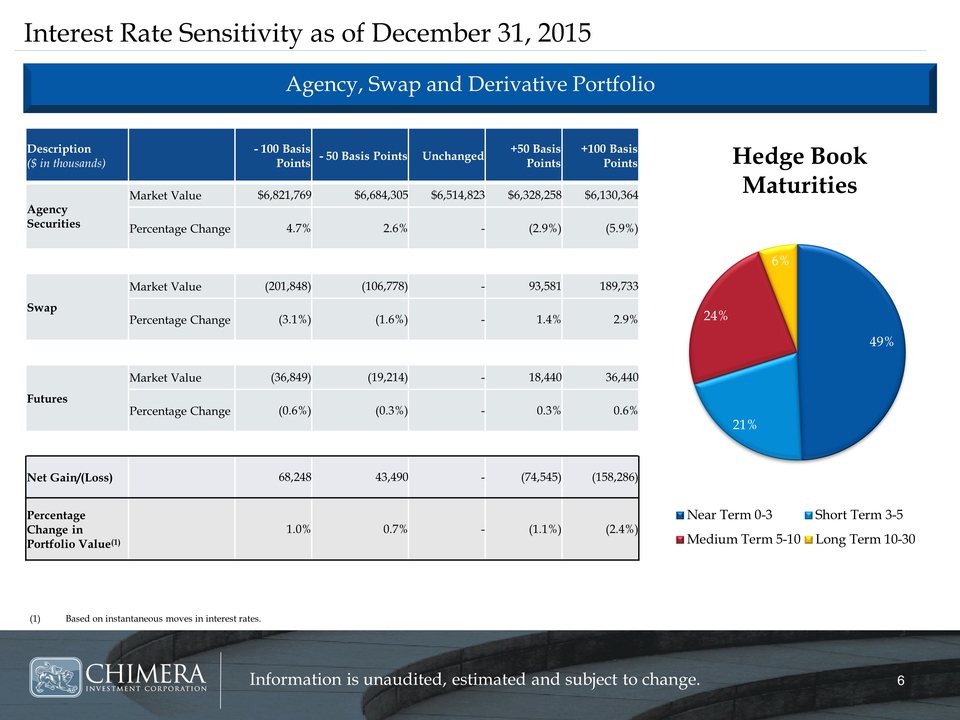
iAsM uEn GaOuEdSit HeEdR, Eestimated and subject to change. 66 Interest
Rate Sensitivity as of December 31, 2015 Agency, Swap and Derivative
Portfolio Description ($ in thousands) - 100 Basis Points - 50 Basis
Points Unchanged +50 Basis Points +100 Basis Points Agency Securities
Market Value $6,821,769 $6,684,305 $6,514,823 $6,328,258 $6,130,364
Percentage Change 4.7% 2.6% - (2.9%) (5.9%) Swap Market Value (201,848)
(106,778) - 93,581 189,733 Percentage Change (3.1%) (1.6%) - 1.4% 2.9%
Futures Market Value (36,849) (19,214) - 18,440 36,440 Percentage Change
(0.6%) (0.3%) - 0.3% 0.6% Net Gain/(Loss) 68,248 43,490 - (74,545)
(158,286) Percentage Change in Portfolio Value(1) 1.0% 0.7% - (1.1%)
(2.4%) (1) Based on instantaneous moves in interest rates. 49% 21% 24%
6% Hedge Book Maturities Near Term 0-3 Short Term 3-5 Medium Term 5-10
Long Term 10-30 6
CIOnNfFoErmREaNtCioEn N
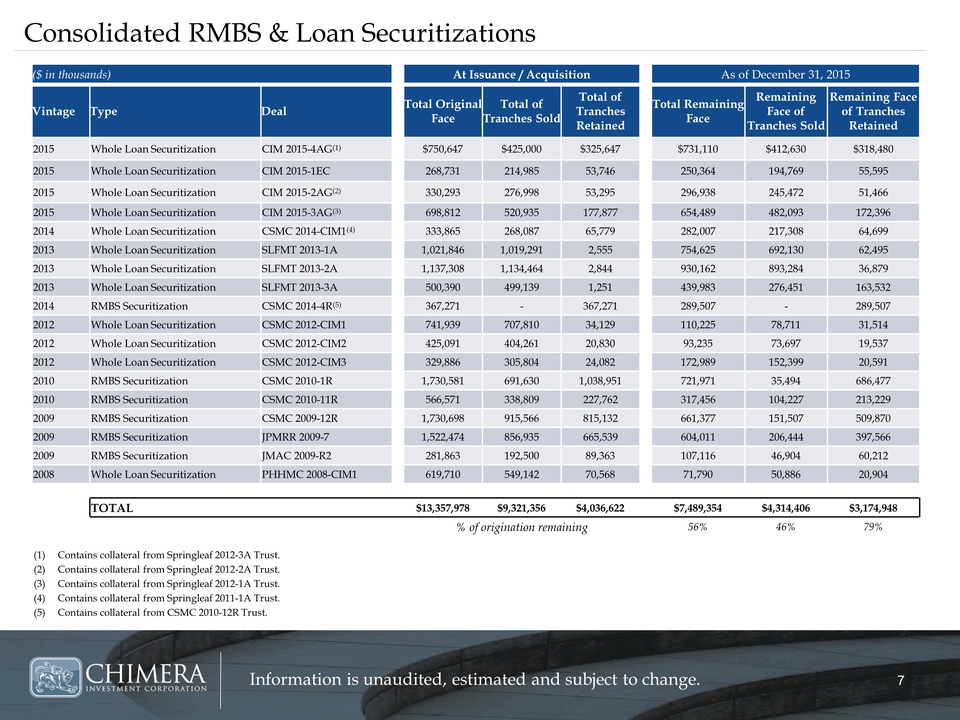
iAsM uEn GaOuEdSit HeEdR, Eestimated and subject to change. 77
Consolidated RMBS & Loan Securitizations ($ in thousands) At Issuance /
Acquisition As of December 31, 2015 Vintage Type Deal Total Original
Face Total of Tranches Sold Total of Tranches Retained Total Remaining
Face Remaining Face of Tranches Sold Remaining Face of Tranches Retained
2015 Whole Loan Securitization CIM 2015-4AG(1) $750,647 $425,000
$325,647 $731,110 $412,630 $318,480 2015 Whole Loan Securitization CIM
2015-1EC 268,731 214,985 53,746 250,364 194,769 55,595 2015 Whole Loan
Securitization CIM 2015-2AG(2) 330,293 276,998 53,295 296,938 245,472
51,466 2015 Whole Loan Securitization CIM 2015-3AG(3) 698,812 520,935
177,877 654,489 482,093 172,396 2014 Whole Loan Securitization CSMC
2014-CIM1(4) 333,865 268,087 65,779 282,007 217,308 64,699 2013 Whole
Loan Securitization SLFMT 2013-1A 1,021,846 1,019,291 2,555 754,625
692,130 62,495 2013 Whole Loan Securitization SLFMT 2013-2A 1,137,308
1,134,464 2,844 930,162 893,284 36,879 2013 Whole Loan Securitization
SLFMT 2013-3A 500,390 499,139 1,251 439,983 276,451 163,532 2014 RMBS
Securitization CSMC 2014-4R(5) 367,271 - 367,271 289,507 - 289,507 2012
Whole Loan Securitization CSMC 2012-CIM1 741,939 707,810 34,129 110,225
78,711 31,514 2012 Whole Loan Securitization CSMC 2012-CIM2 425,091
404,261 20,830 93,235 73,697 19,537 2012 Whole Loan Securitization CSMC
2012-CIM3 329,886 305,804 24,082 172,989 152,399 20,591 2010 RMBS
Securitization CSMC 2010-1R 1,730,581 691,630 1,038,951 721,971 35,494
686,477 2010 RMBS Securitization CSMC 2010-11R 566,571 338,809 227,762
317,456 104,227 213,229 2009 RMBS Securitization CSMC 2009-12R 1,730,698
915,566 815,132 661,377 151,507 509,870 2009 RMBS Securitization JPMRR
2009-7 1,522,474 856,935 665,539 604,011 206,444 397,566 2009 RMBS
Securitization JMAC 2009-R2 281,863 192,500 89,363 107,116 46,904 60,212
2008 Whole Loan Securitization PHHMC 2008-CIM1 619,710 549,142 70,568
71,790 50,886 20,904 TOTAL $13,357,978 $9,321,356 $4,036,622 $7,489,354
$4,314,406 $3,174,948 % of origination remaining 56% 46% 79% (1)
Contains collateral from Springleaf 2012-3A Trust. (2) Contains
collateral from Springleaf 2012-2A Trust. (3) Contains collateral from
Springleaf 2012-1A Trust. (4) Contains collateral from Springleaf
2011-1A Trust. (5) Contains collateral from CSMC 2010-12R Trust.7
WWCWWIOnWNWfFo..ACErNmRHNEIaMANtLCEiYoRE.nAC N ROiAsEMM IuTE.n CGaOOuMEd Sit HeEdR, Eestimated and subject to change. 88 Q4 2015 Supplemental Financial Information