Attached files
| file | filename |
|---|---|
| 8-K - 8-K - AMAG PHARMACEUTICALS, INC. | a16-4686_18k.htm |
| EX-99.1 - EX-99.1 - AMAG PHARMACEUTICALS, INC. | a16-4686_1ex99d1.htm |
Exhibit 99.2
AMAG Pharmaceuticals 4Q 2015 Financial Results February 17, 2016
This presentation contains forward-looking statements within the meaning of the Private Securities Litigation Reform Act of 1995 and other federal securities laws. Any statements contained herein which do not describe historical facts, including among others, statements regarding expected 2015 financial results and 2016 financial guidance, including revenues, adjusted EBITDA and cash earnings; future growth drivers for Makena, including estimated market size, the impact of the increased size of the sales force and patient support services and their effect on brand loyalty from physicians and patients and expectations for approval and commercialization of the single-dose preservative-free formulation of Makena; expectations for the next generation development programs for Makena, including the development and advantages of a single-dose preservative free formulation of Makena, a subcutaneous auto-injector and a longer-acting formulation of Makena (including the timing, cost-effectiveness, clinical trial efforts and targeted approval and commercialization related to such activities); beliefs regarding, and characterizations of, physician response and behaviors with regard to Makena and next generation products; future growth opportunities for CBR, including the impact of the increased size of the sales force, the benefits of a segmentation and pricing study that is underway and potential future medical applications in regenerative medicine; key drivers for the growth of Feraheme, including opportunities and plans to grow market share in the hospital and hematology/oncology segments, improved patient identification, and plans to realize the benefits of performance-based contracting strategies; growth opportunities for Feraheme in the CKD market through increased market share of the current U.S. indication and the potential approval of Feraheme for the broad IDA indication; plans and expectations (including timing and approval) for the head-to-head Phase 3 clinical trial for the broad IDA indication for Feraheme; and AMAG’s 2016 key priorities, including plans to achieve financial, product development and portfolio expansion objectives are forward-looking statements which involve risks and uncertainties that could cause actual results to differ materially from those discussed in such forward-looking statements. Such risks and uncertainties include, among others, the possibility that a recent Paragraph IV certification notice letter regarding an Abbreviated New Drug Application (ANDA) submitted to the U.S. Food & Drug Administration for a generic version of Feraheme will result in the introduction of generic competition for Feraheme, especially if AMAG is not successful in patent infringement litigation, if initiated, against such ANDA filer, which if not successful could lead to generic competition for Feraheme; the possibility that AMAG’s Phase 3 clinical trial for broad IDA indication for Feraheme will absorb significant resources, financial or otherwise over a considerable period of time and despite such efforts, might not be deemed adequate by the FDA, as well as those risks identified in AMAG’s filings with the U.S. Securities and Exchange Commission (SEC), including its Annual Report on Form 10-K for the year ended December 31, 2014, its Quarterly Reports on Form 10-Q for the quarters ended June 30, 2015 and September 30, 2015 and subsequent filings with the SEC. Any of the above risks and uncertainties could materially and adversely affect AMAG’s results of operations, its profitability and its cash flows, which would, in turn, have a significant and adverse impact on AMAG’s stock price. Use of the term “including” in this paragraph shall mean in each case “including, but not limited to.” AMAG cautions you not to place undue reliance on any forward-looking statements, which speak only as of the date they are made. Forward-Looking Statements
4Q 2015 Earnings Call Agenda Transformational Growth 1 2 3 4 2016 Key Priorities and Closing Remarks 5 Q&A 5 Commercial Performance and Developments 4Q 2015 Results and Financial Update
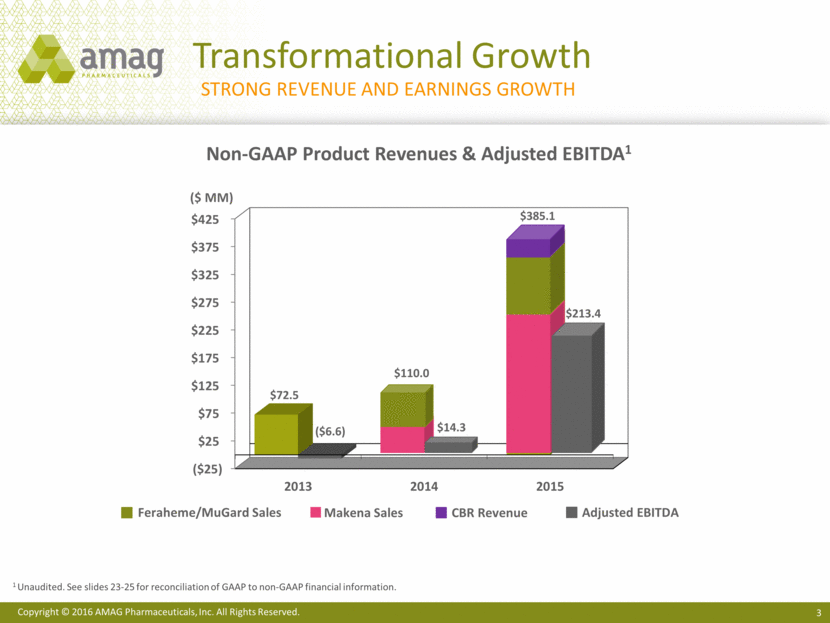
Transformational Growth Non-GAAP Product Revenues & Adjusted EBITDA1 1 Unaudited. See slides 23-25 for reconciliation of GAAP to non-GAAP financial information. ($ MM) Strong revenue and earnings growth ($25) $25 $75 $125 $175 $225 $275 $325 $375 $425 2013 2014 2015 $72.5 $110.0 $385.1 ($6.6) $14.3 $213.4 Makena Sales CBR Revenue Feraheme/MuGard Sales Adjusted EBITDA
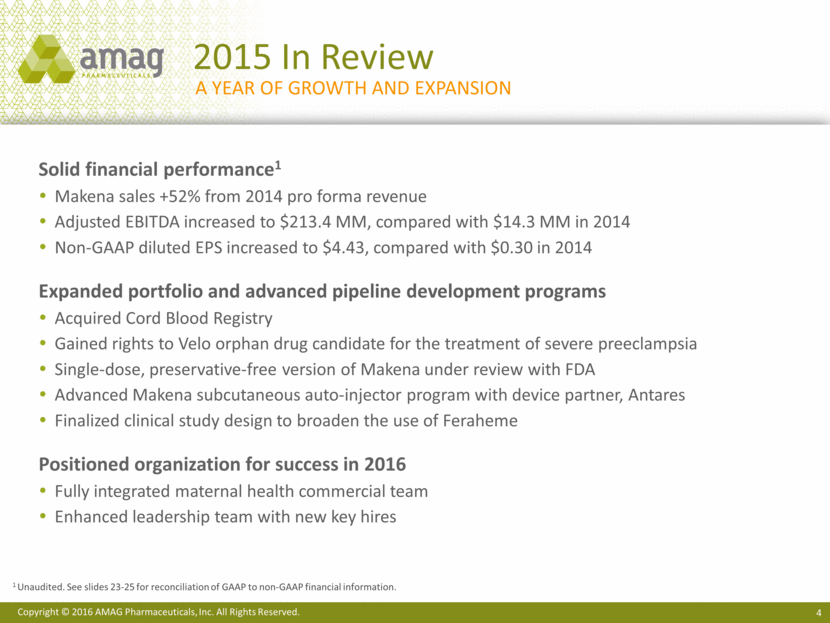
2015 In Review Solid financial performance1 Makena sales +52% from 2014 pro forma revenue Adjusted EBITDA increased to $213.4 MM, compared with $14.3 MM in 2014 Non-GAAP diluted EPS increased to $4.43, compared with $0.30 in 2014 Expanded portfolio and advanced pipeline development programs Acquired Cord Blood Registry Gained rights to Velo orphan drug candidate for the treatment of severe preeclampsia Single-dose, preservative-free version of Makena under review with FDA Advanced Makena subcutaneous auto-injector program with device partner, Antares Finalized clinical study design to broaden the use of Feraheme Positioned organization for success in 2016 Fully integrated maternal health commercial team Enhanced leadership team with new key hires A year of Growth and expansion 1 Unaudited. See slides 23-25 for reconciliation of GAAP to non-GAAP financial information.
Copyright © 2015 AMAG Pharmaceuticals. All Rights Reserved. 4Q/FY 2015 Financial Results
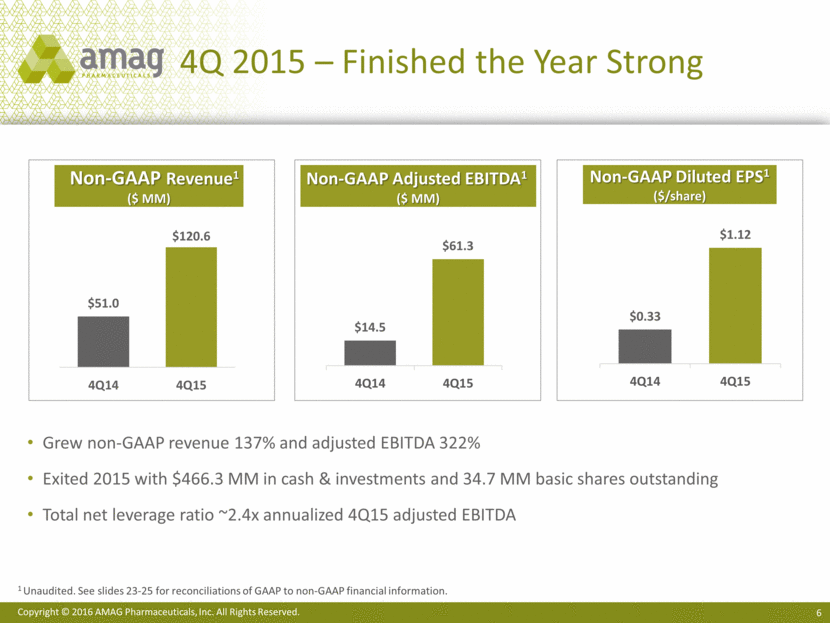
4Q 2015 – Finished the Year Strong Non-GAAP Revenue1 ($ MM) Non-GAAP Adjusted EBITDA1 ($ MM) Non-GAAP Diluted EPS1 ($/share) Grew non-GAAP revenue 137% and adjusted EBITDA 322% Exited 2015 with $466.3 MM in cash & investments and 34.7 MM basic shares outstanding Total net leverage ratio ~2.4x annualized 4Q15 adjusted EBITDA 1 Unaudited. See slides 23-25 for reconciliations of GAAP to non-GAAP financial information. $14.5 $61.3 4Q14 4Q15 $0.33 $1.12 4Q14 4Q15
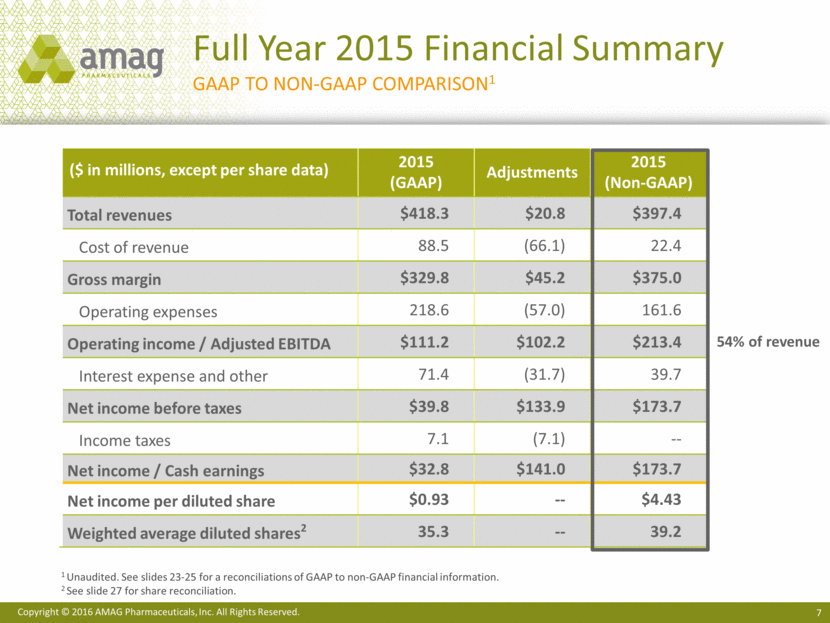
Full Year 2015 Financial Summary GAAP to NON-GAAP Comparison1 1 Unaudited. See slides 23-25 for a reconciliations of GAAP to non-GAAP financial information. 2 See slide 27 for share reconciliation. ($ in millions, except per share data) 2015 (GAAP) Adjustments 2015 (Non-GAAP) Total revenues $418.3 $20.8 $397.4 Cost of revenue 88.5 (66.1) 22.4 Gross margin $329.8 $45.2 $375.0 Operating expenses 218.6 (57.0) 161.6 Operating income / Adjusted EBITDA $111.2 $102.2 $213.4 Interest expense and other 71.4 (31.7) 39.7 Net income before taxes $39.8 $133.9 $173.7 Income taxes 7.1 (7.1) -- Net income / Cash earnings $32.8 $141.0 $173.7 Net income per diluted share $0.93 -- $4.43 Weighted average diluted shares2 35.3 -- 39.2 54% of revenue
Maternal Health

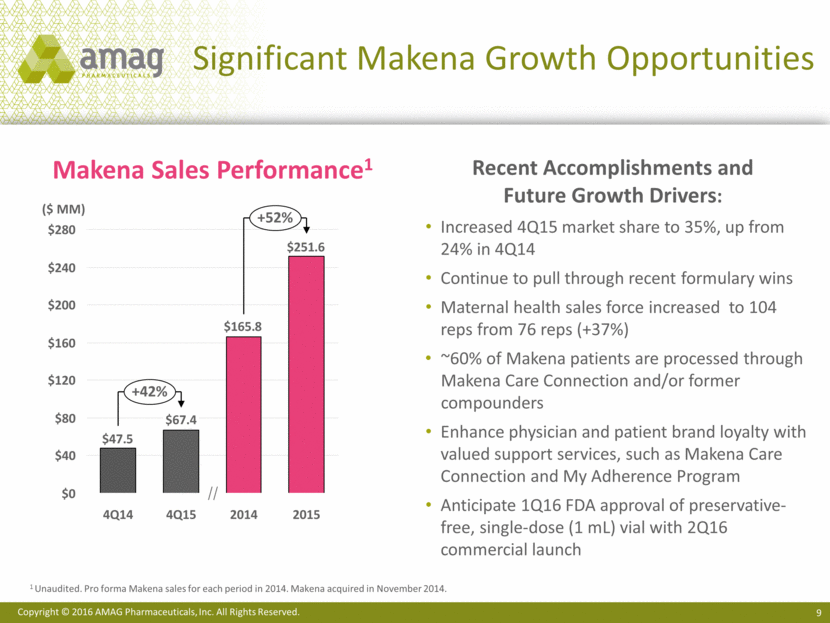
Recent Accomplishments and Future Growth Drivers: Increased 4Q15 market share to 35%, up from 24% in 4Q14 Continue to pull through recent formulary wins Maternal health sales force increased to 104 reps from 76 reps (+37%) ~60% of Makena patients are processed through Makena Care Connection and/or former compounders Enhance physician and patient brand loyalty with valued support services, such as Makena Care Connection and My Adherence Program Anticipate 1Q16 FDA approval of preservative-free, single-dose (1 mL) vial with 2Q16 commercial launch Makena Sales Performance1 Significant Makena Growth Opportunities 1 Unaudited. Pro forma Makena sales for each period in 2014. Makena acquired in November 2014. $120 $240 $200 $160 $280 $40 $0 $80 2015 +42% +52% 4Q15 $67.4 2014 4Q14 ($ MM) $251.6 $165.8 $47.5
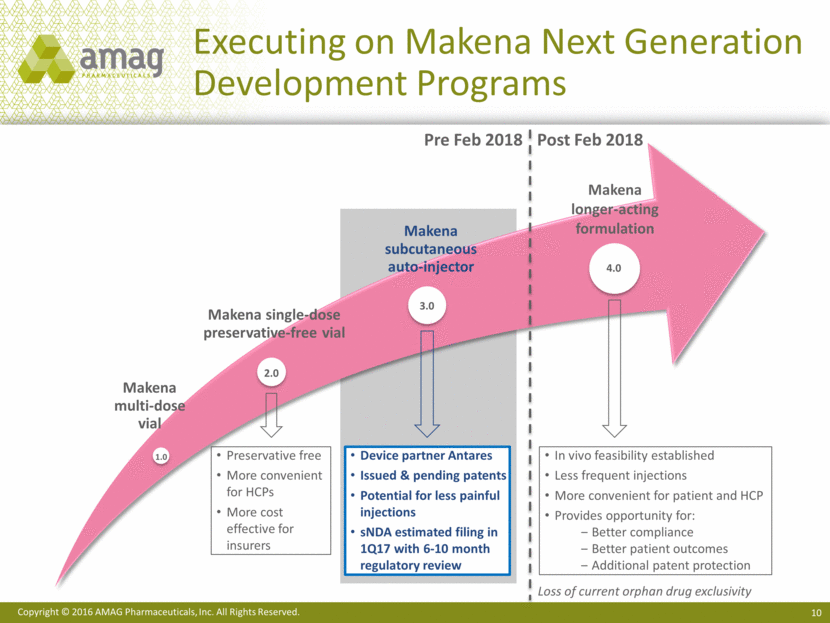
Executing on Makena Next Generation Development Programs Makena longer-acting formulation Pre Feb 2018 Post Feb 2018 Preservative free More convenient for HCPs More cost effective for insurers In vivo feasibility established Less frequent injections More convenient for patient and HCP Provides opportunity for: Better compliance Better patient outcomes Additional patent protection 1.0 2.0 3.0 4.0 Loss of current orphan drug exclusivity Device partner Antares Issued & pending patents Potential for less painful injections sNDA estimated filing in 1Q17 with 6-10 month regulatory review Makena multi-dose vial Makena single-dose preservative-free vial Makena subcutaneous auto-injector
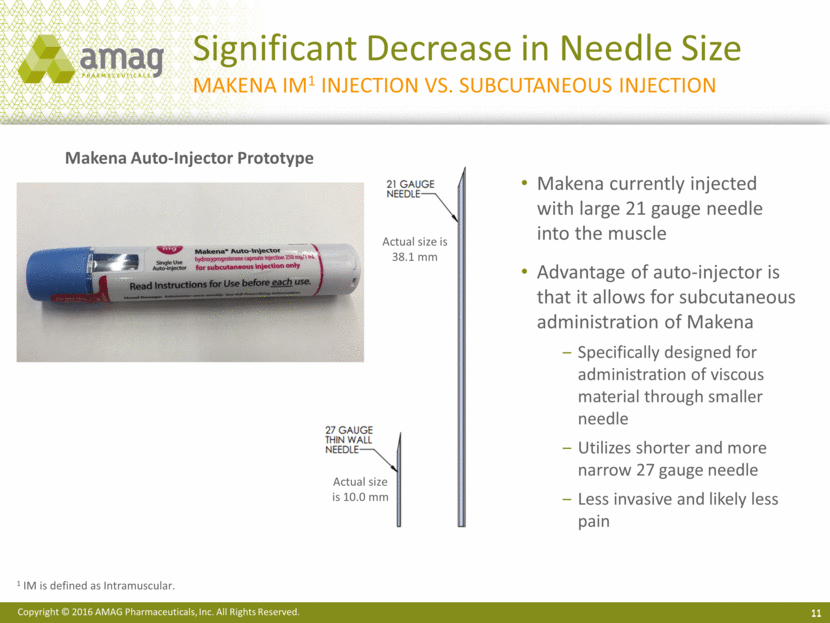
Significant Decrease in Needle Size 11 Makena IM1 Injection vs. subcutaneous injection Makena currently injected with large 21 gauge needle into the muscle Advantage of auto-injector is that it allows for subcutaneous administration of Makena Specifically designed for administration of viscous material through smaller needle Utilizes shorter and more narrow 27 gauge needle Less invasive and likely less pain 1 IM is defined as Intramuscular. Actual size is 10.0 mm Actual size is 38.1 mm Makena Auto-Injector Prototype
Favorable Physician Response to Makena Next Generation Products Physician’s Therapy Preferences Makena is the therapy of choice for at-risk women Respondents state that Makena is administered ~70% in-office, while ~30% administered at-home by nurse/care-giver Makena single-dose launch offers an opportunity to grow the Makena franchise Physicians indicate that 60% of new Makena utilization will come from patients currently on compounded product and 40% will come from patients currently untreated or on unapproved therapy Physicians indicate that the auto-injector is most attractive product for the Makena franchise (even if generic IM HPC enters market) Auto-injector preferred over IM, depot and/or oral forms of HPC Prefilled syringe and potentially less pain were most important attributes AMAG conducted market research of 271 healthcare providers in December 2015 (150 OB/GYNs; 44 MFM, 77 nurses)
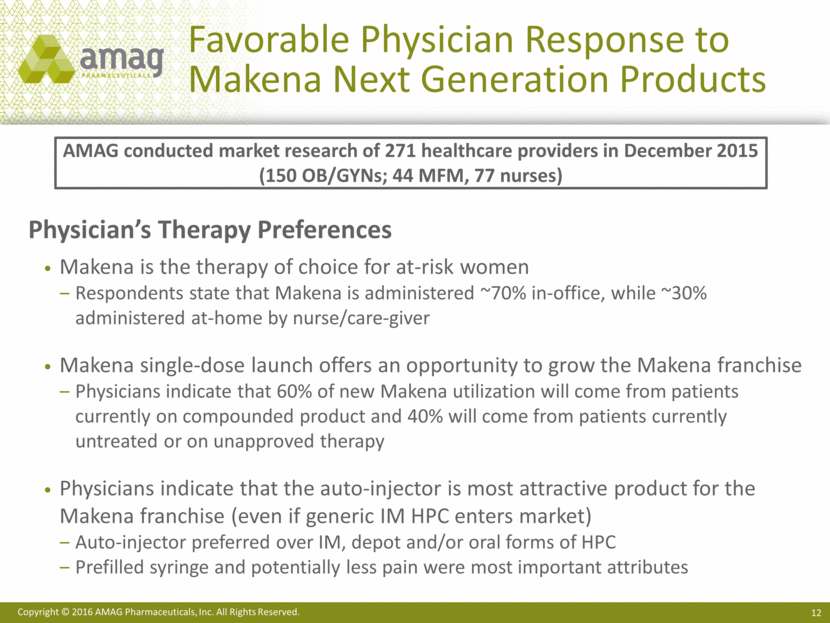
CBR: Unlocking the Potential Value of Newborn Stem Cells Recurring revenue with upside potential: Revenue model: One-time, upfront collection and processing fee On-going annual storage fees Strong brand recognition and customer loyalty 633,000+ units cumulatively stored <1% annual attrition rate Future growth drivers: More than doubled size of the sales force (47 to 104) Expands reach to more obstetricians, more frequently Pricing Scaling back on 2015 discount strategy Segmentation & pricing study to refine market growth strategies Range of current clinical uses and additional potential future medical applications for stem cells in regenerative medicine CBR Pro Forma Revenues (non-GAAP)1 $100 $0 $125 $25 $50 $75 $150 $118.6 2015 2014 4Q15 4Q14 ($ MM) 1 Unaudited. Non-GAAP CBR revenue for each period in 2014 and 2015 includes purchase accounting adjustments related to CBR deferred revenue of $1 MM (4Q14), $12 MM (4Q15), $4 MM (2014) and $22 MM (2015). Revenues shown are pro forma for the periods 4Q14, 2014 and 2015. Adds new Consumer marketing capability $126.8 $28.8 $31.4
Hematology / Oncology and Hospital

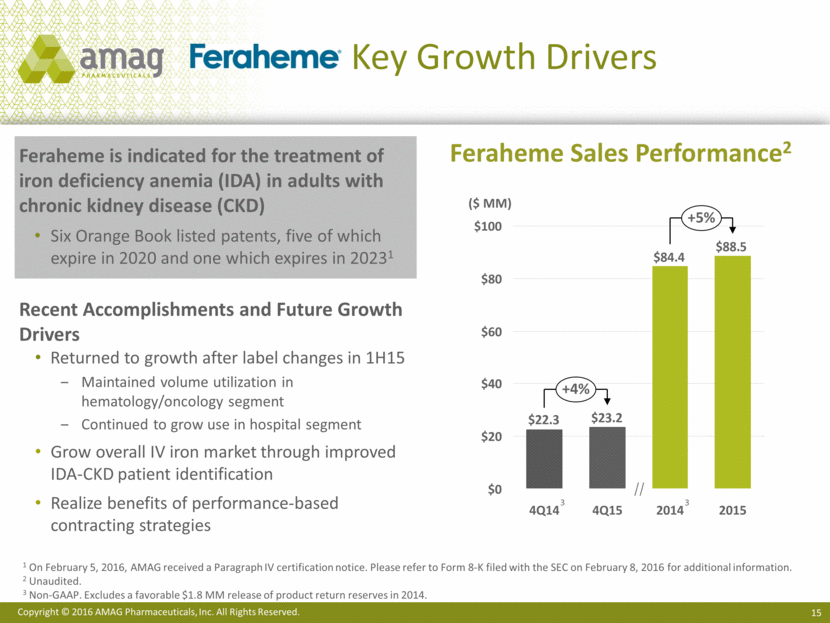
Key Growth Drivers Feraheme is indicated for the treatment of iron deficiency anemia (IDA) in adults with chronic kidney disease (CKD) Six Orange Book listed patents, five of which expire in 2020 and one which expires in 20231 Recent Accomplishments and Future Growth Drivers Returned to growth after label changes in 1H15 Maintained volume utilization in hematology/oncology segment Continued to grow use in hospital segment Grow overall IV iron market through improved IDA-CKD patient identification Realize benefits of performance-based contracting strategies Feraheme Sales Performance2 $100 $80 $20 $60 $40 $0 4Q15 +5% +4% 2015 2014 4Q14 ($ MM) 1 On February 5, 2016, AMAG received a Paragraph IV certification notice. Please refer to Form 8-K filed with the SEC on February 8, 2016 for additional information. 2 Unaudited. 3 Non-GAAP. Excludes a favorable $1.8 MM release of product return reserves in 2014. 3 3 $88.5 $84.4 $23.2 $22.3
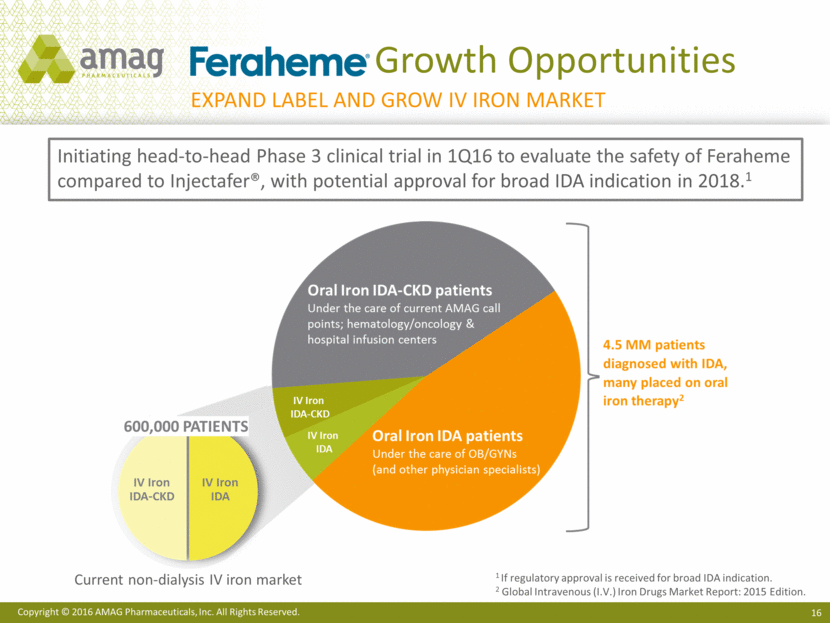
Growth Opportunities 1 If regulatory approval is received for broad IDA indication. 2 Global Intravenous (I.V.) Iron Drugs Market Report: 2015 Edition. Initiating head-to-head Phase 3 clinical trial in 1Q16 to evaluate the safety of Feraheme compared to Injectafer®, with potential approval for broad IDA indication in 2018.1 Expand label and grow IV iron market Current non-dialysis IV iron market
2016 Key Priorities

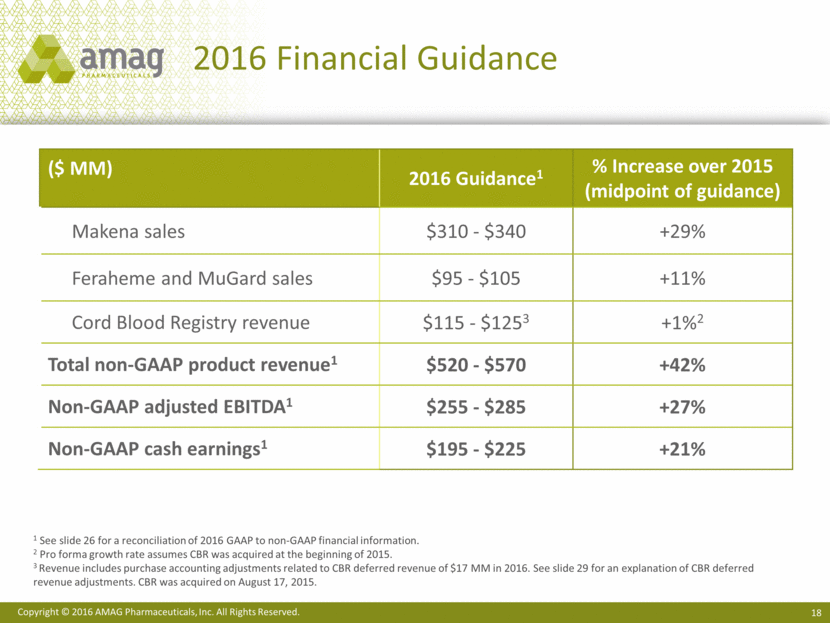
2016 Financial Guidance ($ MM) 2016 Guidance1 % Increase over 2015 (midpoint of guidance) Makena sales $310 - $340 +29% Feraheme and MuGard sales $95 - $105 +11% Cord Blood Registry revenue $115 - $1253 +1%2 Total non-GAAP product revenue1 $520 - $570 +42% Non-GAAP adjusted EBITDA1 $255 - $285 +27% Non-GAAP cash earnings1 $195 - $225 +21% 1 See slide 26 for a reconciliation of 2016 GAAP to non-GAAP financial information. 2 Pro forma growth rate assumes CBR was acquired at the beginning of 2015. 3 Revenue includes purchase accounting adjustments related to CBR deferred revenue of $17 MM in 2016. See slide 29 for an explanation of CBR deferred revenue adjustments. CBR was acquired on August 17, 2015.
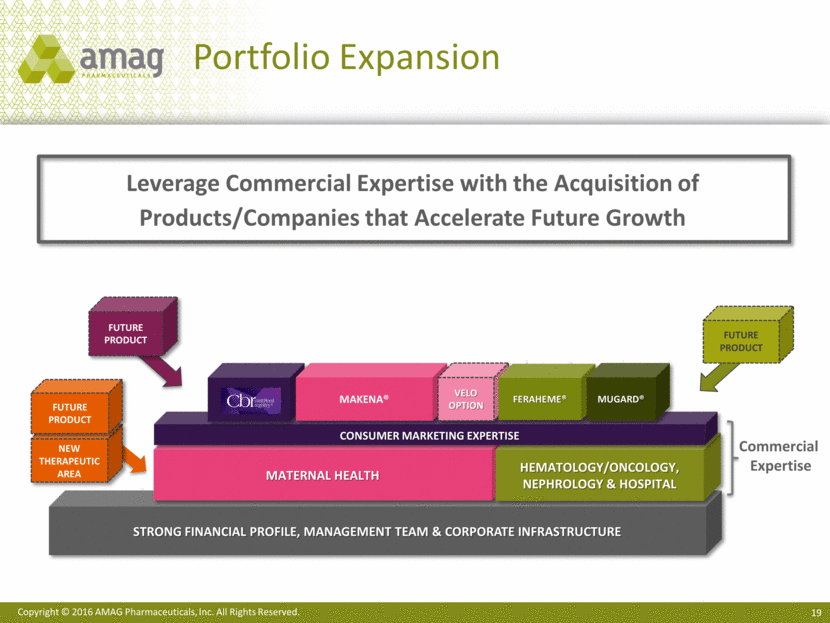
Leverage Commercial Expertise with the Acquisition of Products/Companies that Accelerate Future Growth Strong Financial profile, management team & corporate infrastructure FUTURE PRODUCT Maternal Health Hematology/Oncology, Nephrology & Hospital Consumer marketing expertise FUTURE PRODUCT CBR Commercial Expertise Makena® Velo Option Feraheme® MuGard® FUTURE PRODUCT New Therapeutic Area Portfolio Expansion
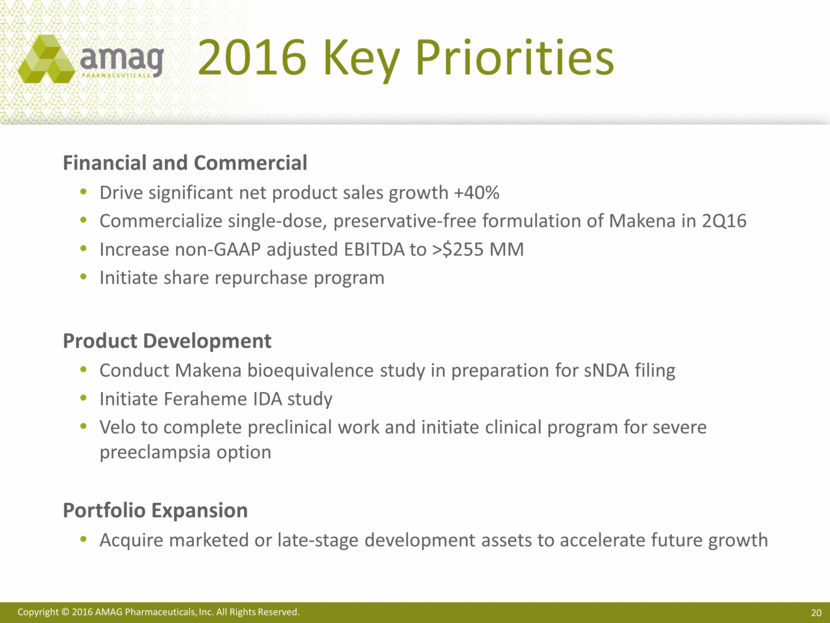
2016 Key Priorities Financial and Commercial Drive significant net product sales growth +40% Commercialize single-dose, preservative-free formulation of Makena in 2Q16 Increase non-GAAP adjusted EBITDA to >$255 MM Initiate share repurchase program Product Development Conduct Makena bioequivalence study in preparation for sNDA filing Initiate Feraheme IDA study Velo to complete preclinical work and initiate clinical program for severe preeclampsia option Portfolio Expansion Acquire marketed or late-stage development assets to accelerate future growth
AMAG Pharmaceuticals 4Q 2015 Financial Results February 17, 2016
AMAG Pharmaceuticals Appendix 4Q 2015 Financial Results February 17, 2016
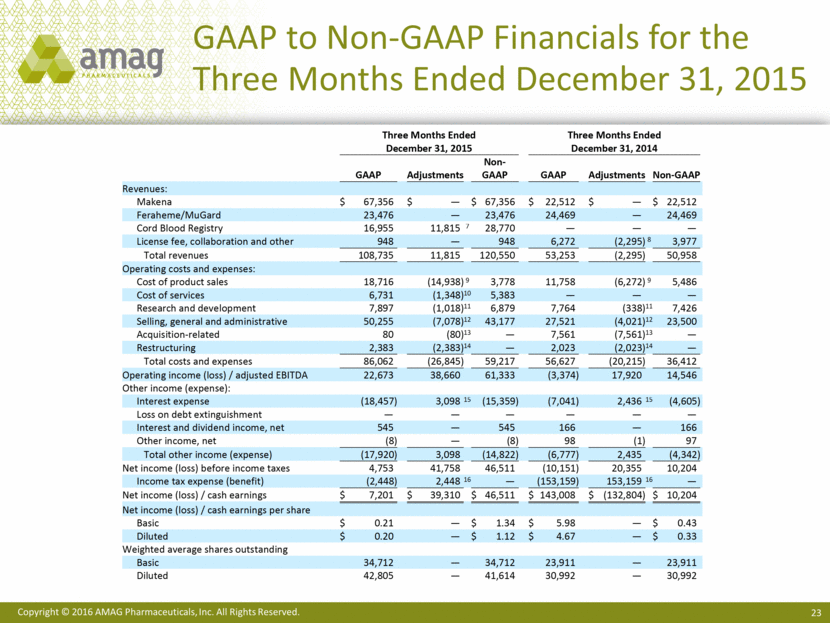
GAAP to Non-GAAP Financials for the Three Months Ended December 31, 2015 Three Months Ended Three Months Ended December 31, 2015 December 31, 2014 GAAP Adjustments Non - GAAP GAAP Adjustments Non - GAAP Revenues: Makena $ 67,356 $ — $ 67,356 $ 2 2,512 $ — $ 22,512 Feraheme/MuGard 23,476 — 23,476 24,469 — 24,469 Cord Blood Registry 16,955 11,815 7 28,770 — — — License fee, collaboration and other 948 — 948 6,272 (2,295) 8 3,977 Total revenues 108,735 11,815 120,550 53,253 (2,295) 50,958 Operating costs and expenses: Cost of product sales 18,716 (14,938) 9 3,778 11,758 (6,272) 9 5,486 Cost of services 6,731 (1,348) 10 5,383 — — — Research and development 7,897 (1,018) 11 6,879 7,764 (338) 11 7,426 Selling, general and administrative 50,255 (7,078) 12 43,177 27,521 (4,021) 12 23,500 Acquisition - related 80 (80) 13 — 7,561 (7,561) 13 — Restructuring 2,383 (2,383) 14 — 2,023 (2,023) 14 — Total costs and expenses 86,062 (26,845) 59,217 56,627 (20,215) 36,412 Opera ting income (loss) / adjusted EBITDA 22,673 38,660 61,333 (3,374) 17,920 14,546 Other income (expense): Interest expense (18,457) 3,098 15 (15,359) (7,041) 2,436 15 (4,605) Loss on debt extinguishment — — — — — — Interest and dividend income, net 545 — 545 166 — 166 Other income, net (8) — (8) 98 (1) 97 Total other income (expense) (17,920) 3,098 (14 ,822) (6,777) 2,435 (4,342) Net income (loss) before income taxes 4,753 41,758 46,511 (10,151) 20,355 10,204 Income tax expense (benefit) (2,448) 2,448 16 — (153,159) 153,159 16 — Net income ( loss) / cash earnings $ 7,201 $ 39,310 $ 46,511 $ 143,008 $ (132,804) $ 10,204 Net income (loss) / cash earnings per share Basic $ 0.21 — $ 1.34 $ 5.98 — $ 0.43 Diluted $ 0.20 — $ 1.12 $ 4.67 — $ 0.33 Weighted average shares outstanding Basic 34,712 — 34,712 23,911 — 23,911 Diluted 42,805 — 41,614 30,992 — 30,992
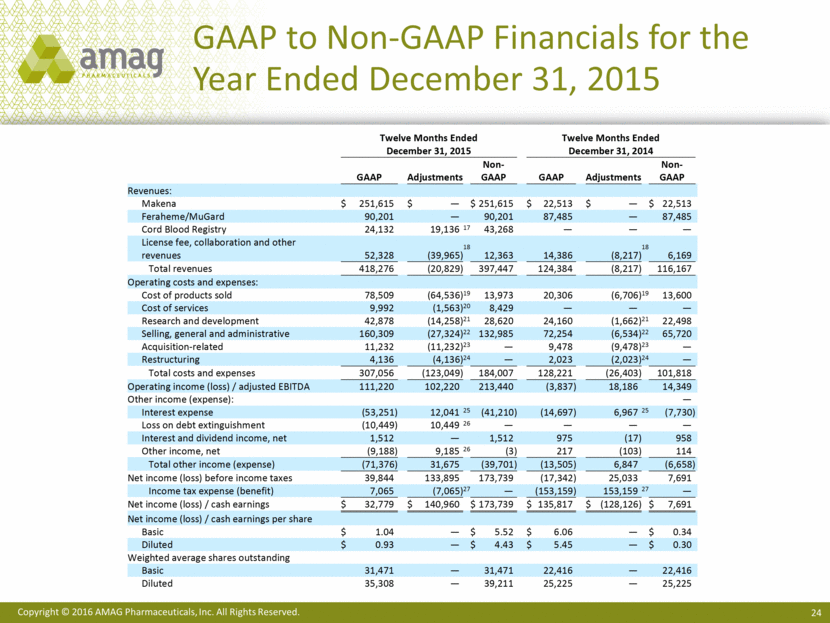
GAAP to Non-GAAP Financials for the Year Ended December 31, 2015 Twelve Months Ended Twelve Months Ended December 31, 2015 December 31, 2014 GAAP Adjustments Non - GAAP GAAP Adjustments Non - GAAP Revenues: Makena $ 251,615 $ — $ 251,615 $ 22,513 $ — $ 22,513 Feraheme/MuGard 90,201 — 90,201 87,485 — 87,485 Cord Blood Registry 24,132 19,136 17 43,268 — — — License fee, collaboration and other revenues 52,328 (39,965) 18 12,363 14,386 (8,217) 18 6,169 Total revenues 418,276 (20,829) 397,447 124,384 (8,217) 116,167 Operating costs and expenses: Cost of products sold 78,509 (64,5 36) 19 13,973 20,306 (6,706) 19 13,600 Cost of services 9,992 (1,563) 20 8,429 — — — Research and development 42,878 (14,258) 21 28,620 24,160 (1,662) 21 22,498 Selling, general and administr ative 160,309 (27,324) 22 132,985 72,254 (6,534) 22 65,720 Acquisition - related 11,232 (11,232) 23 — 9,478 (9,478) 23 — Restructuring 4,136 (4,136) 24 — 2,023 (2,023) 24 — Total costs a nd expenses 307,056 (123,049) 184,007 128,221 (26,403) 101,818 Operating income (loss) / adjusted EBITDA 111,220 102,220 213,440 (3,837) 18,186 14,349 Other income (expense): — Interes t expense (53,251) 12,041 25 (41,210) (14,697) 6,967 25 (7,730) Loss on debt extinguishment (10,449) 10,449 26 — — — — Interest and dividend income, net 1,512 — 1,512 975 (17) 958 O ther income, net (9,188) 9,185 26 (3) 217 (103) 114 Total other income (expense) (71,376) 31,675 (39,701) (13,505) 6,847 (6,658) Net income (loss) before income taxes 39,844 133,895 173,739 (17,342) 25,033 7,691 Income tax expense (benefit) 7,065 (7,065) 27 — (153,159) 153,159 27 — Net income (loss) / cash earnings $ 32,779 $ 140,960 $ 173,739 $ 135,817 $ (128,126) $ 7,691 Net income (loss) / ca sh earnings per share Basic $ 1.04 — $ 5.52 $ 6.06 — $ 0.34 Diluted $ 0.93 — $ 4.43 $ 5.45 — $ 0.30 Weighted average shares outstanding Basic 31,471 — 31,471 22,416 — 22,416 Diluted 35,308 — 39,211 25,225 — 25,225
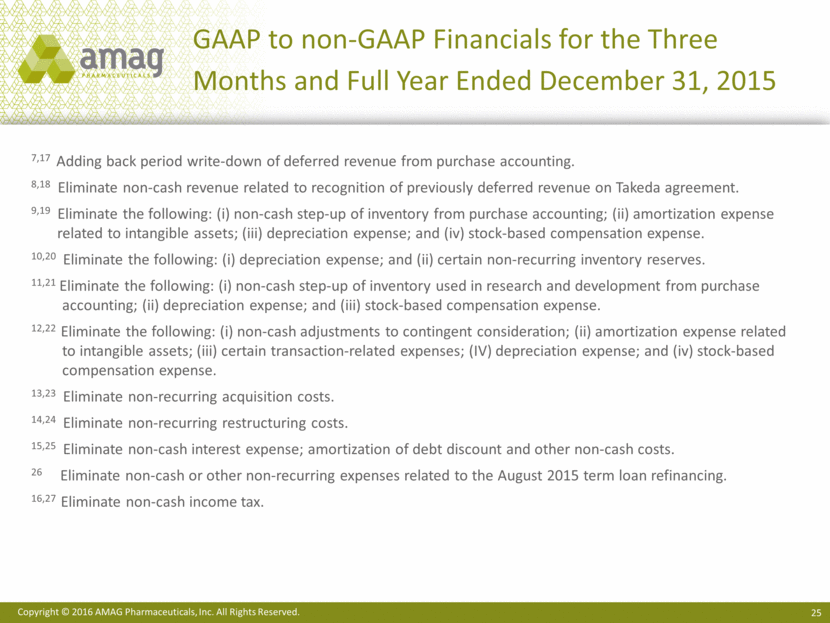
GAAP to non-GAAP Financials for the Three Months and Full Year Ended December 31, 2015 7,17 Adding back period write-down of deferred revenue from purchase accounting. 8,18 Eliminate non-cash revenue related to recognition of previously deferred revenue on Takeda agreement. 9,19 Eliminate the following: (i) non-cash step-up of inventory from purchase accounting; (ii) amortization expense related to intangible assets; (iii) depreciation expense; and (iv) stock-based compensation expense. 10,20 Eliminate the following: (i) depreciation expense; and (ii) certain non-recurring inventory reserves. 11,21 Eliminate the following: (i) non-cash step-up of inventory used in research and development from purchase accounting; (ii) depreciation expense; and (iii) stock-based compensation expense. 12,22 Eliminate the following: (i) non-cash adjustments to contingent consideration; (ii) amortization expense related to intangible assets; (iii) certain transaction-related expenses; (IV) depreciation expense; and (iv) stock-based compensation expense. 13,23 Eliminate non-recurring acquisition costs. 14,24 Eliminate non-recurring restructuring costs. 15,25 Eliminate non-cash interest expense; amortization of debt discount and other non-cash costs. 26 Eliminate non-cash or other non-recurring expenses related to the August 2015 term loan refinancing. 16,27 Eliminate non-cash income tax.
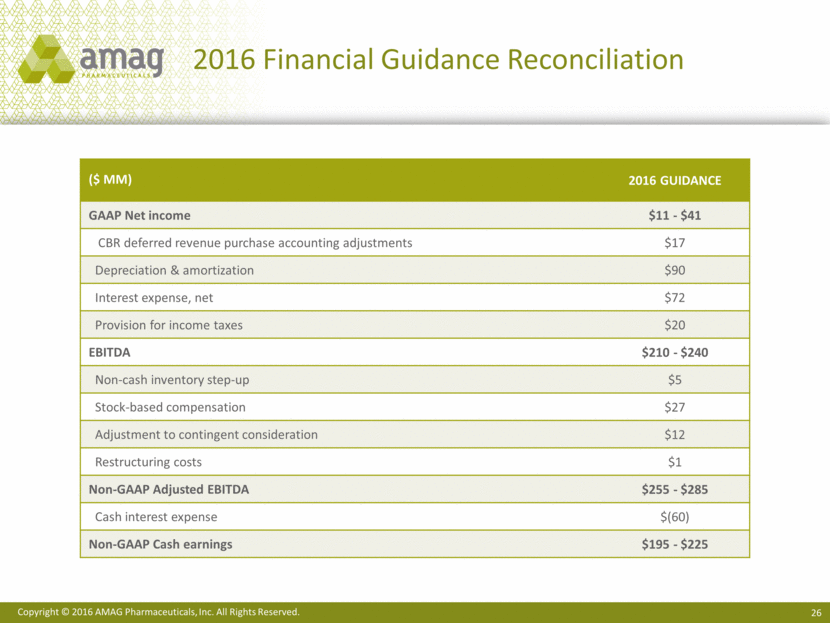
2016 Financial Guidance Reconciliation ($ MM) 2016 Guidance GAAP Net income $11 - $41 CBR deferred revenue purchase accounting adjustments $17 Depreciation & amortization $90 Interest expense, net $72 Provision for income taxes $20 EBITDA $210 - $240 Non-cash inventory step-up $5 Stock-based compensation $27 Adjustment to contingent consideration $12 Restructuring costs $1 Non-GAAP Adjusted EBITDA $255 - $285 Cash interest expense $(60) Non-GAAP Cash earnings $195 - $225
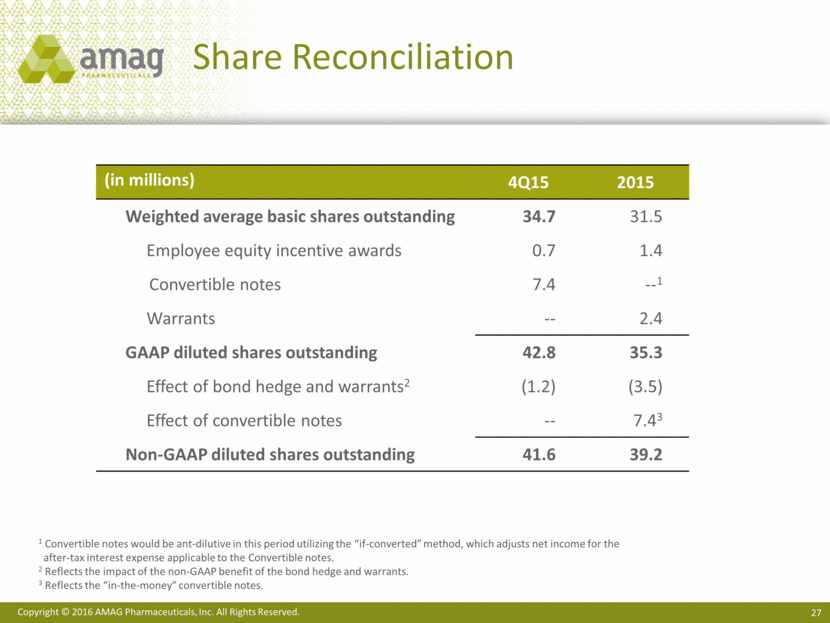
Share Reconciliation 1 Convertible notes would be ant-dilutive in this period utilizing the “if-converted” method, which adjusts net income for the after-tax interest expense applicable to the Convertible notes. 2 Reflects the impact of the non-GAAP benefit of the bond hedge and warrants. 3 Reflects the “in-the-money” convertible notes. (in millions) 4Q15 2015 Weighted average basic shares outstanding 34.7 31.5 Employee equity incentive awards 0.7 1.4 Convertible notes 7.4 --1 Warrants -- 2.4 GAAP diluted shares outstanding 42.8 35.3 Effect of bond hedge and warrants2 (1.2) (3.5) Effect of convertible notes -- 7.43 Non-GAAP diluted shares outstanding 41.6 39.2
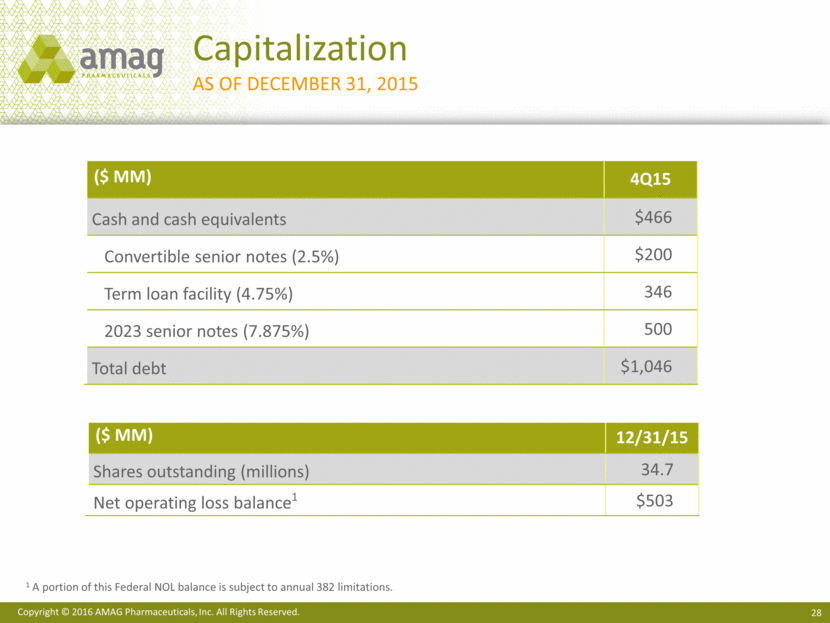
($ MM) 4Q15 Cash and cash equivalents $466 Convertible senior notes (2.5%) $200 Term loan facility (4.75%) 346 2023 senior notes (7.875%) 500 Total debt $1,046 Capitalization As of December 31, 2015 ($ MM) 12/31/15 Shares outstanding (millions) 34.7 Net operating loss balance1 $503 1 A portion of this Federal NOL balance is subject to annual 382 limitations.
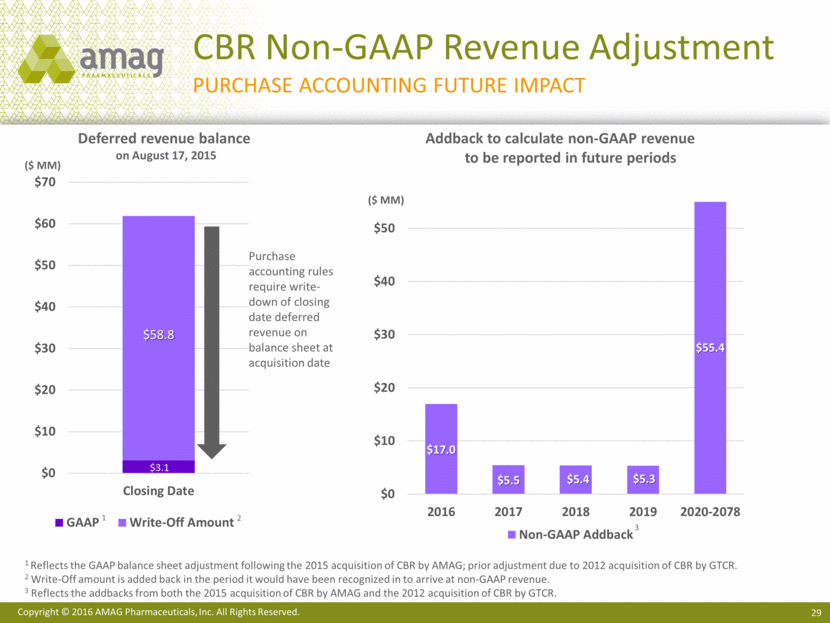
CBR Non-GAAP Revenue Adjustment Purchase accounting future impact Deferred revenue balance on August 17, 2015 Addback to calculate non-GAAP revenue to be reported in future periods ($ MM) Purchase accounting rules require write-down of closing date deferred revenue on balance sheet at acquisition date 1 Reflects the GAAP balance sheet adjustment following the 2015 acquisition of CBR by AMAG; prior adjustment due to 2012 acquisition of CBR by GTCR. 2 Write-Off amount is added back in the period it would have been recognized in to arrive at non-GAAP revenue. 3 Reflects the addbacks from both the 2015 acquisition of CBR by AMAG and the 2012 acquisition of CBR by GTCR. ($ MM) 1 2 3 $3.1 $58.8 $0 $10 $20 $30 $40 $50 $60 $70 Closing Date GAAP Write-Off Amount $17.0 $5.5 $5.4 $5.3 $55.4 $0 $10 $20 $30 $40 $50 2016 2017 2018 2019 2020-2078 Non-GAAP Addback
AMAG Pharmaceuticals 4Q 2015 Financial Results February 17, 2016
