Attached files
| file | filename |
|---|---|
| EX-23.1 - EX-23.1 - ZILLOW GROUP, INC. | d78539dex231.htm |
| EX-31.1 - EX-31.1 - ZILLOW GROUP, INC. | d78539dex311.htm |
| EX-31.2 - EX-31.2 - ZILLOW GROUP, INC. | d78539dex312.htm |
| EX-32.1 - EX-32.1 - ZILLOW GROUP, INC. | d78539dex321.htm |
| EX-21.1 - EX-21.1 - ZILLOW GROUP, INC. | d78539dex211.htm |
| EX-32.2 - EX-32.2 - ZILLOW GROUP, INC. | d78539dex322.htm |
Table of Contents
UNITED STATES
SECURITIES AND EXCHANGE COMMISSION
Washington, D.C. 20549
Form 10-K
| x | ANNUAL REPORT PURSUANT TO SECTION 13 OR 15(d) OF THE SECURITIES EXCHANGE ACT OF 1934 |
For the fiscal year ended December 31, 2015
OR
| ¨ | TRANSITION REPORT PURSUANT TO SECTION 13 OR 15(d) OF THE SECURITIES EXCHANGE ACT OF 1934 |
Commission File Number 001-36853
ZILLOW GROUP, INC.
(Exact name of registrant as specified in its charter)
| Washington | 47-1645716 | |
| (State or other jurisdiction of incorporation or organization) |
(IRS Employer Identification No.) | |
| 1301 Second Avenue, Floor 31, Seattle, Washington |
98101 | |
| (Address of principal executive offices) | (Zip code) |
(206) 470-7000
@ZillowGroup
(Registrant’s telephone number, including area code)
Securities registered pursuant to Section 12(b) of the Act:
| Class A Common Stock, par value $0.0001 per share | The Nasdaq Global Select Market | |
| Class C Capital Stock, par value $0.0001 per share | The Nasdaq Global Select Market | |
| (Title of each class) | (Name of each exchange on which registered) |
Securities registered pursuant to Section 12(g) of the Act:
None
Indicate by check mark whether the registrant is a well-known seasoned issuer, as defined in Rule 405 of the Securities Act: Yes x No ¨
Indicate by check mark whether the registrant is not required to file reports pursuant to Section 13 or 15(d) of the Act: Yes ¨ No x
Indicate by check mark whether the registrant (1) has filed all reports required to be filed by Section 13 or 15(d) of the Securities Exchange Act of 1934 during the preceding 12 months (or for such shorter period that the registrant was required to file such reports), and (2) has been subject to such filing requirements for the past 90 days. Yes x No ¨
Indicate by check mark whether the registrant has submitted electronically and posted on its corporate Web site, if any, every Interactive Data File required to be submitted and posted pursuant to Rule 405 of Regulation S-T during the preceding 12 months (or for such shorter period that the registrant was required to submit and post such files). Yes x No ¨
Indicate by check mark if disclosure of delinquent filers pursuant to Item 405 of Regulation S-K is not contained herein, and will not be contained, to the best of registrant’s knowledge, in definitive proxy or information statements incorporated by reference in Part III of this Form 10-K or any amendment to this Form 10-K. ¨
Indicate by check mark whether the registrant is a large accelerated filer, an accelerated filer, a non-accelerated filer, or a smaller reporting company. See the definitions of “large accelerated filer,” “accelerated filer” and “smaller reporting company” in Rule 12b-2 of the Exchange Act. (Check one):
| Large accelerated filer | x | Accelerated filer | ¨ | |||
| Non-accelerated filer | ¨ (Do not check if a smaller reporting company) | Smaller reporting company | ¨ | |||
Indicate by check mark whether the registrant is a shell company (as defined in Rule 12b-2 of the Act): Yes ¨ No x
As of June 30, 2015, the last business day of the Registrant’s most recently completed second fiscal quarter, the aggregate market value of the Registrant’s Class A common stock held by non-affiliates based upon the closing price of such shares on The Nasdaq Global Select Market on such date was $4,380,916,635. No shares of the Registrant’s Class C capital stock were outstanding as of June 30, 2015.
As of February 4, 2016, 53,320,939 shares of the Registrant’s Class A common stock, 6,217,447 shares of Class B common stock and 118,992,759 shares of Class C capital stock were outstanding.
DOCUMENTS INCORPORATED BY REFERENCE
The information required by Part III of this Report, to the extent not set forth herein, is incorporated in this Report by reference to the Registrant’s definitive proxy statement relating to the 2016 annual meeting of shareholders. The definitive proxy statement will be filed with the Securities and Exchange Commission within 120 days after the end of the 2015 fiscal year.
Table of Contents
ZILLOW GROUP, INC.
Annual Report on Form 10-K
for the Fiscal Year Ended December 31, 2015
| Page | ||||||
| PART I | ||||||
| Item 1. |
5 | |||||
| Item 1A. |
20 | |||||
| Item 1B. |
36 | |||||
| Item 2. |
36 | |||||
| Item 3. |
37 | |||||
| Item 4. |
39 | |||||
| PART II | ||||||
| Item 5. |
40 | |||||
| Item 6. |
43 | |||||
| Item 7. |
Management’s Discussion and Analysis of Financial Condition and Results of Operations |
45 | ||||
| Item 7A. |
76 | |||||
| Item 8. |
78 | |||||
| Item 9. |
Changes in and Disagreements with Accountants on Accounting and Financial Disclosure |
126 | ||||
| Item 9A. |
126 | |||||
| Item 9B. |
128 | |||||
| PART III | ||||||
| Item 10. |
129 | |||||
| Item 11. |
129 | |||||
| Item 12. |
Security Ownership of Certain Beneficial Owners and Management and Related Stockholder Matters |
129 | ||||
| Item 13. |
Certain Relationships and Related Transactions, and Director Independence |
129 | ||||
| Item 14. |
129 | |||||
| PART IV | ||||||
| Item 15. |
130 | |||||
| 131 | ||||||
Table of Contents
As used in this Annual Report on Form 10-K, the terms “Zillow Group,” “the Company,” “we,” “us” and “our” refer to Zillow Group, Inc., unless the context indicates otherwise.
NOTE REGARDING FORWARD-LOOKING STATEMENTS
This Annual Report on Form 10-K, including the sections entitled “Management’s Discussion and Analysis of Financial Condition and Results of Operations,” “Risk Factors” and “Business,” contains forward-looking statements based on our management’s beliefs and assumptions and on information currently available to our management. Forward-looking statements include all statements that are not historical facts and generally may be identified by terms such as “believe,” “may,” “will,” “estimate,” “continue,” “anticipate,” “intend,” “could,” “would,” “project,” “plan,” “expect” or the negative or plural of these words or similar expressions.
These forward-looking statements are subject to a number of risks, uncertainties and assumptions, including those risks, uncertainties and assumptions described in Part I, Item 1A (Risk Factors) of this report. Moreover, we operate in a very competitive and rapidly changing environment. New risks emerge from time to time. It is not possible for our management to predict all risks, nor can we assess the effect of all factors on our business or the extent to which any factor, or combination of factors, may cause actual results to differ materially from those contained in any forward-looking statements we may make. In light of these risks, uncertainties and assumptions, the forward-looking events and circumstances discussed in this report may not occur and actual results could differ materially and adversely from those anticipated or implied in the forward-looking statements.
You should not rely on forward-looking statements as predictions of future events. Although we believe that the expectations reflected in the forward-looking statements are reasonable, we cannot guarantee that the future results, levels of activity, performance or events and circumstances reflected in the forward-looking statements will be achieved or occur. Moreover, except as required by law, neither we nor any other person assumes responsibility for the accuracy and completeness of the forward-looking statements, and we undertake no obligation to update publicly any forward-looking statements for any reason after the date of this report to conform these statements to actual results or to changes in our expectations.
4
Table of Contents
PART I
Mission
Our mission is to build the world’s largest, most trusted and vibrant real estate marketplace.
Overview
Zillow Group, Inc. operates the leading real estate and home-related information marketplaces on mobile and the Web, with a complementary portfolio of brands and products to help people find vital information about homes and connect with local professionals. Zillow Group’s brands focus on all stages of the home lifecycle: renting, buying, selling, financing and home improvement. The Zillow Group portfolio of consumer brands includes real estate and rental marketplaces Zillow, Trulia, StreetEasy and HotPads. In addition, Zillow Group provides advertising services to tens of thousands of real estate agents and rental and mortgage professionals, helping maximize business opportunities and connect to millions of consumers. We also own and operate a number of brands that offer technology solutions to real estate, rental and mortgage professionals, including DotLoop, Mortech, Diverse Solutions and Retsly. Zillow was incorporated as a Washington corporation in December 2004, and we launched the initial version of our website, Zillow.com, in February 2006. Zillow Group was incorporated as a Washington corporation in July 2014 in connection with our acquisition of Trulia. Upon the closing of the Trulia acquisition in February 2015, each of Zillow and Trulia became wholly owned subsidiaries of Zillow Group.
Our living database of more than 110 million U.S. homes—homes for sale, homes for rent and homes not currently on the market—attracts an active and vibrant community of users. Individuals and businesses that use Zillow Group’s mobile applications and websites have updated information on more than 60 million homes and added more than 370 million home photos, creating exclusive home profiles not available anywhere else. These profiles include detailed information about homes, including property facts, listing information and purchase and sale data. We provide this information to our users where, when and how they want it, through our industry-leading mobile applications that enable consumers to access our information when they are curbside, viewing homes, and through our websites. Using complex, proprietary automated valuation models, we provide current home value estimates, or Zestimates, and current rental price estimates, or Rent Zestimates, on more than 100 million U.S. homes.
Consumers increasingly are turning to the Internet and mobile devices for real estate information. For the three months ended December 31, 2015, 123.7 million average monthly unique users visited Zillow Group’s mobile applications and websites, representing year-over-year growth of 61%. For additional information regarding key growth drivers, see “Key Growth Drivers” in the “Management’s Discussion and Analysis of Financial Condition and Results of Operations.” More than 65% of Zillow’s traffic now comes from a mobile device; on weekends it’s more than 70%. We operate the most popular suite of mobile real estate applications across all major mobile platforms. For example, on our flagship Zillow brand, during December 2015, more than 440 million homes were viewed on Zillow on a mobile device, or 165 homes per second. We monetize our marketplace business on mobile in the same way we do on our web platform.
Real estate, rental, mortgage and home improvement professionals are a critical part of home-related marketplaces. We have created a trusted and transparent marketplace where consumers can search and read reviews on local real estate, rental, mortgage and home improvement professionals and contact those professionals on their own terms.
Our home-related marketplaces benefit from network effects. As more consumers come to our mobile applications and websites to use our products and services, more real estate, rental, mortgage and home improvement professionals contribute content to distinguish themselves, thereby making our marketplaces more useful and attracting additional consumers.
5
Table of Contents
Our revenue has grown significantly since our initial website launch in 2006. For the year ended December 31, 2015, we generated revenue of $644.7 million, as compared to $325.9 million for the year ended December 31, 2014, an increase of 98%. We generate revenue from the sale of advertising services and our suite of tools to businesses and professionals primarily associated with the real estate, rental and mortgage industries. These professionals include local real estate and rental professionals, mortgage professionals and brand advertisers. Our two revenue categories are marketplace revenue and display revenue.
Marketplace revenue for the year ended December 31, 2015 consisted of real estate, mortgages, and Market Leader revenue. Real estate revenue primarily includes revenue from the sale of advertising services and a suite of tools to real estate professionals, as well as revenue generated by Zillow Group Rentals, which includes our rentals marketplace and suite of tools for rental professionals. Mortgages revenue primarily includes advertising sold to mortgage lenders and other mortgage professionals, as well as revenue generated by Mortech, which provides subscription-based mortgage software solutions, including a product and pricing engine and lead management platform. Market Leader revenue primarily includes revenue from the sale of a comprehensive premium software-as-a-service based marketing product typically sold to real estate professionals as a bundle of products under a fixed fee subscription. Market Leader revenue is included in our results of operations from February 17, 2015 through the date of divestiture of September 30, 2015.
Display revenue primarily consists of graphical mobile and web advertising sold on a cost per thousand impressions (“CPM”) or cost-per-click (“CPC”) basis to advertisers promoting their brands on our mobile applications and websites and our partner websites. Impressions are delivered when a sold advertisement appears on pages viewed by users of our mobile applications and websites.
Acquisition of Trulia, Inc.
Effective February 17, 2015, pursuant to the Agreement and Plan of Merger dated as of July 28, 2014 (the “Merger Agreement”) by and among Zillow, Inc. (“Zillow”), Zillow Group, and Trulia, Inc. (“Trulia”), Zillow Group acquired Trulia, and Zillow and Trulia became wholly owned subsidiaries of Zillow Group. Upon completion of the acquisition, each outstanding share of Class A common stock of Zillow was converted into the right to receive one share of fully paid and nonassessable Class A common stock of Zillow Group, each outstanding share of Class B common stock of Zillow was converted into the right to receive one share of fully paid and nonassessable Class B common stock of Zillow Group, and each outstanding share of Trulia common stock was converted into the right to receive 0.444 of a share of fully paid and nonassessable Class A Common Stock of Zillow Group.
The total purchase price of Trulia was approximately $2.0 billion. We have included Trulia’s results of operations prospectively after February 17, 2015, the date of acquisition. For additional information regarding the transaction with Trulia, see Note 7 to our consolidated financial statements.
On February 17, 2015, in connection with the acquisition, Zillow Group undertook a restructuring plan that resulted in a total workforce reduction of nearly 350 employees, primarily to eliminate overlapping positions in the sales and marketing functions related to Trulia’s workforce at its Bellevue, Denver, New York and San Francisco locations. The restructuring plan is a result of the integration of Trulia’s business and operations with and into Zillow Group’s business. Employees directly affected by the restructuring plan were provided with severance payments, stock vesting acceleration and outplacement assistance. For additional information regarding the restructuring, see Note 18 to our consolidated financial statements.
6
Table of Contents
Industry Dynamics
The Importance of Homes
Homes are the center of peoples’ lives, the focus of some of their most important decisions and often their most valuable assets. In addition to whether to buy, sell or rent, consumers make many other important home-related decisions throughout their lifetimes, including decisions relating to refinancing or home equity loans, home maintenance and home improvement. Residential real estate is one of the largest sectors of the U.S. economy and supports millions of professionals that provide services related to home purchases and sales, rentals, home financings, and home maintenance and improvement.
Large Market Opportunities
Based on external and internal assessments, we believe our current addressable markets include the following:
Purchase and Sale—Sales of approximately 5.3 million existing and 490 thousand new homes in the United States in 2015 had an aggregate transaction value of approximately $1.6 trillion, according to data published in 2015 by the U.S. Census Bureau and in 2016 by the National Association of REALTORS®. There are approximately 1.9 million licensed real estate professionals in the United States, according to data published in 2012, 2013 and 2014 by the Association of Real Estate License Law Officials. In an effort to acquire new client relationships and sell homes, U.S. real estate agents and brokers spent an estimated $8.9 billion on residential advertising in 2015, according to a forecast from Borrell Associates released in 2016. In addition, U.S. real estate developers spent an estimated $1.7 billion on residential advertising in 2015, also according to a forecast from Borrell Associates released in 2016. In the United States, there are 205 million people residing in owner-occupied housing, according to data published by the U.S. Census Bureau in November 2015. Approximately 29% of movers in 2015, or 10.5 million people, were homeowners, according to the U.S. Census Bureau migration data published in November 2015.
Rentals—In the third quarter of 2015, there were approximately 46.0 million rental housing units in the United States, with a national vacancy rate of 7.3%, according to data published by the U.S. Census Bureau in October 2015. According to data published by the U.S. Census Bureau from the American Housing Survey and the Current Population Survey/Housing Vacancy Survey, approximately:
| • | 9.0% of rental units (4.1 million) are located in buildings with 50 or more units; |
| • | 8.5% of rental units (3.9 million) are located in buildings with 20 to 49 units; |
| • | 12.0% of rental units (5.5 million) are located in buildings with 10 to 19 units; |
| • | 12.6% of rental units (5.8 million) are located in buildings with 5 to 9 units; |
| • | 19.1% of rental units (8.8 million) are located in small multi-family structures of 2-4 units; |
| • | 38.8% of rental units (17.8 million) are 1-unit structures. |
According to a forecast from Borrell Associates released in 2016, U.S. rental property managers spent an estimated $3.5 billion on advertising in 2015, which excludes lease concessions. In the United States, there are 107.6 million people residing in rental housing units, according to data published by the U.S. Census Bureau in 2015. Approximately 71% of movers in 2015, or 25.9 million people, were renters, according to the U.S. Census Bureau migration data published in November 2015.
Home Financing—According to a forecast from the Mortgage Bankers Association published in January 2016, approximately $1.5 trillion in U.S. residential mortgage originations occurred in 2015. U.S. residential mortgage providers spent approximately $4.4 billion in 2015 marketing their services and loan products to mortgage borrowers, according to a forecast from Borrell Associates released in 2016.
7
Table of Contents
Home Maintenance and Improvement—Spending on home improvements and repairs totaled $298 billion in 2013, according to the Joint Center for Housing Studies of Harvard University in a January 2015 report. As noted in the report, 82% of home improvement and repair spending was on owner-occupied homes, with the remainder on rental units. Spending on advertising by the home improvement industry was approximately $10.9 billion in 2014, according to data presented in industry research reports from IBISWorld Inc. released in 2014.
Highly Fragmented, Local and Complex Market
The market for residential real estate transactions and home-related services is highly fragmented, local and complex. Each home has unique characteristics, including location, value, size, style, age and condition. Each consumer approaches home-related transactions with a personal set of objectives, priorities and values. Real estate agents generally operate in local markets as independent contractors with different experiences and skills. These conditions create challenges for consumers and real estate, rental, mortgage and home improvement professionals alike. Consumers are challenged to find information about homes and to find real estate, rental, mortgage and home improvement professionals who fit their individual needs. Real estate, rental, mortgage and home improvement professionals are challenged to efficiently advertise their services and identify new clients, and to measure the effectiveness of their marketing efforts.
Absence of Consumer Orientation
Historically, consumers had minimal access to comprehensive and objective residential real estate data, even though many home-related decisions are extraordinarily information-intensive. While real estate, rental, mortgage and home improvement professionals had some data, consumers did not have free, independent and easy access to data. Even when accessible, the data were difficult to interpret and analyze.
Increasing Role of Mobile Technologies and the Internet
Consumers are increasingly turning to mobile devices and the Internet to access real estate information. With the widespread adoption of mobile and location-based technologies, consumers increasingly expect home-related information to be available on their mobile devices where, when and how they want it. More than 65% of Zillow’s traffic now comes from a mobile device; on weekends it’s more than 70%. We believe that the technological platform shift from desktop computers to mobile devices benefits technology leaders like Zillow Group that are quick to innovate.
Competitive Advantages
We believe we have the following competitive advantages:
| • | Powerful Brand and Scale. We have established a powerful brand identity that includes a portfolio of the largest and most vibrant brands, and we have built a large user community. The majority of our traffic comes direct, not dependent on search engines, with demonstrated consumer intent to visit Zillow Group’s brands. During the three months ended December 31, 2015, our traffic grew to 123.7 million average monthly unique users, an increase of 61% compared to the three months ended December 31, 2014. For additional information regarding key growth drivers, see “Key Growth Drivers” in the “Management’s Discussion and Analysis of Financial Condition and Results of Operations.” |
| • | Inimitable Database of Homes. Our living database of homes is the result of years of substantial investment, sophisticated economic and statistical analysis, complex data aggregation and millions of user contributions. Our dynamic and comprehensive living database includes detailed information on more than 110 million U.S. homes, and includes homes for sale, for rent and recently sold, as well as properties not currently on the market. This database is central to the value we provide to consumers and real estate, rental, mortgage and home improvement professionals. It contains extensive |
8
Table of Contents
| information that users can search, through an easy-to-use interface, to identify, analyze and compare homes. Our database is relevant to a broad range of users, including buyers, sellers, renters, homeowners, real estate agents and other real estate professionals. It includes information such as: |
| • | Property facts: Zestimate and its corresponding value range, number of bedrooms, number of bathrooms, square footage, lot size, assessed tax value and property type such as single-family, condominium, apartment, multifamily, manufactured home or land. |
| • | Listing information: price, price history and reductions, dollars per square foot, days on the market, listing type (such as for sale by agent, for sale by owner, pre-market inventory, which includes foreclosure, pre-foreclosure, Coming Soon and Make Me Move listings, new construction and rental homes), open houses, property photos and estimated monthly mortgage payment. |
| • | Purchase and sale data: prior sales information and recent sales nearby. |
We synthesize data from hundreds of automated feeds, representing information from tens of thousands of public and private sources. Applying extensive computer analytics to the data, we transform it into information that is accessible, understandable and useful.
We refer to the database as “living” because the information is continually updated by the combination of our proprietary algorithms, synthesis of third-party data from hundreds of sources, and through improvements by us and, importantly, by our community of users. User-generated content from owners, agents and others enriches our database with photos and additional property information. Individuals and businesses that use Zillow’s mobile applications and websites have updated information on more than 60 million homes in our database and added more than 370 million home photos, creating exclusive home profiles not available anywhere else. Our inimitable database enables us to create content, products and services not available anywhere else, and attracts an active, vibrant community of users. As of December 31, 2015, we had published more than 1.8 million reviews, including more than 1.5 million reviews of local real estate agents and more than 210,000 reviews of mortgage professionals submitted by our users on Zillow. In addition, our users had submitted more than one million questions and answers in our discussion forum, Zillow Advice. Zillow Advice and Trulia Voices allow consumers to ask questions of real estate, rental, mortgage and home improvement professionals and other consumers and quickly learn more about homes and real estate topics of interest. In particular, many of our dedicated active contributors devote substantial time sharing their expertise about Zillow and the real estate market on Zillow Advice and Trulia Voices. Real estate, rental, mortgage and home improvement professionals who participate in Zillow Advice and Trulia Voices play a key role in helping to educate consumers, and benefit from exposure to consumers and resulting referrals.
| • | Zestimates and Rent Zestimates. We have developed industry-leading automated home valuation models that use advanced statistical methods and complex, proprietary algorithms. We use these models to provide current home value estimates, or Zestimates, and current rental price estimates, or Rent Zestimates, on more than 100 million U.S. homes. Based on our Zestimates, we produce Zillow Home Value Indexes at the neighborhood, zip code, city, metropolitan statistical area, county and national levels. Our Zillow Home Value Indexes have been cited by government entities such as the Federal Reserve Bank and the Congressional Oversight Panel, university studies and respected national publications. For historical comparisons, we provide up to 15 years of Zestimate history on each home and valuable information about property and real estate market trends. Our Zestimates, Rent Zestimates and Zillow Home Value Indexes allow consumers to evaluate homes and neighborhoods, and to easily evaluate historical trends, as they contemplate critical home-related decisions. |
| • | Mobile Leadership and Monetization. Shopping for a home is a far more meaningful consumer experience when it occurs curbside, untethered and on location, so we have developed and operate the most popular suite of mobile real estate applications across all major platforms. For example, on our |
9
Table of Contents
| flagship Zillow brand, during December 2015, more than 440 million homes, or 165 homes per second, were viewed on Zillow on a mobile device. More than 65% of Zillow’s traffic now comes from a mobile device; on weekends it’s more than 70%. Zillow Group’s suite of mobile applications includes 47 distinct real estate, rental, mortgage and home improvement applications that enable people to access and analyze information where, when and how they want it. We monetize our marketplace business on our mobile platform in the same way we do on our web platform. |
| • | Independent Market Positions and Consumer Focus. Zillow Group has been built independent of any real estate industry group. We maintain an unwavering commitment to giving consumers free access to as much useful information as possible. We provide unbiased information, products and services, empowering consumers to make informed decisions about homes and the residential real estate market. We believe our independence enables us to create compelling products and services with broad consumer appeal. |
| • | Multiple Robust Home-Related Marketplaces. We have created trusted and transparent marketplaces in real estate, rentals, mortgages and home improvement where consumers can identify and connect with local professionals that are best suited to meet their needs. Our living database of homes provides a foundation on which we can build new consumer and professional marketplaces in other home-related categories. |
| • | Technology Solutions for Professionals. We offer a suite of marketing and technology solutions to help real estate, rental and mortgage professionals grow their businesses and personal brands, including agent-only features on our mobile real estate applications. |
| • | Consumer-Oriented Mortgage Marketplace. Unlike other sources of mortgage rate quotes, consumers can anonymously submit mortgage loan information requests and receive an unlimited number of personalized mortgage quotes directly from hundreds of consumer-rated lenders. Consumers can then choose to contact those lenders at their discretion. Because we operate this marketplace as part of our real estate home shopping experience, we can efficiently attract motivated users to the marketplace and prioritize the consumer’s experience. For the year ended December 31, 2015, there were approximately 46.8 million mortgage loan information requests submitted by consumers. |
| • | Personalized Experience. We present consumers and real estate, rental, mortgage and home improvement professionals with many opportunities to personalize their Zillow Group experience, leading to more informed home shopping and financing decisions. Users can save favorite homes on Zillow Group’s mobile applications and websites and receive monthly email updates on changes in those homes’ values, listing status, price changes and other data. Users also can customize “saved searches” for any neighborhood or zip code and receive daily email updates on new homes listed for sale, for rent, or price changes for existing listed homes. Once a favorite home or search parameters are saved on Zillow Group’s mobile applications and websites, a consumer or professional may access these personalized options every time they visit Zillow Group through a mobile device or on our websites, personalizing a Zillow Group experience unique to them. |
| • | Proven Management Team. We believe the broad experience and depth of our management team are distinct competitive advantages in the complex and evolving industry in which we compete. The Zillow Group management team has an extensive history building successful consumer Internet companies. In particular, we believe that the shared experience of our executives, many who held similar positions together at Expedia, Inc., provides our management team with unique cohesion and insight. |
Growth Strategies
Our growth strategies are:
| • | Focus on Consumers. Maintain our unwavering focus on consumers and leverage our industry independence to enhance existing products and services and develop new offerings with broad consumer appeal. |
10
Table of Contents
| • | Enhance Our Living Database. Enhance the information in our database of homes, and use it as the foundation for new analyses, insights and tools to inform consumers throughout the home ownership lifecycle. |
| • | Leverage Our Mobile Leadership. Innovate and expand our offerings for mobile devices, continue to optimize for mobile web and launch more applications to extend our brand and products across additional mobile platforms. |
| • | Deepen and Strengthen and Expand Our Marketplaces. Deepen and strengthen our marketplaces by creating new opportunities for high-quality consumer-initiated connections with real estate, rental, mortgage and home improvement professionals when consumers want their services. Our living database of homes provides a foundation on which we can build new consumer and professional marketplaces in other home-related categories. |
| • | Efficiently Increase Brand Awareness. Expand targeted advertising programs, public relations, social media and content distribution to efficiently increase brand awareness. |
| • | Expand Our Platform. Expand our platform beyond advertising services for real estate, rental, mortgage and home improvement professionals by developing additional marketing and business technology solutions to help those professionals manage and grow their businesses and personal brands. |
| • | Optimize Growth Opportunities for Premier Agents. Optimize growth opportunities for Premier Agents participating in our marketplaces through development of a broad variety of marketing and business technology solutions and other enhanced services. |
| • | Leverage Our Sales Force. Leverage our sales force’s expertise with new advertising and technology offerings. |
| • | Pursue Strategic Opportunities. Pursue strategic opportunities, including commercial relationships and acquisitions, to strengthen our market position, enhance our capabilities and accelerate our growth. For example, our February 2015 acquisition of Trulia aligns with our growth strategies, including focusing on consumers and deepening, strengthening, and expanding our marketplaces. With the addition of Trulia, Zillow Group offers more real estate tools and services that empower consumers and drive more business for real estate professionals. |
Advertising Products and Services
We provide advertising products and services for real estate, rental, mortgage and home improvement professionals that enable them to create and promote useful content for consumers.
Marketplace Advertising
Premier Agent Program
Zillow Group’s Premier Agent program offers a suite of marketing and business technology solutions to help real estate agents grow their businesses and personal brands. The Premier Agent program allows agents to select products and services that they can tailor to meet their business and advertising needs. The program has three tiers of participation including Premier Platinum, our flagship product, as well as Premier Gold and Premier Silver, to meet different marketing and business needs of a broad range of agents. All tiers of Premier Agents receive access to a dashboard portal on our website that provides individualized program performance analytics, as well as our personalized website service, and our free customer relationship management, or CRM, tool that captures detailed information about each contact made with a Premier Agent through our mobile and web platforms. Our Premier Gold product also includes featured listings whereby the agent’s listings will appear at the top of search results on our mobile and web platforms. Our Premier Platinum product includes the dashboard portal on our website, our personalized website service, our CRM tool, featured listings, and inclusion on our buyer’s agent list, whereby the agent appears as
11
Table of Contents
the agent to contact for listings in the purchased zip code. Our multi-tiered Premier Agent advertising program, along with our DotLoop collaboration platform, Diverse Solutions agent website services, our CRM tools, and our rentals syndication tool, extend our platform beyond just marketing services for real estate agents to a platform that also includes other types of trade services and tools.
Trulia Real Estate Products
Our Trulia real estate products are primarily sold on a fixed fee subscription basis, and include Trulia Local Ads, Trulia Mobile Ads, Trulia Pro with featured listings and Trulia Seller Ads. Prior to the August 2015 integration of certain of Zillow’s and Trulia’s advertising products, Trulia Local Ads and Trulia Mobile Ads enabled real estate professionals to promote themselves on Trulia’s search results pages and property details pages for a local market area. Real estate professionals purchased subscriptions to these products based upon their specified market share for a city or zip code, at a fixed monthly price, for periods ranging from one month to one year, with pricing depending on demand, location, and the percentage of market share purchased. Following the August 2015 agent advertising product integration, Trulia Local Ads and Trulia Mobile Ads products are no longer sold by Zillow Group. Trulia’s featured listings product allows real estate professionals to receive prominent placement of their listings in Trulia’s search results. Real estate professionals sign up for new subscriptions to this product at a fixed monthly price for periods that generally range from six months to 12 months. Trulia Seller Ads enable real estate professionals to generate leads from consumers interested in selling their homes.
Mortgages
In our mortgages marketplace, consumers request free, personalized quotes in response to their submission of limited anonymous data, such as specific loan amount, zip code, purchase price or estimated home value, and credit score. For the year ended December 31, 2015, there were approximately 46.8 million mortgage loan information requests submitted by consumers. Consumers decide if and when to contact the mortgage professionals who provide quotes. User-generated ratings and reviews of mortgage professionals are provided as a powerful tool to help consumers shop for their loans. Our custom mortgage quote service is operated by our wholly owned subsidiary, Zillow Group Mortgages, Inc., a licensed mortgage broker, pursuant to a support services agreement.
Zillow Group Rentals
Zillow Group continues to develop its rental marketplace on mobile and Web. Zillow Group Rentals is a marketplace for consumers and suite of tools for rental professionals, and is the largest rental network on the Web. Zillow Group Rentals includes listing distribution across Zillow, Trulia and HotPads, reaching millions of rental shoppers each month. Zillow Rent Connect advertisers gain access to the leading technology platform that connects rental properties with consumer contacts.
Display Advertising
Our display advertising primarily consists of graphical mobile and web advertising sold on a CPM basis. We offer customers display advertising opportunities on our mobile applications through display ads that are optimized for the mobile experience, on our home page, and on individual web pages, through graphical displays and text links.
Information Products and Services
We provide consumers with information products and services to enable them to make intelligent decisions about homes.
12
Table of Contents
Zestimates and Rent Zestimates
Our Zestimate and Rent Zestimate valuations are computed using complex, proprietary algorithms we have developed and refined through years of statistical analysis and technological development.
A Zestimate is our estimated current market value of a home. We generate Zestimates using a variety of information, including:
| • | Physical attributes: location, lot size, square footage, number of bedrooms and bathrooms and many other details. |
| • | Tax assessments: property tax information, actual property taxes paid, exceptions to tax assessments and other information provided in the tax assessors’ records. |
| • | Prior and current transactions: actual sale prices over time of the home itself and comparable recent sales of nearby homes. |
We use proprietary automated valuation models that apply advanced algorithms to analyze our data to identify relationships within a specific geographic area between home-related data and actual sales prices. Home characteristics, such as square footage, location or the number of bathrooms, are given different weights according to their influence on home sale prices in each specific geographic area over a specific period of time, resulting in a set of valuation rules, or models, that are applied to generate each home’s Zestimate.
To improve the accuracy of our Zestimates, our algorithms automatically remove or reconcile data that would otherwise inappropriately skew the valuation rules. In addition, our algorithms will automatically generate a new set of valuation rules based on the constantly changing universe of data included in our database. This allows us to provide timely home value information on a massive scale, updated three times a week.
We publicly disclose the accuracy of our Zestimates to further empower consumers in assessing a home’s value. The accuracy may be impacted by a variety of factors, including the amount of data about homes we have for a particular geographic area.
A Rent Zestimate is our estimated current monthly rental price of a home, computed using similar automated valuation models we have designed to address the unique attributes of a rental home. We estimate rental prices on more than 100 million homes, including apartments, single-family homes, condominiums and townhomes.
Zillow Digs
Zillow Digs is the hub for home improvement and design on Zillow. Consumers can browse millions of design ideas for every room, budget and style. Product and paint tags identify the elements in the space, giving consumers the information to recreate the look of the room in their own space. Each product tag provides retailer information, pricing and the link to purchase the item. Additionally, Zillow Digs Estimates give consumers the estimated cost of thousands of real bathrooms and kitchens in Zillow Digs’ ever-increasing portfolio of photos and are computed using Zillow’s proprietary algorithm, which includes real-world data from local contractors such as size, materials, finish level, and regional labor and material rates.
13
Table of Contents
Rich, Searchable Home-Related Data and Analysis
We provide consumers and real estate professionals with a rich set of home-related information. Through our mobile applications and websites, users can access detailed information about homes, including:
| Value Information |
Zestimate | Prior sale prices | ||
| Rent Zestimate | Historical Zestimate values | |||
| For sale price | Historical Rent Zestimate values | |||
| Estimated mortgage payment | Zillow Home Value Index | |||
| Rental price | Zillow Home Value Index Forecasts | |||
| Make Me Move price | Tax-assessed value | |||
| Easy links to county assessor records | Property taxes paid | |||
| Regional 12 month home value forecast | Price per square foot | |||
| Regional foreclosure statistics | ||||
| Home Details |
Bedrooms | Number of stories | ||
| Bathrooms | Number of units in building | |||
| Square footage | Finished basement | |||
| Lot size | Cooling system | |||
| Year built | Heating system | |||
| Property type | Heat source | |||
| County | Fireplace | |||
| Parcel number | Exterior material | |||
| Legal description | Parking type | |||
| Construction quality | Garage size | |||
| Neighborhood Information |
School district | School ratings | ||
| Elementary school | Walkability | |||
| Middle school | Transit access | |||
| High school | Crime data | |||
| For Sale Listing Details |
Price | Price reductions | ||
| Listing agent information | Days on Zillow or Trulia | |||
| Listing brokerage information | MLS number | |||
| Link to listing source | Foreclosure stage and type | |||
| Property type and property features | Home overview description | |||
| Open house dates and times | Neighborhood name and description | |||
| Virtual tour | Coming Soon on market date | |||
| Rental Listing Details |
Building name and number of stories | Property manager | ||
| Rent amount and lease terms | Parking availability | |||
| Application and deposit fees | Utilities and amenities | |||
| Historical rental listings | ||||
Consumers and real estate professionals can update property information by, for example, adding home photos and personalized information regarding the neighborhood or school district, creating exclusive home profiles not available anywhere else.
Our map-based user interface enables our users to search, navigate and zoom to areas of interest and find and compare home information quickly and efficiently from a variety of different perspectives across homes, neighborhoods, cities, counties and other geographical regions. Our consumer search experience supports complex search queries and filters across our data set of homes, allowing consumers to customize their searches and gain actionable insights.
14
Table of Contents
Our team of economists and statisticians generates unbiased local and national real estate data and analysis on 908 metropolitan areas and approximately 11,200 individual neighborhoods that we provide to consumers and real estate, rental, mortgage and home improvement professionals at no cost. This gives our users access to local market trends and data, such as home price cuts, list to sale price ratio and foreclosure data that was historically not easily obtained, if available at all. Users can compare these metrics across neighborhoods and different time periods using our real-time charting and filtering.
For Sale and Rental Listings
We provide comprehensive for sale and rental listings through relationships with real estate brokerages, real estate listings aggregators, multiple listing services, apartment management companies, home builders and other third parties. In addition, we provide consumers with access to exclusive home listings, such as our Make Me Move listings, which are a homeowner’s posted price at which they would be willing to move. We also show listings that may not be available on other sources, including for sale by owner, pre-market inventory, including our Coming Soon listings, and rental listings. Real estate agents and landlords may feature and gain more exposure for their listings through our advertising products.
Historically, a substantial portion of the listings displayed on our mobile applications and websites was provided to us by a single real estate listing aggregator pursuant to platform services agreements. These listings provided revenue-generating opportunities as impressions were delivered through our mobile applications and websites. Pursuant to agreements with the real estate listing aggregator, the platform services agreements expired on April 7, 2015. Through various data acquisition efforts, including the January 2015 launch of the Zillow Data Dashboard, a new listing management and reporting platform that allows Multiple Listing Services, or MLSs, and brokers to provide listings directly to Zillow Group, we have made significant progress in replacing the listings previously provided under the platform services agreements. Since January 2015, nearly 400 MLSs have signed agreements to send listings directly to Zillow and Trulia.
Marketplace of Real Estate Agents
We present consumers with ratings and contact information for the listing agent and local buyer’s agents alongside home profiles and listings for homes to assist them in evaluating and selecting the real estate agent best suited for them. We enhance this offering by providing an online professional directory for consumers to search and contact real estate professionals that they might wish to engage. Our directory includes rich profiles of real estate professionals, including more than 1.8 million ratings and reviews provided by our users, allowing consumers to evaluate these agents based on a number of criteria, including neighborhood specialization, number of listings and number of contributions to Zillow Advice and Trulia Voices.
Marketplace of Mortgage Professionals
In our mortgages marketplace, consumers can anonymously request free, personalized mortgage quotes from consumer-rated and -reviewed mortgage professionals. Consumers can then choose to contact those mortgage professionals at their discretion. For the year ended December 31, 2015, there were approximately 46.8 million mortgage loan information requests submitted by consumers. As of December 31, 2015, we had published more than 210,000 reviews of mortgage professionals submitted by our users.
Home-Related Advice and Discussions
Consumers have many questions and often seek advice during various stages of their home-ownership lifecycle. The Zillow Advice section of our Zillow.com website and Trulia Voices section of our Trulia.com website capture questions and discussion topics from our users, both consumers and real estate, rental, mortgage and home improvement professionals. This allows our consumers to ask questions of other consumers and real estate, rental, mortgage and home improvement professionals and quickly learn more about relevant topics. Our
15
Table of Contents
users have submitted more than one million questions and answers to Zillow Advice as of December 31, 2015. Zillow Advice and Trulia Voices also provide real estate, rental, mortgage and home improvement professionals with an opportunity to help educate consumers and demonstrate their local expertise. These discussions and content are also indexed and searchable by geography and other custom parameters, allowing users to quickly find the information they seek. Email updates are used to provide ongoing monitoring and delivery of posts related to topics of interest.
Mobile Access
We operate the most popular suite of mobile real estate applications across all major mobile platforms. Our mobile real estate applications provide consumers and real estate, rental, mortgage and home improvement professionals with location-based access to many of our products and services, including Zestimates, Rent Zestimates, for sale and rental listings and extensive home-related data. Through our mobile applications, for example, a consumer standing curbside at a home for sale can learn about the home’s for-sale price, Zestimate, number of bedrooms, square footage and past sales, as well as similar information about surrounding homes. The consumer can call a real estate professional through our mobile applications to get more information or schedule a showing. For example, on our flagship Zillow brand, during December 2015, more than 440 million homes were viewed on Zillow on a mobile device, which equates to 165 homes per second.
Marketing
We believe Zillow Group has considerable opportunity to increase brand awareness and grow traffic through product development, targeted advertising programs and strategic partnerships. As such, we selectively advertise to consumers and professionals in various online and offline channels that have tested well for us and pursue strategic partnerships that drive traffic and brand awareness for Zillow Group.
At Zillow Group, marketing begins with product development, which then becomes amplified by effective brand advertising and marketing communications. We create immersive consumer products that people want to use frequently, talk about and share. The engaging nature of our products enables us to execute compelling advertising campaigns integrated with our robust and viral communications program, which together comprise the primary drivers of our brand awareness and traffic acquisition efforts. For example, for our flagship Zillow brand, we launched our consumer brand with communications at the core of our marketing strategy. Next, after years of vigorous field testing, we began large-scale national advertising in early 2013 on television and across other complementary channels, which has continued through the year ended December 31, 2015. In part as a result of these advertising efforts, our traffic has grown to 123.7 million average monthly unique users for the three months ended December 31, 2015, an increase of 61% compared to the three months ended December 31, 2014. The majority of our traffic and brand awareness comes direct, not dependent on search engines, with demonstrated consumer intent to visit the Zillow Group brands.
The communications team for our flagship Zillow brand includes former print and broadcast journalists who have established Zillow Group as an authoritative source for information on a broad range of home and real estate-related subjects. A typical week includes commentary from our real estate experts across dozens of national print and broadcast media outlets, guest opinion pieces or blog posts by our chief economist, and wide-ranging national and local media coverage of Zillow Group products, listings, data and consumer tips. We also produce considerable home and real estate-related content on Zillow Blog and Trulia’s Blog that is syndicated across dozens of prominent media sites. Zillow Blog and Trulia’s Blog content ranges from real estate market trends, to home financing tips, to celebrity real estate listings.
We focus substantial public relations effort around the marketing of our Zillow Real Estate Market Reports, which are in-depth reports produced by our economics and analytics bureau for 794 U.S. markets. Data is released on a monthly and quarterly basis, and the data is widely used by government entities such as the Federal Reserve and Congressional Oversight Panel, as well as regularly featured in respected media outlets such as the
16
Table of Contents
Wall Street Journal, New York Times, Bloomberg, Reuters and across numerous national network and cable news shows including CNBC, CNN, Fox News and Bloomberg. We believe the considerable effort we have spent on public relations and social media has allowed us to build large and credible brands.
Our living database of homes creates significant opportunities for home-ownership lifecycle marketing. A typical person will at various times in life be a renter, buyer, homeowner, remodeler, mortgage refinancer or seller, and this presents opportunities to communicate with consumers over many years before, during and after a transaction. We actively communicate with our users through email and social media channels.
Sales, Consumer Care and Customer Support
Our sales teams are responsible for generating advertising customers across our mobile applications and websites.
Our largest sales teams sell our Premier Agent products to real estate agents, and are located in Seattle, Washington, Denver, Colorado, and Irvine, California. We also have a sales team in Seattle, Washington that sells our rental products to rental professionals. In addition, we have sales teams in Seattle, Washington, New York, New York and Lincoln, Nebraska that support sales in our mortgage marketplaces and display advertising. We attract customers through a combination of outbound calling and inbound customer requests generated from our websites and event marketing activities. We also maintain a field sales team in San Francisco, California, New York, New York, Chicago, Illinois, and Detroit, Michigan, to specifically target larger advertising customers in the real estate and related content categories, such as real estate brokerages, home builders, lenders and home service providers, as well as advertisers in the telecommunications, automotive, insurance and other industries.
We believe that consumer care and customer support are important to our success. Our consumer care and customer support teams are located in Seattle, Washington, and Denver, Colorado. Our customer support team responds to commercial and technical issues from our advertisers, and our consumer care team responds to consumer issues from our user community. The Zillow Advice and Trulia Voices forums augment our consumer care by enabling consumers to obtain answers to questions from our employees and other members of our user community, including real estate, rental, mortgage and home improvement professionals.
Technology and Infrastructure
Zillow Group is a data- and technology-driven company. Our technical infrastructure, mobile applications and websites are built to provide consumers and real estate, rental, mortgage and home improvement professionals with access to rich real estate data and powerful online tools to help them accomplish their home-related goals. Many of our services are available through real-time web-based application programming interfaces that allow our information to be easily integrated into third-party websites. We provide HTML and JavaScript-based widgets to allow easy integration of Zillow Group information onto other websites, with little custom programming. Our technology platform is built using industry-leading third-party and internally developed software as well as open source technologies. This combination allows for rapid development and release of high-performance software in a cost-effective and scalable manner. Our mobile applications and websites are designed to have high availability, from the Internet connectivity providers we choose, to the servers, databases and networking hardware that we deploy. We design our systems so that the failure of any individual component is not expected to affect the overall availability of our platform. We also leverage content delivery networks and use other third-party cloud computing services, including map-related and ad serving services, to ensure fast and local access to content. We employ a host of encryption, antivirus, firewall, monitoring, and patch-management technology to protect and maintain our systems.
Our Zillow technical infrastructure, mobile applications and websites are hosted at a third-party facility located in the Seattle area. Additionally, we utilize third-party web services for cloud computing and storage to assist in service growth and redundancy. Content delivery network solutions have been put in place to ensure fast and local access to content. Development and test environments are located either in a data center we manage at our corporate headquarters or are hosted by third-party cloud computing infrastructure.
17
Table of Contents
We currently manage our Trulia mobile applications and website from three locations. The primary location where we host our production environment is within a shared data center in Santa Clara, California. We also have a second hosted facility located in Denver, Colorado where we support our production environment and provide redundancy, backup and load balancing. We use a third hosted facility located in Oakland, California for production service backup and for our development environment.
For information about our research and development costs, see Note 2 of the accompanying notes to our consolidated financial statements included within this annual report.
Intellectual Property
We protect our intellectual property through a combination of trademarks, trade dress, domain names, copyrights, trade secrets and patents, as well as contractual provisions and restrictions on access to our proprietary technology.
Our trademarks registered in the United States and several other jurisdictions include, but are not limited to, “Zillow,” “Trulia,” “Zestimate,” “Premier Agent,” “Dueling Digs,” “Make Me Move,” “Diverse Solutions,” “dsIDXpress,” “Mortech,” “Marksman,” “Hotpads,” “StreetEasy,” “Retsly,” “dotloop,” “Digs,” “Find Your Way Home,” the Z in a house logo, the Trulia marker logo, as well as logos that correspond with several of our other trademarks. We also have filed other trademark applications in the United States and certain other jurisdictions and will pursue additional trademark registrations to the extent we believe it will be beneficial and cost-effective.
We have 18 patents issued in the United States and internationally. These patents cover proprietary techniques that relate to determining a current value for a real estate property, performing summarization of geographic data points in response to zoom selection, the incorporation of individual aerial images and incorporating visual information into a master planar image, the collection, storage and display of home attribute values, providing for a multi-faceted search, and other proprietary techniques relevant to our products and services. We have 47 patent applications pending in the United States and internationally, which seek to cover proprietary techniques relevant to our products and services. We intend to pursue additional patent protection to the extent we believe it will be beneficial and cost-effective.
We are the registered holder of a variety of domestic and international domain names that include “Zillowgroup.com,” “Zillow.com,” “Trulia.com,” “RealEstate.com,” “DiverseSolutions.com,” “Mortech.com,” “HotPads.com,” “Streeteasy.com,” “DotLoop.com,” “Retsly.com,” and other similar variations.
In addition to the protection provided by our intellectual property rights, we enter into confidentiality and proprietary rights agreements with our employees, consultants, contractors and business partners. Our employees and contractors are also subject to invention assignment provisions. We further control the use of our proprietary technology and intellectual property through provisions in both our general and product-specific terms of use on our mobile applications and websites.
Competition
We face competition to attract consumers to our mobile applications and websites and to attract advertisers to purchase our advertising products and services.
Competition for Consumers
We compete for the attention of consumers with companies that operate, or could develop, national and local real estate, rental, mortgage and home improvement mobile applications and websites. We compete for consumers primarily on the basis of the quality of the consumer experience, the utility of the data and services we provide, the breadth, depth and accuracy of information, and brand awareness and reputation. We believe we compete favorably on these factors.
18
Table of Contents
Competition for Advertisers
We compete for advertising customers, such as real estate professionals, with media companies, including companies dedicated to providing mobile and web-based real estate, rental, mortgage and home improvement information and services to real estate professionals and consumers, local brokerage sites and major Internet portals, general search engines and social media sites, as well as other online companies. We also compete for a share of advertisers’ overall marketing budgets with traditional media such as newspapers, television, magazines, and home/apartment guide publications, particularly with respect to advertising dollars spent at the local level by real estate agents, mortgage professionals, property managers or rental agents to advertise their qualifications or listings. We compete for advertising revenue based on perceived return on investment and perceived transaction readiness and overall quality of consumer leads, the effectiveness and relevance of our advertising products, pricing structure and our ability to effectively deliver types of ads to targeted demographics. We believe we compete favorably on these factors.
Government Regulation
We are affected by laws and regulations that apply to businesses in general, as well as to businesses operating on the Internet and through mobile applications. This includes a continually expanding and evolving range of laws, regulations and standards that address information security, data protection, privacy, consent and advertising, among other things. We are also subject to laws governing marketing and advertising activities conducted by telephone, email, mobile devices, and the Internet, including the Telephone Consumer Protect Act, the Telemarketing Sales Rule, the CAN-SPAM Act, and similar state laws. In addition, some of our mortgage advertising products are operated by our wholly owned subsidiary, Zillow Group Mortgages, Inc., a licensed mortgage broker, pursuant to a support services agreement. Though we do not take mortage applications or make loans or credit decisions in connection with loans, Zillow Group Mortgages, Inc. is subject to stringent state and federal laws and regulations and to the scrutiny of state and federal government agencies as a licensed mortgage broker.
By providing a medium through which users can post content and communicate with one another, we may also be subject to laws governing intellectual property ownership, obscenity, libel, and privacy, among other issues. In addition, the real estate agents, mortgage professionals, banks, property managers, rental agents and some of our other customers and advertisers on our mobile applications and websites are subject to various state and federal laws and regulations relating to real estate, rentals and mortgages. We endeavor to ensure that any content created by Zillow is consistent with such laws and regulations by obtaining assurances of compliance from our advertisers and consumers for their activities through, and the content they provide on, our mobile applications and websites. The real estate, mortgages, and rentals industries are subject to significant state and federal regulation; though we provide advertising services and technology solutions to real estate, mortgages, and rentals professionals, certain of our activities may be deemed to be covered by these industry regulations. Since the laws and regulations governing real estate, rentals and mortgages are constantly evolving, it is possible that we may have to materially alter the way we conduct some parts of our business activities or be prohibited from conducting such activities altogether at some point in the future.
Employees
As of December 31, 2015, we had 2,204 full-time employees.
Where You Can Find More Information
Our filings with the Securities and Exchange Commission, or SEC, including our annual reports on Form 10-K, quarterly reports on Form 10-Q, current reports on Form 8-K, and amendments to those reports, are available on our website at www.zillowgroup.com, free of charge, as soon as reasonably practicable after the electronic filing of these reports with the SEC. The information contained on our website is not a part of this Annual Report on Form 10-K.
19
Table of Contents
Investors and others should note that Zillow Group announces material financial information to its investors using its press releases, SEC filings and public conference calls and webcasts. Zillow Group intends to also use the following channels as a means of disclosing information about Zillow Group, its services and other matters and for complying with its disclosure obligations under Regulation FD:
| • | Zillow Group Investor Relations Webpage (http://investors.zillowgroup.com) |
| • | Zillow Group Investor Relations Blog (http://www.zillowgroup.com/ir-blog) |
| • | Zillow Group Twitter Account (https://twitter.com/zillowgroup) |
The information Zillow Group posts through these channels may be deemed material. Accordingly, investors should monitor these channels, in addition to following Zillow Group’s press releases, SEC filings and public conference calls and webcasts. This list may be updated from time to time. The information we post through these channels is not a part of this Annual Report on Form 10-K.
Our business is subject to numerous risks. You should carefully consider the following risk factors, as any of these risks could harm our business, results of operations, financial condition and our prospects. In addition, risks and uncertainties not currently known to us or that we currently deem to be immaterial also may materially adversely affect our business, financial condition and operating results.
Risks Related to the Acquisition of Trulia
We May Experience Difficulties in Realizing the Expected Benefits of the Acquisition of Trulia.
The Trulia acquisition was completed on February 17, 2015, and the integration is substantially complete as of December 31, 2015. Integration resulted in substantial financial costs and required the investment of personnel time and attention and other resources. The success of the acquisition of Trulia depends in part on our ability to realize the anticipated business opportunities, including certain cost savings and operational efficiencies or synergies, and growth prospects from combining Zillow and Trulia in an efficient and effective manner. We may never realize these business opportunities and growth prospects.
Purchase Price Accounting in Connection with our Acquisition of Trulia Requires Estimates Which Are Subject to Change in the Future. Future Changes to These Estimates Could Impact Our Condensed Consolidated Financial Statements and Our Future Operating Results.
Under the acquisition method of accounting, the purchase price paid for Trulia is allocated to the underlying Trulia tangible and intangible assets acquired and liabilities assumed based on their respective fair market values with any excess purchase price allocated to goodwill. The acquisition method of accounting is dependent upon certain valuations and other studies that are preliminary. Accordingly, the purchase price allocation as of the acquisition date is preliminary. Zillow Group anticipates that all the information needed to identify and measure values assigned to the assets acquired and liabilities assumed will be obtained and finalized during the one-year measurement period following the date of completion of the acquisition. Differences between these preliminary estimates and the final acquisition accounting may occur, and these differences could have a material impact on the consolidated financial statements and the combined company’s future results of operations and financial position.
We Have Incurred, and May Continue to Incur, Significant Acquisition-Related Costs and Transition Costs in Connection with the Acquisition of Trulia.
We have incurred, and may continue to incur, significant, non-recurring costs in connection with completing the acquisition of Trulia and integrating the operations of Zillow and Trulia. We may incur additional costs to maintain employee morale and to retain key employees. Management cannot ensure that the elimination of duplicative costs or the realization of other efficiencies will offset the transaction and integration costs in the near term or at all.
20
Table of Contents
Risks Related to Our Business and Industry
If Real Estate, Rental and Mortgage Professionals or Other Advertisers Reduce or End Their Advertising Spending With Us and We are Unable to Attract New Advertisers, Our Business Would Be Harmed.
Our current financial model depends on advertising revenue generated primarily through sales to real estate agents and brokerages, rental professionals, mortgage professionals and advertisers in categories relevant to real estate. Our ability to attract and retain advertisers, and ultimately to generate advertising revenue, depends on a number of factors, including how successfully we can:
| • | increase the number of consumers who use our products and services and enhance their user experience so we can retain them; |
| • | offer an attractive return on investment to our advertisers for their advertising spending with us; |
| • | continue to develop our advertising products and services, including the expansion of those products and services to new advertising customers; |
| • | keep pace with and anticipate changes in technology to provide industry-leading products and services to advertisers and consumers; and |
| • | compete effectively for advertising dollars with other online media companies. |
We do not have long-term contracts with most of our advertisers. Our advertisers could choose to modify or discontinue their relationships with us with little or no advance notice. In addition, as existing contracts for our Premier Agent advertising programs expire, we may not be successful in renewing these contracts, securing new contracts or increasing the amount of revenue we earn for a given contract over time. We may not succeed in retaining existing advertisers’ spending or capturing a greater share of such spending if we are unable to convince advertisers of the effectiveness or superiority of our products as compared to alternatives, including traditional offline advertising media such as television and newspapers. In addition, future changes to our pricing methodology for advertising services may cause advertisers to reduce their advertising with us or choose not to advertise with us.
If current advertisers reduce or end their advertising spending with us and we are unable to attract new advertisers, our advertising revenue and business, results of operations and financial condition would be harmed. In addition, if we do not realize the benefits we expect from strategic relationships we enter into, including for example, the generation of additional advertising revenue opportunities, our business could be harmed.
If We Do Not Innovate and Provide Products and Services That Are Attractive to Our Users and to Our Advertisers, Our Business Could Be Harmed.
Our success depends on our continued innovation to provide products and services that make our mobile applications, websites and other tools useful for consumers and real estate, rental, mortgage and home improvement professionals, and attractive to our advertisers. As a result, we must continually invest significant resources in research and development to improve the attractiveness and comprehensiveness of our products and services and effectively incorporate new mobile and Internet technologies into them. If we are unable to provide products and services that users, including real estate professionals, want to use, then users may become dissatisfied and use competitors’ mobile applications, websites and tools. If we are unable to continue offering innovative products and services, we may be unable to attract additional users and advertisers or retain our current users and advertisers, which could harm our business, results of operations and financial condition.
If Use of Mobile Technology and the Internet, Particularly With Respect to Real Estate Products and Services, Does Not Continue to Increase as Rapidly as We Anticipate, Our Business Could Be Harmed.
Our future success substantially depends on the continued use of mobile technology and the Internet as effective media of business and communication by our consumers. Mobile technology and Internet use may not continue to develop at historical rates, and consumers may not continue to use mobile technology or the Internet
21
Table of Contents
as media for information exchange. Further, these media may not be accepted as viable long-term outlets for information for a number of reasons, including actual or perceived lack of security of information and possible disruptions of service or connectivity. If consumers begin to access real estate information through other media and we fail to innovate, our business may be negatively impacted.
We Compete in a Dynamic and Nascent Industry, and We May Invest Significant Resources to Pursue Strategies That Do Not Prove Effective.
The industry for residential real estate information marketplaces and related advertising services on mobile and Web is in early stages of development, and significant shifts in consumer and professional behaviors occur constantly and rapidly. We continue to learn a great deal about the behaviors and objectives of residential real estate market participants as the industry evolves. We may not successfully anticipate or keep pace with industry changes, and we may invest considerable financial, personnel, and other resources to pursue strategies that do not, ultimately, prove effective such that our results of operations and financial condition may be harmed.
We Depend on the Real Estate Industry, and Changes to That Industry, or Declines in the Real Estate Market or Increases in Mortgage Interest Rates, Could Reduce the Demand for Our Products and Services.
Our financial results significantly depend on real estate shoppers using our services. Real estate shopping patterns depend on the overall health of the real estate market. Changes to the regulation of the real estate industry, including mortgage lending, may negatively impact the prevalence of home ownership and the ability of market participants to close transactions. Changes to the real estate industry, declines in the real estate market or increases in mortgage interest rates could reduce demand for our services. Real estate markets also may be negatively impacted by a significant natural disaster, such as earthquake, fire, flood or other disruption. In addition, real estate, rental, and mortgage professionals are subject to comprehensive federal, state, and local laws and regulations which may cause them to significantly alter, decrease, or terminate their purchase of our products and services. Seasonality, micro- and macroeconomic factors, government regulation, and other similar factors may decrease consumer usage as well as sales to our advertisers and other customers, which could harm our results of operations and financial condition.
We May Not Be Able to Maintain or Establish Relationships With Real Estate Brokerages, Real Estate Listing Aggregators, Multiple Listing Services, Property Management Companies, Home Builders and Other Third-Party Listing Providers, Which Could Limit the Information We Are Able to Provide to Our Users.
Our ability to attract users to our mobile applications, websites and other tools depends to some degree on providing a robust number of for-sale and rental listings. To provide these listings, we maintain relationships with real estate brokerages, real estate listing aggregators, multiple listing services, property management companies, home builders, other third-party listing providers, and homeowners and their real estate agents to include listing data in our services. Many of our agreements with real estate listing providers are short-term agreements that may be terminated with limited notice. The loss of some of our existing relationships with listing providers, whether due to termination of agreements or otherwise, changes to our rights to use listing data, or an inability to continue to add new listing providers, may cause our listing data to omit information important to users of our products and services. This could reduce user confidence in the sale and rental data we provide and make us less popular with consumers, which could harm our business, results of operations and financial condition.
Historically, a substantial portion of the listings displayed on our mobile applications and websites was provided to us by a single real estate listing aggregator pursuant to platform services agreements. These listings provided revenue-generating opportunities as impressions were delivered through our mobile applications and websites. Pursuant to agreements with the real estate listing aggregator, the platform services agreements expired on April 7, 2015. Through various data acquisition efforts, including the January 2015 launch of the Zillow Data Dashboard, a new listing management and reporting platform that allows Multiple Listing Services, or MLSs, and brokers to provide listings directly to Zillow, we have made progress in replacing the listings previously
22
Table of Contents
provided under the platform services agreements. Since January 2015, nearly 400 MLSs have signed agreements to send listings directly to Zillow and Trulia. However, we may not be able to fully replace the listings in a timely manner or on terms favorable to us, if at all, which could harm our business, results of operations and financial condition.
We May Not Be Able to Maintain or Establish Relationships With Data Providers, Which Could Limit the Information We Are Able to Provide to Our Users and Impair Our Ability to Attract or Retain Users.
We obtain real estate data, such as sale transactions, property descriptions, tax-assessed value and property taxes paid, under licenses from third-party data providers. We use this data to enable the development, maintenance and improvement of our information services, including Zestimates, Rent Zestimates and our living database of homes. We have invested significant time and resources to develop proprietary algorithms, valuation models, software and practices to use and improve on this specific data. We may be unable to renew our licenses with these data providers, or we may be able to do so only on terms that are less favorable to us, which could harm our ability to continue to develop, maintain and improve these information services and could harm our business, results of operations and financial condition.
We Face Competition to Attract Consumers to Our Mobile Applications and Websites, Which Could Impair Our Ability to Continue to Grow the Number of Users Who Use Our Mobile Applications and Websites, Which Would Harm Our Business, Results of Operations and Financial Condition.
Our success depends on our ability to continue to attract additional consumers to our mobile applications and websites. Our existing and potential competitors include companies that operate, or could develop, national and local real estate, rental, mortgage and home improvement websites. These companies could devote greater technical and other resources than we have available, have a more accelerated time frame for deployment and leverage their existing user bases and proprietary technologies to provide products and services that consumers might view as superior to our offerings. Any of our future or existing competitors may introduce different solutions that attract consumers or provide solutions similar to our own but with better branding or marketing resources. If we are not able to continue to grow the number of consumers who use our mobile applications and websites, our business, results of operations and financial condition would be harmed.
We May Not Be Able to Compete Successfully Against Our Existing or Future Competitors in Attracting Advertisers, Which Could Harm Our Business, Results of Operations and Financial Condition.
We compete to attract advertisers with media sites, including websites dedicated to providing real estate, rental, mortgage and home improvement information and services to real estate professionals and consumers, and major Internet portals, general search engines and social media sites, as well as other online companies. We also compete for a share of advertisers’ overall marketing budgets with traditional media such as television, magazines, newspapers and home/apartment guide publications, particularly with respect to advertising dollars spent at the local level by real estate professionals to advertise their qualifications and listings. Large companies with significant brand recognition have large numbers of direct sales personnel and substantial proprietary advertising inventory and web traffic, which may provide a competitive advantage. To compete successfully for advertisers against future and existing competitors, we must continue to invest resources in developing our advertising platform and proving the effectiveness and relevance of our advertising products and services. Pressure from competitors seeking to acquire a greater share of our advertisers’ overall marketing budget could adversely affect our pricing and margins, lower our revenue, and increase our research and development and marketing expenses. If we are unable to compete successfully against our existing or future competitors, our business, results of operations or financial condition would be harmed.
Our Dedication to Making Decisions Based Primarily on the Best Interests of Consumers May Cause Us to Forgo Short-Term Gains.
Our guiding principle is to build our business by making decisions based primarily on the best interests of consumers, which we believe has been essential to our success in increasing our user growth rate and
23
Table of Contents
engagement and has served the long-term interests of our company and our shareholders. In the past, we have forgone, and we will in the future forgo, certain expansion or short-term revenue opportunities that we do not believe are in the best interests of consumers, even if such decisions negatively impact our short-term results of operations. In addition, our philosophy of putting consumers first may negatively impact our relationships with our existing or prospective advertisers. This could result in a loss of advertisers, which could harm our revenue and results of operations. For example, we believe that some real estate agents have chosen not to purchase our Premier Agent product because we display a Zestimate on their for-sale listings. We believe, however, that it is valuable to consumers to have access to a valuation starting point on all homes and so we display a Zestimate on every home in the Zillow database for which we have sufficient data to produce the Zestimate. Similarly, we gather, and make available to our consumers, reviews on real estate, rental, mortgage and home improvement professionals, even if those reviews are unfavorable. Although real estate, rental, mortgage and home improvement professionals who receive unfavorable reviews may be less likely to purchase our advertising products and services, we continue to post favorable and unfavorable reviews because we believe the reviews are useful to consumers in finding the right professional. Our principle of making decisions based primarily on the best interests of consumers may not result in the long-term benefits that we expect, in which case our user traffic and engagement, business and results of operations could be harmed.
We May in the Future Be Subject to Disputes Regarding the Accuracy of Our Zestimates and Rent Zestimates.
We provide our users with Zestimate and Rent Zestimate home and rental valuations. Zestimates are our estimated current market values of a home based on our proprietary automated valuation models that apply advanced algorithms to analyze our data; they are not appraisals. A Rent Zestimate is our estimated current monthly rental price of a home, using similar automated valuation models that we have designed to address the unique attributes of rental homes. Revisions to our automated valuation models, or the algorithms that underlie them, may cause certain Zestimates or Rent Zestimates to vary from our expectations for those Zestimates or Rent Zestimates. In addition, from time to time, users disagree with our Zestimates and Rent Zestimates. Any such variation in Zestimates or Rent Zestimates or disagreements could result in distraction from our business or potentially harm our reputation and could result in legal disputes.
We May Be Unable to Increase Awareness of the Zillow Group Brands Cost-effectively, Which Could Harm Our Business.
We rely heavily on the Zillow Group brands, including Zillow and Trulia, which we believe are key assets of our company. Awareness and perceived quality and differentiation of the Zillow Group brands are important aspects of our efforts to attract and expand the number of consumers who use our mobile applications and websites. Should the competition for awareness and brand preference increase among providers of mobile or online real estate information, we may not be able to successfully maintain or enhance the strength of our brand. In 2013 and 2014, we significantly increased our advertising investment to increase brand awareness and grow traffic, and this investment continued through 2015. We expect to continue to invest in our paid advertising. Paid advertising may not continue to be successful or cost-effective. If we are unable to maintain or enhance user and advertiser awareness of our brand cost-effectively, or if we are unable to recover our additional marketing and advertising costs through increased usage of our products and services, our business, results of operations and financial condition could be harmed.
If We Fail to Manage Our Growth Effectively, Our Brands, Results of Operations and Business Could Be Harmed.
We have experienced rapid and significant growth in our headcount and operations, including as a result of the February 2015 Trulia acquisition, which places substantial demand on management and our operational infrastructure. The majority of our employees have been with us for fewer than two years. As we continue to grow, we must effectively integrate, develop and motivate a large number of new employees, while maintaining the beneficial aspects of our company culture. In particular, we expect to continue to pursue strategic
24
Table of Contents
opportunities and make substantial investments in our technology and development and sales and marketing organizations. If we do not manage the growth of our business and operations effectively, the quality of our services and efficiency of our operations could suffer, which could harm our brand, results of operations and overall business.
We Rely on the Performance of Highly Skilled Personnel, and if We Are Unable to Attract, Retain and Motivate Well-Qualified Employees, Our Business Could Be Harmed.
We believe our success has depended, and continues to depend, on the efforts and talents of our management and our highly skilled team of employees, including our software engineers, statisticians, marketing professionals and advertising sales staff. Our future success depends on our continuing ability to attract, develop, motivate and retain highly qualified and skilled employees. The loss of any of our senior management or key employees could materially adversely affect our ability to build on the efforts they have undertaken and to execute our business plan, and we may not be able to find adequate replacements. We cannot ensure that we will be able to retain the services of any members of our senior management or other key employees. If we do not succeed in attracting well-qualified employees or retaining and motivating existing employees, our business could be harmed.
We May Make Acquisitions and Investments, Which Could Result in Operating Difficulties, Dilution and Other Harmful Consequences.
We continue to evaluate a wide array of potential strategic opportunities, including acquisitions. Any transactions that we enter into could be material to our financial condition and results of operations. The acquisitions may not result in the intended benefits to our business, and we may not successfully evaluate or utilize the acquired products, technology, or personnel, or accurately forecast the financial impact of an acquisition transaction. The process of integrating an acquired company, business or technology could create unforeseen operating difficulties and expenditures. The areas where we face risks include:
| • | diversion of management time and focus from operating our business to acquisition integration challenges; |
| • | consumer and industry acceptance of products and services offered by the acquired company; |
| • | implementation or remediation of controls, procedures and policies at the acquired company; |
| • | coordination of product, engineering and sales and marketing functions; |
| • | retention of employees from the acquired company; |
| • | liability for activities of the acquired company before the acquisition; |
| • | litigation or other claims arising in connection with the acquired company; and |
| • | impairment charges associated with goodwill and other acquired intangible assets. |
Our failure to address these risks or other problems encountered in connection with our past or future acquisitions and investments could cause us to fail to realize the anticipated benefits of such acquisitions or investments, incur unanticipated liabilities, and harm our business, results of operations and financial condition.
We Are Subject to a Number of Risks Related to the Credit Card and Debit Card Payments We Accept.
We accept payments through credit and debit card transactions. For credit and debit card payments, we pay interchange and other fees, which may increase over time. An increase in those fees may require us to increase the prices we charge and would increase our operating expenses, either of which could harm our business, financial condition and results of operations.
25
Table of Contents
We depend on processing vendors to complete credit and debit card transactions. If we or our processing vendors fail to maintain adequate systems for the authorization and processing of credit card transactions, it could cause one or more of the major credit card companies to disallow our continued use of their payment products. In addition, if these systems fail to work properly and, as a result, we do not charge our customers’ credit cards on a timely basis or at all, our business, revenue, results of operations and financial condition could be harmed.
We are also subject to payment card association operating rules, certification requirements and rules governing electronic funds transfers, which could change or be reinterpreted to make it more difficult for us to comply. We are required to comply with payment card industry security standards. Failing to comply with those standards may violate payment card association operating rules, federal and state laws and regulations, and the terms of our contracts with payment processors. Any failure to comply fully also may subject us to fines, penalties, damages and civil liability, and may result in the loss of our ability to accept credit and debit card payments. Further, there is no guarantee that such compliance will prevent illegal or improper use of our payment systems or the theft, loss, or misuse of data pertaining to credit and debit cards, card holders and transactions.
If we fail to adequately control fraudulent credit card transactions, we may face civil liability, diminished public perception of our security measures, and significantly higher credit card-related costs, each of which could harm our business, results of operations and financial condition.
If we are unable to maintain our chargeback rate or refund rates at acceptable levels, our processing vendors may increase our transaction fees or terminate their relationships with us. Any increases in our credit and debit card fees could harm our results of operations, particularly if we elect not to raise our rates for our service to offset the increase. The termination of our ability to process payments on any major credit or debit card would significantly impair our ability to operate our business.
Risks Related to Our Intellectual Property and Technology
If Our Security Measures Are Compromised, We May Be Subject to Legal Claims and Suffer Significant Losses, and Consumers May Curtail Use of Our Products and Services and Advertisers May Reduce Their Advertising on Our Mobile Applications and Websites.
Our products and services involve the transmission and/or storage of users’ information, some of which may be private or include personally identifiable information such as social security numbers and credit card information, and security breaches could expose us to a risk of loss or exposure of this information, which could result in potential liability and litigation. Like all mobile application and website providers, our mobile applications and websites are vulnerable to computer viruses, break-ins, phishing attacks, attempts to overload our servers with denial-of-service or other attacks, and similar disruptions from unauthorized use of our computer systems, any of which could lead to interruptions, delays, or website shutdowns, causing loss of critical data or the unauthorized disclosure or use of personal or other confidential information. Further, outside parties may attempt to fraudulently induce employees, users or advertisers to disclose sensitive information in order to gain access to our information or our users’ or advertisers’ information, and our information technology and infrastructure may be vulnerable to attacks by hackers or breached due to employee error, malfeasance or other disruptions. If we experience compromises to our security that result in mobile application or website performance or availability problems, the complete shutdown of our mobile applications or websites, or the loss or unauthorized disclosure of confidential information, our users and advertisers may lose trust and confidence in us, we may be subject to legal claims, government investigation and additional state and federal statutory requirements, users may decrease the use of our mobile applications or websites or stop using our mobile applications or websites in their entirety, and advertisers may decrease or stop advertising on our mobile applications or websites. In May 2015, for example, we detected a distributed denial of service attack against our website, zillow.com. Upon detection, standard response protocols were immediately initiated, filtering malicious
26
Table of Contents
traffic and restoring network performance. This incident did not have a material adverse effect on our business, and there is no indication that our internal controls were compromised. Despite the additional network detection tools we implemented, we cannot ensure that we will not experience future incidents.
We depend on data storage vendors to store certain user information, some of which may be private or include personally identifiable information. If our data storage vendors fail to maintain adequate information security systems and our users’ information is compromised, our business, results of operations and financial condition could be harmed.
Further, because the techniques used to obtain unauthorized access, disable or degrade service, or sabotage systems change frequently, often are not recognized until launched against a target, and may originate from less regulated and remote areas around the world, we may be unable to proactively address all these techniques or to implement adequate preventative measures. Any or all of these issues could negatively impact our ability to attract new users and increase engagement by existing users, cause existing users to curtail or stop use of our products or services or close their accounts, cause existing advertisers to cancel their contracts, or subject us to third-party lawsuits, regulatory fines or other action or liability, thereby harming our business, results of operations and financial condition.
Any Significant Disruption in Service on Our Mobile Applications or Websites or in Our Network Could Damage Our Reputation and Brands, and Result in a Loss of Users of Our Products and Services and of Advertisers, Which Could Harm Our Business, Results of Operations and Financial Condition.
Our brand, reputation and ability to attract users and advertisers depend on the reliable performance of our network infrastructure and content delivery processes. We have experienced minor interruptions in these systems in the past, including server failures that temporarily slowed the performance of our mobile applications and websites, and we may experience interruptions in the future. Interruptions in these systems, whether due to system failures, computer viruses, software errors or physical or electronic break-ins, could affect the security or availability of our products and services on our mobile applications and websites and prevent or inhibit the ability of users to access our services. Since our users may rely on our products and services, including our free customer relationship management tools, for important aspects of their businesses, problems with the reliability, availability or security of our systems could damage our users’ businesses, harm our reputation, result in a loss of users of our products and services and of advertisers and result in additional costs, any of which could harm our business, results of operations and financial condition.
The majority of the communications, network and computer hardware used to operate our mobile applications and websites are located at facilities in the Seattle, Washington and Santa Clara, California areas. We do not own or control the operation of certain of these facilities. Our systems and operations are vulnerable to damage or interruption from fire, flood, power loss, telecommunications failure, terrorist attacks, acts of war, electronic and physical break-ins, computer viruses, earthquakes and similar events. The occurrence of any of the foregoing events could result in damage to our systems and hardware or could cause them to fail completely, and our insurance may not cover such events or may be insufficient to compensate us for losses that may occur.
A failure of our systems at one site could result in reduced functionality for our users, and a total failure of our systems could cause our mobile applications or websites to be inaccessible. Problems faced by our third-party web-hosting providers with the telecommunications network providers with which they contract or with the systems by which they allocate capacity among their customers, including us, could adversely affect the experience of our users. Our third-party web-hosting providers could decide to close their facilities without adequate notice. Any financial difficulties, such as bankruptcy reorganization, faced by our third-party web-hosting providers or any of the service providers with whom they contract may have negative effects on our business, the nature and extent of which are difficult to predict. If our third-party web-hosting providers are unable to keep up with our growing needs for capacity, our business could be harmed. In addition, if distribution channels for our mobile applications experience disruptions, such disruptions could adversely affect the ability of users and potential users to access or update our mobile applications, which could harm our business.
27
Table of Contents
We do not carry business interruption insurance sufficient to compensate us for the potentially significant losses, including the potential harm to the future growth of our business, which may result from interruptions in our service as a result of system failures. Any errors, defects, disruptions or other performance problems with our services could harm our reputation, business, results of operations and financial condition.
We May Be Unable to Adequately Protect Our Intellectual Property, Which Could Harm the Value of Our Brands and Our Business.
We regard our intellectual property as critical to our success, and we rely on trademark, copyright and patent law, trade secret protection and contracts to protect our proprietary rights. If we are not successful in protecting our intellectual property, the value of our brands and our business, results of operations and financial condition could be harmed.
While we believe that our issued patents and pending patent applications help to protect our business, we cannot ensure that our operations do not, or will not, infringe valid, enforceable patents of third parties or that competitors will not devise new methods of competing with us that are not covered by our patents or patent applications. We cannot ensure that our patent applications will be approved, that any patents issued will adequately protect our intellectual property, that such patents will not be challenged by third parties or found to be invalid or unenforceable, or that our patents will be effective in preventing third parties from utilizing a “copycat” business model to offer the same products or services. Moreover, we rely on intellectual property and technology developed or licensed by third parties, and we may not be able to obtain licenses and technologies from these third parties on reasonable terms or at all.
Effective trademark, service mark, copyright and trade secret protection may not be available in every country in which our products and services may be provided. The laws of certain countries do not protect proprietary rights to the same extent as the laws of the United States and, therefore, in certain jurisdictions, we may be unable to protect intellectual property and our proprietary technology adequately against unauthorized third-party copying or use, which could harm our competitive position. We have licensed in the past, and expect to license in the future, certain of our proprietary rights, such as trademarks or copyrighted material, to third parties. These licensees may take actions that might diminish the value of our proprietary rights or harm our reputation, even if we have agreements prohibiting such activity. To the extent third parties are obligated to indemnify us for breaches of our intellectual property rights, these third parties may be unable to meet these obligations. Any of these events could harm our business, results of operations or financial condition.
In addition, we may actively pursue entities that infringe our intellectual property, including through legal action. Taking such action may be costly, and we cannot ensure that such actions will be successful. Any increase in the unauthorized use of our intellectual property could make it more expensive for us to do business and harm our results of operations or financial condition.
Intellectual Property Disputes Are Costly to Defend and Could Harm Our Business, Results of Operations, Financial Condition and Reputation.
From time to time, we face allegations that we have infringed the trademarks, copyrights, patents and other intellectual property rights of third parties. We are currently subject to patent and other intellectual properly infringement claims. These claims allege, among other things, that aspects of our technology infringe upon the plaintiffs’ patents or other intellectual property. If we are not successful in defending ourselves against these claims, we may be required to pay damages and may be subject to injunctions, each of which could harm our business, results of operations, financial condition and reputation. We may be subject to future claims or allegations relating to our intellectual property rights. As we grow our business and expand our operations, we expect that we will continue to be subject to intellectual property claims and allegations. Patent and other intellectual property disputes or litigation may be protracted and expensive, and the results are difficult to predict and may require us to stop offering certain products, services or features, purchase licenses that may be
28
Table of Contents
expensive to procure, or modify our products or services. In addition, patent or other intellectual property disputes or litigation may result in significant settlement costs. Any of these events could harm our business, results of operations, financial condition and reputation.
In addition, we use open source software in our services and will continue to use open source software in the future. From time to time, we may be subject to claims brought against companies that incorporate open source software into their products or services, claiming ownership of, or demanding release of, the source code, the open source software and/or derivative works that were developed using such software, or otherwise seeking to enforce the terms of the applicable open source license. These claims could also result in litigation, require us to purchase a costly license, or require us to devote additional research and development resources to changing our products or services, any of which would have a negative effect on our business and results of operations.
Even if these matters do not result in litigation or are resolved in our favor or without significant cash settlements, the time and resources necessary to resolve them could harm our business, results of operations, financial condition and reputation.
We May Be Unable to Continue to Use the Domain Names That We Use in Our Business, or Prevent Third Parties From Acquiring and Using Domain Names That Infringe on, Are Similar to, or Otherwise Decrease the Value of Our Brand or Our Trademarks or Service Marks.
We have registered domain names for our websites that we use in our business. If we lose the ability to use a domain name, we may incur significant expenses to market our products and services under a new domain name, which could harm our business. In addition, our competitors could attempt to capitalize on our brand recognition by using domain names similar to ours. Domain names similar to ours have been registered in the United States and elsewhere. We may be unable to prevent third parties from acquiring and using domain names that infringe on, are similar to, or otherwise decrease the value of our brand or our trademarks or service marks. Protecting and enforcing our rights in our domain names and determining the rights of others may require litigation, which could result in substantial costs and diversion of management’s attention.
Confidentiality Agreements With Employees and Others May Not Adequately Prevent Disclosure of Trade Secrets and Other Proprietary Information.
In order to protect our technologies and processes, we rely in part on confidentiality agreements with our employees, licensees, independent contractors and other advisors. These agreements may not effectively prevent disclosure of confidential information, including trade secrets, and may not provide an adequate remedy in the event of unauthorized disclosure of confidential information. In addition, others may independently discover our trade secrets and proprietary information, and in such cases we could not assert any trade secret rights against such parties. To the extent that our employees, contractors or other third parties with whom we do business use intellectual property owned by others in their work for us, disputes may arise as to the rights in related or resulting know-how and inventions. The loss of trade secret protection could make it easier for third parties to compete with our products by copying functionality. In addition, any changes in, or unexpected interpretations of, intellectual property laws may compromise our ability to enforce our trade secret and intellectual property rights. Costly and time-consuming litigation could be necessary to enforce and determine the scope of our proprietary rights, and failure to obtain or maintain protection of our trade secrets or other proprietary information could harm our business, results of operations, reputation and competitive position.
We May Not Be Able to Halt the Operations of Websites That Aggregate or Misappropriate Our Data.
From time to time, third parties have misappropriated our data through website scraping, robots or other means, and aggregated this data on their websites with data from other companies. In addition, copycat websites have misappropriated data on our network and attempted to imitate our brand or the functionality of our websites. When we have become aware of such websites, we have employed technological or legal measures in an attempt to halt their operations. We may not be able, however, to detect all such websites in a timely manner and, even if
29
Table of Contents
we could, technological and legal measures may be insufficient to halt their operations. In some cases, particularly in the case of websites operating outside of the United States, our available remedies may not be adequate to protect us against the impact of the operation of such websites. Regardless of whether we can successfully enforce our rights against the operators of these websites, any measures that we may take could require us to expend significant financial or other resources, which could harm our business, results of operations or financial condition. In addition, to the extent that such activity creates confusion among consumers or advertisers, our brands and business could be harmed.
Risks Related to Regulatory Compliance and Legal Matters
We Are, and May in the Future Become, Subject to a Variety of Federal and State Laws, Many of Which Are Unsettled and Still Developing and Which Could Subject Us to Claims or Otherwise Harm Our Business.
We are currently subject to a variety of, and may in the future become subject to additional, federal and state laws that are continuously evolving and developing, including laws regarding the real estate, rental, mortgage and home improvement industries, mobile- and Internet-based businesses and other businesses that rely on advertising, as well as privacy and consumer protection laws, including the Telephone Consumer Protect Act, the Telemarketing Sales Rule, the CAN-SPAM Act, and similar state laws. These laws can be costly to comply with, require significant management time and effort, and subject us to claims, government enforcement actions, civil and criminal liability or other remedies, including suspension of business operations. These laws may conflict with each other, and if we comply with the laws of one jurisdiction, we may find that we are violating laws of another jurisdiction. Additionally, our ability to provide a specific target audience to advertisers is a significant competitive advantage. Any legislation reducing this ability would have a negative impact on our business and results of operations.
If we are unable to comply with these laws or regulations, if we become liable under these laws or regulations, or if unfavorable regulations or unfavorable interpretations of existing regulations by courts or regulatory bodies are implemented, we could be directly harmed and forced to implement new measures to reduce our exposure to this liability and it could cause the development of product or service offerings in affected markets to become impractical. This may require us to expend substantial resources or to discontinue certain products or services, limit our ability to expand our product and services offerings, or expand into new markets or otherwise harm our business, results of operations and financial condition. In addition, the increased attention focused on liability issues as a result of lawsuits and legislative proposals could harm our reputation or otherwise impact the growth of our business. Any costs incurred as a result of this potential liability could harm our business and results of operations.
We assist with the processing of customer credit card transactions and consumer credit report requests, which results in us receiving personally identifiable information. This information is increasingly subject to legislation and regulation in the United States. This legislation and regulation is generally intended to protect the privacy and security of personal information, including credit card information that is collected, processed and transmitted. We could be adversely affected if government regulations require us to significantly change our business practices with respect to this type of information.
Certain of our mortgage advertising products are operated by our wholly owned subsidiary, Zillow Group Mortgages, Inc., a licensed mortgage broker, pursuant to a support services agreement. Though we do not take mortage applications or make loans or credit decisions in connection with loans, Zillow Group Mortgages, Inc. is subject to stringent state and federal laws and regulations and to the scrutiny of state and federal government agencies as a licensed mortgage broker. Further, due to the geographic scope of our operations and the nature of the services we provide, we may be required to obtain and maintain additional real estate brokerage and mortgage broker licenses in certain states in which we operate. In connection with such licenses, we are required to designate individual licensed brokers of record. We cannot assure you that we are, and will remain at all times, in full compliance with state real estate and mortgage broker licensing laws and regulations and we may be subject to fines or penalties in the event of any non-compliance. If in the future a state agency were to determine
30
Table of Contents
that we are required to obtain a real estate or mortgage brokerage license in that state in order to receive payments or commissions from real estate professionals, or if we lose an existing license or are otherwise found to be in violation of a law or regulation, we may be subject to fines or legal penalties or our business operations in that state may be suspended until we obtain the license or otherwise remedy the compliance issue. Any failure to comply with applicable laws and regulations may limit our ability to expand into new markets, offer new products or continue to operate in one or more of our current markets.
We are From Time to Time Involved In, or May In the Future be Subject to, Claims, Suits, Government Investigations, and Other Proceedings That May Result In Adverse Outcomes.
We are from time to time involved in, or may in the future be subject to, claims, suits, government investigations, and proceedings arising from our business, including actions with respect to intellectual property claims, privacy, consumer protection, information security, data protection or law enforcement matters, tax matters, labor and employment claims, commercial claims, as well as actions involving content generated by our users, shareholder derivative actions, purported class action lawsuits, and other matters, including for example, the compliance review by the Wage and Hour Division of the U.S. Department of Labor described below in Part I, Item 3. Such claims, suits, government investigations, and proceedings are inherently uncertain and their results cannot be predicted with certainty. Regardless of the outcome, any such legal proceedings can have an adverse impact on us because of legal costs, diversion of management and other personnel, and other factors. For instance, for the fiscal year ended December 31, 2015, we incurred approximately $27.1 million in legal costs related to our litigation with Move, Inc., described below in Part I, Item 3. In addition, it is possible that a resolution of one or more such proceedings could result in reputational harm, liability, penalties, or sanctions, as well as judgments, consent decrees, or orders preventing us from offering certain features, functionalities, products, or services, or requiring a change in our business practices, products or technologies, which could in the future materially and adversely affect our business, operating results and financial condition. As an example, in connection with our litigation with Move, Inc., described below in Part I, Item 3, the plaintiffs recently indicated that they are seeking damages which, if actually awarded, would have a material adverse effect on our business, operating results and financial condition. See “Legal Proceedings” below in Part I, Item 3.
The Requirements of Being a Public Company May Strain Our Resources and Distract Our Management, Which Could Make It Difficult to Manage Our Business.
We are required to comply with various regulatory and reporting requirements, including those required by the SEC. Complying with these reporting and other regulatory requirements can be time-consuming and results in increased costs to us and could harm our business, results of operations and financial condition.
As a public company, we are subject to the reporting requirements of the Securities Exchange Act of 1934, as amended, or the Exchange Act. These requirements could strain our systems and resources. The Exchange Act also requires that we file annual, quarterly and current reports with respect to our business and financial condition. The Exchange Act requires that we maintain effective disclosure controls and procedures and internal control over financial reporting. To maintain and improve the effectiveness of our disclosure controls and procedures and internal control over financial reporting, we have committed significant resources, hired additional staff and provided additional management oversight. We have implemented additional procedures and processes for the purpose of addressing the standards and requirements applicable to public companies. Sustaining our growth will require us to commit additional management, operational and financial resources to identify new professionals to join us and to maintain appropriate operational and financial systems to adequately support expansion. These activities may divert management’s attention from other business concerns and could make it difficult to manage our business, which could harm our business, results of operations, financial condition and cash flows. In addition, if we identify any material weaknesses in our internal controls, we could lose investor confidence in the accuracy and completeness of our financial reports, which would cause the market price of our capital stock to decline.
31
Table of Contents
Risks Related to Our Financial Statements
We Incurred Significant Operating Losses in the Past and We May Not Be Able to Generate Sufficient Revenue to Be Profitable Over the Long Term.
We have incurred significant net operating losses in the past and, as of December 31, 2015, we had an accumulated deficit of $276.6 million. Although we have experienced significant growth in revenue, our revenue growth rate may decline in the future as the result of a variety of factors, including the maturation of our business. At the same time, we also expect our costs to increase in future periods as we continue to expend substantial financial resources to develop and expand our business, including on:
| • | product development; |
| • | sales and marketing; |
| • | technology infrastructure; |
| • | strategic opportunities, including commercial relationships and acquisitions; and |
| • | general administration, including legal and accounting expenses related to being a public company. |
These investments may not result in increased revenue or growth in our business. If we fail to continue to grow our revenue and overall business and to manage our expenses, we may incur significant losses in the future and not be able to maintain profitability.
We Rely on Assumptions and Estimates to Calculate Certain of our Key Growth Drivers, and Real or Perceived Inaccuracies in Such Metrics May Harm our Reputation and Negatively Affect our Business.
Our key metrics of unique users and Agent Advertisers are calculated using internal company data that has not been independently verified. While these numbers are based on what we believe to be reasonable calculations for the applicable period of measurement, there are inherent challenges in measuring such information. For example, our measurement of unique users may be affected by applications that automatically contact our servers to access our mobile applications and websites with no user action involved, and this activity can cause our system to count the user associated with such a device as a unique user on the day such contact occurs.
We regularly review and may adjust our processes for calculating our key growth drivers to improve their accuracy. Our measures of unique users and Agent Advertisers may differ from estimates published by third parties or from similarly-titled metrics of our competitors due to differences in methodology. If real estate professionals, advertisers or investors do not perceive our key growth drivers to be accurate representations of our user or advertiser engagement, or if we discover material inaccuracies in our key growth drivers, our reputation may be harmed, and real estate professionals and advertisers may be less willing to allocate their resources to our products and services, which could negatively affect our business and operating results.
We Expect Our Results of Operations to Fluctuate on a Quarterly and Annual Basis.
Our revenue and results of operations could vary significantly from period to period and may fail to match expectations as a result of a variety of factors, some of which are outside our control. The other risk factors discussed in this “Risk Factors” section may contribute to the variability of our quarterly and annual results. In addition, our results may fluctuate as a result of fluctuations in the quantity of, and the price at which we are able to sell, our remnant advertising, seasonal variances of home sales, which historically peak in the spring and summer seasons, and the size and seasonal variability of our advertisers’ marketing budgets. As a result of the potential variations in our revenue and results of operations, period-to-period comparisons may not be meaningful and the results of any one period should not be relied on as an indication of future performance. In addition, our results of operations may not meet the expectations of investors or public market analysts who follow us, which may adversely affect our stock price.
32
Table of Contents
Our Ability to Use Our Net Operating Loss Carryforwards and Certain Other Tax Attributes May Be Limited.
As of December 31, 2015, we had federal net operating loss carryforwards of approximately $735.2 million, state net operating loss carryforwards of approximately $11.6 million (tax effected), and net tax credit carryforwards of approximately $17.2 million. Under Sections 382 and 383 of the Internal Revenue Code of 1986, as amended, if a corporation undergoes an “ownership change,” the corporation’s ability to use its pre-change net operating loss carryforwards and other pre-change tax attributes, such as research tax credits, to offset its post-change income or income tax liability may be limited. In general, an “ownership change” will occur if there is a cumulative change in our ownership by certain “5-percent shareholders” that exceeds 50 percentage points over a rolling three-year period. In connection with Zillow’s August 2013 public offering of Zillow Class A Common stock, Zillow experienced an ownership change that triggered Section 382 and 383, which may limit our ability to utilize net operating loss and tax credit carryforwards. In connection with Zillow Group’s February 2015 acquisition of Trulia, Trulia experienced an ownership change that triggered Section 382 and 383, which may limit Zillow Group’s ability to utilize Trulia’s net operating loss and tax credit carryforwards. If we experience one or more ownership changes in the future as a result of future transactions in our stock, our ability to utilize net operating loss carryforwards could be limited. Furthermore, our ability to utilize net operating loss carryforwards of any companies that we have acquired or may acquire in the future may be limited. As a result, if we earn net taxable income, our ability to use our pre-change net operating loss carryforwards, other pre-change tax attributes, or net operating loss carryforwards of any acquired companies to offset our federal taxable income or reduce our federal income tax liability may be subject to limitation.
Risks Related to Ownership of Our Common and Capital Stock
Our Class A Common Stock and Class C Capital Stock Prices May Be Volatile, and the Value of an Investment in Our Class A Common Stock and Class C Capital Stock May Decline.
An active, liquid and orderly market for our Class A common stock and Class C capital stock may not be sustained, which could depress the trading price of our Class A common stock and Class C capital stock. The trading price of our Class A common stock and Class C capital stock has at times experienced price volatility and may continue to be volatile. For example, since shares of our Class A common stock began trading in February 2015, the closing price of our Class A common stock has ranged from $22.58 per share to $39.13 per share (adjusted for the Class C Stock Split (as defined below)) through December 31, 2015. Since shares of our Class C capital stock began trading in August 2015, the closing price of our Class C capital stock has ranged from $23.27 per share to $33.45 per share through December 31, 2015. The market price of our Class A common stock and Class C capital stock could be subject to wide fluctuations in response to many of the risk factors discussed in this Annual Report on Form 10-K and others beyond our control, including:
| • | actual or anticipated fluctuations in our financial condition and results of operations; |
| • | changes in projected operational and financial results; |
| • | addition or loss of significant customers; |
| • | actual or anticipated changes in our growth rate relative to that of our competitors; |
| • | announcements by us or our competitors of significant acquisitions, strategic partnerships, joint ventures or capital-raising activities or commitments; |
| • | announcements of technological innovations or new offerings by us or our competitors; |
| • | additions or departures of key personnel; |
| • | changes in laws or regulations applicable to our services; |
| • | fluctuations in the valuation of companies perceived by investors to be comparable to us; |
| • | issuance of new or updated research or reports by securities analysts; |
| • | sales of our Class A common stock and Class C capital stock by us or our shareholders; |
33
Table of Contents
| • | issuances of our Class A common stock upon conversion of Trulia’s Convertible Senior Notes due in 2020; |
| • | stock price and volume fluctuations attributable to inconsistent trading volume levels of our shares; and |
| • | general economic and market conditions. |
Furthermore, the stock markets in recent years have experienced extreme price and volume fluctuations that have affected and continue to affect the market prices of the equity securities of many companies. These fluctuations often have been unrelated or disproportionate to the operating performance of those companies. These broad market and industry fluctuations, as well as general economic, political and market conditions such as recessions, interest rate changes or international currency fluctuations, may negatively impact the market price of our Class A common stock and Class C capital stock. In the past, companies that have experienced volatility in the market price of their stock have been subject to securities class action litigation. We have in the past been the target of this type of litigation, and we may continue to be the target of this type of litigation in the future. Past and future securities litigation against us could result in substantial costs and divert management’s attention from other business concerns, which could harm our business, results of operations or financial condition.
The Structure of Our Capital Stock as Contained in Our Charter Documents Has the Effect of Concentrating Voting Control With Our Founders, and Limits Your Ability to Influence Corporate Matters.
Since Zillow Group’s inception, our capital structure has included authorized Class A common stock and authorized Class B common stock. Our Class A common stock entitles its holder to one vote per share, and our Class B common stock entitles its holder to 10 votes per share. All shares of Class B common stock have been and are held or controlled by our founders, Richard Barton and Lloyd Frink. As of December 31, 2015, Mr. Barton’s holdings and Mr. Frink’s holdings represented approximately 32.6% and 21.3%, respectively, of the voting power of our outstanding capital stock.
For the foreseeable future, Mr. Barton and Mr. Frink will therefore have significant control over our management and affairs and will be able to control most matters requiring shareholder approval, including the election or removal (with or without cause) of directors and the approval of any significant corporate transaction, such as a merger or other sale of us or our assets. In addition, because our Class C capital stock carries no voting rights (except as required by applicable law or as expressly provided in our amended and restated articles of incorporation), the issuance of Class C capital stock (instead of Class A common stock) could prolong the duration of Mr. Barton’s and Mr. Frink’s relative ownership of our voting power. This concentrated control could delay, defer or prevent a change of control, merger, consolidation, takeover, or other business combination involving us that you, as a shareholder, may otherwise support. This concentrated control could also discourage a potential investor from acquiring our Class A common stock or Class C capital stock due to the limited voting power of such stock relative to the Class B common stock and might harm the market price of our Class A common stock and Class C capital stock.
Future Sales of Our Stock in the Public Market Could Cause Our Stock Price to Decline.
Our Class A common stock began trading on The Nasdaq Global Select Market on February 18, 2015, and our Class C capital stock began trading on The Nasdaq Global Select Market on August 17, 2015. We cannot predict the effect, if any, that market sales of shares or the availability of shares for sale will have on the prevailing trading price of our Class A common stock and Class C capital stock from time to time. There is currently no contractual restriction on our ability to issue additional shares, and all of our outstanding shares are generally freely tradable, except for shares held by our “affiliates” as defined in Rule 144 under the Securities Act, which may be sold in compliance with the volume restrictions of Rule 144. Sales of a substantial number of shares of our Class A common stock and Class C capital stock could cause our stock price to decline. In addition, we may in the future issue shares of Class C capital stock for financings, acquisitions or equity incentives. If we issue shares of Class C capital stock in the future, such issuances would have a dilutive effect on the economic interest of our Class A common stock.
34
Table of Contents
If Securities or Industry Analysts Do Not Publish Research or Publish Inaccurate or Unfavorable Research About Our Business, Our Class A Common Stock and Class C Capital Stock Price and Trading Volume Could Decline.
The trading market for our Class A common stock and Class C capital stock depends in part on the research and reports that securities or industry analysts publish about our company. If few or no securities or industry analysts cover our company, the market price of our publicly-traded stock could be negatively impacted. If securities or industry analysts cover us and if one or more of such analysts downgrade our stock or publish inaccurate or unfavorable research about our business, our stock price would likely decline. If one or more of the analysts covering us fail to publish reports on us regularly, demand for our stock could decline, which could cause our stock price and trading volume to decline.
If We Issue Additional Equity Securities or Issue Convertible Debt to Raise Capital, It May Have a Dilutive Effect on Shareholders’ Investment.
If we raise additional capital through further issuances of equity or convertible debt securities, our existing shareholders could suffer significant dilution in their percentage ownership of us. Moreover, any new equity securities we issue could have rights, preferences and privileges senior to those of holders of our common stock.
Anti-Takeover Provisions in Our Charter Documents and Under Washington Law Could Make an Acquisition of Us More Difficult, Limit Attempts by Shareholders to Replace or Remove Our Management and Affect the Market Price of Our Stock.
Provisions in our articles of incorporation and bylaws, as amended and restated, may have the effect of delaying or preventing a change of control or changes in our management. Our amended and restated articles of incorporation or amended and restated bylaws include provisions, some of which will become effective only after the date, which we refer to as the threshold date, on which the Class B common stock controlled by our founders represents less than 7% of the aggregate number of shares of our outstanding Class A common stock and Class B common stock, that:
| • | set forth the structure of our capital stock, which concentrates voting control of matters submitted to a vote of our shareholders with the holders of our Class B common stock, which is held or controlled by our founders; |
| • | authorize our board of directors to issue, without further action by our shareholders, up to 30,000,000 shares of undesignated preferred stock, subject, prior to the threshold date, to the approval rights of the holders of our Class B common stock; |
| • | establish that our board of directors will be divided into three classes, Class I, Class II and Class III, with each class serving three-year staggered terms; |
| • | prohibit cumulative voting in the election of directors; |
| • | provide that, after the threshold date, our directors may be removed only for cause; |
| • | provide that, after the threshold date, vacancies on our board of directors may be filled only by the affirmative vote of a majority of directors then in office or by the sole remaining director; |
| • | provide that only our board of directors may change the board’s size; |
| • | specify that special meetings of our shareholders can be called only by the chair of our board of directors, our board of directors, our chief executive officer, our president or, prior to the threshold date, holders of at least 25% of all the votes entitled to be cast on any issue proposed to be considered at any such special meeting; |
| • | establish an advance notice procedure for shareholder proposals to be brought before a meeting of shareholders, including proposed nominations of persons for election to our board of directors; |
35
Table of Contents
| • | require the approval of our board of directors or the holders of at least two-thirds of all the votes entitled to be cast by shareholders generally in the election of directors, voting together as a single group, to amend or repeal our bylaws; and |
| • | require the approval of not less than two-thirds of all the votes entitled to be cast on a proposed amendment, voting together as a single group, to amend certain provisions of our articles of incorporation. |
Prior to the threshold date, our directors can be removed with or without cause by holders of our Class A common stock and Class B common stock, voting together as a single group, and vacancies on the board of directors may be filled by such shareholders, voting together as a single group. Given the structure of our capital stock, our founders, Richard Barton and Lloyd Frink, who hold or control our Class B common stock, will have the ability for the foreseeable future to control these shareholder actions. See the risk factor above titled “The Structure of Our Capital Stock as Contained in Our Charter Documents Has the Effect of Concentrating Voting Control With our Founders, and Limits Your Ability to Influence Corporate Matters.”
The provisions described above, after the threshold date, may frustrate or prevent any attempts by our shareholders to replace or remove our current management by making it more difficult for shareholders to replace members of our board of directors, which board is responsible for appointing our management. In addition, because we are incorporated in the State of Washington, we are governed by the provisions of Chapter 23B.19 of the Washington Business Corporation Act, which prohibits certain business combinations between us and certain significant shareholders unless specified conditions are met. These provisions may also have the effect of delaying or preventing a change of control of our company, even if this change of control would benefit our shareholders.
Item 1B. Unresolved Staff Comments
Not applicable.
We have various operating leases for office space and equipment.
Seattle, Washington
In March 2011, we entered into a lease agreement for office space that houses our corporate headquarters in Seattle (as amended from time to time, the “Seattle Lease”). Pursuant to the terms of the Seattle Lease, we currently occupy a total of 155,042 square feet, and we are obligated to make escalating monthly lease payments that began in December 2012 and continue through December 2024. In November 2014, we entered into a lease amendment under which we will lease an additional 113,470 square feet of office space. The Company has taken possession of a portion of the additional office space and will continue to take possession as space becomes available through 2017 under the same terms and conditions.
San Francisco, California
In connection with our February 2015 acquisition of Trulia, Inc. (“Trulia”), we assumed a lease agreement for office space in San Francisco (as amended from time to time, the “San Francisco Lease”), which houses Trulia’s corporate headquarters and beginning in March 2015, also houses Zillow’s personnel located in San Francisco. Pursuant to the terms of the San Francisco Lease, we lease a total of approximately 79,000 square feet, and we are obligated to make escalating monthly lease payments that began in November 2014 and continue through September 2023. In July 2014, Trulia entered into a lease amendment under which we lease an additional 26,620 square feet of office space under the same terms and conditions.
36
Table of Contents
In November 2012, we entered into an operating lease in San Francisco, California for 18,353 square feet under which we are obligated to make escalating monthly lease payments which began in December 2012 and continue through November 2018. In March 2015, we ceased use of this space in connection with our February 2015 acquisition of Trulia, and in May 2015, we sublet this office space to another occupant. Pursuant to the terms of the operating lease, we lease an additional 8,311 square feet of office space that commenced in October 2015 under the same terms and conditions.
New York, New York
In February 2014, we entered into an operating lease in New York (as amended from time to time, the “New York Lease”). Pursuant to the terms of the New York Lease, we lease a total of approximately 39,900 square feet, and we are obligated to make escalating monthly lease payments that began in August 2014 and continue through November 2024. In July 2015, we sublet approximately 6,650 square feet of this office space to another occupant.
Denver, Colorado
In connection with our February 2015 acquisition of Trulia, we assumed a lease agreement for office space in Denver. Pursuant to the terms of the lease, we lease a total of approximately 65,000 square feet, and we are obligated to make escalating monthly lease payments that began in November 2014 and continue through October 2021.
Irvine, California
In April 2012, we entered into a lease agreement for office space in Irvine (as amended from time to time, the “Irvine Lease”). Pursuant to the terms of the Irvine Lease, we lease a total of approximately 60,000 square feet under which we are obligated to make escalating monthly lease payments which began in August 2012 and continue through July 2022.
We lease additional office space in San Francisco, California, Chicago, Illinois, Denver, Colorado, Cincinnati, Ohio, Lincoln, Nebraska and Vancouver, British Columbia.
In March 2010, Smarter Agent, LLC (“Smarter Agent”) filed a complaint against us and multiple other defendants, including HotPads, Inc. (“HotPads”), for patent infringement in the U.S. District Court for the District of Delaware. The complaint alleges, among other things, that our mobile technology infringes three patents held by Smarter Agent purporting to cover: a “Global positioning-based real estate database access device and method,” a “Position-based information access device and method” and a “Position-based information access device and method of searching,” and seeks an injunction against the alleged infringing activities and an unspecified award for damages. In November 2010, the U.S. Patent and Trademark Office granted our petition for re-examination of the three patents-in-suit, and, to date, all claims of all three patents remain rejected in the re-examination proceedings, including through appeals to the Patent Trial and Appeal Board. In March 2011, the court granted a stay of the litigation pending the completion of the re-examination proceedings. In addition, in October 2011, Smarter Agent filed a substantially similar complaint against Diverse Solutions, Inc. (“Diverse Solutions”), StreetEasy, Market Leader (a subsidiary of Trulia), and other defendants, for patent infringement in the U.S. District Court for the District of Delaware. On October 31, 2011, we acquired substantially all of the operating assets and certain liabilities of Diverse Solutions, including the Smarter Agent complaint against Diverse Solutions. On December 14, 2012, we acquired HotPads, and took responsibility for the Smarter Agent complaint against HotPads. On August 26, 2013, we acquired StreetEasy, and took responsibility for the Smarter Agent complaint against StreetEasy. On February 17, 2015, we acquired Trulia, and took responsibility for the Smarter Agent complaint against Market Leader. On September 22, 2015, the court dismissed the case against Zillow, HotPads, and Trulia. On September 25, 2015, the court dismissed the case against Market Leader and Diverse Solutions. On October 6, 2015, the court dismissed the case against StreetEasy.
37
Table of Contents
In September 2010, LendingTree, LLC (“LendingTree”) filed a complaint against us for patent infringement in the U.S. District Court for the Western District of North Carolina. The complaint alleged, among other things, that our website technology infringes two patents purporting to cover a “Method and computer network for coordinating a loan over the internet.” The complaint sought, among other things, a judgment that we infringed certain patents held by LendingTree, an injunction against the alleged infringing activities and an award for damages. We denied the allegations and asserted defenses and counterclaims seeking declarations that we are not infringing the patents and that the patents are invalid. In March 2014, a federal jury found that Zillow does not infringe the patents and that the patents asserted by LendingTree are invalid. In April, 2014, LendingTree filed two motions for judgment as a matter of law and for a new trial, all of which we opposed. In October 2014, the Court issued an order upholding the jury verdict and denying LendingTree’s motions. In November 2014, LendingTree filed a notice of appeal and, in September 2015, LendingTree filed its opening brief. In December 2015, we filed a response brief to LendingTree’s opening brief.
In March 2014, Move, Inc., the National Association of Realtors and three related entities, filed a complaint against us and Errol Samuelson, our Chief Industry Development Officer, in the Superior Court of the State of Washington in King County, alleging, among other things, that Zillow and Mr. Samuelson misappropriated plaintiffs’ trade secrets in connection with Mr. Samuelson joining Zillow in March 2014. The plaintiffs seek, among other things, an injunction against the alleged misappropriations and Mr. Samuelson working for us, as well as significant monetary damages. In February 2015, plaintiffs filed an amended complaint that, among other things, added Curt Beardsley, our Vice President of MLS Partnerships, as a defendant in the matter. In August 2015, Zillow filed an amended answer and counterclaim against plaintiffs that alleged, among other things, that plaintiffs violated the Washington Trade Secrets Act and aided and abetted a breach of the duty of confidentiality through the public filing of a document that included Zillow’s confidential information and trade secrets. On January 8, 2016, plaintiffs filed a motion seeking sanctions against defendants for alleged evidence spoliation, and defendants each filed a motion for partial summary judgment against plaintiffs regarding the preemption of their common law claims by the Uniform Trade Secrets Act. A hearing was held on February 5, 2016 regarding the motions that the court is currently taking under advisement. An evidentiary hearing regarding plaintiffs’ spoliation motion has been scheduled for April 2016. The plaintiffs recently indicated that they are seeking damages which, if actually awarded, would have a material adverse effect on our business. We believe the plaintiffs’ allegations are without merit and their calculations of damages are baseless. We deny the allegations of any wrongdoing and intend to vigorously defend the claims in the lawsuit. The trial date is scheduled for June 2016.
In August 2014, four purported class action lawsuits were filed by plaintiffs against Trulia and its directors, Zillow, and Zebra Holdco, Inc. in connection with Zillow’s proposed acquisition of Trulia. One of those purported class actions, captioned Collier et al. v. Trulia, Inc., et al., was brought in the Superior Court of the State of California for the County of San Francisco, however on October 7, 2014, plaintiff in the Collier action filed a new complaint in the Delaware Court of Chancery alleging substantially the same claims and seeking substantially the same relief as the original complaint filed in California. On October 8, 2014, plaintiff in the Collier action filed a request for dismissal of the California case without prejudice. The other three of the purported class action lawsuits, captioned Shue et al. v. Trulia, Inc., et al., Sciabacucci et al. v. Trulia, Inc., et al., and Steinberg et al. v. Trulia, Inc. et al., were brought in the Delaware Court of Chancery. All four lawsuits allege that Trulia’s directors breached their fiduciary duties to Trulia stockholders, and that the other defendants aided and abetted such breaches, by seeking to sell Trulia through an allegedly unfair process and for an unfair price and on unfair terms. All lawsuits sought, among other things, equitable relief that would have enjoined the consummation of Zillow’s proposed acquisition of Trulia and attorneys’ fees and costs. The Delaware actions also seek rescission of the Merger Agreement or rescissory damages and orders directing the defendants to account for alleged damages suffered by the plaintiffs and the purported class as a result of the defendants’ alleged wrongdoing. On September 24, 2014, plaintiff in the Sciabacucci action filed (1) a motion for expedited proceedings, (2) a motion for a preliminary injunction, (3) a request for production of documents from defendants, and (4) notice of depositions. On October 13, 2014, the Delaware Court of Chancery issued an order consolidating all of the Delaware actions into one matter captioned In re Trulia, Inc. Stockholder Litigation. On
38
Table of Contents
October 13 and 14, 2014, the above-referenced motions were refiled under the consolidated case number. On November 14, 2014, plaintiffs again refiled their motion for a preliminary injunction challenging the proposed acquisition. On November 19, 2014, the parties entered into a Memorandum of Understanding, documenting an agreement-in-principle for the settlement of the consolidated litigation, pursuant to which Trulia agreed to make certain supplemental disclosures in a Form 8-K. The Memorandum of Understanding was filed with the Court of Chancery that same day. Thereafter, the parties negotiated and agreed to a stipulation of settlement, and after notice to the class, the Court of Chancery held a settlement hearing on September 16, 2015 where the Court requested the parties to make further submission in connection with the settlement. By an opinion dated January 22, 2016, the Court denied approval of the settlement.
In July 2015, two purported class action lawsuits were filed against us and each of our directors in the Superior Court of the State of Washington in King County, alleging, among other things, that the directors breached their fiduciary duties in connection with the approval of the issuance of non-voting Class C capital stock as a dividend. The complaints seek, among other things, injunctive relief and unspecified monetary damages. A hearing on the plaintiffs’ motion seeking a preliminary injunction to enjoin the issuance of the Class C Stock Split was held on August 5, 2015, and the court denied plaintiffs’ motion for a preliminary injunction. Plaintiffs filed a consolidated class action complaint on September 18, 2015 naming and seeking relief from only our co-founders as defendants. On December 4, 2015, defendants filed a motion to dismiss the consolidated class action complaint, and a hearing to consider that motion to dismiss is scheduled for March 2016.
In March 2015, the Wage and Hour Division of the U.S. Department of Labor (“DOL”) notified the Company that it was initiating a compliance review to determine the Company’s compliance with one or more federal labor laws enforced by the DOL. The Company understands that the scope of this review is limited to the review of the Company’s compliance with certain wage and hour laws with respect to Zillow, Inc. inside sales consultants during a two-year period between 2013 and 2015. In October 2015, the DOL orally informed us that the compliance review is ongoing but that, based on its preliminary findings, it believes the Company may have failed to pay overtime to such inside sales consultants. The DOL has made no assessment of damages or penalties, however, nor has it made a determination that we violated one or more federal labor laws. We have cooperated and continue to cooperate with the DOL in its compliance review. If the DOL were to finally determine that we violated one or more federal labor laws, we may be required to make certain payments of back wages and other amounts to such inside sales consultants or take other corrective actions, and may be subject to fines or penalties.
Although the results of litigation cannot be predicted with certainty, we currently believe we have substantial and meritorious defenses to the outstanding claims.
From time to time, we are involved in litigation and claims that arise in the ordinary course of business and although we cannot be certain of the outcome of any such litigation or claims, nor the amount of damages and exposure that we could incur, we currently believe that the final disposition of such matters will not have a material effect on our business, financial position, results of operations or cash flow. Regardless of the outcome, litigation can have an adverse impact on us because of defense and settlement costs, diversion of management resources and other factors.
Item 4. Mine Safety Disclosures
Not applicable.
39
Table of Contents
PART II
Item 5. Market for Registrant’s Common Equity, Related Stockholder Matters and Issuer Purchases of Equity Securities
Market Information and Holders
Our Class A common stock has traded on The Nasdaq Global Select Market under the symbol “ZG” since August 17, 2015 and under the symbol “Z” from July 20, 2011 through August 14, 2015. The following table sets forth, for each quarterly period indicated, the high and low sales prices per share for our Class A common stock as quoted on The Nasdaq Global Select Market, adjusted for the Class C Stock Split (see Note 14 of Part II, Item 8 of this Annual Report on Form 10-K for additional information related to the Class C Stock Split):
| High | Low | |||||||
| Year Ended December 31, 2015: |
||||||||
| First Quarter |
$ | 44.40 | $ | 29.76 | ||||
| Second Quarter |
34.69 | 26.73 | ||||||
| Third Quarter |
29.84 | 22.58 | ||||||
| Fourth Quarter |
35.47 | 24.76 | ||||||
| High | Low | |||||||
| Year Ended December 31, 2014: |
||||||||
| First Quarter |
$ | 34.07 | $ | 25.33 | ||||
| Second Quarter |
48.50 | 28.21 | ||||||
| Third Quarter |
54.97 | 37.51 | ||||||
| Fourth Quarter |
42.63 | 31.41 | ||||||
Our Class B common stock is not listed and there is no established public trading market.
Our Class C capital stock has traded on The Nasdaq Global Select Market under the symbol “Z” since August 17, 2015. Prior to that time, there was no public market for our Class C capital stock. The following table sets forth, for each quarterly period indicated, the high and low sales prices per share for our Class C capital stock as quoted on The Nasdaq Global Select Market:
| High | Low | |||||||
| Year Ended December 31, 2015: |
||||||||
| First Quarter |
$ | — | $ | — | ||||
| Second Quarter |
— | — | ||||||
| Third Quarter |
28.54 | 23.00 | ||||||
| Fourth Quarter |
33.62 | 22.80 | ||||||
Holders of Record
As of February 4, 2016, there were 126, three, and 129 holders of record of our Class A common stock, our Class B common stock, and our Class C capital stock, respectively.
Dividends
We have never declared or paid a cash dividend on our common or capital stock and we intend to retain all available funds and any future earnings to fund the development and growth of our business. We therefore do not anticipate paying any cash dividends on our common or capital stock in the foreseeable future. Any future determinations to pay dividends on our common or capital stock would depend on our results of operations, our financial condition and liquidity requirements, restrictions that may be imposed by applicable law or our contracts, and any other factors that our board of directors may consider relevant.
40
Table of Contents
Recent Sales of Unregistered Securities and Use of Proceeds from Registered Securities
Recent Sales of Unregistered Securities
On February 19, 2015, in connection with a sponsorship agreement involving an equity-based payment to a non-employee recipient, we issued 1,391 (the share amount has not been adjusted for the Class C Stock Split) restricted shares of our Class A common stock to the recipient. This transaction was exempt from registration under the Securities Act in reliance upon Section 4(a)(2) of the Securities Act and Regulation D promulgated thereunder. The recipient of restricted shares of our Class A common stock in this transaction represented their intentions to acquire the securities for investment only and not with a view to or for sale in connection with any distribution thereof, and appropriate legends were placed upon the stock certificates issued in these transactions. The recipient had adequate access, through their relationships with us, to information about Zillow Group.
There were no other sales of unregistered securities during the year ended December 31, 2015.
Purchases of Equity Securities by the Issuer
None.
Performance Graph
The following graph compares our cumulative total shareholder return on Zillow Group’s common stock with the NASDAQ Composite Index and the RDG Internet Composite Index.
For our Class A common stock, this graph covers the period from July 20, 2011, using the closing price for the first day of trading immediately following the effectiveness of our initial public offering per SEC regulations, through December 31, 2015 (adjusted to give effect to the Class C Stock Split). This graph assumes that the value of the investment in Zillow Group’s Class A common stock and each index (including reinvestment of dividends) was $100 on July 20, 2011.
For our Class C capital stock, this graph covers the period from August 3, 2015, using the closing price for the first day of trading during the when-issued trading period prior to the Class C Stock Split, through December 31, 2015. This graph assumes that the value of the investment in Zillow Group’s Class C capital stock (including reinvestment of dividends) was $100 on August 3, 2015.
41
Table of Contents
The information contained in the graph is based on historical data and is not intended to forecast possible future performance.
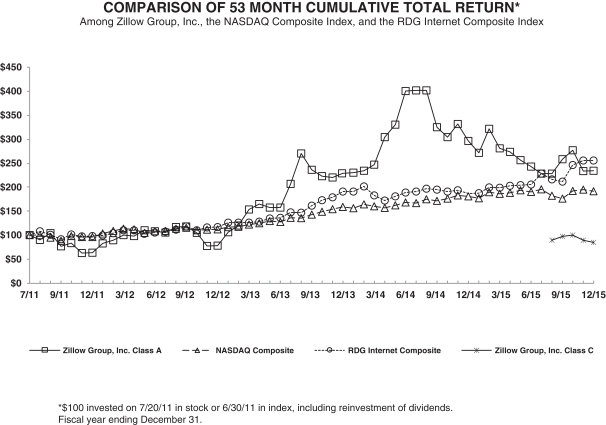
42
Table of Contents
Item 6. Selected Financial Data
The selected financial data set forth below should be read in conjunction with the information under “Management’s Discussion and Analysis of Financial Condition and Results of Operations” and our consolidated financial statements and related notes included elsewhere in this Annual Report on Form 10-K and our previously audited financial statements that are not included herein. We have included Trulia, Inc. in Zillow Group’s results of operations prospectively after February 17, 2015, the date of acquisition. Our historical results are not necessarily indicative of our results to be expected in any future period. We have given retroactive effect to prior period share and per share amounts in our consolidated statements of operations for the August 2015 Class C Stock Split so that prior periods are comparable to current period presentation (see Note 14 of Part II, Item 8 of this Annual Report on Form 10-K for additional information related to the Class C Stock Split).
| Year Ended December 31, | ||||||||||||||||||||
| 2015 | 2014 | 2013 | 2012 | 2011 | ||||||||||||||||
| (in thousands, except per share data) | ||||||||||||||||||||
| Statement of Operations Data: |
||||||||||||||||||||
| Revenue |
$ | 644,677 | $ | 325,893 | $ | 197,545 | $ | 116,850 | $ | 66,053 | ||||||||||
| Costs and expenses: |
||||||||||||||||||||
| Cost of revenue (exclusive of amortization) (1)(2) |
61,614 | 29,461 | 18,810 | 14,043 | 10,575 | |||||||||||||||
| Sales and marketing (1) |
307,089 | 169,462 | 108,891 | 49,105 | 25,725 | |||||||||||||||
| Technology and development (1) |
198,565 | 84,669 | 48,498 | 26,614 | 14,143 | |||||||||||||||
| General and administrative (1) |
170,445 | 65,503 | 37,919 | 20,024 | 14,268 | |||||||||||||||
| Acquisition-related costs |
16,576 | 21,493 | 376 | 1,267 | 345 | |||||||||||||||
| Restructuring costs (1) |
35,551 | — | — | — | — | |||||||||||||||
| Loss on divestiture of business |
4,368 | — | — | — | — | |||||||||||||||
|
|
|
|
|
|
|
|
|
|
|
|||||||||||
| Total costs and expenses |
794,208 | 370,588 | 214,494 | 111,053 | 65,056 | |||||||||||||||
|
|
|
|
|
|
|
|
|
|
|
|||||||||||
| Income (loss) from operations |
(149,531 | ) | (44,695 | ) | (16,949 | ) | 5,797 | 997 | ||||||||||||
| Other income |
1,501 | 1,085 | 385 | 142 | 105 | |||||||||||||||
| Interest expense |
(5,489 | ) | — | — | — | — | ||||||||||||||
|
|
|
|
|
|
|
|
|
|
|
|||||||||||
| Income (loss) before income taxes |
(153,519 | ) | (43,610 | ) | (16,564 | ) | 5,939 | 1,102 | ||||||||||||
| Income tax benefit |
4,645 | — | 4,111 | — | — | |||||||||||||||
|
|
|
|
|
|
|
|
|
|
|
|||||||||||
| Net income (loss) |
$ | (148,874 | ) | $ | (43,610 | ) | $ | (12,453 | ) | $ | 5,939 | $ | 1,102 | |||||||
|
|
|
|
|
|
|
|
|
|
|
|||||||||||
| Net income (loss) attributable to common shareholders |
$ | (148,874 | ) | $ | (43,610 | ) | $ | (12,453 | ) | $ | 5,939 | $ | — | |||||||
| Net income (loss) per share attributable to common shareholders—basic |
$ | (0.88 | ) | $ | (0.36 | ) | $ | (0.12 | ) | $ | 0.07 | $ | — | |||||||
| Net income (loss) per share attributable to common shareholders—diluted |
$ | (0.88 | ) | $ | (0.36 | ) | $ | (0.12 | ) | $ | 0.06 | $ | — | |||||||
| Weighted average shares outstanding—basic |
169,767 | 120,027 | 108,087 | 90,582 | 59,445 | |||||||||||||||
| Weighted average shares outstanding—diluted |
169,767 | 120,027 | 108,087 | 98,127 | 66,915 | |||||||||||||||
| (1) Includes share-based compensation as follows: |
||||||||||||||||||||
| Cost of revenue |
$ | 4,694 | $ | 1,844 | $ | 737 | $ | 380 | $ | 189 | ||||||||||
| Sales and marketing |
25,391 | 7,320 | 10,969 | 2,433 | 388 | |||||||||||||||
| Technology and development |
26,849 | 11,681 | 4,660 | 1,886 | 546 | |||||||||||||||
| General and administrative |
48,280 | 13,240 | 7,070 | 1,912 | 822 | |||||||||||||||
| Restructuring costs |
14,859 | — | — | — | — | |||||||||||||||
|
|
|
|
|
|
|
|
|
|
|
|||||||||||
| Total |
$ | 120,073 | $ | 34,085 | $ | 23,436 | $ | 6,611 | $ | 1,945 | ||||||||||
|
|
|
|
|
|
|
|
|
|
|
|||||||||||
| (2) Amortization of website development costs and intangible assets included in technology and development |
$ | 63,189 | $ | 29,487 | $ | 19,791 | $ | 11,179 | $ | 5,384 | ||||||||||
43
Table of Contents
| At December 31, | ||||||||||||||||||||
| 2015 | 2014 | 2013 | 2012 | 2011 | ||||||||||||||||
| (in thousands) | ||||||||||||||||||||
| Balance Sheet Data: |
|
|||||||||||||||||||
| Cash, cash equivalents and investments |
$ | 520,289 | $ | 455,920 | $ | 437,726 | $ | 203,483 | $ | 92,136 | ||||||||||
| Working capital |
493,672 | 352,141 | 282,903 | 184,661 | 71,713 | |||||||||||||||
| Property and equipment, net |
89,639 | 41,600 | 27,408 | 16,948 | 7,227 | |||||||||||||||
| Total assets |
3,135,700 | 649,730 | 608,063 | 307,549 | 116,668 | |||||||||||||||
| Long-term debt |
230,000 | — | — | — | — | |||||||||||||||
| Deferred tax liabilities and other long-term liabilities |
132,482 | — | — | — | — | |||||||||||||||
| Total shareholders’ equity |
2,679,053 | 588,779 | 567,796 | 280,317 | 101,213 | |||||||||||||||
44
Table of Contents
Item 7. Management’s Discussion and Analysis of Financial Condition and Results of Operations
The following discussion of our financial condition and results of operations should be read in conjunction with our audited consolidated financial statements and the related notes included elsewhere in this Annual Report on Form 10-K. In addition to historical financial information, the following discussion contains forward-looking statements that reflect our plans, estimates and beliefs. Our actual results may differ materially from those contained in or implied by any forward-looking statements. Factors that could cause or contribute to these differences include those discussed below and elsewhere in this Annual Report on Form 10-K, particularly in “Risk Factors”.
Overview of our Business
Zillow Group, Inc. operates the leading real estate and home-related information marketplaces on mobile and the Web, with a complementary portfolio of brands and products to help people find vital information about homes and connect with local professionals. Zillow Group’s brands focus on all stages of the home lifecycle: renting, buying, selling, financing and home improvement. The Zillow Group portfolio of consumer brands includes real estate and rental marketplaces Zillow, Trulia, StreetEasy and HotPads. In addition, Zillow Group works with tens of thousands of real estate agents, mortgage and rental professionals, helping maximize business opportunities and connect to millions of consumers. We also own and operate a number of brands for real estate, rental and mortgage professionals, including DotLoop, Mortech, Diverse Solutions and Retsly.
We generate revenue from the sale of advertising services and our suite of tools to businesses and professionals primarily associated with the real estate, rental and mortgage industries. These professionals include local real estate and rental professionals, mortgage professionals and brand advertisers. Our two revenue categories are marketplace revenue and display revenue.
Marketplace revenue for the year ended December 31, 2015 consisted of real estate, mortgages, and Market Leader revenue. Real estate revenue primarily includes revenue from the sale of advertising services and a suite of tools sold to real estate professionals, as well as revenue generated by Zillow Group Rentals, which includes our rentals marketplace and suite of tools for rental professionals. Mortgages revenue primarily includes advertising sold to mortgage lenders and other mortgage professionals, as well as revenue generated by Mortech, which provides subscription-based mortgage software solutions, including a product and pricing engine and lead management platform. Market Leader revenue primarily includes revenue from the sale of a comprehensive premium software-as-a-service based marketing product typically sold to real estate professionals as a bundle of products under a fixed fee subscription. Market Leader revenue is included in our results of operations from February 17, 2015 through the date of divestiture of September 30, 2015.
Display revenue primarily consists of graphical mobile and web advertising sold on a cost per thousand impressions (“CPM”) or cost-per-click (“CPC”) basis to advertisers promoting their brands on our mobile applications and websites and our partner websites. Impressions are delivered when a sold advertisement appears on pages viewed by users of our mobile applications and websites.
Overview of Significant Milestones and Results
The following is a summary of our significant milestones for the year ended December 31, 2015:
| • | In January, we launched the Zillow Data Dashboard, a new listing management and reporting platform that allows Multiple Listing Services, or MLSs, and brokers to provide listings directly to Zillow Group. Since January 2015, nearly 400 MLSs have signed agreements to send listings directly to Zillow and Trulia. |
| • | Effective February 17, 2015, Zillow Group acquired Trulia, and Zillow and Trulia became wholly owned subsidiaries of Zillow Group (the “Trulia acquisition”). |
45
Table of Contents
| • | In February, we announced the release of our fifth TV spot, “Lake House,” and in June, we announced the release of our sixth TV spot, “Homecoming,” both as part of our award-winning “Find Your Way Home” national advertising campaign. |
| • | In March, we announced the launch of Agent Finder, a new way for home buyers and sellers to search for, and find, a real estate agent based on their local expertise and reputation. |
| • | In July, we announced that our board of directors approved a distribution of shares of our non-voting Class C capital stock as a dividend to our Class A and Class B common shareholders (the “Class C Stock Split”). Holders of Class A common stock and Class B common stock as of the close of business on July 31, 2015, the record date for the Class C Stock Split, received on August 14, 2015 a distribution of two shares of Class C capital stock for each share of Class A and Class B common stock held by them as of the record date. The distribution had the effect of a 3-for-1 stock split. On August 17, the first trading day following the issuance date of the Class C Stock Split, our Class C capital stock began trading on The NASDAQ Global Select Market (“NASDAQ”) under the symbol “Z” and our Class A common stock began trading on NASDAQ under the symbol “ZG”. All references made to share or per share amounts in this Management’s Discussion and Analysis of Financial Condition and Results of Operations have been retroactively adjusted to reflect the Class C Stock Split. |
| • | In August, Zillow Group appointed chief operating officer Kathleen Philips to the position of chief financial officer and appointed chief marketing officer Amy Bohutinsky to chief operating officer. |
| • | In August, we completed the acquisition of DotLoop, Inc. (“DotLoop”), a company which simplifies multi-party real estate transactions by enabling real estate professionals and their clients to share, edit, sign and store documents digitally. The total purchase price for the acquisition of DotLoop was approximately $105.5 million. Based on the allocation of the purchase price in connection with our acquisition of DotLoop, a substantial majority of the purchase price has been allocated to goodwill and intangible assets. For additional information regarding the transaction with DotLoop, see Note 7 to our consolidated financial statements. |
| • | In September, we completed the sale of our Market Leader business, including the Sharper Agent service and the Leads Direct, HouseValues and JustListed lead generation businesses. In connection with the divestiture, Market Leader’s approximately 100 employees transferred with the business to the acquiror. The total sale price was approximately $22.6 million. The financial results of Market Leader have not been presented as discontinued operations in our consolidated statements of operations, as the disposal group does not represent a strategic shift in our operations or financial results. For additional information regarding the divestiture of Market Leader, see Note 8 to our consolidated financial statements. |
| • | In October, we debuted Zillow for Apple TV®. The app includes Zillow’s own channel, called Zillow TV, to provide high-quality video content designed to inspire homeowners and home shoppers. |
| • | In November, we announced the completion of the combination of Zillow’s and Trulia’s Premier Agent advertising products, several months ahead of schedule. As a result of the integration, Agent Advertisers can manage their advertising across both Zillow and Trulia mobile and Web through the Premier Agent platform. |
| • | In December, we launched Price This Home, a new tool that enables home sellers to create a custom, private value estimate for their home based on comparable home sales and listings, personal knowledge of their home and surrounding neighborhoods, and local market conditions. |
We have included Trulia in Zillow Group’s results of operations prospectively after February 17, 2015, the date of acquisition. Because the Trulia acquisition occurred during the year ended December 31, 2015, the information presented in this section with respect to the year ended December 31, 2015 relates to Zillow Group, and the information presented in this section with respect to the prior-year comparable periods relates to Zillow on a standalone basis. As a result, comparisons to the prior-year period may not be indicative of future results or future rates of growth.
46
Table of Contents
We have experienced significant revenue growth over the past three years. In 2013, 2014 and 2015 we focused on growing our marketplace revenue, which accounted for the majority of our revenue growth over that period. The increase in marketplace revenue resulted primarily from growth in our Premier Agent program. Our Premier Agent program represents the primary source of our revenue and is more predictable than our other revenue sources. As a greater proportion of our revenue has shifted to marketplace revenue with a corresponding lesser proportion of revenue being display revenue, we believe we are experiencing less quarterly seasonality in our business as compared to prior periods.
For the years ended December 31, 2015, 2014, and 2013, we generated revenue of $644.7 million, $325.9 million and $197.5 million, respectively, representing year-over-year growth of 98%, 65% and 69%, respectively. We believe achieving these levels of revenue growth was primarily the result of significant growth in the following areas:
| • | Traffic to our owned and operated mobile applications and websites—indicated by the average number of monthly unique users for the three months ended December 31, 2015, 2014 and 2013 of 123.7, 76.7 million and 54.4 million, respectively, representing year-over-year growth of 61%, 41% and 57%, respectively. The growth in traffic in 2015 was primarily due to the inclusion of Trulia after February 17, 2015. We continue to observe strong adoption of mobile devices and the Internet by consumers seeking real estate information. As a result, we have invested, and expect to continue to invest, in innovating and expanding our offerings for mobile devices, optimizing for mobile web and launching more applications to extend our brand and products across additional mobile platforms. |
| • | Marketplace revenue—due primarily to growth in our Premier Agent program, for which we have generally experienced increases in the number of Agent Advertisers and in the average monthly revenue per advertiser. Increases in the average monthly revenue per advertiser were primarily driven by an increase in impression inventory which led to an increase in sales to existing Agent Advertisers looking to expand their presence on our platform, and in 2015, was also due to our February 2015 acquisition of Trulia. We are currently focused on growing revenue from high producing Agent Advertisers, who we believe deliver better service to consumers. As we prioritize revenue growth from high producing Agent Advertisers and deemphasize increasing the overall number of Agent Advertisers, we expect the number of Agent Advertisers will decrease. |
| • | Display revenue—resulting from our traffic growth and the improved productivity of our sales force. The growth in display revenue in 2015 was primarily due to the inclusion of Trulia after February 17, 2015. |
As of December 31, 2015, we had 2,204 full-time employees compared to 1,215 full-time employees as of December 31, 2014. The increase in the number of full-time employees was primarily due to the inclusion of Trulia after February 17, 2015.
Acquisition of Trulia, Inc.
Effective February 17, 2015, pursuant to the Agreement and Plan of Merger dated as of July 28, 2014 (the “Merger Agreement”), each of Zillow and Trulia became wholly owned subsidiaries of Zillow Group. Upon completion of the acquisition, each outstanding share of Class A common stock of Zillow was converted into the right to receive one share of fully paid and nonassessable Class A common stock of Zillow Group, each outstanding share of Class B common stock of Zillow was converted into the right to receive one share of fully paid and nonassessable Class B common stock of Zillow Group, and each outstanding share of Trulia common stock was converted into the right to receive 0.444 of a share of fully paid and nonassessable Class A Common Stock of Zillow Group.
The total purchase price of Trulia was approximately $2.0 billion. For additional information regarding the transaction with Trulia, see Note 7 to our consolidated financial statements.
47
Table of Contents
On February 17, 2015, in connection with the Trulia acquisition, Zillow Group undertook a restructuring plan that resulted in a total workforce reduction of nearly 350 employees, primarily to eliminate overlapping positions in the sales and marketing functions related to Trulia’s workforce at its Bellevue, Denver, New York and San Francisco locations. The restructuring plan is a result of the integration of Trulia’s business and operations with and into Zillow Group’s business. Employees directly affected by the restructuring plan were provided with severance payments, stock vesting acceleration and outplacement assistance. For additional information regarding the restructuring, see Note 18 to our consolidated financial statements.
Key Growth Drivers
To analyze our business performance, determine financial forecasts and help develop long-term strategic plans, we frequently review the following key growth drivers:
Unique Users
Measuring unique users is important to us because our marketplace revenue depends in part on our ability to enable real estate, rental and mortgage professionals to connect with our users, and our display revenue depends in part on the number of impressions delivered. Furthermore, our community of users improves the quality of our living database of homes with their contributions. We count a unique user the first time an individual accesses one of our mobile applications using a mobile device during a calendar month and the first time an individual accesses one of our websites using a web browser during a calendar month. If an individual accesses our mobile applications using different mobile devices within a given month, the first instance of access by each such mobile device is counted as a separate unique user. If an individual accesses more than one of our mobile applications within a given month, the first access to each mobile application is counted as a separate unique user. If an individual accesses our websites using different web browsers within a given month, the first access by each such web browser is counted as a separate unique user. If an individual accesses more than one of our websites in a single month, the first access to each website is counted as a separate unique user since unique users are tracked separately for each domain. Zillow measures unique users with Google Analytics and Trulia measures unique users with Omniture analytical tools. Beginning on February 17, 2015, the reported monthly unique users reflect the effect of Zillow Group’s February 17, 2015 acquisition of Trulia. Beginning in September 2013, the reported monthly unique users reflect the effect of Zillow’s August 26, 2013 acquisition of StreetEasy, Inc.
| Average Monthly Unique Users for the Three Months Ended December 31, |
2014 to 2015 % Change |
2013 to 2014 % Change |
||||||||||||||||||
| 2015 | 2014 | 2013 | ||||||||||||||||||
| (in thousands) | ||||||||||||||||||||
| Unique Users |
123,658 | 76,713 | * | 54,358 | 61 | % | 41 | % | ||||||||||||
| * | For December 2014, the reported monthly unique user metric was estimated by Zillow based on historical trends by calculating the percentage change in monthly unique users from November 2013 to December 2013 and multiplying that percentage change by the reported November 2014 monthly unique users. Zillow transitioned to an upgraded version of the Google Analytics measurement service, Universal Analytics, in the month of December 2014 on both its mobile application and website platforms. As a result, we are not able to provide an accurate count of the monthly unique users as reported by the service for December 2014. |
48
Table of Contents
Agent Advertisers
The number of Agent Advertisers is an important driver of revenue growth because each advertiser pays us a fee to purchase advertising services. We define an Agent Advertiser as a real estate professional with an active advertising contract at the end of a period. Beginning on February 17, 2015, the reported Agent Advertisers reflect the effect of Zillow Group’s February 17, 2015 acquisition of Trulia. The number of Agent Advertisers excludes users of our Market Leader products who do not also have an active advertising contract for our Premier Agent advertising products.
| At December 31, | 2014 to 2015 % Change |
2013 to 2014 % Change |
||||||||||||||||||
| 2015 | 2014 | 2013 | ||||||||||||||||||
| Agent Advertisers |
92,366 | 62,305 | 48,314 | 48 | % | 29 | % | |||||||||||||
Basis of Presentation
Revenue
We generate revenue from the sale of advertising services and our suite of tools to businesses and professionals primarily associated with the real estate and mortgage industries. These professionals include local real estate and rental professionals, mortgage professionals and brand advertisers. Our two revenue categories are marketplace revenue and display revenue.
Marketplace Revenue. Marketplace revenue for the year ended December 31, 2015 consisted of real estate, mortgages, and Market Leader revenue.
Real estate revenue primarily includes revenue from advertising and a suite of tools sold to real estate professionals, as well as revenue generated by Zillow Group Rentals, which includes our rentals marketplace and suite of tools for rental professionals.
In August 2015, Zillow Group completed the integration of certain Zillow and Trulia agent advertising products, effectively eliminating the Trulia Local Ads and Trulia Mobile Ads products. As a result of the integration, Agent Advertisers can manage their advertising across both Zillow and Trulia mobile and Web through the combined Premier Agent platform.
Our Zillow Premier Agent program, which is included in real estate revenue, offers a suite of marketing and business technology solutions to help real estate agents grow their businesses and personal brands. The Premier Agent program allows agents to select products and services that they can tailor to meet their business and advertising needs. The program has three tiers of participation including Premier Platinum, our flagship product, as well as Premier Gold and Premier Silver, to meet different marketing and business needs of a broad range of agents. All tiers of Premier Agents receive access to a dashboard portal on our website that provides individualized program performance analytics, as well as our personalized website service, and our free customer relationship management, or CRM, tool that captures detailed information about each contact made with a Premier Agent through our mobile and web platforms. Our Premier Gold product also includes featured listings whereby the agent’s listings will appear at the top of search results on our mobile and web platforms. Our Premier Platinum product includes the dashboard portal on our website, our personalized website service, our CRM tool, featured listings, and inclusion on our buyer’s agent list, whereby the agent appears as the agent to contact for listings in the purchased zip code. We charge for our Platinum Premier Agent product based on the number of impressions delivered on our buyer’s agent list in zip codes purchased and a contracted maximum cost per impression. Our Platinum Premier Agent product includes multiple deliverables which are accounted for as a single unit of accounting, as the delivery or performance of the undelivered elements is based on traffic to our mobile applications and websites. We recognize revenue related to our impression-based Platinum Premier Agent product based on the lesser of (i) the actual number of impressions delivered on our buyer’s agent list during the period multiplied by the contracted maximum cost per impression, or (ii) the contractual maximum spend on a
49
Table of Contents
straight-line basis during the contractual period over which the services are delivered, typically over a period of six months or twelve months and then month-to-month thereafter. We charge a fixed subscription fee for Zillow’s Premier Gold and Premier Silver subscription products. Subscription advertising revenue for our Premier Gold and Premier Silver subscription products is recognized on a straight-line basis during the contractual period over which the services are delivered, typically over a period of six months and then month-to-month thereafter.
Our Trulia real estate products included in real estate revenue are primarily sold on a fixed fee subscription basis, and include Trulia Local Ads, Trulia Mobile Ads, Trulia Pro with featured listings and Trulia Seller Ads. Prior to the August 2015 integration of certain of Zillow’s and Trulia’s advertising products, Trulia Local Ads and Trulia Mobile Ads enabled real estate professionals to promote themselves on Trulia’s search results pages and property details pages for a local market area. Real estate professionals purchased subscriptions to these products based upon their specified market share for a city or zip code, at a fixed monthly price, for periods ranging from one month to one year, with pricing depending on demand, location, and the percentage of market share purchased. Following the August 2015 agent advertising product integration, Trulia Local Ads and Trulia Mobile Ads products are no longer sold by Zillow Group. Trulia’s featured listings product allows real estate professionals to receive prominent placement of their listings in Trulia’s search results. Real estate professionals sign up for new subscriptions to this product at a fixed monthly price for periods that generally range from six months to 12 months. Trulia Seller Ads enable real estate professionals to generate leads from consumers interested in selling their homes. Subscription advertising revenue for Trulia’s real estate products included in real estate revenue is recognized on a straight-line basis during the contractual period over which the services are delivered.
Rentals revenue, which is included in real estate revenue, primarily includes advertising sold to property managers and other rental professionals on a cost per lead and cost per lease generated basis. We recognize revenue as leads are delivered to rental professionals or as qualified leases are confirmed.
Mortgages revenue primarily includes advertising sold to mortgage lenders and other mortgage professionals on a cost per lead basis, as well as revenue generated by Mortech, which provides subscription-based mortgage software solutions, including a product and pricing engine and lead management platform, for which we recognize revenue on a straight-line basis during the contractual period over which the services are delivered. For our cost per lead mortgage advertising products, participating qualified mortgage professionals make a prepayment to gain access to consumers interested in connecting with mortgage professionals. Consumers who request rates for mortgage loans are presented with personalized quotes from participating mortgage professionals. We only charge mortgage professionals a fee when users contact mortgage professionals for more information regarding a mortgage loan quote. Mortgage professionals who exhaust their initial prepayment can then prepay additional funds to continue to participate in the marketplace. We recognize revenue when a user contacts a mortgage professional through Zillow Group’s mortgages platform.
Market Leader revenue primarily includes revenue from the sale of a comprehensive premium software-as-a-service based marketing product typically sold to real estate professionals as a bundle of products under a fixed fee subscription. Market Leader became part of Zillow Group through Zillow Group’s February 2015 acquisition of Trulia.
Display Revenue. Display revenue primarily consists of graphical mobile and web advertising sold on a cost per thousand impressions (“CPM”) or cost-per-click (“CPC”) basis to advertisers promoting their brands on our mobile applications and websites and our partner websites, primarily in the real estate industry, including real estate brokerages, home builders, mortgage professionals and home services providers. Our advertising customers also include telecommunications, automotive, insurance and consumer products companies. Impressions are the number of times an advertisement is loaded on a web page and clicks are the number of times users click on an advertisement. Pricing is primarily based on advertisement size and position on our mobile applications and websites, and fees are generally billed monthly. We recognize display revenue as clicks occur or
50
Table of Contents
as impressions are delivered to users interacting with our mobile applications or websites. Growth in display revenue depends on continuing growth in traffic to our mobile applications and websites and migration of advertising spend online from traditional broadcast and print media.
Costs and Expenses
Cost of Revenue. Our cost of revenue consists of expenses related to operating our mobile applications and websites, including associated headcount expenses, such as salaries and benefits and share-based compensation expense and bonuses, as well as credit card fees, ad serving costs paid to third parties, revenue-sharing costs related to our commercial business relationships, costs to generate leads for customers, multiple listing services fees and costs associated with the operation of our data center and customer websites.
Sales and Marketing. Sales and marketing expenses consist of advertising costs and other sales expenses related to promotional and marketing activities, as well as headcount expenses, including salaries, commissions, benefits, share-based compensation expense and bonuses for sales, sales support, customer support, marketing and public relations employees.
Technology and Development. Technology and development expenses consist of headcount expenses, including salaries and benefits, share-based compensation expense and bonuses for salaried employees and contractors engaged in the design, development and testing of our mobile applications and websites, equipment and maintenance costs, and facilities costs allocated on a headcount basis. Technology and development expenses also include amortization costs related to capitalized website and development activities, amortization of certain intangibles and other data agreement costs related to the purchase of data used to populate our mobile applications and websites, and amortization of intangible assets recorded in connection with acquisitions.
General and Administrative. General and administrative expenses consist of headcount expenses, including salaries, benefits, share-based compensation expense and bonuses for executive, finance, accounting, legal, human resources, recruiting and administrative support. General and administrative expenses also include legal, accounting and other third-party professional service fees and bad debt expense.
Acquisition-related Costs. Acquisition-related costs consist of investment banker, legal, accounting, tax, and regulatory filing fees associated with acquisitions.
Restructuring Costs. Restructuring costs consist of workforce reduction expenses in connection with a restructuring plan and related contract termination costs related to operating leases.
Loss on Divestiture of Business. Loss on divestiture of business consists of the loss recognized in connection with our September 2015 sale of the Market Leader business.
Other Income
Other income consists primarily of interest income earned on our cash, cash equivalents and investments.
Interest Expense
Interest expense consists of interest on the 2020 Notes we guaranteed in connection with our February 2015 acquisition of Trulia. Interest is payable on the 2020 Notes at the rate of 2.75% semi-annually on June 15 and December 15 of each year.
Income Taxes
We are subject to federal and state income taxes in the United States and in Canada. During the years ended December 31, 2015, 2014 and 2013, we did not have a material amount of reportable taxable income. We have provided a full valuation allowance against our net deferred tax assets as of December 31, 2015 and 2014
51
Table of Contents
because, based on the weight of available evidence, it is more likely than not (a likelihood of more than 50%) that some or all of the deferred tax assets will not be realized. Therefore, no related tax liability or expense has been recorded in the financial statements. We have accumulated federal tax losses of approximately $735.2 million as of December 31, 2015, which are available to reduce future taxable income. We have accumulated state tax losses of approximately $11.6 million (tax effected) as of December 31, 2015.
We recorded an income tax benefit of $4.6 million for the year ended December 31, 2015, primarily due to a deferred tax liability generated in connection with Zillow’s August 20, 2015 acquisition of DotLoop that can be used to realize certain deferred tax assets for which we had previously provided a full allowance. We recorded an income tax benefit of $4.1 million for the year ended December 31, 2013 due to a deferred tax liability generated in connection with Zillow’s August 26, 2013 acquisition of StreetEasy, Inc. that can be used to realize certain deferred tax assets for which we had previously provided a full allowance.
Results of Operations
The following tables present our results of operations for the periods indicated and as a percentage of total revenue:
| Year Ended December 31, | ||||||||||||
| 2015 | 2014 | 2013 | ||||||||||
| (in thousands, except per share data) | ||||||||||||
| Statements of Operations Data: |
||||||||||||
| Revenue |
$ | 644,677 | $ | 325,893 | $ | 197,545 | ||||||
| Costs and expenses: |
||||||||||||
| Cost of revenue (exclusive of amortization) (1)(2) |
61,614 | 29,461 | 18,810 | |||||||||
| Sales and marketing (1) |
307,089 | 169,462 | 108,891 | |||||||||
| Technology and development (1) |
198,565 | 84,669 | 48,498 | |||||||||
| General and administrative (1) |
170,445 | 65,503 | 37,919 | |||||||||
| Acquisition-related costs |
16,576 | 21,493 | 376 | |||||||||
| Restructuring costs (1) |
35,551 | — | — | |||||||||
| Loss on divestiture of business |
4,368 | — | — | |||||||||
|
|
|
|
|
|
|
|||||||
| Total costs and expenses |
794,208 | 370,588 | 214,494 | |||||||||
|
|
|
|
|
|
|
|||||||
| Loss from operations |
(149,531 | ) | (44,695 | ) | (16,949 | ) | ||||||
| Other income |
1,501 | 1,085 | 385 | |||||||||
| Interest expense |
(5,489 | ) | — | — | ||||||||
|
|
|
|
|
|
|
|||||||
| Loss before income taxes |
(153,519 | ) | (43,610 | ) | (16,564 | ) | ||||||
| Income tax benefit |
4,645 | — | 4,111 | |||||||||
|
|
|
|
|
|
|
|||||||
| Net loss |
$ | (148,874 | ) | $ | (43,610 | ) | $ | (12,453 | ) | |||
|
|
|
|
|
|
|
|||||||
| Net loss per share—basic and diluted |
$ | (0.88 | ) | $ | (0.36 | ) | $ | (0.12 | ) | |||
| Weighted-average shares outstanding—basic and diluted |
169,767 | 120,027 | 108,087 | |||||||||
| Other Financial Data: |
||||||||||||
| Adjusted EBITDA (unaudited) (3) |
$ | 87,564 | $ | 49,766 | $ | 30,117 | ||||||
|
|
||||||||||||
| (1) Includes share-based compensation as follows: |
||||||||||||
| Cost of revenue |
$ | 4,694 | $ | 1,844 | $ | 737 | ||||||
| Sales and marketing |
25,391 | 7,320 | 10,969 | |||||||||
| Technology and development |
26,849 | 11,681 | 4,660 | |||||||||
| General and administrative |
48,280 | 13,240 | 7,070 | |||||||||
| Restructuring costs |
14,859 | — | — | |||||||||
|
|
|
|
|
|
|
|||||||
| Total |
$ | 120,073 | $ | 34,085 | $ | 23,436 | ||||||
|
|
|
|
|
|
|
|||||||
| (2) Amortization of website development costs and intangible assets included in technology and development |
$ | 63,189 | $ | 29,487 | $ | 19,791 | ||||||
52
Table of Contents
| (3) | See “Adjusted EBITDA” below for more information and for a reconciliation of Adjusted EBITDA to net loss, the most directly comparable financial measure calculated and presented in accordance with U.S. generally accepted accounting principles, or GAAP. |
| Year Ended December 31, | ||||||||||||
| 2015 | 2014 | 2013 | ||||||||||
| Percentage of Revenue: |
||||||||||||
| Revenue |
100 | % | 100 | % | 100 | % | ||||||
| Costs and expenses: |
||||||||||||
| Cost of revenue (exclusive of amortization) |
10 | 9 | 10 | |||||||||
| Sales and marketing |
48 | 52 | 55 | |||||||||
| Technology and development |
31 | 26 | 25 | |||||||||
| General and administrative |
26 | 20 | 19 | |||||||||
| Acquisition-related costs |
3 | 7 | 0 | |||||||||
| Restructuring costs |
6 | 0 | 0 | |||||||||
| Loss on divestiture of business |
1 | 0 | 0 | |||||||||
|
|
|
|
|
|
|
|||||||
| Total costs and expenses |
123 | 114 | 109 | |||||||||
| Loss from operations |
(23 | ) | (14 | ) | (9 | ) | ||||||
| Other income |
0 | 0 | 0 | |||||||||
| Interest expense |
(1 | ) | 0 | 0 | ||||||||
|
|
|
|
|
|
|
|||||||
| Loss before income taxes |
(24 | ) | (13 | ) | (8 | ) | ||||||
| Income tax benefit |
1 | 0 | 2 | |||||||||
|
|
|
|
|
|
|
|||||||
| Net loss |
(23 | )% | (13 | )% | (6 | )% | ||||||
|
|
|
|
|
|
|
|||||||
Adjusted EBITDA
To provide investors with additional information regarding our financial results, we have disclosed Adjusted EBITDA within this Annual Report on Form 10-K, a non-GAAP financial measure. We have provided a reconciliation below of Adjusted EBITDA to net loss, the most directly comparable GAAP financial measure.
We have included Adjusted EBITDA in this Annual Report on Form 10-K as it is a key metric used by our management and board of directors to measure operating performance and trends and to prepare and approve our annual budget. In particular, the exclusion of certain expenses in calculating Adjusted EBITDA facilitates operating performance comparisons on a period-to-period basis.
Our use of Adjusted EBITDA has limitations as an analytical tool, and you should not consider it in isolation or as a substitute for analysis of our results as reported under GAAP. Some of these limitations are:
| • | Adjusted EBITDA does not reflect our cash expenditures or future requirements for capital expenditures or contractual commitments; |
| • | Adjusted EBITDA does not reflect changes in, or cash requirements for, our working capital needs; |
| • | Adjusted EBITDA does not consider the potentially dilutive impact of share-based compensation; |
| • | Although depreciation and amortization are non-cash charges, the assets being depreciated and amortized may have to be replaced in the future, and Adjusted EBITDA does not reflect cash capital expenditure requirements for such replacements or for new capital expenditure requirements; |
| • | Adjusted EBITDA does not reflect the impairment of certain acquired intangible assets; |
| • | Adjusted EBITDA does not reflect the impact of income taxes; |
| • | Adjusted EBITDA does not reflect acquisition-related costs; |
53
Table of Contents
| • | Adjusted EBITDA does not reflect restructuring costs; |
| • | Adjusted EBITDA does not reflect the loss on divestiture of business; |
| • | Adjusted EBITDA does not reflect interest expense or other income; and |
| • | Other companies, including companies in our own industry, may calculate Adjusted EBITDA differently than we do, limiting its usefulness as a comparative measure. |
Because of these limitations, you should consider Adjusted EBITDA alongside other financial performance measures, including various cash flow metrics, net loss and our other GAAP results.
The following table presents a reconciliation of Adjusted EBITDA to net loss for each of the periods presented:
| Year Ended December 31, | ||||||||||||
| 2015 | 2014 | 2013 | ||||||||||
| (in thousands, unaudited) |
||||||||||||
| Reconciliation of Adjusted EBITDA to Net Loss: |
||||||||||||
| Net loss |
$ | (148,874 | ) | $ | (43,610 | ) | $ | (12,453 | ) | |||
| Other income |
(1,501 | ) | (1,085 | ) | (385 | ) | ||||||
| Depreciation and amortization expense |
75,386 | 35,624 | 23,254 | |||||||||
| Share-based compensation expense |
105,214 | 34,085 | 23,436 | |||||||||
| Acquisition-related costs |
16,576 | 21,493 | 376 | |||||||||
| Restructuring costs |
35,551 | — | — | |||||||||
| Loss on divestiture of business |
4,368 | — | — | |||||||||
| Interest expense |
5,489 | — | — | |||||||||
| Impairment of certain acquired intangible assets |
— | 3,259 | — | |||||||||
| Income tax benefit |
(4,645 | ) | — | (4,111 | ) | |||||||
|
|
|
|
|
|
|
|||||||
| Adjusted EBITDA |
$ | 87,564 | $ | 49,766 | $ | 30,117 | ||||||
|
|
|
|
|
|
|
|||||||
Year Ended December 31, 2015 Compared to Year Ended December 31, 2014
Revenue
| Year Ended December 31, | 2014 to 2015 % Change |
|||||||||||
| 2015 | 2014 | |||||||||||
| (in thousands) | ||||||||||||
| Revenue: |
||||||||||||
| Marketplace revenue: |
||||||||||||
| Real estate |
$ | 482,092 | $ | 239,039 | 102 | % | ||||||
| Mortgages |
44,263 | 28,203 | 57 | % | ||||||||
| Market Leader |
29,549 | — | N/A | |||||||||
|
|
|
|
|
|||||||||
| Total Marketplace revenue |
555,904 | 267,242 | 108 | % | ||||||||
| Display revenue |
88,773 | 58,651 | 51 | % | ||||||||
|
|
|
|
|
|||||||||
| Total revenue |
$ | 644,677 | $ | 325,893 | 98 | % | ||||||
|
|
|
|
|
|||||||||
54
Table of Contents
| Year Ended December 31, | ||||||||
| 2015 | 2014 | |||||||
| Percentage of Total Revenue: |
||||||||
| Marketplace revenue: |
||||||||
| Real estate |
75 | % | 73 | % | ||||
| Mortgages |
7 | % | 9 | % | ||||
| Market Leader |
5 | % | 0 | % | ||||
|
|
|
|
|
|||||
| Total Marketplace revenue |
86 | % | 82 | % | ||||
| Display revenue |
14 | % | 18 | % | ||||
|
|
|
|
|
|||||
| Total revenue |
100 | % | 100 | % | ||||
|
|
|
|
|
|||||
Overall revenue increased by $318.8 million, or 98%, for the year ended December 31, 2015 compared to the year ended December 31, 2014. Marketplace revenue increased by 108%, and display revenue increased by 51%.
Marketplace revenue grew to $555.9 million for the year ended December 31, 2015 from $267.2 million for the year ended December 31, 2014, an increase of $288.7 million. Marketplace revenue represented 86% of total revenue for the year ended December 31, 2015 compared to 82% of total revenue for the year ended December 31, 2014. The increase in marketplace revenue was primarily attributable to the $243.1 million increase in real estate revenue, which, in turn, was primarily attributable to our February 2015 acquisition of Trulia. The inclusion of Trulia Agent Advertisers contributed to growth in the number of Agent Advertisers to 92,366 as of December 31, 2015 from 62,305 as of December 31, 2014, representing growth of 48%. Real estate revenue was also positively impacted by a strategic shift to focus efforts by our sales team on high-performing Agent Advertisers. This strategic shift resulted in increased sales to Agent Advertisers looking to expand their presence on our platform. Average monthly revenue per advertiser increased by 43% to $482 for the year ended December 31, 2015 from $338 for the year ended December 31, 2014. We calculate our average monthly revenue per advertiser by dividing the revenue generated by Zillow’s Premier Agent program and Trulia’s real estate revenue products (excluding revenue generated by Market Leader) in the period by the average number of Agent Advertisers in the period, divided again by the number of months in the period. If a real estate professional had an active advertising contract for both our Zillow Premier Agent and Trulia agent advertising products, the professional is counted as one Agent Advertiser. The average number of Agent Advertisers is derived by calculating the average of the beginning and ending number of Agent Advertisers for the period. The increase in average monthly revenue per advertiser was primarily driven by an increase in impression inventory, which led to an increase in sales to existing Agent Advertisers looking to expand their presence on our platform, and was also due to our February 2015 acquisition of Trulia.
The increase in marketplace revenue was also attributable to growth in mortgages revenue, which increased by $16.1 million, or 57%, for the year ended December 31, 2015 compared to the year ended December 31, 2014. The increase in mortgages revenue was primarily a result of an increase in the number of loan information requests submitted by consumers, which reflects the inclusion of loan information requests submitted by consumers through Trulia after February 17, 2015. There were approximately 46.8 million mortgage loan information requests submitted by consumers for the year ended December 31, 2015 compared to 25.7 million mortgage loan information requests submitted by consumers for the year ended December 31, 2014, an increase of 82%. The growth in loan information requests submitted by consumers increases the likelihood that consumers’ contact information will be converted into leads, but there is not a direct correlation between the number of loan information requests and mortgages revenue because loan information requests do not always result in revenue recognition. During the first half of 2015 we changed the pricing model for our mortgage advertising products from cost-per-click to cost-per-lead, which also may have contributed to growth in mortgages revenue.
55
Table of Contents
The increase in marketplace revenue was also attributable to the addition of Market Leader revenue following our February 2015 acquisition of Trulia. Market Leader revenue was $29.5 million for the year ended December 31, 2015. Market Leader revenue is included in our results of operations from February 17, 2015 through the date of its divestiture on September 30, 2015.
Display revenue was $88.8 million for the year ended December 31, 2015 compared to $58.7 million for the year ended December 31, 2014, an increase of $30.1 million. Display revenue represented 14% of total revenue for the year ended December 31, 2015 compared to 18% of total revenue for the year ended December 31, 2014. The increase in display revenue was primarily the result of an increase in the number of unique users to our mobile applications and websites, which increased to 123.7 million average monthly unique users for the three months ended December 31, 2015 from 76.7 million average monthly unique users for the three months ended December 31, 2014, representing growth of 61%. The growth in unique users was primarily due to our February 2015 acquisition of Trulia, which increased the number of graphical display impressions available for sale and advertiser demand for graphical display inventory. Although there is a relationship between the number of average monthly unique users and display revenue, there is not a direct correlation, as we do not sell our entire display inventory each period and some of our inventory is sold through networks and not directly through our sales team, which impacts the cost per impression we charge to customers.
Cost of Revenue
Cost of revenue was $61.6 million for the year ended December 31, 2015 compared to $29.5 million for the year ended December 31, 2014, an increase of $32.2 million, or 109%. The increase in cost of revenue was primarily attributable to increased headcount-related expenses of $9.2 million, including share-based compensation expense, driven by growth in headcount, including the impact of growth in headcount as a result of our February 2015 acquisition of Trulia, increased credit card and ad serving fees of $8.5 million, an $8.0 million increase in data center and connectivity costs, a $3.1 million increase in costs to generate leads for customers related to the Market Leader business, a $1.1 million increase in print expenses related to the Market Leader business, a $0.6 million increase in multiple listing service fees, a $0.4 million increase in revenue share costs, and a $1.3 million increase in miscellaneous cost of revenue expenses. We expect our cost of revenue to increase in absolute dollars in future years as we continue to incur more expenses that are associated with growth in revenue.
Sales and Marketing
Sales and marketing expenses were $307.1 million for year ended December 31, 2015 compared to $169.5 million for the year ended December 31, 2014, an increase of $137.6 million, or 81%. The increase in sales and marketing expenses was primarily attributable to increased headcount-related expenses of $88.6 million, including share-based compensation expense, including the impact of growth in headcount as a result of our February 2015 acquisition of Trulia, which resulted in significant growth in the size of our sales team.
In addition to the increases in headcount-related expenses, marketing and advertising expenses increased by $33.3 million, primarily related to advertising spend to acquire shoppers across online and offline channels, which supports our growth initiatives.
We also incurred a $4.8 million increase in software and connectivity costs, a $4.7 million increase in tradeshow and conferences expense, including related travel costs, a $4.2 million increase in consulting costs, a $1.2 million increase in depreciation expense, and a $0.8 million increase in miscellaneous sales and marketing expenses.
We expect our sales and marketing expenses to increase in absolute dollars in future years as we continue to expand our sales team and invest more resources in extending our audience through marketing and advertising initiatives.
56
Table of Contents
Technology and Development
Technology and development expenses, which include research and development costs, were $198.6 million for the year ended December 31, 2015 compared to $84.7 million for the year ended December 31, 2014, an increase of $113.9 million, or 135%. Approximately $50.0 million of the increase related to growth in headcount-related expenses, including share-based compensation expense, including the impact of growth in headcount as a result of our February 2015 acquisition of Trulia, as we continue to grow our engineering headcount to support current and future product initiatives. Approximately $27.3 million of the increase was the result of increased amortization of acquired intangible assets, primarily as a result of our February 2015 acquisition of Trulia. The increase in technology and development expenses was also attributable to a $15.5 million increase in other non-capitalizable data content expense, a $6.4 million increase in amortization related to website development costs and purchased content, a $4.5 million increase in depreciation expense, a $4.3 million increase in consulting costs, a $3.2 million increase in software, hardware and connectivity costs, a $0.9 million increase in repairs and maintenance expense, a $0.8 million increase in travel and meals expense, a $0.7 million increase in dues and subscriptions, and a $0.3 million increase in various miscellaneous expenses.
Amortization expense included in technology and development related to intangible assets recorded in connection with acquisitions was $33.4 million and $6.1 million, respectively, for the year ended December 31, 2015 and 2014. Amortization expense included in technology and development for capitalized website development costs was $23.9 million and $18.3 million, respectively, for the year ended December 31, 2015 and 2014. Other data content expense was $16.2 million and $0.7 million, respectively, for the year ended December 31, 2015 and 2014. Amortization expense included in technology and development for purchased data content intangible assets was $5.9 million and $5.1 million, respectively, for the year ended December 31, 2015 and 2014. We expect our technology and development expenses to increase in absolute dollars over time as we continue to build new mobile and website functionality.
General and Administrative
General and administrative expenses were $170.4 million for the year ended December 31, 2015 compared to $65.5 million for the year ended December 31, 2014, an increase of $104.9 million, or 160%. The increase in general and administrative expenses was primarily a result of a $49.2 million increase in headcount-related expenses, including share-based compensation expense, driven primarily by growth in headcount in shared corporate services to support our engineering and other teams, including the impact of growth in headcount as a result of our February 2015 acquisition of Trulia, and increases in compensation, and a $35.4 million increase in professional services fees, including legal fees incurred in connection with the legal proceedings described in Part I, Item 3. For the year ended December 31, 2015, we incurred $27.1 million in legal costs related to our litigation with Move, Inc.
In addition to the increases in headcount-related expenses and professional services fees, general and administrative expenses increased as a result of a $10.6 million increase in building lease-related expenses including rent, utilities and insurance, a $3.0 million increase in consulting costs, a $2.9 million increase in travel and meals expense, a $2.0 million increase in software, hardware, and connectivity costs, a $0.7 million increase in bad debt expense, a $0.5 million increase in city and state taxes and a $0.6 million increase in various other miscellaneous expenses.
We expect general and administrative expenses to increase over time in absolute dollars as we continue to expand our business.
Acquisition-Related Costs
Acquisition-related costs were $16.6 million for the year ended December 31, 2015 as a result of our February 2015 acquisition of Trulia and our August 2015 acquisition of DotLoop, including legal, accounting
57
Table of Contents
and tax fees. Acquisition-related costs were $21.5 million for the year ended December 31, 2014 as a result of our acquisition of Trulia. We expect our acquisition-related costs to decrease in future periods as we focus on the integration of Trulia and DotLoop.
Restructuring Costs
Restructuring costs were $35.6 million for the year ended December 31, 2015. On February 17, 2015, in connection with the February 2015 acquisition of Trulia, Zillow Group undertook a restructuring plan that resulted in a total workforce reduction of nearly 350 employees, primarily to eliminate overlapping positions in the sales and marketing functions related to Trulia’s workforce at its Bellevue, Denver, New York and San Francisco locations. The restructuring plan is a result of the integration of Trulia’s business and operations with and into Zillow Group’s business. Employees directly affected by the restructuring plan were provided with severance payments, stock vesting acceleration and outplacement assistance. As of December 31, 2015, the restructuring plan is substantially complete.
Primarily as a result of the restructuring plan, Zillow Group recorded a restructuring charge of approximately $35.6 million during the year ended December 31, 2015, including approximately $12.2 million for severance and other personnel related expenses, approximately $14.9 million of non-cash expenses relating to stock vesting acceleration or a reduced remaining requisite service period, and approximately $8.2 million for contract termination costs associated with certain operating leases. Zillow Group recognized certain contract termination costs primarily associated with Trulia’s Bellevue operating lease, as well as Zillow’s San Francisco operating lease, as Zillow’s employees in San Francisco were relocated into Trulia’s San Francisco office space. The restructuring costs for contract termination costs include approximately $4.0 million primarily related to the write-off of certain leasehold improvements. For additional information regarding the restructuring, see Note 18 to our consolidated financial statements.
Loss on Divestiture of Business
The loss on divestiture of business was $4.4 million for the year ended December 31, 2015 and relates to the September 2015 sale of our Market Leader business. For additional information regarding the divestiture of Market Leader, see Note 8 to our consolidated financial statements.
Interest Expense
Interest expense was $5.5 million for the year ended December 31, 2015. The interest expense relates to the 2020 Notes that we guaranteed in connection with the February 2015 acquisition of Trulia, which accrue interest at 2.75% annually. For additional information regarding the 2020 Notes, see Note 12 to our condensed consolidated financial statements.
Income Taxes
During the years ended December 31, 2015 and 2014, we did not have a material amount of reportable taxable income. Therefore, no tax liability or expense has been recorded in the consolidated financial statements for the years ended December 31, 2015 and 2014.
We recorded an income tax benefit of approximately $4.6 million for the year ended December 31, 2015 primarily due to the deferred tax liability generated in connection with Zillow’s August 20, 2015 acquisition of DotLoop that can be used to realize certain deferred tax assets for which we had previously provided a full valuation allowance.
58
Table of Contents
Year Ended December 31, 2014 Compared to Year Ended December 31, 2013
Revenue
| Year Ended December 31, | 2013 to 2014 % Change |
|||||||||||
| 2014 | 2013 | |||||||||||
| (in thousands) | ||||||||||||
| Revenue: |
||||||||||||
| Marketplace revenue: |
||||||||||||
| Real estate |
$ | 239,039 | $ | 132,901 | 80 | % | ||||||
| Mortgages |
28,203 | 21,812 | 29 | % | ||||||||
|
|
|
|
|
|||||||||
| Total Marketplace revenue |
267,242 | 154,713 | 73 | % | ||||||||
| Display revenue |
58,651 | 42,832 | 37 | % | ||||||||
|
|
|
|
|
|||||||||
| Total revenue |
$ | 325,893 | $ | 197,545 | 65 | % | ||||||
|
|
|
|
|
|||||||||
| Year Ended December 31, | ||||||||
| 2014 | 2013 | |||||||
| Percentage of Total Revenue: |
||||||||
| Marketplace revenue: |
||||||||
| Real estate |
73 | % | 67 | % | ||||
| Mortgages |
9 | % | 11 | % | ||||
|
|
|
|
|
|||||
| Total Marketplace revenue |
82 | % | 78 | % | ||||
| Display revenue |
18 | % | 22 | % | ||||
|
|
|
|
|
|||||
| Total revenue |
100 | % | 100 | % | ||||
|
|
|
|
|
|||||
Overall revenue increased by $128.3 million, or 65%, for the year ended December 31, 2014 compared to the year ended December 31, 2013. Marketplace revenue increased by 73%, and display revenue increased by 37%.
Marketplace revenue grew to $267.2 million for the year ended December 31, 2014 from $154.7 million for the year ended December 31, 2013, an increase of $112.5 million. Marketplace revenue represented 82% of total revenue for the year ended December 31, 2014 compared to 78% of total revenue for the year ended December 31, 2013. The increase in marketplace revenue was primarily attributable to the $106.1 million increase in real estate revenue, which was primarily a result of growth in sales to existing Agent Advertisers looking to expand their presence on our platform, which growth was supported by increased impression inventory, as well as growth in the number of advertisers in our Premier Agent program to 62,305 as of December 31, 2014 from 48,314 as of December 31, 2013, representing growth of 29%. Average monthly revenue per advertiser increased by 27% to $338 for the year ended December 31, 2014 from $267 for the year ended December 31, 2013. The increase in average monthly revenue per advertiser was primarily driven by an increase in impression inventory, which led to an increase in sales to existing Premier Agent advertisers looking to expand their presence on our platform.
The increase in marketplace revenue was also attributable to growth in mortgages revenue, which increased by $6.4 million, or 29%, for the year ended December 31, 2014 compared to the year ended December 31, 2013. The increase in mortgages revenue was primarily a result of an increase in the number of loan information requests submitted by consumers. There were approximately 25.7 million mortgage loan information requests submitted by consumers for the year ended December 31, 2014 compared to 20.2 million mortgage loan information requests submitted by consumers for the year ended December 31, 2013, an increase of 27%.
59
Table of Contents
Display revenue was $58.7 million for the year ended December 31, 2014 compared to $42.8 million for the year ended December 31, 2013, an increase of $15.8 million. Display revenue represented 18% of total revenue for the year ended December 31, 2014 compared to 22% of total revenue for the year ended December 31, 2013. The increase in display revenue was primarily the result of an increase in the number of unique users to our mobile applications and websites, which increased to 76.7 million average monthly unique users for the three months ended December 31, 2014 from 54.4 million average monthly unique users for the three months ended December 31, 2013, representing growth of 41%. The growth in unique users increased the number of graphical display impressions available for sale and advertiser demand for graphical display inventory. Although there is a relationship between the number of average monthly unique users and display revenue, there is not a direct correlation, as the Company does not sell its entire display inventory each period and some of the inventory is sold through networks and not directly through our sales team, which impacts the cost per impression we charge to display advertising customers. As a result, the growth rate in the Company’s average monthly unique users outpaced the growth rate of display revenue.
Cost of Revenue
Cost of revenue was $29.5 million for the year ended December 31, 2014 compared to $18.8 million for the year ended December 31, 2013, an increase of $10.7 million, or 57%. The increase in cost of revenue was attributable to increased headcount-related expenses of $3.4 million, including share-based compensation expense, driven by growth in headcount, increased credit card and ad serving fees of $3.1 million, a $2.1 million increase in data center and connectivity costs, a $1.3 million increase in revenue share costs, and a $0.8 million increase in various miscellaneous expenses, including royalties.
Sales and Marketing
Sales and marketing expenses were $169.5 million for the year ended December 31, 2014 compared to $108.9 million for the year ended December 31, 2013, an increase of $60.6 million, or 56%. The increase in sales and marketing expenses was primarily due to a $34.7 million increase in marketing and advertising expenses, primarily related to advertising spend to acquire shoppers across online and offline channels, which supports our growth initiatives, and a $3.0 million increase in consulting costs to support our marketing and advertising spend. We believe we have considerable opportunity to increase brand awareness and grow traffic through targeted advertising programs. As such, we plan to continue to selectively advertise to consumers and professionals in various online and offline channels that have tested well for us to drive traffic and brand awareness for Zillow.
In addition to the increases in marketing and advertising expenses, headcount-related expenses, including share-based compensation expense, increased by $16.9 million, driven primarily by growth in the size of our sales team. We also incurred a $2.5 million increase in software and connectivity costs, a $2.4 million increase in tradeshow and conferences expense, including related travel costs, and a $1.1 million increase in depreciation expense.
Technology and Development
Technology and development expenses, which include research and development costs, were $84.7 million for the year ended December 31, 2014 compared to $48.5 million for the year ended December 31, 2013, an increase of $36.2 million, or 75%. Approximately $18.3 million of the increase related to growth in headcount-related expenses, including share-based compensation expense, as we continue to grow our engineering headcount to support current and future product initiatives. Approximately $9.7 million of the increase was the result of increased amortization of intangible assets, including website development costs, purchased content and acquired intangible assets. Approximately $3.3 million of the increase related to the impairment of certain acquired intangible assets during the year ended December 31, 2014, primarily related to intangible assets obtained in connection with our 2012 acquisition of RentJuice Corporation. The increase in technology and
60
Table of Contents
development expenses was also attributable to a $1.9 million increase in depreciation expense, a $1.3 million increase in consulting costs, a $0.6 million increase in software and hardware costs, a $0.4 million increase in the loss on disposal of property and equipment, and a $0.7 million increase in various miscellaneous expenses.
Amortization expense included in technology and development for capitalized website development costs was $18.3 million and $12.2 million, respectively, for the years ended December 31, 2014 and 2013. Amortization expense included in technology and development related to intangible assets recorded in connection with acquisitions was $6.1 million and $4.8 million, respectively, for the years ended December 31, 2014 and 2013. Amortization expense included in technology and development for purchased data content intangible assets was $5.1 million and $2.8 million, respectively, for the years ended December 31, 2014 and 2013. Other data content expense was $0.7 million and $0.4 million, respectively, for the years ended December 31, 2014 and 2013.
General and Administrative
General and administrative expenses were $65.5 million for the year ended December 31, 2014 compared to $37.9 million for the year ended December 31, 2013, an increase of $27.6 million, or 73%. The increase in general and administrative expenses was a result of an $11.4 million increase in headcount-related expenses, including share-based compensation expense, driven primarily by growth in headcount and increases in compensation, a $5.0 million increase in building lease-related expenses including rent, utilities and insurance, a $4.7 million increase in professional services fees, including legal and accounting, a $2.1 million increase in travel and meals expense, a $1.8 million increase in city and state taxes, a $1.2 million increase in consulting costs, a $0.6 million increase in bad debt expense, a $0.2 million increase in software costs, and a $0.6 million increase in various other miscellaneous expenses.
Acquisition-Related Costs
Acquisition-related costs were $21.5 million for the year ended December 31, 2014 compared to $0.4 million for the year ended December 31, 2013, an increase of $21.1 million. Acquisition-related costs for the year ended December 31, 2014 were primarily a result of our proposed acquisition of Trulia, including investment banker, legal, accounting, tax, and regulatory filing fees. Acquisition-related costs for the year ended December 31, 2013 were a result of the acquisition of StreetEasy, Inc.
Income Taxes
During the years ended December 31, 2014 and 2013, we did not have a material amount of reportable taxable income. Therefore, no tax liability or expense has been recorded in the consolidated financial statements for the years ended December 31, 2014 and 2013.
We recorded an income tax benefit of $4.1 million for the year ended December 31, 2013 due to a deferred tax liability generated in connection with Zillow’s August 26, 2013 acquisition of StreetEasy, Inc. that can be used to realize certain deferred tax assets for which we had previously provided a full allowance.
Quarterly Results of Operations
The following tables set forth our unaudited quarterly statements of operations data for each of the periods presented below. In the opinion of management, the data has been prepared on the same basis as the audited consolidated financial statements included in this Annual Report on Form 10-K, and reflects all necessary adjustments, consisting only of normal recurring adjustments, necessary for a fair presentation of this data. The results of historical periods are not necessarily indicative of the results of operations of any future period. You should read this data together with our consolidated financial statements and the related notes included elsewhere in this Annual Report on Form 10-K. We have included Trulia, Inc. in Zillow Group’s results of operations
61
Table of Contents
prospectively after February 17, 2015, the date of acquisition. Our historical results are not necessarily indicative of our results to be expected in any future period. We have given retroactive effect to prior period share and per share amounts in our consolidated statements of operations for the August 2015 Class C Stock Split so that prior periods are comparable to current period presentation (see Note 14 of Part II, Item 8 of this Annual Report on Form 10-K for additional information related to the Class C Stock Split).
| Three Months Ended | ||||||||||||||||||||||||||||||||
| December 31, 2015 |
September 30, 2015 |
June 30, 2015 |
March 31, 2015 |
December 31, 2014 |
September 30, 2014 |
June 30, 2014 |
March 31, 2014 |
|||||||||||||||||||||||||
| (in thousands, except per share data, unaudited) | ||||||||||||||||||||||||||||||||
| Statement of Operations Data: |
||||||||||||||||||||||||||||||||
| Revenue |
$ | 169,370 | $ | 176,765 | $ | 171,269 | $ | 127,273 | $ | 92,329 | $ | 88,646 | $ | 78,675 | $ | 66,243 | ||||||||||||||||
| Costs and expenses: |
||||||||||||||||||||||||||||||||
| Cost of revenue (exclusive of amortization) (1)(2) |
15,105 | 16,453 | 17,037 | 13,019 | 8,825 | 7,679 | 6,793 | 6,164 | ||||||||||||||||||||||||
| Sales and marketing (1) |
77,817 | 82,044 | 87,942 | 59,286 | 38,437 | 47,463 | 48,429 | 35,133 | ||||||||||||||||||||||||
| Technology and development (1) |
55,782 | 53,718 | 51,740 | 37,325 | 27,637 | 20,789 | 19,508 | 16,735 | ||||||||||||||||||||||||
| General and administrative (1) |
45,939 | 42,672 | 43,810 | 38,024 | 20,535 | 15,757 | 14,522 | 14,689 | ||||||||||||||||||||||||
| Acquisition-related costs |
432 | 1,988 | 1,679 | 12,477 | 8,109 | 13,200 | 184 | — | ||||||||||||||||||||||||
| Restructuring costs (1) |
409 | 3,425 | 6,652 | 25,065 | — | — | — | — | ||||||||||||||||||||||||
| Loss on divestiture of business |
225 | 4,143 | — | — | — | — | — | — | ||||||||||||||||||||||||
|
|
|
|
|
|
|
|
|
|
|
|
|
|
|
|
|
|||||||||||||||||
| Total costs and expenses |
195,709 | 204,443 | 208,860 | 185,196 | 103,543 | 104,888 | 89,436 | 72,721 | ||||||||||||||||||||||||
|
|
|
|
|
|
|
|
|
|
|
|
|
|
|
|
|
|||||||||||||||||
| Loss from operations |
(26,339 | ) | (27,678 | ) | (37,591 | ) | (57,923 | ) | (11,214 | ) | (16,242 | ) | (10,761 | ) | (6,478 | ) | ||||||||||||||||
| Other income |
416 | 366 | 450 | 269 | 317 | 265 | 284 | 219 | ||||||||||||||||||||||||
| Interest expense |
(1,589 | ) | (1,590 | ) | (1,580 | ) | (730 | ) | — | — | — | — | ||||||||||||||||||||
|
|
|
|
|
|
|
|
|
|
|
|
|
|
|
|
|
|||||||||||||||||
| Loss before income taxes |
(27,512 | ) | (28,902 | ) | (38,721 | ) | (58,384 | ) | (10,897 | ) | (15,977 | ) | (10,477 | ) | (6,259 | ) | ||||||||||||||||
| Income tax benefit |
1,792 | 2,853 | — | — | — | — | — | — | ||||||||||||||||||||||||
|
|
|
|
|
|
|
|
|
|
|
|
|
|
|
|
|
|||||||||||||||||
| Net loss |
$ | (25,720 | ) | $ | (26,049 | ) | $ | (38,721 | ) | $ | (58,384 | ) | $ | (10,897 | ) | $ | (15,977 | ) | $ | (10,477 | ) | $ | (6,259 | ) | ||||||||
|
|
|
|
|
|
|
|
|
|
|
|
|
|
|
|
|
|||||||||||||||||
| Net loss per share—basic and diluted |
$ | (0.14 | ) | $ | (0.15 | ) | $ | (0.22 | ) | $ | (0.40 | ) | $ | (0.09 | ) | $ | (0.13 | ) | $ | (0.09 | ) | $ | (0.05 | ) | ||||||||
| Weighted-average shares outstanding—basic and diluted |
178,020 | 177,098 | 176,142 | 147,390 | 121,800 | 120,888 | 119,400 | 117,966 | ||||||||||||||||||||||||
| Other Financial Data: |
||||||||||||||||||||||||||||||||
| Adjusted EBITDA (3) |
$ | 20,394 | $ | 29,477 | $ | 21,039 | $ | 16,654 | $ | 19,978 | $ | 14,631 | $ | 6,429 | $ | 8,728 | ||||||||||||||||
62
Table of Contents
| Three Months Ended | ||||||||||||||||||||||||||||||||||
| December 31, 2015 |
September 30, 2015 |
June 30, 2015 |
March 31, 2015 |
December 31, 2014 |
September 30, 2014 |
June 30, 2014 |
March 31, 2014 |
|||||||||||||||||||||||||||
| (in thousands, unaudited) | ||||||||||||||||||||||||||||||||||
| (1) | Includes share-based compensation as follows: | |||||||||||||||||||||||||||||||||
| Cost of revenue |
$ | 1,254 | $ | 1,378 | $ | 1,110 | $ | 952 | $ | 564 | $ | 489 | $ | 418 | $ | 373 | ||||||||||||||||||
| Sales and marketing |
4,952 | 7,446 | 8,784 | 4,209 | 2,434 | 1,885 | 1,698 | 1,303 | ||||||||||||||||||||||||||
| Technology and development |
6,436 | 7,642 | 7,005 | 5,766 | 3,852 | 2,748 | 3,056 | 2,025 | ||||||||||||||||||||||||||
| General and administrative |
11,670 | 11,549 | 12,981 | 12,080 | 3,059 | 3,512 | 3,238 | 3,431 | ||||||||||||||||||||||||||
| Restructuring costs |
(204 | ) | 1,059 | 3,584 | 10,420 | — | — | — | — | |||||||||||||||||||||||||
|
|
|
|
|
|
|
|
|
|
|
|
|
|
|
|
|
|||||||||||||||||||
| Total |
$ | 24,108 | $ | 29,074 | $ | 33,464 | $ | 33,427 | $ | 9,909 | $ | 8,634 | $ | 8,410 | $ | 7,132 | ||||||||||||||||||
|
|
|
|
|
|
|
|
|
|
|
|
|
|
|
|
|
|||||||||||||||||||
| (2) | Amortization of website development costs and intangible assets included in technology and development | $ | 17,885 | $ | 16,405 | $ | 17,117 | $ | 11,782 | $ | 8,374 | $ | 7,472 | $ | 6,857 | $ | 6,784 | |||||||||||||||||
| (3) | See “Adjusted EBITDA” below for more information and for a reconciliation of Adjusted EBITDA to net loss, the most directly comparable financial measure calculated and presented in accordance with U.S. generally accepted accounting principles, or GAAP. | |||||||||||||||||||||||||||||||||
The following tables present our revenue by type and as a percentage of total revenue for the periods presented:
| Three Months Ended | ||||||||||||||||||||||||||||||||
| December 31, 2015 |
September 30, 2015 |
June 30, 2015 |
March 31, 2015 |
December 31, 2014 |
September 30, 2014 |
June 30, 2014 |
March 31, 2014 |
|||||||||||||||||||||||||
| (in thousands, unaudited) | ||||||||||||||||||||||||||||||||
| Revenue: |
||||||||||||||||||||||||||||||||
| Marketplace revenue: |
||||||||||||||||||||||||||||||||
| Real estate |
$ | 136,560 | $ | 129,662 | $ | 122,558 | $ | 93,312 | $ | 70,807 | $ | 65,586 | $ | 56,051 | $ | 46,595 | ||||||||||||||||
| Mortgages |
11,688 | 12,624 | 10,393 | 9,558 | 7,403 | 7,106 | 6,565 | 7,129 | ||||||||||||||||||||||||
| Market Leader |
5 | 10,957 | 12,530 | 6,057 | — | — | — | — | ||||||||||||||||||||||||
|
|
|
|
|
|
|
|
|
|
|
|
|
|
|
|
|
|||||||||||||||||
| Total Marketplace revenue |
148,253 | 153,243 | 145,481 | 108,927 | 78,210 | 72,692 | 62,616 | 53,724 | ||||||||||||||||||||||||
| Display revenue |
21,117 | 23,522 | 25,788 | 18,346 | 14,119 | 15,954 | 16,059 | 12,519 | ||||||||||||||||||||||||
|
|
|
|
|
|
|
|
|
|
|
|
|
|
|
|
|
|||||||||||||||||
| Total revenue |
$ | 169,370 | $ | 176,765 | $ | 171,269 | $ | 127,273 | $ | 92,329 | $ | 88,646 | $ | 78,675 | $ | 66,243 | ||||||||||||||||
|
|
|
|
|
|
|
|
|
|
|
|
|
|
|
|
|
|||||||||||||||||
63
Table of Contents
| Three Months Ended | ||||||||||||||||||||||||||||||||
| December 31, 2015 |
September 30, 2015 |
June 30, 2015 |
March 31, 2015 |
December 31, 2014 |
September 30, 2014 |
June 30, 2014 |
March 31, 2014 |
|||||||||||||||||||||||||
| Percentage of Revenue: |
||||||||||||||||||||||||||||||||
| Marketplace revenue: |
||||||||||||||||||||||||||||||||
| Real estate |
81 | % | 73 | % | 72 | % | 73 | % | 77 | % | 74 | % | 71 | % | 70 | % | ||||||||||||||||
| Mortgages |
7 | 7 | 6 | 8 | 8 | 8 | 8 | 11 | ||||||||||||||||||||||||
| Market Leader |
0 | 6 | 7 | 5 | 0 | 0 | 0 | 0 | ||||||||||||||||||||||||
|
|
|
|
|
|
|
|
|
|
|
|
|
|
|
|
|
|||||||||||||||||
| Total Marketplace revenue |
88 | 87 | 85 | 86 | 85 | 82 | 80 | 81 | ||||||||||||||||||||||||
| Display revenue |
12 | 13 | 15 | 14 | 15 | 18 | 20 | 19 | ||||||||||||||||||||||||
|
|
|
|
|
|
|
|
|
|
|
|
|
|
|
|
|
|||||||||||||||||
| Total revenue |
100 | % | 100 | % | 100 | % | 100 | % | 100 | % | 100 | % | 100 | % | 100 | % | ||||||||||||||||
|
|
|
|
|
|
|
|
|
|
|
|
|
|
|
|
|
|||||||||||||||||
Total revenue increased sequentially in all quarters presented with the exception of the three months ended December 31, 2015. The decrease in revenue in the three months ended December 31, 2015 is primarily due to the impact of the divestiture of the Market Leader business in September 2015, as there is de minimis revenue recorded related to the Market Leader business during the three months ended December 31, 2015. The increases in revenue in the year ended December 31, 2015 as compared to the year ended December 31, 2014 was primarily attributable to our February 2015 acquisition of Trulia. In addition, the strong increase in consumer adoption of our mobile applications and websites in the year ended December 31, 2015 was reflected in the significant growth in unique users year over year, which resulted in increased impression inventory, leads, and graphical display impressions available for sale to our Agent Advertisers, other real estate professional advertisers, and display advertisers, respectively. The composition of revenue continues to shift from display revenue to marketplace revenue, as we continue to dedicate more of our advertising placements on search, map and home detail pages to our marketplace products, which provide consumers with services that are directly relevant to home-related searches. As a greater proportion of our revenue has shifted to marketplace revenue, with a corresponding lesser proportion of revenue being display revenue, we believe we are experiencing less quarterly seasonality in our business as compared to prior periods.
The following table presents our average monthly revenue per advertiser for the periods presented:
| Three Months Ended | ||||||||||||||||||||||||||||||||
| December 31, 2015 |
September 30, 2015 |
June 30, 2015 |
March 31, 2015 |
December 31, 2014 |
September 30, 2014 |
June 30, 2014 |
March 31, 2014 |
|||||||||||||||||||||||||
| (unaudited) | ||||||||||||||||||||||||||||||||
| Average Monthly Revenue per Advertiser |
$ | 438 | $ | 402 | $ | 375 | $ | 354 | $ | 359 | $ | 349 | $ | 320 | $ | 286 | ||||||||||||||||
Average monthly revenue per advertiser increased 24% to $354 for the three months ended March 31, 2015 from $286 for the three months ended March 31, 2014. Average monthly revenue per advertiser increased 17% to $375 for the three months ended June 30, 2015 from $320 for the three months ended June 30, 2014. Average monthly revenue per advertiser increased 15% to $402 for the three months ended September 30, 2015 from $349 for the three months ended September 30, 2014. Average monthly revenue per advertiser increased 22% to $438 for the three months ended December 31, 2015 from $359 for the three months ended December 31, 2014. In each of the periods, we believe the increase in average monthly revenue per advertiser was primarily driven by a strategic shift to focus efforts by our sales team on high-performing Agent Advertisers, as well as an increase in impression inventory, which led to an increase in sales to existing Agent Advertisers looking to expand their presence on our platform, and was also due to our February 2015 acquisition of Trulia.
64
Table of Contents
Adjusted EBITDA
The following table sets forth a reconciliation of Adjusted EBITDA to net loss for each of the periods presented below. See “Adjusted EBITDA” under “Results of Operations” above in this Item 7 for additional information about why we have included Adjusted EBITDA in this Annual Report on Form 10-K and how we use Adjusted EBITDA.
| Three Months Ended | ||||||||||||||||||||||||||||||||
| December 31, 2015 |
September 30, 2015 |
June 30, 2015 |
March 31, 2015 |
December 31, 2014 |
September 30, 2014 |
June 30, 2014 |
March 31, 2014 |
|||||||||||||||||||||||||
| (in thousands, unaudited) | ||||||||||||||||||||||||||||||||
| Reconciliation of Adjusted EBITDA to Net Loss: |
||||||||||||||||||||||||||||||||
| Net loss |
$ | (25,720 | ) | $ | (26,049 | ) | $ | (38,721 | ) | $ | (58,384 | ) | $ | (10,897 | ) | $ | (15,977 | ) | $ | (10,477 | ) | $ | (6,259 | ) | ||||||||
| Other income |
(416 | ) | (366 | ) | (450 | ) | (269 | ) | (317 | ) | (265 | ) | (284 | ) | (219 | ) | ||||||||||||||||
| Depreciation and amortization expense |
21,355 | 19,584 | 20,419 | 14,028 | 9,915 | 9,039 | 8,596 | 8,074 | ||||||||||||||||||||||||
| Share-based compensation expense |
24,312 | 28,015 | 29,880 | 23,007 | 9,909 | 8,634 | 8,410 | 7,132 | ||||||||||||||||||||||||
| Acquisition-related costs |
432 | 1,988 | 1,679 | 12,477 | 8,109 | 13,200 | 184 | — | ||||||||||||||||||||||||
| Restructuring costs |
409 | 3,425 | 6,652 | 25,065 | — | — | — | — | ||||||||||||||||||||||||
| Loss on divestiture of business |
225 | 4,143 | — | — | — | — | — | — | ||||||||||||||||||||||||
| Interest expense |
1,589 | 1,590 | 1,580 | 730 | — | — | — | — | ||||||||||||||||||||||||
| Impairment of certain acquired intangible assets |
— | — | — | — | 3,259 | — | — | — | ||||||||||||||||||||||||
| Income tax benefit |
(1,792 | ) | (2,853 | ) | — | — | — | — | — | — | ||||||||||||||||||||||
|
|
|
|
|
|
|
|
|
|
|
|
|
|
|
|
|
|||||||||||||||||
| Adjusted EBITDA |
$ | 20,394 | $ | 29,477 | $ | 21,039 | $ | 16,654 | $ | 19,978 | $ | 14,631 | $ | 6,429 | $ | 8,728 | ||||||||||||||||
|
|
|
|
|
|
|
|
|
|
|
|
|
|
|
|
|
|||||||||||||||||
Key Growth Drivers
The following tables set forth our key growth drivers for each of the periods presented below. Refer to “Key Growth Drivers—Unique Users” above in this Item 7 for information about how we measure unique users. The average number of unique users has historically peaked during the three months ended September 30, consistent with seasonal variances of home sales which generally peak in the spring and summer months. Because the number of unique users may impact impression inventory, leads to real estate professionals, and graphical display inventory which we monetize, this variance in the average number of unique users may result in seasonality of revenue.
| Average for the Three Months Ended | ||||||||||||||||||||||||||||||||
| December 31, 2015 |
September 30, 2015 |
June 30, 2015 |
March 31, 2015 |
December 31, 2014 |
September 30, 2014 |
June 30, 2014 |
March 31, 2014 |
|||||||||||||||||||||||||
| (in thousands) | ||||||||||||||||||||||||||||||||
| Unique Users |
123,658 | 142,121 | 140,959 | 109,912 | 76,713 | 85,979 | 81,108 | 70,668 | ||||||||||||||||||||||||
| Period Ended | ||||||||||||||||||||||||||||||||
| December 31, 2015 |
September 30, 2015 |
June 30, 2015 |
March 31, 2015 |
December 31, 2014 |
September 30, 2014 |
June 30, 2014 |
March 31, 2014 |
|||||||||||||||||||||||||
| Agent Advertisers |
92,366 | 96,965 | 101,297 | 103,415 | 62,305 | 60,877 | 56,818 | 52,968 | ||||||||||||||||||||||||
65
Table of Contents
Liquidity and Capital Resources
In August 2013, we sold and issued 3,253,522 shares of our Class A common stock, including 753,522 shares of our Class A common stock pursuant to the underwriters’ option to purchase additional shares, and certain shareholders sold 2,523,486 shares of our Class A common stock, at a price of $82.00 per share (share and per share amounts have not been adjusted for the Class C Stock Split). The net proceeds for all shares sold by us in the public offering were approximately $253.9 million after deducting underwriting discounts and commissions of approximately $12.0 million and additional offering-related expenses of $0.9 million, for total expenses of $12.9 million. We received no proceeds from the sale of our Class A common stock by the selling shareholders. The net offering proceeds were invested into money market funds and U.S. government agency securities.
As of December 31, 2015 and December 31, 2014, we had cash, cash equivalents, restricted cash, and investments of $523.3 million and $455.9 million, respectively. Cash and cash equivalents balances consist of operating cash on deposit with financial institutions, money market funds, foreign government securities and certificates of deposit with original maturities of three months or less. Investments as of December 31, 2015 and December 31, 2014 consisted of fixed income securities, which include U.S. government agency securities, corporate notes and bonds, municipal securities, foreign government securities, commercial paper and certificates of deposit. Restricted cash primarily consists of certificates of deposit held as collateral in our name at a financial institution related to certain of our operating leases. Amounts on deposit with third-party financial institutions exceed the Federal Deposit Insurance Corporation and the Securities Investor Protection Corporation insurance limits, as applicable. We believe that cash from operations and cash, cash equivalents and investment balances will be sufficient to meet our ongoing operating activities, working capital, capital expenditures and other capital requirements for at least the next 12 months.
On February 17, 2015, we acquired Trulia in a stock-for-stock transaction. The total purchase price of Trulia was approximately $2.0 billion. During the years ended December 31, 2015 and 2014, Zillow Group incurred a total of $16.6 million and $21.5 million, respectively, in acquisition-related costs, primarily related to the acquisition of Trulia. We have included Trulia’s results of operations prospectively after February 17, 2015, the date of acquisition.
Our February 2015 acquisition of Trulia has had, and continues to have, a significant impact on our liquidity, financial position and results of operations. Trulia contributes to revenue, but we also incurred, and may continue to incur, significant acquisition-related and other expenses. Further, as a result of the acquisition, Zillow Group entered into a supplemental indenture in respect of the 2020 Notes in the aggregate principal amount of $230.0 million, which supplemental indenture provides, among other things, that, at the effective time of the Trulia acquisition, (i) each outstanding 2020 Note is no longer convertible into shares of Trulia common stock and is convertible solely into shares of Zillow Group Class A common stock, pursuant to, and in accordance with, the terms of the indenture governing the 2020 Notes, and (ii) Zillow Group guaranteed all of the obligations of Trulia under the 2020 Notes and related indenture. The aggregate principal amount of the 2020 Notes is due on December 15, 2020 if not earlier converted or redeemed. Interest is payable on the 2020 Notes at the rate of 2.75% semi-annually on June 15 and December 15 of each year.
Holders of the 2020 Notes may convert all or any portion of their notes, in multiples of $1,000 principal amount, at their option at any time prior to the close of business on the business day immediately preceding the maturity date. In connection with the supplemental indenture in respect of the 2020 Notes, the conversion ratio immediately prior to the effective time of the Trulia Merger of 27.8303 shares of Trulia common stock per $1,000 principal amount of notes was adjusted to 12.3567 shares of our Class A common stock per $1,000 principal amount of notes based on the exchange ratio of 0.444 per the Merger Agreement. This was equivalent to an initial conversion price of approximately $80.93 per share of our Class A common stock. In connection with the Class C Stock Split described above, the conversion ratio has been further adjusted to 41.4550 shares of Class A common stock per $1,000 principal amount of notes, which is equivalent to a conversion price of
66
Table of Contents
approximately $24.12 per share of our Class A common stock. The conversion ratio will be adjusted for certain dilutive events and will be increased in the case of corporate events that constitute a “Make-Whole Fundamental Change” (as defined in the indenture governing the notes). The conversion option of the 2020 Notes has no cash settlement provisions. The conversion option does not meet the criteria for separate accounting as a derivative as it is indexed to our own stock.
We may not redeem the 2020 Notes prior to December 20, 2018. We may redeem the 2020 Notes, at our option, in whole or in part on or after December 20, 2018, if the last reported sale price per share of our Class A common stock has been at least 130% of the conversion price then in effect for at least 20 trading days (whether or not consecutive) during any 30 consecutive trading day period.
For additional information regarding the 2020 Notes, see Note 12 to our consolidated financial statements.
In August 2015, we completed the acquisition of DotLoop. The total purchase price for the acquisition of DotLoop was approximately $105.5 million, which was primarily paid in cash. A substantial majority of the purchase price for DotLoop has been allocated to goodwill and intangible assets.
In September 2015, we completed the sale of our Market Leader business, including the Sharper Agent service and the Leads Direct, HouseValues and JustListed lead generation businesses, to the Perseus Division of Constellation Software, Inc. Market Leader became part of Zillow Group through Zillow Group’s February 2015 acquisition of Trulia. The total sales price was approximately $22.6 million, including $17.0 million that was paid in cash at closing and approximately $5.6 million for the amount received by Zillow Group from Constellation on December 29, 2015 upon the expiration of a holdback period to satisfy any purchase price adjustments and/or indemnification claims.
The following table presents selected cash flow data for the periods presented:
| Year Ended December 31, | ||||||||||||
| 2015 | 2014 | 2013 | ||||||||||
| (in thousands) | ||||||||||||
| Cash Flow Data: |
||||||||||||
| Cash flows provided by operating activities |
$ | 22,659 | $ | 45,519 | $ | 31,298 | ||||||
| Cash flows provided by (used in) investing activities |
64,441 | (145,437 | ) | (251,827 | ) | |||||||
| Cash flows provided by financing activities |
16,273 | 23,923 | 272,249 | |||||||||
Cash Flows Provided By Operating Activities
Our operating cash flows result primarily from cash received from real estate professionals, mortgage professionals, rental professionals, and brand advertisers. Our primary uses of cash from operating activities include payments for marketing and advertising activities and employee compensation. Additionally, uses of cash from operating activities include costs associated with operating our mobile applications and websites and other general corporate expenditures.
For the year ended December 31, 2015, net cash provided by operating activities was $22.7 million. This was driven by a net loss of $148.9 million, adjusted by share-based compensation expense of $105.2 million, depreciation and amortization expense of $75.4 million, non-cash restructuring costs of $19.0 million, a $3.9 non-cash loss on divestiture of businesses, net, bad debt expense of $3.2 million, a $2.9 million non-cash change in the valuation allowance related to a deferred tax liability generated in connection with our acquisition of DotLoop, an increase in the balance of deferred rent of $2.6 million, amortization of bond premium of $2.5 million, and a loss on disposal of property and equipment of $1.4 million. Changes in operating assets and liabilities decreased cash provided by operating activities by $38.8 million.
67
Table of Contents
For the year ended December 31, 2014, net cash provided by operating activities was $45.5 million. This was driven by a net loss of $43.6 million, adjusted by depreciation and amortization expense of $35.6 million, share-based compensation expense of $34.1 million, an increase in the balance of deferred rent of $4.4 million, amortization of bond premium of $3.5 million, impairment of certain acquired intangible assets of $3.3 million, bad debt expense of $2.5 million and a loss on disposal of property and equipment of $0.5 million. Primarily due to the increase in accrued expenses and accounts payable since December 31, 2013, which, in turn, were primarily a result of increased legal and advertising spend and related consulting costs, changes in operating assets and liabilities increased cash provided by operating activities by $5.2 million.
Cash flows provided by operating activities of $31.3 million for the year ended December 31, 2013 was primarily driven by a net loss of $12.5 million, adjusted by share-based compensation expense of $23.4 million, depreciation and amortization expense of $23.3 million, a $4.1 million non-cash change in the valuation allowance related to a deferred tax liability generated in connection with our acquisition of StreetEasy, Inc., bad debt expense of $1.9 million and loss on disposal of property and equipment of $0.9 million. Changes in operating assets and liabilities decreased cash provided by operating activities by $2.7 million.
Cash Flows Provided By (Used In) Investing Activities
Our primary investing activities include the purchase and sale or maturity of investments, the purchase of property and equipment and intangible assets, net cash acquired or cash paid in acquisitions, and proceeds from divestitures of businesses.
For the year ended December 31, 2015, net cash provided by investing activities was $64.4 million. This was primarily the result of $173.4 million of net cash acquired in connection with our February 2015 acquisition of Trulia, $36.0 million of net proceeds from maturities and sales of investments, and $23.4 million in proceeds from the divestiture of businesses, partially offset by $104.2 million paid in connection with our acquisition of DotLoop, $68.1 million of purchases for property and equipment and intangible assets and a $3.9 million decrease in restricted cash.
For the year ended December 31, 2014, net cash used in investing activities was $145.4 million. This was the result of $97.7 million of net purchases of investments, $44.2 million of purchases for property and equipment and intangible assets, and $3.5 million paid in connection with an acquisition.
For the year ended December 31, 2013, net cash used in investing activities was $251.8 million. This was the result of $183.1 million of net purchases of investments, $42.7 million paid in connection with the acquisition of StreetEasy, Inc., and $26.0 million of purchases for property and equipment and intangible assets.
The increases in capital expenditures and intangible assets during all three periods reflect our continued investments in support of business growth. We expect to continue to make significant investments in our business to provide for the continued innovation in our products and services in 2016 and thereafter.
Cash Flows Provided By Financing Activities
Our financing activities have primarily resulted from the exercise of employee option awards, equity awards withheld for tax liabilities and proceeds from our public offerings.
The proceeds from the exercise of option awards for the year ended December 31, 2015 was $24.4 million. In addition, for the year ended December 31, 2015, approximately $8.2 million of equity awards was withheld for tax liabilities.
68
Table of Contents
For the year ended December 31, 2014, our financing activities resulted entirely from the exercise of employee option awards. The proceeds from the issuance of Class A common stock from the exercise of option awards for the year ended December 31, 2014 was $23.9 million.
For the year ended December 31, 2013, net cash provided by financing activities was approximately $272.2 million, which was primarily the result of $253.9 million in proceeds, net of offering costs, from our August 2013 public offering, and $18.4 million in proceeds from the issuance of Class A common stock from the exercise of option awards.
Off-Balance Sheet Arrangements
We did not have any off-balance sheet arrangements other than outstanding surety bonds issued for our benefit of approximately $3.4 million as of December 31, 2015. We do not believe that the surety bonds will have a material effect on our liquidity, capital resources, market risk support or credit risk support. For additional information regarding the surety bonds, see Note 17 to our consolidated financial statements under the subsection titled “Surety Bonds”.
Contractual Obligations
The following table provides a summary of our contractual obligations as of December 31, 2015:
| Payment Due By Period | ||||||||||||||||||||
| Total | Less Than 1 Year |
1-3 Years | 3-5 Years | More Than 5 Years |
||||||||||||||||
| (in thousands, unaudited) | ||||||||||||||||||||
| Long-term debt (1) |
$ | 230,000 | $ | — | $ | — | $ | 230,000 | $ | — | ||||||||||
| Interest on long-term debt (2) |
31,625 | 6,325 | 12,650 | 12,650 | — | |||||||||||||||
| Operating lease obligations (3) |
188,110 | 17,885 | 44,924 | 44,348 | 80,953 | |||||||||||||||
| Purchase obligations (4) |
99,671 | 34,330 | 48,841 | 12,000 | 4,500 | |||||||||||||||
|
|
|
|
|
|
|
|
|
|
|
|||||||||||
| Total contractual obligations |
$ | 549,406 | $ | 58,540 | $ | 106,415 | $ | 298,998 | $ | 85,453 | ||||||||||
|
|
|
|
|
|
|
|
|
|
|
|||||||||||
| (1) | The aggregate principal amount of the 2020 Notes is due on December 15, 2020 if not earlier converted or redeemed. |
| (2) | The stated interest rate on the 2020 Notes is 2.75%. |
| (3) | Our operating lease obligations consist of various operating leases for office space under noncancelable operating lease agreements. For additional information regarding our operating leases, see Note 17 to our consolidated financial statements. |
| (4) | We have noncancelable purchase obligations for content related to our mobile applications and websites. For additional information regarding our purchase obligations, see Note 17 to our consolidated financial statements. |
As of December 31, 2015, we have outstanding letters of credit of approximately $4.6 million, $1.8 million, $1.5 million, $1.1 million and $1.1 million, respectively, which secure our lease obligations in connection with the operating leases of our San Francisco, Seattle, Bellevue, New York and Denver office spaces. Certain of the letters of credit are unsecured obligations, and certain of the letters of credit are secured by certificates of deposit held as collateral in our name at a financial institution.
We have excluded unrecognized tax benefits from the contractual obligations table above because we cannot make a reasonably reliable estimate of the amount and period of payment due primarily to our significant net operating loss carryforwards.
69
Table of Contents
In the course of business, we are required to provide financial commitments in the form of surety bonds to third parties as a guarantee of our performance on and our compliance with certain obligations. If we were to fail to perform or comply with these obligations, any draws upon surety bonds issued on our behalf would then trigger our payment obligation to the surety bond issuer. We have outstanding surety bonds issued for our benefit of approximately $3.4 million as of December 31, 2015.
Critical Accounting Policies and Estimates
Our consolidated financial statements are prepared in accordance with U.S. generally accepted accounting principles, or GAAP. The preparation of these consolidated financial statements requires us to make estimates and assumptions that affect the reported amounts of assets, liabilities, revenue, expenses and related disclosures. We evaluate our estimates and assumptions on an ongoing basis. Our estimates are based on historical experience and various other assumptions that we believe to be reasonable under the circumstances. Our actual results could differ from these estimates.
We believe that the assumptions and estimates associated with revenue recognition, website and software development costs, recoverability of long-lived assets and intangible assets with definite lives, share-based compensation, income taxes, business combinations, goodwill, and restructuring, have the greatest potential impact on our consolidated financial statements. Therefore, we consider these to be our critical accounting policies and estimates.
Revenue Recognition
In general, we recognize revenue when (i) persuasive evidence of an arrangement exists, (ii) delivery has occurred or services have been rendered to the customer, (iii) the fee is fixed or determinable, and (iv) collectability is reasonably assured. We consider a signed agreement, a binding insertion order or other similar documentation reflecting the terms and conditions under which products or services will be provided to be persuasive evidence of an arrangement. Collectability is assessed based on a number of factors, including payment history and the creditworthiness of a customer. If it is determined that collection is not reasonably assured, revenue is not recognized until collection becomes reasonably assured, which is generally upon receipt of cash.
We generate revenue from the sale of advertising services and our suite of tools to businesses and professionals primarily associated with the real estate and mortgage industries. These professionals include local real estate professionals, mortgage professionals and brand advertisers. Our two revenue categories are marketplace revenue and display revenue. Incremental direct costs incurred related to the acquisition or origination of a customer contract in a transaction that results in the deferral of revenue are expensed as incurred.
Marketplace Revenue. Marketplace revenue for the year ended December 31, 2015 consisted of real estate, mortgages, and Market Leader revenue. Market Leader revenue is included in our results of operations from February 17, 2015 through the date of divestiture of September 30, 2015.
Real estate revenue primarily includes revenue from advertising and a suite of tools sold to real estate professionals, as well as revenue generated by Zillow Group Rentals, which includes our rentals marketplace and suite of tools for rental professionals.
In August 2015, Zillow Group completed the integration of certain Zillow and Trulia agent advertising products, effectively eliminating the Trulia Local Ads and Trulia Mobile Ads products. As a result of the integration, Agent Advertisers can manage their advertising efforts across Zillow and Trulia mobile and Web through the combined Premier Agent platform.
70
Table of Contents
Our Zillow Premier Agent program, which is included in real estate revenue, offers a suite of marketing and business technology solutions to help real estate agents grow their businesses and personal brands. The Premier Agent program allows agents to select products and services that they can tailor to meet their business and advertising needs. The program has three tiers of participation including Premier Platinum, our flagship product, as well as Premier Gold and Premier Silver, to meet different marketing and business needs of a broad range of agents. All tiers of Premier Agents receive access to a dashboard portal on our website that provides individualized program performance analytics, as well as our personalized website service, and our free customer relationship management, or CRM, tool that captures detailed information about each contact made with a Premier Agent through our mobile and web platforms. Our Premier Gold product also includes featured listings whereby the agent’s listings will appear at the top of search results on our mobile and web platforms. Our Premier Platinum product includes the dashboard portal on our website, our personalized website service, our CRM tool, featured listings, and inclusion on our buyer’s agent list, whereby the agent appears as the agent to contact for listings in the purchased zip code. We charge for our Platinum Premier Agent product based on the number of impressions delivered on our buyer’s agent list in zip codes purchased and a contracted maximum cost per impression. Our Platinum Premier Agent product includes multiple deliverables which are accounted for as a single unit of accounting, as the delivery or performance of the undelivered elements is based on traffic to our mobile applications and websites. We recognize revenue related to our impression-based Platinum Premier Agent product based on the lesser of (i) the actual number of impressions delivered on our buyer’s agent list during the period multiplied by the contracted maximum cost per impression, or (ii) the contractual maximum spend on a straight-line basis during the contractual period over which the services are delivered, typically over a period of six months or twelve months and then month-to-month thereafter. We charge a fixed subscription fee for Zillow’s Premier Gold and Premier Silver subscription products. Subscription advertising revenue for our Premier Gold and Premier Silver subscription products is recognized on a straight-line basis during the contractual period over which the services are delivered, typically over a period of six months and then month-to-month thereafter.
Our Trulia real estate products included in real estate revenue are primarily sold on a fixed fee subscription basis, and include Trulia Local Ads, Trulia Mobile Ads, Trulia Pro with featured listings and Trulia Seller Ads. Prior to the August 2015 integration of certain of Zillow’s and Trulia’s advertising products, Trulia Local Ads and Trulia Mobile Ads enabled real estate professionals to promote themselves on Trulia’s search results pages and property details pages for a local market area. Real estate professionals purchased subscriptions to these products based upon their specified market share for a city or zip code, at a fixed monthly price, for periods ranging from one month to one year, with pricing depending on demand, location, and the percentage of market share purchased. Following the August 2015 agent advertising product integration, Trulia Local Ads and Trulia Mobile Ads products are no longer sold by Zillow Group. Trulia’s featured listings product allows real estate professionals to receive prominent placement of their listings in Trulia’s search results. Real estate professionals sign up for new subscriptions to this product at a fixed monthly price for periods that generally range from six months to 12 months. Trulia Seller Ads enable real estate professionals to generate leads from consumers interested in selling their homes. Subscription advertising revenue for Trulia’s real estate products included in real estate revenue is recognized on a straight-line basis during the contractual period over which the services are delivered.
Rentals revenue, which is included in real estate revenue, primarily includes advertising sold to property managers and other rental professionals on a cost per lead and cost per lease generated basis. We recognize revenue as leads are delivered to rental professionals or as qualified leases are confirmed.
Mortgages revenue primarily includes advertising sold to mortgage lenders and other mortgage professionals on a cost per lead basis, as well as revenue generated by Mortech, which provides subscription-based mortgage software solutions, including a product and pricing engine and lead management platform, for which we recognize revenue on a straight-line basis during the contractual period over which the services are delivered. For our cost per lead mortgage advertising products, participating qualified mortgage professionals make a prepayment to gain access to consumers interested in connecting with mortgage professionals.
71
Table of Contents
Consumers who request rates for mortgage loans are presented with personalized quotes from participating mortgage professionals. We only charge mortgage professionals a fee when users contact mortgage professionals for more information regarding a mortgage loan quote. Mortgage professionals who exhaust their initial prepayment can then prepay additional funds to continue to participate in the marketplace. We recognize revenue when a user contacts a mortgage professional through Zillow Group’s mortgages platform.
Market Leader revenue primarily includes revenue from the sale of a comprehensive premium software-as-a-service based marketing product typically sold to real estate professionals as a bundle of products under a fixed fee subscription. Subscription advertising revenue for our Market Leader subscription products is recognized on a straight-line basis during the contractual period over which the services are delivered.
Display Revenue. Display revenue primarily consists of graphical mobile and web advertising sold on a cost per thousand impressions (“CPM”) or cost-per-click (“CPC”) basis to advertisers promoting their brands on our mobile applications and websites and our partner websites, primarily in the real estate industry, including real estate brokerages, home builders, mortgage professionals and home services providers. Our advertising customers also include telecommunications, automotive, insurance and consumer products companies. Impressions are the number of times an advertisement is loaded on a web page and clicks are the number of times users click on an advertisement. Pricing is primarily based on advertisement size and position on our mobile applications and websites, and fees are generally billed monthly. We recognize display revenue as clicks occur or as impressions are delivered to users interacting with our mobile applications or websites.
Website and Software Development Costs
The costs incurred in the preliminary stages of website and software development are expensed as incurred. Once an application has reached the development stage, internal and external costs, if direct and incremental and deemed by management to be significant, are capitalized in property and equipment and amortized on a straight-line basis over their estimated useful lives. Maintenance and enhancement costs (including those costs in the post-implementation stages) are typically expensed as incurred, unless such costs relate to substantial upgrades and enhancements to the websites (or software) that result in added functionality, in which case the costs are capitalized and amortized on a straight-line basis over the estimated useful lives.
Capitalized development activities placed in service are amortized over the expected useful lives of those releases, currently estimated at one year. Estimated useful lives of website and software development activities are reviewed frequently and adjusted as appropriate to reflect upcoming development activities that may include significant upgrades and/or enhancements to the existing functionality.
We exercise judgment in determining the point at which various projects may be capitalized, in assessing the ongoing value of the capitalized costs, and in determining the estimated useful lives over which the costs are amortized. To the extent that we change the manner in which we develop and test new features and functionalities related to our mobile applications and websites, assess the ongoing value of capitalized assets, or determine the estimated useful lives over which the costs are amortized, the amount of website and software development costs we capitalize and amortize could change in future periods.
Recoverability of Intangible Assets with Definite Lives and Other Long-Lived Assets
We evaluate intangible assets and other long-lived assets for impairment whenever events or circumstances indicate that they may not be recoverable. Recoverability is measured by comparing the carrying amount of an asset group to future undiscounted net cash flows expected to be generated. We group assets for purposes of such review at the lowest level for which identifiable cash flows of the asset group are largely independent of the cash flows of the other groups of assets and liabilities. If this comparison indicates impairment, the amount of impairment to be recognized is calculated as the difference between the carrying value and the fair value of the asset group.
72
Table of Contents
Unforeseen events, changes in circumstances and market conditions and material differences in estimates of future cash flows could adversely affect the fair value of our assets and could result in an impairment charge. Fair value can be estimated utilizing a number of techniques including quoted market prices, prices for comparable assets, or other valuation processes involving estimates of cash flows, multiples of earnings or revenues, and we may make various assumptions and estimates when performing our impairment assessments, particularly as it relates to cash flow projections. Cash flow estimates are by their nature subjective, and include assumptions regarding factors such as recent and forecasted operating performance, revenue trends and operating margins. These estimates could also be adversely impacted by changes in federal, state, or local regulations, economic downturns or developments, or other market conditions affecting our industry.
Share-Based Compensation
We measure compensation expense for all share-based awards at fair value on the date of grant and recognize compensation expense over the service period for awards expected to vest. We use the Black-Scholes-Merton option-pricing model to determine the fair value for option awards and recognize compensation expense on a straight-line basis over the option awards’ vesting period. For restricted stock awards, restricted stock units and restricted units, we use the market value of Zillow’s Class A common stock and Class C capital stock, as applicable, on the date of grant to determine the fair value of the award, and we recognize compensation expense on a straight-line basis over the awards’ vesting period.
Determining the fair value of option awards at the grant date requires judgment. If any of the assumptions used in the Black-Scholes-Merton model changes significantly, share-based compensation expense for future option awards may differ materially compared with the awards granted previously. In valuing our option awards, we make assumptions about risk-free interest rates, dividend yields, volatility, and weighted-average expected lives, including estimated forfeiture rates.
Risk-free interest rate. Risk-free interest rates are derived from U.S. Treasury securities as of the option award’s grant date.
Expected dividend yields. Expected dividend yields are based on our historical dividend payments, which have been zero to date.
Volatility. The expected volatility for our Class A common stock and Class C capital stock is estimated using a combination of our historical volatility and the published historical volatilities of industry peers in the online publishing market (primarily the financial and real estate services industries) representing the verticals in which we operate.
Expected term. Through June 30, 2015, we estimated the weighted-average expected life of the option awards as the average of the option vesting schedule and the term of the award, since we did not have sufficient historical exercise data to provide a reasonable basis upon which to estimate expected term due to the limited period of time share-based awards had been exercisable. Beginning July 1, 2015, we estimate the weighted-average expected life of the option awards based on our historical exercise data.
Forfeiture rate. We record share-based compensation expense net of estimated forfeitures. Forfeiture rates are estimated using historical actual forfeiture trends as well as our judgment of future forfeitures. These rates are evaluated at least quarterly and any change in compensation expense is recognized in the period of the change. The estimation of option awards that will ultimately vest requires judgment, and to the extent actual results or updated estimates differ from our current estimates, such amounts will be recorded as a cumulative adjustment in the period in which the estimates are revised. We consider many factors when estimating expected forfeitures, including employee class and historical experience.
73
Table of Contents
We will continue to use judgment in evaluating the expected volatility, expected terms, and forfeiture rates utilized for our share-based compensation expense calculations on a prospective basis. Actual results, and future changes in estimates, may differ substantially from management’s current estimates. As we continue to accumulate additional data related to our Class A common stock and Class C capital stock, we may have refinements to the estimates of our expected volatility, expected terms, and forfeiture rates, which could materially impact our future share-based compensation expense. In future periods, we expect our share-based compensation expense to increase as a result of our existing, unrecognized share-based compensation that will be recognized as the awards vest, and as we grant additional share-based awards to attract and retain employees.
Income Taxes
We use the asset and liability approach for accounting and reporting income taxes, which requires the recognition of deferred tax assets and liabilities for the expected future tax consequences of temporary differences between the financial statement and tax bases of assets and liabilities at the applicable enacted tax rates. A valuation allowance against deferred tax assets would be established if, based on the weight of available evidence, it is more likely than not (a likelihood of more than 50%) that some or all of the deferred tax assets are not expected to be realized.
Our assumptions, judgments, and estimates relative to the value of our deferred tax assets take into account predictions of the amount and category of future taxable income, such as income from operations or capital gains income. Actual operating results and the underlying amount and category of income in future years could render our current assumptions, judgments, and estimates of recoverable net deferred taxes inaccurate. Any of the assumptions, judgments, and estimates mentioned above could cause our actual income tax obligations to differ from our estimates, thus materially impacting our financial position and results of operations.
Since inception, we have incurred operating losses, and accordingly, we have generally not recorded a provision for income taxes. We generally do not expect any significant changes in the amount of our income tax provision until we are no longer incurring operating losses.
We establish reserves for tax-related uncertainties based on estimates of whether, and the extent to which, additional taxes will be due. We adjust these reserves in light of changing facts and circumstances, such as the closing of a tax audit, new tax legislation or the change of an estimate. To the extent that the final tax outcome of these matters is different than the amounts recorded, such differences will affect the provision for income taxes in the period in which such determination is made.
Business Combinations
We recognize identifiable assets acquired and liabilities assumed at their acquisition date fair values. Goodwill as of the acquisition date is measured as the excess of consideration transferred over the net of the acquisition date fair values of the assets acquired and the liabilities assumed. While we use our best estimates and assumptions for the purchase price allocation process to value assets acquired and liabilities assumed at the acquisition date, our estimates are inherently uncertain and subject to refinement. As a result, during the measurement period, which may be up to one year from the acquisition date, we record adjustments to the assets acquired and liabilities assumed, with the corresponding offset to goodwill to the extent that we identify adjustments to the preliminary purchase price allocation. Upon the conclusion of the measurement period or final determination of the values of assets acquired or liabilities assumed, whichever comes first, any subsequent adjustments are recorded to our condensed consolidated statements of operations. We recognize adjustments to provisional amounts that are identified during the measurement period in the reporting period in which the adjustment amounts are determined.
74
Table of Contents
Goodwill
We assess the impairment of goodwill on an annual basis, in our fourth quarter, or whenever events or changes in circumstances indicate that goodwill may be impaired. We assess goodwill for possible impairment by first performing a qualitative assessment to determine whether it is more likely than not that the fair value of our reporting unit is less than its carrying amount. If we determine that it is not more likely than not that the fair value of our reporting unit is less than its carrying amount, then the first and second steps of the goodwill impairment test are unnecessary. If we determine that it is more likely than not that the fair value of our reporting unit is less than its carrying amount, we perform the two-step goodwill impairment test. The first step of the goodwill impairment test identifies if there is potential goodwill impairment. If step one indicates that an impairment may exist, a second step is performed to measure the amount of the goodwill impairment, if any. Goodwill impairment exists when the estimated fair value of goodwill is less than its carrying value. If impairment exists, the carrying value of the goodwill is reduced to fair value through an impairment charge recorded in our statements of operations.
For our most recent impairment assessment performed as of October 1, 2015, we performed a qualitative assessment and determined that it is not more likely than not that the fair value of our reporting unit is less than its carrying amount, and therefore, the first and second steps of the goodwill impairment test were unnecessary. In evaluating whether it is more likely than not that the fair value of our reporting unit is less than its carrying amount, we considered macroeconomic conditions, industry and market considerations, cost factors, our overall financial performance, other relevant entity-specific events, potential events affecting our reporting unit, and changes in the market price of our common stock. The primary qualitative factors we considered in our analysis as of October 1, 2015 were our overall financial performance, including our revenue growth and positive cash flows, and a market capitalization that is well in excess of the book value of our common stock.
Restructuring
The main components of our restructuring plan related to our February 2015 acquisition of Trulia relate to workforce reduction and contract termination costs. Workforce reduction charges are accrued when it is probable that the employees are entitled to the severance payments and the amounts can be reasonably estimated. One-time involuntary termination benefits are accrued when the plan of termination has been communicated to employees and certain other criteria are met. Share-based compensation expense related to acceleration of share-based awards assumed in connection with the acquisition of Trulia is recognized over the remaining requisite service period. Contract termination costs are recognized as a liability when a contract is terminated in accordance with its terms or at the cease-use date. The cumulative effect of a change resulting from a revision to either the timing or the amount of estimated cash flows is recognized as an adjustment to the liability in the period of the change. If the amounts and timing of cash flows from restructuring activities are significantly different from what we have estimated, the actual amount of restructuring and other related charges could be materially different than those we have recorded.
Recent Accounting Pronouncements
In November 2015, the Financial Accounting Standards Board (“FASB”) issued guidance on the balance sheet classification of deferred taxes. This standard requires that deferred tax liabilities and assets be classified as noncurrent in a classified statement of financial position. This guidance is effective for interim and annual reporting periods beginning after December 15, 2016, and early adoption is permitted. We adopted this guidance for the year ended December 31, 2015 on a retrospective basis. The adoption of this guidance has not had a material impact on our financial position, results of operations or cash flows, and did not have any effect on prior periods due to the full valuation allowance against our net deferred tax assets.
In September 2015, the FASB issued guidance on simplifying the accounting for measurement-period adjustments in business combinations. This standard requires that an acquirer recognize adjustments to provisional amounts that are identified during the measurement period in the reporting period in which the
75
Table of Contents
adjustment amounts are determined. This guidance is effective for interim and annual reporting periods beginning after December 15, 2015, and early adoption is permitted. We adopted this guidance for the year ended December 31, 2015. The adoption of this guidance has not had a material impact on our financial position, results of operations or cash flows.
In April 2015, the FASB issued guidance related to a customer’s accounting for fees paid in a cloud computing arrangement. This standard provides guidance to customers about whether a cloud computing arrangement includes a software license. If a cloud computing arrangement includes a software license, then the customer should account for the software license element of the arrangement consistent with the acquisition of other software licenses. If a cloud computing arrangement does not include a software license, the customer should account for the arrangement as a service contract. This guidance is effective for interim and annual reporting periods beginning after December 15, 2015, and early adoption is permitted. We adopted this guidance on January 1, 2016. The adoption of this guidance has not had a material impact on our financial position, results of operations or cash flows.
In August 2014, the FASB issued guidance on the disclosure of uncertainties about an entity’s ability to continue as a going concern. This standard provides guidance about management’s responsibility to evaluate whether there is substantial doubt about an entity’s ability to continue as a going concern and to provide related footnote disclosures. The guidance is effective for annual reporting periods ending after December 15, 2016, and early adoption is permitted. We expect to adopt this guidance on January 1, 2017. We do not expect the adoption of this guidance to have any impact on our financial position, results of operations or cash flows.
In May 2014, the FASB issued guidance on revenue recognition. This guidance provides that an entity should recognize revenue to depict the transfer of promised goods or services to customers in an amount that reflects the consideration to which the entity expects to be entitled in exchange for those goods or services. This guidance also requires more detailed disclosures to enable users of financial statements to understand the nature, amount, timing, and uncertainty of revenue and cash flows arising from contracts with customers. The original effective date of this guidance was for interim and annual reporting periods beginning after December 15, 2016, early adoption is not permitted, and the guidance must be applied retrospectively or modified retrospectively. In July 2015, the FASB approved an optional one-year deferral of the effective date. As a result, we expect to adopt this guidance on January 1, 2018. We have not yet determined our approach to adoption or the impact the adoption of this guidance will have on our financial position, results of operations or cash flows, if any.
In April 2014, the FASB issued guidance on reporting discontinued operations and disclosures of disposals of components of an entity. This standard raises the threshold for a disposal to qualify as a discontinued operation and requires new disclosures of both discontinued operations and certain other disposals that do not meet the definition of a discontinued operation. The guidance is effective for annual reporting periods ending after December 15, 2014. Early adoption is permitted but only for disposals that have not been reported in financial statements previously issued. We adopted this guidance on January 1, 2015. The adoption of this guidance has not had a material impact on our financial position, results of operations or cash flows.
Item 7A. Quantitative and Qualitative Disclosures About Market Risk
We are exposed to market risks in the ordinary course of our business. These risks primarily consist of fluctuations in interest rates.
Interest Rate Risk
Under our current investment policy, we invest our excess cash in money market funds, certificates of deposit, U.S. government agency securities, foreign government securities, municipal securities, commercial paper, and corporate notes and bonds. Our current investment policy seeks first to preserve principal, second to provide liquidity for our operating and capital needs and third to maximize yield without putting our principal at risk.
76
Table of Contents
Our investments are exposed to market risk due to the fluctuation of prevailing interest rates that may reduce the yield on our investments or their fair value. As our investment portfolio is short-term in nature, we do not believe an immediate 10% increase in interest rates would have a material effect on the fair market value of our portfolio, and therefore we do not expect our results of operations or cash flows to be materially affected by a sudden change in market interest rates.
As of December 31, 2015, we also have outstanding $230.0 million aggregate principal Convertible Senior Notes due in 2020 (the “2020 Notes”). The 2020 Notes were guaranteed by Zillow Group in connection with our February 2015 acquisition of Trulia, Inc. The 2020 Notes carry a fixed interest rate of 2.75% per year.
Inflation Risk
We do not believe that inflation has had a material effect on our business, results of operations or financial condition. If our costs were to become subject to significant inflationary pressures, we may not be able to fully offset such higher costs through price increases. Our inability or failure to do so could harm our business, results of operations and financial condition.
Foreign Currency Exchange Risk
We do not believe that foreign currency exchange risk has had a material effect on our business, results of operations or financial condition. As we do not maintain a significant balance of foreign currency, we do not believe an immediate 10% increase or decrease in foreign currency exchange rates relative to the U.S. dollar would have a material effect on our business, results of operations or financial condition.
77
Table of Contents
Item 8. Financial Statements and Supplementary Data
Index to Consolidated Financial Statements
| Page | ||||
| 79 | ||||
| 80 | ||||
| 81 | ||||
| 82 | ||||
| 83 | ||||
| 84 | ||||
| 85 | ||||
78
Table of Contents
REPORT OF INDEPENDENT REGISTERED PUBLIC ACCOUNTING FIRM
The Board of Directors and Shareholders of Zillow Group, Inc.
We have audited the accompanying consolidated balance sheets of Zillow Group, Inc. as of December 31, 2015 and 2014, and the related consolidated statements of operations, comprehensive loss, shareholders’ equity and cash flows for each of the three years in the period ended December 31, 2015. These consolidated financial statements are the responsibility of the Company’s management. Our responsibility is to express an opinion on these consolidated financial statements based on our audits.
We conducted our audits in accordance with the standards of the Public Company Accounting Oversight Board (United States). Those standards require that we plan and perform the audit to obtain reasonable assurance about whether the financial statements are free of material misstatement. An audit includes examining, on a test basis, evidence supporting the amounts and disclosures in the financial statements. An audit also includes assessing the accounting principles used and significant estimates made by management, as well as evaluating the overall financial statement presentation. We believe that our audits provide a reasonable basis for our opinion.
In our opinion, the financial statements referred to above present fairly, in all material respects, the consolidated financial position of Zillow Group, Inc. at December 31, 2015 and 2014, and the consolidated results of its operations and its cash flows for each of the three years in the period ended December 31, 2015, in conformity with U.S. generally accepted accounting principles.
We also have audited, in accordance with the standards of the Public Company Accounting Oversight Board (United States), Zillow Group, Inc.’s internal control over financial reporting as of December 31, 2015, based on criteria established in Internal Control-Integrated Framework issued by the Committee of Sponsoring Organizations of the Treadway Commission (2013 framework) and our report dated February 12, 2016 expressed an unqualified opinion thereon.
/s/ Ernst & Young LLP
Seattle, Washington
February 12, 2016
79
Table of Contents
CONSOLIDATED BALANCE SHEETS
(in thousands, except share data)
| December 31, | ||||||||
| 2015 | 2014 | |||||||
| Assets |
||||||||
| Current assets: |
||||||||
| Cash and cash equivalents |
$ | 229,138 | $ | 125,765 | ||||
| Short-term investments |
291,151 | 246,829 | ||||||
| Accounts receivable, net of allowance for doubtful accounts of $3,378 and $2,811 at December 31, 2015 and 2014, respectively |
29,789 | 18,684 | ||||||
| Prepaid expenses and other current assets |
24,016 | 10,059 | ||||||
|
|
|
|
|
|||||
| Total current assets |
574,094 | 401,337 | ||||||
| Restricted cash |
3,015 | — | ||||||
| Long-term investments |
— | 83,326 | ||||||
| Property and equipment, net |
89,639 | 41,600 | ||||||
| Goodwill |
1,909,167 | 96,352 | ||||||
| Intangible assets, net |
554,765 | 26,757 | ||||||
| Other assets |
5,020 | 358 | ||||||
|
|
|
|
|
|||||
| Total assets |
$ | 3,135,700 | $ | 649,730 | ||||
|
|
|
|
|
|||||
| Liabilities and shareholders’ equity |
||||||||
| Current liabilities: |
||||||||
| Accounts payable |
$ | 3,361 | $ | 9,358 | ||||
| Accrued expenses and other current liabilities |
43,047 | 16,883 | ||||||
| Accrued compensation and benefits |
11,392 | 6,735 | ||||||
| Deferred revenue |
21,450 | 15,356 | ||||||
| Deferred rent, current portion |
1,172 | 864 | ||||||
|
|
|
|
|
|||||
| Total current liabilities |
80,422 | 49,196 | ||||||
| Deferred rent, net of current portion |
13,743 | 11,755 | ||||||
| Long-term debt |
230,000 | — | ||||||
| Deferred tax liabilities and other long-term liabilities |
132,482 | — | ||||||
|
|
|
|
|
|||||
| Total liabilities |
456,647 | 60,951 | ||||||
| Commitments and contingencies (Note 17) |
||||||||
| Shareholders’ equity: |
||||||||
| Preferred stock, $0.0001 par value; 30,000,000 shares authorized as of December 31, 2015 and 2014; no shares issued and outstanding as of December 31, 2015 and 2014 |
— | — | ||||||
| Class A common stock, $0.0001 par value; 1,245,000,000 and 600,000,000 shares authorized as of December 31, 2015 and 2014, respectively; 53,299,111 and 34,578,393 shares issued and outstanding as of December 31, 2015 and 2014, respectively |
5 | 3 | ||||||
| Class B common stock, $0.0001 par value; 15,000,000 shares authorized as of December 31, 2015 and 2014; 6,217,447 shares issued and outstanding as of December 31, 2015 and 2014 |
1 | 1 | ||||||
| Class C capital stock, $0.0001 par value; 600,000,000 shares authorized as of December 31, 2015 and no shares authorized as of December 31, 2014; 118,958,359 shares issued and outstanding as of December 31, 2015 and 81,591,680 shares issued and outstanding on a retroactive basis as of December 31, 2014 |
12 | 8 | ||||||
| Additional paid-in capital |
2,956,111 | 716,498 | ||||||
| Accumulated other comprehensive loss |
(471 | ) | — | |||||
| Accumulated deficit |
(276,605 | ) | (127,731 | ) | ||||
|
|
|
|
|
|||||
| Total shareholders’ equity |
2,679,053 | 588,779 | ||||||
|
|
|
|
|
|||||
| Total liabilities and shareholders’ equity |
$ | 3,135,700 | $ | 649,730 | ||||
|
|
|
|
|
|||||
See accompanying notes to consolidated financial statements.
80
Table of Contents
CONSOLIDATED STATEMENTS OF OPERATIONS
(in thousands, except per share data)
| Year Ended December 31, | ||||||||||||
| 2015 | 2014 | 2013 | ||||||||||
| Revenue |
$ | 644,677 | $ | 325,893 | $ | 197,545 | ||||||
| Costs and expenses: |
||||||||||||
| Cost of revenue (exclusive of amortization) (1) |
61,614 | 29,461 | 18,810 | |||||||||
| Sales and marketing |
307,089 | 169,462 | 108,891 | |||||||||
| Technology and development |
198,565 | 84,669 | 48,498 | |||||||||
| General and administrative |
170,445 | 65,503 | 37,919 | |||||||||
| Acquisition-related costs |
16,576 | 21,493 | 376 | |||||||||
| Restructuring costs |
35,551 | — | — | |||||||||
| Loss on divestiture of business |
4,368 | — | — | |||||||||
|
|
|
|
|
|
|
|||||||
| Total costs and expenses |
794,208 | 370,588 | 214,494 | |||||||||
|
|
|
|
|
|
|
|||||||
| Loss from operations |
(149,531 | ) | (44,695 | ) | (16,949 | ) | ||||||
| Other income |
1,501 | 1,085 | 385 | |||||||||
| Interest expense |
(5,489 | ) | — | — | ||||||||
|
|
|
|
|
|
|
|||||||
| Loss before income taxes |
(153,519 | ) | (43,610 | ) | (16,564 | ) | ||||||
| Income tax benefit |
4,645 | — | 4,111 | |||||||||
|
|
|
|
|
|
|
|||||||
| Net loss |
$ | (148,874 | ) | $ | (43,610 | ) | $ | (12,453 | ) | |||
|
|
|
|
|
|
|
|||||||
| Net loss per share—basic and diluted |
$ | (0.88 | ) | $ | (0.36 | ) | $ | (0.12 | ) | |||
| Weighted-average shares outstanding—basic and diluted |
169,767 | 120,027 | 108,087 | |||||||||
|
(1) Amortization of website development costs and intangible assets included in technology and development |
$ | 63,189 | $ | 29,487 | $ | 19,791 | ||||||
See accompanying notes to consolidated financial statements.
81
Table of Contents
CONSOLIDATED STATEMENTS OF COMPREHENSIVE LOSS
(in thousands)
| Year Ended December 31, | ||||||||||||
| 2015 | 2014 | 2013 | ||||||||||
| Net loss |
$ | (148,874 | ) | $ | (43,610 | ) | $ | (12,453 | ) | |||
| Other comprehensive loss: |
||||||||||||
| Unrealized losses on investments |
(448 | ) | — | — | ||||||||
| Reclassification adjustment for net losses from investments included in net loss |
(23 | ) | — | — | ||||||||
|
|
|
|
|
|
|
|||||||
| Net unrealized losses on investments |
(471 | ) | — | — | ||||||||
|
|
|
|
|
|
|
|||||||
| Total other comprehensive loss |
(471 | ) | — | — | ||||||||
|
|
|
|
|
|
|
|||||||
| Comprehensive loss |
$ | (149,345 | ) | $ | (43,610 | ) | $ | (12,453 | ) | |||
|
|
|
|
|
|
|
|||||||
See accompanying notes to consolidated financial statements.
82
Table of Contents
CONSOLIDATED STATEMENTS OF SHAREHOLDERS’ EQUITY
(in thousands, except share data)
| Class A Common Stock, Class B Common Stock and Class C Capital Stock |
Additional Paid-In Capital |
Accumulated Deficit |
Accumulated Other Comprehensive Loss |
Total Shareholders’ Equity |
||||||||||||||||||||
| Shares | Amount | |||||||||||||||||||||||
| Balance at December 31, 2012 |
101,630,820 | $ | 10 | $ | 351,975 | $ | (71,668 | ) | $ | — | $ | 280,317 | ||||||||||||
| Issuance of common and capital stock upon exercise of stock options |
6,076,980 | 1 | 18,349 | — | — | 18,350 | ||||||||||||||||||
| Issuance of restricted shares of common and capital stock |
756,342 | — | — | — | — | — | ||||||||||||||||||
| Cancellation of restricted shares of common and capital stock |
(15,810 | ) | — | — | — | — | — | |||||||||||||||||
| Fair value of equity awards assumed in connection with an acquisition |
— | — | 430 | — | — | 430 | ||||||||||||||||||
| Share-based compensation expense |
— | — | 27,253 | — | — | 27,253 | ||||||||||||||||||
| Issuance of common and capital stock in connection with public offering, net of issuance costs of $12,900 |
9,760,566 | 1 | 253,898 | — | — | 253,899 | ||||||||||||||||||
| Net loss |
— | — | — | (12,453 | ) | — | (12,453 | ) | ||||||||||||||||
|
|
|
|
|
|
|
|
|
|
|
|
|
|||||||||||||
| Balance at December 31, 2013 |
118,208,898 | 12 | 651,905 | (84,121 | ) | — | 567,796 | |||||||||||||||||
| Issuance of common and capital stock upon exercise of stock options |
3,970,527 | — | 23,923 | — | — | 23,923 | ||||||||||||||||||
| Issuance of common and capital stock related to vesting of restricted stock units |
208,095 | — | — | — | — | — | ||||||||||||||||||
| Share-based compensation expense |
— | — | 40,670 | — | — | 40,670 | ||||||||||||||||||
| Net loss |
— | — | — | (43,610 | ) | — | (43,610 | ) | ||||||||||||||||
|
|
|
|
|
|
|
|
|
|
|
|
|
|||||||||||||
| Balance at December 31, 2014 |
122,387,520 | 12 | 716,498 | (127,731 | ) | — | 588,779 | |||||||||||||||||
| Issuance of common and capital stock in connection with an acquisition |
51,779,112 | 5 | 1,883,723 | — | — | 1,883,728 | ||||||||||||||||||
| Equity award vesting acceleration in connection with restructuring |
— | — | 14,859 | — | — | 14,859 | ||||||||||||||||||
| Fair value of equity awards assumed in connection with acquisitions |
— | — | 82,840 | — | — | 82,840 | ||||||||||||||||||
| Debt premium recorded in additional paid-in capital in connection with an acquisition |
— | — | 126,386 | — | — | 126,386 | ||||||||||||||||||
| Issuance of common and capital stock upon exercise of stock options |
2,732,767 | 1 | 24,422 | — | — | 24,423 | ||||||||||||||||||
| Vesting of restricted stock units |
1,899,531 | — | — | — | — | — | ||||||||||||||||||
| Shares and value of restricted stock units withheld for tax liability |
(324,013 | ) | — | (8,150 | ) | — | — | (8,150 | ) | |||||||||||||||
| Share-based compensation expense |
— | — | 115,533 | — | — | 115,533 | ||||||||||||||||||
| Net loss |
— | — | — | (148,874 | ) | — | (148,874 | ) | ||||||||||||||||
| Other comprehensive loss |
— | — | — | — | (471 | ) | (471 | ) | ||||||||||||||||
|
|
|
|
|
|
|
|
|
|
|
|
|
|||||||||||||
| Balance at December 31, 2015 |
178,474,917 | $ | 18 | $ | 2,956,111 | $ | (276,605 | ) | $ | (471 | ) | $ | 2,679,053 | |||||||||||
|
|
|
|
|
|
|
|
|
|
|
|
|
|||||||||||||
See accompanying notes to consolidated financial statements.
83
Table of Contents
CONSOLIDATED STATEMENTS OF CASH FLOWS
(in thousands)
| Year Ended December 31, | ||||||||||||
| 2015 | 2014 | 2013 | ||||||||||
| Operating activities |
||||||||||||
| Net loss |
$ | (148,874 | ) | $ | (43,610 | ) | $ | (12,453 | ) | |||
| Adjustments to reconcile net loss to net cash provided by operating activities, net of amounts assumed in connection with acquisitions: |
||||||||||||
| Depreciation and amortization |
75,386 | 35,624 | 23,254 | |||||||||
| Share-based compensation expense |
105,214 | 34,085 | 23,436 | |||||||||
| Restructuring costs |
19,001 | — | — | |||||||||
| Release of valuation allowance on certain deferred tax assets |
(2,853 | ) | — | (4,111 | ) | |||||||
| Loss on disposal of property and equipment |
1,384 | 505 | 910 | |||||||||
| Loss on divestiture of businesses, net |
3,899 | — | — | |||||||||
| Bad debt expense |
3,235 | 2,529 | 1,907 | |||||||||
| Deferred rent |
2,553 | 4,415 | 400 | |||||||||
| Amortization of bond premium |
2,487 | 3,506 | 624 | |||||||||
| Impairment of certain acquired intangible assets |
— | 3,259 | — | |||||||||
| Changes in operating assets and liabilities: |
||||||||||||
| Accounts receivable |
(1,051 | ) | (5,979 | ) | (7,571 | ) | ||||||
| Prepaid expenses and other assets |
(761 | ) | (5,084 | ) | (1,543 | ) | ||||||
| Accounts payable |
(11,158 | ) | 4,634 | 1,497 | ||||||||
| Accrued expenses and other current liabilities |
(18,384 | ) | 6,282 | (668 | ) | |||||||
| Accrued compensation and benefits |
(4,020 | ) | 2,295 | 1,706 | ||||||||
| Deferred revenue |
(2,434 | ) | 3,058 | 3,910 | ||||||||
| Other long-term liabilities |
(965 | ) | — | — | ||||||||
|
|
|
|
|
|
|
|||||||
| Net cash provided by operating activities |
22,659 | 45,519 | 31,298 | |||||||||
| Investing activities |
||||||||||||
| Proceeds from maturities of investments |
335,443 | 174,949 | 53,000 | |||||||||
| Purchases of investments |
(307,658 | ) | (272,644 | ) | (236,147 | ) | ||||||
| Proceeds from sales of investments |
8,260 | — | — | |||||||||
| Decrease in restricted cash, net of amounts assumed in connection with an acquisition |
3,931 | — | — | |||||||||
| Purchases of property and equipment |
(54,981 | ) | (32,595 | ) | (22,047 | ) | ||||||
| Purchases of intangible assets |
(13,127 | ) | (11,647 | ) | (3,925 | ) | ||||||
| Proceeds from divestiture of businesses |
23,359 | — | — | |||||||||
| Cash acquired in acquisition, net |
173,406 | — | — | |||||||||
| Cash paid for acquisitions, net |
(104,192 | ) | (3,500 | ) | (42,708 | ) | ||||||
|
|
|
|
|
|
|
|||||||
| Net cash provided by (used in) investing activities |
64,441 | (145,437 | ) | (251,827 | ) | |||||||
| Financing activities |
||||||||||||
| Proceeds from exercise of stock options |
24,423 | 23,923 | 18,350 | |||||||||
| Value of equity awards withheld for tax liability |
(8,150 | ) | — | — | ||||||||
| Proceeds from public offering, net of offering costs |
— | — | 253,899 | |||||||||
|
|
|
|
|
|
|
|||||||
| Net cash provided by financing activities |
16,273 | 23,923 | 272,249 | |||||||||
| Net increase (decrease) in cash and cash equivalents during period |
103,373 | (75,995 | ) | 51,720 | ||||||||
| Cash and cash equivalents at beginning of period |
125,765 | 201,760 | 150,040 | |||||||||
|
|
|
|
|
|
|
|||||||
| Cash and cash equivalents at end of period |
$ | 229,138 | $ | 125,765 | $ | 201,760 | ||||||
|
|
|
|
|
|
|
|||||||
| Supplemental disclosures of cash flow information |
||||||||||||
| Cash paid for interest |
$ | 6,325 | $ | — | $ | — | ||||||
| Noncash transactions: |
||||||||||||
| Value of Class A common stock issued in connection with an acquisition |
$ | 1,883,728 | $ | — | $ | — | ||||||
| Capitalized share-based compensation |
$ | 10,319 | $ | 6,585 | $ | 3,817 | ||||||
| Write-off of fully depreciated property and equipment |
$ | 26,242 | $ | 4,749 | $ | 3,697 | ||||||
See accompanying notes to consolidated financial statements.
84
Table of Contents
NOTES TO CONSOLIDATED FINANCIAL STATEMENTS
Note 1. Organization and Description of Business
Zillow Group, Inc. (the “Company,” “Zillow Group,” “we,” “us” and “our”) operates the leading real estate and home-related information marketplaces on mobile and the Web, with a complementary portfolio of brands and products to help people find vital information about homes and connect with local professionals. Zillow Group’s brands focus on all stages of the home lifecycle: renting, buying, selling, financing and home improvement. The Zillow Group portfolio of consumer brands includes real estate and rental marketplaces Zillow, Trulia, StreetEasy and HotPads. In addition, Zillow Group works with tens of thousands of real estate agents, mortgage and rental professionals, helping maximize business opportunities and connect to millions of consumers. We also own and operate a number of brands for real estate, rental and mortgage professionals, including DotLoop, Mortech, Diverse Solutions and Retsly.
Acquisition of Trulia, Inc.
Effective February 17, 2015, pursuant to the Agreement and Plan of Merger dated as of July 28, 2014 (the “Merger Agreement”) by and among Zillow, Inc. (“Zillow”), Zillow Group, and Trulia, Inc. (“Trulia”), each of Zillow and Trulia became wholly owned subsidiaries of Zillow Group. Upon completion of the acquisition, each outstanding share of Class A common stock of Zillow was converted into the right to receive one share of fully paid and nonassessable Class A common stock of Zillow Group, each outstanding share of Class B common stock of Zillow was converted into the right to receive one share of fully paid and nonassessable Class B common stock of Zillow Group, and each outstanding share of Trulia common stock was converted into the right to receive 0.444 of a share of fully paid and nonassessable Class A Common Stock of Zillow Group.
In addition, subject to certain exceptions, each Trulia stock option, restricted stock unit and stock appreciation right outstanding upon the consummation of the acquisition, whether or not vested and exercisable, was assumed by Zillow Group and converted into a corresponding equity award to purchase, acquire shares of, or participate in the appreciation in price of Zillow Group Class A Common Stock. The terms of each such assumed equity award are the same except that the number of shares subject to each equity award and the per share exercise price, if any, were adjusted based on the exchange ratio of 0.444 per a formula set forth in the Merger Agreement. Generally, each Zillow stock option and restricted stock unit outstanding upon the consummation of the acquisition, whether or not vested or exercisable, was assumed by Zillow Group and converted into a corresponding equity award to purchase or acquire shares of Zillow Group Class A common stock. The terms of each such assumed equity award are the same. Any unvested shares of Zillow Class A common stock subject to a repurchase option, risk of forfeiture or other condition as of the consummation of the acquisition were exchanged for shares of Zillow Group Class A common stock that are also unvested and subject to the same repurchase option, risk of forfeiture or other condition. Each Zillow restricted unit outstanding as of the consummation of the acquisition was assumed by Zillow Group and converted into the right to receive Zillow Group Class A common stock, subject to the same terms as the original restricted unit.
The total purchase price of Trulia was approximately $2.0 billion. We have included Trulia’s results of operations prospectively after February 17, 2015, the date of acquisition. Further details on the acquisition of Trulia are presented in Note 7 of these consolidated financial statements.
On February 17, 2015, in connection with the acquisition, Zillow Group undertook a restructuring plan that resulted in a total workforce reduction of nearly 350 employees, primarily to eliminate overlapping positions in the sales and marketing functions related to Trulia’s workforce at its Bellevue, Denver, New York and San Francisco locations. The restructuring plan is a result of the integration of Trulia’s business and operations with and into Zillow Group’s business. Employees directly affected by the restructuring plan have been provided with severance payments, stock vesting acceleration and outplacement assistance. As of December 31, 2015, the restructuring plan is substantially complete. Further details on the restructuring plan are presented in Note 18 of these consolidated financial statements.
85
Table of Contents
Certain Significant Risks and Uncertainties
We operate in a dynamic industry and, accordingly, can be affected by a variety of factors. For example, we believe that changes or developments in any of the following areas could have a significant effect on us in terms of our future financial position, results of operations or cash flows: rates of revenue growth; engagement and usage of our products; scaling and adaptation of existing technology and network infrastructure; competition in our market; our ability to successfully integrate and realize the benefits of our past or future strategic acquisitions or investments, including our February 2015 acquisition of Trulia; management of our growth; our ability to attract and retain qualified employees and key personnel; protection of our brand and intellectual property; changes in government regulation affecting our business; the outcome of claims asserted against us in litigation; intellectual property infringement and other claims; protection of customers’ information and privacy concerns; and security measures related to our mobile applications and websites, among other things.
Note 2. Summary of Significant Accounting Policies
Basis of Presentation
The accompanying consolidated financial statements include Zillow Group, Inc. and its wholly-owned subsidiaries. All significant intercompany balances and transactions have been eliminated in consolidation. These consolidated financial statements have been prepared in conformity with accounting principles generally accepted in the United States (“GAAP”).
For financial reporting and accounting purposes, Zillow was the acquirer of Trulia. The results presented in the consolidated financial statements and the notes to consolidated financial statements reflect those of Zillow prior to the completion of the acquisition of Trulia on February 17, 2015, and Trulia’s results of operations have been included prospectively after February 17, 2015.
On August 14, 2015, Zillow Group completed a stock dividend in the form of two shares of Class C capital stock for each share of Class A common stock and Class B common stock outstanding as of July 31, 2015. The stock dividend had the effect of a 3-for-1 stock split. All references made to share or per share amounts in the accompanying consolidated financial statements and applicable disclosures have been retroactively adjusted to reflect the stock split. See Note 12, Note 14 and Note 15 for additional information about the stock split effected in the form of a stock dividend.
Use of Estimates
The preparation of financial statements in conformity with GAAP requires management to make certain estimates, judgments and assumptions that affect the reported amounts of assets and liabilities and the related disclosures at the date of the financial statements, as well as the reported amounts of revenue and expenses during the periods presented. On an ongoing basis, we evaluate our estimates, including those related to revenue recognition, website development costs, recoverability of long-lived assets and intangible assets with definite lives, share-based compensation, income taxes, business combinations, goodwill, and restructuring, among others. To the extent there are material differences between these estimates, judgments, or assumptions and actual results, our financial statements will be affected.
Reclassifications
Certain immaterial reclassifications have been made in the consolidated statements of operations and statements of cash flows to conform data for prior periods to the current format.
Concentrations of Credit Risk
Financial instruments, which potentially subject us to concentrations of credit risk, consist primarily of cash and cash equivalents, investments and accounts receivable. We place cash and cash equivalents and investments with major financial institutions, which management assesses to be of high credit quality, in order to limit exposure of our investments.
86
Table of Contents
Credit risk with respect to accounts receivable is dispersed due to the large number of customers. Further, our credit risk on accounts receivable is mitigated by the relatively short payment terms that we offer. Collateral is not required for accounts receivable. We maintain an allowance for doubtful accounts such that receivables are stated at net realizable value.
Cash and Cash Equivalents
Cash includes demand deposits with banks or financial institutions. Cash equivalents include short-term, highly liquid investments that are both readily convertible to known amounts of cash, and so near their maturity that they present minimal risk of changes in value because of changes in interest rates. Our cash equivalents include only investments with original maturities of three months or less. We regularly maintain cash in excess of federally insured limits at financial institutions.
Restricted Cash
Restricted cash consists of certificates of deposit held as collateral in our name at a financial institution related to certain of our operating leases.
Investments
Our investments consist of fixed income securities, which include U.S. and foreign government agency securities, corporate notes and bonds, municipal securities, commercial paper and certificates of deposit, and are classified as available-for-sale securities beginning on January 1, 2015. As the investments are available to support current operations, our available-for-sale securities are classified as short-term investments. Available-for-sale securities are carried at fair value with unrealized gains and losses reported as a component of accumulated other comprehensive loss in shareholders’ equity, while realized gains and losses and other-than-temporary impairments are reported as a component of net loss based on specific identification. An impairment charge is recorded in the consolidated statements of operations for declines in fair value below the cost of an individual investment that are deemed to be other than temporary. We assess whether a decline in value is temporary based on the length of time that the fair market value has been below cost, the severity of the decline and the intent and ability to hold or sell the investment. We did not identify any investments as other-than-temporarily impaired as of December 31, 2015 or December 31, 2014.
Prior to January 1, 2015 our investments were classified as held-to-maturity and were recorded at amortized cost (see Note 4).
Accounts Receivable and Allowance for Doubtful Accounts
Accounts receivable are generally due within 30 days and are recorded net of the allowance for doubtful accounts. We consider accounts outstanding longer than the contractual terms past due. We review accounts receivable on a regular basis and estimate an amount of losses for uncollectible accounts based on our historical collections experience, age of the receivable, knowledge of the customer and the condition of the general economy and industry as a whole. We record changes in our estimate to the allowance for doubtful accounts through bad debt expense and relieve the allowance when accounts are ultimately determined to be uncollectible. Bad debt expense is included in general and administrative expenses.
Property and Equipment
Property and equipment is recorded at cost and depreciated using the straight-line method over the estimated useful lives of the related assets. The useful lives are as follows:
| Computer equipment |
3 years | |
| Purchased software |
3 years | |
| Office equipment, furniture and fixtures |
5 to 7 years | |
| Leasehold improvements |
Shorter of expected useful life or lease term |
87
Table of Contents
Maintenance and repair costs are charged to expense as incurred. Major improvements, which extend the useful life of the related asset, are capitalized. Upon disposal of a fixed asset, we record a gain or loss based on the differences between the proceeds received and the net book value of the disposed asset.
Website and Software Development Costs
The costs incurred in the preliminary stages of development are expensed as incurred. Once an application has reached the development stage, internal and external costs, if direct and incremental and deemed by management to be significant, are capitalized in property and equipment and amortized on a straight-line basis over their estimated useful lives. Maintenance and enhancement costs, including those costs in the post-implementation stages, are typically expensed as incurred, unless such costs relate to substantial upgrades and enhancements to the website or software that result in added functionality, in which case the costs are capitalized and amortized on a straight-line basis over the estimated useful lives. Amortization expense related to capitalized website and software development costs is included in technology and development expense.
Capitalized development activities placed in service are amortized over the expected useful lives of those releases, currently estimated at one year. The estimated useful lives of website and software development activities are reviewed frequently and adjusted as appropriate to reflect upcoming development activities that may include significant upgrades and/or enhancements to the existing functionality.
Goodwill
Goodwill represents the excess of the cost of an acquired business over the fair value of the assets acquired at the date of acquisition. We assess the impairment of goodwill on an annual basis, in our fourth quarter, or whenever events or changes in circumstances indicate that goodwill may be impaired.
We assess goodwill for possible impairment by first performing a qualitative assessment to determine whether it is more likely than not that the fair value of our reporting unit is less than its carrying amount. If we determine that it is not more likely than not that the fair value of our reporting unit is less than its carrying amount, then the first and second steps of the goodwill impairment test are unnecessary. If we determine that it is more likely than not that the fair value of our reporting unit is less than its carrying amount, we perform the two-step goodwill impairment test. The first step of the goodwill impairment test identifies if there is potential goodwill impairment. If step one indicates that an impairment may exist, a second step is performed to measure the amount of the goodwill impairment, if any. Goodwill impairment exists when the estimated fair value of goodwill is less than its carrying value. If impairment exists, the carrying value of the goodwill is reduced to fair value through an impairment charge recorded in our statements of operations.
Intangible Assets
We purchase and license data content from multiple data providers. This data content consists of U.S. county data about home details (e.g., the number of bedrooms, bathrooms, square footage) and other information relating to the purchase price of homes, both current and historical, as well as imagery, mapping and parcel data that is displayed on our mobile applications and websites. Our home details data not only provides information about a home and its related transactions which is displayed on our mobile applications and websites, but is also used in our proprietary valuation algorithms to produce Zestimates, Rent Zestimates and Zillow Home Value Indexes. License agreement terms vary by vendor. In some instances, we retain perpetual rights to this information after the contract ends; in other instances, the information and data are licensed only during the fixed term of the agreement. Additionally, certain data license agreements provide for uneven payment amounts throughout the life of the contract term.
We capitalize payments made to third parties for data licenses that we expect to provide future economic benefit through the recovery of the costs of these arrangements via the generation of our revenue and margins. For data license contracts that include uneven payment amounts, we capitalize the payments as they are made as an intangible asset and amortize the total contract value over the estimated useful life. For contracts in which we
88
Table of Contents
have perpetual rights to the data, the total contract value is amortized on a straight-line basis over the life of the contract plus two years, which is equivalent to the estimated useful life of the asset. For contracts in which we do not have access to the data beyond the contractual term, the total contract value is amortized on a straight line basis over the term of the contract. We evaluate data content contracts for potential capitalization at the inception of the arrangement as well as each time periodic payments to third parties are made.
The amortization period for the capitalized purchased content is based on our best estimate of the useful life of the asset, which ranges from two to nine years. The determination of the useful life includes consideration of a variety of factors including, but not limited to, our assessment of the expected use of the asset and contractual provisions that may limit the useful life, as well as an assessment of when the data is expected to become obsolete based on our estimates of the diminishing value of the data over time. We evaluate the useful life of the capitalized purchased data content each reporting period to determine whether events and circumstances warrant a revision to the remaining useful life. If we determine the estimate of the asset’s useful life requires modification, the carrying amount of the asset is amortized prospectively over the revised useful life. The capitalized purchased data content is amortized on a straight-line basis as the pattern of delivery of the economic benefits of the data cannot reliably be determined because we do not have the ability to reliably predict future traffic to our websites and mobile applications.
Under certain other data agreements, the underlying data is obtained on a subscription basis with consistent monthly or quarterly recurring payment terms over the contractual period. Upon the expiration of such arrangements, we no longer have the right to access the related data, and therefore, the costs incurred under such contracts are not capitalized and are expensed as payments are made. We would immediately lose rights to data under these arrangements if we were to cancel the subscription and/or cease making payments under the subscription arrangements.
We also have intangible assets for developed technology, customer relationships, trade names and trademarks, advertising relationships and MLS home data feeds which we recorded in connection with acquisitions. Purchased intangible assets with a determinable economic life are carried at cost, less accumulated amortization. These intangible assets are amortized over the estimated useful life of the asset on a straight-line basis.
Recoverability of Intangible Assets with Definite Lives and Other Long-Lived Assets
We evaluate intangible assets and other long-lived assets for impairment whenever events or circumstances indicate that they may not be recoverable. Recoverability is measured by comparing the carrying amount of an asset group to future undiscounted net cash flows expected to be generated. We group assets for purposes of such review at the lowest level for which identifiable cash flows of the asset group are largely independent of the cash flows of the other groups of assets and liabilities. If this comparison indicates impairment, the amount of impairment to be recognized is calculated as the difference between the carrying value and the fair value of the asset group.
Deferred Revenue
Deferred revenue consists of prepaid advertising fees received or billed in advance of the delivery or completion of the services, prepaid but unrecognized subscription revenue, and for amounts received in instances when revenue recognition criteria have not been met. Deferred revenue is recognized when the services are provided and all revenue recognition criteria have been met.
Deferred Rent
For our operating leases, we recognize rent expense on a straight-line basis over the terms of the leases and, accordingly, we record the difference between cash rent payments and the recognition of rent expense as a deferred rent liability. For office space under an operating lease that is subleased to a third party for which we intend to reoccupy the space at a future date, rent expense is recognized net of sublease income. Landlord-funded leasehold improvements are also recorded as deferred rent liabilities and are amortized as a reduction of rent expense over the non-cancelable term of the related operating lease.
89
Table of Contents
Restructuring
The main components of our restructuring plan related to the February 2015 acquisition of Trulia relate to workforce reduction and contract termination costs. Workforce reduction charges are accrued when it is probable that the employees are entitled to the severance payments and the amounts can be reasonably estimated. One-time involuntary termination benefits are accrued when the plan of termination has been communicated to the employees and certain other criteria are met. Share-based compensation expense related to acceleration of share-based awards assumed in connection with the acquisition of Trulia is recognized over the remaining requisite service period. Contract termination costs are recognized as a liability when a contract is terminated in accordance with its terms or at the cease-use date. The cumulative effect of a change resulting from a revision to either the timing or the amount of estimated cash flows is recognized as an adjustment to the liability in the period of the change. If the amounts and timing of cash flows from restructuring activities are significantly different from what we have estimated, the actual amount of restructuring and other related charges could be materially different than those we have recorded. Further details on the restructuring are presented in Note 18 of these consolidated financial statements.
Business Combinations
We recognize identifiable assets acquired and liabilities assumed at their acquisition date fair values. Goodwill as of the acquisition date is measured as the excess of consideration transferred over the net of the acquisition date fair values of the assets acquired and the liabilities assumed. While we use our best estimates and assumptions for the purchase price allocation process to value assets acquired and liabilities assumed at the acquisition date, our estimates are inherently uncertain and subject to refinement. As a result, during the measurement period, which may be up to one year from the acquisition date, we record adjustments to the assets acquired and liabilities assumed, with the corresponding offset to goodwill to the extent that we identify adjustments to the preliminary purchase price allocation. Upon the conclusion of the measurement period or final determination of the values of assets acquired or liabilities assumed, whichever comes first, any subsequent adjustments are recorded to our consolidated statements of operations. We recognize adjustments to provisional amounts that are identified during the measurement period in the reporting period in which the adjustment amounts are determined. Further details on the February 2015 acquisition of Trulia and the August 2015 acquisition of DotLoop, Inc. are presented in Note 7 of these consolidated financial statements.
Revenue Recognition
In general, we recognize revenue when (i) persuasive evidence of an arrangement exists, (ii) delivery has occurred or services have been rendered to the customer, (iii) the fee is fixed or determinable, and (iv) collectability is reasonably assured. We consider a signed agreement, a binding insertion order or other similar documentation reflecting the terms and conditions under which products or services will be provided to be persuasive evidence of an arrangement. Collectability is assessed based on a number of factors, including payment history and the creditworthiness of a customer. If it is determined that collection is not reasonably assured, revenue is not recognized until collection becomes reasonably assured, which is generally upon receipt of cash.
We generate revenue from the sale of advertising services and our suite of tools to businesses and professionals primarily associated with the real estate and mortgage industries. These professionals include local real estate professionals, mortgage professionals and brand advertisers. Our two revenue categories are marketplace revenue and display revenue. Incremental direct costs incurred related to the acquisition or origination of a customer contract in a transaction that results in the deferral of revenue are expensed as incurred.
Marketplace Revenue. Marketplace revenue consists of real estate, mortgages, and Market Leader revenue. Market Leader revenue is included in our results of operations from February 17, 2015 through the date of divestiture of September 30, 2015 (see Note 8).
90
Table of Contents
Real estate revenue primarily includes revenue from advertising and a suite of tools sold to real estate professionals, as well as revenue generated by Zillow Group Rentals, which includes our rentals marketplace and suite of tools for rental professionals.
In August 2015, Zillow Group completed the integration of certain Zillow and Trulia agent advertising products, effectively eliminating the Trulia Local Ads and Trulia Mobile Ads products. As a result of the integration, Agent Advertisers can manage their advertising across both Zillow and Trulia mobile and Web through the combined Premier Agent platform.
Our Zillow Premier Agent program, which is included in real estate revenue, offers a suite of marketing and business technology solutions to help real estate agents grow their businesses and personal brands. The Premier Agent program allows agents to select products and services that they can tailor to meet their business and advertising needs. The program has three tiers of participation including Premier Platinum, our flagship product, as well as Premier Gold and Premier Silver, to meet different marketing and business needs of a broad range of agents. All tiers of Premier Agents receive access to a dashboard portal on our website that provides individualized program performance analytics, as well as our personalized website service, and our free customer relationship management, or CRM, tool that captures detailed information about each contact made with a Premier Agent through our mobile and web platforms. Our Premier Gold product also includes featured listings whereby the agent’s listings will appear at the top of search results on our mobile and web platforms. Our Premier Platinum product includes the dashboard portal on our website, our personalized website service, our CRM tool, featured listings, and inclusion on our buyer’s agent list, whereby the agent appears as the agent to contact for listings in the purchased zip code. We charge for our Platinum Premier Agent product based on the number of impressions delivered on our buyer’s agent list in zip codes purchased and a contracted maximum cost per impression. Our Platinum Premier Agent product includes multiple deliverables which are accounted for as a single unit of accounting, as the delivery or performance of the undelivered elements is based on traffic to our mobile applications and websites. We recognize revenue related to our impression-based Platinum Premier Agent product based on the lesser of (i) the actual number of impressions delivered on our buyer’s agent list during the period multiplied by the contracted maximum cost per impression, or (ii) the contractual maximum spend on a straight-line basis during the contractual period over which the services are delivered, typically over a period of six months or twelve months and then month-to-month thereafter. We charge a fixed subscription fee for Zillow’s Premier Gold and Premier Silver subscription products. Subscription advertising revenue for our Premier Gold and Premier Silver subscription products is recognized on a straight-line basis during the contractual period over which the services are delivered, typically over a period of six months and then month-to-month thereafter.
Our Trulia real estate products included in real estate revenue are primarily sold on a fixed fee subscription basis, and include Trulia Local Ads, Trulia Mobile Ads, Trulia Pro with featured listings and Trulia Seller Ads. Prior to the August 2015 integration of certain of Zillow’s and Trulia’s advertising products, Trulia Local Ads and Trulia Mobile Ads enabled real estate professionals to promote themselves on Trulia’s search results pages and property details pages for a local market area. Real estate professionals purchased subscriptions to these products based upon their specified market share for a city or zip code, at a fixed monthly price, for periods ranging from one month to one year, with pricing depending on demand, location, and the percentage of market share purchased. Following the August 2015 agent advertising product integration, Trulia Local Ads and Trulia Mobile Ads products are no longer sold by Zillow Group. Trulia’s featured listings product allows real estate professionals to receive prominent placement of their listings in Trulia’s search results. Real estate professionals sign up for new subscriptions to this product at a fixed monthly price for periods that generally range from six months to 12 months. Trulia Seller Ads enable real estate professionals to generate leads from consumers interested in selling their homes. Subscription advertising revenue for Trulia’s real estate products included in real estate revenue is recognized on a straight-line basis during the contractual period over which the services are delivered.
Rentals revenue, which is included in real estate revenue, primarily includes advertising sold to property managers and other rental professionals on a cost per lead and cost per lease generated basis. We recognize revenue as leads are delivered to rental professionals or as qualified leases are confirmed.
91
Table of Contents
Mortgages revenue primarily includes advertising sold to mortgage lenders and other mortgage professionals on a cost per lead basis, as well as revenue generated by Mortech, which provides subscription-based mortgage software solutions, including a product and pricing engine and lead management platform, for which we recognize revenue on a straight-line basis during the contractual period over which the services are delivered. For our cost per lead mortgage advertising products, participating qualified mortgage professionals make a prepayment to gain access to consumers interested in connecting with mortgage professionals. Consumers who request rates for mortgage loans are presented with personalized quotes from participating mortgage professionals. We only charge mortgage professionals a fee when users contact mortgage professionals for more information regarding a mortgage loan quote. Mortgage professionals who exhaust their initial prepayment can then prepay additional funds to continue to participate in the marketplace. We recognize revenue when a user contacts a mortgage professional through Zillow Group’s mortgages platform.
Market Leader revenue primarily includes revenue from the sale of a comprehensive premium software-as-a-service based marketing product typically sold to real estate professionals as a bundle of products under a fixed fee subscription. Market Leader revenue is included in our results of operations from February 17, 2015 through the date of divestiture of September 30, 2015 (see Note 8).
Display Revenue. Display revenue primarily consists of graphical mobile and web advertising sold on a cost per thousand impressions (“CPM”) or cost-per-click (“CPC”) basis to advertisers promoting their brands on our mobile applications and websites and our partner websites, primarily in the real estate industry, including real estate brokerages, home builders, mortgage professionals and home services providers. Our advertising customers also include telecommunications, automotive, insurance and consumer products companies. Impressions are the number of times an advertisement is loaded on a web page and clicks are the number of times users click on an advertisement. Pricing is primarily based on advertisement size and position on our mobile applications and websites, and fees are generally billed monthly. We recognize display revenue as clicks occur or as impressions are delivered to users interacting with our mobile applications or websites.
There were no customers that generated 10% or more of our total revenue in the years ended December 31, 2015, 2014 or 2013.
Cost of Revenue
Our cost of revenue consists of expenses related to operating our mobile applications and websites, including associated headcount expenses, such as salaries and benefits and share-based compensation expense and bonuses, as well as credit card fees, ad serving costs paid to third parties, revenue-sharing costs related to our commercial business relationships, costs to generate leads for customers, multiple listing services fees and costs associated with the operation of our data center and customer websites.
Technology and Development
Research and development costs are expensed as incurred and are recorded in technology and development expenses. These costs consist primarily of technology and development headcount related expenses including salaries, bonuses, benefits and share-based compensation expense primarily associated with developing new technologies. For the years ended December 31, 2015, 2014 and 2013, expenses attributable to research and development for our business totaled $163.8 million, $72.9 million and $41.7 million, respectively. Technology and development expenses also include amortization of intangible assets, including acquired intangible assets, purchased content and capitalized website development costs, and other data content expense.
Share-Based Compensation
We measure compensation expense for all share-based awards at fair value on the date of grant and recognize compensation expense over the service period on a straight-line basis for awards expected to vest.
92
Table of Contents
We use the Black-Scholes-Merton option-pricing model to determine the fair value for option awards. In valuing our option awards, we make assumptions about risk-free interest rates, dividend yields, volatility, and weighted-average expected lives, including estimated forfeiture rates. Risk-free interest rates are derived from U.S. Treasury securities as of the option award grant date. Expected dividend yield is based on our historical cash dividend payments, which have been zero to date. The expected volatility for our Class A common stock and Class C capital stock is estimated using a combination of our historical volatility and the published historical volatilities of industry peers in the online publishing market representing the verticals in which we operate. Through June 30, 2015, we estimated the weighted-average expected life of the option awards as the average of the option vesting schedule and the term of the award, since we did not have sufficient historical exercise data to provide a reasonable basis upon which to estimate expected term due to the limited period of time share-based awards had been exercisable. Beginning July 1, 2015, we estimate the weighted-average expected life of the option awards based on our historical exercise data. Forfeiture rates are estimated using historical actual forfeiture trends as well as our judgment of future forfeitures. These rates are evaluated at least quarterly and any change in compensation expense is recognized in the period of the change. The estimation of option awards that will ultimately vest requires judgment, and to the extent actual results or updated estimates differ from our current estimates, such amounts will be recorded as a cumulative adjustment in the period the estimates are revised. We consider many factors when estimating expected forfeitures, including employee class and historical experience. Actual results, and future changes in estimates, may differ substantially from management’s current estimates.
For issuances of restricted stock awards, restricted stock units and restricted units, we determine the fair value of the award based on the market value of our Class A common stock or Class C capital stock at the date of grant.
Advertising Costs
Advertising costs are expensed as incurred. For the years ended December 31, 2015, 2014 and 2013, expenses attributable to advertising totaled $103.4 million, $73.1 million and $38.7 million, respectively. Advertising costs are recorded in sales and marketing expenses.
Income Taxes
We use the asset and liability approach for accounting and reporting income taxes, which requires the recognition of deferred tax assets and liabilities for the expected future tax consequences of temporary differences between the financial statement and tax bases of assets and liabilities at the applicable enacted tax rates. A valuation allowance against deferred tax assets would be established if, based on the weight of available evidence, it is more likely than not (a likelihood of more than 50%) that some or all of the deferred tax assets are not expected to be realized.
We establish reserves for tax-related uncertainties based on estimates of whether, and the extent to which, additional taxes will be due. We adjust these reserves in light of changing facts and circumstances, such as the closing of a tax audit, new tax legislation or the change of an estimate. To the extent that the final tax outcome of these matters is different than the amounts recorded, such differences will affect the provision for income taxes in the period in which such determination is made. Interest and penalties related to unrecognized tax benefits are recorded as income tax expense.
Recently Issued Accounting Standards
In November 2015, the Financial Accounting Standards Board (“FASB”) issued guidance on the balance sheet classification of deferred taxes. This standard requires that deferred tax liabilities and assets be classified as noncurrent in a classified statement of financial position. This guidance is effective for interim and annual reporting periods beginning after December 15, 2016, and early adoption is permitted. We adopted this guidance
93
Table of Contents
for the year ended December 31, 2015 on a retrospective basis. The adoption of this guidance has not had a material impact on our financial position, results of operations or cash flows, and did not have any effect on prior periods due to the full valuation allowance against our net deferred tax assets.
In September 2015, the FASB issued guidance on simplifying the accounting for measurement-period adjustments in business combinations. This standard requires that an acquirer recognize adjustments to provisional amounts that are identified during the measurement period in the reporting period in which the adjustment amounts are determined. This guidance is effective for interim and annual reporting periods beginning after December 15, 2015, and early adoption is permitted. We adopted this guidance for the year ended December 31, 2015. The adoption of this guidance has not had a material impact on our financial position, results of operations or cash flows.
In April 2015, the FASB issued guidance related to a customer’s accounting for fees paid in a cloud computing arrangement. This standard provides guidance to customers about whether a cloud computing arrangement includes a software license. If a cloud computing arrangement includes a software license, then the customer should account for the software license element of the arrangement consistent with the acquisition of other software licenses. If a cloud computing arrangement does not include a software license, the customer should account for the arrangement as a service contract. This guidance is effective for interim and annual reporting periods beginning after December 15, 2015, and early adoption is permitted. We adopted this guidance on January 1, 2016. The adoption of this guidance has not had a material impact on our financial position, results of operations or cash flows.
In August 2014, the FASB issued guidance on the disclosure of uncertainties about an entity’s ability to continue as a going concern. This standard provides guidance about management’s responsibility to evaluate whether there is substantial doubt about an entity’s ability to continue as a going concern and to provide related footnote disclosures. The guidance is effective for annual reporting periods ending after December 15, 2016, and early adoption is permitted. We expect to adopt this guidance on January 1, 2017. We do not expect the adoption of this guidance to have any impact on our financial position, results of operations or cash flows.
In May 2014, the FASB issued guidance on revenue recognition. This guidance provides that an entity should recognize revenue to depict the transfer of promised goods or services to customers in an amount that reflects the consideration to which the entity expects to be entitled in exchange for those goods or services. This guidance also requires more detailed disclosures to enable users of financial statements to understand the nature, amount, timing, and uncertainty of revenue and cash flows arising from contracts with customers. The original effective date of this guidance was for interim and annual reporting periods beginning after December 15, 2016, early adoption is not permitted, and the guidance must be applied retrospectively or modified retrospectively. In July 2015, the FASB approved an optional one-year deferral of the effective date. As a result, we expect to adopt this guidance on January 1, 2018. We have not yet determined our approach to adoption or the impact the adoption of this guidance will have on our financial position, results of operations or cash flows, if any.
In April 2014, the FASB issued guidance on reporting discontinued operations and disclosures of disposals of components of an entity. This standard raises the threshold for a disposal to qualify as a discontinued operation and requires new disclosures of both discontinued operations and certain other disposals that do not meet the definition of a discontinued operation. The guidance is effective for annual reporting periods ending after December 15, 2014. Early adoption is permitted but only for disposals that have not been reported in financial statements previously issued. We adopted this guidance on January 1, 2015. The adoption of this guidance has not had a material impact on our financial position, results of operations or cash flows.
94
Table of Contents
Note 3. Fair Value Measurements
Accounting standards define fair value as the price that would be received to sell an asset or paid to transfer a liability (an exit price) in the principal or most advantageous market in an orderly transaction between market participants on the measurement date. The standards also establish a fair value hierarchy, which requires an entity to maximize the use of observable inputs and minimize the use of unobservable inputs when measuring fair value. There are three levels of inputs that may be used to measure fair value:
| • | Level 1—Quoted prices in active markets for identical assets or liabilities. |
| • | Level 2—Assets and liabilities valued based on observable market data for similar instruments, such as quoted prices for similar assets or liabilities. |
| • | Level 3—Unobservable inputs that are supported by little or no market activity; instruments valued based on the best available data, some of which is internally developed, and considers risk premiums that a market participant would require. |
We applied the following methods and assumptions in estimating our fair value measurements:
Cash equivalents—Cash equivalents are comprised of highly liquid investments, including money market funds, foreign government securities and certificates of deposit, with original maturities of less than three months. The fair value measurement of these assets is based on quoted market prices in active markets and these assets are recorded at fair value.
Investments—Our investments consist of fixed income securities, which include U.S. and foreign government agency securities, corporate notes and bonds, municipal securities, commercial paper and certificates of deposit. The fair value measurement of these assets is based on observable market-based inputs or inputs that are derived principally from or corroborated by observable market data by correlation or other means.
Restricted cash—Our restricted cash consists primarily of certificates of deposit held as collateral in our name at a financial institution related to certain of our operating leases. The fair value measurement of these assets is based on observable market-based inputs.
The following table presents the balances of assets measured at fair value on a recurring basis, by level within the fair value hierarchy, as of December 31, 2015 (in thousands):
| December 31, 2015 | ||||||||||||
| Total | Level 1 | Level 2 | ||||||||||
| Cash equivalents: |
||||||||||||
| Money market funds |
$ | 195,870 | $ | 195,870 | $ | — | ||||||
| Certificates of deposit |
1,622 | — | 1,622 | |||||||||
| Short-term investments: |
||||||||||||
| U.S. government agency securities |
194,636 | 194,636 | — | |||||||||
| Corporate notes and bonds |
41,314 | — | 41,314 | |||||||||
| Municipal securities |
39,853 | — | 39,853 | |||||||||
| Certificates of deposit |
11,837 | — | 11,837 | |||||||||
| Foreign government securities |
3,511 | — | 3,511 | |||||||||
| Restricted cash |
3,015 | — | 3,015 | |||||||||
|
|
|
|
|
|
|
|||||||
| Total |
$ | 491,658 | $ | 390,506 | $ | 101,152 | ||||||
|
|
|
|
|
|
|
|||||||
95
Table of Contents
The following table presents the fair value, by level within the fair value hierarchy, of our cash equivalents and investments as of December 31, 2014 (in thousands):
| December 31, 2014 | ||||||||||||
| Total | Level 1 | Level 2 | ||||||||||
| Cash equivalents: |
||||||||||||
| Money market funds |
$ | 98,645 | $ | 98,645 | $ | — | ||||||
| Foreign government securities |
9,035 | — | 9,035 | |||||||||
| Certificates of deposit |
2,975 | — | 2,975 | |||||||||
| Short-term investments: |
||||||||||||
| U.S. government agency securities |
118,342 | 118,342 | — | |||||||||
| Corporate notes and bonds |
78,746 | — | 78,746 | |||||||||
| Municipal securities |
26,256 | — | 26,256 | |||||||||
| Foreign government securities |
8,570 | — | 8,570 | |||||||||
| Commercial paper |
7,987 | — | 7,987 | |||||||||
| Certificates of deposit |
6,928 | — | 6,928 | |||||||||
| Long-term investments: |
||||||||||||
| U.S. government agency securities |
63,515 | 63,515 | — | |||||||||
| Municipal securities |
12,917 | — | 12,917 | |||||||||
| Corporate notes and bonds |
6,694 | — | 6,694 | |||||||||
| Certificates of deposit |
200 | — | 200 | |||||||||
|
|
|
|
|
|
|
|||||||
| Total |
$ | 440,810 | $ | 280,502 | $ | 160,308 | ||||||
|
|
|
|
|
|
|
|||||||
See Note 12 for the carrying amount and estimated fair value of the Company’s convertible senior notes.
We did not have any Level 3 assets as of December 31, 2015 or 2014. There were no liabilities measured at fair value as of December 31, 2015 or 2014.
Note 4. Cash, Cash Equivalents, Investments and Restricted Cash
On January 1, 2015 we transferred our cash equivalent and investment portfolio of approximately $440.8 million from held-to-maturity to available-for-sale, which resulted in the recognition of an insignificant loss of $0.1 million. The transfer of the investment portfolio to available-for-sale was made to provide increased flexibility in the use of our investments to support current operations. As the investments are available to support current operations, our available-for-sale securities are classified as short-term investments. Available-for-sale securities are carried at fair value with unrealized gains and losses reported as a component of accumulated other comprehensive loss in shareholders’ equity, while realized gains and losses and other-than-temporary impairments are reported as a component of net loss based on specific identification.
96
Table of Contents
The following table presents the amortized cost, gross unrealized gains and losses, and estimated fair market value of our cash and cash equivalents, available-for-sale investments and restricted cash as of December 31, 2015 (in thousands):
| December 31, 2015 | ||||||||||||||||
| Amortized Cost |
Gross Unrealized Gains |
Gross Unrealized Losses |
Estimated Fair Market Value |
|||||||||||||
| Cash |
$ | 31,646 | $ | — | $ | — | $ | 31,646 | ||||||||
| Cash equivalents: |
||||||||||||||||
| Money market funds |
195,870 | — | — | 195,870 | ||||||||||||
| Certificates of deposit |
1,622 | — | — | 1,622 | ||||||||||||
| Short-term investments: |
||||||||||||||||
| U.S government agency securities |
195,092 | 1 | (457 | ) | 194,636 | |||||||||||
| Corporate notes and bonds |
41,390 | 1 | (77 | ) | 41,314 | |||||||||||
| Municipal securities |
39,878 | 11 | (36 | ) | 39,853 | |||||||||||
| Certificates of deposit |
11,839 | 1 | (3 | ) | 11,837 | |||||||||||
| Foreign government securities |
3,516 | — | (5 | ) | 3,511 | |||||||||||
| Restricted cash |
3,015 | — | — | 3,015 | ||||||||||||
|
|
|
|
|
|
|
|
|
|||||||||
| Total |
$ | 523,868 | $ | 14 | $ | (578 | ) | $ | 523,304 | |||||||
|
|
|
|
|
|
|
|
|
|||||||||
As of December 31, 2014, the amortized cost of cash equivalents and held-to-maturity investments approximated their fair value.
The following table presents available-for-sale investments by contractual maturity date as of December 31, 2015 (in thousands):
| Amortized Cost |
Estimated Fair Market Value |
|||||||
| Due in one year or less |
$ | 140,656 | $ | 140,551 | ||||
| Due after one year through two years |
151,059 | 150,600 | ||||||
|
|
|
|
|
|||||
| Total |
$ | 291,715 | $ | 291,151 | ||||
|
|
|
|
|
|||||
Note 5. Accounts Receivable, Net
The following table presents the detail of accounts receivable as of the dates presented (in thousands):
| December 31, | ||||||||
| 2015 | 2014 | |||||||
| Accounts receivable |
$ | 30,740 | $ | 17,373 | ||||
| Unbilled accounts receivable |
2,427 | 4,122 | ||||||
| Less: allowance for doubtful accounts |
(3,378 | ) | (2,811 | ) | ||||
|
|
|
|
|
|||||
| Accounts receivable, net |
$ | 29,789 | $ | 18,684 | ||||
|
|
|
|
|
|||||
The following table presents the changes in the allowance for doubtful accounts for the periods presented (in thousands):
| Year Ended December 31, | ||||||||||||
| 2015 | 2014 | 2013 | ||||||||||
| Allowance for doubtful accounts: |
||||||||||||
| Balance, beginning of period |
$ | 2,811 | $ | 1,850 | $ | 965 | ||||||
| Additions charged to expense |
3,235 | 2,529 | 1,907 | |||||||||
| Less: write-offs, net of recoveries and other adjustments |
(2,668 | ) | (1,568 | ) | (1,022 | ) | ||||||
|
|
|
|
|
|
|
|||||||
| Balance, end of period |
$ | 3,378 | $ | 2,811 | $ | 1,850 | ||||||
|
|
|
|
|
|
|
|||||||
97
Table of Contents
Note 6. Property and Equipment, Net
The following table presents the detail of property and equipment as of the dates presented (in thousands):
| December 31, | ||||||||
| 2015 | 2014 | |||||||
| Website development costs |
$ | 74,750 | $ | 65,224 | ||||
| Computer equipment |
20,965 | 13,243 | ||||||
| Leasehold improvements |
32,918 | 10,617 | ||||||
| Software |
6,961 | 3,431 | ||||||
| Construction-in-progress |
15,630 | 9,307 | ||||||
| Office equipment, furniture and fixtures |
13,495 | 6,482 | ||||||
|
|
|
|
|
|||||
| Property and equipment |
164,719 | 108,304 | ||||||
| Less: accumulated amortization and depreciation |
(75,080 | ) | (66,704 | ) | ||||
|
|
|
|
|
|||||
| Property and equipment, net |
$ | 89,639 | $ | 41,600 | ||||
|
|
|
|
|
|||||
We recorded depreciation expense related to property and equipment (other than website development costs) of $12.2 million, $6.1 million and $3.5 million, respectively, during the years ended December 31, 2015, 2014 and 2013.
We capitalized $46.1 million, $22.2 million and $17.3 million, respectively, in website and software development costs during the years ended December 31, 2015, 2014 and 2013. Amortization expense for website and software development costs included in technology and development expenses was $23.9 million, $18.3 million and $12.2 million, respectively, for the years ended December 31, 2015, 2014 and 2013.
Construction-in-progress primarily consists of website development costs that are capitalizable, but for which the associated applications had not been placed in service.
Note 7. Acquisitions
During the year ended December 31, 2015, we acquired Trulia, Inc. (“Trulia”) and DotLoop, Inc. (“DotLoop”). Acquisition-related costs incurred, which primarily included investment banker fees, legal, accounting, tax, regulatory filing and printing fees, were expensed as incurred. Total acquisition-related costs of $16.6 million for the year ended December 31, 2015 are included as a separate line item in our consolidated statement of operations, and primarily relate to the February 2015 acquisition of Trulia.
Acquisition of Trulia
Effective February 17, 2015, pursuant to the Merger Agreement dated as of July 28, 2014 by and among Zillow, Zillow Group and Trulia, following the consummation of the transactions contemplated by the Merger Agreement, each of Zillow and Trulia became wholly owned subsidiaries of Zillow Group. Prior to the closing, Zillow Group formed two wholly owned subsidiaries, Zebra Merger Sub, Inc. and Tiger 1 Merger Sub, Inc. Pursuant to the Merger Agreement, Zebra Merger Sub, Inc. merged with and into Zillow (the “Zillow Merger”), Zebra Merger Sub, Inc. ceased to exist, and Zillow is the surviving corporation, and Tiger 1 Merger Sub, Inc. merged with and into Trulia (the “Trulia Merger”), Tiger 1 Merger Sub, Inc. ceased to exist, and Trulia is the surviving corporation. The acquisition of Trulia aligns with our growth strategies, including focusing on consumers and deepening, strengthening, and expanding our marketplaces. With the addition of Trulia, we expanded our audience and added another consumer brand that offers buyers, sellers, homeowners and renters access to information about homes and real estate for free, and provides advertising and software solutions that help real estate professionals grow their business.
98
Table of Contents
At the effective time of the Zillow Merger, each share of Zillow Class A common stock, other than Zillow excluded shares (as defined below), was converted into the right to receive one share of fully paid and nonassessable Zillow Group Class A common stock, and each share of Zillow Class B common stock, other than Zillow excluded shares, was converted into the right to receive one share of fully paid and nonassessable Zillow Group Class B common stock. Shares of Zillow common stock held by Zillow as treasury stock or by Zillow Group, Trulia, or any direct or indirect wholly owned subsidiary of Zillow or Trulia (“Zillow excluded shares”) were canceled and did not receive the Zillow merger consideration. Generally, each Zillow stock option and restricted stock unit outstanding (whether or not vested or exercisable) as of the effective time of the Zillow Merger was assumed by Zillow Group and converted into a corresponding equity award to purchase or acquire shares of Zillow Group Class A common stock, subject to the same terms, conditions and restrictions as the original option or award. Any unvested shares of Zillow Class A common stock subject to a repurchase option, risk of forfeiture or other condition as of the effective time of the Zillow Merger were exchanged for shares of Zillow Group Class A common stock that are also unvested and subject to the same repurchase option, risk of forfeiture or other condition. Each Zillow restricted unit outstanding as of the effective time of the Zillow Merger was assumed by Zillow Group and converted into the right to receive Zillow Group Class A common stock, subject to the same terms, conditions and restrictions as the original restricted unit.
At the effective time of the Trulia Merger, each share of Trulia common stock, other than Trulia excluded shares (as defined below), was converted into the right to receive 0.444 of a share of fully paid and nonassessable Zillow Group Class A common stock. Shares of Trulia common stock held by Trulia as treasury stock or by Zillow Group, Zillow, or any direct or indirect wholly owned subsidiary of Zillow or Trulia (“Trulia excluded shares”) were canceled and did not receive the Trulia merger consideration. Generally, each Trulia stock option, restricted stock unit, and stock appreciation right outstanding (whether or not vested or exercisable) as of the effective time of the Trulia Merger was assumed by Zillow Group and converted into a corresponding equity award to purchase, acquire shares of, or participate in the appreciation in price of Zillow Group Class A common stock, subject to the same terms, conditions and restrictions as the original option or award, subject to specified adjustments to reflect the effect of the Trulia exchange ratio. Each outstanding unvested Trulia stock option and restricted stock unit held by a member of the Trulia board of directors immediately prior to the effective time of the Trulia Merger who was not an employee of Trulia or any subsidiary of Trulia became fully vested immediately prior to the effective time of the Trulia Merger in accordance with the terms of the applicable award agreements.
Our acquisition of Trulia has been accounted for as a business combination, and assets acquired and liabilities assumed were recorded at their estimated fair values as of February 17, 2015. Goodwill, which represents the expected synergies from combining the acquired assets and the operations of the acquirer, as well as intangible assets that do not qualify for separate recognition, is measured as of the acquisition date as the excess of consideration transferred, which is also measured at fair value, and the net of the fair values of the assets acquired and the liabilities assumed as of the acquisition date.
In all cases in which Zillow Group’s closing stock price is a determining factor in arriving at the amount of merger consideration, the stock price assumed is the closing price of Zillow Class A common stock on NASDAQ on February 17, 2015 ($109.14 per share, unadjusted for the August 2015 stock split effected in the form of a dividend). The purchase price to effect the acquisition of Trulia of approximately $2.0 billion is summarized in the following table (in thousands):
| Value of Class A Common stock issued |
$ | 1,883,728 | ||
| Substituted stock options and stock appreciation rights attributable to pre-combination service |
54,853 | |||
| Substituted restricted stock units attributable to pre-combination service |
27,798 | |||
| Cash paid in lieu of fractional outstanding shares |
41 | |||
|
|
|
|||
| Total purchase price |
$ | 1,966,420 | ||
|
|
|
99
Table of Contents
A total of 17,259,704 shares of Zillow Group Class A common stock were issued in connection with the acquisition of Trulia. Trulia stockholders did not receive any fractional shares of Zillow Group Class A common stock in connection with the acquisition. Instead of receiving any fractional shares, each holder of Trulia common stock was paid an amount in cash (without interest) equal to such fractional amount multiplied by the last reported sale price of Zillow Class A common stock on NASDAQ on the last complete trading day prior to the date of the effective time of the Trulia Merger.
A portion of the purchase price has been attributed to the substitution of Trulia’s stock options, restricted stock units and stock appreciation rights outstanding as of February 17, 2015, for corresponding stock options, restricted stock units and stock appreciation rights to purchase, vest in or participate in the appreciation in price of shares of Zillow Group Class A common stock, all at an exchange ratio of 0.444. The fair value of Trulia’s share-based awards assumed in connection with the acquisition, including stock options, restricted stock units and stock appreciation rights, which relate to post-combination service will be recorded by Zillow Group as share-based compensation expense ratably over the remaining related vesting period of the respective award. The share-based compensation expense related to stock options and stock appreciation rights assumed is estimated at the acquisition date using the Black-Scholes-Merton option-pricing model, assuming no dividends, expected volatility of 53%, a risk-free interest rate of 1.10%, and an expected life of three years. For restricted stock units assumed, Zillow Group used the market value of Zillow’s Class A common stock on the date of acquisition to determine the fair value of the award.
The total purchase price has been allocated to the assets acquired and liabilities assumed, including identifiable intangible assets, based on their respective fair values at the acquisition date. Based upon the fair values determined by us, in which we considered or relied in part upon a valuation report of a third-party expert, the total purchase price was allocated as follows (in thousands):
| Cash and cash equivalents |
$ | 173,447 | ||
| Accounts receivable |
13,093 | |||
| Prepaid expenses and other current assets |
20,833 | |||
| Restricted cash |
6,946 | |||
| Property and equipment |
30,189 | |||
| Other assets |
434 | |||
| Identifiable intangible assets |
549,000 | |||
| Goodwill |
1,736,362 | |||
| Accounts payable, accrued expenses and other current liabilities |
(51,258 | ) | ||
| Accrued compensation and benefits |
(8,324 | ) | ||
| Deferred revenue |
(8,300 | ) | ||
| Long-term debt |
(230,000 | ) | ||
| Debt premium recorded in additional paid-in capital |
(126,386 | ) | ||
| Deferred tax liabilities and other long-term liabilities |
(139,616 | ) | ||
|
|
|
|||
| Total preliminary estimated purchase price |
$ | 1,966,420 | ||
|
|
|
The preliminary estimated fair value of identifiable intangible assets acquired consisted of the following (in thousands):
| Preliminary Estimated Fair Value |
Estimated Useful Life (in years) |
|||||||
| Trulia trade names and trademarks |
$ | 351,000 | Indefinite | |||||
| Market Leader trade names and trademarks |
2,000 | 2 | ||||||
| Customer relationships |
92,000 | 3-7 | ||||||
| Developed technology |
91,000 | 3-7 | ||||||
| Advertising relationships |
9,000 | 3 | ||||||
| MLS home data feeds |
4,000 | 3 | ||||||
|
|
|
|||||||
| Total |
$ | 549,000 | ||||||
|
|
|
|||||||
100
Table of Contents
The preliminary estimated fair value of the intangible assets acquired was determined by Zillow Group, and Zillow Group considered or relied in part upon a valuation report of a third-party expert. Zillow Group used an income approach to measure the fair value of the trade names and trademarks and the developed technology based on the relief-from-royalty method. Zillow Group used an income approach to measure the fair value of the customer relationships based on the excess earnings method, whereby the fair value is estimated based upon the present value of cash flows that the applicable asset is expected to generate. Zillow Group used an income approach to measure the fair value of the advertising relationships based on a with and without analysis, whereby the fair value is estimated based on the present value of cash flows the combined business is expected to generate with and without the advertising relationships. Zillow Group used a cost approach to measure the fair value of the MLS home data feeds based on the estimated cost to replace the data feed library. These fair value measurements were based on Level 3 measurements under the fair value hierarchy.
A portion of the total purchase price was allocated to Trulia’s 2020 Notes (see Note 12). In accordance with the accounting guidance related to business combinations, the 2020 Notes are recognized at fair value as of the effective date of the acquisition. The preliminary estimated fair value of the 2020 Notes is approximately $356.4 million. The preliminary estimated fair value of the 2020 Notes as of the date of acquisition was determined by Zillow Group, and Zillow Group considered or relied in part upon a valuation report of a third-party expert. The preliminary estimated fair value of the 2020 Notes was determined through combination of the use of a binomial lattice valuation model and consideration of quoted market prices. The fair value is classified as Level 3 due to the use of significant unobservable inputs such as implied volatility of Zillow Group’s Class A common stock, discount spread and the limited trading activity for the 2020 Notes. Given the preliminary fair value of the 2020 Notes of $356.4 million is at a substantial premium to the principal amount of $230.0 million, the premium amount of $126.4 million has been recorded as additional paid-in capital in the consolidated balance sheet as of the effective date of the acquisition. Accordingly, Zillow Group has recognized the liability component of the 2020 Notes at the stated par amount in the consolidated balance sheet as of the effective date of the acquisition. The conversion feature included in the 2020 Notes is not required to be bifurcated and separately accounted for as it meets the equity scope exception given the conversion feature (i) is indexed to Zillow Group’s Class A common stock and (ii) would be classified in shareholder’s equity. Further, the 2020 Notes do not permit or require Zillow Group to settle the debt in cash (in whole or in part) upon conversion.
A portion of the total purchase price was allocated to deferred tax liabilities primarily related to an indefinite-lived intangible asset generated in connection with the acquisition. Due to the recognition of a $351.0 million indefinite-lived Trulia trade name and trademark intangible asset as of the effective date of the acquisition, a deferred tax liability of $139.5 million is recognized which cannot be offset by the recognized deferred tax assets.
Our estimates and assumptions related to the purchase price allocation are preliminary and subject to change during the measurement period (up to one year from the acquisition date) as we finalize the amount of intangible assets, goodwill, and deferred taxes recorded in connection with the acquisition.
The results of operations related to the acquisition of Trulia have been included in our consolidated financial statements since the date of acquisition of February 17, 2015. However, disclosure of the amounts of revenue and earnings of the acquiree since the acquisition date is impracticable because discrete financial information is not available due to the rapid integration of Zillow’s and Trulia’s operations.
Unaudited Pro Forma Financial Information
The following unaudited pro forma condensed combined financial information gives effect to the acquisition of Trulia as if it were consummated on January 1, 2014 (the beginning of the comparable prior reporting period). The unaudited pro forma condensed combined financial information is presented for informational purposes only. The unaudited pro forma condensed combined financial information does not represent true historical financial information. Further, the unaudited pro forma condensed combined financial
101
Table of Contents
information is not intended to represent or be indicative of the results of operations that would have been reported had the acquisition occurred on January 1, 2014 and should not be taken as representative of future results of operations of the combined company.
The following table presents the unaudited pro forma condensed combined financial information for the periods presented (in thousands):
| Year Ended December 31, |
||||||||
| 2015 (1) | 2014 (2) | |||||||
| Revenue |
$ | 679,935 | $ | 577,830 | ||||
| Net loss |
$ | (91,055 | ) | $ | (83,336 | ) | ||
| (1) | The year ended December 31, 2015 includes pro forma adjustments for $49.3 million to eliminate direct and incremental acquisition-related costs reflected in the historical financial statements, $37.3 million to eliminate share-based compensation expense attributable to substituted equity awards and to record additional share-based compensation expense attributable to substituted equity awards, $35.7 million to eliminate restructuring costs associated with the acquisition of Trulia reflected in the historical financial statements and $2.4 million to record additional amortization expense for acquired intangible assets. |
| (2) | The year ended December 31, 2014 includes pro forma adjustments for $39.5 million to eliminate direct and incremental acquisition-related costs reflected in the historical financial statements, $18.7 million to record additional amortization expense for acquired intangible assets, $10.7 million to eliminate share-based compensation expense attributable to substituted equity awards, $6.2 million to eliminate Trulia’s historical amortization of capitalized website development costs and $2.7 million to record additional rent expense. |
Acquisition of DotLoop
In July 2015, Zillow, Inc., Delta MergerCo, Inc., a Delaware corporation and wholly owned subsidiary of Zillow, Inc. (“Merger Sub”), DotLoop, a Delaware corporation, and Fortis Advisors, LLC, a Delaware limited liability company acting as the stockholder representative, entered into an Agreement and Plan of Merger (the “DotLoop Merger Agreement”), pursuant to which Zillow, Inc. acquired DotLoop on August 20, 2015. Under the terms and subject to the conditions of the DotLoop Merger Agreement, Merger Sub merged with and into DotLoop, with DotLoop remaining as the surviving company and a wholly owned subsidiary of Zillow, Inc. (the “DotLoop Merger”). DotLoop simplifies multi-party real estate transactions by enabling real estate professionals and their clients to share, edit, sign, and store documents digitally.
Our acquisition of DotLoop has been accounted for as a business combination, and assets acquired and liabilities assumed were recorded at their estimated fair values as of August 20, 2015. Goodwill, which represents the expected synergies from combining the acquired assets and the operations of the acquirer, as well as intangible assets that do not qualify for separate recognition, is measured as of the acquisition date as the excess of consideration transferred, which is also measured at fair value, and the net of the fair values of the assets acquired and the liabilities assumed as of the acquisition date. The purchase price to effect the acquisition of DotLoop of approximately $105.5 million is summarized in the following table (in thousands):
| Cash paid for the outstanding stock and warrants of DotLoop |
$ | 94,957 | ||
| Cash paid for the cancellation of vested options to purchase shares of DotLoop’s common stock |
5,640 | |||
| Certain transaction expenses and other costs incurred by DotLoop |
4,750 | |||
| Substituted stock options attributable to pre-combination service |
191 | |||
|
|
|
|||
| Total purchase price |
$ | 105,538 | ||
|
|
|
102
Table of Contents
A portion of the purchase price has been attributed to the substitution of DotLoop’s unvested stock options outstanding as of August 20, 2015, for corresponding stock options to purchase shares of Zillow Group Class C capital stock at an exchange ratio implied by the merger consideration. The fair value of DotLoop’s unvested stock options substituted in connection with the acquisition which relate to post-combination service will be recorded by Zillow Group as share-based compensation expense ratably over the remaining related vesting period of the respective award. The share-based compensation expense related to unvested stock options substituted is estimated at the acquisition date using the Black-Scholes-Merton option-pricing model, assuming no dividends, expected volatility of 55%, a risk-free interest rate of 1.25%, and an expected life of 4.28 years.
The total purchase price has been allocated to the assets acquired and liabilities assumed, including identifiable intangible assets, based on their respective fair values at the acquisition date. Based upon the fair values determined by us, in which we considered or relied in part upon a valuation report of a third-party expert, the total purchase price was allocated as follows (in thousands):
| Cash, cash equivalents, accounts receivable, prepaid expenses and other current assets |
$ | 2,149 | ||
| Property and equipment and other assets |
258 | |||
| Identifiable intangible assets |
22,500 | |||
| Goodwill |
86,128 | |||
| Accounts payable, accrued expenses and other current liabilities, accrued compensation and benefits, and deferred revenue |
(1,362 | ) | ||
| Deferred tax liabilities |
(4,135 | ) | ||
|
|
|
|||
| Total preliminary estimated purchase price |
$ | 105,538 | ||
|
|
|
The preliminary estimated fair value of identifiable intangible assets acquired consisted of the following (in thousands):
| Preliminary Estimated Fair Value |
Estimated Useful Life (in years) | |||||
| Developed technology |
$ | 10,700 | 3 | |||
| Customer relationships |
10,200 | 6-7 | ||||
| Trade names and trademarks |
1,600 | 3 | ||||
|
|
|
|||||
| Total |
$ | 22,500 | ||||
|
|
|
|||||
The preliminary estimated fair value of the intangible assets acquired was determined by Zillow Group, and Zillow Group considered or relied in part upon a valuation report of a third-party expert. Zillow Group used an income approach to measure the fair value of the developed technology and the trade names and trademarks based on the relief-from-royalty method. Zillow Group used an income approach to measure the fair value of the customer relationships based on the excess earnings method, whereby the fair value is estimated based upon the present value of cash flows that the applicable asset is expected to generate. These fair value measurements were based on Level 3 measurements under the fair value hierarchy.
Our estimates and assumptions related to the purchase price allocation are preliminary and subject to change during the measurement period (up to one year from the acquisition date) as we finalize the amount of intangible assets, goodwill and deferred taxes recorded in connection with the acquisition.
Acquisition-related costs incurred, which primarily included legal and accounting fees and other external costs directly related to the acquisition, were expensed as incurred and were not material.
103
Table of Contents
The results of operations related to the acquisition of DotLoop have been included in our consolidated financial statements since the date of acquisition, and are not significant. Pro forma financial information for the acquisition accounted for as a business combination has not been presented, as the effects were not material to our consolidated financial statements.
Note 8. Divestiture of Market Leader
On September 2, 2015, Zillow Group, Market Leader, Inc., an indirect wholly-owned subsidiary of Zillow Group (“ML, Inc.”), Market Leader, LLC d/b/a Market Leader, LLC of Nevada, an indirect wholly-owned subsidiary of Zillow Group (together with ML, Inc., “Market Leader”), Constellation Homebuilder Systems, Corp. (“Constellation Canada”) and Constellation Web Solutions Inc. (together with Constellation Canada, the Perseus Division of Constellation), entered into an Asset Purchase Agreement (the “Asset Purchase Agreement”) pursuant to which Constellation acquired Zillow Group’s Market Leader business, including the Sharper Agent service and the Leads Direct, HouseValues and JustListed lead generation businesses, on September 30, 2015. Market Leader became part of Zillow Group through Zillow Group’s February 2015 acquisition of Trulia. Constellation acquired substantially all of the assets of the Market Leader business and assumed certain related liabilities, including Zillow Group’s Bellevue, Washington operating lease (see Note 17). In connection with the divestiture, Market Leader’s approximately 100 employees transferred with the business to Constellation. The total sale price of approximately $22.6 million includes $17.0 million that was paid in cash at closing and approximately $5.6 million for the amount received by Zillow Group from Constellation on December 29, 2015 upon the expiration of a holdback period to satisfy any purchase price adjustments and/or certain indemnification claims.
The following table presents the aggregate carrying amounts of the major classes of assets and liabilities related to the Market Leader disposal group as of the date of divestiture of September 30, 2015 (in thousands):
| Assets |
||||
| Prepaid expenses and other current assets |
$ | 501 | ||
| Property and equipment, net |
5,764 | |||
| Goodwill |
9,209 | |||
| Intangible assets, net |
17,161 | |||
|
|
|
|||
| Total assets |
$ | 32,635 | ||
|
|
|
|||
| Liabilities |
||||
| Current liabilities |
$ | 2,278 | ||
| Other long-term liabilities |
3,771 | |||
|
|
|
|||
| Total liabilities |
$ | 6,049 | ||
|
|
|
The total loss recorded related to the divestiture of Market Leader was $4.4 million for the year ended December 31, 2015 and is included in loss on divesture of business in our consolidated statements of operations. In July 2015, we determined that Market Leader met the held for sale criteria. The operating results of Market Leader prior to the date of divestiture have not been presented as discontinued operations in our consolidated statements of operations, as the disposal group does not represent a strategic shift in our operations or financial results.
104
Table of Contents
Note 9. Goodwill
The following table presents the change in goodwill from December 31, 2014 through December 31, 2015 (in thousands):
| Balance as of December 31, 2014 |
$ | 96,352 | ||
| Goodwill recorded in connection with the acquisition of Trulia |
1,736,362 | |||
| Goodwill recorded in connection with the acquisition of DotLoop |
86,128 | |||
| Reduction of goodwill in connection with the divestitures of businesses |
(9,675 | ) | ||
|
|
|
|||
| Balance as of December 31, 2015 |
$ | 1,909,167 | ||
|
|
|
The goodwill recorded in connection with the February 2015 acquisition of Trulia, which is not deductible for tax purposes, includes intangible assets that do not qualify for separate recognition, such as the assembled workforce and anticipated synergies from complementary products, and largely non-overlapping customer bases. The goodwill recorded in connection with the acquisition of DotLoop, which includes intangible assets that do not qualify for separate recognition, is not deductible for tax purposes.
Note 10. Intangible Assets
The following tables present the detail of intangible assets subject to amortization as of the dates presented (in thousands):
| December 31, 2015 | ||||||||||||
| Cost | Accumulated Amortization |
Net | ||||||||||
| Purchased content |
$ | 37,581 | $ | (19,649 | ) | $ | 17,932 | |||||
| Customer relationships |
103,425 | (16,204 | ) | 87,221 | ||||||||
| Developed technology |
108,295 | (19,515 | ) | 88,780 | ||||||||
| Trade names and trademarks |
4,860 | (2,212 | ) | 2,648 | ||||||||
| Advertising relationships |
9,000 | (2,598 | ) | 6,402 | ||||||||
| MLS home data feeds |
1,100 | (318 | ) | 782 | ||||||||
|
|
|
|
|
|
|
|||||||
| Total |
$ | 264,261 | $ | (60,496 | ) | $ | 203,765 | |||||
|
|
|
|
|
|
|
|||||||
| December 31, 2014 | ||||||||||||
| Cost | Accumulated Amortization |
Net | ||||||||||
| Purchased content |
$ | 24,615 | $ | (13,904 | ) | $ | 10,711 | |||||
| Developed technology |
13,595 | (5,321 | ) | 8,274 | ||||||||
| Customer relationships |
9,225 | (3,387 | ) | 5,838 | ||||||||
| Trademarks |
3,261 | (1,327 | ) | 1,934 | ||||||||
|
|
|
|
|
|
|
|||||||
| Total |
$ | 50,696 | $ | (23,939 | ) | $ | 26,757 | |||||
|
|
|
|
|
|
|
|||||||
105
Table of Contents
Amortization expense recorded for intangible assets for the years ended December 31, 2015, 2014 and 2013 was $39.3 million, $11.1 million and $7.6 million, respectively, and these amounts are included in technology and development expenses.
Estimated future amortization expense for intangible assets, including amortization related to future commitments (see Note 17), as of December 31, 2015 is as follows (in thousands):
| 2016 |
$ | 46,377 | ||
| 2017 |
44,090 | |||
| 2018 |
37,727 | |||
| 2019 |
32,906 | |||
| 2020 |
32,415 | |||
| All future years |
43,894 | |||
|
|
|
|||
| Total future amortization expense |
$ | 237,409 | ||
|
|
|
As of December 31, 2015, we have an indefinite-lived intangible asset for $351.0 million that we recorded in connection with our February 2015 acquisition of Trulia for Trulia’s trade names and trademarks that is not subject to amortization. See Note 7 for further details related to the acquisition.
Note 11. Accrued Expenses and Other Current Liabilities
The following table presents the detail of accrued expenses and other current liabilities as of as of the dates presented (in thousands):
| December 31, | ||||||||
| 2015 | 2014 | |||||||
| Accrued marketing and advertising |
$ | 9,663 | $ | 1,509 | ||||
| Accrued purchased content |
8,385 | — | ||||||
| Accrued legal fees |
7,784 | 3,755 | ||||||
| Merger consideration payable to former stockholders of StreetEasy, Inc. |
5,317 | 5,317 | ||||||
| Other accrued expenses and other current liabilities |
11,898 | 6,302 | ||||||
|
|
|
|
|
|||||
| Total accrued expenses and other current liabilities |
$ | 43,047 | $ | 16,883 | ||||
|
|
|
|
|
|||||
Note 12. Convertible Senior Notes
In connection with the February 2015 acquisition of Trulia (see Note 7), a portion of the total purchase price was allocated to Trulia’s Convertible Senior Notes due in 2020 (the “2020 Notes”), which are unsecured senior obligations. Pursuant to and in accordance with the Merger Agreement, Zillow Group entered into a supplemental indenture in respect of the 2020 Notes in the aggregate principal amount of $230.0 million, which supplemental indenture provides, among other things, that, at the effective time of the Trulia Merger, (i) each outstanding 2020 Note is no longer convertible into shares of Trulia common stock and is convertible solely into shares of Zillow Group Class A common stock, pursuant to, and in accordance with, the terms of the indenture governing the 2020 Notes, and (ii) Zillow Group guaranteed all of the obligations of Trulia under the 2020 Notes and related indenture. The aggregate principal amount of the 2020 Notes is due on December 15, 2020 if not earlier converted or redeemed. Interest is payable on the 2020 Notes at the rate of 2.75% semi-annually on June 15 and December 15 of each year.
Holders of the 2020 Notes may convert all or any portion of their notes, in multiples of $1,000 principal amount, at their option at any time prior to the close of business on the business day immediately preceding the maturity date. In connection with the supplemental indenture in respect of the 2020 Notes, the conversion ratio immediately prior to the effective time of the Trulia Merger of 27.8303 shares of Trulia common stock per
106
Table of Contents
$1,000 principal amount of notes was adjusted to 12.3567 shares of our Class A common stock per $1,000 principal amount of notes based on the exchange ratio of 0.444 per the Merger Agreement. This was equivalent to an initial conversion price of approximately $80.93 per share of our Class A common stock. In connection with the Class C Stock Split described below under Note 14, the conversion ratio has been further adjusted to 41.4550 shares of Class A common stock per $1,000 principal amount of notes, which is equivalent to a conversion price of approximately $24.12 per share of our Class A common stock. The conversion ratio will be adjusted for certain dilutive events and will be increased in the case of corporate events that constitute a “Make-Whole Fundamental Change” (as defined in the indenture governing the notes). The conversion option of the 2020 Notes has no cash settlement provisions. The conversion option does not meet the criteria for separate accounting as a derivative as it is indexed to our own stock.
The holders of the 2020 Notes will have the ability to require us to repurchase the notes in whole or in part upon the occurrence of an event that constitutes a “Fundamental Change” (as defined in the indenture governing the notes, including such events as a “change in control” or “termination of trading”, subject to certain exceptions). In such case, the repurchase price would be 100% of the principal amount of the 2020 Notes plus accrued and unpaid interest, if any, to, but excluding, the Fundamental Change repurchase date. Certain events are also considered “Events of Default,” which may result in the acceleration of the maturity of the 2020 Notes, as described in the indenture governing the notes. There are no financial covenants associated with the 2020 Notes.
We may not redeem the 2020 Notes prior to December 20, 2018. We may redeem the 2020 Notes, at our option, in whole or in part on or after December 20, 2018, if the last reported sale price per share of our Class A common stock has been at least 130% of the conversion price then in effect for at least 20 trading days (whether or not consecutive) during any 30 consecutive trading day period.
Interest expense related to the 2020 Notes for the year ended December 31, 2015 was $5.5 million. Accrued interest related to the 2020 Notes as of December 31, 2015 is $0.3 million, and is recorded in accrued expenses and other current liabilities in our consolidated balance sheet.
The estimated fair value and carrying value of the 2020 Notes were $272.9 million and $230.0 million, respectively, as of December 31, 2015. The estimated fair value of the 2020 Notes was determined through consideration of quoted market prices. The fair value is classified as Level 3 due to the limited trading activity for the 2020 Notes.
Note 13. Income Taxes
We are subject to federal and state income taxes in the United States and in Canada. For the years ended December 31, 2015, 2014 and 2013, we did not have a material amount of reportable taxable income and, therefore, no related tax liability or expense has been recorded in the consolidated financial statements. We recorded an income tax benefit of $4.6 million for the year ended December 31, 2015 primarily due to a deferred tax liability generated in connection with Zillow Group’s August 20, 2015 acquisition of DotLoop that can be used to realize certain deferred tax assets for which we had previously provided a full allowance. We recorded an income tax benefit of $4.1 million for the year ended December 31, 2013 due to a deferred tax liability generated in connection with Zillow’s August 26, 2013 acquisition of StreetEasy, Inc. that can be used to realize certain deferred tax assets for which we had previously provided a full valuation allowance.
The following table summarizes the components of our income tax benefit for the periods presented (in thousands):
| Year Ended December 31, | ||||||||||||
| 2015 | 2014 | 2013 | ||||||||||
| Federal |
$ | 2,838 | $ | — | $ | 3,783 | ||||||
| State |
1,807 | — | 328 | |||||||||
|
|
|
|
|
|
|
|||||||
| Deferred income tax benefit |
$ | 4,645 | $ | — | $ | 4,111 | ||||||
|
|
|
|
|
|
|
|||||||
107
Table of Contents
The following table presents a reconciliation of the federal statutory rate and our effective tax rate for the periods presented:
| Year Ended December 31, | ||||||||||||
| 2015 | 2014 | 2013 | ||||||||||
| Tax expense at federal statutory rate |
(35.0 | )% | (34.0 | )% | (34.0 | )% | ||||||
| State income taxes, net of federal tax benefit |
(2.3 | )% | (1.5 | )% | (5.8 | )% | ||||||
| Nondeductible expenses |
2.8 | % | 15.3 | % | 3.1 | % | ||||||
| Share-based compensation |
1.2 | % | 0.7 | % | 0.2 | % | ||||||
| Research and development credits |
(4.1 | )% | (3.2 | )% | (23.3 | )% | ||||||
| Divestiture of businesses |
2.3 | % | — | — | ||||||||
| Other |
(1.0 | )% | — | — | ||||||||
| Valuation allowance |
33.1 | % | 22.7 | % | 35.0 | % | ||||||
|
|
|
|
|
|
|
|||||||
| Effective tax rate |
(3.0 | )% | 0.0 | % | (24.8 | )% | ||||||
|
|
|
|
|
|
|
|||||||
Deferred federal, state and foreign income taxes reflect the net tax impact of temporary differences between the carrying amounts of assets and liabilities for financial reporting purposes and such amounts for tax purposes. The following table presents the significant components of our deferred tax assets and liabilities as of the dates presented (in thousands):
| December 31, | ||||||||
| 2015 | 2014 | |||||||
| Deferred tax assets: |
||||||||
| Federal and state net operating loss carryforwards |
$ | 162,521 | $ | 25,665 | ||||
| Share-based compensation |
45,969 | 12,680 | ||||||
| Goodwill |
825 | 1,355 | ||||||
| Depreciation and amortization |
3,090 | — | ||||||
| Start-up and organizational costs |
369 | 430 | ||||||
| Research and development credits |
21,157 | 6,493 | ||||||
| Other tax credits |
1,358 | — | ||||||
| Accruals and reserves |
3,338 | 2,339 | ||||||
| Deferred rent |
5,228 | 4,248 | ||||||
| Other deferred tax assets |
550 | 167 | ||||||
|
|
|
|
|
|||||
| Total deferred tax assets |
244,405 | 53,377 | ||||||
| Deferred tax liabilities: |
||||||||
| Website and software development costs |
(13,851 | ) | (7,263 | ) | ||||
| Intangibles |
(200,082 | ) | (6,052 | ) | ||||
| Other deferred tax liabilities |
(52 | ) | — | |||||
| Depreciation and amortization |
— | (2,838 | ) | |||||
|
|
|
|
|
|||||
| Net deferred tax assets before valuation allowance |
30,420 | 37,224 | ||||||
| Less: valuation allowance |
(162,715 | ) | (37,224 | ) | ||||
|
|
|
|
|
|||||
| Net deferred tax assets (liabilities) |
$ | (132,295 | ) | $ | — | |||
|
|
|
|
|
|||||
Realization of deferred tax assets is dependent upon the generation of future taxable income, if any, the timing and amount of which are uncertain. We have provided a full valuation allowance against the net deferred tax assets as of December 31, 2015 and 2014 because, based on the weight of available evidence, it is more likely than not (a likelihood of more than 50%) that some or all of the deferred tax assets will not be realized. The valuation allowance increased by $125.5 million and $9.9 million, respectively, during the years ended December 31, 2015 and 2014.
108
Table of Contents
We have accumulated federal tax losses of approximately $735.2 million and $358.6 million, respectively, as of December 31, 2015 and 2014, which are available to reduce future taxable income. We have accumulated state tax losses of approximately $11.6 million and $7.2 million (tax effected), respectively, as of December 31, 2015 and 2014. As of December 31, 2015, approximately $304.0 million of our net operating loss carryforwards relate to tax deductible share-based compensation in excess of amounts recognized for financial reporting purposes. To the extent that net operating loss carryforwards, if realized, relate to share-based compensation, the resulting tax benefits will be recorded to shareholders’ equity rather than to the statement of operations. Additionally, we have net research and development credit carryforwards of $17.2 million and $6.5 million, respectively, as of December 31, 2015 and 2014, which are available to reduce future tax liabilities. The tax loss and research and development credit carryforwards begin to expire in 2025. Under Sections 382 and 383 of the Internal Revenue Code, if a corporation undergoes an ownership change, the corporation’s ability to use its pre-change net operating loss carryforwards and other pre-change tax attributes, such as research tax credits, to offset its post-change income or income tax liability may be limited. In connection with our August 2013 public offering of our Class A Common stock, we experienced an ownership change that triggered Sections 382 and 383, which may limit our ability to utilize net operating loss and tax credit carryforwards. In connection with Zillow Group’s February 2015 acquisition of Trulia, Trulia experienced an ownership change that triggered Section 382 and 383, which may limit Zillow Group’s ability to utilize Trulia’s net operating loss and tax credit carryforwards.
We are currently not under audit in any tax jurisdiction. Tax years from 2012 through 2015 are currently open for audit by federal and state taxing authorities.
Changes for unrecognized tax benefits for the periods presented are as follows (in thousands):
| Balance at January 1, 2013 |
$ | 1,255 | ||
| Gross increases—prior and current period tax positions |
3,868 | |||
|
|
|
|||
| Balance at December 31, 2013 |
$ | 5,123 | ||
|
|
|
|||
| Gross increases—current period tax positions |
1,946 | |||
| Gross decreases—prior period tax positions |
(576 | ) | ||
|
|
|
|||
| Balance at December 31, 2014 |
$ | 6,493 | ||
|
|
|
|||
| Gross increases—prior and current period tax positions |
3,577 | |||
| Gross increases—assumed in connection with February 2015 acquisition of Trulia |
3,910 | |||
|
|
|
|||
| Balance at December 31, 2015 |
$ | 13,980 | ||
|
|
|
At December 31, 2015, the total amount of unrecognized tax benefits of $14.0 million is recorded as a reduction to the deferred tax asset. We do not anticipate that the amount of existing unrecognized tax benefits will significantly increase or decrease within the next 12 months. Accrued interest and penalties related to unrecognized tax benefits are recorded as income tax expense and are zero.
Note 14. Shareholders’ Equity
Preferred Stock
Our board of directors has the authority to fix and determine and to amend the number of shares of any series of preferred stock that is wholly unissued or to be established and to fix and determine and to amend the designation, preferences, voting powers and limitations, and the relative, participating, optional or other rights, of any series of shares of preferred stock that is wholly unissued or to be established, subject in each case to certain approval rights of holders of our outstanding Class B common stock. There was no preferred stock issued and outstanding as of December 31, 2015 or December 31, 2014.
109
Table of Contents
Common and Capital Stock
Our Class A common stock has no preferences or privileges and is not redeemable. Holders of Class A common stock are entitled to one vote for each share.
Our Class B common stock has no preferences or privileges and is not redeemable. At any time after the date of issuance, each share of Class B common stock, at the option of the holder, may be converted into one share of Class A common stock, or automatically converted into Class A common stock upon the affirmative vote by or written consent of holders of a majority of the shares of the Class B common stock. During the years ended December 31, 2015, 2014, and 2013, no shares, 251,445 shares, and 993,634 shares, respectively of Class B common stock were converted into Class A common stock at the option of the holders. Holders of Class B common stock are entitled to 10 votes for each share.
Our Class C capital stock has no preferences or privileges, is not redeemable and, except in limited circumstances, is non-voting.
In August 2013, we sold 3,253,522 shares of our Class A common stock, including 753,522 shares of our Class A common stock pursuant to the underwriters’ option to purchase additional shares, and certain shareholders sold 2,523,486 shares of our Class A common stock, at a price of $82.00 per share (unadjusted for the August 2015 stock split effected in the form of a dividend). We received net proceeds of $253.9 million after deducting underwriting discounts and commissions and offering expenses payable by us. We received no proceeds from the sale of our Class A common stock by the selling shareholders.
The following shares of common and capital stock have been reserved for future issuance as of the dates presented, and share numbers as of December 31, 2014 have been retroactively adjusted to reflect the effects of the Class C Stock Split defined below:
| December 31, 2015 |
December 31, 2014 |
|||||||
| Option awards outstanding |
27,126,374 | 17,399,292 | ||||||
| Restricted stock units outstanding |
2,605,514 | 376,806 | ||||||
| Class A common stock and Class C capital stock available for grant under 2011 Plan |
688,014 | 2,017,818 | ||||||
| Shares issuable upon conversion of outstanding Class B common stock |
6,217,447 | 6,217,447 | ||||||
|
|
|
|
|
|||||
| Total |
36,637,349 | 26,011,363 | ||||||
|
|
|
|
|
|||||
Stock Split Effected in Form of Stock Dividend
In December 2014 and in connection with the Trulia acquisition, the shareholders of Zillow and the stockholders of Trulia approved amendments to Zillow Group’s amended and restated articles of incorporation to, among other things, create a new class of non-voting Class C capital stock. On July 21, 2015, we announced that our board of directors had approved a distribution of shares of our Class C capital stock as a dividend to our Class A and Class B common shareholders (the “Class C Stock Split”). Holders of Class A common stock and Class B common stock as of the close of business on July 31, 2015, the record date for the Class C Stock Split, received on August 14, 2015 a distribution of two shares of Class C capital stock for each share of Class A and Class B common stock held by them as of the record date. The distribution of shares had the effect of a 3-for-1 stock split. Outstanding equity awards to purchase or acquire shares of Class A common stock were proportionately adjusted to relate to one share of Class A common stock and two shares of Class C capital stock for each share of Class A common stock subject to the awards as of the record date, and the exercise prices of any such awards were also proportionately allocated between Class A common stock and Class C capital stock.
110
Table of Contents
The adjustment to outstanding equity awards resulted in an immaterial amount of incremental aggregate fair value associated with the awards outstanding immediately following the Class C Stock Split as compared to just prior to the Class C Stock Split, which did not have a material impact on our consolidated statements of operations for the periods presented.
The par value per share of our shares of Class A common stock and Class B common stock have remained unchanged at $0.0001 per share after the Class C Stock Split. On the effective date of the Class C Stock Split, we transferred between additional paid in capital and Class C capital stock an amount equal to the $0.0001 par value of the Class C capital stock that was issued. We have given retroactive effect to prior period share and per share amounts in our consolidated financial statements for the effect of the Class C Stock Split so that prior periods are comparable to current period presentation.
Note 15. Share-Based Awards
In connection with our February 2015 acquisition of Trulia, we assumed the obligations of Zillow, Trulia and Market Leader outstanding under pre-existing stock plans. In addition, we assumed the Zillow 2011 Incentive Plan, as amended and/or restated, and the Trulia 2012 Equity Incentive Plan, as amended and restated, for purposes of future grants, with the number and type of shares issuable thereunder appropriately adjusted to reflect the acquisition in accordance with applicable NASDAQ exchange listing requirements.
In connection with the Class C Stock Split discussed in Note 14 above, all outstanding equity awards under each of the plans described below (collectively, the “Plans”) as of the record date were proportionately adjusted to relate to one share of Class A common stock and two shares of Class C capital stock for each share of Class A common stock subject to the awards as of the record date (the “Split Adjustment”). The original exercise prices of outstanding stock options and stock appreciation rights were proportionally allocated between shares of Class A common stock and Class C capital stock, based on the ratio of the when-issued trading prices of the Class A common stock and the Class C capital stock during the ten trading days prior to and including the payment date of the Class C Stock Split. In connection with the Split Adjustment, each stock option and stock appreciation right is independently exercisable (to the extent vested) for shares of Class A common stock and shares of Class C capital stock so that, in effect, for each share of Class A common stock subject to the option or stock appreciation right prior to the Class C Stock Split, the Split Adjustment resulted in a stock option to purchase one share of Class A common stock and a stock option to purchase two shares of Class C capital stock. Each such adjusted equity award otherwise has the same terms and conditions, including the vesting schedule and term, as the original equity award prior to the Split Adjustment.
Zillow Group, Inc. Amended and Restated 2011 Incentive Plan
On July 19, 2011, Zillow’s 2011 Incentive Plan (as amended and/or restated from time to time, the “2011 Plan”) became effective and serves as the successor to Zillow’s 2005 Equity Incentive Plan (the “2005 Plan”). Effective June 11, 2015, the 2011 Plan was amended and restated as the Zillow Group, Inc. Amended and Restated 2011 Incentive Plan to, among other changes: (i) increase the number of shares authorized for issuance by 1,500,000 shares, from 3,800,000 shares to 5,300,000 shares; (ii) introduce flexibility to grant Class C capital stock, in addition to or in lieu of, Class A common stock under the 2011 Plan (references in this discussion to “common stock” under the 2011 Plan generally refer to both Class A common stock and Class C capital stock); and (iii) update references to “Zillow, Inc.” to “Zillow Group, Inc.” as applicable. Shareholders approved the amended and restated 2011 Plan on June 11, 2015, and we intend that future equity grants will be made under this plan only (or a successor thereto). As a result of the Class C Stock Split, the number of shares available for future awards under the 2011 Plan was adjusted by 1,953,950 shares, which were registered as Class C capital stock.
The 2011 Plan provides that in the event of a stock dividend, stock split or similar event, the maximum number and kind of securities available for issuance under the plan will be proportionally adjusted. Under the 2011 Plan, 15,900,000 shares of common stock (as adjusted in connection with the Class C Stock Split) (or 5,300,000 shares of common stock before the Class C Stock Split took effect on August 14, 2015) are reserved
111
Table of Contents
for issuance. The number of shares of common stock available for issuance under the 2011 Plan automatically increases on the first day of each of our fiscal years beginning in 2016 by a number of shares equal to the least of (a) 3.5% of our outstanding common stock on a fully diluted basis as of the end of our immediately preceding fiscal year, (b) 10,500,000 shares (or 3,500,000 shares before the Class C Stock Split took effect on August 14, 2015), and (c) a lesser amount determined by our board of directors; provided, however, that any shares from any increases in previous years that are not actually issued will continue to be available for issuance under the 2011 Plan. In addition, shares previously available for grant under the 2005 Plan, but not issued or subject to outstanding awards under the 2005 Plan as of July 19, 2011, and shares subject to outstanding awards under the 2005 Plan that subsequently cease to be subject to such awards (other than by reason of exercise of the awards) are available for grant under the 2011 Plan. The 2011 Plan is administered by the compensation committee of the board of directors. Under the terms of the 2011 Plan, the compensation committee may grant equity awards, including incentive stock options, nonqualified stock options, restricted stock, restricted stock units or restricted units to employees, officers, directors, consultants, agents, advisors and independent contractors. The compensation committee has also authorized certain senior executive officers to grant equity awards under the 2011 Plan, within limits prescribed by the compensation committee.
Options under the 2011 Plan are granted with an exercise price per share not less than 100% of the fair market value of our common stock on the date of grant, with the exception of substituted option awards granted in connection with acquisitions, and are exercisable at such times and under such conditions as determined by the compensation committee. Under the 2011 Plan, the maximum term of an option is ten years from the date of grant. Any portion of an option that is not vested and exercisable on the date of a participant’s termination of service expires on such date. Employees generally forfeit their rights to exercise vested options after 3 months following their termination of employment or 12 months in the event of termination by reason of death, disability or retirement. Options granted under the 2011 Plan are typically granted with seven-year terms and typically vest 25% after 12 months and ratably thereafter over the next 36 months, though certain options have been granted with longer terms and vesting schedules.
Restricted stock units under the 2011 Plan typically vest either 25% after 12 months and quarterly thereafter over the next three years or 12.5% after 6 months and quarterly thereafter for the next 3.5 years. Any portion of a restricted stock unit that is not vested on the date of a participant’s termination of service expires on such date.
Trulia 2005 Stock Incentive Plan
Trulia granted options under the 2005 Stock Incentive Plan (as amended, “the 2005 Plan”) until September 2012 when the 2005 Plan was terminated. Stock options issued prior to the plan termination remained outstanding in accordance with their terms. Under the terms of the 2005 Plan, Trulia had the ability to grant incentive and nonqualified stock options, stock appreciation rights, restricted stock awards and restricted stock units. Options granted under the 2005 Plan generally vest at a rate of 25% after 12 months and ratably thereafter over the next 36 months and expire 10 years from the grant date. Certain options vest monthly over two to four years.
Trulia 2012 Equity Incentive Plan, as Amended and Restated
On September 19, 2012, Trulia’s 2012 Equity Incentive Plan (the “2012 Plan”) became effective. The 2012 Plan provides for the grant of incentive and nonqualified stock options, restricted stock, restricted stock units, stock appreciation rights, performance units and performance shares to employees, directors and consultants. Under the 2012 Plan, stock options are granted at a price per share not less than 100% of the fair market value per share of the underlying stock at the grant date. The plan administrator determines the vesting period for each option award on the grant date, and the options generally expire 10 years from the grant date or such shorter term as may be determined for the options. As noted above, we intend that future equity grants will be made under the 2011 Plan only.
112
Table of Contents
Market Leader Amended and Restated 2004 Equity Incentive Plan
In connection with Trulia’s acquisition of Market Leader in 2013, Trulia assumed Market Leader’s Amended and Restated 2004 Equity Incentive Plan (the “2004 Plan”), including all outstanding shares of restricted stock, all outstanding stock appreciation rights, all outstanding options, and all shares available for future issuance under the 2004 Plan. Trulia granted equity awards, to the extent permissible by applicable law and New York Stock Exchange rules, under the 2004 Plan until it expired on December 9, 2014. The equity awards issued prior to the 2004 Plan’s expiration remained outstanding in accordance with their terms.
Option Awards and Stock Appreciation Rights
The following table summarizes option award and stock appreciation rights activity for the year ended December 31, 2015 and has been retroactively adjusted to reflect the effects of the Class C Stock Split:
| Number of Shares Subject to Existing Options and Stock Appreciation Rights |
Weighted- Average Exercise Price Per Share |
Weighted- Average Remaining Contractual Life (Years) |
Aggregate Intrinsic Value (in thousands) |
|||||||||||||
| Outstanding at January 1, 2015 |
17,399,292 | $ | 18.12 | 5.32 | $ | 311,040 | ||||||||||
| Assumed Trulia options and stock appreciation rights in connection with February 2015 acquisition of Trulia |
3,159,765 | 13.79 | ||||||||||||||
| Granted |
11,438,095 | 31.45 | ||||||||||||||
| Exercised |
(2,732,767 | ) | 8.99 | |||||||||||||
| Forfeited or cancelled |
(2,138,011 | ) | 28.37 | |||||||||||||
|
|
|
|||||||||||||||
| Outstanding at December 31, 2015 |
27,126,374 | 23.35 | 5.96 | 156,025 | ||||||||||||
| Vested and exercisable at December 31, 2015 |
9,470,685 | 14.44 | 3.93 | 112,923 | ||||||||||||
The number of options granted during the year ended December 31, 2015 in the table above includes a total of 199,779 substituted options with a weighted-average exercise price of $9.29 per share granted in connection with our August 2015 acquisition of DotLoop.
The fair value of options granted, excluding options granted under the Stock Option Grant Program for Nonemployee Directors (“Nonemployee Director Awards”) and certain options granted to the Company’s executives in January and February 2015 and January 2013, is estimated at the date of grant using the Black-Scholes-Merton option-pricing model with the following assumptions for the periods presented:
| Year Ended December 31, | ||||||
| 2015 | 2014 | 2013 | ||||
| Expected volatility |
54% – 56% | 53% – 57% | 50% – 54% | |||
| Expected dividend yield |
— | — | — | |||
| Risk-free interest rate |
1.03% – 1.48% | 1.37% – 1.55% | 0.70% – 1.27% | |||
| Weighted-average expected life |
3.50 – 4.58 years | 4.58 years | 4.58 years | |||
| Weighted-average fair value of options granted |
$13.77 | $14.78 | $7.09 | |||
The weighted average estimated fair value of options granted included in the table above has been retroactively adjusted to reflect the effects of the Class C Stock Split.
113
Table of Contents
The assumptions included in the table above exclude Trulia’s stock options and stock appreciation rights assumed in connection with the February 17, 2015 acquisition and DotLoop’s unvested stock options substituted in connection with the August 20, 2015 acquisition (see Note 7).
In January and February 2015, option awards for a total of 3,450,000 shares of Class A common stock and Class C capital stock (as adjusted in connection with the Class C Stock Split) were granted to certain of the Company’s executive officers. The fair value of the option awards is estimated at the date of grant using the Black-Scholes-Merton option-pricing model, assuming no dividends, expected volatility of 52%, a risk-free interest rate of 1.76% and a weighted-average expected life of 6.8 years. The grant date fair value of the option awards is approximately $62.8 million. One-sixteenth of the total number of shares subject to the option awards will vest and become exercisable on the first anniversary of the vesting commencement date. An additional 1/192nd of the total number of shares subject to the option awards will vest and become exercisable monthly thereafter over the next three years so that this portion of the award will be vested and exercisable four years from the vesting commencement date. One-sixteenth of the total number of shares subject to the option awards will vest and become exercisable on the two-year anniversary of the vesting commencement date. An additional 1/192nd of the total number of shares subject to the option awards will vest and become exercisable monthly thereafter over the next three years so that this portion of the award will be vested and exercisable five years from the vesting commencement date. One-sixteenth of the total number of shares subject to the option awards will vest and become exercisable on the three-year anniversary of the vesting commencement date. An additional 1/192nd of the total number of shares subject to the option awards will vest and become exercisable monthly thereafter over the next three years so that this portion of the award will be vested and exercisable six years from the vesting commencement date. One-sixteenth of the total number of shares subject to the option awards will vest and become exercisable on the four-year anniversary of the vesting commencement date. An additional 1/192nd of the total number of shares subject to the option awards will vest and become exercisable monthly thereafter over the next three years so that this portion of the award will be vested and exercisable seven years from the vesting commencement date. The option awards have a ten-year term.
In March 2015, option awards for an aggregate of 47,175 shares of Class A common stock and Class C capital stock (as adjusted in connection with the Class C Stock Split) were granted as Nonemployee Director Awards, which are fully vested and exercisable on the date of grant. The fair value of options granted for the Nonemployee Director Awards, $15.90 per share, is estimated at the date of grant using the Black-Scholes-Merton option-pricing model, assuming no dividends, expected volatility of 57%, a risk-free interest rate of 1.01%, and a weighted-average expected life of 3.5 years. During the year ended December 31, 2015, share-based compensation expense recognized in our statement of operations related to Nonemployee Director Awards was $0.8 million, and is included in general and administrative expenses.
In January 2013, an option award for 1,500,000 shares of Class A common stock and Class C capital stock (as adjusted in connection with the Class C Stock Split) was granted to the Company’s chief executive officer. The fair value of the option award, $6.33 per share, is estimated at the date of grant using the Black-Scholes-Merton option-pricing model, assuming no dividends, expected volatility of 51%, a risk-free interest rate of 0.70% and a weighted-average expected life of 7.3 years.
As of December 31, 2015, there was a total of $203.9 million in unrecognized compensation cost related to unvested stock options and stock appreciation rights, which is expected to be recognized over a weighted-average period of 3.5 years.
The total intrinsic value of options and stock appreciation rights exercised during the years ended December 31, 2015, 2014 and 2013 was $67.3 million, $124.0 million and $114.4 million, respectively. The fair value of options and stock appreciation rights vested for the years ended December 31, 2015, 2014 and 2013 was $59.9 million, $18.9 million and $10.6 million, respectively.
114
Table of Contents
Restricted Stock Awards
The following table summarizes restricted stock award activity for the year ended December 31, 2015 and has been retroactively adjusted to reflect the effects of the Class C Stock Split:
| Shares of Restricted Stock |
Weighted- Average Grant- Date Fair Value |
|||||||
| Unvested outstanding at January 1, 2015 |
260,505 | $ | 10.75 | |||||
| Granted |
4,173 | 40.45 | ||||||
| Vested |
(233,732 | ) | 11.07 | |||||
| Forfeited or cancelled |
— | — | ||||||
|
|
|
|||||||
| Unvested outstanding at December 31, 2015 |
30,946 | 12.35 | ||||||
|
|
|
|||||||
The total fair value of shares of restricted stock awards vested for the years ended December 31, 2015, 2014 and 2013 was $2.6 million, $4.5 million and $3.4 million, respectively.
The fair value of the outstanding restricted stock awards will be recorded as share-based compensation expense over the vesting period. As of December 31, 2015, there was $0.4 million of total unrecognized compensation cost related to restricted stock awards, which is expected to be recognized over a weighted-average period of 0.8 years.
Restricted Stock Units
The following table summarizes activity for restricted stock units for the year ended December 31, 2015 and has been retroactively adjusted to reflect the effects of the Class C Stock Split:
| Restricted Stock Units |
Weighted- Average Grant- Date Fair Value |
|||||||
| Unvested outstanding at January 1, 2015 |
376,806 | $ | 28.56 | |||||
| Assumed Trulia restricted stock units in connection with February 2015 acquisition of Trulia |
3,798,957 | 36.38 | ||||||
| Granted |
1,354,185 | 28.55 | ||||||
| Vested |
(1,899,531 | ) | 31.74 | |||||
| Forfeited or cancelled |
(1,024,903 | ) | 31.12 | |||||
|
|
|
|||||||
| Unvested outstanding at December 31, 2015 |
2,605,514 | 32.36 | ||||||
|
|
|
|||||||
In February 2015, pursuant to the terms of a Restricted Stock Unit Award Notice and Restricted Stock Unit Award Agreement entered into between Zillow Group and an employee, Zillow Group granted to the employee restricted stock units for a total of 82,077 shares of Class A common stock and Class C capital stock (as adjusted in connection with the Class C Stock Split). For 50,202 of the restricted stock units, 25% of such restricted stock unit award will vest on February 17, 2016, and the remainder will vest in substantially equal installments each three-month period thereafter for three years, subject to the recipient’s continued full-time employment or service to Zillow Group. For 31,875 of the restricted stock units, one-eighth of such restricted stock unit award vested on August 17, 2015, and the remainder will vest in substantially equal installments each three-month period thereafter for three and a half years, subject to the recipient’s continued full-time employment or service to Zillow Group. In the event of termination of service or employment by Zillow Group without cause or upon the resignation by such employee for good reason, the employee will receive an additional 12 months’ accelerated
115
Table of Contents
vesting of the then outstanding restricted stock units, except that in the event of such a termination in connection with a change in control, the employee will receive 50% accelerated vesting of the then outstanding restricted stock units. The employee will be entitled to receive one share of Class A common stock and two shares of Class C capital stock for each then outstanding restricted stock unit that becomes vested. The grant date fair value of the restricted stock units is approximately $3.0 million.
In April 2015, Zillow Group granted to certain employees supporting our Trulia brand retention restricted stock units for a total of 316,074 shares of Class A common stock and Class C capital stock (as adjusted in connection with the Class C Stock Split), of which 12.5% of the retention restricted stock units vested approximately 6 months after the vesting commencement date of February 18, 2015, and the remaining retention restricted stock units vest quarterly thereafter for approximately 3.5 years, subject to the recipient’s continued full-time employment or service to Zillow Group. The total grant date fair value of the retention restricted stock units is approximately $10.2 million.
Pursuant to the terms of the DotLoop Merger Agreement, Zillow Group established a retention bonus plan in August 2015 pursuant to which a total of 178,428 restricted stock units for shares of our Class C capital stock have been granted to employees of DotLoop who accepted employment with Zillow Group, of which 25% of the restricted stock units vest on August 20, 2016, and the remaining restricted stock units vest quarterly thereafter over the next three years. The vesting of the restricted stock units is subject to the recipient’s continued full-time employment or service to Zillow Group. The total grant date fair value of the restricted stock units is approximately $4.5 million.
In August 2015, pursuant to the terms of a Restricted Stock Unit Award Notice and Restricted Stock Unit Award Agreement between Zillow Group and an employee, Zillow Group granted to the employee 173,761 restricted stock units, of which 50% of the restricted stock units vest on August 21, 2016, and the remaining restricted stock units vest quarterly thereafter for the next three years. The vesting of the restricted stock units is subject to the recipient’s continued full-time employment or service to Zillow Group. The total grant date fair value of the restricted stock units is approximately $4.4 million.
The total fair value of vested restricted stock units was $67.3 million, $5.1 million and $10.5 million, respectively, for the years ended December 31, 2015, 2014 and 2013.
The fair value of the outstanding restricted stock units will be recorded as share-based compensation expense over the vesting period. As of December 31, 2015, there was $69.0 million of total unrecognized compensation cost related to restricted stock units, which is expected to be recognized over a weighted-average period of 2.6 years.
Share-Based Compensation Expense
The following table presents the effects of share-based compensation in our consolidated statements of operations during the periods presented (in thousands):
| Year Ended December 31, | ||||||||||||
| 2015 | 2014 | 2013 | ||||||||||
| Cost of revenue |
$ | 4,694 | $ | 1,844 | $ | 737 | ||||||
| Sales and marketing |
25,391 | 7,320 | 10,969 | |||||||||
| Technology and development |
26,849 | 11,681 | 4,660 | |||||||||
| General and administrative |
48,280 | 13,240 | 7,070 | |||||||||
| Restructuring costs |
14,859 | — | — | |||||||||
|
|
|
|
|
|
|
|||||||
| $ | 120,073 | $ | 34,085 | $ | 23,436 | |||||||
|
|
|
|
|
|
|
|||||||
116
Table of Contents
Certain executives of Trulia are entitled to partial and/or full “double trigger” equity acceleration upon a termination without “cause” or a resignation for “good reason,” each within twelve months of the Trulia acquisition, pursuant to pre-existing offer letters and/or equity award agreements entered into with Trulia. For the year ended December 31, 2015, approximately $1.8 million, $1.4 million, and $6.7 million, respectively, of share-based compensation expense is included in sales and marketing expenses, technology and development expenses, and general and administrative expenses related to change in control equity acceleration for certain former executives of Trulia pursuant to Zillow Group’s February 2015 restructuring plan (see Note 18).
Note 16. Net Loss Per Share
Basic net loss per share is computed by dividing net loss by the weighted-average number of shares (including Class A common stock, Class B common stock and Class C capital stock) outstanding during the period. In the calculation of basic net loss per share, undistributed earnings are allocated assuming all earnings during the period were distributed.
Diluted net loss per share is computed by dividing net loss by the weighted-average number of shares (including Class A common stock, Class B common stock and Class C capital stock) outstanding during the period and potentially dilutive Class A common stock and Class C capital stock equivalents, except in cases where the effect of the Class A common stock or Class C capital stock equivalent would be antidilutive. Potential Class A common stock and Class C capital stock equivalents consist of Class A common stock and Class C capital stock issuable upon exercise of stock options and stock appreciation rights and Class A common stock and Class C capital stock underlying unvested restricted stock awards and unvested restricted stock units using the treasury stock method. Potential Class A common stock equivalents also include Class A common stock issuable upon conversion of the 2020 Notes using the if-converted method.
For the periods presented, the following Class A common stock and Class C capital stock equivalents were excluded from the calculations of diluted net loss per share because their effect would have been antidilutive, which share numbers have been retroactively adjusted to reflect the effects of the Class C Stock Split (in thousands):
| Year Ended December 31, | ||||||||||||
| 2015 | 2014 | 2013 | ||||||||||
| Class A common stock and Class C capital stock issuable upon the exercise of option awards and stock appreciation rights |
6,751 | 8,709 | 9,537 | |||||||||
| Class A common stock and Class C capital stock underlying unvested restricted stock awards and restricted stock units |
639 | 354 | 513 | |||||||||
| Class A common stock issuable upon conversion of the 2020 Notes |
9,535 | — | — | |||||||||
|
|
|
|
|
|
|
|||||||
| Total Class A common stock and Class C capital stock equivalents |
16,925 | 9,063 | 10,050 | |||||||||
|
|
|
|
|
|
|
|||||||
In the event of liquidation, dissolution, distribution of assets or winding-up of the Company, the holders of all classes of common and capital stock have equal rights to receive all the assets of the Company after the rights of the holders of preferred stock have been satisfied. We have not presented net loss per share under the two-class method for our Class A common stock, Class B common stock and Class C capital stock because it would be the same for each class due to equal dividend and liquidation rights for each class.
117
Table of Contents
Note 17. Commitments and Contingencies
Lease Commitments
We have various operating leases for office space and equipment.
Seattle, Washington
In March 2011, we entered into a lease agreement for office space that houses our corporate headquarters in Seattle (as amended from time to time, the “Seattle Lease”). Pursuant to the terms of the Seattle Lease, we currently occupy a total of 155,042 square feet, and we are obligated to make escalating monthly lease payments that began in December 2012 and continue through December 2024. In November 2014, we entered into a lease amendment under which we will lease an additional 113,470 square feet of office space. The Company has taken possession of a portion of the additional office space and will continue to take possession as space becomes available through 2017 under the same terms and conditions.
San Francisco, California
In connection with our February 2015 acquisition of Trulia, Inc. (“Trulia”), we assumed a lease agreement for office space in San Francisco (as amended from time to time, the “San Francisco Lease”), which houses Trulia’s corporate headquarters and beginning in March 2015, also houses Zillow’s personnel located in San Francisco. Pursuant to the terms of the San Francisco Lease, we lease a total of approximately 79,000 square feet, and we are obligated to make escalating monthly lease payments that began in November 2014 and continue through September 2023. In July 2014, Trulia entered into a lease amendment under which we lease an additional 26,620 square feet of office space under the same terms and conditions.
In November 2012, we entered into an operating lease in San Francisco, California for 18,353 square feet under which we are obligated to make escalating monthly lease payments which began in December 2012 and continue through November 2018. In March 2015, we ceased use of this space in connection with our February 2015 acquisition of Trulia, and in May 2015, we sublet this office space to another occupant. Pursuant to the terms of the operating lease and since October 2015, we lease an additional 8,311 square feet of office space under the same terms and conditions.
New York, New York
In February 2014, we entered into an operating lease in New York (as amended from time to time, the “New York Lease”). Pursuant to the terms of the New York Lease, we lease a total of approximately 39,900 square feet, and we are obligated to make escalating monthly lease payments that began in August 2014 and continue through November 2024. In July 2015, we sublet approximately 6,650 square feet of this office space to another occupant.
Denver, Colorado
In connection with our February 2015 acquisition of Trulia, we assumed a lease agreement for office space in Denver. Pursuant to the terms of the lease, we lease a total of approximately 65,000 square feet, and we are obligated to make escalating monthly lease payments that began in November 2014 and continue through October 2021.
Bellevue, Washington
In connection with our February 2015 acquisition of Trulia, we assumed a lease agreement for office space in Bellevue for approximately 72,000 square feet of office space. In September 2015, in connection with our divestiture of Market Leader (see Note 8), Constellation assumed the Bellevue operating lease.
118
Table of Contents
Irvine, California
In April 2012, we entered into a lease agreement for office space in Irvine (as amended from time to time, the “Irvine Lease”). Pursuant to the terms of the Irvine Lease, we lease a total of approximately 60,000 square feet under which we are obligated to make escalating monthly lease payments which began in August 2012 and continue through July 2022.
We lease additional office space in San Francisco, California, Chicago, Illinois, Denver, Colorado, Cincinnati, Ohio, Lincoln, Nebraska and Vancouver, British Columbia.
Future minimum payments for all operating leases as of December 31, 2015 are as follows (in thousands):
| 2016 |
$ | 17,885 | ||
| 2017 |
21,702 | |||
| 2018 |
23,222 | |||
| 2019 |
21,909 | |||
| 2020 |
22,439 | |||
| All future years |
80,953 | |||
|
|
|
|||
| Total future minimum lease payments |
$ | 188,110 | ||
|
|
|
Rent expense for the years ended December 31, 2015, 2014 and 2013, was $14.9 million, $7.5 million and $4.1 million, respectively. Total minimum rentals to be received in the future under noncancelable subleases as of December 31, 2015 was $4.3 million.
Purchase Commitments
As of December 31, 2015, we had non-cancelable purchase commitments for content related to our mobile applications and websites totaling $99.7 million. The amounts due for this content as of December 31, 2015 are as follows (in thousands):
| 2016 |
$ | 34,330 | ||
| 2017 |
34,841 | |||
| 2018 |
14,000 | |||
| 2019 |
6,000 | |||
| 2020 |
6,000 | |||
| 2021 |
4,500 | |||
|
|
|
|||
| Total future purchase commitments |
$ | 99,671 | ||
|
|
|
Letters of Credit
As of December 31, 2015, we have outstanding letters of credit of approximately $4.6 million, $1.8 million, $1.5 million, $1.1 million and $1.1 million which secure our lease obligations in connection with the operating leases of our San Francisco, Seattle, Bellevue, New York and Denver office spaces, respectively. Certain of the letters of credit are unsecured obligations, and certain of the letters of credit are secured by certificates of deposit held as collateral in our name at a financial institution. The secured letters of credit are classified as restricted cash in our consolidated balance sheet.
Surety Bonds
In the course of business, we are required to provide financial commitments in the form of surety bonds to third parties as a guarantee of our performance on and our compliance with certain obligations. If we were to fail to perform or comply with these obligations, any draws upon surety bonds issued on our behalf would then trigger our payment obligation to the surety bond issuer. We have outstanding surety bonds issued for our benefit of approximately $3.4 million as of December 31, 2015. There were no surety bonds outstanding as of December 31, 2014.
119
Table of Contents
Legal Proceedings
We are involved in a number of legal proceedings concerning matters arising in connection with the conduct of our business activities, some of which are at preliminary stages and some of which seek an indeterminate amount of damages. We regularly evaluate the status of legal proceedings in which we are involved to assess whether a loss is probable or there is a reasonable possibility that a loss or additional loss may have been incurred to determine if accruals are appropriate. We further evaluate each legal proceeding to assess whether an estimate of possible loss or range of loss can be made if accruals are not appropriate. For certain cases described below, management is unable to provide a meaningful estimate of the possible loss or range of possible loss because, among other reasons, (i) the proceedings are in preliminary stages; (ii) specific damages have not been sought; (iii) damages are, in our view, unsupported and/or exaggerated; (iv) there is uncertainty as to the outcome of pending appeals or motions; (v) there are significant factual issues to be resolved; and/or (vi) there are novel legal issues or unsettled legal theories presented. For these cases, however, management does not believe, based on currently available information, that the outcomes of these proceedings will have a material effect on our financial position, results of operations or cash flow.
In March 2010, Smarter Agent, LLC (“Smarter Agent”) filed a complaint against us and multiple other defendants, including HotPads, Inc. (“HotPads”), for patent infringement in the U.S. District Court for the District of Delaware. The complaint alleges, among other things, that our mobile technology infringes three patents held by Smarter Agent purporting to cover: a “Global positioning-based real estate database access device and method,” a “Position-based information access device and method” and a “Position-based information access device and method of searching,” and seeks an injunction against the alleged infringing activities and an unspecified award for damages. In November 2010, the U.S. Patent and Trademark Office granted our petition for re-examination of the three patents-in-suit, and, to date, all claims of all three patents remain rejected in the re-examination proceedings, including through appeals to the Patent Trial and Appeal Board. In March 2011, the court granted a stay of the litigation pending the completion of the re-examination proceedings. In addition, in October 2011, Smarter Agent filed a substantially similar complaint against Diverse Solutions, Inc. (“Diverse Solutions”), StreetEasy, Market Leader (a subsidiary of Trulia), and other defendants, for patent infringement in the U.S. District Court for the District of Delaware. On October 31, 2011, we acquired substantially all of the operating assets and certain liabilities of Diverse Solutions, including the Smarter Agent complaint against Diverse Solutions. On December 14, 2012, we acquired HotPads, and took responsibility for the Smarter Agent complaint against HotPads. On August 26, 2013, we acquired StreetEasy, and took responsibility for the Smarter Agent complaint against StreetEasy. On February 17, 2015, we acquired Trulia, and took responsibility for the Smarter Agent complaint against Market Leader. On September 22, 2015, the court dismissed the case against Zillow, HotPads, and Trulia. On September 25, 2015, the court dismissed the case against Market Leader and Diverse Solutions. On October 6, 2015, the court dismissed the case against StreetEasy. We have not recorded an accrual related to these complaints as of December 31, 2015 or 2014, as the complaints have been dismissed.
In September 2010, LendingTree, LLC (“LendingTree”) filed a complaint against us for patent infringement in the U.S. District Court for the Western District of North Carolina. The complaint alleged, among other things, that our website technology infringes two patents purporting to cover a “Method and computer network for coordinating a loan over the internet.” The complaint sought, among other things, a judgment that we infringed certain patents held by LendingTree, an injunction against the alleged infringing activities and an award for damages. We denied the allegations and asserted defenses and counterclaims seeking declarations that we are not infringing the patents and that the patents are invalid. In March 2014, a federal jury found that Zillow does not infringe the patents and that the patents asserted by LendingTree are invalid. In April, 2014, LendingTree filed two motions for judgment as a matter of law and for a new trial, all of which we opposed. In October 2014, the Court issued an order upholding the jury verdict and denying LendingTree’s motions. In November 2014, LendingTree filed a notice of appeal and, in September 2015, LendingTree filed its opening brief. In December 2015, we filed a response brief to LendingTree’s opening brief. We have not recorded an accrual related to this complaint as of December 31, 2015 or 2014, as we do not believe a loss is probable or reasonably estimable.
120
Table of Contents
In March 2014, Move, Inc., the National Association of Realtors and three related entities, filed a complaint against us and Errol Samuelson, our Chief Industry Development Officer, in the Superior Court of the State of Washington in King County, alleging, among other things, that Zillow and Mr. Samuelson misappropriated plaintiffs’ trade secrets in connection with Mr. Samuelson joining Zillow in March 2014. The plaintiffs seek, among other things, an injunction against the alleged misappropriations and Mr. Samuelson working for us, as well as significant monetary damages. In February 2015, plaintiffs filed an amended complaint that, among other things, added Curt Beardsley, our Vice President of MLS Partnerships, as a defendant in the matter. In August 2015, Zillow filed an amended answer and counterclaim against plaintiffs that alleged, among other things, that plaintiffs violated the Washington Trade Secrets Act and aided and abetted a breach of the duty of confidentiality through the public filing of a document that included Zillow’s confidential information and trade secrets. On January 8, 2016, plaintiffs filed a motion seeking sanctions against defendants for alleged evidence spoliation, and defendants each filed a motion for partial summary judgment against plaintiffs regarding the preemption of their common law claims by the Uniform Trade Secrets Act. A hearing was held on February 5, 2016 regarding the motions that the court is currently taking under advisement. An evidentiary hearing regarding plaintiffs’ spoliation motion has been scheduled for April 2016. The trial date is scheduled for June 2016. The plaintiffs recently indicated that they are seeking damages which, if actually awarded, would have a material adverse effect on our business. We believe the plaintiffs’ allegations are without merit and their calculations of damages are baseless. We deny the allegations of any wrongdoing and intend to vigorously defend the claims in the lawsuit. We have not recorded an accrual related to these complaints as of December 31, 2015 or 2014, as we do not believe a loss is probable. There is a reasonable possibility that a loss may be incurred; however, the possible loss or range of loss is not estimable.
In August 2014, four purported class action lawsuits were filed by plaintiffs against Trulia and its directors, Zillow, and Zebra Holdco, Inc. in connection with Zillow’s proposed acquisition of Trulia. One of those purported class actions, captioned Collier et al. v. Trulia, Inc., et al., was brought in the Superior Court of the State of California for the County of San Francisco, however on October 7, 2014, plaintiff in the Collier action filed a new complaint in the Delaware Court of Chancery alleging substantially the same claims and seeking substantially the same relief as the original complaint filed in California. On October 8, 2014, plaintiff in the Collier action filed a request for dismissal of the California case without prejudice. The other three of the purported class action lawsuits, captioned Shue et al. v. Trulia, Inc., et al., Sciabacucci et al. v. Trulia, Inc., et al., and Steinberg et al. v. Trulia, Inc. et al., were brought in the Delaware Court of Chancery. All four lawsuits allege that Trulia’s directors breached their fiduciary duties to Trulia stockholders, and that the other defendants aided and abetted such breaches, by seeking to sell Trulia through an allegedly unfair process and for an unfair price and on unfair terms. All lawsuits sought, among other things, equitable relief that would have enjoined the consummation of Zillow’s proposed acquisition of Trulia and attorneys’ fees and costs. The Delaware actions also seek rescission of the Merger Agreement or rescissory damages and orders directing the defendants to account for alleged damages suffered by the plaintiffs and the purported class as a result of the defendants’ alleged wrongdoing. On September 24, 2014, plaintiff in the Sciabacucci action filed (1) a motion for expedited proceedings, (2) a motion for a preliminary injunction, (3) a request for production of documents from defendants, and (4) notice of depositions. On October 13, 2014, the Delaware Court of Chancery issued an order consolidating all of the Delaware actions into one matter captioned In re Trulia, Inc. Stockholder Litigation. On October 13 and 14, 2014, the above-referenced motions were refiled under the consolidated case number. On November 14, 2014, plaintiffs again refiled their motion for a preliminary injunction challenging the proposed acquisition. On November 19, 2014, the parties entered into a Memorandum of Understanding, documenting an agreement-in-principle for the settlement of the consolidated litigation, pursuant to which Trulia agreed to make certain supplemental disclosures in a Form 8-K. The Memorandum of Understanding was filed with the Court of Chancery that same day. Thereafter, the parties negotiated and agreed to a stipulation of settlement, and after notice to the class, the Court of Chancery held a settlement hearing on September 16, 2015 where the Court requested the parties to make further submission in connection with the settlement. By an opinion dated January 22, 2016, the Court denied approval of the settlement. We have not recorded an accrual related to these complaints as of December 31, 2015 or 2014, as we do not believe a loss is probable.
121
Table of Contents
In July 2015, two purported class action lawsuits were filed against us and each of our directors in the Superior Court of the State of Washington in King County, alleging, among other things, that the directors breached their fiduciary duties in connection with the approval of the issuance of non-voting Class C capital stock as a dividend. The complaints seek, among other things, injunctive relief and unspecified monetary damages. A hearing on the plaintiffs’ motion seeking a preliminary injunction to enjoin the issuance of the Class C Stock Split was held on August 5, 2015, and the court denied plaintiffs’ motion for a preliminary injunction. Plaintiffs filed a consolidated class action complaint on September 18, 2015 naming and seeking relief from only our co-founders as defendants. On December 4, 2015, defendents filed a motion to dismiss the consolidated class action complaint, and a hearing to consider that motion to dismiss is scheduled for March 2016. We have not recorded an accrual related to this purported class action lawsuit as of December 31, 2015, as we do not believe a loss is probable.
In March 2015, the Wage and Hour Division of the U.S. Department of Labor (“DOL”) notified the Company that it was initiating a compliance review to determine the Company’s compliance with one or more federal labor laws enforced by the DOL. The Company understands that the scope of this review is limited to the review of the Company’s compliance with certain wage and hour laws with respect to Zillow, Inc. inside sales consultants during a two-year period between 2013 and 2015. In October 2015, the DOL orally informed us that the compliance review is ongoing but that, based on its preliminary findings, it believes the Company may have failed to pay overtime to such inside sales consultants. The DOL has made no assessment of damages or penalties, however, nor has it made a determination that we violated one or more federal labor laws. We have cooperated and continue to cooperate with the DOL in its compliance review. If the DOL were to finally determine that we violated one or more federal labor laws, we may be required to make certain payments of back wages and other amounts to such inside sales consultants or take other corrective actions, and may be subject to fines or penalties. We have recorded an accrual for an immaterial amount as of December 31, 2015 related to liabilities that may result from this compliance review. There is a reasonable possibility that a loss in excess of amounts accrued may be incurred; however, any additional possible loss or range of loss is not reasonably estimable at this time because the DOL’s review is ongoing, and we are unable to predict the outcome of the review.
In addition to the matters discussed above, from time to time, we are involved in litigation and claims that arise in the ordinary course of business. Although we cannot be certain of the outcome of any litigation and claims, nor the amount of damages and exposure that we could incur, we currently believe that the final disposition of such matters will not have a material effect on our financial position, results of operations or cash flow. Regardless of the outcome, litigation can have an adverse impact on us because of defense and settlement costs, diversion of management resources and other factors.
Indemnifications
In the ordinary course of business, we enter into contractual arrangements under which we agree to provide indemnification of varying scope and terms to business partners and other parties with respect to certain matters, including, but not limited to, losses arising out of the breach of such agreements and out of intellectual property infringement claims made by third parties. In addition, we have agreements that indemnify certain issuers of surety bonds against losses that they may incur as a result of executing surety bonds on our behalf. For our indemnification arrangements, payment may be conditional on the other party making a claim pursuant to the procedures specified in the particular contract. Further, our obligations under these agreements may be limited in terms of time and/or amount, and in some instances, we may have recourse against third parties for certain payments. In addition, we have indemnification agreements with certain of our directors and executive officers that require us, among other things, to indemnify them against certain liabilities that may arise by reason of their status or service as directors or officers. The terms of such obligations may vary.
122
Table of Contents
Note 18. Restructuring
On February 17, 2015, in connection with the February 2015 acquisition of Trulia, Zillow Group undertook a restructuring plan that resulted in a total workforce reduction of nearly 350 employees, primarily to eliminate overlapping positions in the sales and marketing functions related to Trulia’s workforce at its Bellevue, Denver, New York and San Francisco locations. The restructuring plan is a result of the integration of Trulia’s business and operations with and into Zillow Group’s business. Employees directly affected by the restructuring plan were provided with severance payments, stock vesting acceleration and outplacement assistance. Primarily as a result of the restructuring plan, Zillow Group recorded a restructuring charge of approximately $35.6 million during the year ended December 31, 2015, including approximately $12.2 million for severance and other personnel related expenses, approximately $8.2 million for contract termination costs associated with certain operating leases, and approximately $14.9 million of non-cash expenses relating to stock vesting acceleration or a reduced remaining requisite service period, for which share-based compensation expense is recognized over the remaining requisite service period, which in some cases may result in immediate expense recognition if no substantive future service is required. Zillow Group recognized certain contract termination costs primarily associated with Trulia’s Bellevue operating lease, as well as Zillow’s San Francisco operating lease, as Zillow’s employees in San Francisco were relocated into Trulia’s San Francisco office space. The restructuring costs for contract termination costs for the year ended December 31, 2015 include approximately $4.0 million, primarily related to the write-off of certain leasehold improvements.
In connection with our February 2015 acquisition of Trulia, we also assumed certain restructuring liabilities due to Trulia’s restructuring that commenced in June 2014 as an ongoing effort to fully integrate Market leader’s operations. The Market Leader restructuring resulted in a reduction of headcount of approximately 80 employees in 2014, as well as the recognition of certain contract termination costs associated with Trulia’s Bellevue and Denver operating leases. These restructuring liabilities were transferred in connection with the September 2015 divestiture of Market Leader.
A summary of accrued restructuring costs as of and for the year ended December 31, 2015 is shown in the table below (in thousands):
| One-Time Termination Benefits |
Contract Termination Costs |
Other Associated Costs |
Total | |||||||||||||
| Restructuring liabilities assumed in connection with February 2015 acquisition of Trulia |
$ | 81 | $ | 2,544 | $ | 136 | $ | 2,761 | ||||||||
| Restructuring costs |
11,933 | 1,508 | 315 | 13,756 | ||||||||||||
| Cash payments |
(12,111 | ) | (1,557 | ) | (580 | ) | (14,248 | ) | ||||||||
| Change in estimate |
97 | 2,285 | 129 | 2,511 | ||||||||||||
| Restructuring liabilities transferred in connection with September 2015 divestiture of Market Leader |
— | (4,611 | ) | — | (4,611 | ) | ||||||||||
|
|
|
|
|
|
|
|
|
|||||||||
| Accrued restructuring costs as of December 31, 2015 |
$ | — | $ | 169 | $ | — | $ | 169 | ||||||||
|
|
|
|
|
|
|
|
|
|||||||||
As of December 31, 2015, the restructuring plan is substantially complete.
123
Table of Contents
Note 19. Related Party Transactions
In February 2015, we paid approximately $0.3 million in filing fees directly to the Federal Trade Commission (the “FTC”), on behalf of and in connection with filings made by Mr. Richard Barton, our Executive Chairman, under the Hart-Scott-Rodino Antitrust Improvements Act of 1976 (“HSR Act”), which filings were required due to Mr. Barton’s ownership of Zillow, Inc.’s common stock. Also, in February 2015, we paid approximately $0.1 million in filing fees directly to the FTC, on behalf of and in connection with a filing made by Mr. Lloyd Frink, our Vice Chairman and President, under the HSR Act, which filing was required due to Mr. Frink’s ownership of Zillow, Inc.’s common stock.
During the year ended December 31, 2015, we paid or have payable a total of approximately $0.2 million and $0.2 million, respectively, to Mr. Frink and Mr. Barton for reimbursement of costs incurred by Mr. Frink and Mr. Barton for use of private planes by certain of the Company’s employees and Mr. Frink and Mr. Barton for business travel.
Note 20. Self-Insurance
We are self-insured for a portion of our medical and dental coverage for certain employees of Trulia. The medical plan carries a stop-loss policy, which will protect from individual claims during the plan year exceeding $100,000 or when cumulative medical claims exceed 125% of expected claims for the plan year. We record estimates of the total costs of claims incurred based on an analysis of historical data and independent estimates. Our liability for self-insured medical and dental claims is included within accrued compensation and benefits in our consolidated balance sheet and was $0.5 million as of December 31, 2015. We did not have any self-insurance prior to our February 2015 acquisition of Trulia.
Note 21. Employee Benefit Plan
Effective January 1, 2015, Zillow Group established a defined contribution 401(k) retirement plan covering employees who have met certain eligibility requirements (“the Zillow Group 401(k) Plan”). In addition, in connection with our February 2015 acquisition of Trulia, we adopted a defined contribution 401(k) retirement plan that covers Trulia and Market Leader employees who have met certain eligibility requirements (“the Trulia 401(k) Plan”). Eligible employees under each of the plans may contribute pretax compensation up to a maximum amount allowable under the Internal Revenue Service limitations. Employee contributions and earnings thereon vest immediately. We currently match up to 1.5% of employee contributions under the Zillow Group 401(k) Plan and up to 4% of employee contributions under the Trulia 401(k) Plan. The total expense related to defined contribution 401(k) retirement plans was $4.2 million for the year ended December 31, 2015. We did not have any expense related to defined contribution 401(k) retirement plans for the years ended December 31, 2014 or 2013.
Note 22. Segment Information and Revenue
We have one reportable segment. Our reportable segment has been identified based on how our chief operating decision-maker manages our business, makes operating decisions and evaluates operating performance. The chief executive officer acts as the chief operating decision-maker and reviews financial and operational information on an entity-wide basis. We have one business activity and there are no segment managers who are held accountable for operations, operating results or plans for levels or components. Accordingly, we have determined that we have a single reporting segment and operating unit structure.
124
Table of Contents
The chief executive officer reviews information about revenue categories, including marketplace revenue and display revenue. The following table presents our revenue categories during the periods presented (in thousands):
| Year Ended December 31, | ||||||||||||
| 2015 | 2014 | 2013 | ||||||||||
| Marketplace revenue: |
||||||||||||
| Real estate |
$ | 482,092 | $ | 239,039 | $ | 132,901 | ||||||
| Mortgages |
44,263 | 28,203 | 21,812 | |||||||||
| Market Leader |
29,549 | — | — | |||||||||
|
|
|
|
|
|
|
|||||||
| Total Marketplace revenue |
555,904 | 267,242 | 154,713 | |||||||||
| Display revenue |
88,773 | 58,651 | 42,832 | |||||||||
|
|
|
|
|
|
|
|||||||
| Total revenue |
$ | 644,677 | $ | 325,893 | $ | 197,545 | ||||||
|
|
|
|
|
|
|
|||||||
Note 23. Subsequent Events
On February 2, 2016, Zillow, Inc., Nectarine Merger Sub, Inc., a Delaware corporation and wholly owned subsidiary of Zillow, Inc. (“Merger Sub”), Naked Apartments, Inc., a Delaware corporation (“Naked Apartments”), and an individual acting as the stockholder representative, entered into an Agreement and Plan of Merger (the “Naked Apartments Merger Agreement”) providing for the acquisition of Naked Apartments by Zillow, Inc. Under the terms and subject to the conditions of the Naked Apartments Merger Agreement, Merger Sub will merge with and into Naked Apartments, with Naked Apartments remaining as the surviving company and a wholly owned subsidiary of Zillow, Inc. (the “Naked Apartments Merger”). Naked Apartments is New York City’s largest rentals-only platform. The purchase price will be approximately $13 million in cash, less certain transaction expenses and as adjusted at closing based on Naked Apartments’s net working capital, cash and debt. The acquisition of Naked Apartments, which is expected to close in the first quarter of 2016 subject to satisfaction of customary closing conditions, will be accounted for as a business combination, and assets acquired and liabilities assumed will be recorded at their estimated fair values as of the closing date of the Naked Apartments Merger.
125
Table of Contents
Item 9. Changes in and Disagreements with Accountants on Accounting and Financial Disclosure
None.
Item 9A. Controls and Procedures
Evaluation of Disclosure Controls and Procedures
The Company carried out an evaluation, with the participation of our management, and under the supervision of our Chief Executive Officer and Chief Financial Officer, of the effectiveness of our disclosure controls and procedures (as defined under Rule 13a-15(e) and Rule 15d-15(e) under the Exchange Act) as of the end of the period covered by this report. Based upon that evaluation, our Chief Executive Officer and Chief Financial Officer concluded that our disclosure controls and procedures were effective as of December 31, 2015.
Management’s Report on Internal Control Over Financial Reporting
Our management is responsible for establishing and maintaining adequate internal control over financial reporting, as such term is defined under Rule 13a-15(f) under the Exchange Act. Under the supervision and with the participation of our management, including our Chief Executive Officer and Chief Financial Officer, we conducted an evaluation of the effectiveness of our internal control over financial reporting based on the framework in Internal Control – Integrated Framework issued by the Committee of Sponsoring Organizations of the Treadway Commission (2013 framework). Based on our evaluation, our management concluded that our internal control over financial reporting was effective as of December 31, 2015.
We intend to regularly review and evaluate the design and effectiveness of our disclosure controls and procedures and internal control over financial reporting on an ongoing basis and to improve these controls and procedures over time and to correct any deficiencies that we may discover in the future. While we believe the present design of our disclosure controls and procedures and internal control over financial reporting are effective, future events affecting our business may cause us to modify our controls and procedures.
The Company’s independent registered public accounting firm has issued an attestation report regarding its assessment of the effectiveness of the Company’s internal control over financial reporting as of December 31, 2015.
Changes in Internal Control over Financial Reporting
As a result of our February 2015 acquisition of Trulia, the Company implemented internal controls over significant processes specific to the acquisition that management believes are appropriate in consideration of related integration. As of the date of this Annual Report on Form 10-K, we have integrated Trulia and its subsidiaries into our overall internal controls over financial reporting.
Except as described above, there were no changes in our internal control over financial reporting identified in connection with the evaluation required by Rule 13a-15(d) and 15d-15(d) of the Exchange Act that occurred during the three months ended December 31, 2015 that have materially affected, or are reasonably likely to materially affect, our internal control over financial reporting.
126
Table of Contents
REPORT OF INDEPENDENT REGISTERED PUBLIC ACCOUNTING FIRM
The Board of Directors and Shareholders of Zillow Group, Inc.
We have audited Zillow Group, Inc.’s internal control over financial reporting as of December 31, 2015, based on criteria established in Internal Control—Integrated Framework issued by the Committee of Sponsoring Organizations of the Treadway Commission (2013 framework) (the COSO criteria). Zillow Group, Inc.’s management is responsible for maintaining effective internal control over financial reporting, and for its assessment of the effectiveness of internal control over financial reporting included in the accompanying Management’s Report on Internal Control Over Financial Reporting. Our responsibility is to express an opinion on the company’s internal control over financial reporting based on our audit.
We conducted our audit in accordance with the standards of the Public Company Accounting Oversight Board (United States). Those standards require that we plan and perform the audit to obtain reasonable assurance about whether effective internal control over financial reporting was maintained in all material respects. Our audit included obtaining an understanding of internal control over financial reporting, assessing the risk that a material weakness exists, testing and evaluating the design and operating effectiveness of internal control based on the assessed risk, and performing such other procedures as we considered necessary in the circumstances. We believe that our audit provides a reasonable basis for our opinion.
A company’s internal control over financial reporting is a process designed to provide reasonable assurance regarding the reliability of financial reporting and the preparation of financial statements for external purposes in accordance with generally accepted accounting principles. A company’s internal control over financial reporting includes those policies and procedures that (1) pertain to the maintenance of records that, in reasonable detail, accurately and fairly reflect the transactions and dispositions of the assets of the company; (2) provide reasonable assurance that transactions are recorded as necessary to permit preparation of financial statements in accordance with generally accepted accounting principles, and that receipts and expenditures of the company are being made only in accordance with authorizations of management and directors of the company; and (3) provide reasonable assurance regarding prevention or timely detection of unauthorized acquisition, use, or disposition of the company’s assets that could have a material effect on the financial statements.
Because of its inherent limitations, internal control over financial reporting may not prevent or detect misstatements. Also, projections of any evaluation of effectiveness to future periods are subject to the risk that controls may become inadequate because of changes in conditions, or that the degree of compliance with the policies or procedures may deteriorate.
In our opinion, Zillow Group, Inc. maintained, in all material respects, effective internal control over financial reporting as of December 31, 2015, based on the COSO criteria.
We also have audited, in accordance with the standards of the Public Company Accounting Oversight Board (United States), the consolidated balance sheets of Zillow Group, Inc. as of December 31, 2015 and 2014, and the related consolidated statements of operations, comprehensive loss, shareholders’ equity and cash flows for each of the three years in the period ended December 31, 2015 of Zillow Group, Inc., and our report dated February 12, 2016 expressed an unqualified opinion thereon.
/s/ Ernst & Young LLP
Seattle, Washington
February 12, 2016
127
Table of Contents
None.
128
Table of Contents
PART III
Item 10. Directors, Executive Officers and Corporate Governance
The information required by this item is incorporated by reference to the Company’s definitive proxy statement relating to the 2016 annual meeting of shareholders. The definitive proxy statement will be filed with the Securities and Exchange Commission within 120 days after the end of the 2015 fiscal year.
We have adopted a Code of Ethics that applies to our Chief Executive Officer, Chief Financial Officer, principal accounting officer and controller and persons performing similar functions. The Code of Ethics is posted on our website at http://investors.zillowgroup.com/corporate-governance.cfm. We intend to satisfy the disclosure requirements under Item 5.05 of Form 8-K regarding an amendment to, or waiver from, a provision of the Code of Ethics by posting such information on our website at the address specified above.
Item 11. Executive Compensation
The information required by this item is incorporated by reference to the Company’s definitive proxy statement relating to the 2016 annual meeting of shareholders. The definitive proxy statement will be filed with the Securities and Exchange Commission within 120 days after the end of the 2015 fiscal year.
Item 12. Security Ownership of Certain Beneficial Owners and Management and Related Stockholder Matters
The information required by this item is incorporated by reference to the Company’s definitive proxy statement relating to the 2016 annual meeting of shareholders. The definitive proxy statement will be filed with the Securities and Exchange Commission within 120 days after the end of the 2015 fiscal year.
Item 13. Certain Relationships and Related Transactions, and Director Independence
The information required by this item is incorporated by reference to the Company’s definitive proxy statement relating to the 2016 annual meeting of shareholders. The definitive proxy statement will be filed with the Securities and Exchange Commission within 120 days after the end of the 2015 fiscal year.
Item 14. Principal Accountant Fees and Services
The information required by this item is incorporated by reference to the Company’s definitive proxy statement relating to the 2016 annual meeting of shareholders. The definitive proxy statement will be filed with the Securities and Exchange Commission within 120 days after the end of the 2015 fiscal year.
129
Table of Contents
PART IV
Item 15. Exhibits and Financial Statement Schedules
(a)(1) Financial Statements
We have filed the financial statements listed in the Index to Consolidated Financial Statements as a part of this Annual Report on Form 10-K.
(a)(2) Financial Statement Schedules
All financial statement schedules have been omitted because they are not applicable, not material or the required information is presented in the financial statements or the notes thereto.
(a)(3) Exhibits
The list of exhibits included in the Exhibit Index to this Annual Report on Form 10-K is incorporated herein by reference.
130
Table of Contents
Pursuant to the requirements of Section 13 or 15(d) of the Securities Exchange Act of 1934, the registrant has duly caused this report to be signed on its behalf by the undersigned, thereunto duly authorized.
| ZILLOW GROUP, INC. | ||||
| Date: February 12, 2016 | By: | /S/ KATHLEEN PHILIPS | ||
| Name: | Kathleen Philips | |||
| Title: | Chief Financial Officer, Chief Legal Officer, and Secretary | |||
Pursuant to the requirements of the Securities Exchange Act of 1934, this report has been signed below by the following persons on behalf of the registrant and in the capacities indicated below on February 12, 2016.
| Signature |
Title | |
| /s/ SPENCER M. RASCOFF Spencer M. Rascoff |
Chief Executive Officer (Principal Executive Officer) and Director | |
| /s/ KATHLEEN PHILIPS Kathleen Philips |
Chief Financial Officer, Chief Legal Officer, and Secretary (Principal Financial and Accounting Officer) | |
| /s/ RICHARD BARTON Richard Barton |
Executive Chairman and Director | |
| /s/ LLOYD D. FRINK Lloyd D. Frink |
Vice Chairman, President and Director | |
| /s/ ERIK BLACHFORD Erik Blachford |
Director | |
| /s/ PETER FLINT Peter Flint |
Director | |
| /s/ JAY C. HOAG Jay C. Hoag |
Director | |
| /s/ GREGORY B. MAFFEI Gregory B. Maffei |
Director | |
| /s/ GORDON STEPHENSON Gordon Stephenson |
Director | |
| /s/ GREGORY WALDORF Gregory Waldorf |
Director | |
131
Table of Contents
EXHIBIT INDEX
Certain of the following exhibits have heretofore been filed with the Securities and Exchange Commission and are incorporated by reference from the documents described in parentheses. Certain others are filed herewith. The exhibits are numbered in accordance with Item 601 of Regulation S-K. In reviewing the agreements included as exhibits to this Annual Report on Form 10-K, please remember that they are included to provide you with information regarding their terms and are not intended to provide any other factual or disclosure information about the Company or the other parties to the agreement. The agreements may contain representations and warranties by each of the parties to the applicable agreement. These representations and warranties have been made solely for the benefit of the other party or parties to the applicable agreement and (i) should not in all instances be treated as categorical statements of fact, but rather as a means of allocating the risk to one of the parties if those statements prove to be inaccurate; (ii) may have been qualified by disclosures that were made to the other party or parties in connection with the negotiation of the applicable agreement, which disclosures are not necessarily reflected in the agreement; (iii) may apply standards of materiality in a manner that is different from what may be viewed as material to you or other investors; and (iv) were made only as of the date of the applicable agreement or other date or dates that may be specified in the agreement and are subject to more recent developments. Accordingly, these representations and warranties may not describe the actual state of affairs as of the date they were made or at any other time. Additional information about the Company may be found elsewhere in this Annual Report on Form 10-K and the Company’s other public filings, which are available without charge through the SEC’s website at http://www.sec.gov.
| Exhibit |
Description | |
| 2.1+ | Agreement and Plan of Merger, dated August 16, 2013, by and among Zillow, Inc., NMD Interactive, Inc., d/b/a StreetEasy, Strawberry Acquisition, Inc. and Shareholder Representative Services LLC (Filed as Exhibit 2.1 to Zillow, Inc.’s Current Report on Form 8-K filed with the Securities and Exchange Commission on August 19, 2013, and incorporated herein by reference). | |
| 2.2+ | Agreement and Plan of Merger, dated July 28, 2014, by and among Zillow, Inc., the Company (f/k/a Zebra Holdco, Inc.) and Trulia, Inc. (Filed as Exhibit 2.1 to Zillow, Inc.’s Current Report on Form 8-K filed with the Securities and Exchange Commission (File No. 001-35237) on July 29, 2014, and incorporated herein by reference). | |
| 3.1 | Amended and Restated Articles of Incorporation of Zillow Group, Inc. (Filed as Exhibit 3.1 to Registrant’s Current Report on Form 8-K filed with the Securities and Exchange Commission on February 17, 2015, and incorporated herein by reference). | |
| 3.2 | Amended and Restated Bylaws of Zillow Group, Inc. (Filed as Exhibit 3.2 to Registrant’s Current Report on Form 8-K filed with the Securities and Exchange Commission on February 17, 2015, and incorporated herein by reference). | |
| 4.1 | Specimen of Class A Common Stock Certificate (Filed as Exhibit 4.1 to Registrant’s Quarterly Report on Form 10-Q filed on May 12, 2015, and incorporated herein by reference). | |
| 4.2 | Specimen of Class C Capital Stock Certificate (Filed as Exhibit 4.1 Registrant’s Form 8-A filed with the Securities and Exchange Commission on July 29, 2015, and incorporated herein by reference). | |
| 4.3 | Indenture, dated as of December 17, 2013, between Trulia, Inc. And Wells Fargo Bank, National Association, as trustee (Filed as Exhibit 4.1 to Trulia, Inc.’s Current Report on Form 8-K filed with the Securities and Exchange Commission (File No. 001-35650) on December 17, 2013, and incorporated herein by reference). | |
| 4.4 | Form of Note for Trulia, Inc.’s 2.75% Convertible Senior Notes due 2020 (incorporated by reference to Exhibit 4.3 hereto). | |
| 4.5 | Supplemental Indenture, dated as of February 17, 2015, among Zillow Group, Inc., Trulia, Inc. and Wells Fargo Bank, National Association, as trustee (Filed as Exhibit 4.2 to Registrant’s Current Report on Form 8-K12B filed with the Securities and Exchange Commission on February 17, 2015, and incorporated herein by reference). | |
132
Table of Contents
| Exhibit |
Description | |
| 4.6 | Second Supplemental Indenture, dated as of December 30, 2015, among Zillow Group, Inc., Trulia, Inc. and Wells Fargo Bank, National Association, as trustee (Filed as Exhibit 4.1 to Registrant’s Current Report on Form 8-K filed with the Securities and Exchange Commission on December 30, 2015, and incorporated herein by reference). | |
| 4.7 | Transfer Restriction Agreement and Amendment to Noncompetition Agreement, dated July 20, 2015, among Zillow Group, Inc., Zillow, Inc., Richard Barton and the other holders signatory thereto (Filed as Exhibit 10.1 to Registrant’s Current Report on Form 8-K filed with the Securities and Exchange Commission on July 21, 2015, and incorporated herein by reference). | |
| 4.8 | Transfer Restriction Agreement and Amendment to Noncompetition Agreement, dated July 20, 2015, among Zillow Group, Inc., Zillow, Inc., Lloyd Frink and the other holders signatory thereto (Filed as Exhibit 10.2 to Registrant’s Current Report on Form 8-K filed with the Securities and Exchange Commission on July 21, 2015, and incorporated herein by reference). | |
| 10.1* | Zillow, Inc. Amended and Restated 2005 Equity Incentive Plan (Filed as Exhibit 10.5 to Zillow, Inc.’s Amendment No. 3 to Registration Statement on Form S-1 filed with the Securities and Exchange Commission (SEC File No. 333-173570) on June 20, 2011, and incorporated herein by reference). | |
| 10.2* | Form of Stock Option Grant Notice and Stock Option Agreement under the Zillow, Inc. Amended and Restated 2005 Equity Incentive Plan (Filed as Exhibit 10.6 to Zillow, Inc.’s Registration Statement on Form S-1 filed with the Securities and Exchange Commission (SEC File No. 333-173570) filed on April 18, 2011, and incorporated herein by reference). | |
| 10.3* | Market Leader, Inc. Amended and Restated 2004 Equity Incentive Plan (Filed as Appendix A to Market Leader, Inc.’s Definitive Proxy Statement on Schedule 14A filed with the Securities Exchange Commission (SEC File No. 000-51032) on April 10, 2009, and incorporated herein by reference). | |
| 10.4* | Trulia, Inc. 2005 Stock Incentive Plan, as amended, and form of Stock Option Agreement and form of Stock Option Grant Notice thereunder (Filed as Exhibit 10.2 to Trulia, Inc.’s Form S-1 filed with the Securities and Exchange Commission (SEC File No. 333-183364) on August 17, 2012, and incorporated herein by reference). | |
| 10.5* | Zillow, Inc. Amended and Restated 2011 Equity Incentive Plan (Filed as Appendix A to Zillow, Inc.’s Definitive Proxy Statement filed with the Securities and Exchange Commission (SEC File No. 001-35237) on April 17, 2012, and incorporated herein by reference). | |
| 10.6* | Amendment No. 1 to the Zillow, Inc. Amended and Restated 2011 Incentive Plan (Filed as Appendix A to Zillow, Inc.’s Definitive Proxy Statement filed with the Securities and Exchange Commission (SEC File No. 001-35237) on April 16, 2013, and incorporated herein by reference). | |
| 10.7* | Form of Stock Option Grant Notice and Stock Option Agreement under the Zillow, Inc. 2011 Incentive Plan (Filed as Exhibit 10.3 to Zillow, Inc.’s Amendment No. 3 to Registration Statement on Form S-1 filed with the Securities and Exchange Commission (SEC File No. 333-173570) on June 20, 2011, and incorporated herein by reference). | |
| 10.8* | Form of Restricted Stock Unit Award Notice and Restricted Stock Unit Award Agreement under the Zillow, Inc. Amended and Restated 2011 Incentive Plan (Filed as Exhibit 10.2 to Zillow, Inc.’s Form 10-Q filed with the Securities and Exchange Commission on May 8, 2014, and incorporated herein by reference). | |
| 10.9* | Form of Restricted Unit Award Notice and Restricted Unit Award Agreement under the Zillow, Inc. Amended and Restated 2011 Incentive Plan (Filed as Exhibit 10.3 to Zillow, Inc.’s Form 10-Q filed with the Securities and Exchange Commission on May 8, 2014, and incorporated herein by reference). | |
| 10.10* | Amended and Restated Stock Option Grant Program for Nonemployee Directors under the Zillow, Inc. Amended and Restated 2011 Incentive Plan (Filed as Exhibit 10.11 to Registrant’s Quarterly Report on Form 10-Q filed on May 12, 2015, and incorporated herein by reference). | |
| 10.11* | Form of Stock Option Grant Notice and Stock Option Agreement under the Zillow, Inc. Amended and Restated 2011 Incentive Plan (Assumed by Registrant; Filed as Exhibit 10.12 to Registrant’s Quarterly Report on Form 10-Q filed on May 12, 2015, and incorporated herein by reference). | |
133
Table of Contents
| Exhibit |
Description | |
| 10.12* | Form of Restricted Stock Unit Award Notice and Restricted Stock Unit Award Agreement under the Zillow, Inc. Amended and Restated 2011 Incentive Plan (Assumed by Registrant; Filed as Exhibit 10.13 to Registrant’s Quarterly Report on Form 10-Q filed on May 12, 2015, and incorporated herein by reference). | |
| 10.13* | Trulia, Inc. 2012 Equity Incentive Plan, as amended and restated (Filed as Exhibit 10.1 to Trulia, Inc.’s Form 10-Q filed with the Securities and Exchange Commission (File No. 001-35650) on August 12, 2013, and incorporated herein by reference). | |
| 10.14* | Form of Nonqualified Stock Option Grant Notice and Stock Option Agreement under the Trulia, Inc. 2012 Equity Incentive Plan (Assumed by Registrant; Filed as Exhibit 10.15 to Registrant’s Quarterly Report on Form 10-Q filed on May 12, 2015, and incorporated herein by reference). | |
| 10.15* | Form of Restricted Stock Unit Award Notice and Restricted Stock Unit Award Agreement under the Trulia, Inc. 2012 Equity Incentive Plan (Assumed by Registrant; Filed as Exhibit 10.16 to Registrant’s Quarterly Report on Form 10-Q filed on May 12, 2015, and incorporated herein by reference). | |
| 10.16* | Executive Employment Agreement by and between Spencer M. Rascoff and Zillow, Inc. (Filed as Exhibit 10.14 to Zillow, Inc.’s Amendment No. 1 to Registration Statement on Form S-1 filed with the Securities and Exchange Commission (SEC File No. 333-173570) on May 23, 2011, and incorporated herein by reference). | |
| 10.17* | Executive Employment Agreement by and between Chad M. Cohen and Zillow, Inc. (Filed as Exhibit 10.15 to Zillow, Inc.’s Amendment No. 1 to Registration Statement on Form S- 1 filed with the Securities and Exchange Commission (SEC File No. 333-173570) on May 23, 2011, and incorporated herein by reference). | |
| 10.18* | Executive Employment Agreement by and between Kathleen Philips and Zillow, Inc. (Filed as Exhibit 10.16 to Zillow, Inc.’s Amendment No. 1 to Registration Statement on Form S-1 filed with the Securities and Exchange Commission (SEC File No. 333-173570) on May 23, 2011, and incorporated herein by reference). | |
| 10.19* | Employment Offer Letter, dated October 17, 2011, between Trulia, Inc. and Prashant “Sean” Aggarwal (Filed as Exhibit 10.6 to Trulia, Inc.’s Form S-1 filed with the Securities and Exchange Commission (SEC File No. 333-183364) on August 17, 2012, and incorporated herein by reference). | |
| 10.20* | Employment Offer Letter, dated October 17, 2011, between Trulia, Inc. and Scott Darling (Filed as Exhibit 10.8 to Trulia, Inc.’s Form S-1 filed with the Securities and Exchange Commission (SEC File No. 333-183364) on August 17, 2012, and incorporated herein by reference). | |
| 10.21* | Confirmatory Employment Letter, dated August 3, 2012, between Trulia, Inc. and Daniele Farnedi (Filed as Exhibit 10.9 to Trulia, Inc.’s Form S-1 filed with the Securities and Exchange Commission (SEC File No. 333-183364) on August 17, 2012, and incorporated herein by reference). | |
| 10.22* | Confirmatory Employment Letter, dated August 3, 2012, between Trulia, Inc. and Peter Flint (Filed as Exhibit 10.5 to Trulia, Inc.’s Form S-1 filed with the Securities and Exchange Commission (SEC File No. 333-183364) on August 17, 2012, and incorporated herein by reference). | |
| 10.23* | Amended and Restated Executive Employment Agreement by and between Errol Samuelson and Zillow, Inc. (Filed as Exhibit 10.1 to Zillow, Inc.’s Quarterly Report on Form 10-Q filed with the Securities and Exchange Commission on May 8, 2014, and incorporated herein by reference). | |
| 10.24* | Letter Agreement dated June 16, 2014 by and between Zillow, Inc. and Greg M. Schwartz (Filed as Exhibit 10.1 to Zillow, Inc.’s Current Report on Form 8-K filed with the Securities and Exchange Commission on June 18, 2014, and incorporated herein by reference). | |
| 10.25* | Letter Agreement dated April 23, 2015 by and between Zillow Group, Inc. and Greg M. Schwartz (Filed as Exhibit 10.1 to Registrant’s Current Report on Form 8-K filed with the Securities and Exchange Commission on April 28, 2015, and incorporated herein by reference). | |
| 10.26* | Amended and Restated Letter Agreement dated August 3, 2015, by and between Zillow Group, Inc. and Greg M. Schwartz (Filed as Exhibit 10.1 to Registrant’s Current Report on Form 8-K filed with the Securities and Exchange Commission on August 3, 2015, and incorporated herein by reference). | |
134
Table of Contents
| Exhibit |
Description | |
| 10.27* | Executive Employment Agreement, dated February 17, 2015, between Paul Levine and Zillow Group, Inc. (Filed as Exhibit 10.8 to Registrant’s Current Report on Form 8-K12B filed with the Securities and Exchange Commission on February 17, 2015, and incorporated herein by reference). | |
| 10.28* | Transition Employment Letter Agreement, dated February 17, 2015, by and between Peter Flint and Zillow Group, Inc. (Filed as Exhibit 10.27 to Registrant’s Quarterly Report on Form 10-Q filed on May 12, 2015, and incorporated herein by reference). | |
| 10.29* | Form of Confidential Information, Inventions, and Nonsolicitation Agreement for certain officers of Zillow, Inc. (Filed as Exhibit 10.4 to Zillow, Inc.’s Quarterly Report on Form 10-Q filed with the Securities and Exchange Commission on May 8, 2014, and incorporated herein by reference). | |
| 10.30* | Forms of Confidential Information, Inventions, Nonsolicitation and Noncompetition Agreement for the Officers of Zillow Group, Inc. (Filed as Exhibit 10.29 to Registrant’s Quarterly Report on Form 10-Q filed on May 12, 2015, and incorporated herein by reference). | |
| 10.31* | Form of Indemnification Agreement between Zillow Group, Inc. and each of its directors and executive officers (Filed as Exhibit 10.9 to Registrant’s Current Report on Form 8-K12B filed with the Securities and Exchange Commission on February 17, 2015, and incorporated herein by reference). | |
| 10.32* | Zillow Group, Inc. Amended and Restated 2011 Incentive Plan (Filed as Exhibit 10.1 to Registrant’s Quarterly Report on Form 10-Q filed on August 5, 2015, and incorporated herein by reference). | |
| 10.33* | Form of Stock Option Grant Notice and Stock Option Agreement under the Zillow Group, Inc. Amended and Restated 2011 Incentive Plan (Filed as Exhibit 10.2 to Registrant’s Quarterly Report on Form 10-Q filed on August 5, 2015, and incorporated herein by reference). | |
| 10.34* | Form of Restricted Stock Unit Award Notice and Restricted Stock Unit Award Agreement under the Zillow Group, Inc. Amended and Restated 2011 Incentive Plan (Filed as Exhibit 10.3 to Registrant’s Quarterly Report on Form 10-Q filed on August 5, 2015, and incorporated herein by reference). | |
| 10.35* |
Trulia, Inc. SMT Bonus Plan (Filed as Exhibit 10.4 to Trulia, Inc.’s Form S-1 filed with the Securities and Exchange Commission (SEC File No. 333-183364) on August 17, 2012, and incorporated herein by reference). | |
| 10.36 | Multi-Tenant Office Lease, dated January 24, 2011, between Trulia, Inc. and LBA Realty Fund II—WBP III, LLC (Filed as Exhibit 10.16 to Trulia, Inc.’s Form S-1 filed with the Securities and Exchange Commission on August 17, 2012, and incorporated herein by reference). | |
| 10.37 | First Amendment to Multi-Tenant Office Lease, dated August 31, 2012, between Trulia, Inc. and LBA Realty Fund II—WBP III, LLC (Filed as Exhibit 10.17 to Trulia, Inc.’s Form S-1/A filed with the Securities and Exchange Commission on September 19, 2012, and incorporated herein by reference). | |
| 10.38 | Office Lease between The Northwestern Mutual Life Insurance Company and Zillow, Inc. dated March 22, 2011 (Filed as Exhibit 10.10 to Zillow, Inc.’s Registration Statement on Form S-1 (SEC File No. 333-173570) filed on April 18, 2011, and incorporated herein by reference). | |
| 10.39 | Amendment to Office Lease by and between FSP-RIC LLC and Zillow, Inc., dated as of June 27, 2012 (Filed as Exhibit 10.1 to Zillow, Inc.’s Current Report on Form 8-K filed with the Securities and Exchange Commission on June 29, 2012, and incorporated herein by reference). | |
| 10.40 | Second Amendment to Lease by and between FSP-RIC, LLC and Zillow, Inc., dated as of April 16, 2013 (Filed as Exhibit 10.1 to Zillow, Inc.’s Current Report on Form 8-K filed with the Securities and Exchange Commission on April 22, 2013, and incorporated herein by reference). | |
| 10.41 | Third Amendment to Lease by and between FSP-RIC, LLC and Zillow, Inc., dated as of January 10, 2014 (Filed as Exhibit 10.10 to Zillow, Inc.’s Form 10-K filed with the Securities and Exchange Commission on February 18, 2014, and incorporated herein by reference). | |
| 10.42 | Fourth Amendment to Lease by and between FSP-RIC, LLC and Zillow, Inc., dated as of May 2, 2014 (Filed as Exhibit 10.1 to Zillow, Inc.’s Quarterly Report on Form 10-Q filed with the Securities and Exchange Commission on August 6, 2014, and incorporated herein by reference). | |
135
Table of Contents
| Exhibit |
Description | |
| 10.43 | Fifth Amendment to Lease by and between FSP-RIC, LLC and Zillow, Inc., dated as of November 19, 2014 (Filed as Exhibit 10.1 to Zillow, Inc.’s Current Report on Form 8-K filed with the Securities and Exchange Commission on November 24, 2014, and incorporated herein by reference). | |
| 10.44 | Lease, dated March 10, 2014, between Trulia and BXP Mission 535 LLC (Filed as Exhibit 10.1 to Trulia, Inc.’s Quarterly Report on Form 10-Q filed with the Securities and Exchange Commission on May 2, 2014, and incorporated herein by reference). | |
| 10.45 | Amendment to Office Lease, dated July 25, 2014, between Trulia and BXP Mission 535 LLC (Filed as Exhibit 10.1 to Trulia, Inc.’s Form 10-Q filed with the Securities and Exchange Commission on August 8, 2014, and incorporated herein by reference). | |
| 10.46† | Platform Services Agreement, dated April 7, 2011, by and between Zillow, Inc. and Threewide Corporation (Filed as Exhibit 10.18 to Zillow, Inc.’s Annual Report on Form 10-K filed with the Securities and Exchange Commission on February 22, 2013, and incorporated herein by reference). | |
| 10.47† | Platform Services Agreement, dated June 19, 2012, between Trulia, Inc. and Move Sales, Inc. (Filed as Exhibit 10.13 to Trulia, Inc.’s Registration Statement on Form S-1/A filed with the Securities and Exchange Commission on September 19, 2012, and incorporated herein by reference). | |
| 21.1 | Subsidiaries of Zillow Group, Inc. | |
| 23.1 | Consent of independent registered public accounting firm. | |
| 31.1 | Certification of Chief Executive Officer pursuant to Rule 13-14(a) of the Securities Exchange Act of 1934 as adopted pursuant to Section 302 of the Sarbanes-Oxley Act of 2002. | |
| 31.2 | Certification of Chief Financial Officer pursuant to Rule 13-14(a) of the Securities Exchange Act of 1934 as adopted pursuant to Section 302 of the Sarbanes-Oxley Act of 2002. | |
| 32.1 | Certification of Chief Executive Officer Pursuant to 18 U.S.C. Section 1350 as adopted pursuant to Section 906 of the Sarbanes-Oxley Act of 2002. | |
| 32.2 | Certification of Chief Financial Officer Pursuant to 18 U.S.C. Section 1350 as adopted pursuant to Section 906 of the Sarbanes-Oxley Act of 2002. | |
| 101.INS | XBRL Instance Document. | |
| 101.SCH | XBRL Taxonomy Extension Schema Document. | |
| 101.CAL | XBRL Taxonomy Extension Calculation Linkbase Document. | |
| 101.DEF | XBRL Taxonomy Extension Definition Linkbase Document. | |
| 101.LAB | XBRL Taxonomy Extension Label Linkbase Document. | |
| 101.PRE | XBRL Taxonomy Extension Presentation Linkbase Document. | |
| + | Schedules omitted pursuant to Item 601(b)(2) of Regulation S-K. Zillow Group agrees to furnish a supplemental copy of any omitted schedule to the Securities and Exchange Commission upon request. |
| * | Indicates a management contract or compensatory plan or arrangement. |
| † | Portions of this exhibit have been omitted pursuant to a confidential treatment order by the Securities and Exchange Commission. |
136