Attached files
Use these links to rapidly review the document
TABLE OF CONTENTS
PART IV
UNITED STATES SECURITIES AND EXCHANGE COMMISSION
Washington, DC 20549
FORM 10-K
ANNUAL REPORT PURSUANT TO
SECTION 13 OR 15(d) OF
THE SECURITIES EXCHANGE ACT OF 1934
For the Fiscal Year Ended December 31, 2015
Commission File Number 1-5794
MASCO CORPORATION
(Exact name of Registrant
as Specified in its Charter)
| Delaware | 38-1794485 | |
| (State of Incorporation) | (I.R.S. Employer Identification No.) | |
| 21001 Van Born Road, Taylor, Michigan | 48180 | |
| (Address of Principal Executive Offices) | (Zip Code) |
Registrant's telephone number, including area code: 313-274-7400
Securities Registered Pursuant to Section 12(b) of the Act:
| Title of Each Class | Name of Each Exchange On Which Registered |
|
|---|---|---|
| Common Stock, $1.00 par value | New York Stock Exchange, Inc. |
Securities Registered Pursuant to Section 12(g) of the Act:
None
Indicate by check mark if the registrant is a well-known seasoned issuer, as defined in Rule 405 of the Securities Act. Yes þ No o
Indicate by check mark if the registrant is not required to file reports pursuant to Section 13 or Section 15(d) of the Act. Yes o No þ
Indicate by check mark whether the Registrant: (1) has filed all reports required to be filed by Section 13 or 15(d) of the Securities Exchange Act of 1934 during the preceding 12 months (or for such shorter period that the registrant was required to file such reports), and (2) has been subject to such filing requirements for the past 90 days. Yes þ No o
Indicate by check mark whether the registrant has submitted electronically and posted on its corporate Web site, if any, every Interactive Data File required to be submitted and posted pursuant to Rule 405 of Regulation S-T during the preceding 12 months (or such shorter period that the registrant was required to submit and post such files). Yes þ No o
Indicate by check mark if disclosure of delinquent filers pursuant to Item 405 of Regulation S-K is not contained herein, and will not be contained, to the best of Registrant's knowledge, in definitive proxy or information statements incorporated by reference in Part III of this Form 10-K or any amendment to this Form 10-K. þ
Indicate by check mark whether the registrant is a large accelerated filer, an accelerated filer, a non-accelerated filer, or a smaller reporting company. See the definitions of "large accelerated filer," "accelerated filer" and "smaller reporting company" in Rule 12b-2 of the Exchange Act. (Check one):
| Large accelerated filer þ | Accelerated filer o | Non-accelerated filer o (Do not check if a smaller reporting company) |
Smaller reporting company o |
Indicate by check mark whether the registrant is a shell company (as defined in Rule 12b-2 of the Exchange Act). Yes o No þ
The aggregate market value of the Registrant's Common Stock held by non-affiliates of the Registrant on June 30, 2015 (based on the closing sale price of $26.67 of the Registrant's Common Stock, as reported by the New York Stock Exchange on such date) was approximately $9,059,896,000.
Number of shares outstanding of the Registrant's Common Stock at January 31, 2016:
333,931,600 shares of Common Stock, par value $1.00 per share
DOCUMENTS INCORPORATED BY REFERENCE
Portions of the Registrant's definitive Proxy Statement to be filed for its 2016 Annual Meeting of Stockholders are incorporated by reference into Part III of this Form 10-K.
Masco Corporation
2015 Annual Report on Form 10-K
1
Masco Corporation is a global leader in the design, manufacture, marketing and distribution of branded home improvement and building products. Our portfolio of industry-leading brands includes KRAFTMAID® and MERILLAT® cabinets; DELTA®, PEERLESS®, and HANSGROHE® faucets, bath and shower fixtures; HOT SPRING® and CALDERA® spas; BEHR® paint, primer and stain; KILZ® primer; LIBERTY® and BRAINERD® decorative hardware; and MILGARD® windows and doors. We leverage our powerful brands across product categories, sales channels and geographies to create value for our customers and shareholders.
During 2015, we further advanced our strategy to position the Company for future growth by focusing on three strategic pillars: driving the full potential of our core businesses, leveraging opportunities across our businesses, and actively managing our portfolio. We achieved gains in each of these areas.
First, to drive the full potential of our core businesses, we pursued sales growth opportunities in adjacent markets and products, continued the deployment of standardized operating tools across the enterprise, executed cost saving initiatives and expanded our implementation of lean principles and process improvements in many areas, including production and functional support processes.
We also continued to leverage the collective strength of our enterprise, the second pillar of our strategy. We provided new assignments to selected leaders across our business units to further develop talent and facilitate operational improvements. We continued to realize supply chain efficiencies through strategic sourcing, and we continued to share best practices across all of our functional departments to enhance productivity. As a result, our operating results (excluding the impact of foreign currency translation) improved across all of our segments, particularly at our U.S. cabinets business.
The third pillar of our strategy is to actively manage our portfolio. On June 30, 2015, we completed the spin off of our Installation and Other Services businesses into an independent, publicly-traded, company, TopBuild Corp., through a tax-free distribution to our shareholders. As a result of the spin off, our business has become less dependent on new home construction, and is, therefore, less cyclical, and a greater portion of our sales are derived from international markets. In addition, we acquired two businesses in 2015 that complement our existing portfolio. First, we expanded our product offering and distribution channels into the aquatic fitness category with the acquisition of the ENDLESS POOLS® brand. We also acquired Evolution Manufacturing, which expands our offering of fiberglass and composite windows in the United Kingdom. To further enhance value creation for our shareholders, during 2015 we repurchased over 17 million shares of our common stock and increased our quarterly dividend by approximately 6 percent.
We believe that the actions we took during 2015 have positioned our company for further enhancement of shareholder value. We also believe that completion of the spin off allows us to pursue a more focused strategy of growth. We will continue to actively manage our portfolio, identify growth opportunities in key industries and produce new products that differentiate us in the marketplace by combining design and innovation. By continuing our disciplined execution of our strategy, we believe that we will increase shareholder value.
Our Business Segments
We report our financial results in four business segments aggregated by similarity in products and services. The following table sets forth the contribution of our segments to net sales and operating profit (loss) for the three years ended December 31, 2015. Additional financial information concerning our operations by segment and by geographic regions, as well as general corporate expense, net, as of and
2
for the three years ended December 31, 2015, is set forth in Note P to our consolidated financial statements included in Item 8 of this Report.
| |
|
(In Millions) |
||||||||
|---|---|---|---|---|---|---|---|---|---|---|
| |
Net Sales (1) | |||||||||
| |
2015 | 2014 | 2013 | |||||||
Cabinets and Related Products |
$ | 1,025 | $ | 999 | $ | 1,014 | ||||
Plumbing Products |
3,341 | 3,308 | 3,183 | |||||||
Decorative Architectural Products |
2,020 | 1,998 | 1,927 | |||||||
Other Specialty Products |
756 | 701 | 637 | |||||||
| | | | | | | | | | | |
Total |
$ | 7,142 | $ | 7,006 | $ | 6,761 | ||||
| | | | | | | | | | | |
| | | | | | | | | | | |
| | | | | | | | | | | |
| |
Operating Profit (Loss) (1)(2)(3) |
|||||||||
|---|---|---|---|---|---|---|---|---|---|---|
| |
2015 | 2014 | 2013 | |||||||
Cabinets and Related Products |
$ | 51 | $ | (62 | ) | $ | (10 | ) | ||
Plumbing Products |
512 | 512 | 394 | |||||||
Decorative Architectural Products |
403 | 360 | 351 | |||||||
Other Specialty Products |
57 | 47 | 35 | |||||||
| | | | | | | | | | | |
Total |
$ | 1,023 | $ | 857 | $ | 770 | ||||
| | | | | | | | | | | |
| | | | | | | | | | | |
| | | | | | | | | | | |
- (1)
- Amounts exclude discontinued operations.
- (2)
- Operating profit (loss) is before general corporate expense, net.
- (3)
- Operating profit (loss) is before income of $9 million regarding the 2014 litigation settlement in the Decorative Architectural Products segment.
All of our operating segments, except the Plumbing Products segment, normally experience stronger sales during the second and third calendar quarters, corresponding with the peak season for repair and remodel activity and new home construction.
Cabinets and Related Products
In North America, we manufacture and sell value-priced, stock and semi-custom assembled cabinetry for kitchen, bath, storage, home office and home entertainment applications in a broad range of styles and price points to address consumer preferences. Our product offerings in this segment also include the fabrication and sale of integrated bathroom vanity and countertop products. In the United Kingdom, we manufacture and sell kitchen, bath, and storage cabinetry. Our KRAFTMAID® brand is sold primarily to dealers and home center retailers, and our MERILLAT®, QUALITY CABINETS™, MOORES™ and CARDELL® brands are sold primarily to dealers and homebuilders for both home improvement and new home construction. Cabinet sales are significantly affected by levels of activity in both retail consumers spending and new home construction, particularly spending for major kitchen and bathroom renovation projects. A significant portion of our sales for home improvement are made through home center retailers.
Our Cabinets and Related Products segment was particularly affected by the economic downturn and decline in new home construction and repair and remodel activity that began in 2008. Consumer spending for big ticket remodeling projects is improving, including large kitchen and bath remodeling projects, but continues to be below normal levels, which impacts our profitability. Home construction is also improving and is expected to continue to improve. Demand has increased for multi-family housing units, which are generally smaller and require fewer kitchen and bathroom cabinets than single-family housing units. Our initiatives to improve this segment have been complex, time-consuming and expensive. Although the operating results of our cabinetry businesses improved in 2015, we continue to
3
focus on obtaining profitable sales, reducing our cost structure and improving cabinet production efficiencies. We are pursuing strategies to increase sales through new product introductions and enhanced customer service, and to rationalize a portion of our customer base in our builder channel to focus on opportunities that offer more profitable growth.
The cabinet manufacturing industry in the United States and the United Kingdom includes several large competitors and numerous local and regional competitors, and in the United Kingdom, foreign manufacturers. In recent years, we have experienced significant competition in the form of new product offerings by our competitors, which have impacted the segment's results of operations. Additional local and regional competitors may enter this industry as conditions improve. In addition to price, we believe that competition in this industry is based largely on product quality, responsiveness to customer needs, product features and selection. Some of our North American competitors include American Woodmark Corporation, Fortune Brands Home & Security, Inc. and Elkay.
The raw materials used in this segment are primarily hardwood lumber, plywood and particleboard, and are available from multiple sources, both domestic and foreign.
Plumbing Products
The businesses in our Plumbing Products segment sell a wide variety of products that are manufactured or sourced by us. The majority of our faucet, bathing and showering devices are sold in North America and Europe under the brand names DELTA®, PEERLESS®, HANSGROHE®, AXOR®, BRIZO®, GINGER®, NEWPORT BRASS®, BRASSTECH® and PLUMB SHOP®. Our BRISTAN™ and HERITAGE™ products are principally sold in the United Kingdom. These plumbing products include faucets, showerheads, handheld showers, valves, bathing units, shower enclosures and toilets and are sold to home center retailers and to wholesalers and distributors that, in turn, sell them to plumbers, building contractors, remodelers, smaller retailers and consumers.
Our acrylic tub and shower systems, bath and shower enclosure units and shower trays are manufactured and sold under the DELTA, PEERLESS, and MIROLIN® brand names. These products are sold primarily to home center retailers for home improvement and new home construction in North America. Our MIROLIN products are also sold to wholesalers and distributors in Canada. Our HÜPPE® shower enclosures are sold through wholesale channels in Europe and China.
Our spas and exercise pools are manufactured and sold under HOT SPRING®, CALDERA®, FREEFLOW SPAS®, FANTASY SPAS®, ENDLESS POOLS® and other trademarks. Spa products are sold to independent specialty retailers or online mass merchant retailers, while exercise pools are available on a consumer direct basis. Competitors include Jacuzzi, Master Spas and Dynasty Spas.
Also included in our Plumbing Products segment are brass and copper plumbing system components and other plumbing specialties, which are sold to plumbing, heating and hardware wholesalers, home center retailers, hardware stores, building supply outlets and other mass merchandisers. These products are marketed in North America for the wholesale trade under our BRASSCRAFT®, PLUMB SHOP®, COBRA®, BRASSTECH®, and MASTER PLUMBER® trademarks, and are also sold under private label.
We believe that our plumbing products are among the leaders in sales in North America and Europe. Our major competitors include Lixil Group Corporation's American Standard Brands and Grohe products, Kohler Co., Fortune Brands Home & Security Inc. and Spectrum Brands Holdings, LLC's Pfister faucets. We also experience competition from foreign manufacturers, including Grohe, particularly in Germany, China and the Middle East. We face significant competition from private label products. Many of the faucet and showering products with which our products compete are manufactured by foreign manufacturers that are putting downward pressure on price. The businesses in our Plumbing Products segment manufacture products in the United States, Europe and Asia and source products from Asia and other regions. In addition to price, we believe that brand reputation is an important factor in consumer
4
selection. Competition for our plumbing products is based largely on service, product quality, product innovation and features and breadth of product offering.
Many of our plumbing products contain brass, the major components of which are copper and zinc. We have multiple sources, both domestic and foreign, for the raw materials used in this segment, and sufficient raw materials have been available for our needs. We have encountered price volatility for brass, brass components and any components containing copper and zinc; therefore, we have implemented a hedging strategy to help reduce the impact of this volatility.
Decorative Architectural Products
We produce architectural coatings, including paints, primers, specialty paint products, stains and waterproofing products. These products are sold in North America, China, and South America under the brand names BEHR®, BEHR PRO® and KILZ® to "do-it-yourself" and professional customers through home center retailers and other retailers. Net sales of architectural coatings comprised approximately 25 percent of our consolidated net sales in 2015, 2014 and 2013. Our BEHR products are sold through The Home Depot, our largest customer and this segment's largest customer. The loss of this segment's sales to The Home Depot would have a material adverse effect on this segment's business and on our consolidated business as a whole.
Our competitors include large national and international brands such as Benjamin Moore, Glidden, Olympic, PPG, Sherwin-Williams, Valspar and Zinsser, as well as many regional and other national brands. In addition to price, we believe that brand reputation is an important factor in consumer selection, and that competition in this industry is based largely on product quality, technology and product innovation, and customer service. In 2015, we introduced a new BEHR® COLOR SOLUTIONS® Center, designed to enhance the color selection process and overall shopping experience, in all North American The Home Depot stores.
Fluctuations in raw material costs can have a material impact on our operating results in this segment. Titanium dioxide and acrylic resins derived from crude oil and natural gas are used in the manufacturing of architectural coatings. Significant increases in the cost of crude oil and natural gas can adversely affect this segment's results of operations. Global supply and demand dynamics and production capacity limitations can cause fluctuations in the price of titanium dioxide and acrylic resins, which can impact our results. We have agreements with the significant suppliers of the major raw materials used in this segment which are intended to help assure continued availability.
Our Decorative Architectural Products segment also includes branded cabinet, door, window and other hardware, which are manufactured for us and sold to home center retailers, other retailers, original equipment manufacturers and wholesalers. These products are sold under the LIBERTY® and BRAINERD® brands. Key competitors in North America include Amerock, Top Knobs and house brands. Decorative bath hardware and shower accessories are sold under the brand names DELTA® and FRANKLIN BRASS® to distributors, home center retailers and other retailers. Competitors include Moen, Gatco and private label brands.
Other Specialty Products
We manufacture and sell vinyl, fiberglass and aluminum windows and patio doors, as well as the ESSENCE SERIES® windows and doors, which combines a wood interior with a fiberglass exterior, under the MILGARD® brand name for home improvement and new home construction, principally in the western United States. MILGARD products are sold primarily through dealers and, to a lesser extent, directly to production and custom homebuilders and through lumber yards and home center retailers. Our North American competitors for these products include national brands, such as Jeld-Wen, Marvin, Pella and Andersen, and numerous regional brands.
5
In the United Kingdom, we manufacture and sell vinyl windows, composite and panel doors, related products and components under several brand names including DURAFLEX™, GRIFFIN™, PREMIER™ and EVOLUTION™. Sales are primarily through dealers and wholesalers to the repair and remodeling markets, although our DURAFLEX products are also sold to other window fabricators. United Kingdom competitors include many small and mid-sized firms and a few large, vertically integrated competitors.
In addition to price, we believe that brand reputation is an important factor in consumer selection and that competition in this industry in both the domestic and foreign markets is based largely on product quality, innovative products and customer and warranty services.
We manufacture and sell a complete line of manual and electric heavy duty staple guns, hammer tackers, glue guns and rivet tools as well as the staples, glue and rivets that complement our products. We sell these products primarily in North America under the brand names ARROW®, POWERSHOT® and EASYSHOT® to professional contractors and do-it-yourself consumers through various distribution channels, including home center and other retailers and wholesalers. Our principal North American competitor in this product line is Stanley Black & Decker.
The raw materials used in this segment have been available from multiple sources, although our U.S. window business has, at times, experienced allocation of glass from its suppliers.
Additional Information
Intellectual Property
We hold numerous U.S. and foreign patents, patent applications, licenses, trademarks, trade names, trade secrets and proprietary manufacturing processes. As a manufacturer and distributor of brand name products, we view our trademarks and other intellectual property rights as important, but do not believe that there is any reasonable likelihood of a loss of such rights that would have a material adverse effect on our present business as a whole.
Laws and Regulations Affecting Our Business
We are subject to U.S. and foreign government regulations, particularly those pertaining to health and safety (including protection of employees and consumers), climate disruption and environmental issues. Our businesses are subject to requirements regarding protection of the environment and worker health and safety and have certain responsibilities for environmental remediation.
- •
- Our Cabinets and Related Products segment is subject to requirements relating to the emission of volatile organic compounds, which may
impact our sourcing of particleboard and may require that we install special equipment in manufacturing facilities.
- •
- Our Decorative Architectural Products segment is also subject to the requirements relating to the emission of volatile organic
compounds, which may require us to reformulate paint products.
- •
- Certain products in our Plumbing Products segment are subject to restrictions on lead content and on waterflow.
Compliance with these laws and regulations significantly affects product performance as well as our production costs. We monitor applicable laws and regulations relating to the protection of the environment, climate disruption and worker health and safety, and incur ongoing expense relating to compliance. We do not expect compliance with the federal, state and local regulations relating to the discharge of materials into the environment, or otherwise relating to the protection of the environment and worker health and safety, will result in material capital expenditures or have a material adverse effect on our earnings or competitive position.
6
Backlog
We do not consider backlog orders to be material in any of our segments.
Employees
At December 31, 2015, we employed approximately 25,000 people. We have generally experienced satisfactory relations with our employees.
Available Information
Our website is www.masco.com. Our periodic reports and all amendments to those reports required to be filed or furnished pursuant to Section 13(a) or Section 15(d) of the Securities Exchange Act of 1934 are available free of charge through our website as soon as reasonably practicable after those reports are electronically filed with or furnished to the Securities and Exchange Commission. This Report is being posted on our website concurrently with its filing with the Securities and Exchange Commission. Material contained on our website is not incorporated by reference into this Report.
7
There are a number of business risks and uncertainties that could affect our business. These risks and uncertainties could cause our actual results to differ from past performance or expected results. We consider the following risks and uncertainties to be most relevant to our specific business activities. Additional risks and uncertainties not presently known to us, or that we currently believe to be immaterial, also may adversely impact our business, financial condition and results of operations.
Our business relies on home improvement and new home construction activity, both of which are cyclical.
A significant portion of our business relies on home improvement, including repair and remodeling projects, of which our reliance has increased following the spin off of TopBuild Corp. ("TopBuild") in 2015. Our business also relies on new home construction activity. Macroeconomic conditions in the U.S. and Europe, including consumer confidence levels, fluctuations in home prices, unemployment and underemployment levels, consumer income and debt levels, household formation and the availability of home equity loans and mortgages and the interest rates for such loans, affect both consumers' discretionary spending on home improvement projects as well as new home construction activity. While improving, both consumer spending for big ticket remodeling projects and new home construction continue to be below historic average levels. Adverse changes or uncertainty regarding these macroeconomic conditions could result in a decline in spending on home improvement projects and a decline in demand for new home construction, both of which could adversely affect our results of operations and our financial position.
If we do not maintain strong brands, develop new products or respond to changing purchasing practices and consumer preferences we could lose market share.
Our competitive advantage is due, in part, to our ability to maintain our strong brands and to develop and introduce innovative new and improved products. While we continue to invest in brand building and brand awareness, these initiatives may not be successful. The uncertainties associated with developing and introducing new and improved products, such as gauging changing consumer preferences and successfully developing, manufacturing, marketing and selling these products, may impact the success of our product introductions. If we do not introduce new or improved products in a timely manner or if these products do not gain widespread acceptance, we could lose market share, which could negatively impact our operating results.
In recent years, consumer purchasing practices and preferences have shifted and our customers' business models and strategies have changed. Consumers are increasingly using the internet and mobile technology to research home improvement products and to inform and provide feedback on their purchasing and ownership experience for these products. E-business is a rapidly developing area, and the refinement and execution of a successful e-business strategy involves significant time, investment and resources. If we are unable to successfully execute our e-business strategy, our brands may lose market share.
While U.S. demand for single-family houses is increasing, the demand for multi-family housing units such as apartments and condominiums continues to be elevated compared to historic levels. Multi-family units typically are smaller than single-family houses and require fewer kitchen and bathroom cabinets than single-family houses. If this demand mix remains, it may limit our growth opportunities.
If we do not timely and effectively identify and respond to these changing purchasing practices and consumer preferences, our relationships with our customers and with consumers could be harmed, the demand for our brands and products could be reduced and our results of operations could be negatively affected.
8
We face significant competition.
Our products face significant competition. We believe that brand reputation is an important factor impacting product selection and that we compete on the basis of product features and innovation, product quality, customer service, warranty and price. Home center retailers continue to purchase products in our segments directly from low-cost foreign manufacturers for sale as private label merchandise. Additionally, home center retailers, which have historically concentrated their sales efforts on retail consumers and remodelers, are increasingly marketing directly to professional contractors and installers, which may impact our margins on our products that contractors and installers would otherwise buy through our dealers and wholesalers.
We sell many of our products through distributors and independent dealers and we rely on these customers to market and promote our products to consumers. Our success with these customers is dependent on our ability to provide quality products and timely delivery. Additionally, in these channels as well as at home center retailers, we compete with foreign manufacturers in a variety of our product groups. Some of these foreign manufacturers are putting downward pressures on price. As market dynamics change, we may experience a shift in the mix of some products we sell toward more value-priced or opening price point products, which may impact our ability to maintain or gain market share and/or our profitability.
Our ability to maintain our competitive position in our industries depends upon maintaining strong brands, developing and innovating products, maintaining strong relationships with our customers, managing our cost structure, executing a successful e-business strategy, accommodating customer demands for new and improved products on a shorter cycle, implementing growth strategies and entering new domestic and international areas, none of which is assured.
Our sales are concentrated with two significant customers.
As a result of the spin off of TopBuild in 2015, the mix of our business operations has changed and the concentration of our sales to our two largest customers has increased and may continue to increase. In 2015, net sales to our largest customer, The Home Depot, were $2.4 billion (approximately 33 percent of our consolidated net sales). In 2015, net sales to Lowe's, our second largest customer, were less than ten percent of our consolidated net sales. If the mix of our business operations continues to change, including as a result of acquisitions or divestitures, our reliance on these significant customers may further increase. These home center retailers can significantly affect the prices we receive for our products and the terms and conditions on which we do business with them. Additionally, these home center customers may reduce the number of vendors from which they purchase and could make significant changes in their volume of purchases. Although other retailers, dealers, distributors and homebuilders represent other channels of distribution for our products and services, the loss of a substantial portion of our sales to The Home Depot or the loss of all of our sales to Lowe's would have a material adverse effect on our business.
Further, as some of these home center retailers expand their markets and targeted customers and as consumer purchasing practices change and e-commerce increases, conflicts between our existing distribution channels have and will continue to occur, which could impact our results of operations. Our relationships with our customers may be impacted if we increase the amount of business we transact directly with consumers. In addition, our large retail customers request product exclusivity from time to time, which may affect our ability to offer products to other customers and may diminish our ability to leverage economies of scale.
We may not achieve all of the anticipated benefits of our strategic initiatives.
We continue to pursue our strategic initiatives, which are designed to increase shareholder value over the mid- to long-term. Our business performance and results could be adversely affected if we are
9
unable to successfully execute these initiatives, or if we are unable to execute them in a timely and efficient manner. We could also be adversely affected if we are unable to effectively manage change throughout our organization.
Pursuing the acquisition of businesses complementary to our portfolio is a component of our strategy for future growth. If we are not able to identify suitable acquisition candidates or consummate potential acquisitions, our long-term competitive positioning may be impacted. Even if we are successful in acquiring businesses, we may experience risks in integrating these businesses into our existing business. Such risks include difficulties realizing expected synergies and economies of scale, diversion of our resources, unforeseen liabilities, issues with the new or existing customers or suppliers, and difficulties in retaining critical employees of the acquired businesses. Future foreign acquisitions may also increase our exposure to foreign currency risks and risks associated with interpretation and enforcement of foreign regulations. Our failure to address these risks could cause us to incur additional costs and/or fail to realize the anticipated benefits of our acquisitions and could adversely affect our results of operations.
We may not be able to sustain the turnaround in our cabinetry businesses.
Our initiatives to improve our cabinetry operations have been complex, time-consuming and expensive. Although the operating results of our cabinetry businesses improved in 2015, we continue to focus on obtaining profitable sales, reducing our cost structure and improving production efficiencies. Our strategies in these areas require time to implement, execute and assess and may not be successful. If the improvement in our cabinetry businesses cannot be sustained or if the pace of the improvement slows, our results of operations may be negatively impacted.
Variability in commodity costs or limited availability of commodities could impact us.
We buy various commodities to manufacture our products, including, among others, brass, resins, titanium dioxide, zinc, wood and glass. In addition, water is a significant component of many of our architectural coatings products and may be subject to restrictions in certain regions. Fluctuations in the availability and prices of these commodities could increase our costs to manufacture our products. Further, increases in energy costs could increase our production costs as well as our transportation costs, each of which could negatively affect our financial condition and operating results.
It has been, and likely will continue to be, difficult for us to pass on to customers cost increases to cover our increased commodity and production costs. Our existing arrangements with customers, competitive considerations and customer resistance to price increases may delay or make us unable to adjust selling prices. If we are not able to increase the prices of our products or achieve cost savings to offset increased commodity and production costs, our financial condition and operating results could be negatively impacted. If we are able to increase our selling prices, sustained price increases for our products may lead to sales declines and loss of market share, particularly if our competitors do not increase their prices. When commodity prices decline, we have experienced and may in the future receive pressure from our customers to reduce our prices. Such reductions could impact our operating results.
To help reduce price volatility associated with certain anticipated commodity purchases, we use derivative instruments, including commodity futures and swaps. This strategy increases the possibility that we may make commitments to purchase these commodities at prices that subsequently exceed their market prices, which has and may continue to adversely affect our financial condition and operating results. We also have agreements with certain significant suppliers to help assure continued availability.
10
We are dependent on third-party suppliers.
We rely heavily on third-party suppliers for many of our products and components, and our ability to offer a wide variety of products depends on our ability to obtain an adequate supply of these products and components. Failure by our suppliers to provide us quality products on commercially reasonable terms, or to comply with applicable legal and regulatory requirements, could have a material adverse effect on our financial condition or operating results. Resourcing these products and components to another supplier could take time and involve significant costs. Accordingly, the loss of critical suppliers, or a substantial decrease in the availability of products or components from our suppliers, could disrupt our business and adversely impact our operating results.
Many of the suppliers upon whom we rely are located in foreign countries. The differences in business practices, shipping and delivery requirements and laws and regulations, together with the limited number of suppliers, have increased the complexity of our supply chain logistics and the potential for interruptions in our production scheduling. If we are unable to effectively manage our supply chain, our operating results could be negatively affected.
There are risks associated with international operations and global strategies.
Approximately 21 percent of our sales are made outside of North America (principally in Europe) and are transacted in currencies other than the U.S. dollar. Following the TopBuild spin off, a greater proportion of our sales occurs outside of the U.S., and increasing our international sales is an important part of our strategic plans. In addition to our European operations, we manufacture products in Asia and source products and components from third parties globally. Risks associated with our international operations include changes in political, monetary and social environments, labor conditions and practices, the laws, regulations and policies of foreign governments, social and political unrest, terrorist attacks, cultural differences and differences in enforcement of contract and intellectual property rights.
Our operating results are also impacted by international economic conditions, primarily in Europe. As our sales made outside of the U.S. have increased, we have experienced a greater negative impact from currency conversion rates, particularly the Euro, the Canadian dollar and the British pound sterling, on our results of operations due to the strength of the U.S. dollar compared to foreign currencies. Fluctuations in currency exchange rates may present challenges in comparing operating performance from period to period.
U.S. laws and regulations regarding activities of U.S. companies doing business abroad, including tax laws, laws regulating competition, anti-bribery/anti-corruption and other business practices, and trade regulations, which may include duties and tariffs, can also affect us. While it is difficult to assess what changes may occur and the relative impact on our international tax structure, it is possible that significant changes in how U.S. and foreign jurisdictions tax cross-border transactions could adversely impact our financial results.
We may not be able to adequately protect or prevent the unauthorized use of our intellectual property.
Protecting our intellectual property is critical to our growth and innovation efforts. We own a number of patents, trade names, brand names and other forms of intellectual property in our products and manufacturing processes throughout the world. There can be no assurance that our efforts to protect our intellectual property rights will prevent violations. Our intellectual property may be challenged or infringed upon by third parties, particularly in countries where property rights are not highly developed or protected. In addition, the global nature of our business increases the risk that we may be unable to obtain or maintain our intellectual property rights on reasonable terms. Furthermore, others may assert intellectual property infringement claims against us. Protecting and defending our intellectual property could be costly, time consuming and require significant resources. If we are not able to protect our existing
11
intellectual property rights, or prevent unauthorized use of our intellectual property, sales of our products may be affected and we may experience reputational damage to our brand names, increased litigation costs and adverse impact to our competitive position, which could affect our results of operations.
The long-term performance of our businesses relies on our ability to attract, develop and retain talented personnel.
To be successful, we must attract, develop and retain highly qualified and talented personnel who have the experience, knowledge and expertise to successfully implement our key business strategies. We compete for employees with a broad range of employers in many different industries, including large multinational firms, and we invest significant resources in recruiting, developing, motivating and retaining them. The failure to attract and retain key employees, or to develop effective succession planning to assure smooth transitions of those employees and the knowledge and expertise they possess, could negatively affect our competitive position and our operating results. If we are unable to recruit, train and retain sufficient skilled and unskilled labor, we may not be able to adequately satisfy increased demand for our products and services, and our operating results could be adversely affected.
Claims and litigation could be costly.
We are involved in various claims, litigation matters and regulatory proceedings that arise in the ordinary course of our business and which could have a material adverse effect on us. These matters may include competition, products liability, employment, warranty disputes, advertising claims, contract disputes, personal injury claims, environmental claims or proceedings, and other proceedings and litigation, including class actions.
We are subject to product safety regulations, recalls and direct claims for product liability that can result in significant liability and, regardless of the ultimate outcome, can damage the reputation of our brands and business and can be costly to defend or manage. Also, we rely on other manufacturers to provide us with products or components for products that we sell. Due to the difficulty of controlling the quality of products or components sourced from other manufacturers, we are exposed to risks relating to the quality of such products and to limitations on our recourse against such suppliers.
We intend to defend all claims and litigation matters vigorously; however, given the inherently unpredictable nature of claims and litigation, we cannot predict with certainty the outcome or effect of any claim or litigation matter. In recent years, we have experienced class action lawsuits predicated upon claims for product liability and wage and hour issues, and we may be subject to other consumer claims in the future. We have generally denied liability and have vigorously defended these cases. Due to their scope and complexity, however, these lawsuits can be particularly costly to defend and resolve, and we have and may continue to incur significant costs as a result of these types of lawsuits.
We maintain insurance against some, but not all, of these risks of loss resulting from claims and litigation. We may elect not to obtain insurance if we believe the cost of available insurance is excessive relative to the risks presented. The levels of insurance we maintain may not be adequate to fully cover any and all losses or liabilities. If any significant accident, judgment, claim or other event is not fully insured or indemnified against, it could have a material adverse impact on our business, financial condition and results of operations. We may also experience increased costs for insurance coverage that could impact our financial results.
See Note U to the consolidated financial statements included in Item 8 of this Report for additional information about litigation involving our businesses.
12
Compliance with laws, government regulation and industry standards could impact our operating results.
We are subject to federal, state and foreign government regulations, particularly those pertaining to health and safety (including protection of employees and consumers), product compliance, competition practices, import and export regulations, climate disruption and environmental issues. In addition to complying with current requirements and requirements that will become effective at a future date, even more stringent requirements could be imposed on us in the future. Additionally, some of our products must be certified by industry organizations. Compliance with these laws, regulations and industry standards may require us to alter our product designs, our manufacturing processes or our sourcing. Further, compliance activities are costly and require significant management attention and resources. If we do not effectively and timely comply with such regulations and industry standards, our results of operations could be negatively affected.
We rely on information systems and technology, and disruptions to these systems could impact our operating results.
We rely on a number of information systems and technology to process, transmit, store and manage information to support our business activities, and we have plans to make significant investments in new technology systems. We may be adversely impacted if our information systems are disrupted or fail, or if we do not appropriately select and implement our new technology systems in a timely manner. In addition to the disruptions that may occur from interruptions in our systems, increased global cybersecurity vulnerabilities, threats and more sophisticated and targeted attacks pose a risk to our information technology systems. We have established security policies, processes and layers of defense designed to help identify and protect against intentional and unintentional misappropriation or corruption of our systems and information and disruption of our operations. Despite these efforts, our systems may be damaged, disrupted, or shut down due to attacks by unauthorized access, malicious software, undetected intrusion, hardware failures, or other events, and in these circumstances our disaster recovery plans may be ineffective or inadequate. These breaches or intrusions could lead to business interruption, exposure of proprietary or confidential information, data corruption, damage to our reputation, exposure to litigation, and increased operational costs. Such events could have a material adverse impact on our operating results. In addition, we could be adversely affected if any of our significant customers or suppliers experiences any similar events that disrupt their business operations or damage their reputation.
Restrictive covenants in our credit agreement could limit our financial flexibility.
We must comply with both financial and nonfinancial covenants in our credit agreement, and in order to borrow under it, we cannot be in default with any of those provisions. Our ability to borrow under the credit agreement could be impacted if our earnings significantly decline to a level where we are not in compliance with the financial covenants or if we default on any nonfinancial covenants. In the past, we have been able to amend the covenants in our credit agreement, but there can be no assurance that in the future we would be able to further amend them. If we were unable to borrow under our credit agreement, our financial flexibility would be restricted if we were also unable to obtain alternative financing on acceptable terms and at acceptable rates or if we were not permitted to obtain alternative financing under the terms of our existing financing arrangements.
The TopBuild spin off could result in substantial tax liability to us and our stockholders.
We received an opinion of tax counsel substantially to the effect that, for U.S. Federal income tax purposes, the spin off and certain related transactions qualify for tax-free treatment under certain sections of the Internal Revenue Code. However, if the factual assumptions or representations made by us in connection with the delivery of the opinion are inaccurate or incomplete in any material respect, including
13
those relating to the past and future conduct of our business, we will not be able to rely on the opinion. Furthermore, the opinion is not binding on the Internal Revenue Service or the courts. If, notwithstanding receipt of the opinion, the spin off transaction and certain related transactions are determined to be taxable, we would be subject to a substantial tax liability. In addition, if the spin off transaction is taxable, each holder of our common stock who received shares of TopBuild in connection with the spin off would generally be treated as receiving a taxable distribution of property in an amount equal to the fair market value of the shares received, thereby potentially increasing such holder's tax liability.
Even if the spin off otherwise qualifies as a tax-free transaction, the distribution could be taxable to us (but not to our stockholders) in certain circumstances if future significant acquisitions of our stock or the stock of TopBuild are deemed to be part of a plan or series of related transactions that included the spin off. In this event, the resulting tax liability could be substantial. In connection with the spin off, we entered into a tax matters agreement with TopBuild, pursuant to which TopBuild agreed to not enter into any transaction that could cause any portion of the spin off to be taxable to us without our consent and to indemnify us for any tax liability resulting from any such transaction. These obligations and potential tax liabilities may discourage, delay or prevent a change of control of us.
Item 1B. Unresolved Staff Comments.
None.
The table below lists our principal North American properties.
Business Segment
|
Manufacturing | Warehouse and Distribution |
|||||
|---|---|---|---|---|---|---|---|
Cabinets and Related Products |
8 | 8 | |||||
Plumbing Products |
19 | 4 | |||||
Decorative Architectural Products |
8 | 9 | |||||
Other Specialty Products |
11 | 6 | |||||
| | | | | | | | |
Totals |
46 | 27 | |||||
| | | | | | | | |
| | | | | | | | |
| | | | | | | | |
Most of our North American facilities range from single warehouse buildings to complex manufacturing facilities. We own most of our North American manufacturing facilities, none of which are subject to significant encumbrances. A substantial number of our warehouse and distribution facilities are leased.
The table below lists our principal properties outside of North America.
Business Segment
|
Manufacturing | Warehouse and Distribution |
|||||
|---|---|---|---|---|---|---|---|
Cabinets and Related Products |
1 | 1 | |||||
Plumbing Products |
11 | 22 | |||||
Decorative Architectural Products |
— | — | |||||
Other Specialty Products |
8 | — | |||||
| | | | | | | | |
Totals |
20 | 23 | |||||
| | | | | | | | |
| | | | | | | | |
| | | | | | | | |
Most of our international facilities are located in China, Germany and the United Kingdom. We own most of our international manufacturing facilities, none of which are subject to significant encumbrances. A substantial number of our international warehouse and distribution facilities are leased.
14
We own our corporate headquarters in Taylor, Michigan. We own an additional building near our corporate headquarters that is used by our Masco Technical Services (research and development) department. We continue to lease an office facility in Luxembourg which serves as a headquarters for most of our foreign operations.
We have entered into a contract to lease a new corporate headquarters in Livonia, Michigan, which we expect to occupy beginning in 2017.
Each of our operating divisions assesses the manufacturing, distribution and other facilities needed to meet its operating requirements. Our buildings, machinery and equipment have been generally well maintained and are in good operating condition. We believe our facilities have sufficient capacity and are adequate for our production and distribution requirements.
Information regarding legal proceedings involving us is set forth in Note U to our consolidated financial statements included in Item 8 of this Report and is incorporated herein by reference.
Item 4. Mine Safety Disclosures.
Not applicable.
15
Item 5. Market for Registrant's Common Equity, Related Stockholder Matters and Issuer Purchases of Equity Securities.
The New York Stock Exchange is the principal market on which our common stock is traded. The following table indicates the high and low sales prices of our common stock as reported by the New York Stock Exchange and the cash dividends declared per common share for the periods indicated:
| |
Market Price | |
||||||||
|---|---|---|---|---|---|---|---|---|---|---|
| |
Dividends Declared |
|||||||||
Quarter
|
High | Low | ||||||||
2015 |
||||||||||
Fourth |
$ | 30.61 | $ | 24.89 | $ | .095 | ||||
Third |
28.59 | 22.52 | .095 | |||||||
Second |
28.38 | 25.47 | .09 | |||||||
First |
27.40 | 23.23 | .09 | |||||||
| | | | | | | | | | | |
Total |
$ | .370 | ||||||||
| | | | | | | | | | | |
| | | | | | | | | | | |
| | | | | | | | | | | |
2014 |
||||||||||
Fourth |
$ | 25.58 | $ | 19.84 | $ | .09 | ||||
Third |
24.91 | 20.18 | .09 | |||||||
Second |
23.42 | 19.50 | .09 | |||||||
First |
23.73 | 20.60 | .075 | |||||||
| | | | | | | | | | | |
Total |
$ | .345 | ||||||||
| | | | | | | | | | | |
| | | | | | | | | | | |
| | | | | | | | | | | |
On January 31, 2016, there were approximately 4,200 holders of record of our common stock.
We expect that our practice of paying quarterly dividends on our common stock will continue, although the payment of future dividends is at the discretion of our Board of Directors and will depend upon our earnings, capital requirements, financial condition and other factors.
In September 2014, our Board of Directors authorized the purchase of up to 50 million shares, for retirement of our common stock in open-market transactions or otherwise, replacing the previous authorization established in 2007. During 2015, we repurchased and retired 17 million shares of our common stock for cash aggregating $456 million. The following table provides information regarding the repurchase of our common stock for the three months ended December 31, 2015.
Period
|
Total Number of Shares Purchased |
Average Price Paid Per Common Share |
Total Number of Shares Purchased as Part of Publicly Announced Plans or Programs |
Maximum Number of Shares That May Yet Be Purchased Under the Plans or Programs |
|||||||||
|---|---|---|---|---|---|---|---|---|---|---|---|---|---|
10/1/15 - 10/31/15 |
960,000 | $ | 26.63 | 960,000 | 28,573,000 | ||||||||
11/1/15 - 11/30/15 |
800,000 | $ | 29.23 | 800,000 | 27,773,000 | ||||||||
12/1/15 - 12/31/15 |
— | $ | — | — | 27,773,000 | ||||||||
| | | | | | | | | | | | | | |
Total for the quarter |
1,760,000 | $ | 27.81 | 1,760,000 | 27,773,000 | ||||||||
16
Performance Graph
The table below compares the cumulative total shareholder return on our common stock with the cumulative total return of (i) the Standard & Poor's 500 Composite Stock Index ("S&P 500 Index"), (ii) The Standard & Poor's Industrials Index ("S&P Industrials Index") and (iii) the Standard & Poor's Consumer Durables & Apparel Index ("S&P Consumer Durables & Apparel Index"), from December 31, 2010 through December 31, 2015, when the closing price of our common stock was $28.30. The graph assumes investments of $100 on December 31, 2010 in our common stock and in each of the three indices and the reinvestment of dividends.
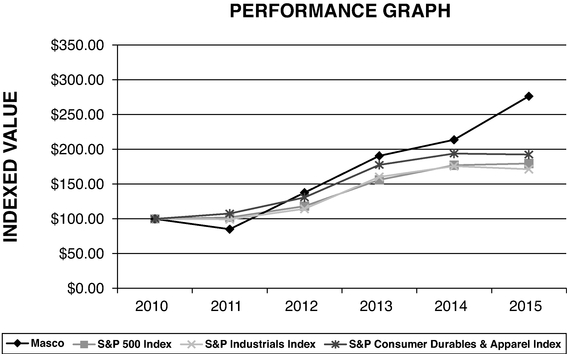
The table below sets forth the value, as of December 31 for each of the years indicated, of a $100 investment made on December 31, 2010 in each of our common stock, the S&P 500 Index, the S&P Industrials Index and the S&P Consumer Durables & Apparel Index and includes the reinvestment of dividends.
| |
2011 | 2012 | 2013 | 2014 | 2015 | |||||||||||
|---|---|---|---|---|---|---|---|---|---|---|---|---|---|---|---|---|
Masco |
$ | 85.15 | $ | 137.80 | $ | 190.82 | $ | 213.95 | $ | 276.69 | ||||||
S&P 500 Index |
$ | 102.09 | $ | 118.30 | $ | 156.21 | $ | 177.32 | $ | 179.76 | ||||||
S&P Industrials Index |
$ | 99.39 | $ | 114.48 | $ | 160.47 | $ | 175.98 | $ | 171.52 | ||||||
S&P Consumer Durables & Apparel Index |
$ | 107.71 | $ | 130.87 | $ | 177.77 | $ | 194.10 | $ | 192.67 | ||||||
17
Item 6. Selected Financial Data.
| |
Dollars in Millions (Except Per Common Share Data) |
|||||||||||||||
|---|---|---|---|---|---|---|---|---|---|---|---|---|---|---|---|---|
| |
2015 | 2014 | 2013 | 2012 | 2011 | |||||||||||
Net Sales (1) |
$ | 7,142 | $ | 7,006 | $ | 6,761 | $ | 6,286 | $ | 6,093 | ||||||
Operating profit (loss) (1)(3)(4) |
914 | 721 | 612 | 384 | (153 | ) | ||||||||||
Income (loss) from continuing operations attributable to Masco Corporation (1)(2)(3)(4) |
357 | 821 | 259 | 54 | (297 | ) | ||||||||||
Income (loss) per common share from continuing operations: |
||||||||||||||||
Basic |
$ | 1.04 | $ | 2.31 | $ | .72 | $ | .15 | $ | (.86 | ) | |||||
Diluted |
1.03 | 2.28 | .72 | .15 | (.86 | ) | ||||||||||
Dividends declared |
.370 | .345 | .300 | .300 | .300 | |||||||||||
Dividends paid |
.365 | .330 | .300 | .300 | .300 | |||||||||||
At December 31: |
||||||||||||||||
Total assets |
$ | 5,680 | $ | 7,208 | $ | 6,885 | $ | 6,842 | $ | 7,294 | ||||||
Long-term debt |
2,418 | 2,919 | 3,421 | 3,422 | 3,222 | |||||||||||
Shareholders' equity (5) |
58 | 1,128 | 787 | 542 | 750 | |||||||||||
- (1)
- Amounts exclude discontinued operations.
- (2)
- The year 2014 includes a $529 million tax benefit from the release of the valuation allowance on
deferred tax assets.
- (3)
- The year 2012 includes non-cash impairment charges for other intangible assets aggregating
$27 million after tax ($42 million pre-tax).
- (4)
- The year 2011 includes non-cash impairment charges for goodwill and other intangible assets aggregating
$291 million after tax ($450 million pre-tax).
- (5)
- The decrease in shareholder's equity from 2014 to 2015 relates primarily to the spin off of TopBuild Corp.
18
Item 7. Management's Discussion and Analysis of Financial Condition and Results of Operations.
The financial and business analysis below provides information which we believe is relevant to an assessment and understanding of our consolidated financial position, results of operations and cash flows. This financial and business analysis should be read in conjunction with the consolidated financial statements and related notes.
The following discussion and certain other sections of this Report contain statements that reflect our views about our future performance and constitute "forward-looking statements" under the Private Securities Litigation Reform Act of 1995. Forward-looking statements can be identified by words such as "believe," "anticipate," "appear," "may," "will," "should," "intend," "plan," "estimate," "expect," "assume," "seek," "forecast" and similar references to future periods. Our views about future performance involve risks and uncertainties that are difficult to predict and, accordingly, our actual results may differ materially from the results discussed in our forward-looking statements. We caution you against relying on any of these forward-looking statements.
In addition to the various factors included in the "Executive Level Overview," "Critical Accounting Policies and Estimates" and "Outlook for the Company" sections, our future performance may be affected by the levels of home improvement activity and new home construction, our ability to maintain our strong brands and to develop and introduce new and improved products, our ability to maintain our competitive position in our industries, our reliance on key customers, our ability to achieve the anticipated benefits of our strategic initiatives, our ability to sustain the performance of our cabinetry businesses, the cost and availability of raw materials, our dependence on third party suppliers, and risks associated with international operations and global strategies. These and other factors are discussed in detail in Item 1A "Risk Factors" of this Report. Any forward-looking statement made by us speaks only as of the date on which it was made. Factors or events that could cause our actual results to differ may emerge from time to time, and it is not possible for us to predict all of them. Unless required by law, we undertake no obligation to update publicly any forward-looking statements as a result of new information, future events or otherwise.
Executive Level Overview
We design, manufacture, market and distribute branded home improvement and building products. These products are sold for home improvement and new home construction through home center retailers, mass merchandisers, hardware stores, homebuilders, distributors and other outlets for consumers and contractors and direct to the consumer.
2015 Results
Net sales were positively affected by increased repair and remodel activity and new home construction in the U.S. and Europe, favorable product mix, net selling price increases and acquisitions. Such increases were partially offset by foreign currency translation, primarily due to the stronger U.S. dollar compared to the Euro. Our results of operations were positively affected by increased sales volume, operational efficiencies due to benefits resulting from cost savings initiatives and a more favorable relationship between selling prices and commodity costs.
Our Cabinets and Related Products segment was positively affected by operational efficiencies due to benefits resulting from business rationalization activities and other cost saving initiatives and decreased business rationalization expenses. Our Plumbing Products segment benefited from increased sales volume and a favorable relationship between selling prices and commodity costs and was negatively impacted by unfavorable product mix and an increase in certain variable expenses. The Decorative Architectural Products segment benefited from increased sales volume of paints and stains and builders' hardware, a more favorable relationship between selling prices and commodity costs in
19
paints and stains and operational efficiencies due to benefits associated with cost savings initiatives. Our Other Specialty Products segment benefited from increased volume, a more favorable product mix of U.S. windows and a more favorable relationship between selling prices and commodity costs of windows in the U.S. and the U.K.
Critical Accounting Policies and Estimates
Our discussion and analysis of our financial condition and results of operations are based upon our consolidated financial statements, which have been prepared in accordance with accounting principles generally accepted in the United States of America ("GAAP"). The preparation of these financial statements requires us to make certain estimates and assumptions that affect the reported amounts of assets and liabilities, disclosure of any contingent assets and liabilities at the date of the financial statements and the reported amounts of revenues and expenses during the reporting periods. We regularly review our estimates and assumptions, which are based upon historical experience, as well as current economic conditions and various other factors that we believe to be reasonable under the circumstances, the results of which form the basis for making judgments about the carrying values of certain assets and liabilities that are not readily apparent from other sources. Actual results may differ from these estimates and assumptions.
Note A to our consolidated financial statements includes our accounting policies, estimates and methods used in the preparation of our consolidated financial statements.
We believe that the following critical accounting policies are affected by significant judgments and estimates used in the preparation of our consolidated financial statements.
Revenue Recognition and Receivables
We recognize revenue as title to products and risk of loss is transferred to customers or when services are rendered. We record estimated reductions to revenue for customer programs and incentive offerings, including special pricing and co-operative advertising arrangements, promotions and other volume-based incentives. We monitor our customer receivable balances and the credit worthiness of our customers on an on-going basis and maintain allowances for doubtful accounts receivable for estimated losses resulting from the inability of customers to make required payments.
Goodwill and Other Intangible Assets
We record the excess of purchase cost over the fair value of net tangible assets of acquired companies as goodwill or other identifiable intangible assets. In the fourth quarter of each year, or as events occur or circumstances change that would more likely than not reduce the fair value of a reporting unit below its carrying amount, we complete the impairment testing of goodwill utilizing a discounted cash flow method. We selected the discounted cash flow methodology because we believe that it is comparable to what would be used by other market participants. We have defined our reporting units and completed the impairment testing of goodwill at the operating segment level, as defined by GAAP.
Determining market values using a discounted cash flow method requires us to make significant estimates and assumptions, including long-term projections of cash flows, market conditions and appropriate discount rates. Our judgments are based upon historical experience, current market trends, consultations with external valuation specialists and other information. While we believe that the estimates and assumptions underlying the valuation methodology are reasonable, different estimates and assumptions could result in different outcomes. In estimating future cash flows, we rely on internally generated five-year forecasts for sales and operating profits, including capital expenditures, and, currently, a one to three percent long-term assumed annual growth rate of cash flows for periods after the five-year forecast. We generally develop these forecasts based upon, among other things, recent sales
20
data for existing products, planned timing of new product launches, estimated repair and remodel activity and estimated housing starts. Our assumptions included a relatively stable U.S. Gross Domestic Product ranging from 2.4 percent to 2.9 percent and a euro zone Gross Domestic Product ranging from 1.5 percent to 1.8 percent over the five-year forecast.
We utilize our weighted average cost of capital of approximately 8.5 percent as the basis to determine the discount rate to apply to the estimated future cash flows. Our weighted average cost of capital decreased in 2015 as compared to 2014, primarily due to less risk associated with our stock in relation to the capital markets. In 2015, based upon our assessment of the risks impacting each of our businesses, we applied a risk premium to increase the discount rate to a range of 10.5 percent to 12.5 percent for our reporting units.
If the carrying amount of a reporting unit exceeds its fair value, we measure the possible goodwill impairment based upon an allocation of the estimate of fair value of the reporting unit to all of the underlying assets and liabilities of the reporting unit, including any previously unrecognized intangible assets (Step Two Analysis). The excess of the fair value of a reporting unit over the amounts assigned to its assets and liabilities is the implied fair value of goodwill. An impairment loss is recognized to the extent that a reporting unit's recorded goodwill exceeds the implied fair value of goodwill.
In the fourth quarter of 2015, we estimated that future discounted cash flows projected for all of our reporting units were greater than the carrying values. Accordingly, we did not recognize any impairment charges for goodwill.
A 10 percent decrease in the estimated fair value of our reporting units at December 31, 2015 would not have resulted in any additional analysis of goodwill impairment for any reporting unit.
We review our other indefinite-lived intangible assets for impairment annually, in the fourth quarter, or as events occur or circumstances change that indicate the assets may be impaired without regard to the business unit. We consider the implications of both external (e.g., market growth, competition and local economic conditions) and internal (e.g., product sales and expected product growth) factors and their potential impact on cash flows related to the intangible asset in both the near- and long-term. In 2015, we did not recognize any impairment charges for other indefinite-lived intangible assets.
Employee Retirement Plans
Effective January 1, 2010, we froze all future benefit accruals under substantially all of our domestic qualified and non-qualified defined-benefit pension plans.
Accounting for defined-benefit pension plans involves estimating the cost of benefits to be provided in the future, based upon vested years of service, and attributing those costs over the time period each employee works. We develop our pension costs and obligations from actuarial valuations. Inherent in these valuations are key assumptions regarding inflation, expected return on plan assets, mortality rates and discount rates for obligations and expenses. We consider current market conditions, including changes in interest rates, in selecting these assumptions. While we believe that the estimates and assumptions underlying the valuation methodology are reasonable, different estimates and assumptions could result in different reported pension costs and obligations within our consolidated financial statements.
In December 2015, our discount rate increased for obligations to an average of 4.0 percent from 3.8 percent. The discount rate for obligations is based upon the expected duration of each defined-benefit pension plan's liabilities matched to the December 31, 2015 Towers Watson Rate Link curve. The discount rates we use for our defined-benefit pension plans ranged from 2.0 percent to 4.3 percent, with the most significant portion of the liabilities having a discount rate for obligations of 4.0 percent or higher. The assumed asset return was primarily 7.25 percent, reflecting the expected long-term return on plan assets.
21
Our net underfunded amount for our qualified defined-benefit pension plans, which is the difference between the projected benefit obligation and plan assets, decreased to $401 million at December 31, 2015 from $454 million at December 31, 2014. Our projected benefit obligation for our unfunded non-qualified defined-benefit pension plans was $174 million at December 31, 2015 compared with $190 million at December 31, 2014.
The decrease in the projected benefit obligations was primarily due to lower bond rates and a change to the MP 2015 Mortality Improvement Scale issued by the U.S. Society of Actuaries, which decreased our long-term pension liabilities. Our qualified domestic pension plan assets in 2015 had a net loss of 1.8 percent.
At December 31, 2015, we reported a net liability of $575 million, of which $174 million was related to our non-qualified, supplemental retirement plans, which are not subject to the funding requirements of the Pension Protection Act of 2006. In accordance with the Pension Protection Act, the Adjusted Funding Target Attainment Percentage for the various defined-benefit pension plans ranges from 78 percent to 114 percent.
We expect pension expense for our qualified defined-benefit pension plans to be $24 million in 2016 compared with $22 million in 2015. If we assumed that the future return on plan assets was one-half percent lower than the assumed asset return and the discount rate decreased by 50 basis points, the 2016 pension expense would increase by $5 million. We expect pension expense for our non-qualified defined-benefit pension plans to be $9 million in 2016, compared to $10 million in 2015.
We anticipate that we will be required to contribute approximately $25 million in 2016 to our qualified and non-qualified defined-benefit plans. Refer to Footnote M for further information regarding the funding of our plans.
Income Taxes
Deferred taxes are recognized based on the future tax consequences of differences between the financial statement carrying value of assets and liabilities and their respective tax basis. The future realization of deferred tax assets depends on the existence of sufficient taxable income in future periods. Possible sources of taxable income include taxable income in carryback periods, the future reversal of existing taxable temporary differences recorded as a deferred tax liability, tax-planning strategies that generate future income or gains in excess of anticipated losses in the carryforward period and projected future taxable income.
If, based upon all available evidence, both positive and negative, it is more likely than not (more than 50 percent likely) such deferred tax assets will not be realized, a valuation allowance is recorded. Significant weight is given to positive and negative evidence that is objectively verifiable. A company's three-year cumulative loss position is significant negative evidence in considering whether deferred tax assets are realizable, and the accounting guidance restricts the amount of reliance we can place on projected taxable income to support the recovery of the deferred tax assets.
In 2010, we recorded a $372 million valuation allowance against our U.S. Federal deferred tax assets as a non-cash charge to income tax expense. In reaching this conclusion, we considered the weaker retail sales of certain of our building products and the slower than anticipated recovery in the U.S. housing market which led to U.S. operating losses and significant U.S. goodwill impairment charges, that primarily occurred in the fourth quarter of 2010, causing us to be in a three-year cumulative U.S. loss position.
During 2012 and 2011, objective and verifiable negative evidence, such as U.S. operating losses and significant impairment charges for U.S. goodwill and other intangible assets, continued to outweigh positive evidence necessary to reduce the valuation allowance. As a result, we recorded increases of $65 million and $87 million in the valuation allowance related to our U.S. Federal deferred tax assets in 2012 and 2011, respectively.
22
In the third quarter of 2014, we recorded a $517 million tax benefit from the release of the valuation allowance against our U.S. Federal and certain state deferred tax assets due primarily to a return to sustainable profitability in our U.S. operations. In reaching this conclusion, we considered the continued improvement in both the new home construction market and repair and remodel activity in the U.S. and our progress on strategic initiatives to reduce costs and expand our product leadership positions which contributed to the continued improvement in our U.S. operations over the past few years.
In the fourth quarter of 2014, we recorded an additional $12 million tax benefit from the release of the valuation allowances against certain U.K. and Mexican deferred tax assets primarily resulting from a return to sustainable profitability in these jurisdictions.
We continue to maintain a valuation allowance on certain state and foreign deferred tax assets as of December 31, 2015. Should we determine that we would not be able to realize our remaining deferred tax assets in these jurisdictions in the future, an adjustment to the valuation allowance would be recorded in the period such determination is made. The need to maintain a valuation allowance against deferred tax assets may cause greater volatility in our effective tax rate.
The current accounting guidance allows the recognition of only those income tax positions that have a greater than 50 percent likelihood of being sustained upon examination by the taxing authorities. We believe that there is an increased potential for volatility in our effective tax rate because this threshold allows changes in the income tax environment and the inherent complexities of income tax law in a substantial number of jurisdictions to affect the computation of our liability for uncertain tax positions to a greater extent.
While we believe we have adequately provided for our uncertain tax positions, amounts asserted by taxing authorities could vary from our liability for uncertain tax positions. Accordingly, additional provisions for tax-related matters, including interest and penalties, could be recorded in income tax expense in the period revised estimates are made or the underlying matters are settled or otherwise resolved.
Warranty
At the time of sale, we accrue a warranty liability for the estimated cost to provide products, parts or services to repair or replace products in satisfaction of warranty obligations. Our estimate of costs to service our warranty obligations is based upon the information available and includes a number of factors such as the warranty coverage, the warranty period, historical experience specific to the nature, frequency and average cost to service the claim, along with industry and demographic trends.
Certain factors and related assumptions in determining our warranty liability involve judgments and estimates and are sensitive to changes in the aforementioned factors. We believe that the warranty accrual is appropriate; however, actual claims incurred could differ from the original estimates thereby requiring adjustments to previously established accruals.
A significant portion of our business is at the consumer retail level through home center retailers and other major retailers. A consumer may return a product to a retail outlet that is a warranty return. However, certain retail outlets do not distinguish between warranty and other types of returns when they claim a return deduction from us. Our revenue recognition policy takes into account this type of return when recognizing revenue, and deductions are recorded at the time of sale.
Litigation
We are subject to lawsuits and pending or asserted claims in the ordinary course of our business. Liabilities and costs associated with these matters require estimates and judgments based upon our professional knowledge and experience and that of our legal counsel. When estimates of our exposure for lawsuits and pending or asserted claims meet the criteria for recognition under accounting guidance,
23
amounts are recorded as charges to earnings. The ultimate resolution of these exposures may differ due to subsequent developments.
Corporate Development Strategy
We expect to maintain a balanced growth strategy pursuing organic growth by maximizing the full potential of our existing core businesses and complementing our existing business with smaller, strategic acquisitions. We acquired two businesses in 2015, Endless Pools and Evolution Manufacturing. Endless Pools expanded our product offering and distribution channels into the aquatic fitness category. Evolution Manufacturing expanded our offering of fiberglass and composite windows in the United Kingdom. We believe these acquisitions will accelerate the growth of, and complement, our current businesses, Watkins Manufacturing and our UK-based window company, respectively. Longer-term, we may seek larger, strategic acquisitions as our company continues to grow.
In addition, during the financial recession of the last decade, we actively managed our portfolio of companies by divesting of those businesses that did not align with our long-term growth strategy, including, in 2015, the spin off of our Installation and Other Services businesses into an independent, publicly-traded company named TopBuild. We will continue to review all of our businesses to determine which businesses may not be core to our long-term growth strategy.
Liquidity and Capital Resources
Historically, we have largely funded our growth through cash provided by our operations, long-term bank debt and the issuance of notes in the financial markets, and by the issuance of our common stock, including issuances for certain mergers and acquisitions. Maintaining high levels of liquidity and focusing on cash generation are among our financial strategies. We also intend to pay down between $300 million and $500 million of our debt over the next several quarters.
Our total debt as a percent of total capitalization was 98 percent and 75 percent at December 31, 2015 and 2014, respectively.
On June 15, 2015, we repaid and retired all of our $500 million, 4.8% Notes on the scheduled retirement date.
On March 24, 2015, we issued $500 million of 4.45% Notes due April 1, 2025. These Notes are senior indebtedness and are redeemable at our option.
On March 28, 2013, we entered into a credit agreement (the "Credit Agreement") with a bank group, with an aggregate commitment of $1.25 billion and a maturity date of March 28, 2018. On May 29, 2015 and August 28, 2015, we amended the Credit Agreement with the bank group (the "Amended Credit Agreement"). The Amended Credit Agreement reduces the aggregate commitment to $750 million and extends the maturity date to May 29, 2020. Under the Amended Credit Agreement, at our request and subject to certain conditions, we can increase the aggregate commitment up to an additional $375 million with the current bank group or new lenders. See Note K to the consolidated financial statements.
The Amended Credit Agreement contains financial covenants requiring us to maintain (A) a maximum net leverage ratio, as adjusted for certain items, of 4.0 to 1.0, and (B) a minimum interest coverage ratio, as adjusted for certain items, equal to or greater than 2.5 to 1.0. We were in compliance with all covenants and had no borrowings under our Amended Credit Agreement at December 31, 2015.
We had cash, cash investments and short-term bank deposits of approximately $1.7 billion at December 31, 2015. Our cash and cash investments consist of overnight interest bearing money market demand accounts, time deposit accounts, money market mutual funds containing government securities and treasury obligations. While we attempt to diversify these investments in a prudent manner to minimize risk, it is possible that future changes in the financial markets could affect the security or availability of these investments.
24
Of the $1.7 billion of cash, cash investments and short-term bank deposits we held at both December 31, 2015 and 2014, $630 million and $672 million, respectively, is held in our foreign subsidiaries. If these funds were needed for our operations in the U.S., their repatriation into the U.S. would not result in significant additional U.S. income tax or foreign withholding tax, as we have recorded such taxes on substantially all undistributed foreign earnings, except for those that are legally restricted.
We utilize derivative and hedging instruments to manage our exposure to currency fluctuations, primarily related to the European euro, British pound and the U.S. dollar; commodity cost fluctuations, primarily zinc and copper; and interest rate fluctuations, primarily related to debt issuances. We review our hedging program, derivative positions and overall risk management on a regular basis.
In the third quarter of 2015, we increased our quarterly dividend to $.095 per common share from $.09 per common share.
Our current ratio was 1.3 to 1 and 1.6 to 1 at December 31, 2015 and 2014, respectively. The decrease in the current ratio was due to the approximately $500 million increase in short-term notes payable at December 31, 2015 compared to December 31, 2014 due to scheduled debt maturities.
Cash Flows
Significant sources and (uses) of cash in the past three years are summarized as follows, in millions:
| |
2015 | 2014 | 2013 | |||||||
|---|---|---|---|---|---|---|---|---|---|---|
Net cash from operating activities |
$ | 699 | $ | 602 | $ | 645 | ||||
Retirement of notes |
(500 | ) | — | (200 | ) | |||||
Purchase of Company common stock |
(456 | ) | (158 | ) | (35 | ) | ||||
Cash dividends paid |
(126 | ) | (117 | ) | (107 | ) | ||||
Dividends paid to noncontrolling interest |
(36 | ) | (34 | ) | (34 | ) | ||||
Capital expenditures |
(158 | ) | (128 | ) | (126 | ) | ||||
Acquisition of businesses, net of cash acquired |
(41 | ) | (2 | ) | (7 | ) | ||||
Cash distributed to TopBuild Corp. |
(63 | ) | — | — | ||||||
Issuance of TopBuild Corp. debt |
200 | — | — | |||||||
Issuance of notes, net of issuance costs |
497 | — | — | |||||||
Proceeds from disposition of: |
||||||||||
Businesses, net of cash disposed |
— | — | 17 | |||||||
Property and equipment |
18 | 16 | 27 | |||||||
Financial investments, net |
9 | 63 | 15 | |||||||
Decrease in debt, net |
— | (2 | ) | (2 | ) | |||||
Proceeds (purchases) of short-term bank deposits, net |
26 | (20 | ) | 2 | ||||||
Effect of exchange rate changes on cash and cash investments |
(15 | ) | (45 | ) | (3 | ) | ||||
Other, net |
31 | (15 | ) | (9 | ) | |||||
| | | | | | | | | | | |
Cash increase |
$ | 85 | $ | 160 | $ | 183 | ||||
| | | | | | | | | | | |
| | | | | | | | | | | |
| | | | | | | | | | | |
Our working capital days were as follows:
| |
At December 31, |
||||||
|---|---|---|---|---|---|---|---|
| |
2015 | 2014 | |||||
Receivable days |
46 | 47 | |||||
Inventory days |
52 | 53 | |||||
Accounts Payable days |
69 | 67 | |||||
Working capital (receivables plus inventories, less accounts payable) as a % of net sales |
11.1 | % | 11.6 | % | |||
| | | | | | | | |
| | | | | | | | |
| | | | | | | | |
25
Net cash provided by operations of $699 million consisted primarily of net income adjusted for non-cash and certain other items, including depreciation and amortization expense of $133 million, a $212 million net increase in deferred taxes and other non-cash items, including stock-based compensation expense and amortization expense related to in-store displays.
Net cash used for financing activities was $410 million, primarily due to the retirement of $500 million of 4.8% Notes due June 2015, $456 million for the repurchase and retirement of company common stock (as part of our strategic initiative to drive shareholder value, and includes 741 thousand shares repurchased to offset the dilutive impact of long-term stock awards granted in 2015), $126 million for cash dividends paid and $36 million for dividends paid to noncontrolling interest. Other financing activities include the issuance of $497 million of notes, $75 million tax benefit from stock-based compensation, and $200 million of cash received from TopBuild as a result of its new debt financing agreement, offset by $63 million of cash distributed to TopBuild.
In September 2014, our Board of Directors authorized the repurchase of up to 50 million shares for retirement of our common stock in open-market transactions or otherwise, replacing the previous Board of Directors authorization established in 2007. At December 31, 2015, we had remaining authorization from our Board of Directors to repurchase up to an additional 27.8 million shares of our common stock. Consistent with past practice, we anticipate repurchasing shares in 2016 as part of our strategic initiative. As part of our capital management strategy, we expect to repurchase up to $500 million of our common stock in 2016. Some of these shares will be purchased to offset any dilution from long-term stock awards granted as part of our compensation programs.
We believe that our present cash balance and cash flows from operations are sufficient to fund our near-term working capital and other investment needs. We believe that our longer-term working capital and other general corporate requirements will be satisfied through cash flows from operations and, to the extent necessary, from bank borrowings and future financial market activities.
Net cash used for investing activities was $189 million, and included $158 million for capital expenditures, $41 million for acquisitions of companies, net of cash acquired, and $43 million for in-store displays. Investing activities also include net cash provided from the sale of short-term bank deposits of $26 million.
We continue to invest in our manufacturing and distribution operations to increase our productivity, improve customer service and support new product innovation. Capital expenditures for 2015 were $158 million, compared with $128 million for 2014 and $126 million for 2013. For 2016, capital expenditures, excluding any potential 2016 acquisitions, are expected to be approximately $190 million. Depreciation and amortization expense for 2015 totaled $133 million, compared with $167 million for 2014 and $186 million for 2013, including accelerated depreciation of $1 million and $13 million in 2014 and 2013, respectively. For 2016, depreciation and amortization expense, excluding any potential 2016 acquisitions, is expected to be approximately $140 million. Amortization expense totaled $11 million, $10 million and $11 million in 2015, 2014 and 2013, respectively.
Costs of environmental responsibilities and compliance with existing environmental laws and regulations have not had, nor do we expect them to have, a material effect on our capital expenditures, financial position or results of operations.
Consolidated Results of Operations
We report our financial results in accordance with GAAP in the United States. However, we believe that certain non-GAAP performance measures and ratios, used in managing the business, may provide users of this financial information with additional meaningful comparisons between current results and results in prior periods. Non-GAAP performance measures and ratios should be viewed in addition to, and not as an alternative for, our reported results under GAAP.
26
Sales and Operations
Net sales for 2015 were $7.1 billion, which increased two percent compared with 2014. Excluding acquisitions and the unfavorable effect of currency translation, net sales increased five percent compared to 2014. The following table reconciles reported net sales to net sales excluding acquisitions and the effect of currency translation, in millions:
| |
Year Ended December 31 |
||||||
|---|---|---|---|---|---|---|---|
| |
2015 | 2014 | |||||
Net sales, as reported |
$ | 7,142 | $ | 7,006 | |||
– Acquisitions |
(39 | ) | — | ||||
| | | | | | | | |
Net sales, excluding acquisitions |
7,103 | 7,006 | |||||
– Currency translation |
251 | — | |||||
| | | | | | | | |
Net sales, excluding acquisitions and the effect of currency |
$ | 7,354 | $ | 7,006 | |||
| | | | | | | | |
| | | | | | | | |
| | | | | | | | |
Net sales for 2015 were positively affected by increased sales volume of plumbing products, paints and stains, windows and builders' hardware, which, in aggregate, increased sales by approximately four percent compared to 2014. Net sales for 2015 were also positively affected by selling price increases of plumbing products, cabinets and windows, which, in aggregate, increased sales approximately one percent. Sales mix of North American cabinets and windows also positively affected 2015 net sales. Net sales for 2015 were negatively affected by lower sales volume of cabinets and lower selling prices of paints and stains.
Net sales for 2014 were positively affected by increased sales volume of North American plumbing products, paints and stains, builders' hardware and U.S. windows, which, in aggregate, increased sales by approximately three percent compared to 2013. Net sales for 2014 were also positively affected by selling prices for cabinets, international plumbing products, and windows, which, in aggregate, increased sales by approximately two percent. Net sales for 2014 were negatively affected by lower sales volume of cabinets and by lower selling prices of paints and stains.
Net sales for 2013 were positively affected by increased sales volume of North American cabinets (such increase in cabinets was partially offset by a less favorable product mix), plumbing products, paints and stains, builders' hardware and windows. Net sales of international plumbing products and cabinets also increased sales.
Our gross profit margins were 31.5 percent, 29.4 percent and 29.0 percent in 2015, 2014 and 2013, respectively. The 2015 and 2014 gross profit margins were positively affected by increased sales volume as well as a more favorable relationship between selling prices and commodity costs. Both 2015 and 2014 reflect the benefits associated with business rationalizations and other cost savings initiatives.
Selling, general and administrative expenses as a percent of sales were 18.7 percent in 2015 compared with 19.2 percent in 2014 and 19.9 percent in 2013. Selling, general and administrative expenses as a percent of sales in 2015 and 2014 reflect increased sales and the effect of cost containment measures.
27
The following table reconciles reported operating profit to operating profit, as adjusted to exclude certain items, dollars in millions:
| |
2015 | 2014 | 2013 | |||||||
|---|---|---|---|---|---|---|---|---|---|---|
Operating profit, as reported |
$ | 914 | $ | 721 | $ | 612 | ||||
Rationalization charges |
18 |
64 |
47 |
|||||||
Income from litigation settlements |
— | (9 | ) | — | ||||||
Gain from sales of property and equipment |
(5 | ) | — | — | ||||||
| | | | | | | | | | | |
Operating profit, as adjusted |
$ | 927 | $ | 776 | $ | 659 | ||||
| | | | | | | | | | | |
| | | | | | | | | | | |
| | | | | | | | | | | |
Operating profit margins, as reported |
12.8 | % | 10.3 | % | 9.1 | % | ||||
Operating profit margins, as adjusted |
13.0 | % | 11.1 | % | 9.7 | % | ||||
Operating profit margins in 2015 and 2014 were positively affected by increased sales volume, a more favorable relationship between selling prices and commodity costs and the benefits associated with business rationalizations and other cost savings initiatives. Operating profit in 2015 was negatively affected by foreign currency translation.
Other Income (Expense), Net
Other, net, for 2015 included net gains of $6 million from investments in private equity funds and $2 million from equity investments. Other, net, for 2015 also included realized foreign currency losses of $14 million and other miscellaneous items.
Other, net, for 2014 included net gains of $4 million from investments in private equity funds and realized foreign currency gains of $5 million and other miscellaneous items. Income from financial investments, net, for 2014 included losses from equity investments, net, of $2 million.
Other, net, for 2013 included income from equity investments, net, of $16 million and gains of $11 million from investments in private equity funds. Other, net, for 2013 also included realized foreign currency losses of $21 million and other miscellaneous items.
In 2013, in conjunction with the transaction to sell our Danish ready-to-assemble cabinet business (included in discontinued operations), we also disposed of a related Danish holding company. This disposition triggered the settlement of loans, which resulted in the recognition of $18 million of currency translation expense, which is included in other income (expense), net, from continuing operations in the statement of operations.
Interest expense was $225 million in 2015 and 2014, and $235 million in 2013.
Income and Earnings Per Common Share from Continuing Operations (Attributable to Masco Corporation)
Income and diluted income per common share from continuing operations for 2015 were $357 million and $1.03 per common share, respectively. Income and diluted income per common share from continuing operations for 2014 were $821 million and $2.28 per common share, respectively. Income and diluted income per common share from continuing operations for 2013 were $259 million and $.72 per common share, respectively.
Our effective tax rate on income from continuing operations was 43 percent tax expense, 71 percent tax benefit and 22 percent tax expense in 2015, 2014 and 2013, respectively. Compared to our normalized tax rate of 36 percent, the variance in 2015 is primarily due to a $21 million valuation allowance against certain deferred tax assets of TopBuild recorded as a non-cash charge to income tax expense. The TopBuild deferred tax assets have been impaired by our decision to spin off TopBuild into a separate company that on a stand-alone basis as of June 30, 2015, the spin off date, will unlikely be able to realize the value of such deferred tax assets as a result of its history of losses.
28
The 2015 effective tax rate also includes a $19 million charge to income tax expense to recognize the required taxes on substantially all undistributed foreign earnings, except for those that are legally restricted. This charge was the result of our determination that we may need to repatriate earnings from certain foreign subsidiaries that were previously considered permanently reinvested in order to provide greater flexibility in the execution of our capital management strategy.
The variance from our normalized tax rate in 2014 and 2013 is due primarily to changes in the U.S. Federal valuation allowance and reversal of an accrual for uncertain tax positions.
Outlook for the Company
During 2015, we made progress on our strategic priorities, which include leveraging opportunities across our businesses, driving the full potential of our core businesses and actively managing our portfolio.
We believe we will continue to see steady demand for our market-leading products, as both repair and remodel demand and new home construction continue to improve. We believe and are confident that the long-term fundamentals for home improvement activity and new home construction continue to be positive. We believe that our strong financial position, together with our current strategy of investing in our industry-leading branded building products, including KRAFTMAID® and MERILLAT® cabinets, DELTA®, PEERLESS® and HANSGROHE® faucet bath and shower fixtures, HOT SPRING® and CALDERA® spas, BEHR® paint primer and stain, KILZ® primer, LIBERTY® and BRAINERD® decorative hardware, and MILGARD® windows and doors, our continued focus on innovation and our commitment to operational excellence and disciplined capital allocation will allow us to drive long-term growth and create value for our shareholders.
Business Segment and Geographic Area Results
The following table sets forth our net sales and operating profit (loss) information by business segment and geographic area, dollars in millions.
| |
|
|
|
Percent Change |
||||||||||||
|---|---|---|---|---|---|---|---|---|---|---|---|---|---|---|---|---|
| |
2015 | 2014 | 2013 | 2015 vs. 2014 |
2014 vs. 2013 |
|||||||||||
Net Sales: |
||||||||||||||||
Cabinets and Related Products |
$ | 1,025 | $ | 999 | $ | 1,014 | 3 | % | (1 | )% | ||||||
Plumbing Products |
3,341 | 3,308 | 3,183 | 1 | % | 4 | % | |||||||||
Decorative Architectural Products |
2,020 | 1,998 | 1,927 | 1 | % | 4 | % | |||||||||
Other Specialty Products |
756 | 701 | 637 | 8 | % | 10 | % | |||||||||
| | | | | | | | | | | | | | | | | |
Total |
$ | 7,142 | $ | 7,006 | $ | 6,761 | 2 | % | 4 | % | ||||||
| | | | | | | | | | | | | | | | | |
| | | | | | | | | | | | | | | | | |
| | | | | | | | | | | | | | | | | |
North America |
$ | 5,645 | $ | 5,377 | $ | 5,222 | 5 | % | 3 | % | ||||||
International, principally Europe |
1,497 | 1,629 | 1,539 | (8 | )% | 6 | % | |||||||||
| | | | | | | | | | | | | | | | | |
Total |
$ | 7,142 | $ | 7,006 | $ | 6,761 | 2 | % | 4 | % | ||||||
| | | | | | | | | | | | | | | | | |
| | | | | | | | | | | | | | | | | |
| | | | | | | | | | | | | | | | | |
29
| |
2015 | 2014 | 2013 | |||||||
|---|---|---|---|---|---|---|---|---|---|---|
Operating Profit (Loss): (A) |
||||||||||
Cabinets and Related Products |
$ | 51 | $ | (62 | ) | $ | (10 | ) | ||
Plumbing Products |
512 | 512 | 394 | |||||||
Decorative Architectural Products |
403 | 360 | 351 | |||||||
Other Specialty Products |
57 | 47 | 35 | |||||||
| | | | | | | | | | | |
Total |
$ | 1,023 | $ | 857 | $ | 770 | ||||
| | | | | | | | | | | |
| | | | | | | | | | | |
| | | | | | | | | | | |
North America |
$ | 841 | $ | 643 | $ | 612 | ||||
International, principally Europe |
182 | 214 | 158 | |||||||
| | | | | | | | | | | |
Total |
1,023 | 857 | 770 | |||||||
General corporate expense, net |
(109 |
) |
(145 |
) |
(158 |
) |
||||
Income from litigation settlements |
9 | — | ||||||||
| | | | | | | | | | | |
Total operating profit |
$ | 914 | $ | 721 | $ | 612 | ||||
| | | | | | | | | | | |
| | | | | | | | | | | |
| | | | | | | | | | | |
| |
2015 | 2014 | 2013 | |||||||
|---|---|---|---|---|---|---|---|---|---|---|
Operating Profit (Loss) Margin: (A) |
||||||||||
Cabinets and Related Products |
5.0 | % | (6.2 | )% | (1.0 | )% | ||||
Plumbing Products |
15.3 | % | 15.5 | % | 12.4 | % | ||||
Decorative Architectural Products |
20.0 | % | 18.0 | % | 18.2 | % | ||||
Other Specialty Products |
7.5 | % | 6.7 | % | 5.5 | % | ||||
North America |
14.9 |
% |
12.0 |
% |
11.7 |
% |
||||
International, principally Europe |
12.2 | % | 13.1 | % | 10.3 | % | ||||
Total |
14.3 | % | 12.2 | % | 11.4 | % | ||||
Total operating profit margin, as reported |
12.8 |
% |
10.3 |
% |
9.1 |
% |
||||
- (A)
- Before general corporate expense, net, and certain income from litigation settlements; see Note P to the consolidated financial statements.
Business Segment Results Discussion
Changes in operating profit margins in the following Business Segment and Geographic Area Results discussion exclude general corporate expense, net, and income from litigation settlements.
Business Rationalizations and Other Initiatives
Over the last several years, we have taken several actions focused on the strategic rationalization of our businesses including business consolidations, plant closures, headcount reductions and other cost savings initiatives. For the years ended December 31, 2015, 2014 and 2013, we incurred net pre-tax costs and charges related to these initiatives of $18 million, $64 million, and $47 million, respectively.
We continue to realize the benefits of our business rationalizations and continuous improvement initiatives across our enterprise and expect to identify additional opportunities to improve our business operations. We do not anticipate that any costs and charges related to our ongoing commitment to continuous improvement will be as significant as they have been in previous years.
During 2015, our Plumbing segment incurred costs of $9 million primarily related to severance and other cost savings initiatives across multiple businesses. Our cabinet business continued to incur costs and charges of $5 million primarily related to cost savings initiatives in North America. Our corporate office incurred $4 million in costs primarily related to severance actions.
During 2014, our North American cabinet business incurred costs and charges of $31 million primarily related to actions taken to sell two previously idled manufacturing facilities. Our corporate office incurred $27 million in costs primarily related to severance actions. Finally, we incurred $6 million of costs and charges across our business units related to other cost savings initiatives.
30
During 2013, our North American cabinet business incurred costs and charges of $11 million related to the closure of a cabinet components facility and additional severance. Our Plumbing Products segment incurred costs of $16 million related to a plant consolidation and severance in our bathing systems business in North America. Finally, we incurred $20 million of costs and charges across our business units related to other cost savings initiatives.
Based on current plans, we anticipate costs and charges related to our business rationalizations and other initiatives to approximate $8 million in 2016. We continue to evaluate our businesses and may implement additional rationalization programs based on changes in our markets which could result in further costs and charges.
Cabinets and Related Products
Sales
Net sales of Cabinets and Related Products increased three percent in 2015 compared to 2014. Net sales increased primarily due to a favorable sales mix and selling price of North American and international cabinets, which increased sales by six percent compared to 2014. Net sales decreased due to decreased sales volumes in both North America and international cabinets, which on a combined basis decreased sales by three percent compared to 2014.
Net sales in this segment in 2014 decreased primarily due to lower sales volume and a less favorable product mix of North American operations, which decreased sales by nine percent compared to 2013. Such decreases more than offset increased selling prices in North America and increased sales volume and a more favorable product mix of international cabinets, which increased sales by seven percent compared to 2013.
Net sales in this segment in 2013 increased primarily due to increased sales volume of North American and International operations and by increased selling prices in North America. Such increases were partially offset by a less favorable product mix in North America.
Operating Results
Operating margins in the Cabinets and Related Products segment in 2015 were positively affected by operational efficiencies due to the benefits associated with business rationalization activities and other cost savings initiatives and decreased business rationalization expenses. Operating margins were also positively affected by a more favorable relationship between selling prices and commodity costs and a favorable product mix.
Operating margins in this segment in 2014 were negatively affected by lower North American sales volume and the related under-absorption of fixed costs as well as increased business rationalization expenses. Operating margins were also negatively affected by a less favorable product mix. Such declines more than offset a more favorable relationship between selling prices and commodity costs and the benefits associated with business rationalization activities and other cost savings initiatives.
Operating margins in this segment in 2013 were positively affected by lower business rationalization expenses and the benefits associated with such expenses incurred in prior years. Operating margins were also positively affected by a more favorable relationship between selling prices and commodity costs, as well as increased sales volume and the related absorption of fixed costs. Such increases were partially offset by a less favorable product mix.
31
Plumbing Products
Sales
Net sales of Plumbing Products increased one percent in 2015 compared to 2014. Net sales increased primarily due to increased sales volume of North American and international operations, which increased sales by five percent, and selling price increases primarily related to international operations, which increased sales by two percent. An acquisition also positively impacted sales by one percent compared to 2014. Foreign currency translation reduced sales by seven percent compared to 2014, primarily due to the stronger U.S. dollar. Excluding the impact of foreign currency translation, segment sales increased by eight percent in 2015.
Net sales in this segment increased in 2014 primarily due to increased sales volume of both North American and International operations, which, in aggregate, increased sales by four percent compared to 2013. This segment was also positively affected by increased selling prices of International plumbing products.
Net sales in this segment increased in 2013 primarily due to increased sales volume, increased selling prices and a weaker U.S. dollar. Such increases were partially offset by the loss of a portion of our bath products business.
Operating Results
Operating margins in this segment in 2015 were negatively impacted by unfavorable product mix, as well as an increase in certain variable expenses such as trade show and marketing expenses and legal-related expenses. Such decreases were partially offset by increased sales volume and a favorable relationship between selling prices and commodity costs (including the negative impact of metal hedge contracts). Although operating margins were not significantly impacted, foreign currency translation, primarily due to a stronger U.S. dollar, negatively impacted operating profit by six percent compared to 2014.
Operating margins in this segment in 2014 were positively affected by increased sales volume, a more favorable relationship between selling prices and commodity costs (including the positive impact of the metal hedge contracts), lower business rationalization expenses and the benefits associated with business rationalization activities and other cost savings initiatives.
Operating margins in this segment in 2013 were positively affected by increased sales volume and a more favorable relationship between selling prices and commodity costs (including the negative impact of the metal hedge contracts), partially offset by a less favorable product mix.
Decorative Architectural Products
Sales
Net sales of Decorative Architectural Products increased in 2015, primarily due to increased sales volume of paints and stains related to the expansion of the BEHR PRO® business and increased sales volume of builders' hardware. Such increases were partially offset by lower selling prices, higher promotions of paints and stains and an unfavorable currency impact of Canadian paints and stains sales.
Net sales in this segment increased in 2014, primarily due to increased sales volume of paints and stains related to new product introductions and other growth initiatives and increased sales volume of builders' hardware, partially offset by lower selling prices of paints and stains.
Net sales in this segment increased in 2013, primarily due to increased sales volume of paints and stains and builders' hardware, partially offset by lower selling prices of paints and stains.
32
Operating Results
Operating margins in the Decorative Architectural Products segment increased in 2015, reflecting operational efficiencies due to benefits associated with cost savings initiatives, a more favorable relationship between selling prices and commodity costs and increased sales volume of paints and stains and builders' hardware. Such increases were partially offset by an increase in advertising and display expenses. Operating margins were also negatively impacted by unfavorable currency effects from our Canadian operating results due to the stronger U.S. dollar in 2015.
Operating margins in this segment in 2014 reflect a less favorable relationship between selling prices and commodity costs, a less favorable product mix of paints and stains and costs for new product introductions and advertising. Such decreases more than offset the benefits associated with cost savings initiatives.
Operating margins in this segment in 2013 reflect the benefits of increased sales volume of paints and stains and builders' hardware. Such benefits were partially offset by a less favorable relationship between selling prices and commodity costs and increased promotional and advertising costs.
Other Specialty Products
Sales
Net sales of Other Specialty Products increased eight percent in 2015 compared to 2014. Net sales increased primarily due to increased sales volume and a favorable product mix of North American windows in the Western U.S., which, on a combined basis, increased sales by seven percent compared to 2014. An acquisition positively impacted sales by one percent compared to 2014. This segment was also positively affected by selling price increases, increased sales volume and a favorable mix of our U.K. windows business compared to 2014. A stronger U.S. dollar decreased sales by two percent compared to 2014.
Net sales in this segment increased in 2014 primarily due to more favorable product mix, increased selling prices and increased sales volume of North American windows in the Western U.S. which, in aggregate, increased sales by eight percent compared to 2013. This segment was also positively affected by a more favorable product mix and increased selling prices of our U.K. windows business, which increased sales in this segment by two percent compared to 2013. A weaker U.S. dollar increased sales by one percent in 2014 compared to 2013. Such increases were partially offset by lower sales volume and lower selling prices of staple gun tackers and other fastening tools.
Net sales in this segment increased in 2013 primarily due to increased sales volume, increased selling prices and a more favorable product mix of windows in North America. Such increases were partially offset by lower sales volume and lower selling prices of staple gun tackers and other fastening tools.
Operating Results
Operating margins in the Other Specialty Products segment increased in 2015 primarily due to a higher sales volume and favorable mix of windows in the Western U.S., and a more favorable relationship between selling prices and commodity costs of windows in the U.S. and U.K. Such increases were partially offset by an increase in certain expenses such as advertising and system implementation costs in 2015.
Operating margins in this segment in 2014 reflect a more favorable relationship between selling prices and commodity costs, a more favorable product mix of U.S. and U.K. windows and increased sales volume in the western U.S. Such positive results were partially offset by lower sales volume and lower selling prices of staple gun tackers and other fastening tools.
33
Operating margins in this segment in 2013 reflect increased sales volume and the related absorption of fixed costs, as well as a more favorable relationship between selling prices and commodity costs. This segment also reflects the benefits associated with the business rationalizations and other cost savings initiatives. Such positive results were partially offset by lower sales volume and lower selling prices of staple gun tackers and other fastening tools.
Geographic Area Results Discussion
North America
Sales
North American net sales in 2015 were positively impacted by increased sales volume of plumbing products, paints and stains, windows and builders' hardware which more than offset negative sales volume of cabinets. In aggregate, sales volume increased North American sales by approximately four percent compared to 2014. Net sales were also positively impacted by a favorable sales mix of North American cabinets and windows, which in aggregate, increased sales by approximately one percent compared to 2014. Net sales were also positively affected by increased selling prices of cabinets, plumbing products and windows, which increased sales by approximately one percent compared to 2014. An acquisition also positively impacted sales by one percent compared to 2014. Such increases were partially offset by foreign currency translation, primarily due to the stronger U.S. dollar and lower selling prices of paints and stains.
North American net sales in 2014 were positively impacted by increased sales volume of plumbing products, paints and stains, builders' hardware and windows which, in aggregate, increased sales by approximately four percent compared to 2013. Net sales were also positively affected by increased selling prices of cabinets and windows, which increased sales by approximately one percent compared to 2013. Such increases were partially offset by lower sales volume of cabinets and lower selling prices of paints and stains.
North American net sales in 2013 were positively impacted by increased sales volume of plumbing products, paints and stains, windows, cabinets (such increase in cabinets was partially offset by a less favorable product mix), and builders' hardware, as well as increased selling prices of cabinets and windows. Such increases were partially offset by lower selling prices of paints and stains.
Operating Results
Operating margins from North American operations in 2015 were positively affected by increased sales volume, as well as a more favorable relationship between selling prices and commodity costs. North American operations were also positively affected by the benefits associated with past business rationalization and other cost savings initiatives and decreased business rationalization expenses.
Operating margins from North American operations in 2014 were positively affected by increased sales volume, as well as a more favorable relationship between selling prices and commodity costs. North American operations were also positively affected by the benefits associated with past business rationalization and other cost savings initiatives.
Operating margins from North American operations in 2013 were positively affected by increased sales volume and the related absorption of fixed costs, as well as a more favorable relationship between selling prices and commodity costs. North American operations were also positively affected by lower business rationalization expenses and the benefits associated with business rationalization and other cost savings initiatives.
34
International, Principally Europe
Sales
Net sales from International operations decreased by eight percent in 2015 compared to 2014, due primarily to a stronger U.S. dollar in 2015. In local currencies (including sales in foreign currencies outside their respective functional currencies), net sales increased five percent compared to 2014, primarily due to increased selling prices and sales volume for international plumbing products. An acquisition also positively impacted net sales by one percent compared to 2014, partially offset by lower sales volumes for international cabinets.
Net sales from International operations in 2014 increased four percent in local currencies compared to 2013, primarily due to increased selling prices and sales volume for international plumbing products and a more favorable product mix of cabinets and windows. A weaker U.S. dollar increased international net sales by one percent in 2014 compared to 2013.
Net sales from International operations in 2013 were positively affected by increased sales volume of international plumbing products and cabinets and increased selling prices for international plumbing products.
Operating Results
Operating margins from International operations in 2015 were negatively affected by unfavorable product mix and increased costs to support future sales growth initiatives, partially offset by a more favorable relationship between selling prices and commodity costs, primarily related to international plumbing products. Although operating margins were not significantly impacted, foreign currency translation, primarily due to a stronger U.S. dollar, negatively impacted operating profit by 14 percent compared to 2014.
Operating margins from International operations in 2014 were positively affected by a more favorable relationship between selling prices and commodity costs, primarily related to international plumbing products.
Operating margins from International operations in 2013 were positively affected by a more favorable relationship between selling prices and commodity costs, primarily related to international plumbing products and the benefits associated with business rationalizations and other cost savings initiatives, partially offset by a less favorable product mix.
Other Matters
Commitments and Contingencies
Litigation
Information regarding our legal proceedings is set forth in Note U to the consolidated financial statements, which is incorporated herein by reference.
Other Commitments
We enter into contracts, which include reasonable and customary indemnifications that are standard for the industries in which we operate. Such indemnifications include claims made against builders by homeowners for issues relating to our products and workmanship. In conjunction with divestitures and other transactions, we occasionally provide reasonable and customary indemnifications relating to various items, including: the enforceability of trademarks; legal and environmental issues; and provisions for sales returns. We have never had to pay a material amount related to these indemnifications, and we
35
evaluate the probability that amounts may be incurred and we appropriately record an estimated liability when probable.
Recently Issued Accounting Pronouncements
In April 2014, the Financial Accounting Standards Board ("FASB") issued Accounting Standards Update 2014-8 ("ASU 2014-08"), "Reporting of Discontinued Operations and Disclosure of Disposals of Components of an Entity," which changes the criteria for determining which disposals can be presented as discontinued operations and modifies the related disclosure requirements. We adopted this guidance beginning January 1, 2015. The adoption of this new guidance did not have a material impact on our financial position or our results of operations.
In November 2015, the FASB issued Accounting Standards Update 2015-17 ("ASU 2015-17"), "Balance Sheet Classification of Deferred Taxes," which changes the criteria for classifying deferred tax balances by requiring all deferred taxes be presented as noncurrent on the balance sheet. We retrospectively adopted this guidance on December 31, 2015. As a result of the retrospective adoption of this standard, current assets decreased by $244 million, non-current assets increased by $219 million and non-current liabilities decreased by $25 million as of December 31, 2014.
In May 2014, FASB issued a new standard for revenue recognition, Accounting Standards Codification 606 ("ASC 606"). The purpose of ASC 606 is to provide a single, comprehensive revenue recognition model for all contracts with customers to improve comparability across industries. ASC 606 is effective for us for annual periods beginning January 1, 2018. We are currently evaluating the impact the adoption of this new standard will have on our results of operations.
In February 2015, the FASB issued Accounting Standards Update 2015-02 ("ASU 2015-02") "Consolidation (Topic 810) – Amendments to the Consolidations Analysis," which modifies certain aspects of both the variable interest entities and voting interest entities models. ASU 2015-02 is effective for us for annual periods beginning January 1, 2016. We do not expect that the adoption will have a significant impact on our financial position or our results of operations.
In April 2015, the FASB issued Accounting Standards Update 2015-03 ("ASU 2015-03") "Interest – Imputation of Interest (Subtopic 835-30) – Simplifying the Presentation of Debt Issuance Costs," that requires that all costs incurred to issue debt be presented in the balance sheet as a direct deduction from the carrying value of the debt. In August 2015, the FASB issued ASU 2015-15 to clarify that debt issuance costs related to line-of-credit arrangements may remain classified as an asset. Both ASU 2015-03 and ASU 2015-15 are effective for us for annual periods beginning January 1, 2016. We do not expect that the adoptions will have a significant impact on our financial position.
36
Contractual Obligations
The following table provides payment obligations related to current contracts at December 31, 2015, in millions:
| |
Payments Due by Period | ||||||||||||||||||
|---|---|---|---|---|---|---|---|---|---|---|---|---|---|---|---|---|---|---|---|
| |
2016 | 2017 - 2018 |
2019 - 2020 |
Beyond 2020 |
Other (D) | Total | |||||||||||||
Debt (A) |
$ | 1,005 | $ | 416 | $ | 502 | $ | 1,500 | $ | — | $ | 3,423 | |||||||
Interest (A) |
196 | 262 | 220 | 547 | — | 1,225 | |||||||||||||
Operating leases |
38 | 47 | 27 | 65 | — | 177 | |||||||||||||
Currently payable income taxes |
9 | — | — | — | — | 9 | |||||||||||||
Private equity funds (B) |
3 | 3 | — | — | — | 6 | |||||||||||||
Purchase commitments (C) |
241 | 3 | — | — | — | 244 | |||||||||||||
Uncertain tax positions, including interest and penalties (D) |
— | — | — | — | 53 | 53 | |||||||||||||
| | | | | | | | | | | | | | | | | | | | |
Total |
$ | 1,492 | $ | 731 | $ | 749 | $ | 2,112 | $ | 53 | $ | 5,137 | |||||||
| | | | | | | | | | | | | | | | | | | | |
| | | | | | | | | | | | | | | | | | | | |
| | | | | | | | | | | | | | | | | | | | |
- (A)
- We assumed that all debt would be held to maturity.
- (B)
- There is no schedule for the capital commitments to the private equity funds; such allocation was estimated.
- (C)
- Excludes contracts that do not require volume commitments and open or pending purchase orders.
- (D)
- Due to the high degree of uncertainty regarding the timing of future cash outflows associated with uncertain tax positions, we are unable to make a reasonable estimate for the period beyond the next year in which cash settlements may occur with applicable tax authorities.
Refer to Note M of our financial statements for defined-benefit plan obligations.
37
Item 7A. Quantitative and Qualitative Disclosures about Market Risk.
We have considered the provisions of accounting guidance regarding disclosure of accounting policies for derivative financial instruments and derivative commodity instruments, and disclosure of quantitative and qualitative information about market risk inherent in derivative financial instruments, other financial instruments and derivative commodity instruments.
We are exposed to the impact of changes in interest rates, foreign currency exchange rates and commodity costs in the normal course of business and to market price fluctuations related to our financial investments. We have involvement with derivative financial instruments and use such instruments to the extent necessary to manage exposure to foreign currency fluctuations and commodity fluctuations. See Note F to the consolidated financial statements for additional information regarding our derivative instruments.
At December 31, 2015, we performed sensitivity analyses to assess the potential loss in the fair values of market risk sensitive instruments resulting from a hypothetical change of 10 percent in foreign currency exchange rates, a 10 percent decline in the market value of our long-term investments, a 10 percent change in commodity costs, or a 10 percent change in interest rates. Based upon the analyses performed, such changes would not be expected to materially affect our consolidated financial position, results of operations or cash flows.
38
Item 8. Financial Statements and Supplementary Data
Management's Report on Internal Control Over Financial Reporting
The management of Masco Corporation is responsible for establishing and maintaining adequate internal control over financial reporting. Masco Corporation's internal control over financial reporting is a process designed to provide reasonable assurance regarding the reliability of financial reporting and the preparation of financial statements for external purposes in accordance with accounting principles generally accepted in the United States of America.
The management of Masco Corporation assessed the effectiveness of the Company's internal control over financial reporting as of December 31, 2015 using the criteria set forth by the Committee of Sponsoring Organizations of the Treadway Commission (COSO) in "Internal Control – Integrated Framework." Based on this assessment, management has determined that the Company's internal control over financial reporting was effective as of December 31, 2015.
PricewaterhouseCoopers LLP, an independent registered public accounting firm, performed an audit of the Company's consolidated financial statements and of the effectiveness of Masco Corporation's internal control over financial reporting as of December 31, 2015. Their report expressed an unqualified opinion on the effectiveness of Masco Corporation's internal control over financial reporting as of December 31, 2015 and expressed an unqualified opinion on the Company's 2015 consolidated financial statements. This report appears under 'Item 8. Financial Statements and Supplementary Data' under the heading "Report of Independent Registered Public Accounting Firm."
39
Report of Independent Registered Public Accounting Firm
To
the Board of Directors and Shareholders
of Masco Corporation:
In our opinion, the consolidated financial statements listed in the index appearing under Item 15(a) (1) present fairly, in all material respects, the financial position of Masco Corporation and its subsidiaries at December 31, 2015 and 2014, and the results of their operations and their cash flows for each of the three years in the period ended December 31, 2015 in conformity with accounting principles generally accepted in the United States of America. In addition, in our opinion, the financial statement schedule listed in the index appearing under Item 15(a)(2) presents fairly, in all material respects, the information set forth therein when read in conjunction with the related consolidated financial statements. Also in our opinion, the Company maintained, in all material respects, effective internal control over financial reporting as of December 31, 2015, based on criteria established in Internal Control – Integrated Framework (2013) issued by the Committee of Sponsoring Organizations of the Treadway Commission (COSO). The Company's management is responsible for these financial statements and financial statement schedule, for maintaining effective internal control over financial reporting and for its assessment of the effectiveness of internal control over financial reporting, included in Management's Report on Internal Control over Financial Reporting appearing under Item 8. Our responsibility is to express opinions on these financial statements, on the financial statement schedule, and on the Company's internal control over financial reporting based on our integrated audits. We conducted our audits in accordance with the standards of the Public Company Accounting Oversight Board (United States). Those standards require that we plan and perform the audits to obtain reasonable assurance about whether the financial statements are free of material misstatement and whether effective internal control over financial reporting was maintained in all material respects. Our audits of the financial statements included examining, on a test basis, evidence supporting the amounts and disclosures in the financial statements, assessing the accounting principles used and significant estimates made by management, and evaluating the overall financial statement presentation. Our audit of internal control over financial reporting included obtaining an understanding of internal control over financial reporting, assessing the risk that a material weakness exists, and testing and evaluating the design and operating effectiveness of internal control based on the assessed risk. Our audits also included performing such other procedures as we considered necessary in the circumstances. We believe that our audits provide a reasonable basis for our opinions.
A company's internal control over financial reporting is a process designed to provide reasonable assurance regarding the reliability of financial reporting and the preparation of financial statements for external purposes in accordance with generally accepted accounting principles. A company's internal control over financial reporting includes those policies and procedures that (i) pertain to the maintenance of records that, in reasonable detail, accurately and fairly reflect the transactions and dispositions of the assets of the company; (ii) provide reasonable assurance that transactions are recorded as necessary to permit preparation of financial statements in accordance with generally accepted accounting principles, and that receipts and expenditures of the company are being made only in accordance with authorizations of management and directors of the company; and (iii) provide reasonable assurance regarding prevention or timely detection of unauthorized acquisition, use, or disposition of the company's assets that could have a material effect on the financial statements.
Because of its inherent limitations, internal control over financial reporting may not prevent or detect misstatements. Also, projections of any evaluation of effectiveness to future periods are subject to the risk that controls may become inadequate because of changes in conditions, or that the degree of compliance with the policies or procedures may deteriorate.
/s/
PricewaterhouseCoopers LLP
Detroit, Michigan
February 12, 2016
40
Financial Statements and Supplementary Data
MASCO CORPORATION and Consolidated Subsidiaries
CONSOLIDATED BALANCE SHEETS
at December 31, 2015 and 2014
| (In Millions, Except Share Data) |
|||||||
|---|---|---|---|---|---|---|---|
| |
2015 | 2014 | |||||
ASSETS |
|||||||
Current Assets: |
|||||||
Cash and cash investments |
$ | 1,468 | $ | 1,379 | |||
Short-term bank deposits |
248 | 306 | |||||
Receivables |
853 | 820 | |||||
Inventories |
687 | 712 | |||||
Prepaid expenses and other |
72 | 68 | |||||
Assets held for sale |
— | 335 | |||||
| | | | | | | | |
Total current assets |
3,328 | 3,620 | |||||
Property and equipment, net |
1,027 | 1,046 | |||||
Goodwill |
839 | 840 | |||||
Other intangible assets, net |
160 | 142 | |||||
Other assets |
326 | 419 | |||||
Assets held for sale |
— | 1,141 | |||||
| | | | | | | | |
Total Assets |
$ | 5,680 | $ | 7,208 | |||
| | | | | | | | |
| | | | | | | | |
| | | | | | | | |
LIABILITIES and EQUITY |
|||||||
Current Liabilities: |
|||||||
Accounts payable |
$ | 749 | $ | 721 | |||
Notes payable |
1,005 | 505 | |||||
Accrued liabilities |
752 | 685 | |||||
Liabilities held for sale |
— | 300 | |||||
| | | | | | | | |
Total current liabilities |
2,506 | 2,211 | |||||
Long-term debt |
2,418 | 2,919 | |||||
Other liabilities |
698 | 781 | |||||
Liabilities held for sale |
— | 169 | |||||
| | | | | | | | |
Total Liabilities |
5,622 | 6,080 | |||||
| | | | | | | | |
Commitments and contingencies (Note U) |
|||||||
Equity: |
|||||||
Masco Corporation's shareholders' equity Common shares authorized: 1,400,000,000; issued and outstanding: |
330 | 345 | |||||
Preferred shares authorized: 1,000,000; issued and outstanding: |
— | — | |||||
Paid-in capital |
— | — | |||||
Retained (deficit) earnings |
(300 | ) | 690 | ||||
Accumulated other comprehensive loss |
(165 | ) | (111 | ) | |||
| | | | | | | | |
Total Masco Corporation's shareholders' (deficit) equity |
(135 | ) | 924 | ||||
Noncontrolling interest |
193 | 204 | |||||
| | | | | | | | |
Total Equity |
58 | 1,128 | |||||
| | | | | | | | |
Total Liabilities and Equity |
$ | 5,680 | $ | 7,208 | |||
| | | | | | | | |
| | | | | | | | |
| | | | | | | | |
See notes to consolidated financial statements.
41
MASCO CORPORATION and Consolidated Subsidiaries
CONSOLIDATED STATEMENTS OF OPERATIONS
for the years ended December 31, 2015, 2014 and 2013
| (In Millions, Except Per Common Share Data) |
||||||||||
|---|---|---|---|---|---|---|---|---|---|---|
| |
2015 | 2014 | 2013 | |||||||
Net sales |
$ | 7,142 | $ | 7,006 | $ | 6,761 | ||||
Cost of sales |
4,889 | 4,946 | 4,802 | |||||||
| | | | | | | | | | | |
Gross profit |
2,253 | 2,060 | 1,959 | |||||||
Selling, general and administrative expenses |
1,339 | 1,347 | 1,347 | |||||||
Income from litigation settlements |
— | (9 | ) | — | ||||||
Impairment charge for other intangible assets |
— | 1 | — | |||||||
| | | | | | | | | | | |
Operating profit |
914 | 721 | 612 | |||||||
| | | | | | | | | | | |
Other income (expense), net: |
||||||||||
Interest expense |
(225 | ) | (225 | ) | (235 | ) | ||||
Other, net |
— | 11 | 9 | |||||||
| | | | | | | | | | | |
|
(225 | ) | (214 | ) | (226 | ) | ||||
| | | | | | | | | | | |
Income from continuing operations before income taxes |
689 | 507 | 386 | |||||||
Income tax expense (benefit) |
293 | (361 | ) | 86 | ||||||
| | | | | | | | | | | |
Income from continuing operations |
396 | 868 | 300 | |||||||
(Loss) income from discontinued operations, net |
(2 | ) | 35 | 29 | ||||||
| | | | | | | | | | | |
Net income |
394 | 903 | 329 | |||||||
Less: Net income attributable to noncontrolling interest |
39 | 47 | 41 | |||||||
| | | | | | | | | | | |
Net income attributable to Masco Corporation |
$ | 355 | $ | 856 | $ | 288 | ||||
| | | | | | | | | | | |
| | | | | | | | | | | |
| | | | | | | | | | | |
Income (loss) per common share attributable to Masco Corporation: |
||||||||||
Basic: |
||||||||||
Income from continuing operations |
$ | 1.04 | $ | 2.31 | $ | .72 | ||||
(Loss) income from discontinued operations, net |
(.01 | ) | .10 | .08 | ||||||
| | | | | | | | | | | |
Net income |
$ | 1.03 | $ | 2.40 | $ | .80 | ||||
| | | | | | | | | | | |
| | | | | | | | | | | |
| | | | | | | | | | | |
Diluted: |
||||||||||
Income from continuing operations |
$ | 1.03 | $ | 2.28 | $ | .72 | ||||
(Loss) income from discontinued operations, net |
(.01 | ) | .10 | .08 | ||||||
| | | | | | | | | | | |
Net income |
$ | 1.02 | $ | 2.38 | $ | .80 | ||||
| | | | | | | | | | | |
| | | | | | | | | | | |
| | | | | | | | | | | |
Amounts attributable to Masco Corporation: |
||||||||||
Income from continuing operations |
$ | 357 | $ | 821 | $ | 259 | ||||
(Loss) income from discontinued operations, net |
(2 | ) | 35 | 29 | ||||||
| | | | | | | | | | | |
Net income |
$ | 355 | $ | 856 | $ | 288 | ||||
| | | | | | | | | | | |
| | | | | | | | | | | |
| | | | | | | | | | | |
See notes to consolidated financial statements.
42
MASCO CORPORATION and Consolidated Subsidiaries
CONSOLIDATED STATEMENTS OF COMPREHENSIVE INCOME (LOSS)
for the years ended December 31, 2015, 2014 and 2013
| (In Millions) |
||||||||||
|---|---|---|---|---|---|---|---|---|---|---|
| |
2015 | 2014 | 2013 | |||||||
Net income |
$ | 394 | $ | 903 | $ | 329 | ||||
Less: Net income attributable to noncontrolling interest |
39 | 47 | 41 | |||||||
| | | | | | | | | | | |
Net income attributable to Masco Corporation |
$ | 355 | $ | 856 | $ | 288 | ||||
| | | | | | | | | | | |
| | | | | | | | | | | |
| | | | | | | | | | | |
Other comprehensive (loss) income, net of tax (see Note O): |
||||||||||
Cumulative translation adjustment |
$ | (96 | ) | $ | (124 | ) | $ | (75 | ) | |
Interest rate swaps |
2 | 1 | 2 | |||||||
Pension and other post-retirement benefits |
26 | (140 | ) | 138 | ||||||
| | | | | | | | | | | |
Other comprehensive (loss) income |
(68 | ) | (263 | ) | 65 | |||||
Less: Other comprehensive (loss) income attributable to the noncontrolling interest: |
||||||||||
Cumulative translation adjustment |
$ | (16 | ) | $ | (31 | ) | $ | 8 | ||
Pension and other post-retirement benefits |
2 | (6 | ) | 1 | ||||||
| | | | | | | | | | | |
|
(14 | ) | (37 | ) | 9 | |||||
Other comprehensive (loss) income attributable to Masco Corporation |
$ | (54 | ) | $ | (226 | ) | $ | 56 | ||
| | | | | | | | | | | |
| | | | | | | | | | | |
| | | | | | | | | | | |
Total comprehensive income |
$ | 326 | $ | 640 | $ | 394 | ||||
| | | | | | | | | | | |
Less: Total comprehensive income attributable to noncontrolling interest |
25 | 10 | 50 | |||||||
| | | | | | | | | | | |
Total comprehensive income attributable to Masco Corporation |
$ | 301 | $ | 630 | $ | 344 | ||||
| | | | | | | | | | | |
| | | | | | | | | | | |
| | | | | | | | | | | |
See notes to consolidated financial statements.
43
MASCO CORPORATION and Consolidated Subsidiaries
CONSOLIDATED STATEMENTS OF CASH FLOWS
for the years ended December 31, 2015, 2014 and 2013
| |
(In Millions) |
|||||||||
|---|---|---|---|---|---|---|---|---|---|---|
| |
2015 | 2014 | 2013 | |||||||
CASH FLOWS FROM (FOR) OPERATING ACTIVITIES: |
||||||||||
Net income |
$ | 394 | $ | 903 | $ | 329 | ||||
Depreciation and amortization |
133 | 167 | 186 | |||||||
Display amortization |
20 | 15 | 19 | |||||||
Deferred income taxes |
212 | (406 | ) | 42 | ||||||
Non-cash loss on disposition of businesses, net |
— | 2 | 15 | |||||||
(Gain) on disposition of investments, net |
(7 | ) | (2 | ) | (10 | ) | ||||
Pension and other postretirement benefits |
(18 | ) | (36 | ) | (23 | ) | ||||
Impairment of property and equipment, net |
2 | 27 | — | |||||||
Stock-based compensation |
41 | 47 | 54 | |||||||
(Increase) in receivables |
(104 | ) | (81 | ) | (85 | ) | ||||
Decrease (increase) in inventories |
17 | (75 | ) | (24 | ) | |||||
Increase in accounts payable and accrued liabilities, net |
82 | 63 | 147 | |||||||
Other items, net |
(73 | ) | (22 | ) | (5 | ) | ||||
| | | | | | | | | | | |
Net cash from operating activities |
699 | 602 | 645 | |||||||
| | | | | | | | | | | |
CASH FLOWS FROM (FOR) FINANCING ACTIVITIES: |
||||||||||
Retirement of notes |
(500 | ) | — | (200 | ) | |||||
Purchase of Company common stock |
(456 | ) | (158 | ) | (35 | ) | ||||
Cash dividends paid |
(126 | ) | (117 | ) | (107 | ) | ||||
Dividends paid to noncontrolling interest |
(36 | ) | (34 | ) | (34 | ) | ||||
Cash distributed to TopBuild Corp. |
(63 | ) | — | — | ||||||
Issuance of TopBuild Corp. debt |
200 | — | — | |||||||
Issuance of notes, net of issuance costs |
497 | — | — | |||||||
Increase in debt |
4 | 4 | 3 | |||||||
Issuance of Company common stock |
2 | 1 | — | |||||||
Excess tax benefit from stock-based compensation |
75 | 13 | — | |||||||
Payment of debt |
(4 | ) | (6 | ) | (5 | ) | ||||
Credit Agreement and other financing costs |
(3 | ) | — | (4 | ) | |||||
| | | | | | | | | | | |
Net cash for financing activities |
(410 | ) | (297 | ) | (382 | ) | ||||
| | | | | | | | | | | |
CASH FLOWS FROM (FOR) INVESTING ACTIVITIES: |
||||||||||
Capital expenditures |
(158 | ) | (128 | ) | (126 | ) | ||||
Acquisition of businesses, net of cash acquired |
(41 | ) | (2 | ) | (7 | ) | ||||
Proceeds from disposition of: |
||||||||||
Short-term bank deposits |
279 | 379 | 411 | |||||||
Businesses, net of cash disposed |
— | — | 17 | |||||||
Property and equipment |
18 | 16 | 27 | |||||||
Other financial investments |
10 | 64 | 16 | |||||||
Purchases of: |
||||||||||
Other financial investments |
(1 | ) | (1 | ) | (1 | ) | ||||
Short-term bank deposits |
(253 | ) | (399 | ) | (409 | ) | ||||
Other, net |
(43 | ) | (29 | ) | (5 | ) | ||||
| | | | | | | | | | | |
Net cash for investing activities |
(189 | ) | (100 | ) | (77 | ) | ||||
| | | | | | | | | | | |
Effect of exchange rate changes on cash and cash investments |
(15 | ) | (45 | ) | (3 | ) | ||||
| | | | | | | | | | | |
CASH AND CASH INVESTMENTS: |
||||||||||
Increase for the year |
85 | 160 | 183 | |||||||
At January 1 |
1,383 | 1,223 | 1,040 | |||||||
| | | | | | | | | | | |
At December 31 |
$ | 1,468 | $ | 1,383 | $ | 1,223 | ||||
| | | | | | | | | | | |
| | | | | | | | | | | |
| | | | | | | | | | | |
See notes to consolidated financial statements.
44
MASCO CORPORATION and Consolidated Subsidiaries
CONSOLIDATED STATEMENTS OF SHAREHOLDERS' EQUITY
for the years ended December 31, 2015, 2014 and 2013
| |
(In Millions, Except Per Share Data) |
||||||||||||||||||
|---|---|---|---|---|---|---|---|---|---|---|---|---|---|---|---|---|---|---|---|
| |
Total | Common Shares ($1 par value) |
Paid-In Capital |
Retained (Deficit) Earnings |
Accumulated Other Comprehensive Income (Loss) |
Noncontrolling Interest |
|||||||||||||
Balance, January 1, 2013 |
$ | 542 | $ | 349 | $ | 16 | $ | (94 | ) | $ | 59 | $ | 212 | ||||||
Total comprehensive income (loss) |
394 | 288 | 56 | 50 | |||||||||||||||
Shares issued |
(8 | ) | 3 | (11 | ) | ||||||||||||||
Shares retired: |
|||||||||||||||||||
Repurchased |
(35 | ) | (2 | ) | (11 | ) | (22 | ) | |||||||||||
Surrendered (non-cash) |
(12 | ) | (1 | ) | (11 | ) | |||||||||||||
Cash dividends declared |
(107 | ) | (14 | ) | (93 | ) | |||||||||||||
Dividends paid to noncontrolling interest |
(34 | ) | (34 | ) | |||||||||||||||
Stock-based compensation |
47 | 47 | |||||||||||||||||
| | | | | | | | | | | | | | | | | | | | |
Balance, December 31, 2013 |
$ | 787 | $ | 349 | $ | 16 | $ | 79 | $ | 115 | $ | 228 | |||||||
| | | | | | | | | | | | | | | | | | | | |
| | | | | | | | | | | | | | | | | | | | |
| | | | | | | | | | | | | | | | | | | | |
Total comprehensive income (loss) |
640 | 856 | (226 | ) | 10 | ||||||||||||||
Shares issued |
(6 | ) | 3 | (9 | ) | ||||||||||||||
Shares retired: |
|||||||||||||||||||
Repurchased |
(158 | ) | (7 | ) | (28 | ) | (123 | ) | |||||||||||
Surrendered (non-cash) |
(15 | ) | (15 | ) | |||||||||||||||
Cash dividends declared |
(122 | ) | (122 | ) | |||||||||||||||
Dividends paid to noncontrolling interest |
(34 | ) | (34 | ) | |||||||||||||||
Stock-based compensation |
36 | 36 | |||||||||||||||||
| | | | | | | | | | | | | | | | | | | | |
Balance, December 31, 2014 |
$ | 1,128 | $ | 345 | $ | — | $ | 690 | $ | (111 | ) | $ | 204 | ||||||
| | | | | | | | | | | | | | | | | | | | |
| | | | | | | | | | | | | | | | | | | | |
| | | | | | | | | | | | | | | | | | | | |
Total comprehensive income (loss) |
326 | 355 | (54 | ) | 25 | ||||||||||||||
Shares issued |
(15 | ) | 3 | (18 | ) | ||||||||||||||
Shares retired: |
|||||||||||||||||||
Repurchased |
(456 | ) | (17 | ) | (65 | ) | (374 | ) | |||||||||||
Surrendered (non-cash) |
(18 | ) | (1 | ) | (17 | ) | |||||||||||||
Cash dividends declared |
(126 | ) | (126 | ) | |||||||||||||||
Dividends paid to noncontrolling interest |
(36 | ) | (36 | ) | |||||||||||||||
Separation of TopBuild Corp. |
(828 | ) | (828 | ) | |||||||||||||||
Stock-based compensation |
83 | 83 | |||||||||||||||||
| | | | | | | | | | | | | | | | | | | | |
Balance, December 31, 2015 |
$ | 58 | $ | 330 | $ | — | $ | (300 | ) | $ | (165 | ) | $ | 193 | |||||
| | | | | | | | | | | | | | | | | | | | |
| | | | | | | | | | | | | | | | | | | | |
| | | | | | | | | | | | | | | | | | | | |
See notes to consolidated financial statements.
45
MASCO CORPORATION
NOTES TO CONSOLIDATED FINANCIAL STATEMENTS
A. ACCOUNTING POLICIES
Principles of Consolidation. The consolidated financial statements include the accounts of Masco Corporation and all majority-owned subsidiaries. All significant intercompany transactions have been eliminated. We consolidate the assets, liabilities and results of operations of variable interest entities, for which we are the primary beneficiary.
Use of Estimates and Assumptions in the Preparation of Financial Statements. The preparation of financial statements in conformity with accounting principles generally accepted in the United States of America requires us to make certain estimates and assumptions that affect the reported amounts of assets and liabilities and disclosure of any contingent assets and liabilities at the date of the financial statements and the reported amounts of revenues and expenses during the reporting period. Actual results may differ from these estimates and assumptions.
Revenue Recognition. We recognize revenue as title to products and risk of loss is transferred to customers or when services are rendered, net of applicable provisions for discounts, returns and allowances. Amounts billed for shipping and handling are included in net sales, while costs incurred for shipping and handling are included in cost of sales.
Customer Promotion Costs. We record estimated reductions to revenue for customer programs and incentive offerings, including special pricing and co-operative advertising arrangements, promotions and other volume-based incentives. In-store displays that are owned by us and used to market our products are included in other assets in the consolidated balance sheets and are amortized using the straight-line method over the expected useful life of three to five years; related amortization expense is classified as a selling expense in the consolidated statements of operations.
Foreign Currency. The financial statements of our foreign subsidiaries are measured using the local currency as the functional currency. Assets and liabilities of these subsidiaries are translated at exchange rates as of the balance sheet dates. Revenues and expenses are translated at average exchange rates in effect during the year. The resulting cumulative translation adjustments have been recorded in the accumulated other comprehensive income (loss) component of shareholders' equity. Realized foreign currency transaction gains and losses are included in the consolidated statements of operations in other income (expense), net.
Cash and Cash Investments. We consider all highly liquid investments with an initial maturity of three months or less to be cash and cash investments.
Short-Term Bank Deposits. We invest a portion of our foreign excess cash in short-term bank deposits. These highly liquid investments have original maturities between three and twelve months and are valued at cost, which approximates fair value at December 31, 2015 and 2014. These short-term bank deposits are classified in the current assets section of our consolidated balance sheets, and interest income related to short-term bank deposits is recorded in our consolidated statements of operations in other income (expense), net.
46
MASCO CORPORATION
NOTES TO CONSOLIDATED FINANCIAL STATEMENTS (Continued)
A. ACCOUNTING POLICIES (Continued)
Receivables. We do significant business with a number of customers, including certain home center retailers and homebuilders. We monitor our exposure for credit losses on our customer receivable balances and the credit worthiness of our customers on an on-going basis and record related allowances for doubtful accounts. Allowances are estimated based upon specific customer balances, where a risk of default has been identified, and also include a provision for non-customer specific defaults based upon historical collection, return and write-off activity. During downturns in our markets, declines in the financial condition and creditworthiness of customers impacts the credit risk of the receivables involved and we have incurred additional bad debt expense related to customer defaults. A separate allowance is recorded for customer incentive rebates and is generally based upon sales activity. Receivables are presented net of certain allowances (including allowances for doubtful accounts) of $41 million at both December 31, 2015 and 2014.
Property and Equipment. Property and equipment, including significant improvements to existing facilities, are recorded at cost. Upon retirement or disposal, the cost and accumulated depreciation are removed from the accounts and any gain or loss is included in the consolidated statements of operations. Maintenance and repair costs are charged against earnings as incurred.
We review our property and equipment as an event occurs or circumstances change that would more likely than not reduce the fair value of the property and equipment below the carrying amount. If the carrying amount of property and equipment is not recoverable from its undiscounted cash flows, then we would recognize an impairment loss for the difference between the carrying amount and the current fair value. Further, we evaluate the remaining useful lives of property and equipment at each reporting period to determine whether events and circumstances warrant a revision to the remaining depreciation periods.
Depreciation. Depreciation expense is computed principally using the straight-line method over the estimated useful lives of the assets. Annual depreciation rates are as follows: buildings and land improvements, 2 to 10 percent, and machinery and equipment, 5 to 33 percent. Depreciation expense was $116 million, $132 million and $147 million in 2015, 2014 and 2013, respectively. Such depreciation expense included accelerated depreciation of $1 million (in the Cabinets and Related Products segment) and $13 million (primarily in the Cabinets and Related Products and Plumbing Products segments) in 2014 and 2013, respectively.
Goodwill and Other Intangible Assets. We perform our annual impairment testing of goodwill in the fourth quarter of each year, or as events occur or circumstances change that would more likely than not reduce the fair value of a reporting unit below its carrying amount. We have defined our reporting units and completed the impairment testing of goodwill at the operating segment level. Our operating segments are reporting units that engage in business activities, for which discrete financial information, including five-year forecasts, are available. We compare the fair value of the reporting units to the carrying value of the reporting units for goodwill impairment testing. Fair value is determined using a discounted cash flow method, which includes significant unobservable inputs (Level 3 inputs).
Determining market values using a discounted cash flow method requires us to make significant estimates and assumptions, including long-term projections of cash flows, market conditions and appropriate discount rates. Our judgments are based upon historical experience, current market trends, consultations with external valuation specialists and other information.
47
MASCO CORPORATION
NOTES TO CONSOLIDATED FINANCIAL STATEMENTS (Continued)
A. ACCOUNTING POLICIES (Continued)
While we believe that the estimates and assumptions underlying the valuation methodology are reasonable, different estimates and assumptions could result in different outcomes. In estimating future cash flows, we rely on internally generated five-year forecasts for sales and operating profits, including capital expenditures, and, currently, a one to three percent long-term assumed annual growth rate of cash flows for periods after the five-year forecast. We utilize our weighted average cost of capital of approximately 8.5 percent as the basis to determine the discount rate to apply to the estimated future cash flows. Our weighted average cost of capital decreased in 2015 as compared to 2014 due to less risk associated with our stock in relation to the capital markets. In 2015, based upon our assessment of the risks impacting each of our businesses, we applied a risk premium to increase the discount rate to a range of 10.5 percent to 12.5 percent for our reporting units.
If the carrying amount of a reporting unit exceeds its fair value, we measure the possible goodwill impairment based upon an allocation of the estimate of fair value of the reporting unit to all of the underlying assets and liabilities of the reporting unit, including any previously unrecognized intangible assets (Step Two Analysis). The excess of the fair value of a reporting unit over the amounts assigned to its assets and liabilities is the implied fair value of goodwill. An impairment loss is recognized to the extent that a reporting unit's recorded goodwill exceeds the implied fair value of goodwill.
We review our other indefinite-lived intangible assets for impairment annually in the fourth quarter of each year, or as events occur or circumstances change that indicate the assets may be impaired without regard to the business unit. We consider the implications of both external (e.g., market growth, competition and local economic conditions) and internal (e.g., product sales and expected product growth) factors and their potential impact on cash flows related to the intangible asset in both the near- and long-term.
Intangible assets with finite useful lives are amortized using the straight-line method over their estimated useful lives. We evaluate the remaining useful lives of amortizable intangible assets at each reporting period to determine whether events and circumstances warrant a revision to the remaining periods of amortization. See Note H for additional information regarding Goodwill and Other intangible assets.
Fair Value Accounting. We follow accounting guidance for our financial investments and liabilities, which defines fair value, establishes a framework for measuring fair value and prescribes disclosures about fair value measurements. We also follow this guidance for our non-financial investments and liabilities.
The fair value of financial investments and liabilities is determined at each balance sheet date and future declines in market conditions, the future performance of the underlying investments or new information could affect the recorded values of our investments in marketable securities, private equity funds and other private investments.
We use derivative financial instruments to manage certain exposure to fluctuations in earnings and cash flows resulting from changes in foreign currency exchange rates, commodity costs and interest rate exposures. Derivative financial instruments are recorded in the consolidated balance sheets as either an asset or liability measured at fair value, netted by counterparty, where the right of offset exists. For derivative instruments not designated as hedging instruments, the gain or loss is recognized in determining current earnings during the period of the change in fair value.
48
MASCO CORPORATION
NOTES TO CONSOLIDATED FINANCIAL STATEMENTS (Continued)
A. ACCOUNTING POLICIES (Continued)
Warranty. At the time of sale, we accrue a warranty liability for the estimated cost to provide products, parts or services to repair or replace products in satisfaction of warranty obligations. Our estimate of costs to service our warranty obligations is based upon the information available and includes a number of factors such as the warranty coverage, the warranty period, historical experience specific to the nature, frequency and average cost to service the claim, along with industry and demographic trends.
Certain factors and related assumptions in determining our warranty liability involve judgments and estimates and are sensitive to changes in the aforementioned factors. We believe that the warranty accrual is appropriate; however, actual claims incurred could differ from the original estimates thereby requiring adjustments to previously established accruals.
A significant portion of our business is at the consumer retail level through home center retailers and other major retailers. A consumer may return a product to a retail outlet that is a warranty return. However, certain retail outlets do not distinguish between warranty and other types of returns when they claim a return deduction from us. Our revenue recognition policy takes into account this type of return when recognizing revenue, and deductions are recorded at the time of sale.
Insurance Reserves. We provide for expenses associated with workers' compensation and product liability obligations when such amounts are probable and can be reasonably estimated. The accruals are adjusted as new information develops or circumstances change that would affect the estimated liability.
Stock-Based Compensation. We measure compensation expense for stock awards at the market price of our common stock at the grant date. Such expense is recognized ratably over the shorter of the vesting period of the stock awards, typically 5 to 10 years, or the length of time until the grantee becomes retirement-eligible at age 65.
We measure compensation expense for stock options using a Black-Scholes option pricing model. Such expense is recognized ratably over the shorter of the vesting period of the stock options, typically five years, or the length of time until the grantee becomes retirement-eligible at age 65. We utilize the shortcut method to determine the tax windfall pool associated with stock options.
Noncontrolling Interest. We own 68 percent of Hansgrohe SE at both December 31, 2015 and 2014. The aggregate noncontrolling interest, net of dividends, at December 31, 2015 and 2014 has been recorded as a component of equity on our consolidated balance sheets.
Interest and Penalties on Uncertain Tax Positions. We record interest and penalties on our uncertain tax positions in income tax expense (benefit).
Reclassifications. Certain prior year amounts have been reclassified to conform to the 2015 presentation in the consolidated financial statements. In our consolidated statements of cash flows, the cash flows from discontinued operations are not separately classified.
49
MASCO CORPORATION
NOTES TO CONSOLIDATED FINANCIAL STATEMENTS (Continued)
A. ACCOUNTING POLICIES (Concluded)
Recently Issued Accounting Pronouncements. In April 2014, the Financial Accounting Standards Board ("FASB") issued Accounting Standards Update 2014-8 ("ASU 2014-08"), "Reporting of Discontinued Operations and Disclosure of Disposals of Components of an Entity," which changes the criteria for determining which disposals can be presented as discontinued operations and modifies the related disclosure requirements. We adopted this guidance beginning January 1, 2015. The adoption of this new guidance did not have a material impact on our financial position or our results of operations.
In November 2015, the FASB issued Accounting Standards Update 2015-17 ("ASU 2015-17"), "Balance Sheet Classification of Deferred Taxes," which changes the criteria for classifying deferred tax balances by requiring all deferred taxes be presented as noncurrent on the balance sheet. We retrospectively adopted this guidance on December 31, 2015. As a result of the retrospective adoption of this standard, current assets decreased by $244 million, non-current assets increased by $219 million and non-current liabilities decreased by $25 million as of December 31, 2014.
In May 2014, FASB issued a new standard for revenue recognition, Accounting Standards Codification 606 ("ASC 606"). The purpose of ASC 606 is to provide a single, comprehensive revenue recognition model for all contracts with customers to improve comparability across industries. ASC 606 is effective for us for annual periods beginning January 1, 2018. We are currently evaluating the impact the adoption of this new standard will have on our results of operations.
In February 2015, the FASB issued Accounting Standards Update 2015-02 ("ASU 2015-02") "Consolidation (Topic 810) – Amendments to the Consolidations Analysis," which modifies certain aspects of both the variable interest entities and voting interest entities models. ASU 2015-02 is effective for us for annual periods beginning January 1, 2016. We do not expect that the adoption will have a significant impact on our financial position or our results of operations.
In April 2015, the FASB issued Accounting Standards Update 2015-03 ("ASU 2015-03") "Interest – Imputation of Interest (Subtopic 835-30) – Simplifying the Presentation of Debt Issuance Costs," that requires that all costs incurred to issue debt be presented in the balance sheet as a direct deduction from the carrying value of the debt. In August 2015, the FASB issued ASU 2015-15 to clarify that debt issuance costs related to line-of-credit arrangements may remain classified as an asset. Both ASU 2015-03 and ASU 2015-15 are effective for us for annual periods beginning January 1, 2016. We do not expect that the adoptions will have a significant impact on our financial position.
B. DISCONTINUED OPERATIONS
The presentation of discontinued operations includes a component or group of components that we have or intend to dispose of, and represents a strategic shift that has (or will have) a major effect on our operations and financial results. For spin off transactions, discontinued operations treatment is appropriate following the completion of the spin off.
On September 30, 2014, we announced a plan to spin off 100 percent of our Installation and Other Services businesses into an independent, publicly-traded company named TopBuild Corp. ("TopBuild") through a tax-free distribution of the stock of TopBuild to our stockholders. We initiated the spin off as TopBuild was no longer considered core to our long-term growth strategy in branded building products. On June 30, 2015, immediately prior to the effective time of the spin off, TopBuild paid a cash distribution to us of $200 million using the proceeds of its new debt financing arrangement. This transaction was reported as a financing activity in the consolidated statements of cash flows.
50
MASCO CORPORATION
NOTES TO CONSOLIDATED FINANCIAL STATEMENTS (Continued)
B. DISCONTINUED OPERATIONS (Continued)
We have accounted for the spin off of TopBuild as a discontinued operation. (Losses) gains from this discontinued operation were included in (loss) income from discontinued operations, net, in the consolidated statements of operations.
In February 2013, we determined that Tvilum, our Danish ready-to-assemble cabinet business, was no longer core to our long-term growth strategy and, accordingly, we embarked on a plan for disposition. In December 2013, we completed the disposition of this business and a related Danish holding company for net proceeds of $17 million.
We have accounted for Tvilum as a discontinued operation. Losses from this discontinued operation were included in (loss) income from discontinued operations, net, in the consolidated statements of operations.
The major classes of line items constituting pre-tax (loss) profit of the discontinued operations, in millions:
| |
Year Ended December 31 | |||||||||
|---|---|---|---|---|---|---|---|---|---|---|
| |
2015 | 2014 | 2013 | |||||||
Net sales (1) |
$ | 762 | $ | 1,515 | $ | 1,412 | ||||
Cost of sales (1) |
603 | 1,188 | 1,116 | |||||||
| | | | | | | | | | | |
Gross profit (1) |
159 | 327 | 296 | |||||||
Selling, general and administrative expenses (1) |
148 | 259 | 232 | |||||||
| | | | | | | | | | | |
Income from discontinued operations |
$ | 11 | $ | 68 | $ | 64 | ||||
Other discontinued operations results: |
||||||||||
(Loss) gain on disposal of discontinued operations, net (2) |
(1 | ) | (6 | ) | 3 | |||||
Operating loss from discontinued operations (3) |
— | — | (7 | ) | ||||||
Impairment of assets held for sale (4) |
— | — | (10 | ) | ||||||
| | | | | | | | | | | |
Income before income tax |
10 | 62 | 50 | |||||||
Income tax expense (5) |
(12 | ) | (27 | ) | (21 | ) | ||||
| | | | | | | | | | | |
(Loss) income from discontinued operations, net |
$ | (2 | ) | $ | 35 | $ | 29 | |||
| | | | | | | | | | | |
| | | | | | | | | | | |
| | | | | | | | | | | |
- (1)
- Net
sales, cost of sales, gross profit, and selling, general and administrative expenses reflect the results of TopBuild.
- (2)
- Included
in (loss) gain on disposal of discontinued operations, net in 2014 are additional costs and charges related to the 2013 sale of Tvilum.
- (3)
- Operating
loss from discontinued operations reflects the results of Tvilum, including net sales of $265 million in 2013.
- (4)
- Included
in impairment of assets held for sale in 2013 is the impairment of fixed assets. During 2013, we estimated the fair value of the Tvilum business
held for sale, using unobservable inputs (Level 3). After considering the currency translation gains reported in accumulated other comprehensive income (loss), we recorded an impairment of
$10 million in 2013.
- (5)
- The unusual relationship between income tax expense and income before income tax for 2015 resulted primarily from certain non-deductible transaction costs related to the spin off of TopBuild.
51
MASCO CORPORATION
NOTES TO CONSOLIDATED FINANCIAL STATEMENTS (Continued)
B. DISCONTINUED OPERATIONS (Concluded)
The carrying amount of major classes of assets and liabilities included as part of the TopBuild discontinued operations, in millions:
| |
At December 31, | ||||||
|---|---|---|---|---|---|---|---|
| |
2015 | 2014 | |||||
Cash |
$ | — | $ | 4 | |||
Receivables |
— | 220 | |||||
Inventories |
— | 107 | |||||
Prepaid expenses and other |
— | 4 | |||||
Property and equipment, net |
— | 93 | |||||
Goodwill |
— | 1,044 | |||||
Other intangible assets, net |
— | 3 | |||||
Other assets |
— | 1 | |||||
| | | | | | | | |
Total assets classified as held for sale |
$ | — | $ | 1,476 | |||
| | | | | | | | |
| | | | | | | | |
| | | | | | | | |
Accounts payable |
— | $ | 229 | ||||
Accrued liabilities |
— | 71 | |||||
Other liabilities |
— | 40 | |||||
Deferred income taxes |
— | 129 | |||||
| | | | | | | | |
Total liabilities classified as held for sale |
$ | — | $ | 469 | |||
| | | | | | | | |
| | | | | | | | |
| | | | | | | | |
Other selected financial information for TopBuild during the period owned by us, were as follows, in millions:
| |
Year Ended Dec. 31 | |||||||||
|---|---|---|---|---|---|---|---|---|---|---|
| |
2015 | 2014 | 2013 | |||||||
Depreciation and amortization |
$ | 6 | $ | 26 | $ | 27 | ||||
Capital expenditures |
$ | 7 | $ | 13 | $ | 14 | ||||
In conjunction with the spin off, we have entered into a Transition Services Agreement with TopBuild to provide TopBuild administrative services subsequent to the separation. The fees for services rendered under the Transition Services Agreement are not expected to be material to our results of operations.
C. ACQUISITIONS
In the second quarter of 2015, we acquired a U.K. window business for approximately $16 million in cash in the Other Specialty Products segment. This acquisition will support our U.K. window business' growth strategy by expanding its product offerings into timber-alternative windows and doors.
In the first quarter of 2015, we acquired an aquatic fitness business for approximately $25 million in cash in the Plumbing Products segment. This acquisition will allow our spa business to expand its wellness products platform, open new channels of distribution and access a new customer base.
In the first quarter of 2013, we acquired a small U.K. door business in the Other Specialty Products segment. The total net cash purchase price was $4 million.
52
MASCO CORPORATION
NOTES TO CONSOLIDATED FINANCIAL STATEMENTS (Continued)
C. ACQUISITIONS (Concluded)
These acquisitions are not material to us. The results of these acquisitions are included in the consolidated financial statements from the date of their respective acquisition.
D. INVENTORIES
| |
(In Millions) |
||||||
|---|---|---|---|---|---|---|---|
| |
At December 31 | ||||||
| |
2015 | 2014 | |||||
Finished goods |
$ | 358 | $ | 361 | |||
Raw material |
238 | 251 | |||||
Work in process |
91 | 100 | |||||
| | | | | | | | |
Total |
$ | 687 | $ | 712 | |||
| | | | | | | | |
| | | | | | | | |
| | | | | | | | |
Inventories, which include purchased parts, materials, direct labor and applied manufacturing overhead, are stated at the lower of cost or net realizable value, with cost determined by use of the first-in, first-out method.
E. FAIR VALUE OF FINANCIAL INVESTMENTS AND LIABILITIES
Accounting Policy. We follow accounting guidance that defines fair value, establishes a framework for measuring fair value and prescribes disclosures about fair value measurements for financial investments and liabilities. The guidance defines fair value as "the price that would be received to sell an asset or paid to transfer a liability in an orderly transaction between market participants at the measurement date." Further, it defines a fair value hierarchy, as follows: Level 1 inputs as quoted prices in active markets for identical assets or liabilities; Level 2 inputs as observable inputs other than Level 1 prices, such as quoted market prices for similar assets or liabilities or other inputs that are observable or can be corroborated by market data; and Level 3 inputs as unobservable inputs that are supported by little or no market activity and that are financial instruments whose value is determined using pricing models or instruments for which the determination of fair value requires significant management judgment or estimation.
Financial investments that are available to be traded on readily accessible stock exchanges (domestic or foreign) are considered to have active markets and have been valued using Level 1 inputs. Financial investments that are not available to be traded on a public market or have limited secondary markets, or contain provisions that limit the ability to sell the investment are considered to have inactive markets and have been valued using Level 2 or 3 inputs. We incorporated credit risk into the valuations of financial investments by estimating the likelihood of non-performance by the counterparty to the applicable transactions. The estimate included the length of time relative to the contract, financial condition of the counterparty and current market conditions. The criteria for determining if a market was active or inactive were based on the individual facts and circumstances.
Financial Investments. We have maintained investments in available-for-sale securities, equity method investments, and a number of private equity funds and other private investments, principally as part of our tax planning strategies, as any gains enhance the utilization of any current and future tax capital losses.
53
MASCO CORPORATION
NOTES TO CONSOLIDATED FINANCIAL STATEMENTS (Continued)
E. FAIR VALUE OF FINANCIAL INVESTMENTS AND LIABILITIES (Continued)
Financial investments included in other assets were as follows, in millions:
| |
At December 31 | ||||||
|---|---|---|---|---|---|---|---|
| |
2015 | 2014 | |||||
Auction rate securities |
$ | 22 | $ | 22 | |||
| | | | | | | | |
Total recurring investments |
22 | 22 | |||||
Equity method investments |
13 | 11 | |||||
Private equity funds |
10 | 14 | |||||
Other investments |
3 | 3 | |||||
| | | | | | | | |
Total |
$ | 48 | $ | 50 | |||
| | | | | | | | |
| | | | | | | | |
| | | | | | | | |
Auction Rate Securities. Our investments in available-for-sale securities included cost basis of $19 million and pre-tax unrealized gains of $3 million and had a recorded basis of $22 million at both December 31, 2015 and 2014.
Equity Method Investments. Investments in private equity fund partnerships, joint ventures and less than majority-owned subsidiaries in which we have significant influence are accounted for under the equity method. Our consolidated statements of operations include our proportionate share of the net income (loss) of our equity method investees. When we record our proportionate share of net income (loss), it increases (decreases) our equity income in our consolidated statement of operations and our carrying value of that investment on our consolidated balance sheet.
During the fourth quarter of 2014, we sold our investment in the private equity fund, Long Point Capital Fund II L.P. (accounted for as an equity method investment) for proceeds of $48 million, which approximated net book value. Such proceeds are included in the consolidated statements of cash flows in proceeds from other financial investments, in the investing activities section.
Private Equity Funds and Other Investments. Our investments in private equity funds and other private investments, where we do not have significant influence, are carried at cost.
Recurring Fair Value Measurements. For financial investments measured at fair value on a recurring basis at each reporting period, the unrealized gains or losses (that are deemed to be temporary) are recognized, net of tax effect, through shareholders' equity, as a component of other comprehensive income (loss). Realized gains and losses and charges for other-than-temporary impairments are included in determining net income, with related purchase costs based upon specific identification.
In the past, we invested excess cash in auction rate securities. Auction rate securities are investment securities that have interest rates which are reset every 7, 28 or 35 days. The fair values of the auction rate securities held by us have been estimated, on a recurring basis, using a discounted cash flow model (Level 3 input). The significant inputs in the discounted cash flow model used to value the auction rate securities include: expected maturity of auction rate securities, discount rate used to determine the present value of expected cash flows and assumptions for credit defaults, since the auction rate securities are backed by credit default swap agreements.
54
MASCO CORPORATION
NOTES TO CONSOLIDATED FINANCIAL STATEMENTS (Continued)
E. FAIR VALUE OF FINANCIAL INVESTMENTS AND LIABILITIES (Concluded)
There were no changes in the fair value of Level 3 financial investments for the years ended December 31, 2015 or 2014.
Non-Recurring Fair Value Measurements. It is not practicable for us to estimate the fair value of equity method investments or private equity funds and other private investments where we do not have significant influence, because there are no quoted market prices and sufficient information is not readily available for us to utilize a valuation model to determine the fair value for each fund. Due to the significant unobservable inputs, the fair value measurements used to evaluate impairment are a Level 3 input. These investments are evaluated, on a non-recurring basis, for potential other-than-temporary impairment when impairment indicators are present, or when an event or change in circumstances has occurred, that may have a significant adverse effect on the fair value of the investment.
There were no financial investments measured for impairment on a non-recurring basis during 2015, 2014 or 2013.
We did not have any transfers between Level 1 and Level 2 financial assets in 2015 or 2014.
Realized Gains (Losses). Income from financial investments, net, included in other, net, within other income (expense), net, was as follows, in millions:
| |
2015 | 2014 | 2013 | |||||||
|---|---|---|---|---|---|---|---|---|---|---|
Equity investment income (loss), net |
$ | 2 | $ | (2 | ) | $ | 16 | |||
Realized gains from private equity funds |
6 | 4 | 11 | |||||||
| | | | | | | | | | | |
Income from financial investments, net |
$ | 8 | $ | 2 | $ | 27 | ||||
| | | | | | | | | | | |
| | | | | | | | | | | |
| | | | | | | | | | | |
Fair value of debt. The fair value of our short-term and long-term fixed-rate debt instruments is based principally upon modeled market prices for the same or similar issues or the current rates available to us for debt with similar terms and remaining maturities. The aggregate estimated market value of short-term and long-term debt at December 31, 2015 was approximately $3.6 billion, compared with the aggregate carrying value of $3.4 billion. The aggregate estimated market value of short-term and long-term debt at December 31, 2014 was approximately $3.7 billion, compared with the aggregate carrying value of $3.4 billion.
F. DERIVATIVE INSTRUMENTS AND HEDGING ACTIVITIES
We are exposed to global market risk as part of our normal daily business activities. To manage these risks, we enter into various derivative contracts. These contracts include interest rate swap agreements, foreign currency exchange contracts and contracts intended to hedge our exposure to copper and zinc. We review our hedging program, derivative positions and overall risk management on a regular basis.
Interest Rate Swap Agreements. In 2012, in connection with the issuance of $400 million of debt, we terminated the interest rate swap hedge relationships that we had entered into in 2011. These interest
55
MASCO CORPORATION
NOTES TO CONSOLIDATED FINANCIAL STATEMENTS (Continued)
F. DERIVATIVE INSTRUMENTS AND HEDGING ACTIVITIES (Continued)
rate swaps were designated as cash flow hedges and effectively fixed interest rates on the forecasted debt issuance to variable rates based on 3-month LIBOR. Upon termination, the ineffective portion of the cash flow hedges of approximately $2 million loss was recognized in our consolidated statement of operations in other, net. The remaining loss of approximately $23 million from the termination of these swaps is being amortized as an increase to interest expense over the remaining term of the debt, through March 2022. At December 31, 2015, the balance remaining in accumulated other comprehensive loss was $16 million.
Foreign Currency Contracts. Our net cash inflows and outflows exposed to the risk of changes in foreign currency exchange rates arise from the sale of products in countries other than the manufacturing source, foreign currency denominated supplier payments, debt and other payables, and investments in subsidiaries. To mitigate this risk, we, including certain European operations, entered into foreign currency forward contracts and foreign currency exchange contracts.
Gains (losses) related to foreign currency forward and exchange contracts are recorded in our consolidated statements of operations in other income (expense), net. In the event that the counterparties fail to meet the terms of the foreign currency forward or exchange contracts, our exposure is limited to the aggregate foreign currency rate differential with such institutions.
Metals Contracts. We have entered into several contracts to manage our exposure to increases in the price of copper and zinc. Gains (losses) related to these contracts are recorded in our consolidated statements of operations in cost of sales.
The pre-tax (losses) gains included in our consolidated statements of operations are as follows, in millions:
| |
Year Ended December 31, | |||||||||
|---|---|---|---|---|---|---|---|---|---|---|
| |
2015 | 2014 | 2013 | |||||||
Foreign currency contracts |
||||||||||
Exchange contracts |
$ | 4 | $ | 5 | $ | 2 | ||||
Forward contracts |
(3 | ) | — | 1 | ||||||
Metals contracts |
(17 |
) |
(3 |
) |
(7 |
) |
||||
Interest rate swaps |
(2 | ) | (2 | ) | (2 | ) | ||||
| | | | | | | | | | | |
Total |
$ | (18 | ) | $ | — | $ | (6 | ) | ||
| | | | | | | | | | | |
| | | | | | | | | | | |
| | | | | | | | | | | |
56
MASCO CORPORATION
NOTES TO CONSOLIDATED FINANCIAL STATEMENTS (Continued)
F. DERIVATIVE INSTRUMENTS AND HEDGING ACTIVITIES (Concluded)
We present our net derivatives due to the right of offset by our counterparties under master netting arrangements in the consolidated balance sheets. The notional amounts being hedged and the fair value of those derivative instruments are as follows, in millions:
| |
At December 31, 2015 | ||||||
|---|---|---|---|---|---|---|---|
| |
Notional Amount |
Balance Sheet | |||||
Foreign currency contracts |
|||||||
Exchange contracts |
$ | 39 | |||||
Receivables |
$ | 1 | |||||
Forward contracts |
30 | ||||||
Accrued liabilities |
(2 | ) | |||||
Other liabilities |
(1 | ) | |||||
Metals contracts |
50 |
||||||
Accrued liabilities |
(10 | ) | |||||
| |
At December 31, 2014 | ||||||
|---|---|---|---|---|---|---|---|
| |
Notional Amount |
Balance Sheet | |||||
Foreign currency contracts |
|||||||
Exchange contracts |
$ | 55 | |||||
Receivables |
$ | 6 | |||||
Forward contracts |
79 | ||||||
Other assets |
2 | ||||||
Accrued liabilities |
(1 | ) | |||||
Metals contracts |
70 |
||||||
Accrued liabilities |
(2 | ) | |||||
The fair value of all foreign currency and metals derivative contracts is estimated on a recurring basis, quarterly, using Level 2 inputs.
G. PROPERTY AND EQUIPMENT
| |
(In Millions) |
||||||
|---|---|---|---|---|---|---|---|
| |
At December 31 | ||||||
| |
2015 | 2014 | |||||
Land and improvements |
$ | 115 | $ | 122 | |||
Buildings |
672 | 715 | |||||
Machinery and equipment |
1,787 | 1,790 | |||||
| | | | | | | | |
|
2,574 | 2,627 | |||||
Less: Accumulated depreciation |
(1,547 | ) | (1,581 | ) | |||
| | | | | | | | |
Total |
$ | 1,027 | $ | 1,046 | |||
| | | | | | | | |
| | | | | | | | |
| | | | | | | | |
57
MASCO CORPORATION
NOTES TO CONSOLIDATED FINANCIAL STATEMENTS (Continued)
G. PROPERTY AND EQUIPMENT (Concluded)
We lease certain equipment and plant facilities under noncancellable operating leases. Rental expense recorded in the consolidated statements of operations totaled approximately $60 million, $63 million and $59 million during 2015, 2014 and 2013, respectively.
At December 31, 2015, future minimum lease payments were as follows, in millions:
2016 |
$ | 38 | ||
2017 |
27 | |||
2018 |
20 | |||
2019 |
16 | |||
2020 |
11 | |||
2021 and beyond |
65 |
As a result of our business rationalization activities, over the last several years we were holding several facilities for sale. The net book value of facilities held for sale was approximately $2 million and $17 million, included in property and equipment, net, in the consolidated balance sheets, as of December 31, 2015 and 2014, respectively.
During 2014, we decided to sell two facilities in our Cabinets and Related Products segment, and we recorded a charge of $28 million, included in cost of sales in the consolidated statement of operations, to reflect the estimated fair value of those two facilities. Fair value was estimated using a market approach, considering the estimated fair values for other comparable buildings in the areas where the facilities are located (Level 3 inputs). These facilities were considered held for sale as of December 31, 2014 and were sold in 2015.
H. GOODWILL AND OTHER INTANGIBLE ASSETS
The changes in the carrying amount of goodwill, by segment, were as follows, in millions:
| |
Gross Goodwill At December 31, 2015 |
Accumulated Impairment Losses |
Net Goodwill At December 31, 2015 |
|||||||
|---|---|---|---|---|---|---|---|---|---|---|
Cabinets and Related Products |
$ | 240 | $ | (59 | ) | $ | 181 | |||
Plumbing Products |
525 | (340 | ) | 185 | ||||||
Decorative Architectural Products |
294 | (75 | ) | 219 | ||||||
Other Specialty Products |
988 | (734 | ) | 254 | ||||||
| | | | | | | | | | | |
Total |
$ | 2,047 | $ | (1,208 | ) | $ | 839 | |||
| | | | | | | | | | | |
| | | | | | | | | | | |
| | | | | | | | | | | |
58
MASCO CORPORATION
NOTES TO CONSOLIDATED FINANCIAL STATEMENTS (Continued)
H. GOODWILL AND OTHER INTANGIBLE ASSETS (Concluded)
| |
Gross Goodwill At December 31, 2014 |
Accumulated Impairment Losses |
Net Goodwill At December 31, 2014 |
Additions (A) | Other (B) | Net Goodwill At December 31, 2015 |
|||||||||||||
|---|---|---|---|---|---|---|---|---|---|---|---|---|---|---|---|---|---|---|---|
Cabinets and Related Products |
$ | 240 | $ | (59 | ) | $ | 181 | $ | — | $ | — | $ | 181 | ||||||
Plumbing Products |
531 | (340 | ) | 191 | 8 | (14 | ) | 185 | |||||||||||
Decorative Architectural Products |
294 | (75 | ) | 219 | — | — | 219 | ||||||||||||
Other Specialty Products |
983 | (734 | ) | 249 | 6 | (1 | ) | 254 | |||||||||||
| | | | | | | | | | | | | | | | | | | | |
Total |
$ | 2,048 | $ | (1,208 | ) | $ | 840 | $ | 14 | $ | (15 | ) | $ | 839 | |||||
| | | | | | | | | | | | | | | | | | | | |
| | | | | | | | | | | | | | | | | | | | |
| | | | | | | | | | | | | | | | | | | | |
| |
Gross Goodwill At December 31, 2013 |
Accumulated Impairment Losses |
Net Goodwill At December 31, 2013 |
Additions (A) | Other (B) | Net Goodwill At December 31, 2014 |
|||||||||||||
|---|---|---|---|---|---|---|---|---|---|---|---|---|---|---|---|---|---|---|---|
Cabinets and Related Products |
$ | 240 | $ | (59 | ) | $ | 181 | $ | — | $ | — | $ | 181 | ||||||
Plumbing Products |
550 | (340 | ) | 210 | — | (19 | ) | 191 | |||||||||||
Decorative Architectural Products |
294 | (75 | ) | 219 | — | — | 219 | ||||||||||||
Other Specialty Products |
983 | (734 | ) | 249 | — | — | 249 | ||||||||||||
| | | | | | | | | | | | | | | | | | | | |
Total |
$ | 2,067 | $ | (1,208 | ) | $ | 859 | $ | — | $ | (19 | ) | $ | 840 | |||||
| | | | | | | | | | | | | | | | | | | | |
| | | | | | | | | | | | | | | | | | | | |
| | | | | | | | | | | | | | | | | | | | |
- (A)
- Additions consist of acquisitions.
- (B)
- Other principally includes the effect of foreign currency translation.
We completed our annual impairment testing of goodwill and other indefinite-lived intangible assets in the fourth quarters of 2015, 2014 and 2013. There was no impairment of goodwill for any of our reporting units for any of these years.
Other indefinite-lived intangible assets were $137 million and $130 million at December 31, 2015 and 2014, respectively, and principally included registered trademarks. In 2015 and 2013, the impairment test indicated there was no impairment of other indefinite-lived intangible assets for any of our business units. In 2014, we recognized an insignificant impairment charge for other indefinite-lived intangible assets. As a result of our 2015 acquisitions, other indefinite lived intangible assets increased by $7 million as of the acquisition dates.
The carrying value of our definite-lived intangible assets was $23 million (net of accumulated amortization of $49 million) at December 31, 2015 and $12 million (net of accumulated amortization of $48 million) at December 31, 2014 and principally included customer relationships with a weighted average amortization period of 6 years in both 2015 and 2014. Amortization expense related to the definite-lived intangible assets of continuing operations was $6 million in 2015 and $4 million in both 2014 and 2013. As a result of our 2015 acquisitions, definite-lived intangible assets increased by $17 million as of the acquisition dates.
At December 31, 2015, amortization expense related to the definite-lived intangible assets during each of the next five years was as follows: 2016 – $4 million; 2017 – $2 million; 2018 – $2 million, 2019 – $2 million and 2020 – $2 million.
59
MASCO CORPORATION
NOTES TO CONSOLIDATED FINANCIAL STATEMENTS (Continued)
I. OTHER ASSETS
| |
(In Millions) |
||||||
|---|---|---|---|---|---|---|---|
| |
At December 31 | ||||||
| |
2015 | 2014 | |||||
Financial investments (Note E) |
$ | 48 | $ | 50 | |||
In-store displays, net |
56 | 36 | |||||
Debenture expense |
20 | 19 | |||||
Deferred tax assets |
184 | 293 | |||||
Other |
18 | 21 | |||||
| | | | | | | | |
Total |
$ | 326 | $ | 419 | |||
| | | | | | | | |
| | | | | | | | |
| | | | | | | | |
In-store displays are amortized using the straight-line method over the expected useful life of three to five years; we recognized amortization expense related to in-store displays of $20 million, $15 million and $19 million in 2015, 2014 and 2013, respectively. Cash spent for displays was $43 million, $30 million and $5 million in 2015, 2014 and 2013, respectively, and are included in other, net within investing activities on the consolidated statements of cash flows.
J. ACCRUED LIABILITIES
| |
(In Millions) |
||||||
|---|---|---|---|---|---|---|---|
| |
At December 31 | ||||||
| |
2015 | 2014 | |||||
Salaries, wages and commissions |
$ | 171 | $ | 164 | |||
Warranty (Note U) |
152 | 135 | |||||
Advertising and sales promotion |
132 | 111 | |||||
Insurance reserves |
44 | 39 | |||||
Interest |
62 | 57 | |||||
Employee retirement plans |
48 | 40 | |||||
Property, payroll and other taxes |
25 | 25 | |||||
Dividends payable |
32 | 32 | |||||
Other |
86 | 82 | |||||
| | | | | | | | |
Total |
$ | 752 | $ | 685 | |||
| | | | | | | | |
| | | | | | | | |
| | | | | | | | |
60
MASCO CORPORATION
NOTES TO CONSOLIDATED FINANCIAL STATEMENTS (Continued)
K. DEBT
| |
(In Millions) |
||||||
|---|---|---|---|---|---|---|---|
| |
At December 31 | ||||||
| |
2015 | 2014 | |||||
Notes and debentures: |
|||||||
4.800%, due June 15, 2015 |
$ | — | $ | 500 | |||
6.125%, due October 3, 2016 |
1,000 | 1,000 | |||||
5.850%, due March 15, 2017 |
300 | 300 | |||||
6.625%, due April 15, 2018 |
114 | 114 | |||||
7.125%, due March 15, 2020 |
500 | 500 | |||||
5.950%, due March 15, 2022 |
400 | 400 | |||||
4.450%, due April 1, 2025 |
500 | — | |||||
7.750%, due August 1, 2029 |
296 | 296 | |||||
6.500%, due August 15, 2032 |
300 | 300 | |||||
Other |
13 | 14 | |||||
| | | | | | | | |
|
3,423 | 3,424 | |||||
Less: Current portion |
1,005 | 505 | |||||
| | | | | | | | |
Total long-term debt |
$ | 2,418 | $ | 2,919 | |||
| | | | | | | | |
| | | | | | | | |
| | | | | | | | |
All of the notes and debentures above are senior indebtedness and, other than the 6.625% notes due 2018 and the 7.75% notes due 2029, are redeemable at our option.
On June 15, 2015, we repaid and retired all of our $500 million, 4.8% Notes on the scheduled retirement date.
On March 24, 2015, we issued $500 million of 4.45% Notes due April 1, 2025.
On March 28, 2013, we entered into a credit agreement (the "Credit Agreement") with a bank group, with an aggregate commitment of $1.25 billion and a maturity date of March 28, 2018. On May 29, 2015 and August 28, 2015, we amended the Credit Agreement with the bank group (the "Amended Credit Agreement"). The Amended Credit Agreement reduces the aggregate commitment to $750 million and extends the maturity date to May 29, 2020. Under the Amended Credit Agreement, at our request and subject to certain conditions, we can increase the aggregate commitment up to an additional $375 million with the current bank group or new lenders.
The Amended Credit Agreement provides for an unsecured revolving credit facility available to us and one of our foreign subsidiaries, in U.S. dollars, European euros and certain other currencies. Borrowings under the revolver denominated in euros are limited to $500 million, equivalent. We can also borrow swingline loans up to $75 million and obtain letters of credit of up to $100 million; any outstanding letters of credit under the Amended Credit Agreement reduce our borrowing capacity. At December 31, 2015, we had $5 million of outstanding standby letters of credit.
Revolving credit loans bear interest under the Amended Credit Agreement, at our option, at (A) a rate per annum equal to the greater of (i) the prime rate, (ii) the Federal Funds effective rate plus 0.50% and (iii) LIBOR plus 1.0% (the "Alternative Base Rate"); plus an applicable margin based upon our then-applicable corporate credit ratings; or (B) LIBOR plus an applicable margin based upon our then-applicable corporate credit ratings. The foreign currency revolving credit loans bear interest at a rate equal to LIBOR plus an applicable margin based upon our then-applicable corporate credit ratings.
61
MASCO CORPORATION
NOTES TO CONSOLIDATED FINANCIAL STATEMENTS (Continued)
K. DEBT (Concluded)
The Amended Credit Agreement contains financial covenants requiring us to maintain (A) a maximum net leverage ratio, as adjusted for certain items, of 4.0 to 1.0, and (B) a minimum interest coverage ratio, as adjusted for certain items, equal to or greater than 2.5 to 1.0.
In order for us to borrow under the Amended Credit Agreement, there must not be any default in our covenants in the Amended Credit Agreement (i.e., in addition to the two financial covenants, principally limitations on subsidiary debt, negative pledge restrictions, legal compliance requirements and maintenance of properties and insurance) and our representations and warranties in the Amended Credit Agreement must be true in all material respects on the date of borrowing (i.e., principally no material adverse change or litigation likely to result in a material adverse change, since December 31, 2014, in each case, no material ERISA or environmental non-compliance, and no material tax deficiency). We were in compliance with all covenants and no borrowings have been made at December 31, 2015.
At December 31, 2015, the debt maturities during each of the next five years were as follows: 2016 – $1,005 million; 2017 – $301 million; 2018 – $115 million; 2019 – $1 million and 2020 – $501 million.
Interest paid was $216 million, $220 million and $232 million in 2015, 2014 and 2013, respectively.
L. STOCK-BASED COMPENSATION
Our 2014 Long Term Stock Incentive Plan (the "2014 Plan") replaced the 2005 Long Term Stock Incentive Plan in May 2014 and provides for the issuance of stock-based incentives in various forms to employees and non-employee Directors of the Company. At December 31, 2015, outstanding stock-based incentives were in the form of long-term stock awards, stock options, phantom stock awards and stock appreciation rights.
Pre-tax compensation expense and the related income tax benefit for these stock-based incentives were as follows, in millions:
| |
2015 | 2014 | 2013 | |||||||
|---|---|---|---|---|---|---|---|---|---|---|
Long-term stock awards |
$ | 23 | $ | 33 | $ | 31 | ||||
Stock options |
5 | 4 | 12 | |||||||
Phantom stock awards and stock appreciation rights |
11 | 6 | 7 | |||||||
| | | | | | | | | | | |
Total |
$ | 39 | $ | 43 | $ | 50 | ||||
| | | | | | | | | | | |
| | | | | | | | | | | |
| | | | | | | | | | | |
Income tax benefit (37 percent tax rate) |
$ | 14 | $ | 16 | $ | 19 | ||||
| | | | | | | | | | | |
| | | | | | | | | | | |
| | | | | | | | | | | |
At December 31, 2015, a total of 17.1 million shares of our common stock were available under the 2014 Plan for the granting of stock options and other long-term stock incentive awards.
Long-Term Stock Awards. Long-term stock awards are granted to our key employees and non-employee Directors and do not cause net share dilution inasmuch as we continue the practice of repurchasing and retiring an equal number of shares in the open market. We granted 741,040 shares of long-term stock awards during 2015.
62
MASCO CORPORATION
NOTES TO CONSOLIDATED FINANCIAL STATEMENTS (Continued)
L. STOCK-BASED COMPENSATION (Continued)
Our long-term stock award activity was as follows, shares in millions:
| |
2015 | 2014 | 2013 | |||||||
|---|---|---|---|---|---|---|---|---|---|---|
Unvested stock award shares at January 1 |
6 | 8 | 8 | |||||||
Weighted average grant date fair value |
$ | 18 | $ | 17 | $ | 16 | ||||
Stock award shares granted |
1 |
1 |
2 |
|||||||
Weighted average grant date fair value |
$ | 26 | $ | 22 | $ | 20 | ||||
Stock award shares vested |
2 |
2 |
2 |
|||||||
Weighted average grant date fair value |
$ | 17 | $ | 17 | $ | 17 | ||||
Stock award shares forfeited |
— |
1 |
— |
|||||||
Weighted average grant date fair value |
$ | 18 | $ | 19 | $ | 16 | ||||
Forfeitures upon spin off (A) |
1 |
— |
— |
|||||||
Weighted average grant date fair value |
$ | 20 | $ | — | $ | — | ||||
Modification upon spin off (B) |
1 |
— |
— |
|||||||
Unvested stock award shares at December 31 |
5 |
6 |
8 |
|||||||
Weighted average grant date fair value |
$ | 17 | $ | 18 | $ | 17 | ||||
- (A)
- In connection with the spin off of TopBuild, TopBuild employees forfeited their outstanding Masco equity
awards.
- (B)
- Subsequent to the separation of TopBuild, we modified our outstanding equity awards to employees and non-employee directors such that all individuals received an equivalent fair value both before and after the separation. The modification to the outstanding stock awards was made pursuant to existing anti-dilution provisions in our 2014 Plan and 2005 Long Term Incentive Plan.
At December 31, 2015, 2014 and 2013, there was $42 million, $60 million and $69 million, respectively, of total unrecognized compensation expense related to unvested stock awards; such awards had a weighted average remaining vesting period of three years at December 31, 2015, 2014 and 2013.
The total market value (at the vesting date) of stock award shares which vested during 2015, 2014 and 2013 was $54 million, $50 million and $38 million, respectively.
Stock Options. Stock options are granted to our key employees. The exercise price equals the market price of our common stock at the grant date. These options generally become exercisable (vest ratably) over five years beginning on the first anniversary from the date of grant and expire no later than 10 years after the grant date.
We granted 452,380 shares of stock options during 2015 with a grant date weighted-average exercise price of approximately $26 per share. During 2015, 3.2 million stock option shares were forfeited (including options that expired unexercised).
63
MASCO CORPORATION
NOTES TO CONSOLIDATED FINANCIAL STATEMENTS (Continued)
L. STOCK-BASED COMPENSATION (Continued)
Our stock option activity was as follows, shares in millions:
| |
2015 | 2014 | 2013 | |||||||
|---|---|---|---|---|---|---|---|---|---|---|
Option shares outstanding, January 1 |
18 | 24 | 30 | |||||||
Weighted average exercise price |
$ | 21 | $ | 22 | $ | 21 | ||||
Option shares granted |
— |
— |
1 |
|||||||
Weighted average exercise price |
$ | 26 | $ | 22 | $ | 20 | ||||
Option shares exercised |
5 |
2 |
3 |
|||||||
Aggregate intrinsic value on date of exercise (A) |
$ | 50 million | $ | 22 million | $ | 23 million | ||||
Weighted average exercise price |
$ | 17 | $ | 16 | $ | 12 | ||||
Option shares forfeited |
3 |
4 |
4 |
|||||||
Weighted average exercise price |
$ | 29 | $ | 28 | $ | 26 | ||||
Forfeitures upon spin off (B) |
— |
— |
— |
|||||||
Weighted average exercise price |
$ | 19 | $ | — | $ | — | ||||
Modifications upon spin off (C) |
2 |
— |
— |
|||||||
Option shares outstanding, December 31 |
12 |
18 |
24 |
|||||||
Weighted average exercise price |
$ | 17 | $ | 21 | $ | 22 | ||||
Weighted average remaining option term (in years) |
3 | 4 | 4 | |||||||
Option shares vested and expected to vest, December 31 |
12 |
18 |
24 |
|||||||
Weighted average exercise price |
$ | 17 | $ | 21 | $ | 22 | ||||
Aggregate intrinsic value (A) |
$ | 133 million | $ | 110 million | $ | 109 million | ||||
Weighted average remaining option term (in years) |
3 | 4 | 4 | |||||||
Option shares exercisable (vested), December 31 |
10 |
15 |
20 |
|||||||
Weighted average exercise price |
$ | 18 | $ | 22 | $ | 24 | ||||
Aggregate intrinsic value (A) |
$ | 113 million | $ | 84 million | $ | 62 million | ||||
Weighted average remaining option term (in years) |
3 | 3 | 3 | |||||||
- (A)
- Aggregate intrinsic value is calculated using our stock price at each respective date, less the exercise
price (grant date price) multiplied by the number of shares.
- (B)
- In connection with the spin off of TopBuild, TopBuild employees forfeited their outstanding Masco equity
awards.
- (C)
- Subsequent to the separation of TopBuild, we modified our outstanding equity awards to employees and non-employee directors such that all individuals received an equivalent fair value both before and after the separation. The modification to the outstanding options was made pursuant to existing anti-dilution provisions in our 2014 Plan and 2005 Long Term Incentive Plan.
64
MASCO CORPORATION
NOTES TO CONSOLIDATED FINANCIAL STATEMENTS (Continued)
L. STOCK-BASED COMPENSATION (Continued)
At December 31, 2015, 2014 and 2013, there was $6 million, $6 million and $9 million, respectively, of unrecognized compensation expense (using the Black-Scholes option pricing model at the grant date) related to unvested stock options; such options had a weighted average remaining vesting period of two years at December 31, 2015, 2014 and 2013.
The weighted average grant date fair value of option shares granted and the assumptions used to estimate those values using a Black-Scholes option pricing model were as follows:
| |
2015 | 2014 | 2013 | |||||||
|---|---|---|---|---|---|---|---|---|---|---|
Weighted average grant date fair value |
$ | 9.67 | $ | 9.53 | $ | 8.35 | ||||
Risk-free interest rate |
1.75 | % | 1.91 | % | 1.22 | % | ||||
Dividend yield |
1.32 | % | 1.34 | % | 1.47 | % | ||||
Volatility factor |
42.00 | % | 49.00 | % | 49.07 | % | ||||
Expected option life |
6 years | 6 years | 6 years | |||||||
The following table summarizes information for stock option shares outstanding and exercisable at December 31, 2015, shares in millions:
| Option Shares Outstanding | Option Shares Exercisable | |||||||||||||||
|---|---|---|---|---|---|---|---|---|---|---|---|---|---|---|---|---|
Range of Prices |
Number of Shares |
Weighted Average Remaining Option Term |
Weighted Average Exercise Price |
Number of Shares |
Weighted Average Exercise Price |
|||||||||||
| $ | 7 - 18 | 7 | 4 Years | $ | 12 | 6 | $ | 12 | ||||||||
| $ | 20 - 23 | 2 | 3 Years | $ | 23 | 1 | $ | 23 | ||||||||
| $ | 25 - 27 | 3 | 1 Years | $ | 27 | 3 | $ | 27 | ||||||||
| $ | 28 - 29 | — | - Years | $ | 29 | — | $ | 29 | ||||||||
| | | | | | | | | | | | | | | | | |
| $ | 7 - 29 | 12 | 3 Years | $ | 17 | 10 | $ | 18 | ||||||||
| | | | | | | | | | | | | | | | | |
| | | | | | | | | | | | | | | | | |
| | | | | | | | | | | | | | | | | |
Phantom Stock Awards and Stock Appreciation Rights ("SARs"). We grant phantom stock awards and SARs to certain non-U.S. employees.
Phantom stock awards are linked to the value of our common stock on the date of grant and are settled in cash upon vesting, typically over 5 to 10 years. We account for phantom stock awards as liability-based awards; the compensation expense is initially measured as the market price of our common stock at the grant date and is recognized over the vesting period. The liability is remeasured and adjusted at the end of each reporting period until the awards are fully-vested and paid to the employees. We recognized expense of $5 million related to the valuation of phantom stock awards in 2015, 2014 and 2013. In 2015, 2014 and 2013, we granted 134,560 shares, 183,530 shares and 165,180 shares, respectively, of phantom stock awards with an aggregate fair value of $4 million, $4 million and $3 million, respectively, and paid $6 million, $5 million and $4 million of cash in 2015, 2014 and 2013, respectively, to settle phantom stock awards.
65
MASCO CORPORATION
NOTES TO CONSOLIDATED FINANCIAL STATEMENTS (Continued)
L. STOCK-BASED COMPENSATION (Concluded)
SARs are linked to the value of our common stock on the date of grant and are settled in cash upon exercise. We account for SARs using the fair value method, which requires outstanding SARs to be classified as liability-based awards and valued using a Black-Scholes option pricing model at the grant date; such fair value is recognized as compensation expense over the vesting period, typically five years. The liability is remeasured and adjusted at the end of each reporting period until the SARs are exercised and payment is made to the employees or the SARs expire. We recognized expense of $6 million, $1 million and $2 million related to the valuation of SARs for 2015, 2014 and 2013, respectively. During 2015, 2014 and 2013, we did not grant any SARs.
Information related to phantom stock awards and SARs was as follows, in millions:
| |
Phantom Stock Awards |
Stock Appreciation Rights |
|||||||||||
|---|---|---|---|---|---|---|---|---|---|---|---|---|---|
| |
At December 31, | At December 31, | |||||||||||
| |
2015 | 2014 | 2015 | 2014 | |||||||||
Accrued compensation cost liability |
$ | 13 | $ | 13 | $ | 10 | $ | 7 | |||||
Unrecognized compensation cost |
$ | 4 | $ | 4 | $ | — | $ | — | |||||
Equivalent common shares |
1 | 1 | 1 | 1 | |||||||||
M. EMPLOYEE RETIREMENT PLANS
We sponsor qualified defined-benefit and defined-contribution retirement plans for most of our employees. In addition to our qualified defined-benefit pension plans, we have unfunded non-qualified defined-benefit pension plans covering certain employees, which provide for benefits in addition to those provided by the qualified pension plans. Substantially all salaried employees participate in non-contributory defined-contribution retirement plans, to which payments are determined annually by the Organization and Compensation Committee of the Board of Directors.
In addition, we participate in one regional multi-employer pension plan, principally related to building trades, which is not considered significant to us.
Pre-tax expense related to our retirement plans was as follows, in millions:
| |
2015 | 2014 | 2013 | |||||||
|---|---|---|---|---|---|---|---|---|---|---|
Defined-contribution plans |
$ | 52 | $ | 43 | $ | 51 | ||||
Defined-benefit plans |
32 | 25 | 31 | |||||||
| | | | | | | | | | | |
|
$ | 84 | $ | 68 | $ | 82 | ||||
| | | | | | | | | | | |
| | | | | | | | | | | |
| | | | | | | | | | | |
In March 2009, based on management's recommendation, the Board of Directors approved a plan to freeze all future benefit accruals under substantially all of our domestic qualified and non-qualified defined-benefit pension plans. The freeze was effective January 1, 2010.
66
MASCO CORPORATION
NOTES TO CONSOLIDATED FINANCIAL STATEMENTS (Continued)
M. EMPLOYEE RETIREMENT PLANS (Continued)
Changes in the projected benefit obligation and fair value of plan assets, and the funded status of our defined-benefit pension plans were as follows, in millions:
| |
2015 | 2014 | |||||||||||
|---|---|---|---|---|---|---|---|---|---|---|---|---|---|
| |
Qualified | Non-Qualified | Qualified | Non-Qualified | |||||||||
Changes in projected benefit obligation: |
|||||||||||||
Projected benefit obligation at January 1 |
$ | 1,145 | $ | 190 | $ | 983 | $ | 163 | |||||
Service cost |
3 | — | 3 | — | |||||||||
Interest cost |
41 | 7 | 41 | 7 | |||||||||
Actuarial (gain) loss, net |
(61 | ) | (11 | ) | 184 | 32 | |||||||
Foreign currency exchange |
(23 | ) | — | (24 | ) | — | |||||||
Benefit payments |
(46 | ) | (12 | ) | (42 | ) | (12 | ) | |||||
| | | | | | | | | | | | | | |
Projected benefit obligation at December 31 |
$ | 1,059 | $ | 174 | $ | 1,145 | $ | 190 | |||||
| | | | | | | | | | | | | | |
| | | | | | | | | | | | | | |
| | | | | | | | | | | | | | |
Changes in fair value of plan assets: |
|||||||||||||
Fair value of plan assets at January 1 |
$ | 691 | $ | — | $ | 659 | $ | — | |||||
Actual return on plan assets |
(12 | ) | — | 38 | — | ||||||||
Foreign currency exchange |
(7 | ) | — | (8 | ) | — | |||||||
Company contributions |
38 | 12 | 49 | 12 | |||||||||
Expenses, other |
(6 | ) | — | (5 | ) | — | |||||||
Benefit payments |
(46 | ) | (12 | ) | (42 | ) | (12 | ) | |||||
| | | | | | | | | | | | | | |
Fair value of plan assets at December 31 |
$ | 658 | $ | — | $ | 691 | $ | — | |||||
| | | | | | | | | | | | | | |
| | | | | | | | | | | | | | |
| | | | | | | | | | | | | | |
Funded status at December 31: |
$ | (401 | ) | $ | (174 | ) | $ | (454 | ) | $ | (190 | ) | |
| | | | | | | | | | | | | | |
| | | | | | | | | | | | | | |
| | | | | | | | | | | | | | |
Amounts in our consolidated balance sheets were as follows, in millions:
| |
At December 31, 2015 | At December 31, 2014 | |||||||||||
|---|---|---|---|---|---|---|---|---|---|---|---|---|---|
| |
Qualified | Non-Qualified | Qualified | Non-Qualified | |||||||||
Other assets |
$ | 1 | $ | — | $ | — | $ | — | |||||
Accrued liabilities |
(3 | ) | (12 | ) | (2 | ) | (12 | ) | |||||
Other liabilities |
(399 | ) | (162 | ) | (452 | ) | (178 | ) | |||||
| | | | | | | | | | | | | | |
Total net liability |
$ | (401 | ) | $ | (174 | ) | $ | (454 | ) | $ | (190 | ) | |
| | | | | | | | | | | | | | |
| | | | | | | | | | | | | | |
| | | | | | | | | | | | | | |
Unrealized loss included in accumulated other comprehensive income (loss) before income taxes was as follows, in millions:
| |
At December 31, 2015 | At December 31, 2014 | |||||||||||
|---|---|---|---|---|---|---|---|---|---|---|---|---|---|
| |
Qualified | Non-Qualified | Qualified | Non-Qualified | |||||||||
Net loss |
$ | 501 | $ | 56 | $ | 524 | $ | 68 | |||||
Net transition obligation |
1 | — | 1 | — | |||||||||
Net prior service cost |
2 | — | 2 | — | |||||||||
| | | | | | | | | | | | | | |
Total |
$ | 504 | $ | 56 | $ | 527 | $ | 68 | |||||
| | | | | | | | | | | | | | |
| | | | | | | | | | | | | | |
| | | | | | | | | | | | | | |
67
MASCO CORPORATION
NOTES TO CONSOLIDATED FINANCIAL STATEMENTS (Continued)
M. EMPLOYEE RETIREMENT PLANS (Continued)
Information for defined-benefit pension plans with an accumulated benefit obligation in excess of plan assets was as follows, in millions:
| |
At December 31 | ||||||||||||
|---|---|---|---|---|---|---|---|---|---|---|---|---|---|
| |
2015 | 2014 | |||||||||||
| |
Qualified | Non-Qualified | Qualified | Non-Qualified | |||||||||
Projected benefit obligation |
$ | 1,045 | $ | 174 | $ | 1,132 | $ | 190 | |||||
Accumulated benefit obligation |
$ | 1,045 | $ | 174 | $ | 1,132 | $ | 190 | |||||
Fair value of plan assets |
$ | 643 | $ | — | $ | 677 | $ | — | |||||
The projected benefit obligation was in excess of plan assets for all of our qualified defined-benefit pension plans at December 31, 2015 and 2014 which had an accumulated benefit obligation in excess of plan assets.
Net periodic pension cost for our defined-benefit pension plans was as follows, in millions:
| |
2015 | 2014 | 2013 | ||||||||||||||||
|---|---|---|---|---|---|---|---|---|---|---|---|---|---|---|---|---|---|---|---|
| |
Qualified | Non-Qualified | Qualified | Non-Qualified | Qualified | Non-Qualified | |||||||||||||
Service cost |
$ | 3 | $ | — | $ | 3 | $ | — | $ | 3 | $ | — | |||||||
Interest cost |
47 | 7 | 47 | 7 | 44 | 6 | |||||||||||||
Expected return on plan assets |
(46 | ) | — | (45 | ) | — | (40 | ) | — | ||||||||||
Recognized net loss |
18 | 3 | 11 | 2 | 16 | 2 | |||||||||||||
| | | | | | | | | | | | | | | | | | | | |
Net periodic pension cost |
$ | 22 | $ | 10 | $ | 16 | $ | 9 | $ | 23 | $ | 8 | |||||||
| | | | | | | | | | | | | | | | | | | | |
| | | | | | | | | | | | | | | | | | | | |
| | | | | | | | | | | | | | | | | | | | |
We expect to recognize $19 million of pre-tax net loss from accumulated other comprehensive income (loss) into net periodic pension cost in 2016 related to our defined-benefit pension plans.
Plan Assets. Our qualified defined-benefit pension plan weighted average asset allocation, which is based upon fair value, was as follows:
| |
2015 | 2014 | |||||
|---|---|---|---|---|---|---|---|
Equity securities |
49 | % | 46 | % | |||
Debt securities |
32 | % | 34 | % | |||
Other |
19 | % | 20 | % | |||
| | | | | | | | |
Total |
100 | % | 100 | % | |||
| | | | | | | | |
| | | | | | | | |
| | | | | | | | |
For our qualified defined-benefit pension plans, we have adopted accounting guidance that defines fair value, establishes a framework for measuring fair value and prescribes disclosures about fair value measurements. Accounting guidance defines fair value as "the price that would be received to sell an asset or paid to transfer a liability in an orderly transaction between market participants at the measurement date."
Following is a description of the valuation methodologies used for assets measured at fair value. There have been no changes in the methodologies used at December 31, 2015 compared to December 31, 2014.
68
MASCO CORPORATION
NOTES TO CONSOLIDATED FINANCIAL STATEMENTS (Continued)
M. EMPLOYEE RETIREMENT PLANS (Continued)
Common and Preferred Stocks: Valued at the closing price on the active market on which the individual securities are traded, or based on the active market for similar securities.
Private Equity and Hedge Funds: Valued based on an estimated fair value using either a market approach or an income approach, each of which requires a significant degree of judgment. There is no active trading market for these investments and they are generally illiquid. Due to the significant unobservable inputs, the fair value measurements used to estimate fair value are a Level 3 input.
Corporate Debt Securities: Valued based on the active market for similar securities or on estimated fair value.
Government and Other Debt Securities: Valued based on either the closing price reported on the active market on which the individual securities are traded, the market for similar securities or estimated fair value based on a model for similar securities.
Common Collective Trust Fund: Valued based on a unit value basis, which approximates fair value. Such basis is determined by reference to the respective fund's underlying assets, which are primarily marketable equity and fixed income securities. There are no unfunded commitments or other restrictions associated with this fund.
Short-Term and Other Investments: Valued based on a net asset value (NAV), which approximates fair value. Such basis is determined by referencing the respective fund's underlying assets. There are no unfunded commitments or other restrictions associated with these investments.
The methods described above may produce a fair value calculation that may not be indicative of net realizable value or reflective of future fair values. Furthermore, while we believe our valuation methods are appropriate and consistent with other market participants, the use of different methodologies or assumptions to determine the fair value of certain financial instruments could result in a different fair value measurement at the reporting date.
69
MASCO CORPORATION
NOTES TO CONSOLIDATED FINANCIAL STATEMENTS (Continued)
M. EMPLOYEE RETIREMENT PLANS (Continued)
The following table sets forth, by level within the fair value hierarchy, the qualified defined-benefit pension plan assets at fair value as of December 31, 2015 and 2014, in millions.
| |
At December 31, 2015 | ||||||||||||
|---|---|---|---|---|---|---|---|---|---|---|---|---|---|
| |
Level 1 | Level 2 | Level 3 | Total | |||||||||
Common and Preferred Stocks: |
|||||||||||||
United States |
$ | 127 | $ | 126 | $ | — | $ | 253 | |||||
International |
55 | 14 | — | 69 | |||||||||
Private Equity and Hedge Funds: |
|||||||||||||
United States |
— | — | 52 | 52 | |||||||||
International |
— | — | 24 | 24 | |||||||||
Corporate Debt Securities: |
|||||||||||||
United States |
18 | 26 | — | 44 | |||||||||
International |
— | 48 | — | 48 | |||||||||
Government and Other Debt Securities: |
|||||||||||||
United States |
64 | 3 | — | 67 | |||||||||
International |
23 | 30 | — | 53 | |||||||||
Common Collective Trust Fund – United States |
— | 4 | — | 4 | |||||||||
Short-Term and Other Investments: |
|||||||||||||
United States |
2 | — | — | 2 | |||||||||
International |
2 | 21 | 19 | 42 | |||||||||
| | | | | | | | | | | | | | |
Total Assets at Fair Value |
$ | 291 | $ | 272 | $ | 95 | $ | 658 | |||||
| | | | | | | | | | | | | | |
| | | | | | | | | | | | | | |
| | | | | | | | | | | | | | |
| |
At December 31, 2014 | ||||||||||||
|---|---|---|---|---|---|---|---|---|---|---|---|---|---|
| |
Level 1 | Level 2 | Level 3 | Total | |||||||||
Common and Preferred Stocks: |
|||||||||||||
United States |
$ | 136 | $ | 116 | $ | — | $ | 252 | |||||
International |
50 | 15 | — | 65 | |||||||||
Private Equity and Hedge Funds: |
|||||||||||||
United States |
— | — | 59 | 59 | |||||||||
International |
— | — | 27 | 27 | |||||||||
Corporate Debt Securities: |
|||||||||||||
United States |
15 | 33 | — | 48 | |||||||||
International |
— | 75 | — | 75 | |||||||||
Government and Other Debt Securities: |
|||||||||||||
United States |
64 | 2 | — | 66 | |||||||||
International |
24 | 27 | — | 51 | |||||||||
Common Collective Trust Fund – United States |
— | 5 | — | 5 | |||||||||
Short-Term and Other Investments: |
|||||||||||||
United States |
— | 1 | — | 1 | |||||||||
International |
3 | 21 | 18 | 42 | |||||||||
| | | | | | | | | | | | | | |
Total Assets at Fair Value |
$ | 292 | $ | 295 | $ | 104 | $ | 691 | |||||
| | | | | | | | | | | | | | |
| | | | | | | | | | | | | | |
| | | | | | | | | | | | | | |
70
MASCO CORPORATION
NOTES TO CONSOLIDATED FINANCIAL STATEMENTS (Continued)
M. EMPLOYEE RETIREMENT PLANS (Continued)
Changes in the fair value of the qualified defined-benefit pension plan Level 3 assets, were as follows, in millions:
| |
2015 | 2014 | |||||
|---|---|---|---|---|---|---|---|
Fair Value, January 1 |
$ | 104 | $ | 93 | |||
Purchases |
4 | 13 | |||||
Sales |
(11 | ) | (9 | ) | |||
Transfers, net |
— | — | |||||
Unrealized (losses) gains |
(2 | ) | 7 | ||||
| | | | | | | | |
Fair Value, December 31 |
$ | 95 | $ | 104 | |||
| | | | | | | | |
| | | | | | | | |
| | | | | | | | |
Assumptions. Weighted-average major assumptions used in accounting for our defined-benefit pension plans were as follows:
| |
2015 | 2014 | 2013 | |||||||
|---|---|---|---|---|---|---|---|---|---|---|
Discount rate for obligations |
4.00 | % | 3.80 | % | 4.40 | % | ||||
Expected return on plan assets |
7.25 | % | 7.25 | % | 7.25 | % | ||||
Rate of compensation increase |
— | % | — | % | — | % | ||||
Discount rate for net periodic pension cost |
3.80 | % | 4.40 | % | 3.80 | % | ||||
The discount rate for obligations for 2015 and 2014 was based upon the expected duration of each defined-benefit pension plan's liabilities matched to the December 31, 2015 and 2014 Towers Watson Rate Link Curve. At December 31, 2015, such rates for our defined-benefit pension plans ranged from 2.0 percent to 4.3 percent, with the most significant portion of the liabilities having a discount rate for obligations of 4.0 percent or higher. At December 31, 2014, such rates for our defined-benefit pension plans ranged from 2.0 percent to 4.0 percent, with the most significant portion of the liabilities having a discount rate for obligations of 3.70 percent or higher. The increase in the weighted average discount rate over the last year is principally the result of higher long-term interest rates in the bond markets.
For 2015 and 2014, we determined the expected long-term rate of return on plan assets of 7.25 percent based upon an analysis of expected and historical rates of return of various asset classes utilizing the current and long-term target asset allocation of the plan assets. The projected asset return at both December 31, 2015 and 2014 also considered near term returns, including current market conditions as well as that pension assets are long-term in nature. The actual annual rate of return on our pension plan assets was negative 1.8 percent in 2015, and positive 3.6 percent and 13.6 percent in 2014 and 2013, respectively. For the 10-year period ended December 31, 2015, the actual annual rate of return on our pension plan assets was 3.9 percent. Although this rate of return is less than our current expected long-term rate of return on plan assets, we note that the 10-year period ended December 31, 2015 includes one significant decline in the equity markets in 2008 (of negative 32.1 percent). Accordingly, we believe a 7.25 percent expected long-term rate of return is reasonable.
The investment objectives seek to minimize the volatility of the value of our plan assets relative to pension liabilities and to ensure plan assets are sufficient to pay plan benefits. In 2015, we substantially achieved targeted asset allocation: 50 percent equities, 30 percent fixed-income, and 20 percent alternative investments (such as private equity, commodities and hedge funds).
71
MASCO CORPORATION
NOTES TO CONSOLIDATED FINANCIAL STATEMENTS (Continued)
M. EMPLOYEE RETIREMENT PLANS (Continued)
The asset allocation of the investment portfolio was developed with the objective of achieving our expected rate of return and reducing volatility of asset returns, and considered the freezing of future benefits. The equity portfolios are invested in individual securities or funds that are expected to mirror broad market returns for equity securities. The fixed-income portfolio is invested in corporate bonds, bond index funds and U.S. Treasury securities. It is expected that the alternative investments would have a higher rate of return than the targeted overall long-term return of 7.25 percent. However, these investments are subject to greater volatility, due to their nature, than a portfolio of equities and fixed-income investments, and would be less liquid than financial instruments that trade on public markets. This portfolio is expected to yield a long-term rate of return of 7.25 percent.
The fair value of our plan assets is subject to risk including significant concentrations of risk in our plan assets related to equity, interest rate and operating risk. In order to ensure plan assets are sufficient to pay benefits, a portion of plan assets is allocated to equity investments that are expected, over time, to earn higher returns with more volatility than fixed-income investments which more closely match pension liabilities. Within equity, risk is mitigated by targeting a portfolio that is broadly diversified by geography, market capitalization, manager mandate size, investment style and process.
In order to minimize asset volatility relative to the liabilities, a portion of plan assets are allocated to fixed-income investments that are exposed to interest rate risk. Rate increases generally will result in a decline in fixed-income assets, while reducing the present value of the liabilities. Conversely, rate decreases will increase fixed income assets, partially offsetting the related increase in the liabilities.
Potential events or circumstances that could have a negative effect on estimated fair value include the risks of inadequate diversification and other operating risks. To mitigate these risks, investments are diversified across and within asset classes in support of investment objectives. Policies and practices to address operating risks include ongoing manager oversight, plan and asset class investment guidelines and instructions that are communicated to managers, and periodic compliance and audit reviews to ensure adherence to these policies. In addition, we periodically seek the input of our independent advisor to ensure the investment policy is appropriate.
Other. We sponsor certain post-retirement benefit plans that provide medical, dental and life insurance coverage for eligible retirees and dependents in the United States based upon age and length of service. The aggregate present value of the unfunded accumulated post-retirement benefit obligation was $10 million and $12 million at December 31, 2015 and 2014, respectively.
Cash Flows. At December 31, 2015, we expected to contribute approximately $45 million to our qualified defined-benefit pension plans in 2016, which will exceed ERISA requirements in 2016. We also expected to pay benefits of $8 million and $12 million to participants of our foreign and non-qualified (domestic) defined-benefit pension plans, respectively, in 2016.
72
MASCO CORPORATION
NOTES TO CONSOLIDATED FINANCIAL STATEMENTS (Continued)
M. EMPLOYEE RETIREMENT PLANS (Concluded)
At December 31, 2015, the benefits expected to be paid in each of the next five years, and in aggregate for the five years thereafter, relating to our defined-benefit pension plans, were as follows, in millions:
| |
Qualified Plans |
Non-Qualified Plans |
|||||
|---|---|---|---|---|---|---|---|
2016 |
$ | 49 | $ | 12 | |||
2017 |
$ | 50 | $ | 12 | |||
2018 |
$ | 51 | $ | 12 | |||
2019 |
$ | 52 | $ | 12 | |||
2020 |
$ | 53 | $ | 12 | |||
2021 - 2025 |
$ | 280 | $ | 58 | |||
N. SHAREHOLDERS' EQUITY
On September 30, 2014, we announced that our Board of Directors authorized the repurchase of up to 50 million shares for retirement of our common stock in open-market transactions or otherwise, replacing the previous Board of Directors authorization established in 2007. At December 31, 2015, we have 27.8 million shares remaining under the authorization.
During 2015, we repurchased and retired 17.2 million shares of our common stock for cash aggregating $456 million (including 741 thousand shares to offset the dilutive impact of long-term stock awards granted in 2015). During 2014, we repurchased and retired 6.7 million shares of our common stock for cash aggregating $158 million (including 1.7 million shares to offset the dilutive impact of long-term stock awards granted in 2014). During 2013, we repurchased and retired 1.7 million shares of our common stock for cash aggregating $35 million to offset the dilutive impact of long-term stock awards granted in 2013.
On June 30, 2015, we completed the spin off of Top Build as an independent publicly traded company. As a result of the separation, our retained earnings decreased by $828 million in 2015.
On the basis of amounts paid (declared), cash dividends per common share were $.365 ($.370) in 2015, $.330 ($.345) in 2014 and $.300 ($.300) in 2013.
Accumulated Other Comprehensive Loss. The components of accumulated other comprehensive loss attributable to Masco Corporation were as follows, in millions:
| |
At December 31 | ||||||
|---|---|---|---|---|---|---|---|
| |
2015 | 2014 | |||||
Cumulative translation adjustments |
$ | 245 | $ | 325 | |||
Unrealized loss on marketable securities, net |
(12 | ) | (12 | ) | |||
Unrealized loss on interest rate swaps |
(16 | ) | (18 | ) | |||
Unrecognized net loss and prior service cost, net |
(382 | ) | (406 | ) | |||
| | | | | | | | |
Accumulated other comprehensive loss |
$ | (165 | ) | $ | (111 | ) | |
| | | | | | | | |
| | | | | | | | |
| | | | | | | | |
73
MASCO CORPORATION
NOTES TO CONSOLIDATED FINANCIAL STATEMENTS (Continued)
N. SHAREHOLDERS' EQUITY (Concluded)
The unrealized loss on marketable securities, net, is reported net of income tax expense of $14 million at both December 31, 2015 and 2014. The unrealized loss on interest rate swaps is reported net of income tax benefit of $1 million at both December 31, 2015 and 2014. The unrecognized net loss and prior service cost, net, is reported net of income tax benefit of $186 million and $199 million at December 31, 2015 and 2014, respectively.
O. RECLASSIFICATIONS FROM OTHER COMPREHENSIVE (LOSS) INCOME
The reclassifications from accumulated other comprehensive income (loss) to the consolidated statements of operations were as follows, in millions:
Accumulated Other Comprehensive Income (Loss) |
2015 | 2014 | 2013 | Statement of Operations Line Item | |||||||
|---|---|---|---|---|---|---|---|---|---|---|---|
Amortization of defined benefit pension: |
|||||||||||
Actuarial losses, net |
$ | 21 | $ | 13 | $ | 18 | Selling, general and administrative expenses | ||||
Tax (benefit) expense |
(8 | ) | (5 | ) | 2 | ||||||
| | | | | | | | | | | | |
Net of tax |
$ | 13 | $ | 8 | $ | 20 | |||||
| | | | | | | | | | | | |
| | | | | | | | | | | | |
| | | | | | | | | | | | |
Interest rate swaps |
$ | 2 | $ | 2 | $ | 2 | Interest expense | ||||
Tax (benefit) |
— | (1 | ) | — | |||||||
| | | | | | | | | | | | |
Net of tax |
$ | 2 | $ | 1 | $ | 2 | |||||
| | | | | | | | | | | | |
| | | | | | | | | | | | |
| | | | | | | | | | | | |
P. SEGMENT INFORMATION
Our reportable segments are as follows:
Cabinets and Related Products – principally includes assembled kitchen and bath cabinets; home office workstations; entertainment centers; storage products; bookcases; and kitchen utility products.
Plumbing Products – principally includes faucets; plumbing fittings and valves; showerheads and hand showers; bathtubs and shower enclosures; toilets; spas; and, exercise pools.
Decorative Architectural Products – principally includes paints and stains; and cabinet, door, window and other hardware.
Other Specialty Products – principally includes windows, window frame components and patio doors; staple gun tackers, staples and other fastening tools.
The above products and services are sold to the home improvement and new home construction markets through home center retailers, mass merchandisers, hardware stores, homebuilders, distributors and other outlets for consumers and contractors and direct to the customer.
74
MASCO CORPORATION
NOTES TO CONSOLIDATED FINANCIAL STATEMENTS (Continued)
P. SEGMENT INFORMATION (Continued)
Our operations are principally located in North America and Europe. Our country of domicile is the United States of America.
Corporate assets consist primarily of real property, equipment, cash and cash investments and other investments.
Our segments are based upon similarities in products and services and represent the aggregation of operating units, for which financial information is regularly evaluated by our corporate operating executive in determining resource allocation and assessing performance, and is periodically reviewed by the Board of Directors. Accounting policies for the segments are the same as those for us. We primarily evaluate performance based upon operating profit (loss) and, other than general corporate expense, allocate specific corporate overhead to each segment. The evaluation of segment operating profit (loss) also excludes the income from litigation settlements.
Information by segment and geographic area was as follows, in millions:
| |
Net Sales (1)(2)(3)(4)(5) |
Operating Profit (Loss) (5)(6) |
Assets at December 31 (8) |
|||||||||||||||||||||||||
|---|---|---|---|---|---|---|---|---|---|---|---|---|---|---|---|---|---|---|---|---|---|---|---|---|---|---|---|---|
| |
2015 | 2014 | 2013 | 2015 | 2014 | 2013 | 2015 | 2014 | 2013 | |||||||||||||||||||
Our operations by segment were: |
||||||||||||||||||||||||||||
Cabinets and Related Products |
$ | 1,025 | $ | 999 | $ | 1,014 | $ | 51 | $ | (62 | ) | $ | (10 | ) | $ | 567 | $ | 608 | $ | 659 | ||||||||
Plumbing Products |
3,341 | 3,308 | 3,183 | 512 | 512 | 394 | 1,972 | 1,989 | 2,040 | |||||||||||||||||||
Decorative Architectural Products |
2,020 | 1,998 | 1,927 | 403 | 360 | 351 | 874 | 857 | 812 | |||||||||||||||||||
Other Specialty Products |
756 | 701 | 637 | 57 | 47 | 35 | 748 | 702 | 693 | |||||||||||||||||||
| | | | | | | | | | | | | | | | | | | | | | | | | | | | | |
Total |
$ | 7,142 | $ | 7,006 | $ | 6,761 | $ | 1,023 | $ | 857 | $ | 770 | $ | 4,161 | $ | 4,156 | $ | 4,204 | ||||||||||
| | | | | | | | | | | | | | | | | | | | | | | | | | | | | |
| | | | | | | | | | | | | | | | | | | | | | | | | | | | | |
| | | | | | | | | | | | | | | | | | | | | | | | | | | | | |
Our operations by geographic area were: |
||||||||||||||||||||||||||||
North America |
$ | 5,645 | $ | 5,377 | $ | 5,222 | $ | 841 | $ | 643 | $ | 612 | $ | 2,925 | $ | 2,861 | $ | 2,830 | ||||||||||
International, principally Europe |
1,497 | 1,629 | 1,539 | 182 | 214 | 158 | 1,236 | 1,295 | 1,374 | |||||||||||||||||||
| | | | | | | | | | | | | | | | | | | | | | | | | | | | | |
Total, as above |
$ | 7,142 | $ | 7,006 | $ | 6,761 | 1,023 | 857 | 770 | 4,161 | 4,156 | 4,204 | ||||||||||||||||
| | | | | | | | | | | | | | | | | | | | | | | | | | | | | |
| | | | | | | | | | | | | | | | | | | | | | | | | | | | | |
| | | | | | | | | | | | | | | | | | | | | | | | | | | | | |
General corporate expense, net (6) |
(109 | ) | (145 | ) | (158 | ) | ||||||||||||||||||||||
Income from litigation settlements (7) |
— | 9 | — | |||||||||||||||||||||||||
| | | | | | | | | | | | | | | | | | | | | | | | | | | | | |
Operating profit, as reported |
914 | 721 | 612 | |||||||||||||||||||||||||
|
(225 |
) |
(214 |
) |
(226 |
) |
||||||||||||||||||||||
| | | | | | | | | | | | | | | | | | | | | | | | | | | | | |
Income from continuing operations before income taxes |
$ | 689 | $ | 507 | $ | 386 | ||||||||||||||||||||||
| | | | | | | | | | | | | | | | | | | | | | | | | | | | | |
| | | | | | | | | | | | | | | | | | | | | | | | | | | | | |
| | | | | | | | | | | | | | | | | | | | | | | | | | | | | |
Corporate assets |
1,519 | 1,576 | 1,214 | |||||||||||||||||||||||||
Assets held for sale |
— | 1,476 | 1,467 | |||||||||||||||||||||||||
| | | | | | | | | | | | | | | | | | | | | | | | | | | | | |
Total assets |
$ | 5,680 | $ | 7,208 | $ | 6,885 | ||||||||||||||||||||||
| | | | | | | | | | | | | | | | | | | | | | | | | | | | | |
| | | | | | | | | | | | | | | | | | | | | | | | | | | | | |
| | | | | | | | | | | | | | | | | | | | | | | | | | | | | |
75
MASCO CORPORATION
NOTES TO CONSOLIDATED FINANCIAL STATEMENTS (Continued)
P. SEGMENT INFORMATION (Concluded)
| |
Property Additions (5)
|
Depreciation and Amortization (5) |
|||||||||||||||||
|---|---|---|---|---|---|---|---|---|---|---|---|---|---|---|---|---|---|---|---|
| |
2015 | 2014 | 2013 | 2015 | 2014 | 2013 | |||||||||||||
Our operations by segment were: |
|||||||||||||||||||
Cabinets and Related Products |
$ | 6 | $ | 9 | $ | 9 | $ | 24 | $ | 33 | $ | 42 | |||||||
Plumbing Products |
87 | 65 | 71 | 56 | 63 | 65 | |||||||||||||
Decorative Architectural Products |
16 | 12 | 16 | 16 | 16 | 17 | |||||||||||||
Other Specialty Products |
41 | 28 | 10 | 18 | 18 | 22 | |||||||||||||
| | | | | | | | | | | | | | | | | | | | |
|
150 | 114 | 106 | 114 | 130 | 146 | |||||||||||||
Unallocated amounts, principally related to corporate assets |
1 | 1 | 4 | 13 | 11 | 11 | |||||||||||||
| | | | | | | | | | | | | | | | | | | | |
Total |
$ | 151 | $ | 115 | $ | 110 | $ | 127 | $ | 141 | $ | 157 | |||||||
| | | | | | | | | | | | | | | | | | | | |
| | | | | | | | | | | | | | | | | | | | |
| | | | | | | | | | | | | | | | | | | | |
- (1)
- Included in net sales were export sales from the U.S. of $217 million, $228 million and
$227 million in 2015, 2014 and 2013, respectively.
- (2)
- Excluded from net sales were intra-company sales between segments of less than one percent in 2015, 2014 and
2013.
- (3)
- Included in net sales were sales to one customer of $2,378 million, $2,310 million and
$2,275 million in 2015, 2014 and 2013, respectively. Such net sales were included in each of our segments.
- (4)
- Net sales from our operations in the U.S. were $5,407 million, $5,112 million and
$4,947 million in 2015, 2014 and 2013, respectively.
- (5)
- Net sales, operating profit (loss), property additions and depreciation and amortization expense for 2015,
2014 and 2013 excluded the results of businesses reported as discontinued operations.
- (6)
- General corporate expense, net included those expenses not specifically attributable to our segments.
- (7)
- The income from litigation settlements in 2014 relates to a business in our Decorative Architectural
Products segment.
- (8)
- Long-lived assets of our operations in the U.S. and Europe were $1,487 million and $427 million, $1,470 million and $428 million, and $1,530 million and $481 million at December 31, 2015, 2014 and 2013, respectively.
Q. SEVERANCE COSTS
As part of our continuing review of our operations, actions were taken during 2015, 2014 and 2013 to respond to market conditions. We recorded charges related to severance and early retirement programs of $12 million, $27 million and $19 million for the years ended December 31, 2015, 2014 and 2013, respectively. Such charges are principally reflected in the consolidated statements of operations in selling, general and administrative expenses and were primarily paid when incurred.
76
MASCO CORPORATION
NOTES TO CONSOLIDATED FINANCIAL STATEMENTS (Continued)
R. OTHER INCOME (EXPENSE), NET
Other, net, which is included in other income (expense), net, was as follows, in millions:
| |
2015 | 2014 | 2013 | |||||||
|---|---|---|---|---|---|---|---|---|---|---|
Income from cash and cash investments |
$ | 3 | $ | 3 | $ | 3 | ||||
Income from financial investments, net (Note E) |
8 | 2 | 27 | |||||||
Foreign currency transaction (losses) gains |
(14 | ) | 5 | (21 | ) | |||||
Other items, net |
3 | 1 | — | |||||||
| | | | | | | | | | | |
Total other, net |
$ | — | $ | 11 | $ | 9 | ||||
| | | | | | | | | | | |
| | | | | | | | | | | |
| | | | | | | | | | | |
In 2013, in conjunction with the transaction to sell the Danish ready-to-assemble cabinet business (included in discontinued operations), we also disposed of a related Danish holding company. This disposition triggered the settlement of loans, which resulted in the recognition of $18 million of currency translation expense.
77
MASCO CORPORATION
NOTES TO CONSOLIDATED FINANCIAL STATEMENTS (Continued)
S. INCOME TAXES
| |
|
(In Millions) |
||||||||
|---|---|---|---|---|---|---|---|---|---|---|
| |
2015 | 2014 | 2013 | |||||||
Income from continuing operations before income taxes: |
||||||||||
U.S. |
$ | 496 | $ | 270 | $ | 231 | ||||
Foreign |
193 | 237 | 155 | |||||||
| | | | | | | | | | | |
|
$ | 689 | $ | 507 | $ | 386 | ||||
| | | | | | | | | | | |
| | | | | | | | | | | |
| | | | | | | | | | | |
Income tax expense (benefit) on income from continuing operations: |
||||||||||
Currently payable: |
||||||||||
U.S. Federal |
$ | 10 | $ | 3 | $ | 3 | ||||
State and local |
27 | 1 | 2 | |||||||
Foreign |
56 | 67 | 58 | |||||||
Deferred: |
||||||||||
U.S. Federal |
192 | (401 | ) | 22 | ||||||
State and local |
3 | (21 | ) | 3 | ||||||
Foreign |
5 | (10 | ) | (2 | ) | |||||
| | | | | | | | | | | |
|
$ | 293 | $ | (361 | ) | $ | 86 | |||
| | | | | | | | | | | |
| | | | | | | | | | | |
| | | | | | | | | | | |
Deferred tax assets at December 31 (1): |
||||||||||
Receivables |
$ | 9 | $ | 9 | ||||||
Inventories |
17 | 25 | ||||||||
Other assets, principally stock-based Compensation |
78 | 77 | ||||||||
Accrued liabilities |
118 | 102 | ||||||||
Long-term liabilities |
225 | 284 | ||||||||
Net operating loss carryforward |
39 | 194 | ||||||||
Tax credit carryforward |
55 | 44 | ||||||||
| | | | | | | | | | | |
|
541 | 735 | ||||||||
Valuation allowance |
(49 | ) | (66 | ) | ||||||
| | | | | | | | | | | |
|
492 | 669 | ||||||||
| | | | | | | | | | | |
Deferred tax liabilities at December 31 (1): |
||||||||||
Property and equipment |
104 | 118 | ||||||||
Intangibles |
212 | 387 | ||||||||
Investment in foreign subsidiaries |
8 | 4 | ||||||||
Other |
1 | 13 | ||||||||
| | | | | | | | | | | |
|
325 | 522 | ||||||||
| | | | | | | | | | | |
Net deferred tax asset at December 31 |
$ | 167 | $ | 147 | ||||||
| | | | | | | | | | | |
| | | | | | | | | | | |
| | | | | | | | | | | |
- (1)
- 2014 amounts have not been recasted to exclude discontinued operations.
The net deferred tax asset consisted of net long-term deferred tax liabilities (included in other liabilities) of $17 million and $17 million, and net long-term deferred tax assets (included in other assets) of $184 million and $293 million, at December 31, 2015 and 2014, respectively, and net long-term liabilities (included in liabilities held for sale) of $129 million at December 31, 2014.
78
MASCO CORPORATION
NOTES TO CONSOLIDATED FINANCIAL STATEMENTS (Continued)
S. INCOME TAXES (Continued)
The tax benefit from certain stock-based compensation is not recognized as a deferred tax asset until the tax deduction reduces cash taxes. During 2015, we recorded a $53 million deferred tax asset to paid-in capital related to additional net operating losses, previously not recognized, that were used to reduce cash taxes on our 2015 taxable income.
As a result of recording the separation of TopBuild due to its spin off, as of June 30, 2015, our net deferred tax asset increased by $190 million.
The current portion of the state and local income tax includes a $5 million, $8 million and $8 million tax benefit from the reversal of an accrual for uncertain tax positions resulting primarily from the expiration of applicable statutes of limitations and favorable settlements on state audits in 2015, 2014 and 2013, respectively. The deferred portion of the state and local taxes includes a $(1) million, $(29) million and $19 million tax (benefit) expense resulting from a change in the valuation allowance against state and local deferred tax assets in 2015, 2014 and 2013, respectively. The deferred portion of the foreign taxes includes $12 million and $(6) million tax expense (benefit) from a change in the valuation allowance against foreign deferred tax assets in 2015 and 2014, respectively.
During 2015 we recorded a $21 million valuation allowance against certain deferred tax assets related to TopBuild as a non-cash charge to income tax expense. The TopBuild deferred tax assets have been impaired by our decision to spin off TopBuild into a separate company that on a stand-alone basis as of June 30, 2015, the spin off date, will unlikely be able to realize the value of such deferred tax assets as a result of its history of losses.
Our capital management strategy includes the repurchase of Masco common stock, the payment of dividends, the pay-down of debt and the funding of potential acquisitions both within and outside the U.S. In order to provide greater flexibility in the execution of our capital management strategy, we determined in the fourth quarter of 2015 that we may repatriate earnings from certain foreign subsidiaries that were previously considered permanently reinvested. As a result, we recorded a $19 million charge to income tax expense in 2015 to recognize the required taxes on foreign earnings, including those previously considered permanently reinvested. Our December 31, 2015 deferred tax balance on investment in foreign subsidiaries reflects the impact of all taxable temporary differences, including those related to substantially all undistributed foreign earnings, except those that are legally restricted.
The accounting guidance for income taxes requires that the future realization of deferred tax assets depends on the existence of sufficient taxable income in future periods. Possible sources of taxable income include taxable income in carryback periods, the future reversal of existing taxable temporary differences recorded as a deferred tax liability, tax-planning strategies that generate future income or gains in excess of anticipated losses in the carryforward period and projected future taxable income.
If, based upon all available evidence, both positive and negative, it is more likely than not (more than 50 percent likely) such deferred tax assets will not be realized, a valuation allowance is recorded. Significant weight is given to positive and negative evidence that is objectively verifiable. A company's three-year cumulative loss position is significant negative evidence in considering whether deferred tax assets are realizable, and the accounting guidance restricts the amount of reliance the company can place on projected taxable income to support the recovery of the deferred tax assets.
In 2010, we recorded a $372 million valuation allowance against our U.S. Federal deferred tax assets as a non-cash charge to income tax expense. In reaching this conclusion, we considered the weaker
79
MASCO CORPORATION
NOTES TO CONSOLIDATED FINANCIAL STATEMENTS (Continued)
S. INCOME TAXES (Continued)
retail sales of certain of our building products and the slower than anticipated recovery in the U.S. housing market which led to U.S. operating losses and significant U.S. goodwill impairment charges, that primarily occurred in the fourth quarter of 2010, causing us to be in a three-year cumulative U.S. loss position.
During 2012 and 2011, objective and verifiable negative evidence, such as U.S. operating losses and significant impairment charges for U.S. goodwill and other intangible assets, continued to outweigh positive evidence necessary to reduce the valuation allowance. As a result, we recorded increases of $65 million and $87 million in the valuation allowance related to our U.S. Federal deferred tax assets in 2012 and 2011, respectively.
In the third quarter of 2014, we recorded a $517 million tax benefit from the release of the valuation allowance against our U.S. Federal and certain state deferred tax assets due primarily to a return to sustainable profitability in our U.S. operations. In reaching this conclusion, we considered the continued improvement in both the new home construction market and repair and remodel activity in the U.S. and our progress on strategic initiatives to reduce costs and expand our product leadership positions which contributed to the continued improvement in our U.S. operations over the past few years.
In the fourth quarter of 2014, we recorded an additional $12 million tax benefit from the release of the valuation allowances against certain U.K. and Mexican deferred tax assets primarily resulting from a return to sustainable profitability in these jurisdictions.
We continue to maintain a valuation allowance on certain state and foreign deferred tax assets as of December 31, 2015. Should we determine that we would not be able to realize our remaining deferred tax assets in these jurisdictions in the future, an adjustment to the valuation allowance would be recorded in the period such determination is made.
Of the $94 million and $238 million deferred tax asset related to the net operating loss and tax credit carryforwards at December 31, 2015 and December 31, 2014, $67 million and $233 million will expire between 2021 and 2033 and $27 million and $5 million are unlimited, respectively.
A reconciliation of the U.S. Federal statutory tax rate to the income tax expense (benefit) on income from continuing operations was as follows:
| |
2015 | 2014 | 2013 | |||||||
|---|---|---|---|---|---|---|---|---|---|---|
U.S. Federal statutory tax rate – expense |
35 | % | 35 | % | 35 | % | ||||
State and local taxes, net of U.S. Federal tax benefit |
3 | (2 | ) | 1 | ||||||
Lower taxes on foreign earnings |
(1 | ) | (5 | ) | — | |||||
U.S. and foreign taxes on distributed and undistributed foreign earnings |
3 | — | — | |||||||
U.S. Federal valuation allowance |
3 | (98 | ) | (13 | ) | |||||
Other, net |
— | (1 | ) | (1 | ) | |||||
| | | | | | | | | | | |
Effective tax rate – expense (benefit) |
43 | % | (71 | )% | 22 | % | ||||
| | | | | | | | | | | |
| | | | | | | | | | | |
| | | | | | | | | | | |
Income taxes paid were $107 million, $80 million and $77 million in 2015, 2014 and 2013, respectively.
80
MASCO CORPORATION
NOTES TO CONSOLIDATED FINANCIAL STATEMENTS (Continued)
S. INCOME TAXES (Concluded)
A reconciliation of the beginning and ending liability for uncertain tax positions, including related interest and penalties, is as follows, in millions:
| |
Uncertain Tax Positions |
Interest and Penalties |
Total | |||||||
|---|---|---|---|---|---|---|---|---|---|---|
Balance at January 1, 2014 |
$ | 46 | $ | 13 | $ | 59 | ||||
Current year tax positions: |
||||||||||
Additions |
9 | — | 9 | |||||||
Reductions |
(1 | ) | — | (1 | ) | |||||
Prior year tax positions: |
||||||||||
Additions |
1 | — | 1 | |||||||
Reductions |
(5 | ) | — | (5 | ) | |||||
Settlements with tax authorities |
(1 | ) | — | (1 | ) | |||||
Lapse of applicable statute of limitations |
(10 | ) | — | (10 | ) | |||||
Interest and penalties recognized in income tax expense |
— | (4 | ) | (4 | ) | |||||
| | | | | | | | | | | |
Balance at December 31, 2014 |
$ | 39 | $ | 9 | $ | 48 | ||||
| | | | | | | | | | | |
| | | | | | | | | | | |
| | | | | | | | | | | |
Current year tax positions: |
||||||||||
Additions |
10 | — | 10 | |||||||
Prior year tax positions: |
||||||||||
Additions |
1 | — | 1 | |||||||
Reductions |
(1 | ) | — | (1 | ) | |||||
Lapse of applicable statute of limitations |
(6 | ) | — | (6 | ) | |||||
Interest and penalties recognized in income tax expense |
— | 1 | 1 | |||||||
| | | | | | | | | | | |
Balance at December 31, 2015 |
$ | 43 | $ | 10 | $ | 53 | ||||
| | | | | | | | | | | |
| | | | | | | | | | | |
| | | | | | | | | | | |
If recognized, $28 million and $26 million of the liability for uncertain tax positions at December 31, 2015 and 2014, respectively, net of any U.S. Federal tax benefit, would impact our effective tax rate.
Of the $53 million and $48 million total liability for uncertain tax positions (including related interest and penalties) at December 31, 2015 and 2014, $52 million and $48 million are recorded in other liabilities, respectively, and $1 million is recorded as a net offset to other assets at December 31, 2015.
We file income tax returns in the U.S. Federal jurisdiction, and various local, state and foreign jurisdictions. We continue to participate in the Compliance Assurance Program ("CAP"). CAP is a real-time audit of the U.S. Federal income tax return that allows the Internal Revenue Service ("IRS"), working in conjunction with us, to determine tax return compliance with the U.S. Federal tax law prior to filing the return. This program provides us with greater certainty about our tax liability for a given year within months, rather than years, of filing our annual tax return and greatly reduces the need for recording a liability for U.S. Federal uncertain tax positions. The IRS has completed their examination of our consolidated U.S. Federal tax returns through 2014. With few exceptions, we are no longer subject to state or foreign income tax examinations on filed returns for years before 2005.
As a result of tax audit closings, settlements and the expiration of applicable statutes of limitations in various jurisdictions within the next 12 months, we anticipate that it is reasonably possible the liability for uncertain tax positions could be reduced by approximately $8 million.
81
MASCO CORPORATION
NOTES TO CONSOLIDATED FINANCIAL STATEMENTS (Continued)
T. EARNINGS PER COMMON SHARE
Reconciliations of the numerators and denominators used in the computations of basic and diluted earnings per common share were as follows, in millions:
| |
2015 | 2014 | 2013 | |||||||
|---|---|---|---|---|---|---|---|---|---|---|
Numerator (basic and diluted): |
||||||||||
Income from continuing operations |
$ | 357 | $ | 821 | $ | 259 | ||||
Less: Allocation to unvested restricted stock awards |
5 | 16 | 6 | |||||||
| | | | | | | | | | | |
Income from continuing operations attributable to common shareholders |
352 | 805 | 253 | |||||||
| | | | | | | | | | | |
(Loss) income from discontinued operations, net |
(2 | ) | 35 | 29 | ||||||
Less: Allocation to unvested restricted stock awards |
— | (1 | ) | — | ||||||
| | | | | | | | | | | |
(Loss) income from discontinued operations attributable to common shareholders |
(2 | ) | 34 | 29 | ||||||
| | | | | | | | | | | |
Net income available to common shareholders |
$ | 350 | $ | 839 | $ | 282 | ||||
| | | | | | | | | | | |
| | | | | | | | | | | |
| | | | | | | | | | | |
Denominator: |
||||||||||
Basic common shares (based upon weighted average) |
338 | 349 | 350 | |||||||
Add: |
||||||||||
Stock option dilution |
3 | 3 | 2 | |||||||
| | | | | | | | | | | |
Diluted common shares |
341 | 352 | 352 | |||||||
| | | | | | | | | | | |
| | | | | | | | | | | |
| | | | | | | | | | | |
We follow accounting guidance regarding determining whether instruments granted in share-based payment transactions are participating securities. This accounting guidance clarifies that share-based payment awards that entitle their holders to receive non-forfeitable dividends prior to vesting should be considered participating securities. We have granted restricted stock awards that contain non-forfeitable rights to dividends on unvested shares; such unvested restricted stock awards are considered participating securities. As participating securities, the unvested shares are required to be included in the calculation of our basic earnings per common share, using the "two-class method." The two-class method of computing earnings per common share is an allocation method that calculates earnings per share for each class of common stock and participating security according to dividends declared and participation rights in undistributed earnings. For the years ended December 31, 2015, 2014 and 2013, we allocated dividends and undistributed earnings to the participating securities.
Additionally, 5 million common shares, 7 million common shares and 12 million common shares for 2015, 2014 and 2013, respectively, related to stock options were excluded from the computation of diluted earnings per common share due to their antidilutive effect.
Common shares outstanding included on our balance sheet and for the calculation of earnings per common share do not include unvested stock awards (5 million common shares and 6 million common shares at December 31, 2015 and 2014, respectively); shares outstanding for legal requirements included all common shares that have voting rights (including unvested stock awards).
82
MASCO CORPORATION
NOTES TO CONSOLIDATED FINANCIAL STATEMENTS (Continued)
U. OTHER COMMITMENTS AND CONTINGENCIES
Litigation. We are subject to claims, charges, litigation and other proceedings in the ordinary course of our business, including those arising from or related to contractual matters, intellectual property, personal injury, environmental matters, product liability, product recalls, construction defect, insurance coverage, personnel and employment disputes, anti-trust issues and other matters, including class actions. We believe we have adequate defenses in these matters and that the likelihood that the outcome of these matters would have a material adverse effect on us is remote. However, there is no assurance that we will prevail in these matters, and we could, in the future, incur judgments, enter into settlements of claims or revise our expectations regarding the outcome of these matters, which could materially impact our results of operations.
Warranty. Changes in our warranty liability were as follows, in millions:
| |
2015 | 2014 | |||||
|---|---|---|---|---|---|---|---|
Balance at January 1 |
$ | 135 | $ | 124 | |||
Accruals for warranties issued during the year |
56 | 51 | |||||
Accruals related to pre-existing warranties |
15 | 11 | |||||
Settlements made (in cash or kind) during the year |
(50 | ) | (46 | ) | |||
Other, net (including currency translation) |
(4 | ) | (5 | ) | |||
| | | | | | | | |
Balance at December 31 |
$ | 152 | $ | 135 | |||
| | | | | | | | |
| | | | | | | | |
| | | | | | | | |
Investments. With respect to our investments in private equity funds, we had, at December 31, 2015, commitments to contribute up to $6 million of additional capital to such funds representing our aggregate capital commitment to such funds less capital contributions made to date. We are contractually obligated to make additional capital contributions to certain of our private equity funds upon receipt of a capital call from the private equity fund. We have no control over when or if the capital calls will occur. Capital calls are funded in cash and generally result in an increase in the carrying value of our investment in the private equity fund when paid.
Other Matters. We enter into contracts, which include reasonable and customary indemnifications that are standard for the industries in which we operate. Such indemnifications include customer claims against builders for issues relating to our products and workmanship. In conjunction with divestitures and other transactions, we occasionally provide reasonable and customary indemnifications relating to various items including: the enforceability of trademarks; legal and environmental issues; provisions for sales returns; and asset valuations. We have never had to pay a material amount related to these indemnifications and we evaluate the probability that amounts may be incurred and appropriately record an estimated liability when probable.
83
MASCO CORPORATION
NOTES TO CONSOLIDATED FINANCIAL STATEMENTS (Continued)
V. INTERIM FINANCIAL INFORMATION (UNAUDITED)
| |
|
Quarters Ended | ||||||||||||||
|---|---|---|---|---|---|---|---|---|---|---|---|---|---|---|---|---|
| |
|
(In Millions, Except Per Common Share Data) |
||||||||||||||
| |
Total Year |
December 31 | September 30 | June 30 | March 31 | |||||||||||
2015 |
||||||||||||||||
Net sales |
$ | 7,142 | $ | 1,715 | $ | 1,839 | $ | 1,929 | $ | 1,659 | ||||||
Gross profit |
$ | 2,253 | $ | 532 | $ | 589 | $ | 637 | $ | 495 | ||||||
Income from continuing operations |
$ | 357 | $ | 76 | $ | 111 | $ | 109 | $ | 61 | ||||||
Net income |
$ | 355 | $ | 75 | $ | 111 | $ | 105 | $ | 64 | ||||||
Earnings per common share: |
||||||||||||||||
Basic: |
||||||||||||||||
Income from continuing operations |
$ | 1.04 | $ | .23 | $ | .33 | $ | .32 | $ | .17 | ||||||
Net income |
$ | 1.03 | $ | .22 | $ | .33 | $ | .30 | $ | .18 | ||||||
Diluted: |
||||||||||||||||
Income from continuing operations |
$ | 1.03 | $ | .22 | $ | .32 | $ | .31 | $ | .17 | ||||||
Net income |
$ | 1.02 | $ | .22 | $ | .32 | $ | .30 | $ | .18 | ||||||
2014 |
||||||||||||||||
Net sales |
$ | 7,006 | $ | 1,666 | $ | 1,834 | $ | 1,876 | $ | 1,630 | ||||||
Gross profit |
$ | 2,060 | $ | 481 | $ | 522 | $ | 575 | $ | 482 | ||||||
Income from continuing operations |
$ | 821 | $ | 86 | $ | 533 | $ | 124 | $ | 78 | ||||||
Net income |
$ | 856 | $ | 100 | $ | 543 | $ | 139 | $ | 74 | ||||||
Earnings per common share: |
||||||||||||||||
Basic: |
||||||||||||||||
Income from continuing operations |
$ | 2.31 | $ | .24 | $ | 1.49 | $ | .35 | $ | .22 | ||||||
Net income |
$ | 2.40 | $ | .28 | $ | 1.52 | $ | .39 | $ | .21 | ||||||
Diluted: |
||||||||||||||||
Income from continuing operations |
$ | 2.28 | $ | .24 | $ | 1.48 | $ | .35 | $ | .22 | ||||||
Net income |
$ | 2.38 | $ | .28 | $ | 1.51 | $ | .39 | $ | .21 | ||||||
Earnings per common share amounts for the four quarters of 2015 and 2014 may not total to the earnings per common share amounts for the years ended December 31, 2015 and 2014 due to the allocation of income to participating securities.
In the third quarter of 2014, we recorded a $517 million tax benefit from the release of the valuation allowance against our U.S. Federal and certain state deferred tax assets.
84
Item 9. Changes in and Disagreements with Accountants on Accounting and Financial Disclosure.
Not applicable.
Item 9A. Controls and Procedures.
- a.
- Evaluation of Disclosure Controls and Procedures.
The Company's principal executive officer and principal financial officer have concluded, based on an evaluation of the Company's disclosure controls and procedures (as defined in the Securities Exchange Act of 1934 Rules 13a-15(e) or 15d-15(e)) as required by paragraph (b) of Exchange Act Rules 13a-15 or 15d-15 that, as of December 31, 2015, the Company's disclosure controls and procedures were effective.
- b.
- Management's Report on Internal Control over Financial Reporting.
Management's report on the Company's internal control over financial reporting (as such term is defined in Rules 13a-15(f) and 15d-15(f) under the Exchange Act) is included in this Report under Item 8. Financial Statements and Supplementary Data, under the heading, "Management's Report on Internal Control over Financial Reporting" and is incorporated herein by reference. The report of our independent registered public accounting firm is also included under Item 8, under the heading, "Report of Independent Registered Public Accounting Firm" and is incorporated herein by reference.
- c.
- Changes in Internal Control over Financial Reporting.
In connection with the evaluation of the Company's "internal control over financial reporting" that occurred during the quarter ended December 31, 2015, which is required under the Securities Exchange Act of 1934 by paragraph (d) of Exchange Rules 13a-15 or 15d-15 (as defined in paragraph (f) of Rule 13a-15), management determined that there was no change that materially affected or is reasonably likely to materially affect internal control over financial reporting.
During the first quarter of 2016, we started a phased deployment of a new Enterprise Resource Planning ("ERP") system at Milgard. The system implementation is designed, in part, to enhance the overall system of internal control over financial reporting through further automation and improve business processes and is not in response to any identified deficiency or weakness in the Company's internal control over financial reporting. However, this system implementation is significant in scale and complexity and will result in modification to certain Milgard internal controls.
Not applicable.
85
Item 10. Directors, Executive Officers and Corporate Governance.
Our Code of Business Ethics applies to all employees, officers and directors including our Principal Executive Officer, Principal Financial Officer and Principal Accounting Officer, and is posted on our website at www.masco.com. Other information required by this Item will be contained in our definitive Proxy Statement for the 2016 Annual Meeting of Stockholders, to be filed on or before April 29, 2016, and such information is incorporated herein by reference.
Item 11. Executive Compensation.
Information required by this Item will be contained in our definitive Proxy Statement for the 2016 Annual Meeting of Stockholders, to be filed on or before April 29, 2016, and such information is incorporated herein by reference.
Item 12. Security Ownership of Certain Beneficial Owners and Management and Related Stockholder Matters.
Equity Compensation Plan Information
We grant equity under our 2014 Long Term Stock Incentive Plan (the "2014 Plan"). The following table sets forth information as of December 31, 2015 concerning the 2015 Plan, which was approved by our stockholders. We do not have any equity compensation plans that have not been approved by our stockholders.
Plan Category
|
Number of Securities to be Issued Upon Exercise of Outstanding Options, Warrants and Rights |
Weighted-Average Exercise Price of Outstanding Options, Warrants and Rights |
Number of Securities Remaining Available for Future Issuance Under Equity Compensation Plans (Excluding Securities Reflected in the First Column) |
|||||||
|---|---|---|---|---|---|---|---|---|---|---|
Equity compensation plans approved by stockholders |
12,278,037 | $ | 17.44 | 17,126,332 | ||||||
The remaining information required by this Item will be contained in our definitive Proxy Statement for our 2016 Annual Meeting of Stockholders, to be filed on or before April 29, 2016, and such information is incorporated herein by reference.
Item 13. Certain Relationships and Related Transactions, and Director Independence.
Information required by this Item will be contained in our definitive Proxy Statement for the 2016 Annual Meeting of Stockholders, to be filed on or before April 29, 2016, and such information is incorporated herein by reference.
Item 14. Principal Accountant Fees and Services.
Information required by this Item will be contained in our definitive Proxy Statement for the 2016 Annual Meeting of Stockholders, to be filed on or before April 29, 2016, and such information is incorporated herein by reference.
86
Item 15. Exhibits and Financial Statement Schedules.
a. Listing of Documents.
- (1)
- Financial Statements. Our consolidated financial statements included in Item 8 hereof, as required at December 31, 2015 and 2014, and for the years ended December 31, 2015, 2014 and 2013, consist of the following:
- (2)
- Financial Statement Schedule.
- a.
- Our Financial Statement Schedule appended hereto, as required for the years ended December 31, 2015, 2014 and 2013, consists of the following:
- (3)
- Exhibits.
II. Valuation and Qualifying Accounts
See separate Exhibit Index beginning on page 91.
87
Pursuant to the requirements of Section 13 or 15(d) of the Securities Exchange Act of 1934, the Registrant has duly caused this Report to be signed on its behalf by the undersigned, thereunto duly authorized.
| MASCO CORPORATION | ||||
By: |
/s/ JOHN G. SZNEWAJS John G. Sznewajs |
|||
| Vice President, Treasurer and Chief Financial Officer |
||||
February 12, 2016
88
Pursuant to the requirements of the Securities Exchange Act of 1934, this Report has been signed below by the following persons on behalf of the Registrant and in the capacities and on the date indicated.
| Principal Executive Officer: | ||||||
/s/ KEITH ALLMAN Keith Allman |
President, Chief Executive Officer and Director |
|||||
Principal Financial Officer: |
||||||
/s/ JOHN G. SZNEWAJS John G. Sznewajs |
Vice President, Treasurer and Chief Financial Officer |
|||||
Principal Accounting Officer: |
||||||
/s/ JOHN P. LINDOW John P. Lindow |
Vice President – Controller |
|||||
/s/ J. MICHAEL LOSH J. Michael Losh |
Chairman of the Board |
|||||
/s/ MARK R. ALEXANDER Mark R. Alexander |
Director |
|||||
/s/ DENNIS W. ARCHER Dennis W. Archer |
Director |
February 12, 2016 |
||||
/s/ RICHARD A. MANOOGIAN Richard A. Manoogian |
Chairman Emeritus |
|||||
/s/ CHRISTOPHER A. O'HERLIHY Christopher A. O'Herlihy |
Director |
|||||
/s/ DONALD R. PARFET Donald R. Parfet |
Director |
|||||
/s/ LISA A. PAYNE Lisa A. Payne |
Director |
|||||
/s/ JOHN C. PLANT John C. Plant |
Director |
|||||
/s/ REGINALD M. TURNER, JR. Reginald M. Turner, Jr. |
Director |
|||||
/s/ MARY ANN VAN LOKEREN Mary Ann Van Lokeren |
Director |
89
MASCO CORPORATION
SCHEDULE II. VALUATION AND QUALIFYING ACCOUNTS
for the years ended December 31, 2015, 2014 and 2013
| |
(In Millions) |
|||||||||||||||||||||
|---|---|---|---|---|---|---|---|---|---|---|---|---|---|---|---|---|---|---|---|---|---|---|
Column A
|
Column B | Column C | |
Column D | |
Column E | ||||||||||||||||
| |
|
Additions | |
|
|
|
||||||||||||||||
Description
|
Balance at Beginning of Period |
Charged to Costs and Expenses |
Charged to Other Accounts |
|
Deductions | |
Balance at End of Period |
|||||||||||||||
Allowances for doubtful accounts, deducted from accounts receivable in the balance sheet (e): |
||||||||||||||||||||||
2015 |
$ | 14 | $ | 4 | $ | — | $ | (7 | ) | (a | ) | $ | 11 | |||||||||
| | | | | | | | | | | | | | | | | | | | | | | |
| | | | | | | | | | | | | | | | | | | | | | | |
| | | | | | | | | | | | | | | | | | | | | | | |
2014 |
$ | 22 | $ | 3 | $ | — | $ | (11 | ) | (a | ) | $ | 14 | |||||||||
| | | | | | | | | | | | | | | | | | | | | | | |
| | | | | | | | | | | | | | | | | | | | | | | |
| | | | | | | | | | | | | | | | | | | | | | | |
2013 |
$ | 26 | $ | 5 | $ | — | $ | (9 | ) | (a | ) | $ | 22 | |||||||||
| | | | | | | | | | | | | | | | | | | | | | | |
| | | | | | | | | | | | | | | | | | | | | | | |
| | | | | | | | | | | | | | | | | | | | | | | |
Valuation Allowance on deferred tax assets: |
||||||||||||||||||||||
2015 |
$ | 66 | $ | 36 | $ | (53 | ) | (b | ) | $ | — | $ | 49 | |||||||||
| | | | | | | | | | | | | | | | | | | | | | | |
| | | | | | | | | | | | | | | | | | | | | | | |
| | | | | | | | | | | | | | | | | | | | | | | |
2014 |
$ | 662 | $ | (539 | ) | $ | (57 | ) | (c | ) | $ | — | $ | 66 | ||||||||
| | | | | | | | | | | | | | | | | | | | | | | |
| | | | | | | | | | | | | | | | | | | | | | | |
| | | | | | | | | | | | | | | | | | | | | | | |
2013 |
$ | 785 | $ | (36 | ) | $ | (87 | ) | (d | ) | $ | — | $ | 662 | ||||||||
| | | | | | | | | | | | | | | | | | | | | | | |
| | | | | | | | | | | | | | | | | | | | | | | |
| | | | | | | | | | | | | | | | | | | | | | | |
- (a)
- Deductions,
representing uncollectible accounts written off, less recoveries of accounts written off in prior years.
- (b)
- Valuation
allowance on deferred tax assets allocated to TopBuild due to its spin off into a separate stand-alone company on June 30, 2015.
- (c)
- Write
off of a $55 million deferred tax asset on certain net operating loss carryforward against the valuation allowance as it was determined that
there was only a remote likelihood that such a carryforward could be utilized; and $2 million valuation allowance on deferred tax assets recorded primarily in other comprehensive income.
- (d)
- Valuation
allowance on deferred tax assets recorded primarily in other comprehensive income and paid in capital.
- (e)
- Amounts exclude discontinued operations.
90
| |
|
|
|
Incorporated By Reference | |
||||||||||
|---|---|---|---|---|---|---|---|---|---|---|---|---|---|---|---|
| Exhibit No. |
|
|
|
Filed Herewith |
|||||||||||
| Exhibit Description | Form | Exhibit | Filing Date | ||||||||||||
| 2 | Separation and Distribution Agreement dated June 29, 2015.1 | 8-K | 2.1 | 07/06/2015 | |||||||||||
| 3.i | Restated Certificate of Incorporation of Masco Corporation. | X | |||||||||||||
| 3.ii | Bylaws of Masco Corporation, as Amended and Restated May 8, 2012. | 8-K | 3.ii | 05/10/2012 | |||||||||||
| 4.a.i | Indenture dated as of December 1, 1982 between Masco Corporation and The Bank of New York Mellon Trust Company, N.A., as successor trustee under agreement originally with Morgan Guaranty Trust Company of New York, as Trustee and Directors' resolutions establishing Masco Corporation's: | 2011 10-K | 4.a.i | 02/21/2012 | |||||||||||
| (i) | 6.625% Debentures Due April 15, 2018; and | 2013 10-K | 4.a.i(i) | 02/14/2014 | |||||||||||
| (ii) | 73/4% Debentures Due August 1, 2029. | 2014 10-K | 4.a.i(ii) | 02/13/2015 | |||||||||||
| 4.a.ii | Supplemental Indenture dated as of July 26, 1994 between Masco Corporation and The Bank of New York Mellon Trust Company, N.A., as successor trustee under agreement originally with The First National Bank of Chicago, as Trustee. | 2014 10-K | 4.a.ii | 02/13/2015 | |||||||||||
| 4.b.i | Indenture dated as of February 12, 2001 between Masco Corporation and The Bank of New York Mellon Trust Company, N.A., as successor trustee under agreement originally with Bank One Trust Company, National Association, as Trustee and Directors' Resolutions establishing Masco Corporation's: | 2011 10-K | 4.b.i | 02/21/2012 | |||||||||||
| (i) | 61/2% Notes Due August 15, 2032; | 2012 10-K | 4.b.i(i) | 02/15/2013 | |||||||||||
| (ii) | 6.125% Notes Due October 3, 2016; | 2011 10-K | 4.b.i(iv) | 02/21/2012 | |||||||||||
| (iii) | 5.85% Notes Due March 15, 2017; | 2011 10-K | 4.b.i(v) | 02/21/2012 | |||||||||||
| (iv) | 7.125% Notes Due March 15, 2020; | X | |||||||||||||
| (v) | 5.95% Notes Due March 15, 2022; and | 10-Q | 4.b | 05/02/2012 | |||||||||||
| (vi) | 4.45% Notes Due April 1, 2025. | 8-K | 4.1 | 03/23/2015 | |||||||||||
| 4.b.ii | Supplemental Indenture dated as of November 30, 2006 to the Indenture dated February 12, 2001 by and between Masco Corporation and The Bank of New York Mellon Trust Corporation N.A., as Trustee. | 2011 10-K | 4.b.ii | 02/21/2012 | |||||||||||
Note 1: |
Other instruments, notes or extracts from agreements defining the rights of holders of long-term debt of Masco Corporation or its subsidiaries have not been filed since (i) in each case the total amount of long-term debt permitted thereunder does not exceed 10 percent of Masco Corporation's consolidated assets, and (ii) such instruments, notes and extracts will be furnished by Masco Corporation to the Securities and Exchange Commission upon request. |
||||||||||||||
- 1
- The schedules to this agreement are omitted pursuant to Item 601(b)(2) of Regulation S-K. The Company agrees to supplementally furnish to the Securities and Exchange Commission, upon request, a copy of any omitted schedule.
91
| |
|
|
|
Incorporated By Reference | |
||||||||||
|---|---|---|---|---|---|---|---|---|---|---|---|---|---|---|---|
| Exhibit No. |
|
|
|
Filed Herewith |
|||||||||||
| Exhibit Description | Form | Exhibit | Filing Date | ||||||||||||
| 10.a.i | Credit Agreement dated as of March 28, 2013 by and among Masco Corporation and Masco Europe S.à.r.l. as borrowers, the lenders party thereto, JPMorgan Chase Bank, N.A. as Administrative Agent, Citibank, N.A. as Syndication Agent, and Royal Bank of Canada, Deutsche Bank Securities, Inc., PNC Bank, National Association, and SunTrust Bank as Co-Documentation Agents. | 8-K | 10 | 04/03/2013 | |||||||||||
| 10.a.ii | Amendment No. 1 dated as of May 29, 2015 to Credit Agreement dated as of March 28, 2013 among Masco Corporation and Masco Europe S.à r.l., as borrowers, the lenders party thereto, JPMorgan Chase Bank, N.A., as Administrative Agent, Citibank, N.A., as Syndication Agent, and Royal Bank of Canada, Deutsche Bank Securities Inc., PNC Bank, National Association, and SunTrust Bank, as Co-Documentation Agents. | 8-K | 10 | 06/04/15 | |||||||||||
| 10.a.iii | Amendment No. 2 dated as of August 28, 2015 to Credit Agreement dated as of March 28, 2013 among Masco Corporation and Masco Europe S.à r.l., as borrowers, the lenders party thereto, JPMorgan Chase Bank, N.A., as Administrative Agent, Citibank, N.A., as Syndication Agent, and Royal Bank of Canada, Deutsche Bank Securities Inc., PNC Bank, National Association, and SunTrust Bank, as Co-Documentation Agents. | 10-Q | 10 | 10/27/2015 | |||||||||||
Note 2: |
Exhibits 10.b through 10.m constitute the management contracts and executive compensatory plans or arrangements in which certain of the Directors and executive officers of the Company participate. |
||||||||||||||
| 10.b.i | Masco Corporation 2005 Long Term Stock Incentive Plan (Amended and Restated May 11, 2010): | X | |||||||||||||
| (i) | Form of Restricted Stock Award Agreements: | ||||||||||||||
| (A) | for awards on or after January 1, 2013; | 2012 10-K | 10.b.i(i)(A) | 02/15/2013 | |||||||||||
| (B) | for awards during 2012; | 2012 10-K | 10.b.i(i)(B) | 02/15/2013 | |||||||||||
| (C) | for awards prior to 2012; | X | |||||||||||||
| (ii) | Form of Stock Option Grant Agreements: | ||||||||||||||
| (A) | for grants on or after January 1, 2013; | 2012 10-K | 10.b.i(ii)(A) | 02/15/2013 | |||||||||||
| (B) | for grants during 2012; | 2012 10-K | 10.b.i(ii)(B) | 02/15/2013 | |||||||||||
| (C) | for grants prior to 2012; | X | |||||||||||||
| (iii) | Form of Stock Option Grant for Non- Employee Directors. | 2014 10-K | 10.c.i.iv | 02/13/2015 | |||||||||||
| 10.b.ii | Non-Employee Directors Equity Program under Masco Corporation's 2005 Long Term Stock Incentive Plan (Amended July 2012): | 2012 10-K | 10.b.ii | 02/15/2013 | |||||||||||
| (i) | Form of Restricted Stock Awards. | 2012 10-K | 10.b.ii(i) | 02/15/2013 | |||||||||||
| 10.b.iii | Non-Employee Directors Equity Program under Masco Corporation's 2005 Long Term Stock Incentive Plan (Amended October 2010): | X | |||||||||||||
92
| |
|
|
|
Incorporated By Reference | |
||||||||||
|---|---|---|---|---|---|---|---|---|---|---|---|---|---|---|---|
| Exhibit No. |
|
|
|
Filed Herewith |
|||||||||||
| Exhibit Description | Form | Exhibit | Filing Date | ||||||||||||
| (i) | Form of Restricted Stock Award for awards 2010 through 2012. | 2012 10-K | 10.b.iii(i) | 02/15/2013 | |||||||||||
| 10.b.iv | Non-Employee Directors Equity Program under Masco Corporation's 2005 Long Term Stock Incentive Plan (for awards prior to 2010): | 2012 10-K | 10.b.iv | 02/15/2013 | |||||||||||
| (i) | Form of Stock Option Grant Agreement. | 2012 10-K | 10.b.iv(ii) | 02/15/2013 | |||||||||||
| 10.c.i | Masco Corporation 2014 Long Term Stock Incentive Plan: | 8-K | 10.a | 05/06/2014 | |||||||||||
| (i) | Form of Restricted Stock Award Agreement; and | 8-K | 10.b | 05/06/2014 | |||||||||||
| (ii) | Form of Stock Option Grant Agreement. | 8-K | 10.d | 05/06/2014 | |||||||||||
| 10.c.ii | Non-Employee Directors Equity Program under Masco Corporation's 2014 Long Term Stock Incentive Plan: | 10-Q | 10 | 10/28/2014 | |||||||||||
| (i) | Form of Restricted Stock Award Agreement for Non-Employee Directors. | 8-K | 10.c | 05/06/2014 | |||||||||||
| 10.d | Forms of Masco Corporation Supplemental Executive Retirement and Disability Plan and amendments thereto: | ||||||||||||||
| (i) | Richard A. Manoogian; | X | |||||||||||||
| (ii) | John G. Sznewajs (includes amendment freezing benefit accruals); | X | |||||||||||||
| (iii) | Gerald Volas (includes amendment freezing benefit accruals); and, | 10-Q | 10.a | 04/28/2015 | |||||||||||
| (iv) | Timothy Wadhams (includes amendment freezing benefit accruals). | X | |||||||||||||
| 10.e | Masco Corporation 1997 Non-Employee Directors Stock Plan (as amended and restated October 27, 2005): | X | |||||||||||||
| (i) | Form of Stock Option Grant. | X | |||||||||||||
| 10.f | Other compensatory arrangements for executive officers. | 2011 10-K | 10.e | 02/21/2012 | |||||||||||
| 10.g | Form of award letter for the Masco Corporation Long-Term Cash Incentive Program. | 2012 10 K | 10.f.(i) | 02/15/2013 | |||||||||||
| 10.h | Compensation of Non-Employee Directors. | 2014 10-K | 10.i | 02/13/2015 | |||||||||||
| 10.i.i | Masco Corporation Retirement Benefit Restoration Plan effective January 1, 1995 (as amended and restated December 22, 2010). | X | |||||||||||||
| 10.i.ii | Amendment to Masco Corporation Retirement Benefit Restoration Plan effective February 6, 2012. | 10-Q | 10.h | 05/02/2012 | |||||||||||
| 10.i.iii | Amendment to Masco Corporation Retirement Benefit Restoration Plan effective January 1, 2014. | X | |||||||||||||
| 10.j.i | Letter Agreement dated June 29, 2009 between Richard A. Manoogian and Masco Corporation. | 2014 10-K | 10.k.i | 02/13/2015 | |||||||||||
| 10.j.ii | Aircraft Time Sharing Agreement dated October 1, 2012 between Richard A. Manoogian and Masco Corporation. | 2012 10-K | 10.i.ii | 02/15/2013 | |||||||||||
| 10.k | Employment Offer Letter dated October 23, 2014 between Christopher Kastner and Masco Corporation. | 2014 10-K | 10.m | 02/13/2015 | |||||||||||
| 10.l | Employment Offer Letter dated November 1, 2014 between Amit Bhargava and Masco Corporation. | 2014 10-K | 10.n | 02/13/2015 | |||||||||||
93
| |
|
|
|
Incorporated By Reference | |
||||||||||
|---|---|---|---|---|---|---|---|---|---|---|---|---|---|---|---|
| Exhibit No. |
|
|
|
Filed Herewith |
|||||||||||
| Exhibit Description | Form | Exhibit | Filing Date | ||||||||||||
| 10.m | Agreement dated as of June 11, 2015 between Gerald Volas and Masco Corporation. | 8-K | 10 | 06/15/2015 | |||||||||||
| 10.n | Tax Matters Agreement dated June 29, 2015. | 8-K | 10.1 | 07/06/2015 | |||||||||||
| 10.o | Transition Services Agreement dated June 29, 2015. | 8-K | 10.2 | 07/06/2015 | |||||||||||
| 10.p | Employee Matters Agreement dated June 29, 2015. | 8-K | 10.3 | 07/06/2015 | |||||||||||
| 12 | Computation of Ratio of Earnings to Combined Fixed Charges and Preferred Stock Dividends. | X | |||||||||||||
| 21 | List of Subsidiaries. | X | |||||||||||||
| 23 | Consent of Independent Registered Public Accounting Firm relating to Masco Corporation's Consolidated Financial Statements and Financial Statement Schedule. | X | |||||||||||||
| 31.a | Certification by Chief Executive Officer required by Rule 13a-14(a)/15d-14(a). | X | |||||||||||||
| 31.b | Certification by Chief Financial Officer required by Rule 13a-14(a)/15d-14(a). | X | |||||||||||||
| 32 | Certifications required by Rule 13a-14(b) or Rule 15d-14(b) and Section 1350 of Chapter 63 of Title 18 of the United States Code. | X | |||||||||||||
| 101 | Interactive Date File. | X | |||||||||||||
The Company will furnish to its stockholders a copy of any of the above exhibits not included herein upon the written request of such stockholder and the payment to the Company of the reasonable expenses incurred by the Company in furnishing such copy or copies. |
|||||||||||||||
94