Attached files
UNITED STATES
SECURITIES AND EXCHANGE COMMISSION
WASHINGTON, DC 20549
____________________________________________________
FORM 10-K
[X] Annual Report Pursuant to Section 13 or 15(d) of the Securities Exchange Act of 1934 for the fiscal year ended December 31, 2015.
or
[ ] Transition Report Pursuant to Section 13 or 15(d) of the Securities Exchange Act of 1934 for the transition period from _________ to _________ .
Commission file number 001-34874

(Exact name of registrant as specified in its charter)
Delaware | 27-2197395 | |
(State or other jurisdiction of incorporation or organization) | (IRS Employer Identification No.) | |
2500 Windy Ridge Parkway, Atlanta, Georgia 30339
(Address of principal executive offices, including zip code)
(678) 260-3000
(Registrant’s telephone number, including area code)
____________________________________________________
Securities registered pursuant to Section 12(b) of the Act:
Title of each class | Name of each exchange on which registered | |
Common Stock, par value $0.01 per share | New York Stock Exchange (NYSE), NYSE Euronext Paris | |
Securities registered pursuant to Section 12(g) of the Act: None
____________________________________________________
Indicate by check mark if the registrant is a well-known seasoned issuer, as defined in Rule 405 of the Securities Act. Yes [X] No [ ]
Indicate by check mark if the registrant is not required to file reports pursuant to Section 13 or Section 15(d) of the Act. Yes [ ] No [X]
Indicate by check mark whether the registrant (1) has filed all reports to be filed by Section 13 or 15(d) of the Securities Exchange Act of 1934 during the preceding 12 months (or for such shorter period that the registrant was required to file such reports), and (2) has been subject to such filing requirements for the past 90 days. Yes [X] No [ ]
Indicate by check mark whether the registrant has submitted electronically and posted on its corporate Website, if any, every Interactive Data File required to be submitted and posted pursuant to Rule 405 of Regulation S-T (§ 232.405 of this chapter) during the preceding 12 months (or for shorter period that the registrant was required to submit and post such files). Yes [X] No [ ]
Indicate by check mark if disclosure of delinquent filers pursuant to Item 405 of Regulation S-K (§ 229.405 of this chapter) is not contained herein, and will not be contained, to the best of registrant’s knowledge, in definitive proxy or information statements incorporated by reference in Part III of this Form 10-K or any amendment to this Form 10-K. [X]
Indicate by check mark whether the registrant is a large accelerated filer, an accelerated filer, a non-accelerated filer, or a smaller reporting company. See the definitions of “large accelerated filer,” “accelerated filer,” and “smaller reporting company” in Rule 12b-2 of the Exchange Act. (Check one)
Large accelerated filer [X] | Accelerated filer [ ] | |
Non-accelerated filer [ ] (Do not check if a smaller reporting company) | Smaller reporting company [ ] | |
Indicate by check mark whether the registrant is a shell company (as defined in Rule 12b-2 of the Act). Yes [ ] No [X]
The aggregate market value of the registrant's common stock held by non-affiliates of the registrant as of July 3, 2015 (assuming, for the sole purpose of this calculation, that all directors and executive officers of the registrant are "affiliates") was $9,798,932,717 (based on the closing sale price of the registrant's common stock as reported on the New York Stock Exchange).
The number of shares outstanding of the registrant’s common stock as of January 29, 2016 was 227,338,239.
DOCUMENTS INCORPORATED BY REFERENCE
Portions of the registrant’s Proxy Statement for the Annual Meeting of Shareowners to be held on April 26, 2016 are incorporated by reference in Part III.
1
TABLE OF CONTENTS | |||
Page | |||
2
PART I
ITEM 1. | BUSINESS |
References in this report to “CCE,” “we,” “our,” or “us” refer to Coca-Cola Enterprises, Inc. and its subsidiaries unless the context requires otherwise.
Forward-looking statements involve matters that are not historical facts. Because these statements involve anticipated events or conditions, forward-looking statements often include words such as “anticipate,” “believe,” “can,” “could,” “estimate,” “expect,” “intend,” “may,” “plan,” “project,” “should,” “target,” “will,” “would,” or similar expressions. These statements are based upon the current reasonable expectations and assessments of our management and are inherently subject to business, economic, and competitive uncertainties and contingencies, many of which are beyond our control. In addition, these forward-looking statements are subject to assumptions with respect to future business strategies and decisions that are subject to change.
Forward-looking statements include, but are not limited to:
• | Projections of revenues, income, basic and diluted earnings per share, capital expenditures, dividends, capital structure, or other financial and operating measures; |
• | Descriptions of anticipated plans, goals, or objectives of our management for operations, products, or services; |
• | Forecasts of performance; and |
• | Assumptions regarding any of the foregoing. |
For example, our forward-looking statements include our expectations regarding:
• | Net sales growth; |
• | Volume growth; |
• | Net price per case growth; |
• | Cost of sales per case growth; |
• | Operating income growth; and |
• | Diluted earnings per share. |
Additionally, we may also make forward-looking statements regarding:
• | Capital expenditures; |
• | Concentrate cost increases from The Coca-Cola Company (TCCC); |
• | Developments in accounting standards; |
• | Future repatriation of foreign earnings; |
• | Renewal of our product licensing agreements; |
• | Planned share repurchases; |
• | Restructuring charges and expected annual cost savings; and |
• | Return on invested capital (ROIC). |
Do not unduly rely on forward-looking statements. They represent our expectations about the future and are not guarantees. Forward-looking statements are only as of the date of the filing of this report, and, except as required by law, might not be updated to reflect changes as they occur after the forward-looking statements are made. We urge you to review our periodic filings with the Securities and Exchange Commission (SEC) for any updates to our forward-looking statements.
We undertake no obligation, other than as may be required under the federal securities laws, to publicly update or revise any forward-looking statements, whether as a result of new information, future events, or otherwise. We do not assume responsibility for the accuracy and completeness of forward-looking statements. Although we believe that the expectations reflected in these forward-looking statements are reasonable, any or all of the forward-looking statements contained in this report and in any other of our public statements may prove to be incorrect. This may occur as a result of inaccurate assumptions as a consequence of known or unknown risks and uncertainties. We caution that our list of risk factors may not be exhaustive (refer to Item 1A. Risk Factors in this report). We operate in a continually changing business environment, and new risk factors emerge from time to time. We cannot predict these new risk factors, nor can we assess the impact, if any, of the new risk factors on our business or the extent
3
to which any factor or combination of factors may cause actual results to differ materially from those expressed or implied by any forward-looking statement. In light of these risks, uncertainties, and assumptions, the events anticipated by our forward-looking statements discussed in this report might not occur.
Introduction
Coca-Cola Enterprises, Inc. at a Glance
• | Markets, produces, and distributes nonalcoholic beverages. |
• | Serves a market of approximately 170 million consumers throughout Belgium, continental France, Great Britain, Luxembourg, Monaco, the Netherlands, Norway, and Sweden. |
• | Employs approximately 11,500 people. |
• | Generated $7.0 billion in net sales and sold approximately 12 billion bottles and cans (or 600 million physical cases) during 2015. |
We were incorporated in Delaware in 2010 and are a publicly traded company listed on the New York Stock Exchange (NYSE) and NYSE Euronext Paris.
We are TCCC’s strategic bottling partner in Western Europe and one of the world's largest independent Coca-Cola bottlers. We have 10-year bottling agreements with TCCC for each of our territories which extend through October 2, 2020, with each containing the right for us to request a 10-year renewal. Products licensed to us through TCCC and its affiliates represent greater than 90 percent of our sales volume, with the remainder of our volume being attributable to sales of non-TCCC products.
We have bottling rights within our territories for various beverage brands, including products with the name “Coca-Cola.” For substantially all products, the bottling rights include stated expiration dates. For all bottling rights granted by TCCC with stated expiration dates, we believe our interdependent relationship with TCCC and the substantial cost and disruption to TCCC that would be caused by nonrenewals of these licenses ensure that they will continue to be renewed. For additional information about the terms of these licenses, refer to the section of this report titled “Product Licensing and Bottling Agreements.”
On August 6, 2015, we entered into agreements with TCCC, Coca-Cola Iberian Partners (CCIP), the privately-owned Coca-Cola bottler operating primarily in Spain and Portugal, and Coca-Cola Erfrischungsgetränke (CCEAG), the wholly-owned TCCC bottler operating in Germany, related to a pending transaction to form Coca-Cola European Partners (CCEP). The combination (the Merger) will be effected through the contribution of CCIP and CCEAG to a newly created entity, CCEP, and the merger of CCE with and into a newly formed indirect U.S. subsidiary of CCEP (MergeCo), with MergeCo continuing as the surviving entity. For further details, refer to Note 2 of the Notes to Consolidated Financial Statements within this report.
Relationship with TCCC
We conduct our business primarily under agreements with TCCC. These agreements generally give us the exclusive right to market, produce, and distribute beverage products of TCCC in authorized containers in specified territories. These agreements provide TCCC with the ability, at its sole discretion, to establish its sales prices, terms of payment, and other terms and conditions for our purchases of concentrates and syrups from TCCC. However, concentrate prices have been subject to the terms of an incidence-based concentrate pricing agreement between us and TCCC which extended through December 31, 2015. We and TCCC reached an understanding on a new incidence-based concentrate pricing model and funding program which was effective on January 1, 2016. The term of this new understanding is tied to the term of our bottling agreements, which expire on October 2, 2020. If our bottling agreements are terminated due to the closing of the proposed Merger, this understanding will continue until the commencement of a new incidence pricing agreement between TCCC and CCEP.
Other significant transactions and agreements with TCCC include arrangements for cooperative marketing; advertising expenditures; purchases of sweeteners, juices, mineral waters, and finished products; strategic marketing initiatives; cold-drink equipment placement; and, from time to time, acquisitions of bottling territories.
Territories
Our bottling territories consist of Belgium, continental France, Great Britain, Luxembourg, Monaco, the Netherlands, Norway and Sweden (our Bottlers). The aggregate population of these territories was approximately 170 million at December 31, 2015. We generated $7.0 billion in net sales and sold approximately 12 billion bottles and cans (or 600 million physical cases) during 2015.
4
Product Licensing and Bottling Agreements
As used throughout this report, the term “sparkling” beverage means nonalcoholic ready-to-drink beverages with carbonation, including energy drinks, waters, and flavored waters with carbonation. The term “still” beverage means nonalcoholic beverages without carbonation, including waters and flavored waters without carbonation, juice and juice drinks, teas, coffees, and sports drinks. The term “Coca-Cola trademark” refers to sparkling beverages bearing the trademark “Coca-Cola” or “Coke” brand name. The term “allied beverages” refers to sparkling beverages of TCCC or its subsidiaries other than Coca-Cola trademark beverages or energy drinks. The term “pre-mix” refers to ready-to-serve beverages which are sold in tanks or kegs, and the term “post-mix” refers to fountain syrup.
Product Licensing and Bottling Agreements with TCCC
Our Bottlers operate in their respective territories under licensing, bottling, and distribution agreements with TCCC and The Coca-Cola Export Corporation, a Delaware subsidiary of TCCC (the product licensing and bottling agreements). We believe that the structure of these product licensing and bottling agreements are substantially similar to agreements between TCCC and other European bottlers of Coca-Cola trademark beverages and allied beverages.
Exclusivity. Subject to the Supplemental Agreement (described below) and with certain minor exceptions, our Bottlers have the exclusive rights granted by TCCC in their territories to sell the beverages covered by their respective product licensing and bottling agreements in containers authorized for use by TCCC (including pre- and post-mix containers). The covered beverages include Coca-Cola trademark beverages, allied beverages, still beverages, and certain other beverages specific to the European market. TCCC has retained the right, under certain limited circumstances, to produce and sell, or authorize third parties to produce and sell, the beverages in any manner or form within our territories.
Our Bottlers are prohibited from selling covered beverages outside their territories, or to anyone intending to resell the beverages outside their territories, without the consent of TCCC, except for sales arising out of an unsolicited order from a customer in another member state of the European Economic Area (EEA) or for export to another such member state. The product licensing and bottling agreements also contemplate that there may be instances in which large or special buyers have operations transcending the boundaries of our territories, and, in such instances, our Bottlers agree to collaborate with TCCC to provide sales and distribution to such customers.
Pricing. The product licensing and bottling agreements provide that sales by TCCC of concentrate, syrups, juices, mineral waters, finished goods, and other goods to our Bottlers are at prices that are set from time to time by TCCC at its sole discretion. We and TCCC have operated under an incidence-based concentrate pricing agreement through December 31, 2015, under which concentrate prices increase in a manner that generally tracks our annual net sales per case growth.
We and TCCC reached an understanding on a new incidence-based concentrate pricing model and funding program which was effective on January 1, 2016. The term of this new understanding is tied to the term of our bottling agreements, which expire on October 2, 2020. If our bottling agreements are terminated due to the closing of the proposed Merger, this understanding will continue until the commencement of a new incidence pricing agreement between TCCC and CCEP. The new pricing model and funding program will result in simplified administration without value transfer between the parties when compared to the previous model. We and TCCC believe that this new understanding should be a key factor for better alignment between the parties and position both parties to win in the marketplace and create value.
Term and Termination. The product licensing and bottling agreements have 10-year terms, extending through October 2, 2020, with each containing the right for us to request a 10-year renewal. While the agreements contain no automatic right of renewal beyond October 2, 2020, we believe that our interdependent relationship with TCCC and the substantial cost and disruption to TCCC that would be caused by nonrenewals ensure that these agreements will continue to be renewed. Neither CCE nor its predecessor entity have ever had a franchise license agreement with TCCC terminated due to nonperformance of the agreement terms or due to a decision by TCCC to not renew an agreement at the expiration of a term.
TCCC has the right to terminate the product licensing and bottling agreements before the expiration of the stated term upon the insolvency, bankruptcy, nationalization, or similar condition of our Bottlers. The product licensing and bottling agreements may be terminated by either party upon the occurrence of a default that is not remedied within 60 days of the receipt of a written notice of default, or in the event that U.S. currency exchange is unavailable or local laws prevent performance. They also terminate automatically, after a certain lapse of time, if any of our Bottlers refuse to pay a concentrate base price increase.
Supplemental Agreement with TCCC
In addition to the product licensing and bottling agreements with TCCC, our Bottlers (excluding the Luxembourg distributor), TCCC, and The Coca-Cola Export Corporation are parties to a supplemental agreement (the Supplemental Agreement) with regard
5
to our Bottlers’ rights. The Supplemental Agreement permits our Bottlers to prepare, package, distribute, and sell the beverages covered by any of our Bottlers’ product licensing and bottling agreements in any other territory of our Bottlers, provided that we and TCCC have reached agreement on a business plan for such beverages. The Supplemental Agreement may be terminated, either in whole or in part by territory, by TCCC at any time with 90 days' prior written notice.
Product Licensing and Bottling Agreements with Other Licensors
The product licensing and bottling agreements between us and other licensors of beverage products and syrups generally give those licensors the unilateral right to change the prices for their products and syrups at any time at their sole discretion. Some of these agreements have limited terms of appointment and some prohibit us from selling competing products with similar flavors. These agreements contain restrictions that are generally similar in effect to those in the product licensing and bottling agreements with TCCC as to the use of trademarks and trade names; approved bottles, cans, and labels; planning; and causes for termination.
Schweppes. In Great Britain, we distribute Schweppes, Dr Pepper, Oasis, and Schweppes Abbey Well (collectively the Schweppes Products) pursuant to agreements with an affiliate of TCCC (the Schweppes Agreements). These agreements cover the marketing, sale, and distribution of Schweppes Products in Great Britain. The Schweppes Agreements run through December 31, 2020, and will be automatically renewed for one 10-year term unless terminated by either party.
In November 2008, the Abbey Well water brand was acquired by an affiliate of TCCC. Our use of the Schweppes name with the brand is pursuant to, and under the terms of, the Schweppes Agreements. Abbey Well is a registered trademark of Waters & Robson Ltd., and we have been granted the right to use the Abbey Well name until February 10, 2022, but only in connection with the sale of Schweppes Abbey Well products.
We commenced distribution of Schweppes and Dr Pepper products in the Netherlands in early 2010, pursuant to agreements with Schweppes International Limited. The agreements to distribute products such as Schweppes and Dr Pepper were renegotiated and effective January 1, 2014 for five-year periods each, replacing the previous agreements. The terms of these agreements include certain annual volume targets for Schweppes and Dr Pepper in the Netherlands, but do not include any monetary remedies if these targets are not met.
WILD. We distribute Capri-Sun beverages in France, Belgium, the Netherlands, and Luxembourg through a distribution agreement with a related entity of WILD GmbH & Co. KG (WILD). We also produce and distribute Capri-Sun beverages in Great Britain through a manufacturing and license agreement. As the initial duration of some of our prior agreements expired on December 31, 2013, we signed a new pan-European distribution agreement for France, Belgium, the Netherlands, and Luxembourg and a new license and manufacturing agreement in Great Britain, effective January 1, 2014. The new terms extended the agreements for an initial period of five years expiring on December 31, 2018, and will be renewable for an additional five-year period, subject to achieving certain performance criteria. Although these contracts do not impose monetary penalties in the event that the defined volume targets are not met, meeting the volume targets is part of the performance criteria evaluated in determining whether we would be able to renew these agreements for the additional five-year period.
We also reached agreement with a related entity of WILD to extend the pan-European master distribution agreement to Sweden and distribution of Capri-Sun beverages commenced in Sweden effective June 1, 2015, for an initial period of three years. The agreement in Sweden will be renewable for an additional five-year period, subject to performance criteria and conditions similar to those in our other European territories.
Monster. We distribute Monster-branded beverages in all of our territories (including Norway as of June 2015) under distribution agreements between us and Monster Beverage Corporation. These agreements, for all territories except for Belgium, have 20-year terms from November 2008, comprised of four five-year terms, and can be terminated by either party under certain circumstances, subject to a termination penalty in some cases. In Belgium, the agreement has a 10-year term, comprised of two five-year terms, and can be terminated by either party under certain circumstances, subject to a termination penalty in some cases. In Great Britain, we also produce selected Monster-branded beverages through a manufacturing agreement with Monster Energy Limited. We renewed this agreement for a new term that will expire on October 2, 2018, with the possibility of renewal for two successive periods of five years each.
As of June 13, 2015, as a part of a global transaction between TCCC and Monster Energy Company, Monster acquired full ownership from TCCC of the following energy brands: Relentless, Nalu, and Burn. CCE shall continue to have the exclusive right to prepare, package, distribute, and sell these energy brands within its territories under bottling agreements currently being finalized (with the exception of Norway and Luxembourg which are limited to distribution only). These bottling/distribution agreements between Monster Energy Company and each of our Bottlers are substantially similar to our product licensing and bottling agreements with TCCC, including the same term and termination provisions.
6
Other Agreements. We currently distribute Ocean Spray products in France, subject to a new agreement with Ocean Spray International, Inc. The new agreement with Ocean Spray International commenced on February 1, 2016 and will continue until May 31, 2019. This agreement may be extended by mutual agreement of the parties.
In April 2011, we entered into an agreement with SAB Miller International BV to manufacture, distribute, market, and sell Appletiser products in Great Britain. This agreement has an initial term of 10 years and will continue thereafter until either party terminates the agreement upon providing a 12-month notice. In October 2015, we entered into an ancillary agreement with SAB Miller International Brands Limited to extend our manufacturing, distribution, marketing, and sales of Appletiser products into Belgium and Luxembourg, that commenced on February 1, 2016 for an initial 10-year term.
We manufacture, distribute, and market Fernandes products in the Netherlands. On January 1, 2006, we entered into a 10-year distribution agreement with the Fernandes family and its Netherlands representative, Holfer BV. Although distribution of Fernandes products is currently limited to the Netherlands, we have the right to distribute Fernandes products in the remainder of Europe and Africa. Although the current bottling agreement ended as of December 31, 2015, we and the Fernandes family are negotiating a new bottling agreement. The current agreement has been extended until a new agreement can be reached.
Products, Packaging, and Distribution
We derive our net sales from marketing, producing, and distributing nonalcoholic beverages. Our beverage portfolio consists of some of the most recognized brands in the world, including one of the world’s most valuable beverage brands, Coca-Cola. We manufacture approximately 92 percent of the finished product we sell from concentrates and syrups that we buy. The remainder of the products we sell are purchased in finished form. Although in some of our territories we deliver our product directly to retailers, our product is principally distributed to our customers’ central warehouses and through wholesalers who deliver to retailers.
Our top five brands by volume are:
• | Coca-Cola |
• | Diet Coke/Coca-Cola light |
• | Coca-Cola Zero |
• | Fanta |
• | Capri-Sun |
During 2015, 2014, and 2013, sales of certain major brand categories represented more than 10 percent of our total net sales. The following table summarizes the percentage of total net sales contributed by these major brand categories for the periods presented (rounded to the nearest 0.5 percent):
2015 | 2014 | 2013 | ||||||
Coca-Cola trademark | 64.0 | % | 64.0 | % | 64.0 | % | ||
Sparkling flavors and energy | 17.0 | 17.0 | 17.0 | |||||
Our products are available in a variety of different package types and sizes, including, but not limited to, aluminum and steel cans, glass, polyethylene terephthalate (PET) and aluminum bottles, pouches, and bag-in-box for fountain use.
For additional information about our various products and packages, refer to Management’s Discussion and Analysis of Financial Condition and Results of Operations in this report.
Seasonality
Sales of our products are seasonal, with the second and third calendar quarters accounting for higher unit sales of products than the first and fourth quarters. In a typical year, we earn more than 60 percent of our annual operating income during the second and third quarters of the year. The seasonality of our sales volume, combined with the accounting for fixed costs, such as depreciation, amortization, rent, and interest expense, impacts our results on a quarterly basis. Additionally, year-over-year shifts in holidays, selling days, and weather patterns, particularly cold or wet weather during the summer months, can impact our results on an annual or quarterly basis.
7
Large Customers
No single customer accounted for 10 percent or more of our total net sales in 2015, 2014, or 2013.
Advertising and Marketing
We rely extensively on advertising and sales promotions in marketing our products. TCCC and other licensors that supply concentrates, syrups, and finished products to us advertise in all major media to promote sales in the local areas we serve. We also benefit from regional, local, and global advertising programs conducted by TCCC and other licensors. Certain of the advertising expenditures by TCCC and other licensors are made pursuant to annual arrangements.
We and TCCC engage in a variety of marketing programs to promote the sale of products of TCCC in territories in which we operate. The amounts to be paid to us by TCCC under the programs are determined annually and are periodically reassessed as the programs progress. Marketing support funding programs entered into with TCCC provide financial support, principally based on our product sales or upon the completion of stated requirements, to offset a portion of our costs of the joint marketing programs. Except in certain limited circumstances, TCCC has no specified contractual obligation to participate in expenditures for advertising, marketing, and other support in our territories. The terms of similar programs TCCC may have with other licensees and the amounts paid by TCCC pursuant thereto could differ from our arrangements.
Global Marketing Fund
We and TCCC have utilized a Global Marketing Fund (GMF) under which TCCC paid us $45 million annually through December 31, 2015. During each of the years 2015, 2014, and 2013, we received $45 million under the GMF.
We and TCCC reached an understanding on a new incidence-based concentrate pricing model and funding program effective on January 1, 2016. The term of this new understanding is tied to the term of our bottling agreements, which expire on October 2, 2020. Under the new funding program, the $45 million GMF, which terminated December 31, 2015, has been replaced by the integration of $20 million into the incidence rate and annual payments of $25 million from TCCC to us to support the execution of commercial strategies focused on capturing growth opportunities. This $25 million funding will be paid in two equal installments each year.
Competition
The market for nonalcoholic beverages is highly competitive. We face competitors that differ within individual categories in our territories. Moreover, competition exists not only within the nonalcoholic beverage market, but also between the nonalcoholic and alcoholic markets.
The most significant competitive factors impacting our business include advertising and marketing, brand image, product offerings that meet consumer preferences and trends, new product and package innovations, pricing, and cost inputs. Other competitive factors include supply chain (procurement, manufacturing, and distribution) and sales methods, merchandising productivity, customer service, trade and community relationships, and the management of sales and promotional activities. Management of cold-drink equipment, including coolers and vending machines, is also a competitive factor. We believe our most favorable competitive factor is the consumer and customer goodwill associated with our brand portfolio.
We face strong competition from companies that produce and sell competing products to a retail sector that is consolidating and in which buyers are able to choose freely between our products and those of our competitors. Our competitors include the local bottlers and distributors of competing products and manufacturers of private-label products. For example, we compete with bottlers and distributors of products of PepsiCo, Inc., Nestlé S.A., Groupe Danone S.A., and other private-label products, including those of certain of our customers. In certain of our territories, we sell products against which we compete in other territories. However, in all of our territories, our primary business is marketing, producing, and distributing products of TCCC.
Raw Materials and Other Supplies
We purchase concentrates and syrups from TCCC and other licensors to manufacture products. In addition, we purchase sweeteners, juices, mineral waters, finished product, carbon dioxide, fuel, PET (plastic) preforms, glass, aluminum and plastic bottles, aluminum and steel cans, pouches, closures, post-mix, and packaging materials. We generally purchase our raw materials, other than concentrates, syrups, and mineral waters, from multiple suppliers. The product licensing and bottling agreements with TCCC and agreements with some of our other licensors provide that all authorized containers, closures, cases, cartons and other packages, and labels for their products must be purchased from manufacturers approved by the respective licensor.
8
The principal sweetener we use is sugar derived from sugar beets. Our sugar purchases are made from multiple suppliers. We do not separately purchase low-calorie sweeteners because sweeteners for low-calorie beverage products are contained in the concentrates or syrups we purchase.
We produce most of our plastic bottle requirements within our production facilities using preforms purchased from multiple suppliers. We believe the self-manufacture of certain packages serves to ensure supply and to reduce or manage our costs.
We do not use any materials or supplies that are currently in short supply, although the supply and price of specific materials or supplies are, at times, adversely affected by strikes, weather conditions, speculation, abnormally high demand, governmental controls, new taxes, national emergencies, natural disasters, price or supply fluctuations of their raw material components, and currency fluctuations.
Governmental Regulation
The production, distribution, and sale of many of our products is subject to various laws and regulations of the countries in which we operate that regulate the production, packaging, sale, safety, advertising, labeling, and ingredients of our products.
Packaging
The European Commission has a packaging and packing waste directive that has been incorporated into the national legislation of the European Union (EU) member states in which we do business. The weight of packages collected and sent for recycling (inside or outside the EU) in the countries in which we operate must meet certain minimum targets, depending on the type of packaging. The legislation sets targets for the recovery and recycling of household, commercial, and industrial packaging waste and imposes substantial responsibilities on bottlers and retailers for implementation.
In the Netherlands, we include approximately 25 percent recycled content in our recyclable plastic bottles, in accordance with an agreement we have with the government. In compliance with national regulation within the sparkling beverage industry, we charge our customers in the Netherlands a deposit on all containers greater than a 1/2 liter, which is refunded to them if and when the containers are returned. Container deposit schemes also exist in Norway (which is part of the EEA but is not an EU member state) and Sweden, under which a deposit fee is included in the consumer price, which is refunded to them if and when the container is returned. The Norwegian government further imposes two types of packaging taxes: (1) a base tax and (2) an environmental tax calculated against the amount returned. The Norwegian base tax applies only to one-way packages such as cans and nonreturnable PET (plastic) that may not be used again in their original form.
We have taken actions to mitigate the adverse financial effects resulting from legislation concerning deposits and restrictive packaging, which impose additional costs on us. We are unable to quantify the impact on current and future operations that may result from additional legislation, if enacted or enforced in the future, but the impact of any such legislation could be significant.
Excise and Other Taxes
There are specific taxes on certain beverage products in certain territories in which we do business. Excise taxes on the sale of sparkling and still beverages are in place in Belgium, France, the Netherlands, and Norway.
Proposals could be adopted to increase existing excise tax rates, or to impose new special taxes, on certain beverages that we sell. We are unable to forecast whether such new legislation will be adopted and, if enacted, what the impact would be on our financial results.
Beverages in Schools
Throughout our territories, different policies exist related to the presence of our products in schools, from a total ban of vending machines in schools in France, to a limited choice in Great Britain, and self-regulation guidelines in our other territories, including our commitment to selling primarily low-calorie options in this channel. Despite our established internal guidelines, we continue to face pressure from regulatory intervention to further restrict the availability of sugared and sweetened beverages in schools. During 2015, sales in schools represented less than 1.0 percent of our total sales volume.
Environmental Regulations
Substantially all of our facilities are subject to laws and regulations dealing with above-ground and underground fuel storage tanks and the discharge of materials into the environment.
9
Our beverage manufacturing operations do not use or generate a significant amount of toxic or hazardous substances. We believe our current practices and procedures for the control and disposition of such wastes comply with applicable laws in each of our territories.
We are subject to, and operate in accordance with, the provisions of the EU Directive on Waste Electrical and Electronic Equipment (WEEE). Under the WEEE Directive, companies that put electrical and electronic equipment (such as our cold-drink equipment) on the EU market are responsible for the costs of collection, treatment, recovery, and disposal of their own products.
Trade Regulation
As the exclusive manufacturer and distributor of bottled and canned beverage products of TCCC and other manufacturers within specified geographic territories, we are subject to antitrust laws of general applicability.
EU rules adopted by the European countries in which we do business preclude restriction of the free movement of goods among the member states. As a result, the product licensing and bottling agreements grant us exclusive bottling territories, subject to the exception that other EEA bottlers of Coca-Cola trademark beverages and allied beverages can, in response to unsolicited orders, sell such products in our European territories (as we can in their territories). For additional information about our bottling agreements, refer to the section of this report titled “Product Licensing and Bottling Agreements.”
Employees
At December 31, 2015, we had approximately 11,500 employees, of which approximately 150 were located in the U.S.
A majority of our employees in Europe are covered by collectively bargained labor agreements, most of which do not expire. However, wage rates must be renegotiated at various dates through 2017. We believe we will be able to renegotiate these wage rates with satisfactory terms.
Financial Information on Industry Segments and Geographic Areas
For financial information about our industry segment and operations in geographic areas, refer to Note 14 of the Notes to Consolidated Financial Statements in this report.
For More Information About Us
As a public company, we regularly file reports and proxy statements with the SEC. These reports are required by the U.S. Securities Exchange Act of 1934 and include:
• | Annual reports on Form 10-K (such as this report); |
• | Quarterly reports on Form 10-Q; |
• | Current reports on Form 8-K; and |
• | Proxy statements on Schedule 14A. |
Anyone may read and copy any of the materials we file with the SEC at the SEC’s Public Reference Room at 100 F Street, NE, Washington, D.C. 20549; information on the operation of the Public Reference Room may be obtained by calling the SEC at 1-800-SEC-0330. The SEC maintains an internet site that contains our reports, proxy and information statements, and our other SEC filings; the address of that site is http://www.sec.gov.
We make our SEC filings (including any amendments) available on our own internet site as soon as reasonably practicable after we file them with or furnish them to the SEC. Our internet address is http://www.cokecce.com. All of these filings are available on our website free of charge.
The information on our website is not incorporated by reference into this annual report on Form 10-K unless specifically so incorporated by reference herein.
Our website contains, under “Corporate Governance” in the “About Us” section, information about our policies, such as:
• | Code of Business Conduct; |
• | Board of Directors Guidelines on Significant Corporate Governance Issues; |
• | Board Committee Charters; |
• | Certificate of Incorporation; and |
10
• | Bylaws. |
Any of these items are available in print to any shareowner who requests them. Requests should be sent to the corporate secretary at Coca-Cola Enterprises, Inc., 2500 Windy Ridge Parkway, Atlanta, Georgia 30339.
11
ITEM 1A. | RISK FACTORS |
Risks and Uncertainties
Set forth below are some of the risks and uncertainties that, if they were to occur, could materially and adversely affect our business or could cause our actual results to differ materially from the results contemplated by the forward-looking statements contained in this report and the other public statements we make.
Our business success, including financial results, depends upon our relationship with TCCC.
Under the terms of our product licensing agreements with TCCC:
• | We purchase our entire requirement of concentrates and syrups for Coca-Cola trademark beverages and allied beverages from TCCC at prices, terms of payment, and other terms and conditions determined from time to time by TCCC at its sole discretion. The terms of our contracts with TCCC contain no express limits on the prices TCCC may charge us for concentrate; however, we operated under an incidence-based concentrate pricing agreement with TCCC through December 31, 2015, pursuant to which concentrate prices increased in a manner that generally tracked our annual net sales per case growth. We and TCCC reached an understanding on a new incidence-based concentrate pricing model and funding program effective on January 1, 2016. The term of this new understanding is tied to the term of our bottling agreements, which expire on October 2, 2020. If our bottling agreements are terminated due to the closing of the proposed Merger, this understanding will continue until the commencement of a new incidence pricing agreement between TCCC and CCEP. The new pricing model and funding program will result in simplified administration without value transfer between the parties when compared to the previous model. |
• | Our product licensing and bottling agreements with TCCC state they are for fixed terms, and most of them are renewable only at the discretion of TCCC at the conclusion of their current terms. A decision by TCCC not to renew a current fixed-term product licensing and bottling agreement at the end of its term could substantially and adversely affect our financial results. |
• | We receive from TCCC, at its discretion, much of our marketing and promotional support. Programs currently in effect or under discussion contain requirements or are subject to conditions established by TCCC, which we may not satisfy. The terms of most of the marketing programs contain no express obligation for TCCC to participate in future programs or continue past levels of payments into the future. |
• | We are obligated to maintain sound financial capacity to perform our duties as is required and determined by TCCC at its sole discretion. These duties include, but are not limited to, making certain investments in marketing activities to stimulate the demand for products in our territories and making infrastructure improvements to ensure our facilities and distribution network are capable of handling the demand for these beverages. |
• | We must obtain approval from TCCC to acquire any bottler of Coca-Cola or to dispose of one or more of our Coca-Cola bottling territories. |
Products licensed to us through TCCC and its affiliates represent greater than 90 percent of our sales volume, and disagreements with TCCC concerning other business issues may lead TCCC to act adversely to our interests with respect to the relationships described above which could negatively affect our financial results.
Our pending Merger transaction with CCIP and CCEAG may cause disruption in our business and, if the pending transaction does not occur, we will have incurred significant expenses, may need to pay a termination fee to CCEP, and our share price will likely decline significantly.
On August 6, 2015, we entered into agreements with TCCC, CCIP, and CCEAG related to a pending Merger to form CCEP (refer to Note 2 of the Notes to Consolidated Financial Statements in this report). The announcement of the Merger may result in a loss of key personnel and may disrupt our sales and operations, which could have a negative impact on our financial performance. The agreements generally require us to operate our business in the ordinary course pending consummation of the Merger, but include certain contractual restrictions on the conduct of our business that may affect our ability to execute our 2016 business plans. Additionally, the announcement of the Merger, whether or not it is consummated, may impact our relationships with third parties.
The consummation of the Merger is subject to various conditions including, among others, obtaining the approval of at least a majority of CCE’s shareholders, the availability of cash in an amount sufficient to pay the cash payment for the Merger, the New York Stock Exchange approving the listing of shares of CCEP, the shares of CCEP being admitted to listing and trading on the Euronext Amsterdam Stock Exchange, the approval by the UK Financial Conduct Authority of CCEP’s prospectus complying with the European prospectus directive, the filing and effectiveness of CCEP’s registration statement on Form F-4, the receipt by CCE, TCCC and CCIP of certain tax opinions, the absence of legal prohibitions and the receipt of requisite regulatory approvals,
12
the absence of pending actions by any governmental entity that would prevent the consummation of the Merger, and TCCC having executed new bottling agreements for CCEP having an initial 10-year term with a 10-year renewal term and, except as otherwise agreed, containing other terms materially similar to those currently in effect at CCE, CCIP, and CCEAG. Each party's obligation to close is further subject to there being no material adverse breach by the other parties. The obligations of the parties to close is further conditioned on the completion of a capital restructuring of CCIP and obtaining the approval of 80 percent of shareholders of CCIP in favor of the Merger. The CCIP capital restructuring and shareholder approval were fulfilled on November 11, 2015. Each of the parties has generally agreed to use all reasonable endeavors to take such steps to satisfy the remaining conditions. If the conditions to the completion are not satisfied by August 6, 2016, any conditions become impossible to be satisfied by such date, or any breach of other covenants or warranties occurs that would result in a material adverse effect in respect of the breaching party and such breach cannot be cured before August 6, 2016, or, if curable, is not cured within 30 days following the delivery of a written notice, then the Merger may be terminated.
The agreements set out certain covenants the parties must comply with prior to completion, including carrying out the agreed transaction steps, the consummation of the CCIP capital restructuring, and the removal of certain assets and liabilities from CCIP that are not being transferred to CCEP. The parties have agreed to cooperate in making employee notifications, competition approvals, securities laws filings and listing applications, and obtaining financing. The parties have agreed to use their reasonable endeavors to negotiate and agree on CCEP’s new bottling agreements, an initial business plan, and a long-range business plan.
The parties have also agreed to cause CCIP and CCEP and its subsidiaries to enter into a share purchase agreement substantially simultaneously with, but prior to, the Merger, on terms satisfactory to the parties, with Cobega S.A. and Solinbar, S.L.U. in respect of the sale of Vifilfell hf. (the entity that owns the Coca-Cola bottling business in Iceland) for aggregate consideration of no more than €35 million.
The agreements contain customary warranties of the parties regarding their respective businesses. The warranties of CCE, CCIP, CCEAG, and an entity to be established for the purposes of holding CCIP will survive for three months after the date that CCEP files its December 31, 2016 Form 20-F with the SEC. In the event of a breach of one or more warranties that results in an indemnification claim amount against a particular company for more than $400 million, the relative equity ownership percentages of CCEP (expected to be 48 percent CCE shareholders, 34 percent CCIP, and 18 percent TCCC) will be adjusted by issuing additional shares to increase the ownership of the non-breaching parties to reflect the indemnification claim amount, not to exceed $450 million.
The agreements contain specified termination rights. The agreements can be terminated if the parties fail to perform their representations, warranties, covenants or agreements, if any court of competent jurisdiction or any governmental authority issues an order, decree or ruling or takes any other action permanently enjoining, restraining or otherwise prohibiting the consummation of the transactions, or if the CCE Board of Directors withdraws, modifies, or qualifies its recommendation to shareholders regarding the adoption of the merger agreements. Upon termination under specified circumstances, including upon a termination resulting from a change in the CCE Board of Directors recommendation to shareholders, CCE would be required to pay CCEP a termination fee of $450 million.
We have been named in three lawsuits related to the Merger. For additional information about these lawsuits, refer to Item 3. Legal Proceedings in this report.
We cannot predict whether the closing conditions for the pending Merger set forth in the agreements will be satisfied. As a result, there is a risk that the pending transaction will not be completed in a timely manner or at all. If the closing conditions for the Merger set forth in the agreements are not satisfied, or if the transaction is not completed for any other reason, including regulatory challenges, our share price may be negatively impacted. In addition, if the pending transaction does not occur, we will remain liable for the expenses that we have incurred related to the Merger, and, under specific circumstances, the payment of a $450 million termination fee.
If the pending Merger is not completed for any reason, the ongoing business of CCE may be adversely affected and, without realizing any of the benefits of having completed the Merger, CCE would be subject to a number of other risks, including:
• | CCE may experience negative reactions from the financial markets, including negative impacts on CCE’s stock price; |
• | CCE may experience negative reactions from its customers, regulators, and employees; |
• | CCE management may commit substantial time and resources relating to the Merger and the combination of CCE, CCIP, and CCEAG (through integration planning), that would otherwise have been devoted to day-to-day operations and other opportunities that may have been beneficial to CCE as an independent company; and |
• | CCE being subject to litigation related to any failure to complete the Merger or related to any enforcement proceeding commenced against CCE to perform its obligations under the Merger agreements. |
13
If the Merger is not completed, these risks may materialize and may adversely affect CCE’s business, financial condition, financial results and stock price.
Legislative or regulatory changes that affect our products, distribution, or packaging, including changes in tax laws, could reduce demand for our products or increase our costs.
Our business model depends on the availability of our various products and packages in multiple channels and locations to satisfy the preferences of our customers and consumers. Laws that restrict our ability to distribute products in certain channels and locations, as well as laws that require deposits for certain types of packages or those that limit our ability to design new packages or market certain packages, could negatively impact our financial results. In addition, taxes or other charges imposed on the sale of certain of our products could increase costs or cause consumers to purchase fewer of our products. Many countries in Europe, including territories in which we operate, are evaluating the implementation of, or increase in, such taxes. For example, Belgium and the Netherlands have announced increases in the excise tax on certain of our products effective January 1, 2016.
Concerns about health and wellness, including obesity, could further reduce the demand for some of our products.
Consumers and public health and government officials are highly concerned about the public health consequences of obesity, particularly among young people. In addition, some researchers, health advocates, and dietary guidelines are suggesting that consumption of sugar-sweetened beverages is a primary cause of increased obesity rates and are encouraging consumers to reduce or eliminate consumption of such products. Increasing public concern about obesity and additional governmental regulations concerning the marketing, labeling, packaging, or sale of sugar-sweetened beverages may reduce demand for or increase the cost of our sugar-sweetened beverages.
Health and wellness trends have also resulted in an increased demand for more low-calorie or no-calorie sparkling beverages, water, enhanced water, isotonics, energy drinks, teas, and beverages with natural sweeteners. Limitations on our ability to provide any of these types of products or otherwise satisfy changing consumer preferences relating to nonalcoholic beverages could adversely affect our financial results.
If we, TCCC, or other licensors and bottlers of products we distribute are unable to maintain positive brand or corporate images, or are subject to product liability claims or product recalls, our financial results and brand image may be negatively affected.
Our success depends on our products having a positive brand image with customers and consumers. Product quality issues (real or perceived) or allegations of product contamination (even if false or unfounded) could tarnish the image of the affected brands and cause customers and consumers to choose other products. We could be required to recall products if they become or are perceived to have become contaminated or are damaged or mislabeled, and also may be liable if the consumption of our products causes injury or illness. A significant product liability or other product-related legal judgment against us or a widespread recall of our products could negatively impact our brand image and financial results.
Additionally, adverse publicity surrounding health and well-being concerns, water usage, customer disputes, labor relations, product ingredients, and the like could negatively affect our overall reputation and our products’ acceptance by our customers and consumers, even when the publicity results from actions occurring outside our territory or control. Similarly, if product quality-related issues arise from products not manufactured by us but imported into our territories, our reputation and consumer goodwill could be damaged.
Furthermore, through the increased use of social media, individuals and non-governmental organizations (NGOs) have the ability to disseminate their opinions regarding the safety or healthiness of our products or our financial or tax position to an increasingly wider audience at a faster pace. Our failure to effectively respond to any negative opinions in a timely manner could harm the perception of our brands and damage our reputation, regardless of the validity of the statements.
Changes in currency exchange rates could significantly impact our financial results and ultimately hinder our competitiveness in the marketplace.
We are exposed to significant currency exchange rate risk, including uncertainties related to the monetary policies of the European Central Bank, since all of our revenues and substantially all of our expenses are derived from operations conducted outside the U.S. in the local currency of the countries in which we do business. For purposes of financial reporting, the local currency results are translated into U.S. dollars based on currency exchange rates prevailing during the reporting period. During times of a strengthening U.S. dollar, our reported net sales and operating income is reduced because the local currency will translate into fewer U.S. dollars. During periods of local economic crises or general economic softness, foreign currencies may weaken significantly against the U.S. dollar, thereby reducing our margins as reported in U.S. dollars. Actions to recover margins may result in lower volume and a weaker competitive position.
14
Additionally, there are concerns regarding the short- and long-term stability of the euro and its ability to serve as a single currency for a number of individual countries. These concerns could lead individual countries to revert, or threaten to revert, to their former local currencies, which could lead to the full or partial dissolution of the euro. Should this occur, the assets we hold in a country that reintroduces its local currency could be significantly devalued. Furthermore, the full or partial dissolution of the euro could cause significant volatility and disruption to the global economy, which could impact our financial results, including our ability to access capital at acceptable financing costs, if at all; the availability of supplies and materials; and the demand for our products.
Also, the United Kingdom is discussing a referendum to discontinue its membership in the EU. If such an action was passed, it could lead to volatility in the currency markets and impact our business.
Finally, if it were necessary for us to conduct our business in additional currencies, we would be subjected to additional earnings volatility as amounts in these currencies are translated into U.S. dollars.
Our sales can be adversely impacted by the instability of the general economy.
Unfavorable changes in general economic conditions, such as a recession or prolonged economic slowdown in the territories in which we do business, may reduce the demand for certain products and otherwise adversely affect our sales. For example, economic forces may cause consumers to purchase more private-label brands, which are generally sold at prices lower than our products, or to defer or forgo purchases of beverages altogether. Additionally, consumers who do purchase our products may choose to shift away from purchasing higher-margin products and packages. Adverse economic conditions could also increase the likelihood of customer delinquencies and bankruptcies, which would increase the risk of uncollectability of certain accounts. Each of these factors could adversely affect our revenue, price realization, gross margins, and/or our overall financial condition and operating results. Further, sovereign debt concerns, whether real or perceived, could result in a limitation on the availability of capital in impacted territories, which would restrict our liquidity and negatively impact our financial results.
Changes in the marketplace, including changes in our relationships with large customers, may adversely impact our financial results.
We operate in the highly competitive nonalcoholic beverage industry and face strong competition from other general and specialty beverage companies. Our ability to grow or maintain our market share or gross margins may be limited by the actions of our competitors, who may have lower costs and, thus, advantages in setting their prices. Further, a significant amount of our volume is sold through large retail chains, including supermarkets and wholesalers. These chains are becoming more consolidated and, at times, may seek to use their purchasing power to improve their profitability through lower prices, increased emphasis on generic and other private-label brands, and increased promotional programs. Our response to continued competitor and customer consolidations, customer buying alliances, and marketplace competition may result in lower than expected net pricing of our products. Additionally, hard-discount retailers and online retailers continue to challenge traditional retail outlets, which can increase the pressure on our customer relationships and our supply terms. These factors, as well as others, could have a negative impact on the availability of our products, as well as our profitability.
In addition, at times, a customer may choose to temporarily stop selling certain of our products as a result of a dispute we may be having with that customer. A dispute with a large customer that chooses not to sell certain of our products for a prolonged period of time may adversely affect our sales volume and/or financial results.
Increases in costs, a limitation, or lower than expected quality, of our supplies of raw materials could hurt our financial results.
If there are increases in the costs of raw materials, ingredients, or packaging materials, such as aluminum, steel, sugar, PET (plastic), fuel, or other items, and we are unable to pass the increased costs on to our customers in the form of higher prices, our financial results could be adversely affected. Additionally, we use supplier-pricing agreements and, at times, derivative financial instruments to manage the volatility and market risk with respect to certain commodities. Generally, these hedging instruments establish the purchase price for these commodities in advance of the time of delivery. As such, it is possible that these hedging instruments may lock us into prices that are ultimately greater than the actual market price at the time of delivery.
Certain of our suppliers could restrict our ability to hedge prices through supplier agreements. As a result, we could enter into non-designated commodity hedges, which could expose us to additional earnings volatility with respect to the purchase of these commodities.
If suppliers of raw materials, ingredients, packaging materials, or other cost items are affected by strikes, weather conditions, speculation, abnormally high demand, governmental controls, new taxes, national emergencies, natural disasters, insolvency, or other events, and we are unable to obtain the materials from an alternate source, our cost of sales, net sales, and ability to manufacture and distribute product could be adversely affected.
15
Additionally, lower than expected quality of delivered raw materials, ingredients, packaging materials, or finished goods could lead to a disruption in our operations as we seek to substitute these items for ones that conform to our established standards or if we are required to replace under-performing suppliers.
Adverse weather conditions could limit the demand for our products.
Our sales are significantly influenced by weather conditions in the markets in which we operate. In particular, due to the seasonality of our business, cold or wet weather during the summer months may have a negative impact on the demand for our products and contribute to lower sales, which could have an adverse effect on our financial results.
Additional taxes levied on us could harm our financial results.
Our tax filings for various periods in the jurisdictions in which we do business may be subjected to audit by the relevant tax authorities. These audits may result in assessments of additional taxes as well as interest and/or penalties that could impact our financial results.
Changes in tax laws, regulations, court rulings, related interpretations, and tax accounting standards in the U.S. and other countries in which we operate may adversely affect our financial results. For example, in recent years there have been legislative proposals to reform U.S. taxation of foreign earnings which could have a material adverse effect on our financial results by subjecting a significant portion of our earnings to incremental U.S. taxation and/or by delaying or permanently deferring certain deductions otherwise currently allowed in calculating our U.S. tax liabilities.
We may be affected by the impact of global issues such as water scarcity and climate change, including the legal, regulatory, or market responses to such issues.
Water, which is the primary ingredient in all of our products, is vital to our manufacturing processes and is needed to produce the agricultural ingredients that are essential to our business. While water is generally regarded as abundant in Europe, it is a limited resource in many parts of the world, affected by overexploitation, growing population, increasing demand for food products, increasing pollution, poor management, and the effects of climate change. Water scarcity and deterioration in the quality of available water sources in our territories, or our supply chain, even if temporary, may result in increased production costs or capacity constraints, which could adversely affect our ability to produce and sell our beverages and increase our costs.
Political and scientific consensus indicates that increased concentrations of carbon dioxide and other greenhouse gases (GHG) in the atmosphere are leading to gradual rises in global average temperatures. This is influencing global weather patterns and extreme weather conditions around the world. Climate change may also exacerbate water scarcity and cause a further deterioration of water quality in affected regions. Decreased agricultural productivity in certain regions of the world as a result of changing weather patterns may limit the availability or increase the cost of key raw materials we use to produce our products. Additionally, increased frequency of extreme weather events linked to climate change such as storms or floods in our territories could have adverse impacts on our facilities and distribution network, leading to an increased risk of business disruption.
Concern over climate change, including global warming, has led to legislative and regulatory initiatives directed at limiting GHG emissions. The territories in which we operate have in place a variety of GHG emissions reporting requirements, and some have voluntary emissions reduction covenants in which we participate. Proposals that would impose mandatory requirements on GHG emissions reduction and reporting continue to be considered by policy makers. Furthermore, climate laws that directly or indirectly affect our production, distribution, packaging, cost of raw materials, fuel, ingredients, and water could impact our financial results.
As part of our commitment to Corporate Responsibility and Sustainability (CRS), we have calculated the carbon footprint of our operations in each country where we do business. We have also set a public goal to reduce the carbon footprint of our core business operations by 50 percent and the carbon footprint of each individual beverage we produce by one third by the year 2020, as compared to our 2007 baseline. This commitment and the expectations of our stakeholders and regulatory bodies necessitate our investment in technologies that improve the energy efficiency and reduce the carbon emissions of our business operations. In general, the cost of these types of investments is greater than investments in less energy efficient technologies, and the period before investment return is often longer. Although we believe these investments will provide long-term financial and reputational benefits, there is a risk that we may not achieve our desired returns.
Our business is vulnerable to products being imported from outside our territories, which adversely affects our sales.
Our territories are susceptible to the import of products manufactured by bottlers outside our territories where prices and costs are lower. During 2015, we estimate the gross profit of our business was negatively impacted by approximately $40 million to $45
16
million due to products imported into our territories. In the case of such imports from members of the EEA, we are generally prohibited from taking actions to stop such imports.
Changes in interest rates or our debt rating could harm our financial results and financial position.
We are subject to increases in interest rates and changes in our debt rating that could have a material adverse effect on our interest costs and financing sources. Our debt rating can be materially influenced by a number of factors, including, but not limited to, our financial performance, acquisitions, investment decisions (including share repurchases), and capital management activities of TCCC and/or changes in the debt rating of TCCC.
If we are unable to maintain labor bargaining agreements on satisfactory terms, if we experience employee strikes or work stoppages, or if changes are made to employment laws or regulations, our financial results could be negatively impacted.
The majority of our employees are covered by collectively bargained labor agreements, most of which do not expire. However, wage rates must be renegotiated at various dates through 2017. The inability to renegotiate agreements on satisfactory terms could result in work interruptions or stoppages, which could adversely affect our financial results. The terms and conditions of existing or renegotiated agreements could also increase our cost or otherwise affect our ability to fully implement changes to increase the effectiveness of our operations.
We may not fully realize the expected cost savings and/or operating efficiencies from our restructuring and outsourcing programs.
We have implemented restructuring programs to support key strategic initiatives designed to maintain long-term sustainable growth, such as our business transformation program (refer to Note 15 of the Notes to Consolidated Financial Statements in this report). These programs are intended to enhance our operating effectiveness and efficiency and to reduce our costs. We cannot guarantee that we will achieve or sustain the targeted benefits under these programs, or that the benefits, even if achieved, will be adequate to meet our long-term growth expectations. Additionally, if we cannot successfully resolve consultations with employee representatives (e.g., works council, trade unions) related to key elements of these programs, such as employee job reductions, this may have an adverse impact on our business.
We have outsourced certain financial transaction-processing and information technology services to third-party providers. We may outsource other activities in the future to achieve further efficiencies and cost savings. If the third-party providers do not supply the level of service expected with our outsourcing initiatives, we may incur additional costs to correct the errors and may not achieve the level of cost savings originally expected. Disruptions in transaction processing or information technology services due to the ineffectiveness of our third-party providers could result in inefficiencies within other business processes.
Increases in the cost of employee benefits, including pension retirement benefits, could impact our financial results and cash flow.
Unfavorable changes in the cost of our employee benefits, including pension retirement benefits, could materially impact our financial results and cash flow. We sponsor a number of defined benefit pension plans in the territories in which we operate. Estimates of the amount and timing of our future funding obligations for defined benefit pension plans are based upon various assumptions, including discount rates, mortality assumptions, and long-term asset returns. In addition, the amount and timing of pension funding can be influenced by funding requirements, negotiations with the pension trustee boards, or the action of other governing bodies.
Default by or failure of one or more of our counterparty financial institutions could cause us to incur significant losses.
We are exposed to the risk of default by, or failure of, counterparty financial institutions with whom we do business. This risk may be heightened during economic downturns and periods of uncertainty in the financial markets. If one of our counterparties were to become insolvent or file for bankruptcy, our ability to recover amounts owed from or held in accounts with such counterparty may be limited. In the event of default by or failure of one or more of our counterparties, we could incur significant losses, which could negatively impact our results of operations and financial condition.
17
The occurrence of cyber incidents, or a deficiency in our cybersecurity, could negatively impact our business by causing a disruption to our operations, a compromise or corruption of our confidential information, and/or damage to our brand image, all of which could negatively impact our financial results.
A cyber incident is considered to be any adverse event that threatens the confidentiality, integrity, or availability of our data or information systems. More specifically, a cyber incident is an intentional attack or an unintentional event that can include gaining unauthorized access to systems to disrupt operations, corrupt data, or steal confidential information. As our reliance on technology has increased, so have the risks posed to our systems, both internal and those we have outsourced to a third-party provider. Our three primary risks that could result from the occurrence of a cyber incident include operational interruption, damage to our brand image, and private data exposure.
Technology failures could disrupt our operations and negatively impact our financial results.
We rely extensively on information technology systems to process, transmit, store, and protect electronic information. For example, our production and distribution facilities and our inventory management processes utilize information technology to maximize efficiencies and minimize costs. Furthermore, a significant portion of the communications between our personnel, customers, and suppliers depends on information technology. Our information technology systems, some of which have been outsourced to third-party providers, may be vulnerable to a variety of interruptions due to events that may be beyond our control or that of our third-party providers, including, but not limited to, natural disasters, terrorist attacks, telecommunications failures, additional security issues, and other technology failures. Our technology and information security processes and disaster recovery plans may not be adequate or implemented properly to ensure that our operations are not disrupted. In addition, a miscalculation of the level of investment needed to ensure our technology solutions are current as technology advances and evolves could result in disruptions in our business should the software, hardware, or maintenance of such items become obsolete. Furthermore, when we implement new systems or upgrade existing system modules (e.g., SAP modules), there is a risk our business may be temporarily disrupted during the period of implementation.
Our business is focused geographically in Western Europe, which may limit investor interest in our common stock.
Because we are geographically focused in Western Europe, our stock may not be followed as closely by U.S. investors and analysts. If there is only a limited following by market analysts in the U.S. or the investment community in the U.S., the amount of market activity in our common stock may be reduced, making it more difficult to sell our shares. If shareowners decide to sell all or some of their shares, or the market perceives that these sales could occur, the trading value of our shares may decline.
Legal judgments obtained, or claims made, against our vendors or suppliers could impact their ability to provide us with agreed upon products and services, which could negatively impact our business and financial results.
Many of our outside vendors supply us with services, information, processes, software, or other deliverables that rely on certain intellectual property rights or other proprietary information. To the extent these vendors face legal claims brought by other third parties challenging those rights or information, our vendors could be required to pay significant settlements or even discontinue use of the deliverables furnished to us. These outcomes could require us to change vendors or develop replacement solutions, which could result in significant inefficiencies within our business or higher costs and ultimately could negatively impact our financial results.
Global or regional catastrophic events could impact our financial results.
Our business can be affected by large-scale terrorist acts, especially those directed against our territories or other major industrialized countries, the outbreak or escalation of armed hostilities, major natural disasters, or widespread outbreaks of infectious disease. Such events in the geographic regions in which we do business, or in the geographic regions from which our inputs are supplied, could have a material impact on our sales volume, cost of sales, earnings, and overall financial results.
Miscalculation of our need for infrastructure investment could impact our financial results.
Actual requirements of our infrastructure investments, including cold-drink equipment and production equipment, may differ from our projections with respect to volume growth or product demands. Our infrastructure investments are generally long-term in nature and, therefore, it is possible that investments made today may not generate the expected return due to future changes in the marketplace. Significant changes from our expected need for and/or returns on these infrastructure investments could adversely affect our financial results.
Provisions in our product licensing and bottling agreements with TCCC and in our organizational documents could delay or prevent a change in control of CCE, which could adversely affect the price of our common stock.
18
Provisions in our product licensing and bottling agreements with TCCC, which require us to obtain TCCC’s consent to transfer the business to another person, could delay or prevent an unsolicited change in control of CCE. These provisions may also have the effect of making it more difficult for third parties to replace our current management without the consent of our Board of Directors.
In addition, the provisions in our certificate of incorporation and bylaws could delay or prevent an unsolicited change in control of CCE. These provisions include:
• | The availability of authorized shares of preferred stock for issuance from time to time and the determination of rights, powers, and preferences of the preferred stock at the discretion of the CCE Board of Directors without the approval of our shareowners; |
• | The requirement of a meeting of shareowners to approve all actions to be taken by the shareowners; |
• | Requirements for advance notice for raising business or making nominations at shareowners' meetings; and |
• | Limitations on the minimum and maximum number of directors that constitute the CCE Board of Directors. |
Delaware law also imposes restrictions on mergers and other business combinations between us and any holder of 15 percent or more of our outstanding common stock.
ITEM 1B. | UNRESOLVED STAFF COMMENTS |
Not applicable.
ITEM 2. | PROPERTIES |
Our principal properties include our production facilities, sales and distribution centers, European business unit headquarter offices and shared service center, and corporate offices.
The following summarizes the number of production and distribution facilities by country as of December 31, 2015:
Great Britain | France | Belgium | The Netherlands | Norway | Sweden | Total | |||||||||
Production facilities(A) | |||||||||||||||
Leased | 1 | — | — | — | — | — | 1 | ||||||||
Owned | 5 | 5 | 3 | 1 | 1 | 1 | 16 | ||||||||
Total | 6 | 5 | 3 | 1 | 1 | 1 | 17 | ||||||||
Sales and/or distribution facilities | |||||||||||||||
Leased | 4 | 1 | 4 | 1 | 15 | 5 | 30 | ||||||||
Owned | 6 | — | — | — | — | 1 | 7 | ||||||||
Total | 10 | 1 | 4 | 1 | 15 | 6 | 37 | ||||||||
___________________________
(A) | All production facilities are combination production and warehouse facilities. |
Our principal properties cover approximately 9.7 million square feet in the aggregate. We believe that our facilities are adequately utilized and sufficient to meet our present operating needs.
At December 31, 2015, we operated approximately 5,000 vehicles of various types, the majority of which are leased. We also owned approximately 575,000 pieces of cold-drink equipment, principally coolers and vending machines.
19
ITEM 3. | LEGAL PROCEEDINGS |
In connection with the agreements entered into between us, TCCC, CCIP, and CCEAG on August 6, 2015, three putative class action lawsuits were filed in Delaware Chancery Court between the announcement date and the present. The lawsuits are similar and assert claims on behalf of our shareholders for various alleged breaches of fiduciary duty in connection with the agreements. The lawsuits name us, our Board of Directors, CCIP, CCEAG, CCEP, and TCCC as defendants. Plaintiffs in each case seek to enjoin the transaction, to rescind the transaction if it is consummated and allow termination damages, and to recover other damages, attorneys’ fees, and litigation expenses. By consent order dated January 7, 2016, the court consolidated these cases, with the caption of the consolidated case In Re Coca-Cola Enterprises, Inc. Consolidated Stockholders Litigation, C.A. No. 11492-VCN. We believe this matter to be without merit and intend to defend it vigorously. For additional information about the merger agreements between us, TCCC, CCIP, and CCEAG, refer to Note 2 of the Notes to Consolidated Financial Statements in this report.
ITEM 4. | MINE SAFETY DISCLOSURES |
Not applicable.
20
PART II
ITEM 5. | MARKET FOR REGISTRANT’S COMMON EQUITY, RELATED STOCKHOLDER MATTERS, AND ISSUER PURCHASES OF EQUITY SECURITIES |
Listed and Traded (under the symbol CCE): New York Stock Exchange (NYSE) (Principal)
NYSE Euronext Paris (Secondary)
Common shareowners of record as of January 29, 2016: 11,492
STOCK PRICES
2015 | High | Low | |||||
Fourth Quarter | $ | 52.11 | $ | 48.10 | |||
Third Quarter | 53.79 | 42.13 | |||||
Second Quarter | 46.70 | 42.72 | |||||
First Quarter | 46.40 | 41.03 | |||||
2014 | High | Low | |||||
Fourth Quarter | $ | 45.57 | $ | 39.05 | |||
Third Quarter | 50.00 | 44.46 | |||||
Second Quarter | 48.13 | 43.96 | |||||
First Quarter | 47.98 | 42.07 | |||||
DIVIDENDS
Our dividends are declared at the discretion of our Board of Directors. In February 2015, our Board of Directors approved an increase in our quarterly dividend from $0.25 per share to $0.28 per share beginning in the first quarter of 2015, and in February 2014, our Board of Directors approved an increase in our quarterly dividend from $0.20 per share to $0.25 per share beginning in the first quarter of 2014.
21
SHARE PERFORMANCE
Comparison of Five-Year Cumulative Total Return
Coca-Cola Enterprises, Inc. | S&P 500 Comp | Peer Group | |||
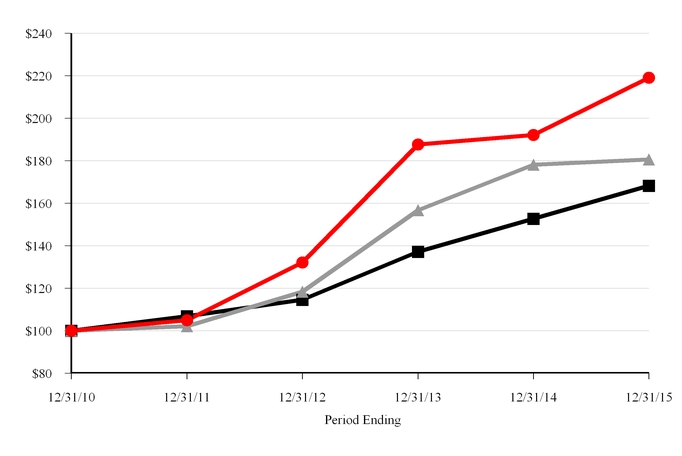
Date | Coca-Cola Enterprises, Inc. | S&P 500 Comp | Peer Group | |||
12/31/2010 | $100.00 | $100.00 | $100.00 | |||
12/31/2011 | 104.98 | 102.10 | 106.87 | |||
12/31/2012 | 132.14 | 118.43 | 114.62 | |||
12/31/2013 | 187.69 | 156.77 | 137.17 | |||
12/31/2014 | 192.18 | 178.21 | 152.74 | |||
12/31/2015 | 219.07 | 180.66 | 168.25 | |||
The graph shows the cumulative total return to our shareowners beginning December 31, 2010 and for the years ended December 31, 2011, 2012, 2013, 2014, and 2015 in comparison to the cumulative returns of the S&P 500 Composite Index and to an index of peer group companies we selected. The peer group consists of TCCC, PepsiCo, Inc., Coca-Cola Hellenic, Dr Pepper Snapple Group, and Britvic plc. The graph assumes $100 invested on December 31, 2010, in our common stock and in each index, with the subsequent reinvestment of dividends on a quarterly basis.
22
SHARE REPURCHASES
The following table presents information about repurchases of Coca-Cola Enterprises, Inc. common stock made by us during the fourth quarter of 2015 (in millions, except average price per share):
Period | Total Number of Shares (or Units) Purchased(A) | Average Price Paid per Share (or Unit) | Total Number of Shares (or Units) Purchased As Part of Publicly Announced Plans or Programs(B) | Maximum Number or Approximate Dollar Value of Shares (or Units) That May Yet Be Purchased Under the Plans or Programs(B) | ||||||||
October 3, 2015 through October 30, 2015 | — | $ | — | — | $ | 969.0 | ||||||
October 31, 2015 through November 27, 2015 | 0.1 | 51.32 | — | 969.0 | ||||||||
November 28, 2015 through December 31, 2015 | — | — | — | 969.0 | ||||||||
Total | 0.1 | 51.32 | — | 969.0 | ||||||||
___________________________
(A) | Represents shares surrendered to CCE by employees in payment of tax obligations related to the vesting of restricted shares (units) or distributions from our deferred compensation plan. |
(B) | In December 2014, our Board of Directors approved a resolution to authorize share repurchases for an aggregate price of not more than $1.0 billion. We currently have $969 million in authorized share repurchases remaining under the December 2014 resolution. We can repurchase shares in the open market and in privately negotiated transactions as part of our share repurchase program. Repurchased shares are added to treasury stock and are available for general corporate purposes, including acquisition financing and the funding of various employee benefit and compensation plans. We do not intend to repurchase additional outstanding shares in the open market prior to the closing of the Merger (expected to be during the second quarter of 2016). |
23
ITEM 6. | SELECTED FINANCIAL DATA |
The following selected financial data should be read in conjunction with Management’s Discussion and Analysis of Financial Condition and Results of Operations, the Consolidated Financial Statements, and the Notes to Consolidated Financial Statements in this report.
For the Years Ended December 31, | ||||||||||||||||||||
(in millions, except per share data) | 2015(A) | 2014(B) | 2013(C) | 2012(D) | 2011(E) | |||||||||||||||
OPERATIONS SUMMARY | ||||||||||||||||||||
Net sales | $ | 7,011 | $ | 8,264 | $ | 8,212 | $ | 8,062 | $ | 8,284 | ||||||||||
Cost of sales | 4,441 | 5,291 | 5,350 | 5,162 | 5,254 | |||||||||||||||
Gross profit | 2,570 | 2,973 | 2,862 | 2,900 | 3,030 | |||||||||||||||
Selling, delivery, and administrative expenses | 1,704 | 1,954 | 1,948 | 1,972 | 1,997 | |||||||||||||||
Operating income | 866 | 1,019 | 914 | 928 | 1,033 | |||||||||||||||
Interest expense | 118 | 119 | 103 | 94 | 85 | |||||||||||||||
Other nonoperating (expense) income | (4 | ) | (7 | ) | (6 | ) | 3 | (3 | ) | |||||||||||
Income before income taxes | 744 | 893 | 805 | 837 | 945 | |||||||||||||||
Income tax expense | 148 | 230 | 138 | 160 | 196 | |||||||||||||||
Net income | $ | 596 | $ | 663 | $ | 667 | $ | 677 | $ | 749 | ||||||||||
WEIGHTED AVERAGE SHARES OUTSTANDING | ||||||||||||||||||||
Basic | 231 | 247 | 268 | 294 | 319 | |||||||||||||||
Diluted | 235 | 252 | 273 | 301 | 327 | |||||||||||||||
PER SHARE DATA | ||||||||||||||||||||
Basic earnings per share | $ | 2.59 | $ | 2.68 | $ | 2.49 | $ | 2.30 | $ | 2.35 | ||||||||||
Diluted earnings per share | 2.54 | 2.63 | 2.44 | 2.25 | 2.29 | |||||||||||||||
Dividends declared per share | 1.12 | 1.00 | 0.80 | 0.64 | 0.51 | |||||||||||||||
Closing stock price | 49.24 | 44.22 | 44.13 | 31.73 | 25.78 | |||||||||||||||
YEAR-END FINANCIAL POSITION | ||||||||||||||||||||
Property, plant, and equipment, net | $ | 1,920 | $ | 2,101 | $ | 2,353 | $ | 2,322 | $ | 2,230 | ||||||||||
Franchise license intangible assets, net | 3,383 | 3,641 | 4,004 | 3,923 | 3,771 | |||||||||||||||
Total assets | 7,611 | 8,543 | 9,525 | 9,510 | 9,094 | |||||||||||||||
Total debt | 3,861 | 3,952 | 3,837 | 3,466 | 3,012 | |||||||||||||||
Total shareowners' equity | 957 | 1,431 | 2,280 | 2,693 | 2,899 | |||||||||||||||
___________________________
(A) | Our 2015 net income included the following items of significance: (1) charges totaling $20 million related to restructuring activities; (2) net mark-to-market losses totaling $28 million related to non-designated commodity hedges associated with underlying transactions that relate to a different reporting period; (3) charges totaling $45 million related to the pending Merger; (4) a gain of $10 million related to the sale of a distribution facility in Great Britain; and (5) a deferred tax benefit of $48 million due to the enactment of corporate tax rate reductions in the United Kingdom and Norway. |
(B) | Our 2014 net income included the following items of significance: (1) charges totaling $81 million related to restructuring activities; (2) net mark-to-market gains totaling $2 million related to non-designated commodity hedges associated with underlying transactions that relate to a different reporting period; (3) charges totaling $10 million related to the impairment of our investment in our recycling joint venture in Great Britain; and (4) net tax items totaling $6 million principally related to the tax impact on the cumulative nonrecurring items for the year. |
(C) | Our 2013 net income included the following items of significance: (1) charges totaling $120 million related to restructuring activities; (2) net mark-to-market losses totaling $7 million related to non-designated commodity hedges associated with underlying transactions that relate to a different reporting period; (3) charges totaling $5 million related to changes in certain underlying tax matters covered by our indemnification to TCCC for the incorporation of CCE in 2010; and (4) a deferred tax benefit of $71 million due to the enactment of a corporate income tax rate reduction in the United Kingdom. |
24
(D) | Our 2012 net income included the following items of significance: (1) charges totaling $85 million related to restructuring activities; (2) net mark-to-market losses totaling $4 million related to non-designated commodity hedges associated with underlying transactions that relate to a different reporting period; and (3) a deferred tax benefit of $62 million due to the enactment of corporate income tax rate reductions in the United Kingdom and Sweden, partially offset by the impact of a corporate income tax law change in Belgium. |
(E) | Our 2011 net income included the following items of significance: (1) charges totaling $19 million related to restructuring activities; (2) net mark-to-market losses totaling $3 million related to non-designated commodity hedges associated with underlying transactions that related to a different reporting period; (3) charges totaling $5 million related to changes in certain underlying tax matters covered by our indemnification to TCCC for the incorporation of CCE in 2010; and (4) a deferred tax benefit of $53 million due to the enactment of a corporate income tax rate reduction in the United Kingdom. |
25
ITEM 7. | MANAGEMENT’S DISCUSSION AND ANALYSIS OF FINANCIAL CONDITION AND RESULTS OF OPERATIONS |
The following Management’s Discussion and Analysis of Financial Condition and Results of Operations (“MD&A”) should be read in conjunction with the Consolidated Financial Statements and the accompanying Notes to Consolidated Financial Statements contained in this report.
Overview
Business
We market, produce, and distribute nonalcoholic beverages to customers and consumers through licensed territory agreements in Belgium, continental France, Great Britain, Luxembourg, Monaco, the Netherlands, Norway, and Sweden. We operate in the highly competitive beverage industry and face strong competition from other general and specialty beverage companies. Our financial results are affected by a number of factors, including, but not limited to, consumer preferences, cost to manufacture and distribute products, foreign currency exchange rates, general economic conditions, local and national laws and regulations, raw material availability, and weather patterns.
Sales of our products are seasonal, with the second and third calendar quarters accounting for higher unit sales of products than the first and fourth quarters. In a typical year, we earn more than 60 percent of our annual operating income during the second and third quarters of the year. The seasonality of our sales volume, combined with the accounting for fixed costs, such as depreciation, amortization, rent, and interest expense, impacts our results on a quarterly basis. Additionally, year-over-year shifts in holidays, selling days, and weather patterns, particularly cold or wet weather during the summer months, can impact our results on an annual or quarterly basis.
On August 6, 2015, we entered into agreements with TCCC, CCIP, and CCEAG related to a pending Merger to form CCEP. For more information about the pending Merger to form CCEP, refer to Note 2 of the Notes to Consolidated Financial Statements in this report.
We and TCCC reached an understanding on a new incidence-based concentrate pricing model and funding program effective on January 1, 2016. The term of this new understanding is tied to the term of our bottling agreements, which expire on October 2, 2020. If our bottling agreements are terminated due to the closing of the proposed Merger, this understanding will continue until the commencement of a new incidence pricing agreement between TCCC and CCEP. Under the new funding program, the $45 million GMF, which terminated December 31, 2015, has been replaced by the integration of $20 million into the incidence rate and annual payments of $25 million from TCCC to us to support the execution of commercial strategies focused on capturing growth opportunities. This $25 million funding will be paid in two equal installments each year. The new pricing model and funding program will result in simplified administration without value transfer between the parties when compared to the previous model. We and TCCC believe that this new understanding should be a key factor for better alignment between the parties and position both parties to win in the marketplace and create value.
Basis of Presentation
Our fiscal year ends on December 31. For interim quarterly reporting convenience, our first three quarters close on the Friday closest to the end of the quarterly calendar period. There were the same number of selling days in 2015, 2014, and 2013 (based upon a standard five-day selling week).
The following table summarizes the number of selling days by quarter for the years ended December 31, 2015, 2014, and 2013 (based on a standard five-day selling week):
First Quarter | Second Quarter | Third Quarter | Fourth Quarter | Full Year | |||||
2015 | 67 | 65 | 65 | 64 | 261 | ||||
2014 | 63 | 65 | 65 | 68 | 261 | ||||
2013 | 64 | 65 | 65 | 67 | 261 | ||||
Strategic Vision
Our strategic vision is to “be the best beverage sales and service company,” and to achieve this aspiration, we look to our operating framework to serve as our compass to steer our priorities, actions, and behaviors. Our operating framework was refreshed in 2014 to adapt to the changing markets and communities in which we operate and the dynamic customer and consumer landscape. To
26
enable us to best serve our stakeholders and achieve our vision, our operating framework includes a mission statement and a targeted set of primary objectives.
Mission Statement: Delight our consumers and drive growth for our customers while proudly supporting our communities every day.
Primary Objectives:
1. Lead category value growth;
2. Excel at serving our customers with world-class capabilities; and
3. Drive an inclusive and passionate culture.
To deliver on our first objective, to lead category value growth, we must focus our efforts on identifying growth opportunities and leveraging our system capabilities to create a sustainable competitive advantage. This entails offering a range of premium but affordable brands, executing world-class consumer and shopper marketing programs, and making our brands an important and intrinsic part of our customers’ own growth strategies.
To achieve our second primary objective, to excel at serving our customers with world-class capabilities, we must place a renewed emphasis on building mutually beneficial relationships and continuously strengthen our execution. This requires a focus on fostering and sustaining productive relationships with customers, developing joint operating plans, gaining a deep understanding of our customers’ needs and expectations, and delivering executional excellence every day. Also, identifying the most critical organizational capabilities needed for success, and investing in assets, innovation, safety practices, process standardization, and technology to further develop them, is important to achieve our objective.
To accomplish our third primary objective, to drive an inclusive and passionate culture, we must concentrate on building an environment that harnesses the individual and collective potential of our people to consistently serve our customers and win in the marketplace. To create such an environment, we must ensure we have a compelling place for employees to work that fosters inclusion, collaboration and connection, and values diversity of perspectives and experiences.
Our operating framework is focused on consumers, customers, and communities, and by accomplishing our primary objectives, we will be well-positioned to achieve consistent long-term profitable growth. Alongside our primary objectives, the operating framework is supported by foundational elements critical to achieving our vision and mission; these are sustainability leadership and winning together with TCCC.
Sustainability Leadership
A fundamental part of reaching our long-term objectives is our commitment to Corporate Responsibility and Sustainability (CRS). We have embedded CRS in our business strategy as a key part of our operating framework and we continue to invest across our territories to incorporate our CRS principles into our business.
We face rising expectations to be a more sustainable company. We want to meet or exceed these expectations and take this responsibility seriously. Our goal is to be the CRS leader within our industry and, with input from key stakeholders, we developed a sustainability plan (“Deliver for Today, Inspire for Tomorrow”) in 2011. In 2015, we updated this plan, having made significant progress against our original commitments, and in response to increased stakeholder expectations. Our updated Sustainability Plan includes a revised set of sustainability commitments and targets across all areas of our business, including energy and climate change, sustainable packaging and recycling, water stewardship, sustainable sourcing, wellbeing, community, and workplace. It includes commitments to “reduce calories per liter across our product portfolio by 10 percent” and to “reduce the absolute carbon footprint of our core business operations by 50 percent” by 2020.
In 2015, we received strong external recognition of our sustainability progress, becoming a member of the Dow Jones Sustainability World and North American Indices. We continued our strong carbon reduction performance and continued to deliver against our water efficiency and water replenishment targets. We also further expanded our external partnerships on key issues, in particular by signing up to the RE100 initiative whereby we have committed to source 100 percent of our electricity from renewable sources by 2020. Additionally, we hosted a series of “Rethinking Business” roundtables in partnership with the Financial Times, providing key stakeholders across our territories a forum within which to discuss sustainability challenges, risks, and opportunities on key topics including resource scarcity, climate change, and the role finance can play in shaping stakeholders' views on the value sustainability brings to business.
We continue to develop new collaborative partnerships to drive sustainability, including partnering with key customers on recycling programs. During 2015, we developed award-winning programs to improve diversity and inclusion within our business, aspiring to have a minimum of 40 percent of women in both leadership and management levels by 2025. We continue to expand our
27
community programs, aiming to “support the skills development and learning needs of 250,000 young people each year” and to “enable three million people to be physically active by investing in grassroots programs which support active lifestyles”.
Moving forward, we will continue to publish progress against this plan in an annual CRS report and on our corporate website, http://www.cokecce.com.
Winning Together With TCCC
We are TCCC’s strategic bottling partner in Western Europe and one of the world’s largest independent Coca-Cola bottlers. While we are two independent companies, we are dependent upon each other for our individual and collective success. For this reason, we understand winning requires us to act with a common vision, one that includes clearly aligned growth targets, common priorities, and a commitment to execute seamlessly together. Our shared vision requires aligned commitments to continuously develop our brands, assets, and capabilities to maximize performance and value, while simultaneously supporting the other party. During 2015, we demonstrated our commitment to winning together by entering into the pending Merger to form CCEP. We believe this transformational transaction better aligns the Coca-Cola system across Western Europe and will enable us to continue to deliver excellent customer service, become more effective and efficient, and drive growth.
2015 Key Accomplishments
During 2015, we continued to drive shareowner value through the generation of strong cash flows and returning cash to shareowners, despite facing a challenging macroeconomic environment. The following highlights some of our primary achievements in 2015:
• | Successfully delivered key marketing initiatives and programs surrounding the 2015 Rugby World Cup and our one-brand strategy aimed at bringing a common identity to our Coca-Cola trademark portfolio and encouraging consumers to “Choose Happiness”; |
• | Continued to advance our activation of new beverage brands in the marketplace by (1) introducing Coca-Cola Life in Norway and Finley in Sweden and (2) further expanding our distribution of smartwater in Great Britain, and Capri-Sun and Monster across our territories; |
• | Achieved significant recognition for our sustainability progress including obtaining: (1) listing on the Dow Jones Sustainability World and North American Indices; (2) certification from the Carbon Trust in the areas of sustainable carbon emissions, water use, and waste management and disposal; (3) a #8 ranking on Newsweek Green Rankings for U.S. Companies; and (4) a #26 ranking on the Corporate Knights 2015 Global 100 Sustainability Index; |
• | Repurchased $600 million of shares under our share repurchase program, bringing the total value of shares repurchased since October 2010 to approximately $4.3 billion; and |
• | Increased our quarterly dividend from $0.25 per share to $0.28 per share, representing the eighth consecutive year of dividend increases. |
Financial Summary
Our financial performance during 2015 reflects the following significant factors:
• | Persistent currency headwinds which decreased our net sales by 13.5 percent, our operating income by 16.0 percent, and our diluted earnings per share by 22.0 percent; |
• | A softer macroeconomic and consumer environment than anticipated; |
• | A volume decline of 0.5 percent, driven by lower sales of our sparkling beverages, partially offset by volume gains in our still portfolio; |
• | Bottle and can gross margin expansion as our cost of sales per case decline of 2.5 percent outpaced a net price per case decline of 1.0 percent; |
• | Essentially flat operating expenses primarily driven by a year-over-year decrease in restructuring expenses, offset by the impact of Merger-related expenses and modest underlying operating expense growth; and |
• | The continuation of our share repurchase program, which increased diluted earnings per share in 2015 by approximately 6.5 percent (or $0.17 per diluted share) compared to 2014. |
Financial Results
Our net income in 2015 was $596 million, or $2.54 per diluted share, compared to net income in 2014 of $663 million, or $2.63 per diluted share. The following items included in our reported results affect the comparability of our year-over-year financial
28
results (the items listed below are based on defined terms and thresholds and represent all material items management considered for year-over-year comparability):
2015
• | Charges totaling $45 million ($31 million net of tax, or $0.13 per diluted share) related to the pending Merger; |
• | Net mark-to-market losses totaling $28 million ($19 million net of tax, or $0.08 per diluted share) related to non-designated commodity hedges associated with underlying transactions that relate to a different reporting period; |
• | Charges totaling $20 million ($14 million net of tax, or $0.06 per diluted share) related to restructuring activities; |
• | A gain of $10 million ($7 million net of tax, or $0.03 per diluted share) related to the sale of a distribution facility in Great Britain; and |
• | A deferred tax benefit of $48 million ($0.20 per diluted share) due to the enactment of corporate tax rate reductions in the United Kingdom and Norway. |
2014
• | Charges totaling $81 million ($55 million net of tax, or $0.22 per diluted share) related to restructuring activities; |
• | Net mark-to-market gains totaling $2 million ($1 million net of tax) related to non-designated commodity hedges associated with underlying transactions that related to a different reporting period; |
• | Charges totaling $10 million ($8 million net of tax, or $0.03 per diluted share) related to the impairment of our investment in our recycling joint venture in Great Britain; and |
• | Net tax items totaling $6 million ($0.03 per diluted share) principally related to the tax impact on the cumulative nonrecurring items for the year. |
Volume and Net Sales
Our overall volume performance reflected a decrease in sparkling beverage sales, partially offset by volume increases in still beverages. The decrease in our sparkling beverage sales primarily resulted from declines in Coca-Cola and Diet Coke/Coca-Cola light, partially offset by growth of 5.0 percent in Coca-Cola Zero. Our still beverage performance was driven by growth in our water brands and Capri-Sun across our territories. Our bottle and can net price per case declined 1.0 percent compared to the prior year driven by our strategic pricing initiatives in light of the soft consumer and cost environment.
Cost of Sales
Our 2015 bottle and can cost per case declined 2.5 percent, reflecting the benefit of favorable cost trends in some of our key commodities, including aluminum, sugar, and PET (plastic), and product mix-shifts. Though the current cost environment is favorable, we continue to execute our risk management strategy through the use of supplier agreements and hedging instruments.
Operating Expenses
Our operating expenses decreased 13.0 percent in 2015 when compared to 2014, primarily driven by the impact of currency, a decline in restructuring expenses, and a gain on sale of a distribution facility in Great Britain. These declines were partially offset by the impact of Merger related costs, and promotional expenses associated with the 2015 Rugby World Cup and our brand expansion efforts throughout the year.
Earnings Per Share
Our diluted earnings per share performance was driven by a 16.0 percent decline in operating income due to currency; the impact of tax rate reductions in the United Kingdom and Norway which resulted in a $48 million deferred tax benefit; and the impact of share repurchase activity, which increased diluted earnings per share year-over-year by approximately 6.5 percent.
Looking Forward
While we expect soft consumer and category trends to persist in 2016, we are committed to and focused on growing our business, enhancing margins and strengthening our long-term outlook. Our business plans for 2016 acknowledge the current marketplace challenges and focus on capturing the benefits of several key brand, packaging, and marketing initiatives. During 2016, we will leverage our key marketing programs, particularly the 2016 European Cup, through activation of targeted programs with customers and in-store execution. We will also introduce several brand extensions and package innovations in each of our territories. We will
29
add new emphasis in cold drinks with expanded vendor placements and support TCCC’s new initiative, “Taste the Feeling.” This effort unites the Coca-Cola brand family under one global creative campaign.
While we are realistic about the current environment, we believe renewed growth, our focus on cash generation, and our demonstrated ability to manage the levers of our business will enable us to achieve continued shareowner value. The pending Merger to create CCEP is an important catalyst and strengthens our ability to adapt and respond to changing business conditions.
Operations Review
The following table summarizes our Consolidated Statements of Income as a percentage of net sales for the periods presented:
2015 | 2014 | 2013 | ||||||
Net sales | 100.0 | % | 100.0 | % | 100.0 | % | ||
Cost of sales | 63.3 | 64.0 | 65.1 | |||||
Gross profit | 36.7 | 36.0 | 34.9 | |||||
Selling, delivery, and administrative expenses | 24.3 | 23.7 | 23.7 | |||||
Operating income | 12.4 | 12.3 | 11.2 | |||||
Interest expense | 1.7 | 1.4 | 1.3 | |||||
Other nonoperating expense | (0.1 | ) | (0.1 | ) | (0.1 | ) | ||
Income before income taxes | 10.6 | 10.8 | 9.8 | |||||
Income tax expense | 2.1 | 2.8 | 1.7 | |||||
Net income | 8.5 | % | 8.0 | % | 8.1 | % | ||
Operating Income
The following table summarizes our operating income by segment for the periods presented (in millions; percentages rounded to the nearest 0.5 percent):
2015 | 2014 | 2013 | ||||||||||||||||||
Amount | Percent of Total | Amount | Percent of Total | Amount | Percent of Total | |||||||||||||||
Europe | $ | 1,063 | 123.0 | % | $ | 1,151 | 113.0 | % | $ | 1,063 | 116.5 | % | ||||||||
Corporate | (197 | ) | (23.0 | ) | (132 | ) | (13.0 | ) | (149 | ) | (16.5 | ) | ||||||||
Consolidated | $ | 866 | 100.0 | % | $ | 1,019 | 100.0 | % | $ | 914 | 100.0 | % | ||||||||
30
During 2015, our operating income decreased 15.0 percent to $866 million. The following table summarizes the significant components of the change in our operating income for the periods presented (in millions; percentages rounded to the nearest 0.5 percent):
2015 Versus 2014 | 2014 Versus 2013 | ||||||||||||
Amount | Change Percent of Total | Amount | Change Percent of Total | ||||||||||
Changes in operating income: | |||||||||||||
Impact of bottle and can price-mix on gross profit | $ | (61 | ) | (6.0 | )% | $ | (9 | ) | (1.0 | )% | |||
Impact of bottle and can cost-mix on gross profit | 117 | 11.5 | 56 | 6.0 | |||||||||
Impact of bottle and can volume on gross profit | (19 | ) | (2.0 | ) | — | — | |||||||
Impact of post-mix, non-trade, and other on gross profit | 5 | 0.5 | — | — | |||||||||
Other selling, delivery, and administrative expenses | (27 | ) | (2.5 | ) | (16 | ) | (2.0 | ) | |||||
Net mark-to-market gains on non-designated commodity hedges | (30 | ) | (3.0 | ) | 9 | 1.0 | |||||||
Restructuring charges | 61 | 6.0 | 39 | 4.5 | |||||||||
Merger related costs | (45 | ) | (4.5 | ) | — | — | |||||||
Gain on property sale | 10 | 1.0 | — | — | |||||||||
Tax sharing agreement indemnification changes | — | — | 5 | 0.5 | |||||||||
Currency exchange rate changes | (166 | ) | (16.0 | ) | 24 | 2.5 | |||||||
Other changes | 2 | — | (3 | ) | — | ||||||||
Change in operating income | $ | (153 | ) | (15.0 | )% | $ | 105 | 11.5 | % | ||||
Net Sales
Net sales decreased 15.0 percent in 2015 to $7.0 billion from $8.3 billion in 2014. This change included a 13.5 percent decrease due to unfavorable currency exchange rate changes, and reflects a 0.5 percent decline in volume and a 1.0 percent decline in bottle and can net pricing per case versus the prior year. Net sales increased 0.5 percent in 2014 to $8.3 billion from $8.2 billion in 2013. This change included a 1.0 percent increase due to favorable currency exchange rate changes, and reflects essentially flat volume and bottle and can net pricing per case versus the prior year.
The following table summarizes the significant components of the change in our net sales per case for the periods presented (rounded to the nearest 0.5 percent and based on wholesale physical case volume):
2015 Versus 2014 | 2014 Versus 2013 | ||||
Changes in net sales per case: | |||||
Bottle and can net price per case | (1.0 | )% | (0.5 | )% | |
Bottle and can currency exchange rate changes | (14.0 | ) | 1.0 | ||
Post-mix, non-trade, and other | 0.5 | — | |||
Change in net sales per case | (14.5 | )% | 0.5 | % | |
Our bottle and can sales accounted for approximately 94 percent of our total net sales during 2015. Bottle and can net price per case is based on the invoice price charged to customers reduced by promotional allowances, and is impacted by the price charged per package or brand, the volume generated in each package or brand, and the channels in which those packages or brands are sold. To the extent we are able to increase volume in higher-margin packages or brands that are sold through higher-margin channels, our bottle and can net pricing per case will increase without an actual increase in wholesale pricing. During 2015, our bottle and can net price per case declined 1.0 percent versus the prior year as a result of our strategic pricing initiatives in light of the soft consumer and cost environment. During 2014, our bottle and can net price per case reflected a modest approach to pricing given the difficult retail environment and negative mix-shifts into multi-serve packages.
We participate in various programs and arrangements with customers designed to increase the sale of our products. The costs of these various programs, included as a reduction in net sales, totaled $1.1 billion in each of the years 2015, 2014, and 2013. These amounts included out-of-period accrual reductions related to estimates for prior year programs of $50 million, $46 million, and $31 million in 2015, 2014, and 2013, respectively.
31
Volume
The following table summarizes the change in our bottle and can volume for the periods presented (selling days were the same in all years presented; rounded to the nearest 0.5 percent):
2015 Versus 2014 | 2014 Versus 2013 | ||||
Change in volume | (0.5 | )% | — | % | |
Brands
The following table summarizes our bottle and can volume by major brand category for the periods presented (selling days were the same in all years presented; rounded to the nearest 0.5 percent):
2015 Versus 2014 Change | 2015 Percent of Total | 2014 Versus 2013 Change | 2014 Percent of Total | ||||||||
Coca-Cola trademark | (2.0 | )% | 68.0 | % | — | % | 69.0 | % | |||
Sparkling flavors and energy | 0.5 | 17.5 | (2.0 | ) | 17.5 | ||||||
Juices, isotonics, and other | 1.5 | 10.5 | — | 10.0 | |||||||
Water | 12.0 | 4.0 | 5.5 | 3.5 | |||||||
Total | (0.5 | )% | 100.0 | % | — | % | 100.0 | % | |||
2015 Versus 2014
Our 2015 volume declined 0.5 percent, reflecting a decrease in sparkling beverage sales of 1.5 percent, partially offset by an increase in still beverage sales of 4.0 percent. The decrease in our sparkling beverage sales primarily resulted from declines in our Coca-Cola trademark beverages, partially offset by increases in Monster and Finley. Our still beverage performance was driven by growth in our water brands and Capri-Sun across our territories.
During 2015, our Coca-Cola trademark volume declined 2.0 percent. This performance was driven by volume declines in Coca-Cola and Diet Coke/Coca-Cola light of 3.0 percent and 4.5 percent, respectively, partially offset by volume gains in Coca-Cola Zero of 5.0 percent and the impact of the expansion of Coca-Cola Life across all of our territories. Our sparkling flavors and energy volume increased 0.5 percent, reflecting continued strength in our energy portfolio, growing 10.5 percent year-over-year, led by Monster, and the impact of the expansion of Finley into additional territories. These increases were partially offset by declines in the sales of Schweppes, Sprite, and Dr Pepper. Juices, isotonics, and other volume increased 1.5 percent reflecting the benefit of expanded distribution of Capri-Sun, offset by declines in Ocean Spray and Minute Maid. We also experienced a 12.0 percent increase in sales of our water brands, reflecting the continued success of smartwater in Great Britain and increased sales of Chaudfontaine in continental Europe.
On a territory basis, continental Europe (including Norway and Sweden) and Great Britain experienced volume declines of 1.0 percent and 0.5 percent, respectively. The performance of our continental Europe territories reflected a 3.0 percent decline in the Coca-Cola trademark portfolio, partially offset by sparkling flavors and energy sales gains of 2.5 percent as Monster experienced double-digit growth. Sales of juices, isotonics, and other brands increased 6.5 percent in continental Europe, driven by strong sales of Capri-Sun and Nestea. In Great Britain, our volume declines were driven by a decrease in sales of sparkling beverage brands, partially offset by growth in still beverage brands. The decline in sparkling beverages was driven by a 1.5 percent reduction in the sales of other sparkling flavors, including Sprite, Schweppes, and Dr Pepper. The increase in still beverage sales was primarily driven by double-digit growth in our water brands, which benefited from the continued expansion of smartwater throughout Great Britain, partially offset by a decrease in Ocean Spray sales after the termination of our agreement in Great Britain in 2014.
2014 Versus 2013
Our 2014 volume remained essentially flat, reflecting a decrease in sparkling beverage sales of 0.5 percent, offset by an increase in still beverage sales of 1.5 percent. The decrease in our sparkling beverage sales primarily resulted from declines in our Sprite, Fanta, and Schweppes brands. Our still beverage performance was driven by growth in our water brands across our territories.
During 2014, our Coca-Cola trademark volume remained essentially flat. This performance was driven by volume declines in Coca-Cola and Diet Coke/Coca-Cola light of 1.0 percent and 5.5 percent, respectively, offset by volume gains in Coca-Cola Zero
32
of 11.0 percent. Our sparkling flavors and energy volume declined 2.0 percent during 2014, reflecting declines in Sprite, Fanta, and Schweppes. These declines were partially offset by continued strength in our energy portfolio, growing 6.5 percent year-over-year led by Monster and Relentless. Juices, isotonics, and other volume remained flat reflecting continued strong growth in Nestea, offset by significant declines in Ocean Spray as a result of the termination of our agreement in Great Britain in early 2014. We also experienced a 5.5 percent increase in sales of our water brands, primarily driven by Chaudfontaine in continental Europe and the introduction of smartwater in Great Britain.
On a territory basis, continental Europe (including Norway and Sweden) volume grew 0.5 percent during 2014, offset by a volume decrease of 0.5 percent in Great Britain. The performance of our continental Europe territories reflected flat volume performance of our Coca-Cola trademark portfolio. Sparkling flavors and energy sales grew 0.5 percent. Sales of juices, isotonics, and other brands increased 0.5 percent in continental Europe, as increases in Capri-Sun and Nestea were partially offset by declines in sports drinks. In Great Britain, our volume declines were driven by a decrease in sales of sparkling beverage brands, partially offset by growth in still beverage brands. The decline in sparkling beverages was driven by a 3.5 percent reduction in the sales of other sparkling flavors, including Sprite and Schweppes. The increase in still beverage sales was primarily driven by double-digit growth in our water brands, which benefited from the introduction of smartwater in Great Britain in 2014, partially offset by a 0.5 percent decrease in our juices, isotonics, and other category led by declines in sales of Ocean Spray, as a result of the termination of our agreement in Great Britain in early 2014, and Powerade.
Consumption
The following table summarizes the change in volume by consumption type for the periods presented (selling days were the same in all years presented; rounded to the nearest 0.5 percent):
2015 Versus 2014 Change | 2015 Percent of Total | 2014 Versus 2013 Change | 2014 Percent of Total | ||||||||
Future Consumption(A) | (0.5 | )% | 65.0 | % | — | % | 65.0 | % | |||
Immediate Consumption(B) | (1.0 | ) | 35.0 | — | 35.0 | ||||||
Total | (0.5 | )% | 100.0 | % | — | % | 100.0 | % | |||
___________________________
(A) | Future consumption packages include containers that are typically one liter and greater, purchased by consumers in multi-packs in take-home channels at ambient temperatures, and are intended for consumption in the future. |
(B) | Immediate consumption packages include containers that are typically less than one liter, purchased by consumers as a single bottle or can in cold drink channels at chilled temperatures, and are intended for consumption shortly after purchase. |
Packages
Our products are available in a variety of package types and sizes (future consumption and immediate consumption) including, but not limited to, aluminum and steel cans, glass, PET (plastic) and aluminum bottles, pouches, and bag-in-box for fountain use. The following table summarizes our volume results by major package category for the periods presented (selling days were the same in all years presented; rounded to the nearest 0.5 percent):
2015 Versus 2014 Change | 2015 Percent of Total | 2014 Versus 2013 Change | 2014 Percent of Total | ||||||||
PET (plastic) | (0.5 | )% | 43.0 | % | (2.5 | )% | 43.0 | % | |||
Cans | (1.0 | ) | 41.0 | 2.5 | 41.5 | ||||||
Glass and other | 0.5 | 16.0 | 1.5 | 15.5 | |||||||
Total | (0.5 | )% | 100.0 | % | — | % | 100.0 | % | |||
Cost of Sales
Cost of sales decreased 16.0 percent in 2015 to $4.4 billion as compared to the prior year. This change included a 14.0 percent decrease due to currency exchange rate changes. Cost of sales decreased 1.0 percent in 2014 to $5.3 billion as compared to the prior year. This change included a 1.0 percent increase due to currency exchange rate changes.
33
The following table summarizes the significant components of the change in our cost of sales per case for the periods presented (rounded to the nearest 0.5 percent and based on wholesale physical case volume):
2015 Versus 2014 | 2014 Versus 2013 | ||||
Changes in cost of sales per case: | |||||
Bottle and can ingredient and packaging costs | (2.5 | )% | (1.0 | )% | |
Bottle and can currency exchange rate changes | (14.0 | ) | 1.0 | ||
Post-mix, non-trade, and other | 1.0 | (1.0 | ) | ||
Change in cost of sales per case | (15.5 | )% | (1.0 | )% | |
Our 2015 bottle and can ingredient and packaging costs per case decreased 2.5 percent. This decline reflects the benefit of favorable cost trends in some of our key commodities, including aluminum, sugar, and PET (plastic). Though the current cost environment is favorable, we continue to execute our risk management strategy through the use of supplier agreements and hedging instruments designed to mitigate our exposure to commodity price volatility.
Our 2014 bottle and can ingredient and packaging costs per case decreased 1.0 percent. This decline reflects mix-shifts into lower cost packages and benefits from favorable cost trends in some of our key inputs, principally sugar and PET (plastic).
Selling, Delivery, and Administrative Expenses
Selling, delivery, and administrative (SD&A) expenses decreased 13.0 percent to $1.7 billion in 2015. SD&A expenses increased 0.5 percent to $2.0 billion in 2014.
The following table summarizes the significant components of the change in our SD&A expenses for the periods presented (in millions; percentages rounded to the nearest 0.5 percent):
2015 Versus 2014 | 2014 Versus 2013 | ||||||||||||
Amount | Change Percent of Total | Amount | Change Percent of Total | ||||||||||
Changes in SD&A expenses: | |||||||||||||
General and administrative expenses | $ | 5 | 0.5 | % | $ | 13 | 0.5 | % | |||||
Selling and marketing expenses | 31 | 1.5 | 24 | 1.5 | |||||||||
Delivery and merchandising expenses | 1 | — | (12 | ) | (0.5 | ) | |||||||
Warehousing expenses | (6 | ) | (0.5 | ) | (11 | ) | (0.5 | ) | |||||
Net mark-to-market losses on non-designated commodity hedges | (3 | ) | — | 11 | 0.5 | ||||||||
Restructuring charges | (61 | ) | (3.0 | ) | (34 | ) | (1.5 | ) | |||||
Merger related costs | 45 | 2.5 | — | — | |||||||||
Gain on property sale | (10 | ) | (0.5 | ) | — | — | |||||||
Tax sharing agreement indemnification changes | — | — | (5 | ) | (0.5 | ) | |||||||
Currency exchange rate changes | (248 | ) | (13.0 | ) | 18 | 1.0 | |||||||
Other changes | (4 | ) | (0.5 | ) | 2 | — | |||||||
Change in SD&A expenses | $ | (250 | ) | (13.0 | )% | $ | 6 | 0.5 | % | ||||
The decrease in our SD&A expenses in 2015 when compared to 2014 primarily reflects the year-over-year impact of currency exchange rates that decreased expenses by 13.0 percent, a decrease in restructuring expenses, and the sale of a distribution facility in Great Britain. These decreases were partially offset by the impact of Merger related costs, and promotional expenses associated with the 2015 Rugby World Cup and our brand expansion efforts throughout the year.
The increase in our SD&A expenses in 2014 when compared to 2013 relates to our efforts to expand promotional activity in Great Britain to respond to marketplace dynamics and marketing initiatives to support the 2014 FIFA World Cup, as well as currency exchange rate changes. These increases are partially offset by the realization of cost savings associated with efforts under our restructuring programs, and a decline in expenses incurred related to our business transformation program as we approached its completion.
34
Interest Expense
Interest expense, net totaled $118 million, $119 million, and $103 million in 2015, 2014, and 2013, respectively. The following tables summarize the primary items impacting our interest expense during the periods presented (in millions):
Debt
2015 | 2014 | 2013 | |||||||||
Average outstanding debt balance | $ | 4,225 | $ | 4,231 | $ | 3,706 | |||||
Weighted average cost of debt | 2.7 | % | 2.8 | % | 2.8 | % | |||||
Fixed-rate debt (% of portfolio) | 95 | % | 96 | % | 97 | % | |||||
Floating-rate debt (% of portfolio) | 5 | % | 4 | % | 3 | % | |||||
Other Nonoperating Expense
Other nonoperating expense totaled $4 million, $7 million, and $6 million in 2015, 2014, and 2013, respectively. Our other nonoperating expense principally included gains and losses on transactions denominated in a currency other than the functional currency of a particular legal entity. In 2014, our other nonoperating expense also includes charges related to the impairment of our investment in our recycling joint venture in Great Britain.
Income Tax Expense
In 2015, our effective tax rate was 20.0 percent. This rate included a deferred tax benefit of $48 million (an approximate 6 percentage point decrease in the effective tax rate) due to the enactment of corporate income tax rate reductions in the United Kingdom and Norway. Our 2015 effective tax rate also reflected the U.S. tax impact associated with repatriating to the U.S. $450 million of our 2015 foreign earnings (refer to Note 11 of the Notes to Consolidated Financial Statements in this report).
In 2014, our effective tax rate was 26.0 percent. Our 2014 effective tax rate reflected the U.S. tax impact associated with repatriating to the U.S. $450 million of our 2014 foreign earnings (refer to Note 11 of the Notes to Consolidated Financial Statements in this report).
In 2013, our effective tax rate was 17.0 percent. This rate included a deferred tax benefit of $71 million (an approximate 9 percentage point decrease in the effective tax rate) due to the enactment of a corporate income tax rate reduction in the United Kingdom. Our 2013 effective tax rate also reflected the U.S. tax impact associated with repatriating to the U.S. $450 million of our 2013 foreign earnings.
35
Cash Flow and Liquidity Review
Liquidity and Capital Resources
Our sources of capital include, but are not limited to, cash flows from operations, public and private issuances of debt and equity securities, and bank borrowings. We believe our operating cash flow, cash on hand, and available short-term and long-term capital resources are sufficient to fund our working capital requirements, scheduled debt payments, interest payments, capital expenditures, benefit plan contributions, income tax obligations, dividends to our shareowners, any contemplated acquisitions, and share repurchases for the foreseeable future. We continually assess the counterparties and instruments we use to hold our cash and cash equivalents, with a focus on preservation of capital and liquidity. Based on information currently available, we do not believe we are at significant risk of default by our counterparties.
We have amounts available to us for borrowing under a $1.0 billion multi-currency credit facility with a syndicate of eight banks. This credit facility matures in 2017 and is for general corporate purposes, including serving as a backstop to our commercial paper program and supporting our working capital needs. At December 31, 2015, we had no amount drawn under this credit facility. Based on information currently available to us, we have no indication that the financial institutions participating in this facility would be unable to fulfill their commitments to us as of the date of the filing of this report.
We satisfy seasonal working capital needs and other financing requirements with operating cash flow, cash on hand, short-term borrowings under our commercial paper program, bank borrowings, and our line of credit. At December 31, 2015, we had $454 million in debt maturities in the next 12 months, including $198 million in commercial paper. In addition to using operating cash flow and cash on hand, we may repay our short-term obligations by issuing more debt, which may take the form of commercial paper and/or long-term debt.
Beginning in October 2010, our Board of Directors has approved a series of resolutions authorizing the repurchase of shares of our stock. Since 2010, we have repurchased $4.3 billion in outstanding shares, representing 125.9 million shares, under these resolutions. In December 2013, our Board of Directors authorized share repurchases for an aggregate price of not more than $1.0 billion. Share repurchase activity under this authorization commenced during the second quarter of 2014. In the third quarter of 2015 we completed authorized share repurchases under the December 2013 resolution. In December 2014, our Board of Directors approved a resolution to authorize additional share repurchases for an aggregate price of not more than $1.0 billion. We currently have $969 million in authorized share repurchases remaining under the December 2014 resolution. We completed our planned share repurchases for 2015 during the third quarter and do not intend to repurchase additional outstanding shares in the open market prior to the closing of the Merger (expected to be during the second quarter of 2016). For additional information about our share repurchase programs, refer to Note 16 of the Notes to Consolidated Financial Statements in this report.
During the third quarter of 2015, we repatriated to the U.S. $450 million of our 2015 foreign earnings for the payment of dividends, share repurchases, interest on U.S.-issued debt, salaries for U.S.-based employees, and other corporate-level operations in the U.S. Our historical foreign earnings, including our 2015 foreign earnings that were not repatriated in 2015, will continue to remain indefinitely reinvested, and, if we do not generate sufficient current year foreign earnings to repatriate to the U.S. in any future given year, we expect to have adequate access to capital in the U.S. to allow us to satisfy our U.S.-based cash flow needs in that year. Therefore, historical foreign earnings and future foreign earnings that are not repatriated to the U.S. will remain indefinitely reinvested and will be used to service our foreign operations, non-U.S. debt, and to fund future acquisitions. During 2016, we expect to repatriate a portion of our 2016 foreign earnings to satisfy our 2016 U.S.-based cash flow needs. The amount to be repatriated to the U.S. will depend on, among other things, our actual 2016 foreign earnings and our actual 2016 U.S.-based cash flow needs. For additional information about repatriation of foreign earnings, refer to Note 11 of the Notes to Consolidated Financial Statements in this report.
At December 31, 2015, substantially all of the cash and cash equivalents recorded on our Consolidated Balance Sheets was held by consolidated entities that are located outside the U.S. Our disclosure of cash and cash equivalents held by consolidated entities located outside the U.S. is not meant to imply the cash will be repatriated to the U.S. at a future date. Any future repatriation of foreign earnings to the U.S. will be based on actual U.S.-based cash flow needs and actual foreign entity cash available at the time of the repatriation.
During 2015, we paid dividends of $257 million. In February 2015, our Board of Directors approved an increase in our quarterly dividend from $0.25 per share to $0.28 per share beginning in the first quarter of 2015.
Credit Ratings and Covenants
Our credit ratings are periodically reviewed by rating agencies. Currently, our long-term ratings from Moody’s, Standard & Poor’s (S&P), and Fitch are A3, BBB+, and BBB+, respectively. Our ratings outlook from S&P and Fitch are stable and Moody's is
36
negative. Changes in our operating results, cash flows, or financial position could impact the ratings assigned by the various rating agencies. Our credit rating can be materially influenced by a number of factors including, but not limited to, acquisitions, investment decisions, and capital management activities of TCCC, and/or changes in the credit rating of TCCC. Should our credit ratings be adjusted downward, we may incur higher costs to borrow, which could have a material impact on our financial condition and results of operations.
Our credit facility and outstanding notes contain various provisions that, among other things, require us to limit the incurrence of certain liens or encumbrances in excess of defined amounts. Additionally, our credit facility requires that we meet a minimum interest coverage ratio. We were in compliance with these requirements as of December 31, 2015. These requirements currently are not, nor is it anticipated that they will become, restrictive to our liquidity or capital resources.
Summary of Cash Activities
2015
During 2015, our primary sources of cash included (1) $941 million from operating activities, net of cash payments related to restructuring programs of $28 million, merger costs of $25 million, and contributions to our defined benefit pension plans of $52 million; (2) proceeds of $527 million from the issuances of debt; (3) the receipt of $56 million upon maturity of certain of our cross-currency swaps related to intercompany loans; and (4) net issuances of commercial paper of $52 million. Our primary uses of cash were (1) cash payments totaling $614 million for shares repurchased under our share repurchase program; (2) payments on debt of $485 million, primarily resulting from the maturing of $475 million notes; (3) capital asset investments totaling $321 million; and (4) dividend payments on common stock of $257 million.
2014
During 2014, our primary sources of cash included (1) $982 million from operating activities, net of cash payments related to restructuring programs of $88 million and contributions to our defined benefit pension plans of $51 million; (2) proceeds of $347 million from the issuances of debt; and (3) net issuances of commercial paper of $146 million. Our primary uses of cash were (1) cash payments totaling $912 million for shares repurchased under our share repurchase program; (2) capital asset investments totaling $332 million; (3) dividend payments on common stock of $246 million; and (4) payments on debt of $114 million, primarily resulting from the maturing of $100 million notes.
2013
During 2013, our primary sources of cash included (1) $833 million from operating activities, net of cash payments related to restructuring programs of $117 million and contributions to our defined benefit pension plans of $72 million; and (2) proceeds of $931 million from the issuances of debt. Our primary uses of cash were (1) cash payments totaling $1.0 billion for shares repurchased under our share repurchase program; (2) payments on debt of $623 million, primarily resulting from the maturing of our Swiss franc (CHF) 200 million notes and our $400 million notes; (3) capital asset investments totaling $313 million; and (4) dividend payments on common stock of $213 million.
Operating Activities
2015 Versus 2014
Our net cash derived from operating activities totaled $941 million in 2015 versus $982 million in 2014. This decrease resulted from a decline in our year-over-year operating income performance driven primarily by currency exchange rate changes, partially offset by favorable working capital changes due to our continued focus on working capital management.
2014 Versus 2013
Our net cash derived from operating activities totaled $982 million in 2014 versus $833 million in 2013. This change reflected our improved year-over-year operating income performance, a $29 million decrease in cash payments under our restructuring programs, and a $21 million decrease in the amount of contributions made to our defined benefit plans.
37
Investing Activities
Capital asset investments represent a principal use of cash for our investing activities. During 2016, we expect our capital expenditures to approximate $325 million and to be invested in similar asset categories as those listed in the table below. The following table summarizes our capital asset investments for the periods presented (in millions):
2015 | 2014 | 2013 | |||||||||
Supply chain infrastructure | $ | 168 | $ | 187 | $ | 190 | |||||
Cold-drink equipment | 110 | 101 | 73 | ||||||||
Information technology | 41 | 37 | 35 | ||||||||
Fleet and other | 2 | 7 | 15 | ||||||||
Total capital asset investments | $ | 321 | $ | 332 | $ | 313 | |||||
During 2015, investing activities also included the receipt of $32 million from the settlement of net investment hedges as well as $13 million in capital disposals driven primarily by the sale of a distribution facility in Great Britain.
During 2014, our investing activities included $27 million in capital asset disposals, driven, in part, by our business transformation program. Additionally, investing activities for 2014 included the receipt of $21 million from the settlement of net investment hedges.
Financing Activities
Our net cash used in financing activities totaled $698 million and $789 million in 2015 and 2014, respectively. The following table summarizes our financing activities related to the issuances of and payments on debt for the period presented (in millions):
Issuances of Debt | Maturity Date | Rate | 2015 | 2014 | ||||||||
€500 million notes | March 2030 | 1.9% | $ | 527 | $ | — | ||||||
€250 million notes | May 2026 | 2.8% | — | 347 | ||||||||
Total issuances of debt, excluding commercial paper | 527 | 347 | ||||||||||
Net issuances of commercial paper | — | — | 52 | 146 | ||||||||
Total issuances of debt | $ | 579 | $ | 493 | ||||||||
Payments on Debt | Maturity Date | Rate(A) | 2015 | 2014 | ||||||||
$475 million notes | September 2015 | 2.1% | $ | (475 | ) | $ | — | |||||
$100 million notes | February 2014 | floating | — | (100 | ) | |||||||
Other payments, net | — | — | (10 | ) | (14 | ) | ||||||
Total payments on debt | $ | (485 | ) | $ | (114 | ) | ||||||
___________________________
(A) | The $100 million notes carried a variable interest rate at three-month USD LIBOR plus 30 basis points. At maturity the effective rate on these notes was 0.5 percent. |
Our financing activities during 2015 and 2014 also included cash payments of $614 million and $912 million for share repurchases, respectively. We do not intend to repurchase additional outstanding shares in the open market prior to the closing of the Merger (expected to be during the second quarter of 2016). Additionally, financing activities during 2015 included the receipt of $56 million upon maturity of certain of our cross-currency swaps related to intercompany loans.
In February 2015, our Board of Directors approved an increase in our quarterly dividend from $0.25 per share to $0.28 per share beginning in the first quarter of 2015. As a result, we paid dividends of $257 million during 2015. During 2014, we paid dividends of $246 million.
38
Financial Position
The following table illustrates selected changes in our consolidated balance sheets (in millions), with underlying movements discussed below:
December 31, | 2015 | 2014 | Change | Currency Impact | Change Excluding Currency | |||||||||||||||
Trade accounts receivable, net | $ | 1,314 | $ | 1,514 | $ | (200 | ) | $ | (122 | ) | $ | (78 | ) | |||||||
Inventories | 336 | 388 | (52 | ) | (34 | ) | (18 | ) | ||||||||||||
Other current assets | 170 | 268 | (98 | ) | (15 | ) | (83 | ) | ||||||||||||
Franchise license intangible assets, net and Goodwill | 3,471 | 3,742 | (271 | ) | (271 | ) | — | |||||||||||||
Other noncurrent assets | 174 | 240 | (66 | ) | (10 | ) | (56 | ) | ||||||||||||
Accounts payable and accrued expenses | 1,601 | 1,872 | (271 | ) | (151 | ) | (120 | ) | ||||||||||||
Current portion of debt | 454 | 632 | (178 | ) | — | (178 | ) | |||||||||||||
Debt, less current portion | 3,407 | 3,320 | 87 | (189 | ) | 276 | ||||||||||||||
Other noncurrent liabilities | 236 | 207 | 29 | (15 | ) | 44 | ||||||||||||||
Common stock in treasury, at cost | (4,411 | ) | (3,807 | ) | (604 | ) | — | (604 | ) | |||||||||||
Trade accounts receivable, net decreased $78 million, or 5.0 percent, attributable to our continued focus on working capital management as well as the timing of cash receipts late in the fourth quarter of 2015.
Inventories decreased $18 million, or 4.5 percent, due primarily to favorable cost trends in some of our key commodities, including aluminum, sugar, and PET (plastic).
Other current assets decreased $83 million, or 31.0 percent, primarily driven by the maturing of certain derivative assets (refer to Note 6 of the Notes to Consolidated Financial Statements in this report) and a decrease in current deferred income tax assets (refer to Note 11 of the Notes to Consolidated Financial Statements in this report).
Other noncurrent assets decreased $56 million, or 23.5 percent, driven by declines in noncurrent deferred income tax assets (refer to Note 11 of the Notes to Consolidated Financial Statements in this report) and declines in noncurrent assets related to our defined benefit pension plans (refer to Note 10 of the Notes to Consolidated Financial Statements in this report).
Accounts payable and accrued expenses decreased $120 million, or 6.5 percent, driven by a decrease in customer marketing agreement accruals, particularly in Great Britain, as well as a decrease in accrued compensation due to the timing of certain severance payments under our business transformation program.
Current portion of debt decreased $178 million, or 28.0 percent, primarily due to the payment of our $475 million, 2.1 percent notes in September 2015, partially offset by net issuances of commercial paper of $52 million and the reclassification of our $250 million, 2.0 percent notes due 2016 to current liabilities. For additional information about our debt, refer to Note 7 of the Notes to Consolidated Financial Statements in this report.
Debt, less current portion increased $276 million, or 8.5 percent, due to the March 2015 issuance of €500 million, 1.9 percent notes due 2030, partially offset by the reclassification of our $250 million, 2.0 percent notes due 2016 to current liabilities. For additional information about our debt, refer to Note 7 of the Notes to Consolidated Financial Statements in this report.
Other noncurrent liabilities increased $44 million, or 21.5 percent, primarily attributable to an increase in our defined benefit pension plan liabilities (refer to Note 10 of the Notes to Consolidated Financial Statements in this report), certain derivative liabilities (refer to Note 6 of the Notes to Consolidated Financial Statements in this report), and an increase in certain income tax liabilities (refer to Note 11 of the Notes to Consolidated Financial Statements in this report).
Common stock in treasury, at cost increased $604 million, or 16.0 percent, primarily driven by our repurchase of $600 million in outstanding shares during 2015 under our share repurchase programs (refer to Note 16 of the Notes to Consolidated Financial Statements in this report). The remaining difference represents shares withheld for taxes upon the vesting of employee share-based payment awards.
39
Contractual Obligations
The following table summarizes our significant contractual obligations as of December 31, 2015 (in millions):
Payments Due by Period | ||||||||||||||||||||
Contractual Obligations | Total | Less Than 1 Year | 1 to 3 Years | 3 to 5 Years | More Than 5 Years | |||||||||||||||
Debt, excluding capital leases(A) | $ | 3,844 | $ | 448 | $ | 380 | $ | 901 | $ | 2,115 | ||||||||||
Interest obligations(B) | 685 | 101 | 180 | 161 | 243 | |||||||||||||||
Purchase agreements(C) | 241 | 73 | 113 | 55 | — | |||||||||||||||
Operating leases(D) | 231 | 54 | 74 | 40 | 63 | |||||||||||||||
Other purchase obligations(E) | 179 | 179 | — | — | — | |||||||||||||||
Capital lease obligations(F) | 19 | 6 | 9 | 3 | 1 | |||||||||||||||
Total contractual obligations | $ | 5,199 | $ | 861 | $ | 756 | $ | 1,160 | $ | 2,422 | ||||||||||
___________________________
(A) | These amounts represent our scheduled debt maturities, excluding capital leases. For additional information about our debt, refer to Note 7 of the Notes to Consolidated Financial Statements in this report. |
(B) | These amounts represent estimated interest payments related to our long-term debt obligations, excluding capital leases. For fixed-rate debt, we have calculated interest based on the applicable rates and payment dates for each individual debt instrument. For variable-rate debt, we have estimated interest using the forward interest rate curve. At December 31, 2015, approximately 95 percent of our debt portfolio was fixed-rate debt and 5 percent was floating-rate debt. |
(C) | These amounts represent noncancelable purchase agreements with various suppliers that are enforceable and legally binding, and that specify a fixed or minimum quantity that we must purchase. All purchases made under these agreements are subject to standard quality and performance criteria. We have excluded amounts related to supply agreements with requirements to purchase a certain percentage of our future raw material needs from a specific supplier, since such agreements do not specify a fixed or minimum quantity requirement. |
(D) | These amounts represent our minimum operating lease payments due under noncancelable operating leases with initial or remaining lease terms in excess of one year as of December 31, 2015. Income associated with sublease arrangements is not significant. For additional information about our operating leases, refer to Note 8 of the Notes to Consolidated Financial Statements in this report. |
(E) | These amounts represent outstanding purchase obligations primarily related to commodity purchases and capital expenditures. |
(F) | These amounts represent our minimum capital lease payments (including amounts representing interest). For additional information about our capital leases, refer to Note 7 of the Notes to Consolidated Financial Statements in this report. |
Benefit Plan Contributions
The following table summarizes the contributions made to our defined benefit pension plans for the years ended December 31, 2015 and 2014, as well as our projected contributions for the year ending December 31, 2016 (in millions):
Actual(A) | Projected(A) | ||||||||||
2015 | 2014 | 2016 | |||||||||
Pension contributions | $ | 52 | $ | 51 | $ | 51 | |||||
___________________________
(A) | These amounts represent only contributions made by CCE. We fund our pension plans at a level to maintain, within established guidelines, the appropriate funded status for each country. |
For additional information about our pension plans, refer to Note 10 of the Notes to Consolidated Financial Statements in this report.
40
Critical Accounting Policies
We make judgments and estimates with underlying assumptions when applying accounting principles to prepare our Consolidated Financial Statements. Certain critical accounting policies requiring significant judgments, estimates, and assumptions are detailed in this section. We consider an accounting estimate to be critical if (1) it requires assumptions to be made that are uncertain at the time the estimate is made and (2) changes to the estimate or different estimates that could have reasonably been used would have materially changed our Consolidated Financial Statements. The development and selection of these critical accounting policies have been reviewed with the Audit Committee of our Board of Directors.
We believe the current assumptions and other considerations used to estimate amounts reflected in our Consolidated Financial Statements are appropriate. However, should our actual experience differ from these assumptions and other considerations used in estimating these amounts, the impact of these differences could have a material impact on our Consolidated Financial Statements.
Indefinite Reinvestment of Foreign Earnings
We had approximately $1.8 billion in cumulative undistributed foreign earnings as of December 31, 2015. These earnings are exclusive of amounts that would result in little or no tax under current tax laws if remitted in the future. The cumulative undistributed earnings from our foreign subsidiaries are considered to be indefinitely reinvested and, accordingly, no provision for U.S. federal and state income taxes has been made in our Consolidated Financial Statements. A distribution of these foreign earnings to the U.S. in the form of dividends, or otherwise, would subject us to U.S. income taxes, as adjusted for foreign tax credits, and withholding taxes payable to the various foreign countries. Determination of the amount of unrecognized deferred U.S. income tax liability on these undistributed earnings is not practicable.
During the third quarter of 2015, we repatriated to the U.S. $450 million of our 2015 foreign earnings for the payment of dividends, share repurchases, interest on U.S.-issued debt, salaries for U.S.-based employees, and other corporate-level operations in the U.S. Our historical foreign earnings, including our 2015 foreign earnings that were not repatriated in 2015, will continue to remain indefinitely reinvested, and, if we do not generate sufficient current year foreign earnings to repatriate to the U.S. in any future given year, we expect to have adequate access to capital in the U.S. to allow us to satisfy our U.S.-based cash flow needs in that year. Therefore, historical foreign earnings and future foreign earnings that are not repatriated to the U.S. will remain indefinitely reinvested and will be used to service our foreign operations, non-U.S. debt, and to fund future acquisitions. During the third quarter of 2014, we repatriated to the U.S. $450 million of our 2014 foreign earnings for the payment of dividends, share repurchases, interest on U.S.-issued debt, salaries for U.S.-based employees, and other corporate-level operations in the U.S.
The following table illustrates the hypothetical U.S. taxes that we would be subjected to if the entire amount of our indefinitely reinvested foreign earnings as of December 31, 2015 were repatriated to the U.S. (in millions):
Incremental U.S. Tax Percentage(A) | Incremental U.S. Taxes(B) | |||
5 percent | $ | 90 | ||
10 percent | 180 | |||
15 percent | 270 | |||
20 percent | 360 | |||
___________________________
(A) | These percentages are not based on any specific facts or circumstances, but instead were selected for illustrative purposes only. Each rate represents the hypothetical incremental U.S. tax assessed on earnings from a foreign jurisdiction upon repatriation to the U.S. |
(B) | Amounts are derived by multiplying the hypothetical incremental U.S. tax percentages by our cumulative undistributed indefinitely reinvested foreign earnings as of December 31, 2015. |
Pension Plan Valuation
We sponsor a number of defined benefit pension plans covering substantially all of our employees. Several critical assumptions are made in valuing our pension plan assets and liabilities and related pension expense. We believe the most critical of these assumptions are the discount rate, salary rate of inflation, and expected long-term return on assets (EROA). Other assumptions we make are related to employee demographic factors such as mortality rates, retirement patterns, and turnover rates.
We determine the discount rate primarily by reference to rates of high-quality, long-term corporate bonds that mature in a pattern similar to the expected payments to be made under the plans. Decreasing our discount rate (3.5 percent for the year ended
41
December 31, 2015 for pension expense and 3.5 percent as of December 31, 2015 for our projected benefit obligation (PBO)) by 0.5 percent would have increased our 2015 pension expense by approximately $13 million and our PBO by approximately $177 million.
We determine the salary rate of inflation by considering the following factors: (1) expected long-term price inflation; (2) allowance for merit and promotion increases; (3) prior years’ actual experience; and (4) any known short-term actions. Increasing our salary rate of inflation (3.2 percent for the year ended December 31, 2015 for pension expense and 3.3 percent as of December 31, 2015 for our PBO) by 0.5 percent would have increased our 2015 pension expense by approximately $9 million and our PBO by approximately $65 million.
The EROA is based on long-term expectations given current investment objectives and historical results. We utilize a combination of active and passive fund management of pension plan assets in order to maximize plan asset returns within established risk parameters. We periodically revise asset allocations, where appropriate, to improve returns and manage risk. Decreasing the EROA (6.9 percent for the year ended December 31, 2015) by 0.5 percent would have increased our pension expense in 2015 by approximately $5 million.
We utilize the five-year asset smoothing technique to recognize market gains and losses for 92 percent of our pension plan assets.
As a result of changes in discount rates, asset performance, and other assumption changes, our net losses deferred in accumulated other comprehensive income (AOCI) have increased in recent years. As of December 31, 2015, our net losses totaled $489 million, of which $26 million will be amortized in 2016 as a component of our 2016 net periodic benefit cost.
For additional information about our pension plans, refer to Note 10 of the Notes to Consolidated Financial Statements in this report.
Customer Marketing Programs and Sales Incentives
We participate in various programs and arrangements with customers designed to increase the sale of our products. Among the programs are arrangements under which allowances can be earned by customers for attaining agreed-upon sales levels or for participating in specific marketing programs. Coupon programs are also developed on a customer- and territory-specific basis with the intent of increasing sales by all customers. We believe our participation in these programs is essential to ensuring volume and revenue growth in the competitive marketplace. The costs of all these various programs, included as a reduction in net sales, totaled $1.1 billion in each of the years 2015, 2014, and 2013.
Under customer programs and arrangements that require sales incentives to be paid in advance, we amortize the amount paid over the period of benefit or contractual sales volume. When incentives are paid in arrears, we accrue the estimated amount to be paid based on the program’s contractual terms, expected customer performance, and/or estimated sales volume. Our accrued marketing costs were $508 million as of December 31, 2015 and $656 million as of December 31, 2014. These estimates are determined using historical customer experience and other factors, which sometimes require significant judgment. In part due to the length of time necessary to obtain relevant data from our customers, actual amounts paid can differ from these estimates. During the years ended December 31, 2015, 2014, and 2013, we recorded out-of-period accrual reductions related to estimates for prior year programs of $50 million, $46 million, and $31 million, respectively.
Contingencies
For information about our contingencies, refer to Note 9 of the Notes to Consolidated Financial Statements in this report.
Workforce
At December 31, 2015, we had approximately 11,500 employees, of which approximately 150 were located in the U.S. A majority of our employees in Europe are covered by collectively bargained labor agreements, most of which do not expire. However, wage rates must be renegotiated at various dates through 2017. We believe that we will be able to renegotiate wage rates with satisfactory terms.
Off-Balance Sheet Arrangements
Not applicable.
42
ITEM 7A. | QUANTITATIVE AND QUALITATIVE DISCLOSURES ABOUT MARKET RISK |
Interest Rate, Currency, and Commodity Price Risk Management
Interest Rates
Interest rate risk is present with both our fixed-rate and floating-rate debt. Interest rate swap agreements and other risk management instruments are used, at times, to manage our fixed/floating debt portfolio. At December 31, 2015, approximately 95 percent of our debt portfolio was comprised of fixed-rate debt and 5 percent was floating-rate debt. We estimate that a 1 percent change in market interest rates as of December 31, 2015 would change the fair value of our fixed-rate debt outstanding as of December 31, 2015 by approximately $405 million.
We also estimate that a 1 percent change in the interest costs of our floating-rate debt outstanding as of December 31, 2015 would change interest expense on an annual basis by approximately $2 million. This amount is determined by calculating the effect of a hypothetical interest rate change on our floating-rate debt after giving consideration to our interest rate swap agreements and other risk management instruments. This estimate does not include the effects of other actions to mitigate this risk or changes in our financial structure.
Currency Exchange Rates
We operate primarily in Western Europe. As such, we are exposed to translation risk because our operations are in local currency and must be translated into U.S. dollars. As currency exchange rates fluctuate, translation of our Consolidated Statements of Income into U.S. dollars affects the comparability of revenues, expenses, operating income, and diluted earnings per share between years. We estimate that a 10 percent unidirectional change in currency exchange rates would have changed our operating income for the year ended December 31, 2015 by approximately $105 million.
Commodity Price Risk
The competitive marketplace in which we operate may limit our ability to recover increased costs through higher prices. As such, we are subject to market risk with respect to commodity price fluctuations principally related to our purchases of aluminum, steel, PET (plastic), sugar, and vehicle fuel. When possible, we manage our exposure to this risk primarily through the use of supplier pricing agreements, which enable us to establish the purchase price for certain commodities. We also, at times, use derivative financial instruments to manage our exposure to this risk. Including the effect of pricing agreements and other hedging instruments entered into to date, we estimate that a 10 percent increase in the market price of these commodities over the current market prices would increase our cost of sales during the next 12 months by approximately $10 million. This amount does not include the potential impact of changes in the conversion costs associated with these commodities.
Certain of our suppliers restrict our ability to hedge prices through supplier agreements. As a result, at times, we enter into non-designated commodity hedging programs. Based on the fair value of our non-designated commodity hedges outstanding as of December 31, 2015, we estimate that a 10 percent change in market prices would change the fair value of our non-designated commodity hedges by approximately $15 million. For additional information about our derivative financial instruments, refer to Note 6 of the Notes to Consolidated Financial Statements in this report.
43
ITEM 8. | FINANCIAL STATEMENTS AND SUPPLEMENTARY DATA |
Report of Management
Management’s Responsibility for the Financial Statements
Management is responsible for the preparation and fair presentation of the financial statements included in this annual report. The financial statements have been prepared in accordance with U.S. generally accepted accounting principles and reflect management’s judgments and estimates concerning effects of events and transactions that are accounted for or disclosed.
Internal Control over Financial Reporting
Management is also responsible for establishing and maintaining effective internal control over financial reporting. Internal control over financial reporting is a process designed to provide reasonable assurance regarding the reliability of financial reporting and the preparation of financial statements for external purposes in accordance with U.S. generally accepted accounting principles. The Company’s internal control over financial reporting includes those policies and procedures that (1) pertain to the maintenance of records that, in reasonable detail, accurately and fairly reflect the transactions and dispositions of the assets of the Company; (2) provide reasonable assurance that transactions are recorded as necessary to permit preparation of financial statements in accordance with U.S. generally accepted accounting principles, and that receipts and expenditures of the Company are being made only in accordance with authorizations of management and directors of the Company; and (3) provide reasonable assurance regarding prevention or timely detection of unauthorized acquisition, use, or disposition of the Company’s assets that could have a material effect on the financial statements. Management recognizes that there are inherent limitations in the effectiveness of any internal control over financial reporting, including the possibility of human error and the circumvention or overriding of internal control. Accordingly, even effective internal control over financial reporting can provide only reasonable assurance with respect to financial statement preparation. Further, because of changes in conditions, the effectiveness of internal control over financial reporting may vary over time.
In order to ensure that the Company’s internal control over financial reporting is effective, management regularly assesses such controls and did so most recently as of December 31, 2015. This assessment was based on criteria for effective internal control over financial reporting described in Internal Control-Integrated Framework issued by the Committee of Sponsoring Organizations of the Treadway Commission (2013 framework). Based on this assessment, management believes the Company maintained effective internal control over financial reporting as of December 31, 2015. Ernst & Young LLP, the Company’s independent registered public accounting firm, has issued an attestation report on the Company’s internal control over financial reporting as of December 31, 2015.
Audit Committee’s Responsibility
The Board of Directors, acting through its Audit Committee, is responsible for the oversight of the Company’s accounting policies, financial reporting, and internal control. The Audit Committee of the Board of Directors is comprised entirely of outside directors who are independent of management. The Audit Committee is responsible for the appointment and compensation of our independent registered public accounting firm and approves decisions regarding the appointment or removal of our Vice President of Internal Audit. It meets periodically with management, the independent registered public accounting firm, and the internal auditors to ensure that they are carrying out their responsibilities. The Audit Committee is also responsible for performing an oversight role by reviewing and monitoring the financial, accounting, and auditing procedures of the Company, in addition to reviewing the Company’s financial reports. Our independent registered public accounting firm and our internal auditors have full and unlimited access to the Audit Committee, with or without management, to discuss the adequacy of internal control over financial reporting, and any other matters which they believe should be brought to the attention of the Audit Committee.
/S/ JOHN F. BROCK |
Chairman and Chief Executive Officer |
/S/ MANIK H. JHANGIANI |
Senior Vice President and Chief Financial Officer |
/S/ SUZANNE D. PATTERSON |
Vice President, Controller and Chief Accounting Officer |
Atlanta, Georgia
February 11, 2016
44
Report of Independent Registered Public Accounting Firm
The Board of Directors and Shareowners of Coca-Cola Enterprises, Inc.
We have audited the accompanying consolidated balance sheets of Coca-Cola Enterprises, Inc. as of December 31, 2015 and 2014, and the related consolidated statements of income, comprehensive income, shareowners’ equity, and cash flows for each of the three years in the period ended December 31, 2015. These financial statements are the responsibility of the Company’s management. Our responsibility is to express an opinion on these financial statements based on our audits.
We conducted our audits in accordance with the standards of the Public Company Accounting Oversight Board (United States). Those standards require that we plan and perform the audit to obtain reasonable assurance about whether the financial statements are free of material misstatement. An audit includes examining, on a test basis, evidence supporting the amounts and disclosures in the financial statements. An audit also includes assessing the accounting principles used and significant estimates made by management, as well as evaluating the overall financial statement presentation. We believe that our audits provide a reasonable basis for our opinion.
In our opinion, the consolidated financial statements referred to above present fairly, in all material respects, the consolidated financial position of Coca-Cola Enterprises, Inc. at December 31, 2015 and 2014, and the consolidated results of their operations and their cash flows for each of the three years in the period ended December 31, 2015, in conformity with U.S. generally accepted accounting principles.
We also have audited, in accordance with the standards of the Public Company Accounting Oversight Board (United States), Coca-Cola Enterprises, Inc.’s internal control over financial reporting as of December 31, 2015, based on criteria established in Internal Control-Integrated Framework issued by the Committee of Sponsoring Organizations of the Treadway Commission (2013 framework) and our report dated February 11, 2016 expressed an unqualified opinion thereon.
/s/ Ernst & Young LLP
Atlanta, Georgia
February 11, 2016
45
Report of Independent Registered Public Accounting Firm on Internal Control over Financial Reporting
The Board of Directors and Shareowners of Coca-Cola Enterprises, Inc.
We have audited Coca-Cola Enterprises, Inc.’s internal control over financial reporting as of December 31, 2015, based on criteria established in Internal Control-Integrated Framework issued by the Committee of Sponsoring Organizations of the Treadway Commission (2013 framework) (the COSO criteria). Coca-Cola Enterprises, Inc.’s management is responsible for maintaining effective internal control over financial reporting, and for its assessment of the effectiveness of internal control over financial reporting included in the Internal Control over Financial Reporting section of the accompanying Report of Management. Our responsibility is to express an opinion on the Company’s internal control over financial reporting based on our audit.
We conducted our audit in accordance with the standards of the Public Company Accounting Oversight Board (United States). Those standards require that we plan and perform the audit to obtain reasonable assurance about whether effective internal control over financial reporting was maintained in all material respects. Our audit included obtaining an understanding of internal control over financial reporting, assessing the risk that a material weakness exists, testing and evaluating the design and operating effectiveness of internal control based on the assessed risk, and performing such other procedures as we considered necessary in the circumstances. We believe that our audit provides a reasonable basis for our opinion.
A company’s internal control over financial reporting is a process designed to provide reasonable assurance regarding the reliability of financial reporting and the preparation of financial statements for external purposes in accordance with generally accepted accounting principles. A company’s internal control over financial reporting includes those policies and procedures that (1) pertain to the maintenance of records that, in reasonable detail, accurately and fairly reflect the transactions and dispositions of the assets of the company; (2) provide reasonable assurance that transactions are recorded as necessary to permit preparation of financial statements in accordance with generally accepted accounting principles, and that receipts and expenditures of the company are being made only in accordance with authorizations of management and directors of the company; and (3) provide reasonable assurance regarding prevention or timely detection of unauthorized acquisition, use, or disposition of the company’s assets that could have a material effect on the financial statements.
Because of its inherent limitations, internal control over financial reporting may not prevent or detect misstatements. Also, projections of any evaluation of effectiveness to future periods are subject to the risk that controls may become inadequate because of changes in conditions, or that the degree of compliance with the policies or procedures may deteriorate.
In our opinion, Coca-Cola Enterprises, Inc. maintained, in all material respects, effective internal control over financial reporting as of December 31, 2015, based on the COSO criteria.
We also have audited, in accordance with the standards of the Public Company Accounting Oversight Board (United States), the consolidated balance sheets of Coca-Cola Enterprises, Inc. as of December 31, 2015 and 2014, and the related consolidated statements of income, comprehensive income, shareowners’ equity, and cash flows for each of the three years in the period ended December 31, 2015 of Coca-Cola Enterprises, Inc. and our report dated February 11, 2016 expressed an unqualified opinion thereon.
/s/ Ernst & Young LLP
Atlanta, Georgia
February 11, 2016
46
COCA-COLA ENTERPRISES, INC.
CONSOLIDATED STATEMENTS OF INCOME
Year Ended December 31, | ||||||||||||
(in millions, except per share data) | 2015 | 2014 | 2013 | |||||||||
Net sales | $ | 7,011 | $ | 8,264 | $ | 8,212 | ||||||
Cost of sales | 4,441 | 5,291 | 5,350 | |||||||||
Gross profit | 2,570 | 2,973 | 2,862 | |||||||||
Selling, delivery, and administrative expenses | 1,704 | 1,954 | 1,948 | |||||||||
Operating income | 866 | 1,019 | 914 | |||||||||
Interest expense, net | 118 | 119 | 103 | |||||||||
Other nonoperating expense | (4 | ) | (7 | ) | (6 | ) | ||||||
Income before income taxes | 744 | 893 | 805 | |||||||||
Income tax expense | 148 | 230 | 138 | |||||||||
Net income | $ | 596 | $ | 663 | $ | 667 | ||||||
Basic earnings per share | $ | 2.59 | $ | 2.68 | $ | 2.49 | ||||||
Diluted earnings per share | $ | 2.54 | $ | 2.63 | $ | 2.44 | ||||||
Dividends declared per share | $ | 1.12 | $ | 1.00 | $ | 0.80 | ||||||
Basic weighted average shares outstanding | 231 | 247 | 268 | |||||||||
Diluted weighted average shares outstanding | 235 | 252 | 273 | |||||||||
The accompanying Notes to Consolidated Financial Statements are an integral part of these statements.
47
COCA-COLA ENTERPRISES, INC.
CONSOLIDATED STATEMENTS OF COMPREHENSIVE INCOME
Year Ended December 31, | ||||||||||||
(in millions) | 2015 | 2014 | 2013 | |||||||||
Net income | $ | 596 | $ | 663 | $ | 667 | ||||||
Components of other comprehensive (loss) income: | ||||||||||||
Currency translations | ||||||||||||
Pretax activity, net | (337 | ) | (482 | ) | 82 | |||||||
Tax effect | — | — | — | |||||||||
Currency translations, net of tax | (337 | ) | (482 | ) | 82 | |||||||
Net investment hedges | ||||||||||||
Pretax activity, net | 163 | 256 | (61 | ) | ||||||||
Tax effect | (57 | ) | (90 | ) | 21 | |||||||
Net investment hedges, net of tax | 106 | 166 | (40 | ) | ||||||||
Cash flow hedges | ||||||||||||
Pretax activity, net | 16 | (15 | ) | 21 | ||||||||
Tax effect | (5 | ) | 4 | (6 | ) | |||||||
Cash flow hedges, net of tax | 11 | (11 | ) | 15 | ||||||||
Pension plan adjustments | ||||||||||||
Pretax activity, net | (76 | ) | (79 | ) | 57 | |||||||
Tax effect | 13 | 23 | (15 | ) | ||||||||
Pension plan adjustments, net of tax | (63 | ) | (56 | ) | 42 | |||||||
Other comprehensive (loss) income, net of tax | (283 | ) | (383 | ) | 99 | |||||||
Comprehensive income | $ | 313 | $ | 280 | $ | 766 | ||||||
The accompanying Notes to Consolidated Financial Statements are an integral part of these statements.
48
COCA-COLA ENTERPRISES, INC.
CONSOLIDATED BALANCE SHEETS
December 31, | ||||||||
(in millions, except share data) | 2015 | 2014 | ||||||
ASSETS | ||||||||
Current: | ||||||||
Cash and cash equivalents | $ | 170 | $ | 223 | ||||
Trade accounts receivable, less allowances of $16 and $17, respectively | 1,314 | 1,514 | ||||||
Amounts receivable from The Coca-Cola Company | 56 | 67 | ||||||
Inventories | 336 | 388 | ||||||
Other current assets | 170 | 268 | ||||||
Total current assets | 2,046 | 2,460 | ||||||
Property, plant, and equipment, net | 1,920 | 2,101 | ||||||
Franchise license intangible assets, net | 3,383 | 3,641 | ||||||
Goodwill | 88 | 101 | ||||||
Other noncurrent assets | 174 | 240 | ||||||
Total assets | $ | 7,611 | $ | 8,543 | ||||
LIABILITIES | ||||||||
Current: | ||||||||
Accounts payable and accrued expenses | $ | 1,601 | $ | 1,872 | ||||
Amounts payable to The Coca-Cola Company | 102 | 104 | ||||||
Current portion of debt | 454 | 632 | ||||||
Total current liabilities | 2,157 | 2,608 | ||||||
Debt, less current portion | 3,407 | 3,320 | ||||||
Other noncurrent liabilities | 236 | 207 | ||||||
Noncurrent deferred income tax liabilities | 854 | 977 | ||||||
Total liabilities | 6,654 | 7,112 | ||||||
SHAREOWNERS’ EQUITY | ||||||||
Common stock, $0.01 par value – Authorized – 1,000,000,000 shares; Issued – 356,214,139 and 354,551,447 shares, respectively | 4 | 3 | ||||||
Additional paid-in capital | 4,032 | 3,958 | ||||||
Reinvested earnings | 2,329 | 1,991 | ||||||
Accumulated other comprehensive loss | (997 | ) | (714 | ) | ||||
Common stock in treasury, at cost – 128,878,376 and 115,305,477 shares, respectively | (4,411 | ) | (3,807 | ) | ||||
Total shareowners’ equity | 957 | 1,431 | ||||||
Total liabilities and shareowners’ equity | $ | 7,611 | $ | 8,543 | ||||
The accompanying Notes to Consolidated Financial Statements are an integral part of these statements.
49
COCA-COLA ENTERPRISES, INC.
CONSOLIDATED STATEMENTS OF CASH FLOWS
Year Ended December 31, | ||||||||||||
(in millions) | 2015 | 2014 | 2013 | |||||||||
Cash Flows from Operating Activities: | ||||||||||||
Net income | $ | 596 | $ | 663 | $ | 667 | ||||||
Adjustments to reconcile net income to net cash derived from operating activities: | ||||||||||||
Depreciation and amortization | 274 | 309 | 308 | |||||||||
Share-based compensation expense | 41 | 28 | 33 | |||||||||
Deferred income tax (benefit) expense | (8 | ) | 65 | (77 | ) | |||||||
Pension expense less than contributions | (11 | ) | (3 | ) | (19 | ) | ||||||
Changes in assets and liabilities: | ||||||||||||
Trade accounts receivable | 78 | (151 | ) | (45 | ) | |||||||
Inventories | 17 | 15 | (57 | ) | ||||||||
Other current assets | (30 | ) | (110 | ) | (21 | ) | ||||||
Accounts payable and accrued expenses | (38 | ) | 94 | 100 | ||||||||
Other changes, net | 22 | 72 | (56 | ) | ||||||||
Net cash derived from operating activities | 941 | 982 | 833 | |||||||||
Cash Flows from Investing Activities: | ||||||||||||
Capital asset investments | (321 | ) | (332 | ) | (313 | ) | ||||||
Capital asset disposals | 13 | 27 | 4 | |||||||||
Settlement of net investment hedges | 32 | 21 | (21 | ) | ||||||||
Net cash used in investing activities | (276 | ) | (284 | ) | (330 | ) | ||||||
Cash Flows from Financing Activities: | ||||||||||||
Net change in commercial paper | 52 | 146 | — | |||||||||
Issuances of debt | 527 | 347 | 931 | |||||||||
Payments on debt | (485 | ) | (114 | ) | (623 | ) | ||||||
Share repurchases under share repurchase programs | (614 | ) | (912 | ) | (1,006 | ) | ||||||
Dividend payments on common stock | (257 | ) | (246 | ) | (213 | ) | ||||||
Exercise of employee share options | 21 | 16 | 22 | |||||||||
Settlement of debt-related cross-currency swaps | 56 | (13 | ) | 12 | ||||||||
Other financing activities, net | 2 | (13 | ) | (19 | ) | |||||||
Net cash used in financing activities | (698 | ) | (789 | ) | (896 | ) | ||||||
Net effect of currency exchange rate changes on cash and cash equivalents | (20 | ) | (29 | ) | 15 | |||||||
Net Change in Cash and Cash Equivalents | (53 | ) | (120 | ) | (378 | ) | ||||||
Cash and Cash Equivalents at Beginning of Year | 223 | 343 | 721 | |||||||||
Cash and Cash Equivalents at End of Year | $ | 170 | $ | 223 | $ | 343 | ||||||
Supplemental Noncash Investing and Financing Activities: | ||||||||||||
Capital lease additions | $ | 3 | $ | 3 | $ | 9 | ||||||
Supplemental Disclosure of Cash Paid for: | ||||||||||||
Income taxes, net | $ | 138 | $ | 187 | $ | 262 | ||||||
Interest, net of amounts capitalized | 103 | 101 | 91 | |||||||||
The accompanying Notes to Consolidated Financial Statements are an integral part of these statements.
50
COCA-COLA ENTERPRISES, INC.
CONSOLIDATED STATEMENTS OF SHAREOWNERS' EQUITY
Common Stock Outstanding | Additional Paid-In Capital | Reinvested Earnings | Accumulated Other Comprehensive Income (Loss) | Common Stock in Treasury | Total Shareowners’ Equity | ||||||||||||||||||||||
(in millions) | Shares | Amount | |||||||||||||||||||||||||
Balance as of January 1, 2013 | 282 | $ | 3 | $ | 3,825 | $ | 1,126 | $ | (430 | ) | $ | (1,831 | ) | $ | 2,693 | ||||||||||||
Net income | — | — | — | 667 | — | — | 667 | ||||||||||||||||||||
Other adjustments, net | — | — | 1 | — | — | — | 1 | ||||||||||||||||||||
Shares issued under share-based compensation plans | 4 | — | 22 | — | — | — | 22 | ||||||||||||||||||||
Deferred compensation plans | — | — | 2 | — | — | — | 2 | ||||||||||||||||||||
Share-based compensation expense | — | — | 33 | — | — | — | 33 | ||||||||||||||||||||
Tax benefit from share-based compensation awards | — | — | 20 | — | — | — | 20 | ||||||||||||||||||||
Dividends declared | — | — | — | (216 | ) | — | — | (216 | ) | ||||||||||||||||||
Shares repurchased under our publicly announced share repurchase programs | (27 | ) | — | — | — | — | (1,006 | ) | (1,006 | ) | |||||||||||||||||
Shares withheld for taxes on share-based payment awards, net | (1 | ) | — | (4 | ) | — | — | (31 | ) | (35 | ) | ||||||||||||||||
Total other comprehensive income | — | — | — | — | 99 | — | 99 | ||||||||||||||||||||
Balance as of December 31, 2013 | 258 | 3 | 3,899 | 1,577 | (331 | ) | (2,868 | ) | 2,280 | ||||||||||||||||||
Net income | — | — | — | 663 | — | — | 663 | ||||||||||||||||||||
Other adjustments, net | — | — | 2 | — | — | — | 2 | ||||||||||||||||||||
Shares issued under share-based compensation plans | 2 | — | 16 | — | — | — | 16 | ||||||||||||||||||||
Deferred compensation plans | — | — | 2 | — | — | — | 2 | ||||||||||||||||||||
Share-based compensation expense | — | — | 28 | — | — | — | 28 | ||||||||||||||||||||
Tax benefit from share-based compensation awards | — | — | 15 | — | — | — | 15 | ||||||||||||||||||||
Dividends declared | — | — | — | (249 | ) | — | — | (249 | ) | ||||||||||||||||||
Shares repurchased under our publicly announced share repurchase programs | (20 | ) | — | — | — | — | (925 | ) | (925 | ) | |||||||||||||||||
Shares withheld for taxes on share-based payment awards, net | (1 | ) | — | (4 | ) | — | — | (14 | ) | (18 | ) | ||||||||||||||||
Total other comprehensive loss | — | — | — | — | (383 | ) | — | (383 | ) | ||||||||||||||||||
Balance as of December 31, 2014 | 239 | 3 | 3,958 | 1,991 | (714 | ) | (3,807 | ) | 1,431 | ||||||||||||||||||
Net income | — | — | — | 596 | — | — | 596 | ||||||||||||||||||||
Other adjustments, net | — | — | 4 | — | — | — | 4 | ||||||||||||||||||||
Shares issued under share-based compensation plans | 2 | 1 | 22 | — | — | — | 23 | ||||||||||||||||||||
Deferred compensation plans | — | — | 3 | — | — | — | 3 | ||||||||||||||||||||
Share-based compensation expense | — | — | 41 | — | — | — | 41 | ||||||||||||||||||||
Tax benefit from share-based compensation awards | — | — | 9 | — | — | — | 9 | ||||||||||||||||||||
Dividends declared | — | — | — | (258 | ) | — | — | (258 | ) | ||||||||||||||||||
Shares repurchased under our publicly announced share repurchase programs | (14 | ) | — | — | — | — | (600 | ) | (600 | ) | |||||||||||||||||
Shares withheld for taxes on share-based payment awards, net | — | — | (5 | ) | — | — | (4 | ) | (9 | ) | |||||||||||||||||
Total other comprehensive loss | — | — | — | — | (283 | ) | — | (283 | ) | ||||||||||||||||||
Balance as of December 31, 2015 | 227 | $ | 4 | $ | 4,032 | $ | 2,329 | $ | (997 | ) | $ | (4,411 | ) | $ | 957 | ||||||||||||
The accompanying Notes to Consolidated Financial Statements are an integral part of these statements.
51
Note 1
BUSINESS AND SUMMARY OF SIGNIFICANT ACCOUNTING POLICIES
Business
We are a marketer, producer, and distributor of nonalcoholic beverages. We market, produce, and distribute our products to customers and consumers through licensed territory agreements in Belgium, continental France, Great Britain, Luxembourg, Monaco, the Netherlands, Norway, and Sweden. We operate in the highly competitive beverage industry and face strong competition from other general and specialty beverage companies. Our financial results are affected by a number of factors, including, but not limited to, consumer preferences, cost to manufacture and distribute products, foreign currency exchange rates, general economic conditions, local and national laws and regulations, raw material availability, and weather patterns.
Sales of our products are seasonal, with the second and third quarters accounting for higher unit sales of our products than the first and fourth quarters. In a typical year, we earn more than 60 percent of our annual operating income during the second and third quarters. The seasonality of our sales volume, combined with the accounting for fixed costs such as depreciation, amortization, rent, and interest expense, impacts our results on a quarterly basis. Additionally, year-over-year shifts in holidays, selling days, and weather patterns can impact our results on an annual or quarterly basis.
Basis of Presentation and Consolidation
Our Consolidated Financial Statements include all entities that we control by ownership of a majority voting interest. All significant intercompany accounts and transactions are eliminated in consolidation.
Our fiscal year ends on December 31. For interim quarterly reporting convenience, our first three quarters close on the Friday closest to the end of the quarterly calendar period. There were the same number of selling days in 2015, 2014, and 2013 (based upon a standard five-day selling week).
The following table summarizes the number of selling days by quarter for the years ended December 31, 2015, 2014, and 2013 (based on a standard five-day selling week):
First Quarter | Second Quarter | Third Quarter | Fourth Quarter | Full Year | |||||
2015 | 67 | 65 | 65 | 64 | 261 | ||||
2014 | 63 | 65 | 65 | 68 | 261 | ||||
2013 | 64 | 65 | 65 | 67 | 261 | ||||
Use of Estimates
Our Consolidated Financial Statements and accompanying Notes are prepared in accordance with U.S. generally accepted accounting principles and include estimates and assumptions made by management that affect reported amounts. Actual results could differ materially from those estimates.
Net Sales
We recognize net sales when all of the following conditions are met: (1) evidence of a binding arrangement exists (generally, purchase orders); (2) products have been delivered and there is no future performance required; and (3) amounts are collectible under normal payment terms. For product sales, these conditions occur when the products are delivered to or picked up by our customers and, in the case of full-service vending, when cash is collected from vending machines. Revenue is stated net of sales discounts and marketing and promotional incentives paid to customers.
We record value added taxes (VAT) on a net basis (i.e., excluded from net sales) and record excise taxes and taxes on packaging on a gross basis (i.e., included in net sales). During 2015, 2014, and 2013, the total amount of taxes recorded on a gross basis approximated $471 million, $584 million, and $555 million, respectively.
52
Customer Marketing Programs and Sales Incentives
We participate in various programs and arrangements with customers designed to increase the sale of our products. Among these programs are arrangements under which allowances can be earned by customers for attaining agreed-upon sales levels or for participating in specific marketing programs. Coupon programs are also developed on a customer- and territory-specific basis with the intent of increasing sales. We believe our participation in these programs is essential to ensuring volume and revenue growth in a competitive marketplace. The costs of all these various programs, included as a reduction in net sales, totaled $1.1 billion in each of the years 2015, 2014, and 2013.
Under customer programs and arrangements that require sales incentives to be paid in advance, we amortize the amount paid over the period of benefit or contractual sales volume. When incentives are paid in arrears, we accrue the estimated amount to be paid based on the program’s contractual terms, expected customer performance, and/or estimated sales volume.
Licensor Support Arrangements
We participate in various funding programs supported by TCCC or other licensors whereby we receive funds from the licensors to support customer marketing programs or other arrangements that promote the sale of the licensors’ products. Under these programs, certain costs incurred by us are reimbursed by the applicable licensor. Payments from TCCC and other licensors for marketing programs and other similar arrangements to promote the sale of products are classified as a reduction in cost of sales, unless we can overcome the presumption that the payment is a reduction in the price of the licensor’s products. Payments for marketing programs are recognized as product is sold.
For additional information about our transactions with TCCC, refer to Note 4.
Shipping and Handling Costs
Shipping and handling costs related to the movement of finished goods from our manufacturing locations to our sales distribution centers are included in cost of sales on our Consolidated Statements of Income. Shipping and handling costs incurred to move finished goods from our sales distribution centers to customer locations are included in SD&A expenses on our Consolidated Statements of Income and totaled approximately $248 million, $301 million, and $275 million in 2015, 2014, and 2013, respectively. Our customers do not pay us separately for shipping and handling costs.
Share-Based Compensation
We recognize compensation expense equal to the grant-date fair value for all share-based payment awards that are expected to vest. This expense is recorded on a straight-line basis over the requisite service period of the entire award, unless the awards are subject to performance conditions, in which case we recognize compensation expense over the requisite service period of each separate vesting tranche. We recognize compensation expense for our performance share units when it becomes probable that the performance criteria specified in the plan will be achieved. All compensation expense related to our share-based payment awards is recorded in SD&A expenses. We determine the grant-date fair value of our share-based payment awards using a Black-Scholes model, unless the awards are subject to market conditions, in which case we use a binomial-lattice model (e.g., Monte Carlo simulation model). The Monte Carlo simulation model utilizes multiple input variables to estimate the probability that market conditions will be achieved. Refer to Note 12.
Earnings Per Share
We calculate our basic earnings per share by dividing net income by the weighted average number of shares and participating securities outstanding during the period. Our diluted earnings per share are calculated in a similar manner but include the effect of dilutive securities. To the extent these securities are antidilutive, they are excluded from the calculation of diluted earnings per share. Share-based payment awards that are contingently issuable upon the achievement of a specified market or performance condition are included in our diluted earnings per share calculation in the period in which the condition is satisfied. Refer to Note 13.
Cash and Cash Equivalents
Cash and cash equivalents include all highly liquid investments with maturity dates of less than three months when acquired. As of December 31, 2015, substantially all of our cash and cash equivalents were held by consolidated entities that are outside the U.S. Our disclosure of the cash and cash equivalents held by consolidated entities located outside the U.S. is not meant to imply the cash will be repatriated to the U.S. at a future date. Any future repatriation of foreign earnings to the U.S. will be based on actual U.S.-based cash flow needs and actual foreign entity cash available at the time of repatriation. We continually assess the counterparties and instruments we use to hold our cash and cash equivalents, with a focus on preservation of capital and liquidity.
53
Trade Accounts Receivable
We sell our products to retailers, wholesalers, and other customers and extend credit, generally without requiring collateral, based on our evaluation of the customer’s financial condition. While we have a concentration of credit risk in the retail sector, we believe this risk is mitigated due to the diverse nature of the customers we serve, including, but not limited to, their type, geographic location, size, and beverage channel. Collections of our receivables are dependent on each individual customer’s financial condition and sales adjustments granted after the balance sheet date. We carry our trade accounts receivable at net realizable value. Typically, accounts receivable have terms of 40 to 60 days and do not bear interest. We monitor our exposure to losses on receivables and maintain allowances for potential losses or adjustments. We determine these allowances by (1) evaluating the aging of our receivables; (2) analyzing our history of adjustments; and (3) reviewing our high-risk customers. Past due receivable balances are written off when our efforts have been unsuccessful in collecting the amount due. We also carry credit insurance on a portion of our accounts receivable balance.
The following table summarizes the change in our allowance for losses on trade accounts receivable for the periods presented (in millions):
Accounts Receivable Allowance | |||
Balance at January 1, 2013 | $ | 17 | |
Provision | 2 | ||
Write-offs | (3 | ) | |
Balance at December 31, 2013 | 16 | ||
Provision | 8 | ||
Write-offs | (5 | ) | |
Currency translation adjustments | (2 | ) | |
Balance at December 31, 2014 | 17 | ||
Provision | 1 | ||
Write-offs | (1 | ) | |
Currency translation adjustments | (1 | ) | |
Balance at December 31, 2015 | $ | 16 | |
Inventories
We value our inventories at the lower of cost or market, and cost is determined using the first-in, first-out (FIFO) method. Inventories consist of raw materials and supplies (primarily including concentrate, other ingredients, and packaging) and finished goods, which also include direct labor and indirect production and overhead costs. The following table summarizes our inventories as of the dates presented (in millions):
December 31, | |||||||
2015 | 2014 | ||||||
Finished goods | $ | 209 | $ | 238 | |||
Raw materials and supplies | 127 | 150 | |||||
Total inventories | $ | 336 | $ | 388 | |||
Property, Plant, and Equipment
Property, plant, and equipment is recorded at cost. Major property additions, replacements, and betterments are capitalized, while maintenance and repairs that do not extend the useful life of an asset or add new functionality are expensed as incurred. Depreciation is recorded using the straight-line method over the respective estimated useful lives of our assets. Our cold-drink equipment and containers, such as reusable crates, shells, and bottles, are depreciated using the straight-line method over the estimated useful life of each group of equipment, as determined using the group-life method. Under this method, we do not recognize gains or losses on the disposal of individual units of equipment when the disposal occurs in the normal course of business. We capitalize the costs of refurbishing our cold-drink equipment and depreciate those costs over the estimated period until the next scheduled refurbishment
54
or until the equipment is retired. Leasehold improvements are amortized using the straight-line method over the shorter of the remaining lease term or the estimated useful life of the improvement.
The following table summarizes the classification of depreciation and amortization expense in our Consolidated Statements of Income for the periods presented (in millions):
Location – Statements of Income | 2015 | 2014 | 2013 | |||||||||
Selling, delivery, and administrative expenses | $ | 163 | $ | 192 | $ | 190 | ||||||
Cost of sales | 111 | 117 | 118 | |||||||||
Total depreciation and amortization | $ | 274 | $ | 309 | $ | 308 | ||||||
Our interests in assets acquired under capital leases are included in property, plant, and equipment and primarily relate to buildings and fleet assets. Amortization of capital lease assets is included in depreciation expense. Our net interests in assets acquired under capital leases totaled $20 million as of December 31, 2015 (gross cost of $75 million, net of accumulated amortization of $55 million). The net present values of amounts due under capital leases are recorded as liabilities and are included within our total debt. Refer to Note 7.
We assess the recoverability of the carrying amount of our property, plant, and equipment when events or changes in circumstances indicate that the carrying amount of an asset or asset group may not be recoverable. If we determine that the carrying amount of an asset or asset group is not recoverable based upon the expected undiscounted future cash flows of the asset or asset group, we record an impairment loss equal to the excess of the carrying amount over the estimated fair value of the asset or asset group.
We capitalize certain development costs associated with internal use software, including external direct costs of materials and services and payroll costs for employees devoting time to a software project. As of December 31, 2015 and 2014, the net amount of unamortized capitalized software costs included on our Consolidated Balance Sheets was $68 million and $73 million, respectively. Costs incurred during the preliminary project stage, as well as costs for maintenance and training, are expensed as incurred.
The following table summarizes our property, plant, and equipment as of the dates presented (in millions):
December 31, | |||||||||
2015 | 2014 | Useful Life | |||||||
Land | $ | 131 | $ | 147 | n/a | ||||
Building and improvements | 894 | 961 | 20 to 40 years | ||||||
Machinery, equipment, and containers | 1,255 | 1,476 | 3 to 20 years | ||||||
Cold-drink equipment | 1,186 | 1,168 | 3 to 13 years | ||||||
Vehicle fleet | 66 | 91 | 3 to 20 years | ||||||
Furniture, office equipment, and software | 287 | 287 | 3 to 10 years | ||||||
Property, plant, and equipment | 3,819 | 4,130 | |||||||
Accumulated depreciation and amortization | (2,036 | ) | (2,162 | ) | |||||
1,783 | 1,968 | ||||||||
Construction in process | 137 | 133 | |||||||
Property, plant, and equipment, net | $ | 1,920 | $ | 2,101 | |||||
Taxes
We compute and report income taxes on a separate return basis and recognize deferred tax assets and liabilities for the expected future tax consequences of temporary differences between the financial statement carrying amounts and the tax bases of our assets and liabilities. We establish valuation allowances if we believe that it is more likely than not that some or all of our deferred tax assets will not be realized. We do not recognize a tax benefit unless we conclude that it is more likely than not that the benefit will be sustained on audit by the taxing authority based solely on the technical merits of the associated tax position. If the recognition threshold is met, we recognize a tax benefit measured at the largest amount of the tax benefit that, in our judgment, is greater than 50 percent likely to be realized. We record interest and penalties related to unrecognized tax positions in interest expense, net and other nonoperating expense, respectively, on our Consolidated Statements of Income. Refer to Note 11.
55
Other Comprehensive Income (Loss)
Comprehensive income (loss) is comprised of net income and other adjustments, including foreign currency translation adjustments, hedges of our net investments in our foreign subsidiaries, changes in the fair value of certain derivative financial instruments qualifying as cash flow hedges, and pension plan adjustments. We do not provide income taxes on currency translation adjustments (CTA), as the historical earnings from our foreign subsidiaries are considered to be indefinitely reinvested. If current year earnings are repatriated, the amount to be repatriated is determined in U.S. dollars and converted to the equivalent amount of foreign currency at the time of repatriation; therefore, the repatriation of current year earnings does not have an impact on the CTA component of our accumulated other comprehensive income (AOCI) balance.
The following table summarizes our AOCI as of the dates presented (after tax; in millions):
Currency Translations | Net Investment Hedges | Cash Flow Hedges(A) | Pension Plan Adjustments(B) | Total | ||||||||||||||||
Balance at January 1, 2014 | $ | 41 | $ | (54 | ) | $ | (7 | ) | $ | (311 | ) | $ | (331 | ) | ||||||
Other comprehensive income (loss) before reclassifications | (482 | ) | 166 | 34 | 20 | (262 | ) | |||||||||||||
Amounts reclassified from AOCI | — | — | (45 | ) | (76 | ) | (121 | ) | ||||||||||||
Net change in other comprehensive income | (482 | ) | 166 | (11 | ) | (56 | ) | (383 | ) | |||||||||||
Balance at December 31, 2014 | (441 | ) | 112 | (18 | ) | (367 | ) | (714 | ) | |||||||||||
Other comprehensive income (loss) before reclassifications | (337 | ) | 106 | (11 | ) | (85 | ) | (327 | ) | |||||||||||
Amounts reclassified from AOCI | — | — | 22 | 22 | 44 | |||||||||||||||
Net change in other comprehensive income (loss) | (337 | ) | 106 | 11 | (63 | ) | (283 | ) | ||||||||||||
Balance at December 31, 2015 | $ | (778 | ) | $ | 218 | $ | (7 | ) | $ | (430 | ) | $ | (997 | ) | ||||||
___________________________
(A) | For additional information about our cash flow hedges, refer to Note 6. |
(B) | For additional information about our pension plans, refer to Note 10. |
Foreign Currency Translation
The assets and liabilities of our operations are translated from local currencies into our reporting currency, the U.S. dollar, at currency exchange rates in effect at the end of each reporting period. Gains and losses from the translation of our results are included in AOCI on our Consolidated Balance Sheets. Revenues and expenses are translated at average monthly currency exchange rates. Gains and losses arising from currency exchange rate fluctuations on transactions denominated in a currency other than the local functional currency are included in other nonoperating expense on our Consolidated Statements of Income.
Fair Value Measurements
The fair values of our cash and cash equivalents, accounts receivable, and accounts payable approximate their carrying amounts due to their short-term nature. The fair values of our debt instruments are estimated based on debt with similar maturities and credit quality and current market interest rates (refer to Note 7). The estimated fair values of our derivative instruments are calculated based on market rates to settle the instruments. These values represent the estimated amounts we would receive upon sale or pay upon transfer, taking into consideration current market rates and credit risk.
56
The following tables summarize our assets and liabilities recorded at fair value on a recurring basis (at least annually) as of the dates presented (in millions):
December 31, 2015 | Quoted Prices in Active Markets for Identical Assets (Level 1) | Significant Other Observable Inputs (Level 2) | Significant Unobservable Inputs (Level 3) | ||||||||||||
Derivative assets(A) | $ | 47 | $ | — | $ | 47 | $ | — | |||||||
Pension plan assets(B) | 1,487 | 275 | 1,198 | 14 | |||||||||||
Total assets | $ | 1,534 | $ | 275 | $ | 1,245 | $ | 14 | |||||||
Derivative liabilities(A) | $ | 75 | $ | — | $ | 75 | $ | — | |||||||
December 31, 2014 | Quoted Prices in Active Markets for Identical Assets (Level 1) | Significant Other Observable Inputs (Level 2) | Significant Unobservable Inputs (Level 3) | ||||||||||||
Derivative assets(A) | $ | 85 | $ | — | $ | 85 | $ | — | |||||||
Pension plan assets(B) | 1,530 | 290 | 1,185 | 55 | |||||||||||
Total assets | $ | 1,615 | $ | 290 | $ | 1,270 | $ | 55 | |||||||
Derivative liabilities(A) | $ | 76 | $ | — | $ | 76 | $ | — | |||||||
___________________________
(A) | We calculate derivative asset and liability amounts using a variety of valuation techniques, depending on the specific characteristics of the hedging instrument, taking into account credit risk. The fair value of our derivative contracts (including forwards, options, cross-currency swaps, and interest rate swaps) is determined using standard valuation models. The significant inputs used in these models are readily available in public markets or can be derived from observable market transactions and, therefore, our derivative contracts have been classified as Level 2. Inputs used in these standard valuation models include the applicable spot, forward, and discount rates. The standard valuation model for our option contracts also includes implied volatility, which is specific to individual options and is based on rates quoted from a widely used third-party resource. |
(B) | For additional information about our pension plan assets, including the determination of fair value, refer to Note 10. |
Derivative Financial Instruments
We utilize derivative financial instruments to mitigate our exposure to certain market risks associated with our ongoing operations. The primary risks that we seek to manage through the use of derivative financial instruments include currency exchange risk, commodity price risk, and interest rate risk. All derivative financial instruments are recorded at fair value on our Consolidated Balance Sheets. We do not use derivative financial instruments for trading or speculative purposes. While certain of our derivative instruments are designated as hedging instruments, we also enter into derivative instruments that are designed to hedge a risk, but are not designated as hedging instruments (referred to as an “economic hedge” or “non-designated hedges”). Changes in the fair value of these non-designated hedging instruments are recognized in the expense line item on our Consolidated Statements of Income that is consistent with the nature of the hedged risk. We are exposed to counterparty credit risk on all of our derivative financial instruments. We have established and maintain strict counterparty credit guidelines and enter into hedges only with financial institutions that are investment grade or better. We continuously monitor counterparty credit risk and utilize numerous counterparties to minimize our exposure to potential defaults. We do not require collateral under these agreements. Refer to Note 6.
Note 2
MERGER AGREEMENT
On August 6, 2015, we entered into agreements with TCCC, CCIP, the privately-owned Coca-Cola bottler operating primarily in Spain and Portugal, and CCEAG, the wholly-owned TCCC bottler operating in Germany, under which:
• | The parties agreed to combine their respective businesses by combining CCE, CCIP, and CCEAG. The combination (the Merger) will be effected through the contribution of CCIP and CCEAG to a newly created entity, Coca-Cola European Partners, plc (CCEP), and the merger of CCE with and into a newly formed indirect U.S. subsidiary of CCEP (MergeCo), with MergeCo continuing as the surviving entity. Upon completion of the Merger, CCEP will consist of businesses |
57
involved in the marketing, production, and distribution of beverages in Andorra, Belgium, France, Germany, Great Britain, Iceland, Luxembourg, Monaco, the Netherlands, Norway, Portugal, Spain, and Sweden.
• | At the effective time of the Merger, each outstanding share of common stock of CCE will be converted into the right to receive one ordinary share of CCEP and a cash payment of $14.50. At closing, on a fully diluted basis CCIP and TCCC will own 34 percent and 18 percent of CCEP, respectively, with CCE shareowners owning 48 percent. |
• | Following the Merger, CCEP will directly and indirectly wholly-own all contributed assets and liabilities of CCE, CCIP, and CCEAG. |
• | At the time of the Merger, CCEP's ordinary shares are expected to be listed for trading on the New York Stock Exchange, Euronext Amsterdam Stock Exchange, Euronext London Stock Exchange, and Madrid Stock Exchange. |
The consummation of the Merger is subject to various conditions including, among others, obtaining the approval of at least a majority of CCE’s shareholders, the availability of cash in an amount sufficient to pay the cash payment for the Merger, the New York Stock Exchange approving the listing of shares of CCEP, the shares of CCEP being admitted to listing and trading on the Euronext Amsterdam Stock Exchange, the approval by the UK Financial Conduct Authority of CCEP’s prospectus complying with the European prospectus directive, the filing and effectiveness of CCEP’s registration statement on Form F-4, the receipt by CCE, TCCC and CCIP of certain tax opinions, the absence of legal prohibitions and the receipt of requisite regulatory approvals, the absence of pending actions by any governmental entity that would prevent the consummation of the Merger, and TCCC having executed new bottling agreements for CCEP having an initial 10-year term with a 10-year renewal term and, except as otherwise agreed, containing other terms materially similar to those currently in effect at CCE, CCIP, and CCEAG. Each party's obligation to close is further subject to there being no material adverse breach by the other parties. The obligations of the parties to close is further conditioned on the completion of a capital restructuring of CCIP and obtaining the approval of 80 percent of shareholders of CCIP in favor of the Merger. The CCIP capital restructuring and shareholder approval were fulfilled on November 11, 2015. Each of the parties has generally agreed to use all reasonable endeavors to take such steps to satisfy the remaining conditions. If the conditions to the completion are not satisfied by August 6, 2016, any conditions become impossible to be satisfied by such date, or any breach of other covenants or warranties occurs that would result in a material adverse effect in respect of the breaching party and such breach cannot be cured before August 6, 2016, or, if curable, is not cured within 30 days following the delivery of a written notice, then the Merger may be terminated.
The agreements set out certain covenants the parties must comply with prior to completion, including carrying out the agreed transaction steps, the consummation of the CCIP capital restructuring, and the removal of certain assets and liabilities from CCIP that are not being transferred to CCEP. The parties have agreed to cooperate in making employee notifications, competition approvals, securities laws filings and listing applications, and obtaining financing. The parties have agreed to use their reasonable endeavors to negotiate and agree on CCEP’s new bottling agreements, an initial business plan, and a long-range business plan.
The parties have also agreed to cause CCIP and CCEP and its subsidiaries to enter into a share purchase agreement substantially simultaneously with, but prior to, the Merger, on terms satisfactory to the parties, with Cobega S.A. and Solinbar, S.L.U. in respect of the sale of Vifilfell hf. (the entity that owns the Coca-Cola bottling business in Iceland) for aggregate consideration of no more than €35 million.
The agreements contain customary warranties of the parties regarding their respective businesses. The warranties of CCE, CCIP, CCEAG, and an entity to be established for the purposes of holding CCIP will survive for three months after the date that CCEP files its December 31, 2016 Form 20-F with the SEC. In the event of a breach of one or more warranties that results in an indemnification claim amount against a particular company for more than $400 million, the relative equity ownership percentages of CCEP will be adjusted by issuing additional shares to increase the ownership of the non-breaching parties to reflect the indemnification claim amount, not to exceed $450 million.
The agreements contain specified termination rights. The agreements can be terminated if the parties fail to perform their representations, warranties, covenants or agreements, if any court of competent jurisdiction or any governmental authority issues an order, decree or ruling or takes any other action permanently enjoining, restraining or otherwise prohibiting the consummation of the transactions or if the CCE Board of Directors withdraws, modifies, or qualifies its recommendation to shareholders regarding the adoption of the merger agreements. Upon termination under specified circumstances, including upon a termination resulting from a change in the CCE Board of Directors recommendation to shareholders, CCE would be required to pay CCEP a termination fee of $450 million.
During the year ended December 31, 2015, we incurred expenses totaling $45 million related to the Merger and expect to incur total Merger expenses of approximately $140 million through its consummation. These expenses are included in SD&A expenses on our Consolidated Statements of Income.
58
CCE has been named in three lawsuits related to the Merger. For additional information about these lawsuits, refer to Item 3. Legal Proceedings in this report. CCEP and/or its subsidiaries intend to finance the cash payment in the Merger primarily using debt financing in either the public or private markets. CCEP expects to have financing in place during the second quarter of 2016.
Note 3
FRANCHISE LICENSE INTANGIBLE ASSETS AND GOODWILL
The following table summarizes the changes in our net franchise license intangible assets and goodwill for the periods presented (in millions):
Franchise License Intangible Assets, net | Goodwill | ||||||
Balance as of January 1, 2013 | $ | 3,923 | $ | 132 | |||
Currency translation adjustments | 81 | (8 | ) | ||||
Balance as of December 31, 2013 | 4,004 | 124 | |||||
Currency translation adjustments | (363 | ) | (23 | ) | |||
Balance as of December 31, 2014 | 3,641 | 101 | |||||
Currency translation adjustments | (258 | ) | (13 | ) | |||
Balance as of December 31, 2015 | $ | 3,383 | $ | 88 | |||
Our franchise license agreements contain performance requirements and convey to us the rights to distribute and sell products of the licensor within specified territories. Our license agreements with TCCC for each of our territories have terms of 10 years and expire on October 2, 2020, with each containing the right for us to request a 10-year renewal. While these agreements contain no automatic right of renewal beyond that date, we believe that our interdependent relationship with TCCC and the substantial cost and disruption to TCCC that would be caused by nonrenewals ensure that these agreements will continue to be renewed and, therefore, are essentially perpetual. We have never had a franchise license agreement with TCCC terminated due to nonperformance of the terms of the agreement or due to a decision by TCCC to terminate an agreement at the expiration of a term. After evaluating the contractual provisions of our franchise license agreements, our mutually beneficial relationship with TCCC, and our history of renewals, we have assigned indefinite lives to all of our franchise license intangible assets.
We do not amortize our franchise license intangible assets and goodwill. Instead, we test these assets for impairment annually, or more frequently if events or circumstances indicate they may be impaired. We performed our 2015, 2014, and 2013 annual impairment tests of our franchise license intangible assets and goodwill as of the last reporting day of October of each respective year. The results of the qualitative impairment assessment of these assets indicated it was not more likely than not that the estimated fair value of these assets was less than their respective carrying values at each testing date. As a result, no impairment charges were recorded.
Note 4
RELATED PARTY TRANSACTIONS
Transactions with TCCC
We are a marketer, producer, and distributor principally of products of TCCC, with greater than 90 percent of our sales volume consisting of sales of TCCC products. Our license arrangements with TCCC are governed by product licensing agreements. From time to time, the terms and conditions of programs with TCCC are modified.
We have license agreements with TCCC for each of our territories that extend through October 2, 2020, with terms of 10 years, with each containing the right for us to request a 10-year renewal.
59
The following table summarizes the transactions with TCCC that directly impacted our Consolidated Statements of Income for the periods presented (in millions):
2015 | 2014 | 2013 | |||||||||
Amounts affecting net sales: | |||||||||||
Fountain syrup and packaged product sales | $ | 15 | $ | 18 | $ | 17 | |||||
Amounts affecting cost of sales: | |||||||||||
Purchases of concentrate, syrup, mineral water, and juice | $ | (1,972 | ) | $ | (2,324 | ) | $ | (2,319 | ) | ||
Purchases of finished products | (40 | ) | (50 | ) | (52 | ) | |||||
Marketing support funding earned | 201 | 223 | 209 | ||||||||
Total | $ | (1,811 | ) | $ | (2,151 | ) | $ | (2,162 | ) | ||
Fountain Syrup and Packaged Product Sales
On behalf of TCCC, we act as a billing and delivery agent in certain territories for fountain customers and receive distribution fees from TCCC for those sales. We invoice and collect amounts receivable for these fountain syrup sales on behalf of TCCC.
Purchases of Concentrate, Syrup, Mineral Water, Juice, and Finished Products
We purchase concentrate, syrup, mineral water, and juice from TCCC to produce, package, distribute, and sell TCCC’s products under product licensing agreements. We also purchase finished products from TCCC for sale within certain territories. The product licensing agreements give TCCC complete discretion to set prices of concentrate and finished products. Pricing of mineral water is also based on contractual arrangements with TCCC.
Marketing Support Funding Earned
We and TCCC engage in a variety of marketing programs to promote the sale of TCCC products in territories in which we operate. The amounts to be paid to us by TCCC under the programs are generally determined annually and are periodically reassessed as the programs progress. Under the licensing agreements, TCCC is under no obligation to participate in the programs or continue past levels of funding in the future. The amounts paid and terms of similar programs with other licensees may differ. Marketing support funding programs granted to us provide financial support principally based on product sales or upon the completion of stated requirements and are intended to offset a portion of the costs of the programs.
We and TCCC reached an understanding on a new incidence-based concentrate pricing model and funding program effective on January 1, 2016. The term of this new understanding is tied to the term of our bottling agreements, which expire on October 2, 2020. If our bottling agreements are terminated due to the closing of the proposed Merger, this understanding will continue until the commencement of a new incidence pricing agreement between TCCC and CCEP. Under the new funding program, the $45 million GMF, which terminated December 31, 2015, has been replaced by the integration of $20 million into the incidence rate and annual payments of $25 million from TCCC to us to support the execution of commercial strategies focused on capturing growth opportunities. This $25 million funding will be paid in two equal installments each year.
Other Transactions
Other transactions with TCCC include certain tax services, management fees, office space leases, and purchases of point-of-sale and other advertising items, all of which were not material to our Consolidated Financial Statements.
Cold-Drink Equipment Placement Programs
We and TCCC are parties to the Cold-Drink Equipment Purchase Partnership Programs (Jumpstart Programs). The Jumpstart Programs were designed to promote the purchase and placement of cold-drink equipment. By the end of 2007, we had met our obligations to purchase and place cold-drink equipment (principally vending machines and coolers). Under the Jumpstart Programs, as amended, we agree to:
• | Maintain the equipment in service, with certain exceptions, for a minimum period of 12 years after placement; |
• | Maintain and stock the equipment in accordance with specified standards for marketing TCCC products; |
• | Report annually to TCCC during the period the equipment is in service whether or not, on average, the equipment purchased has generated a contractually stated minimum sales volume of TCCC products (throughput); and |
60
• | Relocate equipment if the previously placed equipment is not generating sufficient sales volume of TCCC products to meet the minimum throughput requirements. Movement of the equipment is required only if it is determined that, on average, sufficient volume is not being generated, and it would help to ensure our performance under the Jumpstart Programs. |
Historically, our throughput on equipment placed under the Jumpstart Programs has exceeded the throughput requirements of the Jumpstart Programs, and material movements of equipment have not been required.
Note 5
ACCOUNTS PAYABLE AND ACCRUED EXPENSES
The following table summarizes our accounts payable and accrued expenses as of the dates presented (in millions):
December 31, | |||||||
2015 | 2014 | ||||||
Trade accounts payable | $ | 486 | $ | 537 | |||
Accrued customer marketing costs | 508 | 656 | |||||
Accrued compensation and benefits | 213 | 257 | |||||
Accrued taxes | 162 | 172 | |||||
Accrued deposits | 51 | 60 | |||||
Other accrued expenses | 181 | 190 | |||||
Accounts payable and accrued expenses | $ | 1,601 | $ | 1,872 | |||
61
Note 6
DERIVATIVE FINANCIAL INSTRUMENTS
The following table summarizes the fair value of our assets and liabilities related to derivative financial instruments and the respective line items in which they were recorded in our Consolidated Balance Sheets as of the dates presented (in millions):
December 31, | ||||||||||
Hedging Instruments | Location – Balance Sheets | 2015 | 2014 | |||||||
Assets: | ||||||||||
Derivatives designated as hedging instruments: | ||||||||||
Foreign currency contracts(A) | Other current assets | $ | 20 | $ | 58 | |||||
Foreign currency contracts | Other noncurrent assets | 17 | — | |||||||
Total | 37 | 58 | ||||||||
Derivatives not designated as hedging instruments: | ||||||||||
Foreign currency contracts | Other current assets | 2 | 24 | |||||||
Commodity contracts | Other current assets | 1 | 3 | |||||||
Foreign currency contracts | Other noncurrent assets | 7 | — | |||||||
Total | 10 | 27 | ||||||||
Total Assets | $ | 47 | $ | 85 | ||||||
Liabilities: | ||||||||||
Derivatives designated as hedging instruments: | ||||||||||
Foreign currency contracts(A) | Accounts payable and accrued expenses | $ | 28 | $ | 29 | |||||
Foreign currency contracts | Other noncurrent liabilities | 2 | 12 | |||||||
Total | 30 | 41 | ||||||||
Derivatives not designated as hedging instruments: | ||||||||||
Foreign currency contracts | Accounts payable and accrued expenses | — | 22 | |||||||
Commodity contracts | Accounts payable and accrued expenses | 24 | 8 | |||||||
Foreign currency contracts | Other noncurrent liabilities | 7 | — | |||||||
Commodity contracts | Other noncurrent liabilities | 14 | 5 | |||||||
Total | 45 | 35 | ||||||||
Total Liabilities | $ | 75 | $ | 76 | ||||||
___________________________
(A) | Amounts include the gross interest receivable or payable on our cross-currency swap agreements. |
Cash Flow Hedges
We use cash flow hedges to mitigate our exposure to changes in cash flows attributable to currency fluctuations associated with certain forecasted transactions, including purchases of raw materials and services denominated in non-functional currencies, the receipt of interest and principal on intercompany loans denominated in non-functional currencies, and the payment of interest and principal on debt issuances in a non-functional currency. Effective changes in the fair value of these cash flow hedging instruments are recognized in AOCI on our Consolidated Balance Sheets. The effective changes are then recognized in the period that the forecasted purchases or payments impact earnings in the expense line item on our Consolidated Statements of Income that is consistent with the nature of the underlying hedged item. Any changes in the fair value of these cash flow hedges that are the result of ineffectiveness are recognized immediately in the expense line item on our Consolidated Statements of Income that is consistent with the nature of the underlying hedged item. During the third quarter of 2015, we received $56 million upon maturity of certain of our cross-currency swaps related to intercompany loans.
62
The following table summarizes our outstanding cash flow hedges as of the dates presented (all contracts denominated in a foreign currency have been converted into U.S. dollars using the period end spot rate):
December 31, 2015 | December 31, 2014 | |||||||
Type | Notional Amount | Latest Maturity | Notional Amount | Latest Maturity | ||||
Foreign currency contracts | USD 700 million | June 2021 | USD 1.3 billion | June 2021 | ||||
The following tables summarize the net of tax effect of our derivative financial instruments designated as cash flow hedges on our AOCI and Consolidated Statements of Income for the periods presented (in millions):
Amount of Gain (Loss) Recognized in AOCI on Derivative Instruments(A) | ||||||||||||
Cash Flow Hedging Instruments | 2015 | 2014 | 2013 | |||||||||
Foreign currency contracts | $ | (11 | ) | $ | 34 | $ | (6 | ) | ||||
Amount of Gain (Loss) Reclassified from AOCI into Earnings(B) | ||||||||||||||
Cash Flow Hedging Instruments | Location – Statements of Income | 2015 | 2014 | 2013 | ||||||||||
Foreign currency contracts | Cost of sales | $ | (14 | ) | $ | 1 | $ | 2 | ||||||
Foreign currency contracts | Selling, delivery, and administrative expenses | (1 | ) | — | — | |||||||||
Foreign currency contracts(C) | Other nonoperating expense | (7 | ) | 44 | (23 | ) | ||||||||
Total | $ | (22 | ) | $ | 45 | $ | (21 | ) | ||||||
___________________________
(A) | The amount of ineffectiveness associated with these hedges was not material. |
(B) | Over the next 12 months, deferred losses totaling $4 million are expected to be reclassified from AOCI as the forecasted transactions occur. The amounts will be recorded on our Consolidated Statements of Income in the expense line item that is consistent with the nature of the underlying hedged item. |
(C) | The gain (loss) recognized on these currency contracts is offset by the gain (loss) recognized on the remeasurement of the underlying debt instruments; therefore, there is a minimal consolidated net effect in other nonoperating expense on our Consolidated Statements of Income. |
Economic (Non-designated) Hedges
We periodically enter into derivative instruments that are designed to hedge various risks but are not designated as hedging instruments. These hedged risks include those related to commodity price fluctuations associated with forecasted purchases of aluminum, sugar, components of PET (plastic), and vehicle fuel. At times, we also enter into other short-term non-designated hedges to mitigate our exposure to changes in cash flows attributable to currency fluctuations associated with short-term intercompany loans and certain cash equivalents denominated in non-functional currencies. Changes in the fair value of outstanding economic hedges are recognized each reporting period in the expense line item on our Consolidated Statements of Income that is consistent with the nature of the hedged risk.
The following table summarizes our outstanding economic hedges as of the dates presented (all contracts denominated in a foreign currency have been converted into U.S. dollars using the period end spot rate):
December 31, 2015 | December 31, 2014 | |||||||
Type | Notional Amount | Latest Maturity | Notional Amount | Latest Maturity | ||||
Foreign currency contracts | USD 210 million | March 2016 | USD 222 million | July 2015 | ||||
Commodity contracts | USD 137 million | December 2020 | USD 125 million | December 2017 | ||||
63
The following table summarizes the gains (losses) recognized from our non-designated derivative financial instruments on our Consolidated Statements of Income for the periods presented (in millions):
Non-Designated Hedging Instruments | Location – Statements of Income | 2015 | 2014 | 2013 | ||||||||||
Commodity contracts | Cost of sales | $ | (22 | ) | $ | 2 | $ | (22 | ) | |||||
Commodity contracts | Selling, delivery, and administrative expenses | (16 | ) | (13 | ) | 1 | ||||||||
Foreign currency contracts | Other nonoperating expense(A) | (5 | ) | 11 | (1 | ) | ||||||||
Total | $ | (43 | ) | $ | — | $ | (22 | ) | ||||||
___________________________
(A) | The gain (loss) recognized on these currency contracts is offset by the (loss) gain recognized on the remeasurement of the underlying hedged items; therefore, there is a minimal consolidated net effect in other nonoperating expense on our Consolidated Statements of Income. |
Mark-to-market gains (losses) related to our non-designated commodity hedges are recognized in the earnings of our Corporate segment until such time as the underlying hedged transaction affects the earnings of our Europe operating segment. In the period the underlying hedged transaction occurs, the accumulated mark-to-market gains (losses) related to the hedged transaction are reclassified from the earnings of our Corporate segment into the earnings of our Europe operating segment. This treatment allows our Europe operating segment to reflect the true economic effects of the underlying hedged transaction in the period the hedged transaction occurs without experiencing the mark-to-market volatility associated with these non-designated commodity hedges.
As of December 31, 2015, our Corporate segment included net mark-to-market losses on non-designated commodity hedges totaling $38 million. These amounts will be reclassified into the earnings of our Europe operating segment when the underlying hedged transaction occurs. For additional information about our segment reporting, refer to Note 14.
The following table summarizes the deferred gain (loss) activity in our Corporate segment for the periods presented (in millions):
Gains (Losses) Deferred at Corporate Segment(A) | Cost of Sales | SD&A | Total | |||||||||
Balance at January 1, 2013 | $ | (5 | ) | $ | — | $ | (5 | ) | ||||
Amounts recognized during the period and recorded in our Corporate segment, net | (19 | ) | 1 | (18 | ) | |||||||
Amounts transferred from our Corporate segment to our Europe operating segment, net | 12 | (1 | ) | 11 | ||||||||
Balance as of December 31, 2013 | (12 | ) | — | (12 | ) | |||||||
Amounts recognized during the period and recorded in our Corporate segment, net | 2 | (12 | ) | (10 | ) | |||||||
Amounts transferred from our Corporate segment to our Europe operating segment, net | 11 | 1 | 12 | |||||||||
Balance as of December 31, 2014 | 1 | (11 | ) | (10 | ) | |||||||
Amounts recognized during the period and recorded in our Corporate segment, net | (21 | ) | (16 | ) | (37 | ) | ||||||
Amounts transferred from our Corporate segment to our Europe operating segment, net | 2 | 7 | 9 | |||||||||
Balance as of December 31, 2015 | $ | (18 | ) | $ | (20 | ) | $ | (38 | ) | |||
___________________________
(A) | Over the next 12 months, deferred losses totaling $24 million are expected to be reclassified from our Corporate segment earnings into the earnings of our Europe operating segment as the underlying hedged transactions occur. |
64
Net Investment Hedges
We have entered into foreign currency forwards, options, and foreign currency denominated borrowings designated as net investment hedges of our foreign subsidiaries. Changes in the fair value of these hedges resulting from currency exchange rate changes are recognized in AOCI on our Consolidated Balance Sheets to offset the change in the carrying value of the net investment being hedged. Any changes in the fair value of these hedges that are the result of ineffectiveness are recognized immediately in other nonoperating expense on our Consolidated Statements of Income. During 2015 we received $32 million upon maturity of our 2015 net investment hedges and during 2014 we settled our net investment hedges prior to their maturity and received $21 million upon settlement.
The following table summarizes our outstanding instruments designated as net investment hedges as of the dates presented:
December 31, 2015 | December 31, 2014 | |||||||
Type | Notional Amount | Latest Maturity | Notional Amount | Latest Maturity | ||||
Foreign currency contracts | USD 1.7 billion | August 2016 | USD 250 million | November 2015 | ||||
Foreign currency denominated debt | USD 2.0 billion | March 2030 | USD 1.6 billion | May 2026 | ||||
The following table summarizes the net of tax effect of our derivative financial instruments designated as net investment hedges on our AOCI for the periods presented (in millions):
Amount of Gain (Loss) Recognized in AOCI on Derivative Instruments(A) | ||||||||||||
Net Investment Hedging Instruments | 2015 | 2014 | 2013 | |||||||||
Foreign currency contracts | $ | 12 | $ | 25 | $ | (7 | ) | |||||
Foreign currency denominated debt | 94 | 141 | (33 | ) | ||||||||
Total | $ | 106 | $ | 166 | $ | (40 | ) | |||||
___________________________
(A) | The amount of ineffectiveness associated with these hedging instruments was not material. |
Note 7
DEBT AND CAPITAL LEASES
The following table summarizes our debt as of the dates presented (in millions, except rates):
December 31, 2015 | December 31, 2014 | ||||||||||||
Principal Balance | Rates(A) | Principal Balance | Rates(A) | ||||||||||
U.S. dollar commercial paper | $ | 198 | 0.6 | % | $ | 146 | 0.5 | % | |||||
U.S. dollar notes due 2016-2021(B) | 1,319 | 3.4 | 1,793 | 3.1 | |||||||||
Euro notes due 2017-2030(C) | 2,327 | 2.4 | 1,987 | 2.6 | |||||||||
Capital lease obligations(D) | 17 | n/a | 26 | n/a | |||||||||
Total debt(E) | 3,861 | 3,952 | |||||||||||
Current portion of debt | (454 | ) | (632 | ) | |||||||||
Debt, less current portion | $ | 3,407 | $ | 3,320 | |||||||||
___________________________
(A) | These rates represent the weighted average interest rates or effective interest rates on the balances outstanding, as adjusted for the effects of interest rate swap agreements, if applicable. |
(B) | In September 2015, $475 million, 2.1 percent notes matured and were paid in full. |
(C) | In March 2015, we issued €500 million, 1.9 percent notes due 2030. |
(D) | These amounts represent the present value of our minimum capital lease obligations. |
(E) | The total fair value of our outstanding debt, excluding capital lease obligations, was $3.9 billion and $4.2 billion at December 31, 2015 and December 31, 2014, respectively. The fair value of our debt is estimated using quoted market prices for publicly traded instruments (Level 1). |
65
Future Maturities
The following table summarizes our debt maturities and capital lease obligations as of December 31, 2015 (in millions):
Years Ending December 31, | Debt Maturities | |||
2016 | $ | 448 | ||
2017 | 380 | |||
2018 | — | |||
2019 | 378 | |||
2020 | 523 | |||
Thereafter | 2,115 | |||
Debt, excluding capital leases | $ | 3,844 | ||
Years Ending December 31, | Capital Lease Obligations | |||
2016 | $ | 6 | ||
2017 | 5 | |||
2018 | 4 | |||
2019 | 2 | |||
2020 | 1 | |||
Thereafter | 1 | |||
Total minimum lease payments | 19 | |||
Amounts representing interest | (2 | ) | ||
Present value of minimum lease payments | 17 | |||
Total debt | $ | 3,861 | ||
Credit Facilities
We have amounts available to us for borrowing under a $1.0 billion multi-currency credit facility with a syndicate of eight banks. This credit facility matures in 2017 and is for general corporate purposes, including serving as a backstop to our commercial paper program and supporting our working capital needs. At December 31, 2015, we had no amount drawn under this credit facility. Based on information currently available to us, we have no indication that the financial institutions participating in this facility would be unable to fulfill their commitments to us as of the date of the filing of this report.
Covenants
Our credit facility and outstanding notes contain various provisions that, among other things, require us to limit the incurrence of certain liens or encumbrances in excess of defined amounts. Additionally, our credit facility requires that we meet a minimum interest coverage ratio. We were in compliance with these requirements as of December 31, 2015. These requirements currently are not, nor is it anticipated that they will become, restrictive to our liquidity or capital resources.
Note 8
OPERATING LEASES
We lease land, office and warehouse space, computer hardware, machinery and equipment, and vehicles under noncancelable operating lease agreements expiring at various dates through 2027. Some lease agreements contain standard renewal provisions that allow us to renew the lease at rates equivalent to fair market value at the end of the lease term. Under lease agreements that contain escalating rent provisions, lease expense is recorded on a straight-line basis over the lease term. Under lease agreements that contain rent holidays, rent expense is recorded on a straight-line basis over the entire lease term, including the period covered by the rent holiday. Rent expense under noncancelable operating lease agreements totaled $69 million, $86 million, and $89 million during 2015, 2014, and 2013, respectively.
66
The following table summarizes our minimum lease payments under noncancelable operating leases with initial or remaining lease terms in excess of one year as of December 31, 2015 (in millions):
Years Ending December 31, | Operating Leases | |||
2016 | $ | 54 | ||
2017 | 43 | |||
2018 | 31 | |||
2019 | 21 | |||
2020 | 19 | |||
Thereafter | 63 | |||
Total minimum operating lease payments(A) | $ | 231 | ||
___________________________
(A) | Income associated with sublease arrangements is not significant. |
Note 9
COMMITMENTS AND CONTINGENCIES
Purchase Commitments
We have noncancelable purchase agreements with various suppliers that specify a fixed or minimum quantity that we must purchase. All purchases made under these agreements are subject to standard quality and performance criteria. The following table summarizes our purchase commitments as of December 31, 2015 (in millions):
Years Ending December 31, | Purchase Commitments(A) | |||
2016 | $ | 73 | ||
2017 | 60 | |||
2018 | 53 | |||
2019 | 29 | |||
2020 | 26 | |||
Thereafter | — | |||
Total purchase commitments | $ | 241 | ||
___________________________
(A) | These commitments do not include amounts related to supply agreements that require us to purchase a certain percentage of our future raw material needs from a specific supplier, since such agreements do not specify a fixed or minimum quantity. |
Legal Contingencies
In connection with the agreements entered into between us, TCCC, CCIP, and CCEAG on August 6, 2015, three putative class action lawsuits were filed in Delaware Chancery Court between the announcement date and the present. The lawsuits are similar and assert claims on behalf of our shareholders for various alleged breaches of fiduciary duty in connection with the Merger. The lawsuits name us, our Board of Directors, CCIP, CCEAG, CCEP, and TCCC as defendants. Plaintiffs in each case seek to enjoin the transaction, to rescind the Merger if it is consummated and allow termination damages, and to recover other damages, attorneys’ fees, and litigation expenses. By consent order dated January 7, 2016, the court consolidated these cases. We believe this matter to be without merit and intend to defend it vigorously. For additional information about the Merger between us, TCCC, CCIP, and CCEAG, refer to Note 2.
Tax Audits
Our tax filings for various periods in the jurisdictions in which we do business may be subjected to audit by the relevant tax authorities. These audits may result in assessments of additional taxes that are subsequently resolved with the authorities or potentially through the courts. We believe that we have adequately provided for any assessments that could result from those proceedings where it is more likely than not that we will pay some amount.
67
Workforce (Unaudited)
At December 31, 2015, we had approximately 11,500 employees, of which approximately 150 were located in the U.S. A majority of our employees in Europe are covered by collectively bargained labor agreements, most of which do not expire. However, wage rates must be renegotiated at various dates through 2017. We believe that we will be able to renegotiate wage rates with satisfactory terms.
Indemnifications
In the normal course of business, we enter into agreements that provide general indemnifications. We have not made significant indemnification payments under such agreements in the past, and we believe the likelihood of incurring such a payment obligation in the future is remote. Furthermore, we cannot reasonably estimate future potential payment obligations because we cannot predict when and under what circumstances they may be incurred. As a result, we have not recorded a liability in our Consolidated Financial Statements with respect to these general indemnifications.
Note 10
EMPLOYEE BENEFIT PLANS
Pension Plans
We sponsor a number of defined benefit pension plans covering the majority of our non-U.S. employees. All pension plans are measured as of December 31.
Net Periodic Benefit Costs
The following table summarizes the net periodic benefit cost of our pension plans for the periods presented (in millions):
2015 | 2014 | 2013 | |||||||||
Components of net periodic benefit costs: | |||||||||||
Service cost | $ | 56 | $ | 54 | $ | 57 | |||||
Interest cost | 55 | 63 | 57 | ||||||||
Expected return on plan assets | (98 | ) | (96 | ) | (85 | ) | |||||
Amortization of prior service cost | — | 2 | 5 | ||||||||
Amortization of actuarial loss | 28 | 25 | 22 | ||||||||
Net periodic benefit cost | 41 | 48 | 56 | ||||||||
Other(A) | — | — | (4 | ) | |||||||
Total cost | $ | 41 | $ | 48 | $ | 52 | |||||
___________________________
(A) | During 2013, we converted our defined benefit pension plan in the Netherlands to a defined contribution plan, resulting in a net gain on the curtailment and settlement of the defined benefit plan. This gain was partially offset by additional pension expense related to our restructuring activities (refer to Note 15). |
Actuarial Assumptions
The following table summarizes the weighted average actuarial assumptions used to determine the net periodic benefit cost of our pension plans for the periods presented:
2015 | 2014 | 2013 | ||||||
Discount rate | 3.5 | % | 4.4 | % | 4.2 | % | ||
Expected return on assets | 6.9 | 6.9 | 6.7 | |||||
Rate of compensation increase | 3.2 | 3.5 | 3.4 | |||||
68
The following table summarizes the weighted average actuarial assumptions used to determine the benefit obligations of our pension plans as of the dates presented:
December 31, | |||||
2015 | 2014 | ||||
Discount rate | 3.5 | % | 3.5 | % | |
Rate of compensation increase | 3.3 | 3.2 | |||
Benefit Obligation and Fair Value of Plan Assets
The following table summarizes the changes in our pension plan benefit obligation and the fair value of our plan assets as of the dates presented (in millions):
December 31, | |||||||
2015 | 2014 | ||||||
Reconciliation of benefit obligation: | |||||||
Benefit obligation at beginning of plan year | $ | 1,602 | $ | 1,475 | |||
Service cost | 56 | 54 | |||||
Interest cost | 55 | 63 | |||||
Actuarial loss | 30 | 167 | |||||
Benefit payments | (31 | ) | (38 | ) | |||
Currency translation adjustments | (104 | ) | (118 | ) | |||
Other | 4 | (1 | ) | ||||
Benefit obligation at end of plan year | $ | 1,612 | $ | 1,602 | |||
Reconciliation of fair value of plan assets: | |||||||
Fair value of plan assets at beginning of plan year | $ | 1,530 | $ | 1,466 | |||
Actual gain on plan assets | 27 | 157 | |||||
Employer contributions | 52 | 51 | |||||
Benefit payments | (31 | ) | (38 | ) | |||
Currency translation adjustments | (91 | ) | (106 | ) | |||
Fair value of plan assets at end of plan year | $ | 1,487 | $ | 1,530 | |||
The following table summarizes the projected benefit obligation (PBO), the accumulated benefit obligation (ABO), and the fair value of plan assets for our pension plans with an ABO in excess of plan assets and for our pension plans with a PBO in excess of plan assets as of the dates presented (in millions):
December 31, | |||||||
2015 | 2014 | ||||||
Information for plans with an ABO in excess of plan assets: | |||||||
PBO | $ | 220 | $ | 238 | |||
ABO | 168 | 180 | |||||
Fair value of plan assets | 125 | 126 | |||||
Information for plans with a PBO in excess of plan assets: | |||||||
PBO | $ | 1,612 | $ | 238 | |||
ABO | 1,300 | 180 | |||||
Fair value of plan assets | 1,487 | 126 | |||||
69
Funded Status
The following table summarizes the funded status of our pension plans and the amounts recognized in our Consolidated Balance Sheets as of the dates presented (in millions):
December 31, | |||||||
2015 | 2014 | ||||||
Funded status: | |||||||
PBO | $ | (1,612 | ) | $ | (1,602 | ) | |
Fair value of plan assets | 1,487 | 1,530 | |||||
Net funded status | $ | (125 | ) | $ | (72 | ) | |
Funded status - overfunded | — | 40 | |||||
Funded status - underfunded | (125 | ) | (112 | ) | |||
Amounts recognized in the consolidated balance sheet consist of: | |||||||
Noncurrent assets | $ | — | $ | 40 | |||
Current liabilities | (4 | ) | (5 | ) | |||
Noncurrent liabilities | (121 | ) | (107 | ) | |||
Net amounts recognized | $ | (125 | ) | $ | (72 | ) | |
The ABO for our pension plans as of both December 31, 2015 and December 31, 2014 was $1.3 billion.
Accumulated Other Comprehensive Income
The following table summarizes the amounts recorded in AOCI that have not yet been recognized as a component of net periodic benefit cost as of the dates presented (pretax; in millions):
December 31, | |||||||
2015 | 2014 | ||||||
Amounts in AOCI: | |||||||
Prior service cost | $ | 6 | $ | 3 | |||
Net losses | 489 | 446 | |||||
Amounts in AOCI | $ | 495 | $ | 449 | |||
The following table summarizes the changes in AOCI related to our pension plans for the periods presented (pretax; in millions):
2015 | 2014 | ||||||
Reconciliation of AOCI: | |||||||
AOCI at beginning of plan year | $ | 449 | $ | 401 | |||
Prior service cost recognized during the year | — | (2 | ) | ||||
Net losses recognized during the year | (28 | ) | (25 | ) | |||
Net losses (gains) occurring during the year | 101 | 106 | |||||
Other adjustments | 3 | — | |||||
Net adjustments to AOCI | 76 | 79 | |||||
Currency exchange rate changes | (30 | ) | (31 | ) | |||
AOCI at end of plan year | $ | 495 | $ | 449 | |||
70
The following table summarizes the amounts in AOCI expected to be amortized and recognized as a component of net periodic benefit cost for the period presented (pretax; in millions):
2016 | |||
Amortization of prior service cost | $ | 2 | |
Amortization of net losses | 26 | ||
Total amortization expense | $ | 28 | |
Pension Plan Assets
We have established formal investment policies for the assets associated with our pension plans. Policy objectives include (1) maximizing long-term return at acceptable risk levels; (2) diversifying among asset classes, if appropriate, and among investment managers; and (3) establishing relevant risk parameters within each asset class. Investment policies reflect the unique circumstances of the respective plans and include requirements designed to mitigate risk, including quality and diversification standards. Asset allocation targets are based on periodic asset liability and/or risk budgeting study results, which help determine the appropriate investment strategies for acceptable risk levels. The investment policies permit variances from the targets within certain parameters.
Factors such as asset class allocations, long-term rates of return (actual and expected), and results of periodic asset liability modeling studies are considered when constructing the long-term rate of return assumption for our pension plans. While historical rates of return play an important role in the analysis, we also take into consideration data points from other external sources if there is a reasonable justification to do so.
The following table summarizes our weighted average pension asset allocations as of our measurement date for the periods presented and the weighted average expected long-term rates of return by asset category:
Weighted Average Allocation | ||||||||||||
Target | Actual | |||||||||||
Asset Category | 2016 | 2015 | 2014 | Weighted Average Expected Long-Term Rate of Return(A) | ||||||||
Equity securities | 60 | % | 58 | % | 57 | % | 9.2 | % | ||||
Fixed-income securities | 29 | 29 | 29 | 4.2 | ||||||||
Short-term investments | 10 | 10 | 7 | — | ||||||||
Other investments(B) | 1 | 3 | 7 | 6.3 | ||||||||
Total | 100 | % | 100 | % | 100 | % | 6.8 | % | ||||
___________________________
(A) | The weighted average expected long-term rate of return by asset category is based on our target allocation. |
(B) | Other investments generally include hedge funds, real estate funds, and insurance contracts. |
71
The following tables summarize our pension plan assets measured at fair value as of the dates presented (in millions):
December 31, 2015 | Quoted Prices in Active Markets for Identical Assets (Level 1) | Significant Other Observable Inputs (Level 2) | Significant Unobservable Inputs (Level 3) | ||||||||||||
Equity securities:(A) | |||||||||||||||
U.S. equities | $ | 233 | $ | 3 | $ | 230 | $ | — | |||||||
International | 610 | 249 | 361 | — | |||||||||||
Fixed-income securities:(B) | |||||||||||||||
Corporate bonds and notes | 116 | — | 116 | — | |||||||||||
Non-U.S. government securities | 303 | — | 303 | — | |||||||||||
Mortgage backed securities | 5 | — | 5 | — | |||||||||||
Other bonds | 12 | — | 12 | — | |||||||||||
Short-term investments(C) | 26 | 23 | 3 | — | |||||||||||
Other investments: | |||||||||||||||
Real estate funds(D) | 151 | — | 151 | — | |||||||||||
Insurance contracts(E) | 18 | — | 17 | 1 | |||||||||||
Hedge funds(F) | 13 | — | — | 13 | |||||||||||
$ | 1,487 | $ | 275 | $ | 1,198 | $ | 14 | ||||||||
December 31, 2014 | Quoted Prices in Active Markets for Identical Assets (Level 1) | Significant Other Observable Inputs (Level 2) | Significant Unobservable Inputs (Level 3) | ||||||||||||
Equity securities:(A) | |||||||||||||||
U.S. equities | $ | 242 | $ | 4 | $ | 238 | $ | — | |||||||
International | 624 | 269 | 355 | — | |||||||||||
Fixed-income securities:(B) | |||||||||||||||
Corporate bonds and notes | 145 | — | 145 | — | |||||||||||
Non-U.S. government securities | 306 | — | 306 | — | |||||||||||
Mortgage backed securities | 3 | — | 3 | — | |||||||||||
Other bonds | 8 | — | 8 | — | |||||||||||
Short-term investments(C) | 18 | 17 | 1 | — | |||||||||||
Other investments: | |||||||||||||||
Real estate funds(D) | 111 | — | 111 | — | |||||||||||
Insurance contracts(E) | 19 | — | 18 | 1 | |||||||||||
Hedge funds(F) | 54 | — | — | 54 | |||||||||||
$ | 1,530 | $ | 290 | $ | 1,185 | $ | 55 | ||||||||
___________________________
(A) | Equity securities are comprised of the following investment types: (1) common stock; (2) preferred stock; and (3) common trust funds. Investments in common and preferred stocks are valued using quoted market prices multiplied by the number of shares owned. Investments in common trust funds are valued at the net asset value per share multiplied by the number of shares held as of the measurement date (as of December 31, 2015, it is not probable that we will sell these investments at an amount other than net asset value). |
(B) | Investments other than those held in common trust funds are valued utilizing a market approach that includes various valuation techniques and sources such as value generation models, broker quotes in active and non-active markets, benchmark yields and securities, reported trades, issuer spreads, and/or other applicable reference data. |
(C) | Short-term investments are valued at $1.00/unit, which approximates fair value. Amounts are generally invested in actively managed common trust funds or interest-bearing accounts. |
72
(D) | Real estate funds are valued at net asset value, which is calculated using the most recent partnership financial reports, adjusted, as appropriate, for any lag between the date of the financial reports and the measurement date (as of December 31, 2015, it is not probable that we will sell these investments at an amount other than net asset value). |
(E) | Insurance contracts are valued at book value, which approximates fair value, and is calculated using the prior year balance adjusted for investment returns and changes in cash flows. |
(F) | Hedge funds are held in private investment funds. These investments are valued based primarily on the net asset value, which is provided by the management of each private investment fund, multiplied by the number of shares held as of the measurement date, net of any accrued management and incentive fees due to the fund managers (as of December 31, 2015, it is not probable that we will sell these investments at an amount other than net asset value). |
The following table summarizes the changes in our Level 3 (fair value) pension plan assets for the periods presented (in millions):
Insurance Contracts | Hedge Funds | ||||||
Balance as of January 1, 2013 | $ | 1 | $ | 48 | |||
Actual return on plan assets still held at year end | — | 5 | |||||
Asset purchases | 1 | — | |||||
Asset settlements | (1 | ) | — | ||||
Translation | — | 1 | |||||
Balance as of December 31, 2013 | 1 | 54 | |||||
Actual return on plan assets still held at year end | — | 3 | |||||
Translation | — | (3 | ) | ||||
Balance as of December 31, 2014 | 1 | 54 | |||||
Asset sales | — | (40 | ) | ||||
Translation | — | (1 | ) | ||||
Balance as of December 31, 2015 | $ | 1 | $ | 13 | |||
Benefit Plan Contributions
The following table summarizes the contributions made to our pension plans for the years ended December 31, 2015 and 2014, as well as our projected contributions for the year ending December 31, 2016 (in millions):
Actual(A) | Projected(A) | ||||||||||
2015 | 2014 | 2016 | |||||||||
Total pension contributions | $ | 52 | $ | 51 | $ | 51 | |||||
___________________________
(A) | These amounts represent only contributions made by CCE and are unaudited. |
We fund our pension plans at a level to maintain, within established guidelines, the appropriate funded status for each country.
73
Benefit Plan Payments
Benefit payments are primarily made from funded benefit plan trusts. The following table summarizes our expected future benefit payments as of December 31, 2015 (in millions):
Years Ending December 31, | Pension Benefit Plan Payments(A) | |||
2016 | $ | 24 | ||
2017 | 25 | |||
2018 | 29 | |||
2019 | 33 | |||
2020 | 35 | |||
2021 - 2025 | 261 | |||
___________________________
(A) | These amounts represent only payments funded by CCE and are unaudited. |
Defined Contribution Plans
We sponsor qualified defined contribution plans covering substantially all of our employees in France, the Netherlands, Norway, and the U.S., and certain employees in Great Britain. Our contributions to these plans totaled $25 million, $25 million, and $18 million in 2015, 2014, and 2013, respectively.
Note 11
TAXES
The current income tax provision represents the estimated amount of income taxes paid or payable for the year, as well as changes in estimates from prior years. The deferred income tax provision represents the change in our deferred tax liabilities and assets. The following table summarizes the significant components of income tax expense for the periods presented (in millions):
2015 | 2014 | 2013 | |||||||||
Current: | |||||||||||
U.S. | $ | (3 | ) | $ | 13 | $ | 92 | ||||
Europe | 159 | 152 | 123 | ||||||||
Total current | 156 | 165 | 215 | ||||||||
Deferred: | |||||||||||
U.S. | 40 | 56 | (22 | ) | |||||||
Europe | — | 10 | 16 | ||||||||
Rate and law changes | (48 | ) | (1 | ) | (71 | ) | |||||
Total deferred | (8 | ) | 65 | (77 | ) | ||||||
Income tax expense | $ | 148 | $ | 230 | $ | 138 | |||||
74
Our effective tax rate was 20 percent, 26 percent, and 17 percent for the years ended December 31, 2015, 2014, and 2013, respectively. The following table provides a reconciliation of our income tax expense at the statutory U.S. federal tax rate to our actual income tax expense for the periods presented (in millions):
2015 | 2014 | 2013 | |||||||||
U.S. federal statutory tax expense | $ | 260 | $ | 313 | $ | 282 | |||||
Taxation of foreign operations, net(A) | (140 | ) | (159 | ) | (146 | ) | |||||
U.S. taxation of foreign earnings, net of tax credits | 71 | 75 | 70 | ||||||||
Nondeductible items | 3 | 3 | (2 | ) | |||||||
France dividend surtax | — | — | 5 | ||||||||
Rate and law change benefit, net(B)(C)(D)(E) | (48 | ) | (1 | ) | (71 | ) | |||||
Other, net | 2 | (1 | ) | — | |||||||
Total provision for income taxes | $ | 148 | $ | 230 | $ | 138 | |||||
___________________________
(A) | Our effective tax rate reflects the benefit, net of income tax contingencies, of having all of our operations outside the U.S., most of which are taxed at statutory rates lower than the statutory U.S. rate of 35 percent, with the benefit of some income being fully or partially exempt from income taxes due to various operating and financing activities. |
(B) | During the fourth quarter of 2015, the United Kingdom enacted a corporate income tax rate reduction of 2 percentage points, consisting of a 1 percentage point reduction effective April 1, 2017, and 1 percentage point reduction effective April 1, 2020. As a result, we recognized a deferred tax benefit of $47 million during the fourth quarter of 2015 to reflect the impact of this change. |
(C) | During the fourth quarter of 2015, Norway enacted a corporate income tax rate reduction of 2 percentage points effective for tax years beginning on or after January 1, 2016. As a result, we recognized a deferred tax benefit of $1 million during the fourth quarter of 2015 to reflect the impact of this change. |
(D) | During the third quarter of 2014, France extended the temporary corporate income tax surcharge of 10.7 percent to the year 2015. As a result, we recognized a deferred tax benefit of approximately $1 million during the third quarter of 2014 related to net deferred tax assets that we realized in 2015. |
(E) | During the third quarter of 2013, the United Kingdom enacted a corporate income tax rate reduction of 3 percentage points, 2 percentage points effective April 1, 2014, and 1 percentage point effective April 1, 2015. As a result, we recognized a deferred tax benefit of $71 million during the third quarter of 2013 to reflect this change. |
The following table summarizes, by major tax jurisdiction, our tax years that remain subject to examination by taxing authorities:
Tax Jurisdiction | Years Subject to Examination | |
United Kingdom | 2014 – forward | |
Belgium, and France | 2013 – forward | |
Bulgaria, U.S. federal, state, and local | 2012 – forward | |
Luxembourg and the Netherlands | 2011 – forward | |
Sweden | 2010 – forward | |
Norway | 2006 – forward | |
75
Deferred Income Taxes
Deferred income taxes reflect the net tax effects of temporary differences between the carrying amounts of assets and liabilities for financial reporting purposes and the amounts used for income tax purposes. The following table summarizes the significant components of our deferred tax liabilities and assets as of the dates presented (in millions):
December 31, | |||||||
2015 | 2014 | ||||||
Deferred tax liabilities: | |||||||
Franchise license and other intangible assets | $ | 748 | $ | 865 | |||
Property, plant, and equipment | 144 | 157 | |||||
Other, net | 95 | 30 | |||||
Total deferred tax liabilities | 987 | 1,052 | |||||
Deferred tax assets: | |||||||
Net operating loss and other carryforwards | (24 | ) | (22 | ) | |||
Employee and retiree benefit accruals | (76 | ) | (61 | ) | |||
Foreign tax credit carryforwards, net | (132 | ) | (157 | ) | |||
Total deferred tax assets | (232 | ) | (240 | ) | |||
Valuation allowances on deferred tax assets | 18 | 19 | |||||
Net deferred tax liabilities | $ | 773 | $ | 831 | |||
Current deferred income tax assets(A) | $ | 35 | $ | 67 | |||
Current deferred income tax liabilities(B) | — | 9 | |||||
Noncurrent deferred income tax assets(C) | 46 | 88 | |||||
Noncurrent deferred income tax liabilities | 854 | 977 | |||||
Net deferred tax liabilities | $ | 773 | $ | 831 | |||
___________________________
(A) | Amounts are included in other current assets on our Consolidated Balance Sheets. |
(B) | Amounts are included in other current liabilities on our Consolidated Balance Sheets. |
(C) | Amounts are included in other noncurrent assets on our Consolidated Balance Sheets. |
We recognize valuation allowances on deferred tax assets if, based on the weight of the evidence, we believe that it is more likely than not that some or all of our deferred tax assets will not be realized. As of December 31, 2015 and 2014, we had valuation allowances of $18 million and $19 million, respectively. We believe our remaining deferred tax assets will be realized because of the existence of sufficient taxable income within the carryforward period available under the tax law. As of December 31, 2015, our net tax operating loss carryforwards totaled $148 million, of which $10 million expire between 2030 and 2035, and the remainder do not expire. As of December 31, 2015, our foreign tax credit carryforwards totaled $145 million, which expire between 2021 and 2023.
Repatriation of Foreign Earnings
During the third quarter of 2015, we repatriated to the U.S. $450 million of our 2015 foreign earnings for the payment of dividends, share repurchases, interest on U.S.-issued debt, salaries for U.S.-based employees, and other corporate-level operations in the U.S. Our historical foreign earnings, including our 2015 foreign earnings that were not repatriated in 2015, will continue to remain indefinitely reinvested. If we do not generate sufficient current year foreign earnings to repatriate to the U.S. in any future given year, we expect to have adequate access to capital in the U.S. to allow us to satisfy our U.S.-based cash flow needs in that year. Therefore, historical foreign earnings and future foreign earnings that are not repatriated to the U.S. will remain indefinitely reinvested and will be used to service our foreign operations, non-U.S. debt, and to fund future acquisitions.
During the third quarter of 2014, we repatriated to the U.S. $450 million of our 2014 foreign earnings for the payment of dividends, share repurchases, interest on U.S.-issued debt, salaries for U.S.-based employees, and other corporate-level operations in the U.S. Our historical foreign earnings, including our 2014 foreign earnings that were not repatriated in 2014, will continue to remain indefinitely reinvested.
76
We had approximately $1.8 billion in cumulative undistributed foreign earnings as of December 31, 2015. These earnings are exclusive of amounts that would result in little or no tax under current tax laws if remitted in the future. The cumulative undistributed earnings from our foreign subsidiaries are considered to be indefinitely reinvested and, accordingly, no provision for U.S. federal and state income taxes has been made in our Consolidated Financial Statements. A distribution of these foreign earnings to the U.S. in the form of dividends, or otherwise, would subject us to U.S. income taxes, as adjusted for foreign tax credits, and withholding taxes payable to the various foreign countries. Determination of the amount of unrecognized deferred U.S. income tax liability on these undistributed earnings is not practicable.
Other
We are subject to surtaxes on dividends and certain other distributions paid by some of our European entities, including those in France and Belgium, to entities outside of their jurisdiction. We recognize this incremental income tax only when one of these subsidiaries declares a taxable dividend. As of the end of 2015, we have undistributed retained earnings of $484 million that would be subject to this tax if distributed. If all of these undistributed retained earnings were to be declared as dividends, we would be subject to additional income taxes of approximately $19 million.
Note 12
SHARE-BASED COMPENSATION PLANS
Share-Based Payment Awards
We maintain share-based compensation plans that provide for the granting of non-qualified share options and restricted share units, some with performance and/or market conditions, to certain executive and management level employees. We believe that these awards better align the interests of our employees with the interests of our shareowners. During the years ended December 31, 2015, 2014, and 2013, compensation expense related to our share-based payment awards totaled $41 million, $28 million, and $33 million, respectively.
Share Options
Our share options (1) are granted with exercise prices equal to or greater than the fair value of our stock on the date of grant; (2) generally vest in three annual tranches over a period of 36 months; and (3) expire 10 years from the date of grant. Generally, when options are exercised, we issue new shares rather than issuing treasury shares.
The following table summarizes the weighted average grant-date fair value per unit and assumptions that were used to estimate the grant-date fair values of the share options granted during the periods presented:
Grant-Date Fair Value | 2015 | 2014 | 2013 | |||||||||
Share options with service conditions | $ | 8.50 | $ | 6.78 | $ | 7.27 | ||||||
Assumptions: | ||||||||||||
Dividend yield(A) | 2.30 | % | 2.60 | % | 2.50 | % | ||||||
Expected volatility(B) | 22.5 | % | 22.5 | % | 25.0 | % | ||||||
Risk-free interest rate(C) | 1.6 | % | 1.6 | % | 1.3 | % | ||||||
Expected life(D) | 5.0 years | 5.0 years | 5.0 years | |||||||||
___________________________
(A) | The dividend yield was calculated by dividing our annual dividend by our average stock price on the date of grant, taking into consideration our future expectations regarding our dividend yield. |
(B) | The expected volatility was determined by using a combination of the historical volatility of our stock, the implied volatility of our exchange-traded options, and other factors, such as a comparison to our peer group. |
(C) | The risk-free interest rate was based on the U.S. Treasury yield with a term equal to the expected life on the date of grant. |
(D) | The expected life was used for options valued by the Black-Scholes model. It was determined by using a combination of actual exercise and post-vesting cancellation history for the types of employees included in the grant population. |
77
The following table summarizes our share option activity for the periods presented (shares in thousands):
2015 | 2014 | 2013 | ||||||||||||||||||
Shares | Average Exercise Price | Shares | Average Exercise Price | Shares | Average Exercise Price | |||||||||||||||
Outstanding at beginning of year | 8,548 | $ | 24.98 | 8,527 | $ | 21.39 | 8,846 | $ | 18.53 | |||||||||||
Granted | 901 | 51.73 | 1,095 | 43.13 | 976 | 41.73 | ||||||||||||||
Exercised(A) | (1,268 | ) | 16.84 | (1,059 | ) | 14.72 | (1,271 | ) | 17.04 | |||||||||||
Forfeited, expired, or canceled | (45 | ) | 33.04 | (15 | ) | 34.96 | (24 | ) | 21.32 | |||||||||||
Outstanding at end of year | 8,136 | 29.17 | 8,548 | 24.98 | 8,527 | 21.39 | ||||||||||||||
Options exercisable at end of year | 6,488 | 24.45 | 6,825 | 20.68 | 6,853 | 17.61 | ||||||||||||||
___________________________
(A) | The total intrinsic value of options exercised during the years ended December 31, 2015, 2014, and 2013 was $38 million, $32 million, and $27 million, respectively. |
The following table summarizes our options outstanding and our options exercisable as of December 31, 2015 (shares in thousands):
Outstanding | Exercisable | |||||||||||||||||
Ranges of Exercise Price | Options Outstanding(A) | Weighted Average Remaining Life (years) | Weighted Average Exercise Price | Options Exercisable(A) | Weighted Average Remaining Life (years) | Weighted Average Exercise Price | ||||||||||||
$ 6.00 to $10.00 | 722 | 2.83 | $ | 6.74 | 722 | 2.83 | $ | 6.74 | ||||||||||
10.01 to 14.00 | 844 | 3.85 | 13.12 | 844 | 3.85 | 13.12 | ||||||||||||
14.01 to 19.00 | 970 | 1.00 | 15.81 | 970 | 1.00 | 15.81 | ||||||||||||
24.00 to 29.00 | 1,635 | 5.40 | 25.35 | 1,635 | 5.40 | 25.35 | ||||||||||||
29.01 to 35.00 | 1,040 | 6.85 | 30.79 | 1,040 | 6.85 | 30.79 | ||||||||||||
Over 35.00 | 2,925 | 8.82 | 45.33 | 1,277 | 8.18 | 42.21 | ||||||||||||
8,136 | 5.90 | 29.17 | 6,488 | 5.03 | 24.45 | |||||||||||||
___________________________
(A) | As of December 31, 2015, the aggregate intrinsic value of options outstanding and options exercisable was $165 million and $161 million, respectively. |
As of December 31, 2015, we had approximately $9 million of unrecognized compensation expense related to our unvested share options. We expect to recognize this compensation expense over a weighted average period of 1.9 years.
Restricted Share Units
Our restricted share units generally vest upon continued employment for a period of at least 36 months and the attainment of certain market conditions and performance targets. Our restricted share unit awards entitle the participant to hypothetical dividends (which are paid only if the restricted share units vest), but not voting rights. Unvested restricted share units are restricted as to disposition and subject to forfeiture.
We granted 0.6 million restricted share units during both the years ended December 31, 2015 and 2014, and 0.5 million restricted share units during the year ended December 31, 2013. Approximately 0.4 million of the restricted share units granted in 2015, 2014, and 2013, were performance share units (PSUs) for which the ultimate number of shares earned is determined at the end of the stated performance period. The PSUs granted in 2012, 2013, and 2014 also contain a market condition that adjusts the number of PSUs otherwise earned based on the following year's EPS results. Specifically, the percentage of the target PSUs earned based on EPS growth is adjusted (upward or downward) based on our Total Shareholder Return (TSR) performance, as compared to the TSR of the companies in the S&P 500 over the performance period.
78
The following table summarizes the weighted average grant-date fair value per unit and assumptions that were used to estimate the grant-date fair values of the restricted share units granted during the periods presented:
Grant-Date Fair Value | 2015 | 2014 | 2013 | |||||||||
Restricted share units with service conditions | $ | 50.30 | $ | 44.18 | $ | 41.28 | ||||||
Restricted share units with service and performance conditions | 51.73 | n/a | n/a | |||||||||
Restricted share units with service, performance, and market conditions(A) | 49.88 | 44.51 | 43.12 | |||||||||
Assumptions: | ||||||||||||
Dividend yield(B) | 2.30 | % | 2.60 | % | 2.50 | % | ||||||
Expected volatility(C) | 22.5 | % | 22.5 | % | 25.0 | % | ||||||
Risk-free interest rate(D) | 1.6 | % | 1.6 | % | 1.3 | % | ||||||
___________________________
(A) | We have determined the grant-date fair value for these awards using a Monte Carlo simulation model since they are subject to a market condition. |
(B) | The dividend yield was calculated by dividing our annual dividend by our average stock price on the date of grant, taking into consideration our future expectations regarding our dividend yield. |
(C) | The expected volatility was determined by using a combination of the historical volatility of our stock, the implied volatility of our exchange-traded options, and other factors, such as a comparison to our peer group. |
(D) | The risk-free interest rate was based on the U.S. Treasury yield with a term equal to the expected life on the date of grant. |
The following table summarizes our restricted share units award activity during the periods presented (shares in thousands):
Restricted Share Units | Weighted Average Grant- Date Fair Value | Performance Share Units | Weighted Average Grant- Date Fair Value | ||||||||||
Outstanding at January 1, 2012 | 551 | $ | 26.80 | 4,043 | $ | 20.26 | |||||||
Granted | 149 | 41.28 | 377 | 43.12 | |||||||||
Vested(A) | (157 | ) | 25.24 | (2,295 | ) | 15.22 | |||||||
Forfeited or canceled | (19 | ) | 27.87 | (35 | ) | 27.74 | |||||||
Performance adjustment(B) | n/a | n/a | 140 | 39.09 | |||||||||
Outstanding at December 31, 2013 | 524 | 31.34 | 2,230 | 31.25 | |||||||||
Granted | 184 | 44.18 | 388 | 44.51 | |||||||||
Vested(A) | (258 | ) | 26.28 | (942 | ) | 24.50 | |||||||
Forfeited or canceled | (19 | ) | 34.87 | (35 | ) | 33.93 | |||||||
Performance adjustment(C) | n/a | n/a | 39 | 39.19 | |||||||||
Outstanding at December 31, 2014 | 431 | 39.72 | 1,680 | 38.37 | |||||||||
Granted | 274 | 50.30 | 356 | 51.73 | |||||||||
Vested(A) | (124 | ) | 32.72 | (290 | ) | 26.43 | |||||||
Forfeited or canceled | (26 | ) | 38.16 | (41 | ) | 38.38 | |||||||
Performance adjustment(D) | n/a | n/a | 164 | 42.49 | |||||||||
Outstanding at December 31, 2015(E) | 555 | 46.58 | 1,869 | 43.27 | |||||||||
___________________________
(A) | The total fair value of restricted share units that vested during the years ended December 31, 2015, 2014, and 2013 was $19 million, $54 million, and $90 million, respectively. |
(B) | Based on our financial results for the performance period, our 2012 performance share units will pay out at 74 percent of the target award. The ultimate vesting of these performance share units is subject to the participant satisfying the remaining service condition of the award. |
(C) | Based on our financial results for the performance and market condition period, our 2013 performance share units will pay out at 149 percent of the target award. The ultimate vesting of these performance share units is subject to the participant satisfying the remaining service condition of the award. |
79
(D) | Based on our financial results for the performance and market condition period, our 2014 performance share units will pay out at 175 percent of the target award. The ultimate vesting of these performance share units is subject to the participant satisfying the remaining service condition of the award. |
(E) | The target awards for our performance share units are included in the preceding table and are adjusted, as necessary, in the period that the performance conditions are satisfied. The minimum, target, and maximum awards for our 2015 performance share units outstanding as of December 31, 2015 were 0.2 million, 0.4 million, and 0.8 million, respectively. |
As of December 31, 2015, we had approximately $48 million in total unrecognized compensation expense related to our restricted share unit awards based on our current expectations for payout of our performance share units. We expect to recognize this compensation cost over a weighted average period of 2.3 years.
Shares Available for Future Grant
The following table summarizes the shares available for future grant as of December 31, 2015 that may be used to grant share options and/or restricted share units (in millions):
Shares Available for Future Grant | ||
Performance share units at current expected payout | 7.5 | |
Note 13
EARNINGS PER SHARE
We calculate our basic earnings per share by dividing net income by the weighted average number of shares and participating securities outstanding during the period. Our diluted earnings per share are calculated in a similar manner but include the effect of dilutive securities. To the extent these securities are antidilutive, they are excluded from the calculation of diluted earnings per share.
The following table summarizes our basic and diluted earnings per common share calculations for the periods presented (in millions, except per share data; per share data is calculated prior to rounding to millions):
2015 | 2014 | 2013 | |||||||||
Net income | $ | 596 | $ | 663 | $ | 667 | |||||
Basic weighted average shares outstanding | 231 | 247 | 268 | ||||||||
Effect of dilutive securities(A) | 4 | 5 | 5 | ||||||||
Diluted weighted average shares outstanding | 235 | 252 | 273 | ||||||||
Basic earnings per share | $ | 2.59 | $ | 2.68 | $ | 2.49 | |||||
Diluted earnings per share | $ | 2.54 | $ | 2.63 | $ | 2.44 | |||||
___________________________
(A) | Outstanding options to purchase 1.2 million shares for the year ended December 31, 2015, and 1.0 million shares for both the years ended December 31, 2014 and 2013, were excluded from the diluted earnings per share calculation because the effect of including these options in the computation would have been antidilutive. The dilutive impact of the remaining options outstanding and unvested restricted share units was included in the effect of dilutive securities. |
During 2015, we paid dividends of $257 million. In February 2015, our Board of Directors approved an increase in our quarterly dividend from $0.25 per share to $0.28 per share beginning in the first quarter of 2015.
We have 100 million shares of preferred shares authorized. As of December 31, 2015, 2014, and 2013, there were no preferred shares outstanding.
Note 14
OPERATING SEGMENT
We operate in one industry and have one operating segment. This segment derives its revenues from marketing, producing, and distributing nonalcoholic beverages. No single customer accounted for more than 10 percent of our net sales in 2015, 2014, or 2013.
80
Our segment operating income includes the segment’s revenue less substantially all the segment’s cost of production, distribution, and administration. We evaluate the segment’s performance based on several factors, of which net sales and operating income are the primary financial measures.
Additionally, mark-to-market gains/losses related to our non-designated commodity hedges are recognized in the earnings of our Corporate segment until such time as the underlying hedged transaction affects the earnings of our Europe operating segment. In the period the underlying hedged transaction occurs, the accumulated mark-to-market gains/losses related to the hedged transaction are reclassified from the earnings of our Corporate segment into the earnings of our Europe operating segment. This treatment allows our Europe operating segment to reflect the true economic effects of the underlying hedged transaction in the period the hedged transaction occurs without experiencing the mark-to-market volatility associated with these non-designated commodity hedges. For additional information about our non-designated hedges, refer to Note 6.
The following table summarizes selected segment financial information for the periods presented (in millions):
Europe | Corporate | Consolidated | |||||||||
2015: | |||||||||||
Net sales(A) | $ | 7,011 | $ | — | $ | 7,011 | |||||
Operating income (loss)(B)(C) | 1,063 | (197 | ) | 866 | |||||||
Interest expense, net | — | 118 | 118 | ||||||||
Depreciation and amortization | 234 | 40 | 274 | ||||||||
Long-lived assets, net(D)(E) | 5,398 | 167 | 5,565 | ||||||||
Capital asset investments | 301 | 20 | 321 | ||||||||
2014: | |||||||||||
Net sales(A) | $ | 8,264 | $ | — | $ | 8,264 | |||||
Operating income (loss)(B) | 1,151 | (132 | ) | 1,019 | |||||||
Interest expense, net | — | 119 | 119 | ||||||||
Depreciation and amortization | 270 | 39 | 309 | ||||||||
Long-lived assets, net(D)(E) | 5,882 | 201 | 6,083 | ||||||||
Capital asset investments | 310 | 22 | 332 | ||||||||
2013: | |||||||||||
Net sales(A) | $ | 8,212 | $ | — | $ | 8,212 | |||||
Operating income (loss)(B) | 1,063 | (149 | ) | 914 | |||||||
Interest expense, net | — | 103 | 103 | ||||||||
Depreciation and amortization | 273 | 35 | 308 | ||||||||
Long-lived assets, net(D) | 6,587 | 370 | 6,957 | ||||||||
Capital asset investments | 296 | 17 | 313 | ||||||||
___________________________
(A) | The following table summarizes the contribution of total net sales by country as a percentage of our total net sales for the periods presented: |
2015 | 2014 | 2013 | ||||||
Net sales: | ||||||||
Great Britain | 37 | % | 34 | % | 33 | % | ||
France | 29 | 30 | 30 | |||||
Belgium | 15 | 15 | 15 | |||||
The Netherlands | 8 | 8 | 8 | |||||
Norway | 6 | 7 | 8 | |||||
Sweden | 5 | 6 | 6 | |||||
Total | 100 | % | 100 | % | 100 | % | ||
81
(B) | Our Corporate segment earnings include net mark-to-market losses on our non-designated commodity hedges of $28 million in 2015, net mark-to-market gains on our non-designated commodity hedges of $2 million in 2014, and net mark-to-market losses of $7 million during 2013, respectively. As of December 31, 2015, our Corporate segment included net mark-to-market losses on non-designated commodity hedges totaling $38 million. These amounts will be reclassified into the earnings of our Europe operating segment when the underlying hedged transactions occur. For additional information about our non-designated hedges, refer to Note 6. |
(C) | For the year ended December 31, 2015, operating income in our Corporate and Europe segments included Merger related expenses totaling $30 million and $15 million, respectively. |
(D) | The following table summarizes the percentage of net property, plant, and equipment by country and our Corporate segment as of the dates presented: |
December 31, | |||||
2015 | 2014 | ||||
Property, plant, and equipment, net: | |||||
Great Britain | 34 | % | 33 | % | |
France | 24 | 24 | |||
Belgium | 17 | 18 | |||
The Netherlands | 8 | 7 | |||
Norway | 7 | 8 | |||
Sweden | 6 | 6 | |||
Corporate | 4 | 4 | |||
Total | 100 | % | 100 | % | |
(E) | Amounts disclosed as long-lived assets in our Corporate segment for 2015 and 2014 include $46 million and $88 million, respectively, related to deferred income tax assets. |
Note 15
RESTRUCTURING ACTIVITIES
The following table summarizes our restructuring costs by segment for the periods presented (in millions):
2015 | 2014 | 2013 | |||||||||
Europe(A) | $ | 20 | $ | 81 | $ | 120 | |||||
Corporate | — | — | — | ||||||||
Total | $ | 20 | $ | 81 | $ | 120 | |||||
___________________________
(A) | During 2015, we incurred $4 million under our business transformation program and $16 million related to other restructuring activities. Other restructuring activities include initiatives related to increasing the effectiveness and efficiencies of our finance and supply chain functions. All restructuring expenses recorded during 2014 related to our business transformation program. During 2013, we recorded restructuring expense of $99 million related to our business transformation program and $21 million related to our Norway business optimization, which concluded at the end of 2013. |
Business Transformation Program
In 2012, we announced a business transformation program designed to improve our operating model and create a platform for driving sustainable future growth. Through this program we have: (1) streamlined and reduced the cost structure of our finance support function, including the establishment of a centralized shared services center; (2) restructured our sales and marketing organization to better align central and field sales, and deployed standardized channel-focused organizations within each of our territories; and (3) improved the efficiency and effectiveness of certain aspects of our operations, including activities related to our cold-drink equipment.
We are substantially complete with this program as of December 31, 2015, and our nonrecurring restructuring charges totaled $230 million, including severance, transition, consulting, accelerated depreciation, and lease termination costs. During the years ended December 31, 2015, 2014, and 2013, we recorded nonrecurring restructuring charges under this program totaling $4 million,
82
$81 million, and $99 million, respectively. Substantially all nonrecurring restructuring charges related to this program are included in SD&A on our Consolidated Statements of Income.
The following table summarizes these restructuring charges for the period presented (in millions):
Severance Pay and Benefits | Accelerated Depreciation(B) | Other(C) | Total | ||||||||||||
Balance as of January 1, 2013(A) | $ | 41 | $ | — | $ | 1 | $ | 42 | |||||||
Provision | 67 | 5 | 27 | 99 | |||||||||||
Cash payments | (78 | ) | — | (17 | ) | (95 | ) | ||||||||
Noncash items | — | (5 | ) | 1 | (4 | ) | |||||||||
Balance as of December 31, 2013(A) | 30 | — | 12 | 42 | |||||||||||
Provision | 26 | 7 | 48 | 81 | |||||||||||
Cash payments | (33 | ) | — | (55 | ) | (88 | ) | ||||||||
Noncash items | — | (7 | ) | — | (7 | ) | |||||||||
Balance as of December 31, 2014(A) | 23 | — | 5 | 28 | |||||||||||
Provision | (2 | ) | 1 | 5 | 4 | ||||||||||
Cash payments | (14 | ) | — | (6 | ) | (20 | ) | ||||||||
Noncash items | — | (1 | ) | — | (1 | ) | |||||||||
Balance as of December 31, 2015(A) | $ | 7 | $ | — | $ | 4 | $ | 11 | |||||||
___________________________
(A) | Substantially all of the amounts are included in accounts payable and accrued expenses on our Consolidated Balance Sheets. |
(B) | Accelerated depreciation represents the difference between the depreciation expense of the asset using the original useful life and the depreciation expense of the asset under the reduced useful life due to the restructuring activity. |
(C) | In 2013, these charges primarily related to program management and consulting costs. During 2014, these charges primarily related to costs incurred regarding our cold-drink operations, including social and other transition costs associated with the transfer of certain employees and assets to a third party. |
Note 16
SHARE REPURCHASES
Beginning in October 2010, our Board of Directors has approved a series of resolutions authorizing the repurchase of shares of our stock. Since 2010, we have repurchased $4.3 billion in outstanding shares, representing 125.9 million shares, under these resolutions. In December 2013, our Board of Directors authorized share repurchases for an aggregate price of not more than $1.0 billion. Share repurchase activity under this authorization commenced during the second quarter of 2014. In the third quarter of 2015 we completed authorized share repurchases under the December 2013 resolution. In December 2014, our Board of Directors approved a resolution to authorize additional share repurchases for an aggregate price of not more than $1.0 billion. We currently have $969 million in authorized share repurchases remaining under the December 2014 resolution. We completed our planned share repurchases for 2015 during the third quarter and do not intend to repurchase additional outstanding shares in the open market prior to the closing of the Merger (expected to be during the second quarter of 2016).
We can repurchase shares in the open market and in privately negotiated transactions. Repurchased shares are added to treasury stock and are available for general corporate purposes, including acquisition financing and the funding of various employee benefit and compensation plans. In addition to market conditions, we consider alternative uses of cash and/or debt, balance sheet ratios, and shareowner returns when evaluating share repurchases.
The following table summarizes the share repurchase activity for the periods presented (in millions, except per share data):
2015 | 2014 | 2013 | |||||||||
Number of shares repurchased | 13.5 | 20.2 | 27.2 | ||||||||
Weighted average purchase price per share | $ | 44.35 | $ | 45.79 | $ | 36.95 | |||||
Amount of share repurchases(A) | $ | 600 | $ | 925 | $ | 1,006 | |||||
83
___________________________
(A) | Total cash paid for these share repurchases totaled $614 million and $912 million due to the timing of settlement during 2015 and 2014, respectively. |
Note 17
QUARTERLY FINANCIAL INFORMATION (UNAUDITED)
The following table summarizes our quarterly financial information for the periods presented (in millions, except per share data):
2015 | First(A)(E) | Second(B) | Third(C) | Fourth(D)(E) | Full Year | |||||||||||||||
Net sales | $ | 1,631 | $ | 1,928 | $ | 1,822 | $ | 1,630 | $ | 7,011 | ||||||||||
Gross profit | 568 | 705 | 697 | 600 | 2,570 | |||||||||||||||
Operating income | 158 | 275 | 260 | 173 | 866 | |||||||||||||||
Net income | 96 | 176 | 168 | 156 | 596 | |||||||||||||||
Basic earnings per share(F) | $ | 0.41 | $ | 0.76 | $ | 0.74 | $ | 0.69 | $ | 2.59 | ||||||||||
Diluted earnings per share(F) | $ | 0.40 | $ | 0.75 | $ | 0.72 | $ | 0.67 | $ | 2.54 | ||||||||||
2014 | First(A)(E) | Second(B) | Third(C) | Fourth(D)(E) | Full Year | |||||||||||||||
Net sales | $ | 1,870 | $ | 2,333 | $ | 2,136 | $ | 1,925 | $ | 8,264 | ||||||||||
Gross profit | 650 | 846 | 808 | 669 | 2,973 | |||||||||||||||
Operating income | 184 | 295 | 345 | 195 | 1,019 | |||||||||||||||
Net income | 115 | 198 | 238 | 112 | 663 | |||||||||||||||
Basic earnings per share(F) | $ | 0.45 | $ | 0.80 | $ | 0.97 | $ | 0.46 | $ | 2.68 | ||||||||||
Diluted earnings per share(F) | $ | 0.44 | $ | 0.78 | $ | 0.96 | $ | 0.46 | $ | 2.63 | ||||||||||
___________________________
The following items included in our reported results affected the comparability of our year-over-year quarterly financial results (the items listed below are based on defined terms and thresholds and represent all material items management considered for year-over-year comparability).
(A) | Net income in the first quarter of 2015 included (1) net mark-to-market gains totaling $2 million ($2 million net of tax, or $0.01 per diluted share) related to non-designated commodity hedges associated with underlying transactions that related to a different reporting period and (2) charges totaling $9 million ($7 million net of tax, or $0.03 per diluted share) related to restructuring activities. |
Net income in the first quarter of 2014 included (1) net mark-to-market losses totaling $2 million ($1 million net of tax) related to non-designated commodity hedges associated with underlying transactions that related to a different reporting period and (2) charges totaling $8 million ($5 million net of tax, or $0.02 per diluted share) related to restructuring activities.
(B) | Net income in the second quarter of 2015 included (1) net mark-to-market losses totaling $10 million ($8 million net of tax, or $0.03 per diluted share) related to non-designated commodity hedges associated with underlying transactions that related to a different reporting period and (2) charges totaling $4 million ($3 million net of tax, or $0.01 per diluted share) related to restructuring activities. |
Net income in the second quarter of 2014 included (1) net mark-to-market gains totaling $8 million ($5 million net of tax, or $0.02 per diluted share) related to non-designated commodity hedges associated with underlying transactions that related to a different reporting period and (2) charges totaling $54 million ($36 million net of tax, or $0.14 per diluted share) related to restructuring activities.
(C) | Net income in the third quarter of 2015 included (1) charges totaling $6 million ($4 million net of tax, or $0.02 per diluted share) related to restructuring activities; (2) net mark-to-market losses totaling $15 million ($10 million net of tax, or $0.05 per diluted share) related to non-designated commodity hedges associated with underlying transactions that related to a different reporting period; (3) charges totaling $26 million ($18 million net of tax, or $0.08 per diluted share) related to the pending Merger; and (4) a gain of $10 million ($7 million net of tax, or $0.03 per diluted share) related to the sale of a distribution facility in Great Britain. |
84
Net income in the third quarter of 2014 included (1) charges totaling $1 million ($1 million net of tax) related to restructuring activities; (2) net mark-to-market gains totaling $8 million ($6 million net of tax, or $0.02 per diluted share) related to non-designated commodity hedges associated with underlying transactions that related to a different reporting period; and (3) net tax items totaling $6 million ($0.02 per diluted share) principally related to the tax impact on the cumulative nonrecurring items on the quarter.
(D) | Net income in the fourth quarter of 2015 included (1) net mark-to-market losses totaling $5 million ($3 million net of tax, or $0.01 per diluted share) related to non-designated commodity hedges associated with underlying transactions that related to a different reporting period; (2) charges totaling $1 million related to restructuring activities; (3) charges totaling $19 million ($13 million net of tax, or $0.06 per diluted share) related to the pending Merger; and (4) a deferred tax benefit of $48 million ($0.21 per diluted share) due to the enactment of corporate tax rate reductions in the United Kingdom and Norway. |
Net income in the fourth quarter of 2014 included (1) net mark-to-market losses totaling $12 million ($9 million net of tax, or $0.04 per diluted share) related to non-designated commodity hedges associated with underlying transactions that related to a different reporting period; (2) charges totaling $18 million ($13 million net of tax, or $0.05 per diluted share) related to restructuring activities; and (3) charges totaling $10 million ($8 million net of tax, or $0.03 per diluted share) related to the impairment of our investment in our recycling joint venture in Great Britain.
(E) | There were four more selling days in the first quarter of 2015 versus the first quarter of 2014, and there were four fewer selling days in the fourth quarter of 2015 versus the fourth quarter of 2014. |
(F) | Basic and diluted net earnings per share are computed independently for each of the quarters presented. As such, the summation of the quarterly amounts may not equal the total basic and diluted net income per share reported for the year. |
85
ITEM 9. | CHANGES IN AND DISAGREEMENTS WITH ACCOUNTANTS ON ACCOUNTING AND FINANCIAL DISCLOSURE |
Not applicable.
ITEM 9A. | CONTROLS AND PROCEDURES |
Evaluation of Disclosure Controls and Procedures
Our management evaluated, under the supervision and with the participation of management, including the Chief Executive Officer and the Chief Financial Officer, the effectiveness of our “disclosure controls and procedures” (as defined in Rule 13a-15(e) under the U.S. Securities Exchange Act of 1934 the “Exchange Act”) as of the end of the period covered by this report. Based on that evaluation, the Chief Executive Officer and the Chief Financial Officer concluded that our disclosure controls and procedures were effective to provide reasonable assurance that information required to be disclosed by us in reports we file or submit under the Exchange Act is (1) recorded, processed, summarized, and reported within the time periods specified in the SEC’s rules and forms, and (2) is accumulated and communicated to our management, including our Chief Executive Officer and Chief Financial Officer, as appropriate to allow timely decisions regarding required disclosures.
Report of Management on Internal Control Over Financial Reporting and Attestation Report of Independent Registered Public Accounting Firm
The report of management on our internal control over financial reporting as of December 31, 2015, and the attestation report of our independent registered public accounting firm on our internal control over financial reporting are set forth in Item 8. Financial Statements and Supplementary Data in this report.
Changes in Internal Control over Financial Reporting
There has been no change in our internal control over financial reporting (as defined in Rule 13a-15(f) under the Exchange Act) during the fourth quarter of 2015 that has materially affected, or is reasonably likely to materially affect, our internal control over financial reporting.
ITEM 9B. | OTHER INFORMATION |
Not applicable.
86
PART III
ITEM 10. | DIRECTORS, EXECUTIVE OFFICERS, AND CORPORATE GOVERNANCE |
Information about our directors is in our proxy statement for the annual meeting of our shareowners to be held on April 26, 2016 (our “2016 Proxy Statement”) under the heading “Proposal 1: Election of Directors — Nominees for Election” and is incorporated into this report by reference.
Set forth below is information as of February 11, 2016, regarding our executive officers:
Name | Age | Principal Occupation During the Past Five Years | ||
John F. Brock | 67 | Chairman and Chief Executive Officer since October 2010. Prior to that, he served as Chairman and Chief Executive Officer of Coca-Cola Enterprises Inc. from April 2008 to October 2010. | ||
Damian P. Gammell | 45 | Chief Operating Officer since October 2015. Prior to that, he served as President and Chief Executive Officer of Anadolu Beverage Group, from 2010 to October 2015. | ||
Laura Brightwell | 49 | Senior Vice President, Public Affairs and Communications since October 2010. Prior to that, she was the Vice President, Public Affairs and Communications for Coca-Cola Enterprises Inc. from March 2007 to October 2010. | ||
Manik H. Jhangiani | 50 | Senior Vice President and Chief Financial Officer since November 2013. Prior to that, he was Vice President, Finance from September 2012 to October 2013. Prior to joining the Company, he was Group Chief Financial Officer with Bharti Enterprises from 2009 to 2012. | ||
Pamela O. Kimmet | 57 | Senior Vice President, Human Resources since October 2010. Prior to that, she served as Senior Vice President, Human Resources of Coca-Cola Enterprises Inc. from June 2008 to October 2010. | ||
Ronald J. Lewis | 49 | Senior Vice President, Supply Chain since April 2015. Prior to that, he was Vice President, Procurement and Chief Procurement Officer of The Coca-Cola Company from November 2011 to March 2015 and Senior Vice President and General Manager of Coca-Cola Refreshments from October 2010 to November 2011. | ||
John R. Parker, Jr. | 64 | Senior Vice President, General Counsel and Strategic Initiatives since October 2010. Prior to that, he was Senior Vice President, General Counsel and Strategic Initiatives of Coca-Cola Enterprises Inc. from June 2008 to October 2010. | ||
Yahya Sezer | 53 | Senior Vice President and Chief Information Officer since October 2010. Prior to that he was the Senior Vice President and Chief Information Officer for Coca-Cola Enterprises Inc. from October 2006 to October 2010. | ||
Suzanne D. Patterson | 54 | Vice President, Controller, and Chief Accounting Officer since October 2010. Prior to that, she was Vice President, Controller, and Chief Accounting Officer for Coca-Cola Enterprises Inc. from May 2009 to October 2010. | ||
Our officers are elected annually by the Board of Directors for terms of one year or until their successors are elected and qualified, subject to removal by the Board at any time.
Information about compliance with the reporting requirements of Section 16(a) of the Exchange Act by our executive officers and directors, persons who own more than 10 percent of our common stock, and their affiliates who are required to comply with such reporting requirements, is incorporated by reference to, and in, our 2016 Proxy Statement under the heading “Stock Ownership - Section 16(a) Beneficial Ownership Reporting Compliance.” Information about the Audit Committee and the Audit Committee Financial Experts is incorporated by reference to, and in, our 2016 Proxy Statement under the heading “Governance - Board of Directors and Committees,” all of which is incorporated into this report by reference. There have been no material changes to the procedures by which shareowners may recommend nominees to our Board of Directors.
87
We have adopted a Code of Business Conduct (Code) for our employees and directors, including, specifically, our chief executive officer, our chief financial officer, our chief accounting officer, and our other executive officers. Our Code satisfies the requirements for a “code of ethics” within the meaning of SEC rules. A copy of the Code is posted on our website, http://www.cokecce.com, under “Corporate Governance” in the “About Us” section. If we amend the Code or grant any waivers under the Code that are applicable to our chief executive officer, our chief financial officer, or our chief accounting officer and that relate to any element of the SEC’s definition of a code of ethics, which we do not anticipate doing, we will promptly post that amendment or waiver on our website.
ITEM 11. | EXECUTIVE COMPENSATION |
Information about director compensation is in our 2016 Proxy Statement under the heading “Governance — Director Compensation,” and information about executive compensation is in our 2016 Proxy Statement under the heading “Executive Compensation,” all of which is incorporated into this report by reference.
ITEM 12. | SECURITY OWNERSHIP OF CERTAIN BENEFICIAL OWNERS AND MANAGEMENT AND RELATED STOCKHOLDER MATTERS |
Information about securities authorized for issuance under equity compensation plans is in our 2016 Proxy Statement under the heading “Executive Compensation - Equity Compensation Plan Information,” and information about ownership of our common stock by certain persons is in our 2016 Proxy Statement under the heading “Proposal 1: Election of Directors - Stock Ownership” all of which is incorporated into this report by reference.
ITEM 13. | CERTAIN RELATIONSHIPS AND RELATED TRANSACTIONS, AND DIRECTOR INDEPENDENCE |
Information about certain transactions between us and certain related persons is in our 2016 Proxy Statement under the heading “Governance - Other Responsibilities and Governance Policies - Certain Related Party Transactions” and is incorporated into this report by reference. Information about director independence is in our 2016 Proxy Statement and is incorporated into this report by reference.
ITEM 14. | PRINCIPAL ACCOUNTING FEES AND SERVICES |
Information about the fees and services provided to us by Ernst & Young LLP is in our 2016 Proxy Statement under the heading “Audit Matters - Other Audit Information” and is incorporated into this report by reference.
88
PART IV
ITEM 15. | EXHIBITS, FINANCIAL STATEMENT SCHEDULES |
(a) (1) Financial Statements. The following documents are filed as a part of this report:
Report of Management.
Report of Independent Registered Public Accounting Firm.
Report of Independent Registered Public Accounting Firm on Internal Control over Financial Reporting.
Consolidated Statements of Income — Years Ended December 31, 2015, 2014, and 2013.
Consolidated Statements of Comprehensive Income — Years Ended December 31, 2015, 2014, and 2013.
Consolidated Balance Sheets — December 31, 2015 and 2014.
Consolidated Statements of Cash Flows — Years Ended December 31, 2015, 2014, and 2013.
Consolidated Statements of Shareowners’ Equity — Years Ended December 31, 2015, 2014, and 2013.
Notes to Consolidated Financial Statements.
(2) Financial Statement Schedules.
All other schedules for which provision is made in the applicable accounting regulations of the SEC have been omitted, either because they are not required under the related instructions or because they are not applicable.
(3) Exhibits.
Exhibit Number | Description | Incorporated by Reference or Filed Herewith. Our Current, Quarterly, and Annual Reports are filed with the Securities and Exchange Commission under File No. 001-34874. Our Registration Statements have the file numbers noted wherever such statements are identified in the exhibit listing. | ||
2.1 | Business Separation and Merger Agreement dated as of February 25, 2010, among Coca-Cola Enterprises, Inc., Coca-Cola Refreshments USA, Inc., The Coca-Cola Company and Cobalt Subsidiary LLC. | Annex A to our Preliminary Proxy Statement/Prospectus in Amendment No. 4 to Registration Statement on Form S-4 (333-167067), filed on August 25, 2010. | ||
2.2 | Norway-Sweden Share Purchase Agreement dated as of March 20, 2010, among Coca-Cola Enterprises, Inc., Coca-Cola Refreshments USA, Inc., The Coca-Cola Company and Bottling Holdings (Luxembourg) s.a.r.l. | Annex B to our Preliminary Proxy Statement/Prospectus in Amendment No. 4 to Registration Statement on Form S-4 (333-167067), filed on August 25, 2010. | ||
2.3 | Amendment No. 1 dated as of September 6, 2010 to the Business Separation and Merger Agreement dated as of February 25, 2010, among Coca-Cola Enterprises, Inc., Coca-Cola Refreshments USA, Inc., The Coca-Cola Company and Cobalt Subsidiary LLC. | Exhibit 2.1 to our Current Report on Form 8-K, filed September 7, 2010. | ||
2.4 | Merger Agreement dated as of August 6, 2015 among Coca-Cola Enterprises, Inc., Spark Orange Limited, Orange U.S. Holdco, LLC, and Orange MergeCo, LLC. (including Exhibit A Transaction Master Agreement and Exhibit B Orange Shareholders’ Agreement). | Exhibit 2.1 to our Current Report on Form 8-K filed on August 11, 2015. | ||
2.5 | Transaction Master Agreement, as amended by the Amendment and Restatement Deed, dated as of December 14, 2015, among the Company, Red, Olive, Orange, MergeCo and US HoldCo.* | Exhibit 2.1 to our Current Report on Form 8-K filed on December 15, 2015. | ||
89
2.6 | Deed of Adherence, dated as of December 14, 2015, among the Company, Red, Olive, Olive HoldCo, Orange, MergeCo and US HoldCo. | Exhibit 2.2 to our Current Report on Form 8-K filed on December 15, 2015. | ||
2.7 | Form of Shareholders’ Agreement among Orange, Olive HoldCo and Red.* | Exhibit 2.3 to our Current Report on Form 8-K filed on December 15, 2015. | ||
2.8 | Form of Black Contribution Agreement between Red and Orange. | Exhibit 2.4 to our Current Report on Form 8-K filed on December 15, 2015. | ||
2.9 | Form of Olive Contribution Agreement between Olive HoldCo and Orange. | Exhibit 2.5 to our Current Report on Form 8-K filed on August 12, 2015. | ||
2.10 | Agreement dated as of August 6, 2015 by and among certain White Director Shareholders, the Coca-Cola Company, Olive and Orange. | Exhibit 2.4 to our Current Report on Form 8-K filed on August 11, 2015. | ||
2.11 | Form of Registration Rights Agreement among Orange, Olive Holdco and Red.** | Exhibit 2.7 to our Current Report on Form 8-K filed on August 11, 2015. | ||
3.1 | Amended and Restated Certificate of Incorporation, as amended. | Exhibit 3.1 to our Current Report on Form 8-K, filed on October 5, 2010. | ||
3.2 | Bylaws of Coca-Cola Enterprises, Inc. | Exhibit 3.1 to our Current Report on Form 8-K, filed on December 19, 2013. | ||
4.1 | Form of Indenture between International CCE Inc. and Deutsche Bank Trust Company Americas, as Trustee. | Exhibit 4.1 to our Post-Effective Amendment No. 1 to Registration Statement on Form S-3 (333-168565), filed on September 1, 2010. | ||
4.2 | Form of 2.125% Notes due 2015. | Exhibit 4.1 to our Current Report on Form 8-K filed on September 14, 2010. | ||
4.3 | Form of 3.500% Notes due 2020. | Exhibit 4.2 to our Current Report on Form 8-K filed on September 14, 2010. | ||
4.4 | Form of 2.000% Notes due 2016. | Exhibit 4.1 to our Current Report on Form 8-K filed on August 19, 2011. | ||
4.5 | Form of 3.250% Notes due 2021. | Exhibit 4.2 to our Current Report on Form 8-K filed on August 19, 2011. | ||
4.6 | Form of 4.500% Notes due 2021. | Exhibit 4.1 to our Current Report on Form 8-K filed on February 18, 2011. | ||
10.1 | Coca-Cola Enterprises, Inc. Deferred Compensation Plan for Nonemployee Directors (Effective October 2, 2010).* | Exhibit 10.1 to our Annual Report on Form 10-K for the fiscal year ended December 31, 2010. | ||
10.2 | Coca-Cola Enterprises, Inc. Supplemental Savings Plan (As Amended and Restated Effective December 18, 2012).* | Exhibit 10.2 to our Annual Report on Form 10-K for the fiscal year ended December 31, 2012. | ||
10.3 | Restated Employment Agreement between John F. Brock and Coca-Cola Enterprises, Inc. (Effective October 21, 2014).* | Exhibit 10.1 to our Quarterly Report on Form 10-Q (Date of Report: September 26, 2014). | ||
10.4 | Employment Agreement between Damian P. Gammell and Coca-Cola Enterprises, Ltd. (Effective October 12, 2015).* | Exhibit 10.1 to our Quarterly Report on Form 10-Q (Date of Report: October 29, 2015). | ||
10.5 | Employment Agreement between Ronald J. Lewis and Coca-Cola Enterprises, Inc. (Effective April 1, 2015).* | Filed herewith. | ||
10.6 | Employment Agreement between Hubert Patricot and Coca-Cola Enterprises Europe, Ltd.* | Exhibit 10.7 to our Annual Report on Form 10-K for the fiscal year ended December 31, 2012. | ||
10.7 | Restated Employment Agreement between Manik Jhangiani and Coca-Cola Enterprises, Ltd. (Effective December 15, 2014).* | Exhibit 10.11 to our Annual Report on Form 10-K for the fiscal year ended December 31, 2014. | ||
90
10.8 | Coca-Cola Enterprises, Inc. Executive Severance Plan (Effective January 1, 2015). | Filed herewith. | ||
10.9.1 | Coca-Cola Enterprises, Inc. 2010 Incentive Award Plan (As Amended Effective February 7, 2012).* | Exhibit 99.1 to our Current Report on Form 8-K (Date of Report: February 9, 2012). | ||
10.9.2 | Form of Performance Share Unit Agreement For Senior Officers in the United States in connection with the Coca-Cola Enterprises, Inc. 2010 Incentive Award Plan (As Amended Effective February 7, 2012).* | Exhibit 10.8.2 to our Annual Report on Form 10-K for the fiscal year ended December 31, 2012. | ||
10.9.3 | Form of Performance Share Unit Agreement For Senior Officers in the United Kingdom in connection with the Coca-Cola Enterprises, Inc. 2010 Incentive Award Plan (As Amended Effective February 7, 2012).* | Exhibit 10.8.3 to our Annual Report on Form 10-K for the fiscal year ended December 31, 2012. | ||
10.9.4 | Form of Stock Option Agreement For Senior Officers in the United States in connection with the Coca-Cola Enterprises, Inc. 2010 Incentive Award Plan (As Amended Effective February 7, 2012).* | Exhibit 10.8.4 to our Annual Report on Form 10-K for the fiscal year ended December 31, 2012. | ||
10.9.5 | Form of Stock Option Agreement For Senior Officers in the United Kingdom in connection with the Coca-Cola Enterprises, Inc. 2010 Incentive Award Plan (As Amended Effective February 7, 2012).* | Exhibit 10.8.5 to our Annual Report on Form 10-K for the fiscal year ended December 31, 2012. | ||
10.9.6 | Form of New Hire Restricted Stock Unit Award for Chief Operating Officer in connection with the Coca-Cola Enterprises, Inc. 2010 Incentive Award Plan (As Amended Effective February 12, 2012). | Exhibit 10.2 to our Quarterly Report Form 10-Q (Date of Report: October 29, 2015). | ||
10.9.7 | 2014 Special Restricted Stock Unit Award Agreement for Hubert Patricot in connection with the Coca-Cola Enterprises, Inc. 2010 Incentive Award Plan (As Amended Effective February 7, 2012). | Exhibit 10.3 to our Quarterly Report on Form 10-Q (Date of Report: April 30, 2015). | ||
10.9.8 | Form of Special Restricted Stock Unit Award Agreement to U.S. Senior Officer in connection with the Coca-Cola Enterprises, Inc. 2010 Incentive Award Plan (As Amended Effective February 7, 2012) for awards made after April 30, 2015. | Exhibit 10.4 to our Quarterly Report on Form 10-Q (Date of Report: April 30, 2015). | ||
10.9.9 | 2012 Annual Restricted Stock Unit Award Agreement to Manik Jhangiani in connection with the 2010 Coca-Cola Enterprises, Inc. Incentive Award Plan (As Amended Effective February 7, 2012).* | Exhibit 10.7 to our Quarterly Report Form 10-Q (Date of Report: September 27, 2013). | ||
10.9.10 | The Coca-Cola Enterprises, Inc. 2010 Incentive Award Plan (Effective October 2, 2010).* | Exhibit 4.1 to our Registration Statement on Form S-8 (Date of Report: October 4, 2010). | ||
10.9.11 | Form of Stock Option Agreement for Senior Officers in the United States in connection with the Coca-Cola Enterprises, Inc. 2010 Incentive Award Plan.* | Exhibit 10.1 to our Current Report on Form 8-K (Date of Report: November 3, 2010). | ||
10.9.12 | Form of Stock Option Agreement for Senior Officers in the United Kingdom in connection with the Coca-Cola Enterprises, Inc. 2010 Incentive Award Plan.* | Exhibit 10.2 to our Current Report on Form 8-K (Date of Report: November 3, 2010). | ||
10.9.13 | Form of Stock Option Agreement for Senior Officers in the United Kingdom in connection with the Coca-Cola Enterprises, Inc. 2010 Incentive Award Plan and the 2010 UK Approved Option Subplan.* | Exhibit 10.3 to our Current Report on Form 8-K (Date of Report: November 3, 2010). | ||
10.10.1 | The Coca-Cola Enterprises, Inc. Legacy Long-Term Incentive Plan As Amended and Restated (Effective December 14, 2010).* | Exhibit 10.9.1 to our Annual Report on Form 10-K for the fiscal year ended December 31, 2010. | ||
91
10.10.2 | Form of 2006 Stock Option Agreement (Chief Executive Officer) in connection with the 2004 Stock Award Plan.*† | Exhibit 10.1 to the Current Report on Form 8-K for Coca-Cola Enterprises Inc., our predecessor entity (SEC File No. 1-09300) (Date of Report: August 3, 2006). | ||
10.10.3 | Form of 2007 Stock Option Agreement (Chief Executive Officer) in connection with the 2007 Incentive Award Plan.*† | Exhibit 10.31 to the Annual Report on Form 10-K for Coca-Cola Enterprises Inc., our predecessor entity (SEC File No. 1-09300) for the fiscal year ended December 31, 2007. | ||
10.10.4 | Form of Stock Option Agreement (Chief Executive Officer and Senior Officers) in connection with the 2007 Incentive Award Plan for Awards after October 29, 2008.*† | Exhibit 10.16.4 to the Annual Report on Form 10-K for Coca-Cola Enterprises Inc., our predecessor entity (SEC File No. 1-09300) for the fiscal year ended December 31, 2008. | ||
10.11 | The Coca-Cola Enterprises, Inc. Executive Long-Term Disability Plan (Effective October 2, 2010).* | Exhibit 10.8 to our Current Report on Form 8-K (Date of Report: October 7, 2010). | ||
10.12.1 | Five Year Credit Agreement, dated as of September 2012, among Coca-Cola Enterprises, Inc., and the lenders party thereto, Citibank N.A., as administrative agent, Deutsche Bank Securities Inc., as syndication agent, Credit Suisse Securities (USA) LLC, as documentation agent, and Citigroup Global Markets Inc., Deutsche Bank Securities Inc., and Credit Suisse Securities (USA) LLC as joint lead arrangers and joint book managers. | Exhibit 10.1 to our Quarterly Report on Form 10-Q (Date of Report: October 26, 2012). | ||
10.12.2 | Amendment to Five-Year Credit Agreement, dated September 20, 2012, among Coca-Cola Enterprises, Inc., and the lenders party thereto, Citibank, N.A., as administrative agent, Deutsche Bank Securities Inc., as syndication agent, Credit Suisse Securities (USA) LLC, as documentation agent, and Citigroup Global Markets Inc., Deutsche Bank Securities Inc. and Credit Suisse Securities (USA) LLC as joint lead arrangers and joint book managers. | Exhibit 10.5 to our Quarterly Report on Form 10-Q (Date of Report: April 30, 2015). | ||
10.13 | Form of Bottler's Agreement made and entered into with effect from October 2, 2010, by and among The Coca-Cola Company, The Coca-Cola Export Corporation, and the bottling subsidiaries of Coca-Cola Enterprises, Inc. | Exhibit 10.2 to our Current Report on Form 8-K filed on October 5, 2010. | ||
10.14 | Incidence Pricing Agreement dated as of October 2, 2010 between Coca-Cola Enterprises, Inc. and The Coca-Cola Company. | Exhibit 10.3 to our Current Report on Form 8-K filed on October 5, 2010. | ||
10.15 | Incidence Pricing Agreement dated as of October 19, 2015, between Coca-Cola Enterprises, Inc. and The Coca-Cola Company (Effective January 1, 2016). | Exhibit 10.3 to our Quarterly Report on Form 10-Q (Date of Report: October 29, 2015). | ||
10.16 | Form of Corporate Name Letter dated as of October 2, 2010 by and among Coca-Cola Enterprises, Inc., The Coca-Cola Company, The Coca-Cola Export Corporation, and the bottling subsidiaries of Coca-Cola Enterprises, Inc. | Exhibit 10.4 to our Current Report on Form 8-K filed on October 5, 2010. | ||
10.17 | Tax Sharing Agreement dated February 25, 2010 among Coca-Cola Enterprises, Inc., Coca-Cola Refreshments USA, Inc., and The Coca-Cola Company. | Exhibit 10.5 to our Current Report on Form 8-K filed on October 5, 2010. | ||
10.18 | Rules of the Coca-Cola Enterprises Belgian, Coca-Cola Enterprises Services Belgium and Luxembourg Stock Savings Plan (As Amended and Restated Effective January 1, 2014). | Exhibit 10.1 to our Quarterly Report on Form 10-Q (Date of Report: April 30, 2015). | ||
10.19 | Trust Deed and Rules of Coca-Cola Enterprises UK Share Plan (Effective 2010 and Amended on December 10, 2014). | Exhibit 10.2 to our Quarterly Report on Form 10-Q (Date of Report: April 30, 2015). | ||
92
10.20 | Form of Director Indemnification Agreement. | Exhibit 10.20 to our Annual Report on Form 10-K for the fiscal year ended December 31, 2011. | ||
12 | Ratio of Earnings to Fixed Charges. | Filed herewith. | ||
21 | Subsidiaries of Coca-Cola Enterprises, Inc. | Filed herewith. | ||
23 | Consent of Independent Registered Public Accounting Firm. | Filed herewith. | ||
24 | Powers of Attorney. | Filed herewith. | ||
31.1 | Certification of John F. Brock, Chairman and Chief Executive Officer of Coca-Cola Enterprises, Inc. pursuant to Section 302 of the Sarbanes-Oxley Act of 2002. | Filed herewith. | ||
31.2 | Certification of Manik H. Jhangiani, Senior Vice President and Chief Financial Officer of Coca-Cola Enterprises, Inc. pursuant to Section 302 of the Sarbanes-Oxley Act of 2002. | Filed herewith. | ||
32.1 | Certification of John F. Brock, Chairman and Chief Executive Officer of Coca-Cola Enterprises, Inc. pursuant to Section 906 of the Sarbanes-Oxley Act of 2002. | Filed herewith. | ||
32.2 | Certification of Manik H. Jhangiani, Senior Vice President and Chief Financial Officer of Coca-Cola Enterprises, Inc. pursuant to Section 906 of the Sarbanes-Oxley Act of 2002. | Filed herewith. | ||
101.INS | XBRL Instance Document. | Filed herewith. | ||
101.SCH | XBRL Taxonomy Extension Schema Document. | Filed herewith. | ||
101.CAL | XBRL Taxonomy Extension Calculation Linkbase Document. | Filed herewith. | ||
101.DEF | XBRL Taxonomy Extension Definition Linkbase Document. | Filed herewith. | ||
101.LAB | XBRL Taxonomy Extension Label Linkbase Document. | Filed herewith. | ||
101.PRE | XBRL Taxonomy Extension Presentation Linkbase Document. | Filed herewith. | ||
___________________________
* | Management contracts and compensatory plans or arrangements required to be filed as exhibits to this form, pursuant to Item 15(b). | |
** | Certain annexes and/or schedules have been omitted and the Company agrees to furnish supplemental to the Commission a copy of any omitted annexes and/or schedules upon request. | |
† | The outstanding awards under the Coca-Cola Enterprises, Inc. Legacy Long-Term Incentive Plan were assumed by the registrant in connection with its separation from its predecessor entity, Coca-Cola Enterprises Inc. (SEC File No. 1-09300) on October 2, 2010. | |
93
SIGNATURES
Pursuant to the requirements of Section 13 or 15(d) of the Securities Exchange Act of 1934, the Registrant has duly caused this report to be signed on its behalf by the undersigned, thereunto duly authorized.
COCA-COLA ENTERPRISES, INC. (Registrant) | |||
By: | /s/ JOHN F. BROCK | ||
John F. Brock | |||
Chairman and Chief Executive Officer | |||
Date: February 11, 2016
Pursuant to requirements of the Securities Exchange Act of 1934, this report has been signed below by the following persons on behalf of the Registrant and in the capacities and on the dates indicated.
94
Signature | Title | Date | ||
/s/ JOHN F. BROCK | Chairman and Chief Executive Officer (principal executive officer) | February 11, 2016 | ||
(John F. Brock) | ||||
/s/ MANIK H. JHANGIANI | Senior Vice President and Chief Financial Officer (principal financial officer) | February 11, 2016 | ||
(Manik H. Jhangiani) | ||||
/s/ SUZANNE D. PATTERSON | Vice President, Controller and Chief Accounting Officer (principal accounting officer) | February 11, 2016 | ||
(Suzanne D. Patterson) | ||||
* | Director | February 11, 2016 | ||
(Jan Bennink) | ||||
* | Director | February 11, 2016 | ||
(Calvin Darden) | ||||
* | Director | February 11, 2016 | ||
(L. Phillip Humann) | ||||
* | Director | February 11, 2016 | ||
(Orrin H. Ingram II) | ||||
* | Director | February 11, 2016 | ||
(Thomas H. Johnson) | ||||
* | Director | February 11, 2016 | ||
(Véronique Morali) | ||||
* | Director | February 11, 2016 | ||
(Andrea Saia) | ||||
* | Director | February 11, 2016 | ||
(Garry Watts) | ||||
* | Director | February 11, 2016 | ||
(Curtis R. Welling) | ||||
* | Director | February 11, 2016 | ||
(Phoebe A. Wood) | ||||
*By: | /s/ JOHN R. PARKER, JR |
John R. Parker, Jr | |
Attorney-in-Fact | |
95