Attached files
| file | filename |
|---|---|
| EX-32 - EXHIBIT 32 - BankFinancial CORP | bfin-20153112x10xkxex32.htm |
| EX-31.1 - EXHIBIT 31.1 - BankFinancial CORP | bfin2015311210-kex311ceo.htm |
| EX-31.2 - EXHIBIT 31.2 - BankFinancial CORP | bfin2015311210-kex312cfo.htm |
| EX-23 - EXHIBIT 23 - BankFinancial CORP | bfin-20153112x10xkxex23con.htm |
UNITED STATES
SECURITIES AND EXCHANGE COMMISSION
WASHINGTON, D.C. 20549
FORM 10-K
x | ANNUAL REPORT PURSUANT TO SECTION 13 OR 15(d) OF THE SECURITIES EXCHANGE ACT OF 1934 |
For the fiscal year ended December 31, 2015
or
¨ | TRANSITION REPORT PURSUANT TO SECTION 13 OR 15(d) OF THE SECURITIES EXCHANGE ACT OF 1934 |
For transition period from to
Commission File Number 0-51331
BANKFINANCIAL CORPORATION
(Exact Name of Registrant as Specified Its Charter)
Maryland | 75-3199276 |
(State or Other Jurisdiction of Incorporation) | (I.R.S. Employer Identification No.) |
15W060 North Frontage Road, Burr Ridge, Illinois 60527 | |
(Address of Principal Executive Offices) | |
Registrant’s telephone number, including area code: (800) 894-6900
Securities registered pursuant to Section 12(b) of the Act:
Title of Each Class: | Name of Each Exchange on Which Registered: |
Common Stock, par value $0.01 per share | The NASDAQ Stock Market |
Securities registered pursuant to Section 12(g) of the Act: None
Indicate by check mark whether the issuer is a well-known seasoned issuer as defined in Rule 405 of the Securities Act. Yes ¨ No x.
Indicate by check mark if the registrant is not required to file reports pursuant to Section 13 or Section 15(d) of the Act. Yes ¨ No x.
Indicate by check mark whether the registrant (1) has filed all reports required to be filed by Section 13 or 15(d) of the Securities Exchange Act of 1934 during the preceding 12 months (or for such shorter period that the registrant was required to file such reports), and (2) has been subject to such filing requirements for the past 90 days. Yes x No ¨
Indicate by check mark whether the registrant has submitted electronically and posted on its corporate Web site, if any, every Interactive Data File required to be submitted and posted pursuant to Rule 405 of Regulation S-T during the preceding 12 months (or for such shorter period that the registrant was required to submit and post such files). Yes x No ¨
Indicate by check mark if disclosure of delinquent filers pursuant to Item 405 of Regulation S-K is not contained herein, and will not be contained, to the best of registrant's knowledge, in definitive proxy or information statements incorporated by reference in Part III of this Form 10-K or any amendment to the Form 10-K Yes x No ¨
Indicate by check mark whether the registrant is a large accelerated filer, an accelerated filer, a non-accelerated filer, or a smaller reporting company. See definitions of “large accelerated filer,” “accelerated filer” and “smaller reporting company” in Rule 12b-2 of the Exchange Act. (Check one):
Large accelerated filer | ¨ | Accelerated filer | x | |||
Non-accelerated filer | ¨ | Smaller reporting company | ¨ | |||
Indicate by check mark whether the registrant is a shell company (as defined in Rule 12b-2 of the Exchange Act). Yes ¨ No x.
The aggregate market value of the registrant’s outstanding common stock held by non-affiliates on June 30, 2015, determined using a per share closing price on that date of $11.78, as quoted on The Nasdaq Global Select Market, was $208.1 million.
At February 8, 2016, there were 20,200,000 shares of common stock, $0.01 par value, outstanding.
DOCUMENTS INCORPORATED BY REFERENCE
None
BANKFINANCIAL CORPORATION
Form 10-K Annual Report
Table of Contents
Page Number | ||
Item 1. | ||
Item 1A. | ||
Item 1B. | ||
Item 2. | ||
Item 3. | ||
Item 4. | ||
Item 5. | ||
Item 6. | ||
Item 7. | ||
Item 7A. | ||
Item 8. | ||
Item 9. | ||
Item 9A. | ||
Item 9B. | ||
Item 10. | Directors, Executive Officers and Corporate Governance | |
Item 11. | ||
Item 12. | ||
Item 13. | Certain Relationships and Related Transactions, and Director Independence | |
Item 14. | ||
Item 15. | ||
PART I
ITEM 1. | BUSINESS |
Forward Looking Statements
This Annual Report on Form 10-K contains, and other periodic and current reports, press releases and other public stockholder communications of BankFinancial Corporation may contain, forward-looking statements within the meaning of Section 21E of the Securities Exchange Act of 1934, as amended, which involve significant risks and uncertainties. Forward-looking statements may include statements relating to our future plans, strategies and expectations, as well as our future revenues, expenses, earnings, losses, financial performance, financial condition, asset quality metrics and future prospects. Forward looking statements are generally identifiable by use of the words “believe,” “may,” “will,” “should,” “could,” “expect,” “estimate,” “intend,” “anticipate,” “project,” “plan,” or similar expressions. Forward looking statements are frequently based on assumptions that may or may not materialize, and are subject to numerous uncertainties that could cause actual results to differ materially from those anticipated in the forward looking statements. We intend all forward-looking statements to be covered by the safe harbor provisions for forward-looking statements contained in the Private Securities Litigation Reform Act of 1995, and are including this statement for the purpose of invoking these safe harbor provisions.
Factors that could cause actual results to differ materially from the results anticipated or projected and which could materially and adversely affect our operating results, financial condition or future prospects include, but are not limited to: (i) less than anticipated loan growth due to intense competition for high quality loans and leases, particularly in terms of pricing and credit underwriting, or a dearth of borrowers who meet our underwriting standards; (ii) the impact of re-pricing and competitors’ pricing initiatives on loan and deposit products; (iii) interest rate movements and their impact on the economy, customer behavior and our net interest margin; (iv) adverse economic conditions in general and in the Chicago metropolitan area in particular that could result in increased delinquencies in our loan portfolio or a decline in the value of our investment securities and the collateral for our loans; (v) declines in real estate values that adversely impact the value of our loan collateral, Other Real Estate Owned ("OREO"), asset dispositions and the level of borrower equity in their investments; (vi) borrowers that experience legal or financial difficulties that we do not currently foresee; (vii) results of supervisory monitoring or examinations by regulatory authorities, including the possibility that a regulatory authority could, among other things, require us to increase our allowance for loan losses or adversely change our loan classifications, write-down assets, reduce credit concentrations or maintain specific capital levels; (viii) changes, disruptions or illiquidity in national or global financial markets; (ix) the credit risks of lending activities, including risks that could cause changes in the level and direction of loan delinquencies and charge-offs or changes in estimates relating to the computation of our allowance for loan losses; (x) monetary and fiscal policies of the U.S. Government, including policies of the U.S. Treasury and the Federal Reserve Board; (xi) factors affecting our ability to access deposits or cost-effective funding, and the impact of competitors' pricing initiatives on our deposit products; (xii) the impact of new legislation or regulatory changes, including the Dodd-Frank Act and Basel III, on our products, services, operations and operating expenses; (xiii) higher federal deposit insurance premiums; (xiv) higher than expected overhead, infrastructure and compliance costs; (xv) changes in accounting principles, policies or guidelines; and (xvi) privacy and cybersecurity risks, including the risks of business interruption and the compromise of confidential customer information resulting from intrusions.
These risks and uncertainties, as well as the Risk Factors set forth in Item 1A below, should be considered in evaluating forward-looking statements and undue reliance should not be placed on such statements. Forward looking statements speak only as of the date they are made. We do not undertake any obligation to update any forward-looking statement in the future, or to reflect circumstances and events that occur after the date on which the forward-looking statement was made.
BankFinancial Corporation
BankFinancial Corporation, a Maryland corporation headquartered in Burr Ridge, Illinois (the “Company”), became the owner of all of the issued and outstanding capital stock of BankFinancial, F.S.B. (the “Bank”) on June 23, 2005, when we consummated a plan of conversion and reorganization that the Bank and its predecessor holding companies, BankFinancial MHC, Inc. and BankFinancial Corporation, a federal corporation, adopted on August 25, 2004. BankFinancial Corporation, the Maryland corporation, was organized in 2004 to facilitate the mutual-to-stock conversion and to become the holding company for the Bank upon its completion.
As part of the mutual-to-stock conversion, BankFinancial Corporation, the Maryland corporation, sold 24,466,250 shares of common stock in a subscription offering for $10.00 per share. The separate corporate existences of BankFinancial MHC and BankFinancial Corporation, the federal corporation, ceased upon the completion of the mutual-to-stock conversion. For a further discussion of the mutual-to-stock conversion, see our Prospectus as filed on April 29, 2005 with the Securities and Exchange
1
Commission (“SEC”) pursuant to Rule 424(b)(3) of the Rules and Regulations of the Securities Act of 1933 (File Number 333-119217).
We manage our operations as one unit, and thus do not have separate operating segments. Our chief operating decision-makers use consolidated results to make operating and strategic decisions.
BankFinancial, F.S.B.
The Bank is a full-service, community-oriented federal savings bank principally engaged in the business of commercial, family and personal banking. The Bank offers our customers a broad range of loan, deposit, and other financial products and services through 19 full-service Illinois based banking offices located in Cook, DuPage, Lake and Will Counties, and through our Internet Branch, www.bankfinancial.com.
The Bank’s primary business is making loans and accepting deposits. The Bank also offers our customers a variety of financial products and services that are related or ancillary to loans and deposits, including cash management, funds transfers, bill payment and other online and mobile banking transactions, automated teller machines, safe deposit boxes, trust services, wealth management, and general insurance agency services.
The Bank’s primary lending area consists of the counties where our branch offices are located, and contiguous counties in the State of Illinois. We derive the most significant portion of our revenues from these geographic areas. However, we also engage in multi-family lending activities in selected Metropolitan Statistical Areas outside our primary lending area and engage in healthcare lending and commercial leasing activities on a nationwide basis.
We originate deposits predominantly from the areas where our branch offices are located. We rely on our favorable locations, customer service, competitive pricing, our Internet Branch and related deposit services such as cash management to attract and retain these deposits. While we accept certificates of deposit in excess of the Federal Deposit Insurance Corporation (“FDIC”) deposit insurance limits, we generally do not solicit such deposits because they are more difficult to retain than core deposits and at times are more costly than wholesale deposits.
Lending Activities
Our loan portfolio consists primarily of investment and business loans (multi-family, nonresidential real estate, commercial, construction and land loans, and commercial leases), which represented $1.079 billion, or 87.0%, of our gross loan portfolio of $1.240 billion at December 31, 2015. At December 31, 2015, $506.0 million, or 40.8%, of our loan portfolio consisted of multi-family mortgage loans; $226.7 million, or 18.3%, of our loan portfolio consisted of nonresidential real estate loans; $79.5 million, or 6.4%, of our loan portfolio consisted of commercial loans; $265.4 million, or 21.4%, of our loan portfolio consisted of commercial leases; and $1.3 million, or 0.1%, of our loan portfolio consisted of construction and land loans. $159.5 million, or 12.9%, of our loan portfolio consisted of one-to-four family residential mortgage loans (of which $44.5 million, or 3.6%, were loans to investors in non-owner occupied single-family homes), including home equity loans and lines of credit.
Deposit Activities
Our deposit accounts consist principally of savings accounts, NOW accounts, checking accounts, money market accounts, certificates of deposit, and IRAs and other retirement accounts. We provide commercial checking accounts and related services such as cash management. We also provide low-cost checking account services. We rely on our favorable locations, customer service, competitive pricing, our Internet Branch and related deposit services such as cash management to attract and retain deposit accounts.
At December 31, 2015, our deposits totaled $1.213 billion. Interest-bearing deposits totaled $958.1 million, or 79.0%, and noninterest-bearing demand deposits totaled $254.8 million, or 21.0%. Savings, money market and NOW account deposits totaled $735.4 million, and certificates of deposit totaled $222.7 million, or 18.4%, of which $151.5 million had maturities of one year or less.
Related Products and Services
The Bank provides trust and financial planning services through our Trust Department. The Bank’s Wealth Management Group provides investment, financial planning and other wealth management services through arrangements with a third-party broker-dealer. The Bank’s wholly-owned subsidiary, Financial Assurance Services, Inc. (“Financial Assurance”), sells property and casualty insurance and other insurance products on an agency basis. During the year ended December 31, 2015, Financial Assurance recorded a net loss of $44,000. At December 31, 2015, Financial Assurance had two full-time employees. The Bank’s other wholly-owned subsidiary, BF Asset Recovery Corporation, holds title to and sells certain Company-owned real estate acquired through foreclosure and collection actions, and recorded a net loss of $696,000 for the year ended December 31, 2015.
2
Website and Stockholder Information
The website for the Company and the Bank is www.bankfinancial.com. Information on this website does not constitute part of this Annual Report on Form 10-K.
The Company makes available, free of charge, its Annual Report on Form 10-K, its Quarterly Reports on Form 10-Q, its Current Reports on Form 8-K and amendments to such reports filed or furnished pursuant to Section 13(a) or 15(d) of the Securities Exchange Act of 1934, as amended (“Exchange Act”), as soon as reasonably practicable after such forms are filed with or furnished to the SEC. Copies of these documents are available to stockholders at the website for the Company and the Bank, www.bankfinancial.com, under Investor Relations, and through the EDGAR database on the SEC’s website, www.sec.gov.
Competition
We face significant competition in originating loans and attracting deposits. The Chicago Metropolitan Statistical Area and the other markets in which we operate generally have a high concentration of financial institutions, many of which are significantly larger institutions that have greater financial resources than we have, and many of which are our competitors to varying degrees. Our competition for loans and leases comes principally from commercial banks, savings banks, mortgage banking companies, the U.S. Government, credit unions, leasing companies, insurance companies, real estate conduits and other companies that provide financial services to businesses and individuals. Our most direct competition for deposits has historically come from commercial banks, savings banks and credit unions. We face additional competition for deposits from online financial institutions and non-depository competitors such as the mutual fund industry, securities and brokerage firms and insurance companies.
We seek to meet this competition by emphasizing personalized service and efficient decision-making tailored to individual needs. In addition, we from time to time reward long-standing relationships with preferred rates and terms on deposit products based on existing and prospective lending business. We do not rely on any individual, group or entity for a material portion of our loans or our deposits.
Employees
At December 31, 2015, we had 230 full-time employees and 43 part-time employees. The employees are not represented by a collective bargaining unit and we consider our working relationship with our employees to be good.
Supervision and Regulation
General
As a federally chartered savings bank, the Bank is regulated and supervised primarily by the Office of the Comptroller of the Currency (“OCC”). The Bank is also subject to regulation by the FDIC in more limited circumstances because the Bank’s deposits are insured by the FDIC. This regulatory and supervisory structure establishes a comprehensive framework of activities in which a financial institution may engage, and is intended primarily for the protection of the FDIC’s deposit insurance fund, depositors and the banking system. Under this system of federal regulation, financial institutions are periodically examined to ensure that they satisfy applicable standards with respect to their capital adequacy, assets, management, earnings, liquidity and sensitivity to market interest rates. The OCC examines the Bank and prepares reports for the consideration of its Board of Directors on any identified deficiencies. After completing an examination, the OCC issues a report of examination and assigns a rating (known as an institution’s CAMELS rating). Under federal law and regulations, an institution may not disclose the contents of its reports of examination or its CAMELS ratings to the public.
The Bank is a member of, and owns stock in, the Federal Home Loan Bank of Chicago (“FHLBC”), which is one of the 12 regional banks in the Federal Home Loan Bank System. The Bank also is regulated by the Board of Governors of the Federal Reserve System (“FRB”) with regard to reserves it must maintain against deposits, dividends and other matters. The Bank’s relationship with its depositors and borrowers also is regulated in some respects by both federal and state laws, especially in matters concerning the ownership of deposit accounts, and the form and content of the Bank’s consumer loan documents.
The Dodd-Frank Wall Street Reform and Consumer Protection Act (“Dodd-Frank Act”) of 2010, provided for the transfer of the authority for regulating and supervising federal savings banks from the Office of Thrift Supervision (“OTS”), the Bank’s previous regulator, to the OCC. The Dodd-Frank Act also provided for the transfer of authority for regulating and supervising savings and loan holding companies and their non-depository subsidiaries from the OTS to the FRB. The transfers occurred in 2011. The Dodd-Frank Act also created a new federal agency, the Consumer Financial Protection Bureau (“CFPB”), as an independent bureau within the FRB system, to conduct rule-making, supervision, and enforcement of federal consumer financial protection and fair lending laws and regulations. The CFPB has examination and primary enforcement authority in connection with these laws and regulations for depository institutions with total assets of more than $10 billion. Depository institutions with $10 billion or less in
3
total assets, such as the Bank, continue to be examined for compliance with these laws and regulations by their primary federal regulators, and remain subject to their enforcement authority.
There can be no assurance that laws, rules and regulations, and regulatory policies will not change in the future, and change could make compliance more difficult or expensive or otherwise adversely affect our business, financial condition, results of operations or prospects. Any change in these laws or regulations, or in regulatory policy, whether by the OCC, the FDIC, the FRB, the CFPB or Congress, could have a material adverse impact on the Company, the Bank and their respective operations. The following summary of laws and regulations applicable to the Bank and Company is not intended to be exhaustive and is qualified in its entirety by reference to the actual laws and regulations involved.
Federal Banking Regulation
Business Activities. As a federal savings bank, the Bank derives its lending and investment powers from the Home Owners’ Loan Act, as amended, and the regulations, pronouncements or guidance of the OCC. Under these laws and regulations, the Bank may invest in mortgage loans secured by residential and nonresidential real estate, commercial business and consumer loans, certain types of securities and certain other loans and assets. Specifically, the Bank may originate, invest in, sell, or purchase unlimited loans on the security of residential real estate, while loans on nonresidential real estate generally may not, on a combined basis, exceed 400% of the Bank’s total capital. In addition, secured and unsecured commercial loans and certain types of commercial personal property leases may not exceed 20% of the Bank’s assets; however, amounts in excess of 10% of assets may only be used for small business loans. Further, the Bank may generally invest up to 35% of its assets in consumer loans, corporate debt securities and commercial paper on a combined basis, and up to the greater of its capital or 5% of its assets in unsecured construction loans. The Bank may invest up to 10% of its assets in tangible personal property, for rental or sale. Certain leases on tangible personal property are not aggregated with commercial or consumer loans for the purposes of determining compliance with the limitations set forth for those investment categories. The Bank also may establish subsidiaries that may engage in activities not otherwise permissible for the Bank directly, including real estate investment and insurance agency activities. A violation of the lending and investment limitations may be subject to the same enforcement mechanisms of the primary federal regulator as other violations of a law or regulation.
Capital Requirements. Federal regulations require federally insured depository institutions to meet several minimum capital standards: a common equity Tier 1 capital to risk-based assets ratio of 4.5%, a Tier 1 capital to risk-based assets ratio of 6.0%, a total capital to risk-based assets of 8.0%, and a 4.0% Tier 1 capital to total assets leverage ratio. These capital requirements were effective January 1, 2015 and are the result of a final rule implementing recommendations of the Basel Committee on Banking Supervision and certain requirements of the Dodd-Frank Act.
In determining the amount of risk-weighted assets for purposes of calculating risk-based capital ratios, all assets, including certain off-balance sheet assets (e.g., recourse obligations, direct credit substitutes, residual interests) are multiplied by a risk weight factor assigned by the regulations based on the risks believed inherent in the type of asset. Higher levels of capital are required for asset categories believed to present greater risk. Common equity Tier 1 capital is generally defined as common stockholders’ equity and retained earnings. Tier 1 capital is generally defined as common equity Tier 1 and additional Tier 1 capital. Additional Tier 1 capital includes certain noncumulative perpetual preferred stock and related surplus and minority interests in equity accounts of consolidated subsidiaries. Total capital includes Tier 1 capital (common equity Tier 1 capital plus additional Tier 1 capital) and Tier 2 capital. Tier 2 capital is comprised of capital instruments and related surplus, meeting specified requirements, and may include cumulative preferred stock and long-term perpetual preferred stock, mandatory convertible securities, intermediate preferred stock and subordinated debt. Also included in Tier 2 capital is the allowance for loan and lease losses limited to a maximum of 1.25% of risk-weighted assets and, for institutions that have exercised an opt-out election regarding the treatment of Accumulated Other Comprehensive Income, up to 45% of net unrealized gains on available-for-sale equity securities with readily determinable fair market values. Calculation of all types of regulatory capital is subject to deductions and adjustments specified in the regulations. In assessing an institution’s capital adequacy, the OCC takes into consideration, not only these numeric factors, but qualitative factors as well, and has the authority to establish higher capital requirements for individual institutions where deemed necessary.
In addition to establishing the minimum regulatory capital requirements, the regulations limit capital distributions and certain discretionary bonus payments to management if the institution does not hold a “capital conservation buffer” consisting of 2.5% of common equity Tier 1 capital to risk-weighted asset above the amount necessary to meet its minimum risk-based capital requirements. The capital conservation buffer requirement is being phased in beginning January 1, 2016 at 0.625% of risk-weighted assets and increasing each year until fully implemented at 2.5% on January 1, 2019.
At December 31, 2015, the Bank’s capital exceeded all applicable regulatory requirements and the Bank was considered well capitalized.
4
The Company and the Bank each have adopted Regulatory Capital Plans that require the Bank to maintain a Tier 1 leverage ratio of at least 8% and a total risk-based capital ratio of at least 12%. The minimum capital ratios set forth in the Regulatory Capital Plans will be increased and other minimum capital requirements will be established if and as necessary. In accordance with the Regulatory Capital Plans, neither the Company nor the Bank will pursue any acquisition or growth opportunity, declare any dividend or conduct any stock repurchase that would cause the Bank's total risk-based capital ratio and/or its Tier 1 leverage ratio to fall below the established minimum capital levels. In addition, in accordance with its Regulatory Capital Plan, the Company will continue to maintain its ability to serve as a source of financial strength to the Bank by holding at least $5.0 million of cash or liquid assets for that purpose.
Loans-to-One-Borrower. A federal savings bank generally may not make a loan or extend credit to a single or related group of borrowers in excess of 15% of unimpaired capital and surplus. An additional amount may be loaned, equal to 10% of unimpaired capital and surplus, if the loan is secured by readily marketable collateral, which generally does not include real estate. As of December 31, 2015, the Bank was in compliance with the loans-to-one-borrower limitations.
Qualified Thrift Lender Test. As a federal savings bank, the Bank is subject to a qualified thrift lender (“QTL”) test. Under the QTL test, the Bank must maintain at least 65% of its “portfolio assets” in “qualified thrift investments” in at least nine months of the most recent 12-month period. “Portfolio assets” generally means the total assets of a savings institution, less the sum of specified liquid assets up to 20% of total assets, goodwill and other intangible assets, and the value of property used in the conduct of the federal savings bank’s business.
“Qualified thrift investments” include various types of loans made for residential and housing purposes, investments related to those purposes, including certain mortgage-backed and related securities, and loans for personal, family, household and certain other purposes up to a limit of 20% of portfolio assets. “Qualified thrift investments” also include 100% of an institution’s credit card loans, education loans and small business loans. The Bank also may satisfy the QTL test by qualifying as a “domestic building and loan association” as defined in the Internal Revenue Code of 1986. At December 31, 2015, the Bank satisfied the QTL test. A federal savings bank that fails the QTL test must operate under specified restrictions, including limits on growth, branching, new investment and dividends. As a result of the Dodd-Frank Act, noncompliance with the QTL test is subject to regulatory enforcement action as a violation of law.
Capital Distributions. The regulations of the OCC govern capital distributions by a federal savings bank, which include cash dividends, stock repurchases and other transactions charged to the institution’s capital account. A federal savings bank must file an application for approval of a capital distribution if:
• | the total capital distributions for the applicable calendar year exceed the sum of the institution’s net income for that year to date plus the federal savings bank’s retained net income for the preceding two years; |
• | the institution would not be at least adequately capitalized following the distribution; |
• | the distribution would violate any applicable statute, regulation, agreement or OCC-imposed condition; or |
• | the institution is not eligible for expedited treatment of its filings. |
At December 31, 2015, the Bank would have been required to file an application with the OCC for approval of a capital distribution to the Company only if the proposed capital distribution, together with Bank’s total capital distributions for the 2015, exceeded the sum of the Bank’s net income for 2015 plus the Bank’s retained net income for the preceding two years. Whether or not an application to the OCC is required, every federal savings bank that is a subsidiary of a holding company must file a notice with the FRB at least 30 days before the board of directors declares a dividend or approves a capital distribution. If the dividend or other capital distribution does not require prior OCC approval, the OCC must concurrently be provided with an informational copy of the notice given to the FRB.
The FRB may disapprove a notice or application if:
• | the federal savings bank would be undercapitalized following the distribution; |
• | the proposed capital distribution raises safety and soundness concerns; or |
• | the capital distribution would violate a prohibition contained in any statute, regulation or agreement. |
Liquidity. A federal savings bank is required to maintain a sufficient amount of liquid assets to ensure its safe and sound operation.
Community Reinvestment Act and Fair Lending Laws. All federal savings banks have a responsibility under the Community Reinvestment Act (“CRA”) and related federal regulations to help meet the credit needs of their communities, including low- and moderate- income neighborhoods. In connection with its examination of a federal savings bank, the OCC is required to evaluate
5
and rate the federal savings bank’s record of compliance with the CRA. In addition, the Equal Credit Opportunity Act and the Fair Housing Act prohibit lenders from discriminating in their lending practices based on the characteristics specified in those statutes. A federal savings bank’s failure to comply with the provisions of the CRA could, at a minimum, result in regulatory restrictions on its activities. The failure to comply with the Equal Credit Opportunity Act and the Fair Housing Act could result in enforcement actions by the OCC, as well as other federal regulatory agencies and the Department of Justice. The Bank’s CRA performance has been rated as “Outstanding,” the highest possible rating, in all of the seven CRA Performance Evaluations that have been conducted since 1998.
Privacy Standards. Financial institutions are subject to regulations implementing the privacy protection provisions of the Gramm-Leach-Bliley Act. These regulations require the Bank to disclose its privacy policy, including identifying with whom it shares “nonpublic personal information” to customers at the time of establishing the customer relationship and annually thereafter. In addition, the Bank is required to provide its customers with the ability to “opt-out” of or consent to having the Bank share their nonpublic personal information with unaffiliated third parties before it can disclose such information, subject to certain exceptions. The implementation of these regulations did not have a material adverse effect on the Bank. The Gramm-Leach-Bliley Act also allows each state to enact legislation that is more protective of consumers’ personal information.
The OCC and other federal banking agencies have adopted guidelines establishing standards for safeguarding customer information to implement certain provisions of the Gramm-Leach-Bliley Act. The guidelines describe the agencies’ expectations for the creation, implementation and maintenance of an information security program, which would include administrative, technical and physical safeguards appropriate to the size and complexity of a financial institution and the nature and scope of its activities. The standards set forth in the guidelines are intended to ensure the security and confidentiality of customer records and information, to protect against any anticipated threats or hazards to the security or integrity of such records, and to protect against unauthorized access to or use of such records or other information that could result in substantial harm or inconvenience to any customer. The Bank has implemented these guidelines, and such implementation has not had a material adverse effect on our operations.
Transactions with Related Parties. A federal savings bank’s authority to engage in transactions with its “affiliates” is limited by OCC regulations and by Sections 23A and 23B of the Federal Reserve Act and its implementing regulation, Regulation W. The term “affiliates” for these purposes generally means any company that controls or is under common control with an insured depository institution, although subsidiaries of federal savings banks are generally not considered affiliates for the purposes of Sections 23A and 23B of the Federal Reserve Act. The Company is an affiliate of the Bank. In general, transactions with affiliates must be on terms that are as favorable to the federal savings bank as comparable transactions with non-affiliates. In addition, certain types of these transactions are restricted to an aggregate percentage of the federal savings bank’s capital. Collateral in specified amounts must usually be provided by affiliates in order to receive loans from the federal savings bank. Federal regulations also prohibit a federal savings bank from lending to any of its affiliates that are engaged in activities that are not permissible for bank holding companies, and from purchasing the securities of any affiliate, other than a subsidiary.
The Bank’s authority to extend credit to its directors, executive officers and 10% stockholders, as well as to entities controlled by such persons, is currently governed by the requirements of Sections 22(g) and 22(h) of the Federal Reserve Act and Regulation O of the Federal Reserve Board. Among other things, these provisions require that extensions of credit to insiders be made on terms that are substantially the same as, and follow credit underwriting procedures that are not less stringent than, those prevailing for comparable transactions with unaffiliated persons and that do not involve more than the normal risk of repayment or present other unfavorable features, and not exceed certain limitations on the amount of credit extended to such persons, individually and in the aggregate, which limits are based, in part, on the amount of the Bank’s capital. In addition, extensions of credit in excess of certain limits must receive the prior approval of the Bank’s Board of Directors.
Enforcement. The OCC has primary enforcement responsibility over federal savings banks, and this includes the authority to bring enforcement action against the Bank and all “institution-affiliated parties,” including stockholders, attorneys, appraisers and accountants who knowingly or recklessly participate in wrongful action likely to have an adverse effect on an insured institution. Formal enforcement action may range from the issuance of a capital directive or cease and desist order to the removal of officers and/or directors, receivership, conservatorship or the termination of deposit insurance. Civil monetary penalties cover a wide range of violations and actions, and range up to $25,000 per day, unless a finding of reckless disregard is made, in which case penalties may be as high as $1 million per day. The FDIC also has the authority to recommend to the OCC that an enforcement action be taken with respect to a particular savings institution. If action is not taken by the OCC, the FDIC has authority to take action under specified circumstances.
Standards for Safety and Soundness. Federal law requires each federal banking agency to prescribe certain standards for all insured depository institutions. These standards relate to, among other things, internal controls, information systems and audit systems, loan documentation, credit underwriting, interest rate risk exposure, asset growth, compensation and other operational
6
and managerial standards as the agency deems appropriate. The federal banking agencies adopted Interagency Guidelines Prescribing Standards for Safety and Soundness to implement the safety and soundness standards required under federal law. The guidelines set forth the safety and soundness standards that the federal banking agencies use to identify and address problems at insured depository institutions before capital becomes impaired. The guidelines address internal controls and information systems, internal audit systems, credit underwriting, loan documentation, interest rate risk exposure, asset growth, compensation, fees and benefits. If the appropriate federal banking agency determines that an institution fails to meet any standard prescribed by the guidelines, the agency may require the institution to submit to the agency an acceptable plan to achieve compliance with the standard.
Prompt Corrective Action Regulations. Under the Federal Prompt Corrective Action statute, the OCC is required to take supervisory actions against undercapitalized savings institutions under its jurisdiction, the severity of which depends upon the institution’s level of capital. The previously mentioned final capital rule effective January 1 , 2015 revised the prompt corrective action categories to incorporate the revised minimum capital requirements, effective the same date. See “-Capital Requirements.”
Under the revised categories, a savings institution that has total risk-based capital of less than 8%, a leverage ratio that is less than 4%, a Tier 1 risk-based capital ratio that is less than 6%, or a common equity Tier 1 ratio of less than 4.5% is considered to be undercapitalized. A savings institution that has total risk-based capital less than 6%, a Tier 1 risk-based capital ratio of less than 4%, a leverage ratio that is less than 3%, or a common equity Tier 1 ratio of less than 3% is considered to be “significantly undercapitalized.” A savings institution that has a tangible capital to assets ratio equal to or less than 2% is deemed to be “critically undercapitalized."
Generally, the banking regulator is required to appoint a receiver or conservator for a federal savings bank that is “critically undercapitalized.” The regulations also provide that a capital restoration plan must be filed with the OCC within 45 days of the date a bank receives notice that it is “undercapitalized,” “significantly undercapitalized” or “critically undercapitalized.” A parent holding company for the institution involved must guarantee performance under the capital restoration plan up to the lesser of the institution’s capital deficiency when deemed undercapitalized or 5% of the institution’s assets. In addition, numerous mandatory supervisory actions become immediately applicable to the federal savings bank, including, but not limited to, restrictions on growth, investment activities, capital distributions and affiliate transactions. The OCC may also take any one of a number of discretionary supervisory actions against undercapitalized federal savings banks, including the issuance of a capital directive and individual minimum capital requirements and the replacement of senior executive officers and directors.
At December 31, 2015, the Bank met the criteria for being considered “well-capitalized”.
Insurance of Deposit Accounts. The Bank’s deposits are insured up to applicable limits by the Deposit Insurance Fund of the FDIC. Under the FDIC’s risk-based assessment system, insured institutions are assigned to one of four risk categories based on supervisory evaluations, regulatory capital levels and certain other factors, with less risky institutions paying lower assessments. An institution’s assessment rate depends upon the category to which it is assigned, subject to certain adjustments specified by the FDIC. The FDIC may adjust the scale uniformly, except that no adjustment may deviate by more than two basis points from the base scale without notice and comment. No institution may pay a dividend if it is in default of the federal deposit insurance assessment.
Prior to the Dodd-Frank Act, assessment rates ranged from seven to 77.5 basis points of assessable deposits. The Dodd-Frank Act required the FDIC to revise its procedures to base its assessments upon total assets less tangible equity instead of on deposits. The FDIC issued a final rule, effective April 1, 2011, that implemented that change. The FDIC also revised the assessment schedule and certain of the possible adjustments so that the range of assessments is now 2.5 basis points to 45 basis points of total assets less tangible equity.
The Dodd-Frank Act increased the minimum target Deposit Insurance Fund ratio from 1.15% of estimated insured deposits to 1.35% of estimated insured deposits. The FDIC must seek to achieve the 1.35% ratio by September 30, 2020. Insured institutions with assets of $10 billion or more are supposed to fund the increase. The Dodd-Frank Act eliminated the 1.5% maximum fund ratio, instead leaving the ratio to the discretion of the FDIC. The FDIC exercised that discretion by establishing a long-range fund ratio of 2%.
The FDIC has authority to increase insurance assessments. A significant increase in insurance premiums would likely have an adverse effect on the operating expenses and results of operations of the Bank. The Bank cannot predict what its insurance assessment rates will be in the future.
An insured institution’s deposit insurance may be terminated by the FDIC upon a finding that the institution has engaged in unsafe or unsound practices, is in an unsafe or unsound condition to continue operations or has violated any applicable law, regulation,
7
rule, order or regulatory condition imposed in writing. The management of the Bank does not know of any practice, condition or violation that might lead to termination of deposit insurance.
In addition to the FDIC assessments, the Financing Corporation (“FICO”) is authorized to impose and collect, with the approval of the FDIC, assessments for anticipated payments, issuance costs and custodial fees on bonds issued by the FICO in the 1980’s to recapitalize the former Federal Savings and Loan Insurance Corporation. The bonds issued by the FICO are due to mature in 2017 through 2019.
Prohibitions Against Tying Arrangements. Federal savings banks are prohibited, subject to some exceptions, from extending credit to or offering any other service, or fixing or varying the consideration for such extension of credit or service, on the condition that the customer obtain some additional service from the institution or its affiliates or not obtain services of a competitor of the institution.
Federal Home Loan Bank System. The Bank is a member of the Federal Home Loan Bank System, which consists of 12 regional Federal Home Loan Banks. The Federal Home Loan Bank System provides a central credit facility primarily for member institutions. As a member of the FHLBC, the Bank is required to acquire and hold shares of capital stock in the FHLBC in specified amounts. As of December 31, 2015, the Bank was in compliance with this requirement.
The USA PATRIOT Act and the Bank Secrecy Act
The USA PATRIOT Act and the Bank Secrecy Act require financial institutions to develop programs to detect and report money-laundering and terrorist activities, as well as suspicious activities. The USA PATRIOT Act also gives the federal government powers to address terrorist threats through enhanced domestic security measures, expanded surveillance powers, increased information sharing and broadened anti-money laundering requirements. The federal banking agencies are required to take into consideration the effectiveness of controls designed to combat money-laundering activities in determining whether to approve a merger or other acquisition application of a member institution. Accordingly, if we engage in a merger or other acquisition, our controls designed to combat money laundering would be considered as part of the application process. In addition, non-compliance with these laws and regulations could result in fines, penalties and other enforcement measures. We have developed policies, procedures and systems designed to comply with these laws and regulations.
Federal Reserve System
The FRB’s regulations require federal savings banks to maintain noninterest-earning reserves against their transaction accounts, such as negotiable order of withdrawal and regular checking accounts. At December 31, 2015, the Bank was in compliance with the FRB's reserve requirements. The balances maintained to meet the reserve requirements imposed by the FRB may be used to satisfy liquidity requirements imposed by the federal regulation.
Holding Company Regulation
The Company is a unitary savings and loan holding company and is subject to regulation and supervision by the FRB. The FRB has enforcement authority over the Company and its non-savings institution subsidiaries. Among other things, this authority permits the FRB to restrict or prohibit activities that are determined to be a risk to the Bank. The Dodd-Frank Act provided for the transfer of the authority for supervising and regulating savings and loan holding companies and their non-depository subsidiaries from the OTS to the FRB. The transfer occurred on July 21, 2011.
The Company's activities are limited to the activities permissible for financial holding companies or for multiple savings and loan holding companies. A financial holding company may engage in activities that are financial in nature, including underwriting equity securities and insurance, incidental to financial activities or complementary to a financial activity. The Dodd-Frank Act specifies that a savings and loan holding company may only engage in financial holding company activities if it meets the qualitative criteria necessary for a bank holding company to engage in such activities. A multiple savings and loan holding company is generally limited to activities permissible for bank holding companies under Section 4(c) (8) of the Bank Holding Company Act, subject to the prior approval of the FRB, and certain additional activities authorized by FRB regulations.
Federal law prohibits a savings and loan holding company, directly or indirectly, or through one or more subsidiaries, from acquiring control of another savings institution or holding company thereof, without prior written approval of the FRB. It also prohibits the acquisition or retention of, with specified exceptions, more than 5% of the equity securities of a company engaged in activities that are not closely related to banking or financial in nature or acquiring or retaining control of an institution that is not federally insured. In evaluating applications by holding companies to acquire savings institutions, the FRB must consider the financial and managerial resources and future prospects of the savings institution, the effect of the acquisition on the risk to the insurance fund, the convenience and needs of the community and competitive factors.
8
Capital. Savings and loan holding companies have not historically been subject to specific regulatory capital requirements. The Dodd-Frank Act, however, required the FRB to promulgate consolidated capital requirements for depository institution holding companies that are no less stringent, both quantitatively and in terms of components of capital, than those applicable to their subsidiary depository institutions. Instruments such as cumulative preferred stock and trust-preferred securities, which were previously includable within Tier 1 capital by bank holding companies, within certain limits, would no longer be includable as Tier 1 capital, subject to certain grandfathering. The previously discussed final rule regarding regulatory capital requirements implements the Dodd-Frank Act as to savings and loan holding companies. Consolidated regulatory capital requirements identical to those applicable to the subsidiary depository institutions applied to savings and loan holding companies as of January 1, 2015. As is the case with institutions themselves, the capital conservation buffer will be phased in between 2016 and 2019.
Source of Strength Doctrine. The “source of strength doctrine” requires bank holding companies to provide financial assistance to their subsidiary depository institutions in the event the subsidiary depository institution experiences financial distress. The Dodd-Frank Act extends the source of strength doctrine to savings and loan holding companies. The FRB has issued regulations requiring that all bank holding companies and savings and loan holding companies serve as a source of strength to their subsidiary depository institutions by providing capital, liquidity and other support in times of financial distress.
The FRB has issued a policy statement regarding the payment of dividends by bank holding companies that it has made applicable to savings and loan holding companies as well. In general, the policy provides that dividends should be paid only out of current earnings and only if the prospective rate of earnings retention by the holding company appears consistent with the organization’s capital needs, asset quality and overall financial condition. Regulatory guidance provides for prior regulatory review of capital distributions in certain circumstances such as where the company’s net income for the past four quarters, net of dividends previously paid over that period, is insufficient to fully fund a dividend or the company’s overall rate of earnings retention is inconsistent with the company’s capital needs and overall financial condition. The ability of a holding company to pay dividends may be restricted if a subsidiary bank becomes undercapitalized. These regulatory policies could affect the ability of the Company to pay dividends or otherwise engage in capital distributions and stock repurchases.
Change in Control Regulations
Under the Change in Bank Control Act, no person may acquire control of a savings and loan holding company such as the Company unless the FRB has been given 60 days’ prior written notice and has not issued a notice disapproving the proposed acquisition, taking into consideration certain factors, including the financial and managerial resources of the acquiror and the competitive effects of the acquisition. Control, as defined under federal law, means ownership, control of or holding irrevocable proxies representing more than 25% of any class of voting stock, control in any manner of the election of a majority of the company’s directors, or a determination by the regulator that the acquiror has the power to direct, or directly or indirectly to exercise a controlling influence over, the management or policies of the institution. Acquisition of more than 10% of any class of a savings and loan holding company’s voting stock constitutes a rebuttable presumption of control under the regulations under certain circumstances including where, as is the case with the Company, the issuer has registered securities under Section 12 of the Exchange Act.
Sarbanes-Oxley Act of 2002
The Sarbanes-Oxley Act of 2002 was enacted in response to public concerns regarding corporate accountability in connection with certain accounting scandals. The stated goals of the Sarbanes-Oxley Act are to increase corporate responsibility, to provide for enhanced penalties for accounting and auditing improprieties at publicly traded companies, and to protect investors by improving the accuracy and reliability of corporate disclosures pursuant to the securities laws. The Sarbanes-Oxley Act generally applies to all companies that file or are required to file periodic reports with the SEC, under the Exchange Act.
The Sarbanes-Oxley Act includes specific additional disclosure requirements, requires the SEC and national securities exchanges to adopt extensive additional disclosure, corporate governance and other related rules, and mandates further studies of certain issues by the SEC.
Federal Securities Laws
The Company’s common stock is registered with the SEC under the Exchange Act. The Company is subject to the information, proxy solicitation, insider trading restrictions and other requirements of the Exchange Act.
9
ITEM 1A. RISK FACTORS
An investment in our securities is subject to risks inherent in our business and the industry in which we operate. Before making an investment decision, you should carefully consider the risks and uncertainties described below and all other information included in this report. The risks described below may adversely affect our business, financial condition and operating results. In addition to these risks and the other risks and uncertainties described in Item 1, “Business-Forward Looking Statements,” and Item 7, “Management's Discussion and Analysis of Financial Condition and Results of Operations,” there may be additional risks and uncertainties that are not currently known to us or that we currently deem to be immaterial that could materially and adversely affect our business, financial condition or operating results. The value or market price of our securities could decline due to any of these identified or other risks. Past financial performance may not be a reliable indicator of future performance, and historical trends should not be used to anticipate results or trends in future periods.
Our future growth and success will depend on our ability to compete effectively in a highly competitive environment
We face substantial competition in all phases of our operations from a variety of different competitors. Our future growth and success will depend on our ability to compete effectively in this highly competitive environment. To date, our competitive strategies have focused on attracting deposits in our local markets, and growing our loan and lease portfolio by emphasizing specific loan products in which we have significant experience and expertise, identifying and targeting markets in which we believe we can effectively compete with larger institutions and other competitors, and offering highly competitive pricing to commercial borrowers with low risk profiles. We compete for loans, leases, deposits and other financial services with other commercial banks, thrifts, credit unions, brokerage houses, mutual funds, insurance companies, real estate conduits, mortgage brokers and specialized finance companies. Many of our competitors offer products and services that we do not offer, and many have substantially greater resources and lending limits, name recognition and market presence that benefit them in attracting business. In addition, larger competitors may be able to price loans, leases and deposits more aggressively than we do, and because of their larger capital bases, their underwriting practices for smaller loans may be subject to less regulatory scrutiny than they would be for smaller banks. Newer competitors may be more aggressive in pricing loans, leases and deposits in order to increase their market share. Some of the financial institutions and financial services organizations with which we compete are not subject to the extensive regulations imposed on federal savings banks and their holding companies. As a result, these nonbank competitors have certain advantages over us in accessing funding and in providing various financial services.
Numerous factors could adversely impact future loan growth and thus our future profitability
Our future profitability will depend in substantial part on our ability to achieve loan and lease growth under intensely competitive conditions in a manner consistent with our underwriting standards and business plan objectives. Our ability to achieve future loan and lease growth will depend on a number of factors, including our ability to offer loan and lease products at prices and with features that are comparable or superior to those offered by our competitors and attractive to potential borrowers. Because our business plan targets high quality loans and leases in specific markets and product categories, our underwriting standards and our lending requirements relating to collateral eligibility, residual equity, global debt service coverage, loan covenants, loan structure and financial reporting tend to be on the conservative side of the market. This can make it difficult for us to compete with institutions that have comparable loan pricing but more lenient lending requirements. Our loan pricing is also impacted in a significant way by the financial strength of the borrower, the guarantor and the collateral. This enables us to compete effectively for highly qualified borrowers, but it can place us at a competitive disadvantage with respect to borrowers who present acceptable credit risks but are not highly qualified. Our ability to achieve future loan and lease growth will also be affected by factors that are not exclusively within our control, such as the level of loan payoffs and regulatory charter limits and concentrations of credit limits. These and other factors could weaken our competitive position, which could adversely affect our growth and profitability. This, in turn, could have a material adverse effect on our business, financial condition, and results of operations.
Historically low interest rates could continue to adversely affect our net interest income and profitability
Our consolidated operating results are largely dependent on our net interest income. Net interest income is the difference between interest earned on loans and investments and interest expense incurred on deposits and other borrowings. Our net interest income is impacted by changes in market rates of interest, changes in credit spreads, changes in the shape of the yield curve, the interest rate sensitivity of our assets and liabilities, prepayments on our loan, leases and investments, and the mix of our funding sources and assets, among other things.
In recent years it has been the policy of the Board of Governors of the Federal Reserve System to maintain interest rates at historically low levels through its targeted federal funds rate and the purchase of securities. As a result, the interest rates on new loans we have originated and maturing loans that we have renewed and the yields on securities we have purchased during this period have been at historically low levels. Our ability to offset this by lowering the interest rates that we pay on deposits is
10
severely limited because interest rates on deposits are already at historic lows. Accordingly, our net interest income (the difference between interest income earned on assets and interest expense paid on liabilities) may decrease, which may have an adverse effect on our profitability.
Changes in market interest rates could adversely affect our financial condition and results of operations
Our financial condition and results of operations are significantly affected by changes in market interest rates because our assets, primarily loans and leases, and our liabilities, primarily deposits, are monetary in nature. Our results of operations depend substantially on our net interest income, which is the difference between the interest income that we earn on our interest-earning assets and the interest expense that we pay on our interest-bearing liabilities. Market interest rates are affected by many factors beyond our control, including inflation, recession, unemployment, money supply, domestic and international events, and changes in the United States and other financial markets. Our net interest income is affected not only by the level and direction of interest rates, but also by the shape of the yield curve and relationships between interest sensitive instruments and key driver rates, including credit risk spreads, and by balance sheet growth, customer loan and deposit preferences and the timing of changes in these variables which themselves are impacted by changes in market interest rates. As a result, changes in market interest rates can significantly affect our net interest income as well as the fair market valuation of our assets and liabilities, particularly if they occur more quickly or to a greater extent than anticipated.
While we take measures intended to manage the risks from changes in market interest rates, we cannot control or accurately predict changes in market rates of interest or be sure that our protective measures are adequate. If the interest rates paid on deposits and other interest bearing liabilities increase at a faster rate than the interest rates received on loans and other interest earning assets, our net interest income, and therefore earnings, could be adversely affected. We would also incur a higher cost of funds to retain our deposits in a rising interest rate environment. While the higher payment amounts we would receive on adjustable rate loans in a rising interest rate environment may increase our interest income, some borrowers may be unable to afford the higher payment amounts, and this could result in a higher rate of default. Rising interest rates also may reduce the demand for loans and the value of fixed-rate investment securities.
A substantial portion of our loan portfolio is secured by real estate. Deterioration in the real estate markets could lead to higher provisions for loan losses, which could have a material negative effect on our financial condition and results of operations
A substantial portion of our loan portfolio is secured by real estate. At December 31, 2015, our loan portfolio included $506.0 million in multi-family mortgage loans, or 40.8% of total loans, $226.7 million in nonresidential real estate loans, or 18.3% of total loans, and $159.5 million in one-to-four family residential real estate loans, or 12.9% of total loans (which includes $44.5 million in non-owner occupied one-to-four family residential real estate loans, or 3.6% of total loans). Adverse economic conditions and increased levels of unemployment in any of the selected markets in which we make multifamily loans and in the Chicago market with respect to commercial real estate loans and one-to-four family residential loans could cause us to experience higher levels of defaults, charge-offs, loan classifications and provisions for loan losses on our real estate loans and write-downs on our other real estate owned.
Adverse changes in local economic conditions and adverse conditions in an industry on which a local market in which we do business depends could hurt our business in a material way
Except for our lease and healthcare lending activities, which we conduct on a nationwide basis, and our multi-family lending activities, which we conduct in selected Metropolitan Statistical Areas, including the Metropolitan Statistical Areas for Chicago, Illinois, Dallas, Texas, Denver, Colorado, Tampa, Florida and Minneapolis, Minnesota, our loan and deposit activities are generally conducted in the Metropolitan Statistical Area for Chicago, Illinois. Our loan and deposit activities are directly affected by, and our financial success depends on, economic conditions within the local markets in which we do business, as well as conditions in the industries on which those markets are economically dependent. A deterioration in local economic conditions or in the condition of an industry on which a local market depends could adversely affect such factors as unemployment rates, business formations and expansions, housing demand, apartment vacancy rates and real estate values in the local market, and this could result in, among other things, a decline in loan and lease demand, a reduction in the number of creditworthy borrowers seeking loans, an increase in loan delinquencies, defaults and foreclosures, an increase in classified and nonaccrual loans, a decrease in the value of the collateral for our loans, and a decline in the net worth and liquidity of our borrowers and guarantors. Any of these factors could hurt our business in a material way.
11
The City of Chicago and the State of Illinois have experienced significant financial difficulties, and this could adversely impact certain borrowers and the economic vitality of the City and State
The City of Chicago and the State of Illinois are experiencing significant financial difficulties, including material pension funding shortfalls. Their debt ratings have been downgraded and the State of Illinois’ executive and legislative branches of government have been unable to reach agreement on a budget for the current fiscal year. These issues could impact the economic vitality of the City of Chicago and the State of Illinois and the businesses operating there, encourage businesses to leave the City of Chicago and the State of Illinois, and discourage new employers from starting or moving businesses to there. These issues could also result in delays in the payment of accounts receivable owed to borrowers that do business with the State of Illinois and Medicaid payments to nursing homes and other healthcare providers in Illinois, and impair their ability to repay their loans when due.
Repayment of our commercial and commercial real estate loans typically depends on the cash flows of the borrower. If a borrower's cash flows weaken or become uncertain, the loan may need to be classified, the collateral securing the loan may decline in value and we may need to increase our loan loss reserves or record a charge off
We underwrite our commercial and commercial real estate loans primarily based on the historical and expected cash flows of the borrower. Although we consider collateral in the underwriting process, it is a secondary consideration that generally relates to the risk of loss in the event of a borrower default. We follow the OCC's published guidance for assigning risk-ratings to loans, which emphasizes the strength of the borrower's cash flow. Specifically, the OCC's loan risk-rating guidance provides that the primary consideration in assigning risk-ratings to commercial and commercial real estate loans is the strength of the primary source of repayment, which is defined as a sustainable source of cash under the borrower's control that is reserved, explicitly or implicitly, to cover the debt obligation. The OCC's loan risk-rating guidance typically does not consider secondary repayment sources until the strength of the primary repayment source weakens, and collateral values typically do not have a significant impact on a loan's risk ratings until a loan is classified. Consequently, if a borrower's cash flows weaken or become uncertain, the loan may need to be classified, whether or not the loan is performing or fully secured. In addition, real estate appraisers typically place significant weight on the cash flows generated by income-producing real estate and the reliability of the cash flows in performing valuations. Thus, economic or borrower-specific conditions that cause a decline in a borrower's cash flows could cause our loan classifications to increase and the appraised value of the collateral securing our loans to decline, and require us to increase our loan loss reserves or record charge offs.
If our allowance for loan losses is not sufficient to cover actual loan losses, our earnings would be adversely impacted
In the event that our loan customers do not repay their loans according to their terms, and the collateral securing the repayment of these loans is insufficient to cover any remaining loan balance, including expenses of collecting the loan and managing and liquidating the collateral, we could experience significant loan losses or increase our provision for loan losses or both, which could have a material adverse effect on our operating results. At December 31, 2015, our allowance for loan losses was $9.7 million, which represented 0.78% of total loans and 271.30% of nonperforming loans as of that date. In determining the amount of our allowance for loan losses, we rely on internal and external loan reviews, our experience and our evaluation of economic conditions, among other factors. In addition, we make various estimates and assumptions about the collectability of our loan portfolio, including the creditworthiness of our borrowers and the value of the real estate and other assets, if any, serving as collateral for the repayment of our loans. We also make judgments concerning our legal positions and the priority of our liens and interests in contested legal or bankruptcy proceedings, and at times, we may lack sufficient information to establish adequate specific reserves for loans involved in such proceedings. We base these estimates, assumptions and judgments on information that we consider reliable, but if an estimate, assumption or judgment that we make ultimately proves to be incorrect, additional provisions to our allowance for loan losses may become necessary. In addition, as an integral part of their supervisory and/or examination process, the OCC periodically reviews the methodology for and the sufficiency of the allowance for loan losses. The OCC has the authority to require us to recognize additions to the allowance based on their inclusion, exclusion or modification of risk factors or differences in judgments of information available to them at the time of their examination.
Repayment of our lease loans is typically dependent on the cash flows of the lessee, which may be unpredictable, and the collateral securing these loans may fluctuate in value
We lend money to small and mid-sized independent leasing companies to finance the debt portion of leases. A lease loan arises when a leasing company discounts the equipment rental revenue stream owed to the leasing company by a lessee. Our lease loans entail many of the same types of risks as our commercial loans. Lease loans generally are non-recourse to the leasing company, and, consequently, our recourse is limited to the lessee and the leased equipment. As with commercial loans secured by equipment, the equipment securing our lease loans may depreciate over time, may be difficult to appraise and may fluctuate in value. We rely on the lessee’s continuing financial stability, rather than the value of the leased equipment, for the repayment of all required amounts under lease loans. In the event of a default on a lease loan, the proceeds from the sale of the leased equipment may not be sufficient
12
to satisfy the outstanding unpaid amounts under the terms of the loan. At December 31, 2015, our lease loans totaled $265.4 million, or 21.4% of our total loan portfolio.
Our loan portfolio includes loans to healthcare providers, and the repayment of these loans is largely dependent upon the receipt of governmental reimbursements
At December 31, 2015, we had $50.7 million of loans and unused commitments to a variety of healthcare providers, including lines of credit secured by healthcare receivables. The repayment of these lines of credit is largely dependent on the borrower's receipt of payments and reimbursements under Medicaid, Medicare and in some cases private insurance contracts for the services they have provided. The ability of the borrowers to service loans we have made to them may be adversely impacted by the financial health of the state or federal payors, many of which have experienced budgetary stress, to make reimbursements for the services provided. The failure of one or more state or federal payors to make reimbursements owed to the operators of these facilities, or a significant delay in the making of such reimbursements, could adversely affect the ability of the operators of these facilities to repay their obligations to us. In addition, changes to national health care policy involving private health insurance policies may also affect the business prospects and financial condition or operations of commercial loan customers and commercial lessees involved in health care-related businesses.
New or changing tax, accounting, and regulatory rules and interpretations could have a significant impact on our strategic initiatives, results of operations, cash flows, and financial condition
The banking services industry is extensively regulated and the degree of regulation is increasing due to the Dodd-Frank Act and regulatory initiatives precipitated by the Dodd-Frank Act and the most recent economic downturn and the resulting disruptions that certain financial markets experienced. These regulations, along with the currently existing tax, accounting, securities, insurance, and monetary laws, regulations, rules, standards, policies and interpretations, control the methods by which financial institutions and their holding companies conduct business, engage in strategic and tax planning and implement strategic initiatives, and govern financial reporting and disclosures. These laws, regulations, rules, standards, policies and interpretations are constantly evolving and may change significantly over time.
We are subject to security and operational risks relating to our use of technology, including the risk of cyber-attack or cyber-theft
Communications and information systems are essential to the conduct of our business, as we use such systems to manage our customer relationships, general ledger and virtually all other aspects of our business. We depend on the secure processing, storage and transmission of confidential and other information in our data processing systems, computers, networks and communications systems. Although we take numerous protective measures and otherwise endeavor to protect and maintain the privacy and security of confidential data, these systems may be vulnerable to unauthorized access, computer viruses, other malicious code, cyber-attacks, cyber-theft and other events that could have a security impact. If one or more of such events were to occur, this potentially could jeopardize confidential and other information processed and stored in, and transmitted through, our systems or otherwise cause interruptions or malfunctions in our or our customers' operations. We may be required to expend significant additional resources to modify our protective measures or to investigate and remediate vulnerabilities or other exposures, and we may be subject to litigation and financial losses that are not fully covered by our insurance. Security breaches in our Internet banking activities could expose us to possible liability and deter customers from using our systems. We rely on standard internet security systems to provide the security and authentication necessary to effect secure transmission of data. These precautions may not fully protect our systems from compromises or breaches of our security measures that could result in damage to our reputation and our business. Although we perform most data processing functions internally, we outsource certain services to third parties. If our third party providers encounter operational difficulties or security breaches, it could affect our ability to adequately process and account for customer transactions, which could significantly affect our business operations.
Our operations rely on numerous external vendors
We rely on numerous external vendors to provide us with products and services necessary to maintain our day-to-day operations. Accordingly, our operations are exposed to risk that these vendors will not perform in accordance with the contracted arrangements under service level agreements. The failure of an external vendor to perform in accordance with the contracted arrangements under service level agreements because of changes in the vendor's organizational structure, financial condition, support for existing products and services or strategic focus or for any other reason, could be disruptive to our operations, which in turn could have a material negative impact on our financial condition and results of operations. We also could be adversely affected to the extent such an agreement is not renewed by the third party vendor or is renewed on terms less favorable to us.
13
Our business and operations could be significantly impacted if we or our third party vendors suffer failure or disruptions of information processing systems, systems failures or security breaches
We have become increasingly dependent on communications, data processing and other information technology systems to manage and conduct our business and support our day-to-day banking, investment, and trust activities, some of which are provided through third-parties. If we or our third party vendors encounter difficulties or become the subject of a cyber-attack on or other breach of their operational systems, data or infrastructure, or if we have difficulty communicating with any such third party system, our business and operations could suffer. Any failure or disruption to our systems, or those of a third party vendor, could impede our transaction processing, service delivery, customer relationship management, data processing, financial reporting or risk management. Although we take ongoing monitoring, detection, and prevention measures and perform penetration testing and periodic risk assessments, our computer systems, software and networks and those of our third party vendors may be or become vulnerable to unauthorized access, loss or destruction of data (including confidential client information), account takeovers, unavailability of service, computer viruses, denial of service attacks, malicious social engineering or other malicious code, or cyber-attacks beyond what we can reasonably anticipate and such events could result in material loss. If any of our financial, accounting or other data processing systems fail or have other significant shortcomings, we could be materially adversely affected. Security breaches in our online banking systems could also have an adverse effect on our reputation and could subject us to possible liability. Additionally, we could suffer disruptions to our systems or damage to our network infrastructure from events that are wholly or partially beyond our control, such as electrical or telecommunications outages, natural disasters, widespread health emergencies or pandemics, or events arising from local or larger scale political events, including terrorist acts. There can be no assurance that our policies, procedures and protective measures designed to prevent or limit the effect of a failure, interruption or security breach, or the policies, procedures and protective measures of our third party vendors, will be effective. If significant failure, interruption or security breaches do occur in our processing systems or those of our third party providers, we could suffer damage to our reputation, a loss of customer business, additional regulatory scrutiny, or exposure to civil litigation, additional costs and possible financial liability. In addition, our business is highly dependent on our ability to process, record and monitor, on a continuous basis, a large number of transactions. To do so, we are dependent on our employees and therefore, the potential for operational risk exposure exists throughout our organization, including losses resulting from human error. We could be materially adversely affected if one or more of our employees cause a significant operational breakdown or failure. If we fail to maintain adequate infrastructure, systems, controls and personnel relative to our size and products and services, our ability to effectively operate our business may be impaired and our business could be adversely affected.
We continually encounter technological change, and may have fewer resources than many of our competitors to continue to invest in technological improvements
The financial services industry is undergoing rapid technological changes, with frequent introductions of new technology-driven products and services. The effective use of technology increases efficiency and enables financial institutions to better serve customers and to reduce costs. Our future success will depend, in part, upon our ability to address the needs of our customers by using technology to provide products and services that will satisfy customer demands for convenience, as well as to create additional efficiencies in our operations. Many of our competitors have substantially greater resources to invest in technological improvements. We also may not be able to effectively implement new technology-driven products and services or be successful in marketing these products and services to our customers.
Consumers and businesses are increasingly using non-banks to complete their financial transactions, which could adversely affect our business and results of operations
Technology and other changes are allowing consumers and businesses to complete financial transactions that historically have involved banks through alternative methods. For example, the wide acceptance of Internet-based commerce has resulted in a number of alternative payment processing systems and lending platforms in which banks play only minor roles. Customers can now maintain funds in prepaid debit cards or digital currencies, and pay bills and transfer funds directly without the direct assistance of banks. The diminishing role of banks as financial intermediaries has resulted and could continue to result in the loss of fee income, as well as the loss of customer deposits and the related income generated from those deposits. The loss of these revenue streams and the potential loss of lower cost deposits as a source of funds could have a material adverse effect on our business, financial condition and results of operations.
The Bank is subject to limits on certain types of commercial lending, which restricts our ability to grow our commercial loan portfolio and diversify our overall loan portfolio
Under the Home Owners Loan Act, the Bank may originate, invest in, sell or purchase unlimited loans on the security of residential real estate, while loans on nonresidential real estate generally may not, on a combined basis, exceed 400% of the Bank’s total capital. In addition, secured and unsecured commercial loans and certain types of commercial personal property leases may not
14
exceed 20% of the Bank’s assets; however, amounts in excess of 10% of assets may only be used for small business loans. Further, the Bank may generally invest up to 35% of its assets in consumer loans, corporate debt securities and commercial paper on a combined basis. The Bank may invest up to 10% of its assets in tangible personal property, for rental or sale. Certain leases on tangible personal property are not aggregated with commercial or consumer loans for the purposes of determining compliance with the limitations set forth for those investment categories. These limitations limit our ability to grow our commercial loan portfolio and diversify our overall loan portfolio.
New lines of business or new products and services may subject us to additional risks
From time to time, we may seek to implement new lines of business or offer new products and services within existing lines of business in our current markets or new markets. There are substantial risks and uncertainties associated with these efforts, particularly in instances where the markets are not fully developed. In developing and marketing new lines of business and/or new products and services, we may invest significant time and resources. Initial timetables for the introduction and development of new lines of business and/or new products or services may not be achieved and price and profitability targets may not prove feasible, which could in turn have a material negative effect on our operating results.
Our sources of funds are limited because of our holding company structure
The Company is a separate legal entity from its subsidiaries and does not have significant operations of its own. Dividends from the Bank provide a significant source of cash for the Company. The availability of dividends from the Bank is limited by various statutes and regulations. Under these statutes and regulations, the Bank is not permitted to pay dividends on its capital stock to the Company, its sole stockholder, if the dividend would reduce the stockholders' equity of the Bank below the amount of the liquidation account established in connection with the mutual-to-stock conversion. Federal savings banks may pay dividends without the approval of its primary federal regulator only if they meet applicable regulatory capital requirements before and after the payment of the dividends and total dividends do not exceed net income to date over the calendar year plus its retained net income over the preceding two years. Although the Bank's capital exceeded applicable regulatory requirements at December 31, 2015, the Bank did not have sufficient net income over the preceding two years to pay a dividend to the Company without receiving prior regulatory approval. The Company has also reserved $5.0 million of its available cash to maintain its ability to serve as a source of financial strength to the Bank. If in the future, the Company utilizes its available cash for other purposes and the Bank is unable to pay dividends to the Company, the Company may not have sufficient funds to pay dividends.
FDIC deposit insurance costs have increased and may increase further in the future
FDIC insurance rates have increased significantly, and we may pay higher FDIC deposit premiums in the future. The Dodd-Frank Act established 1.35% as the minimum Designated Reserve Ratio (“DRR”) for the deposit insurance fund. The FDIC has determined that the DRR should be 2.0% and has adopted a plan under which it will meet the statutory minimum DRR of 1.35% by the statutory deadline of September 30, 2020. The Dodd-Frank Act also required the FDIC to base deposit insurance premiums on an institution's total assets minus its tangible equity instead of its deposits. The FDIC has adopted final regulations that base assessments for banks and thrifts on a combination of financial ratios and regulatory ratings. The FDIC also revised the assessment schedule and established adjustments that increase assessments so that the range of assessments is now 2.5 basis points to 45 basis points of total assets less tangible equity. If there are any changes in the Bank’s financial ratios and regulatory ratings that require adjustments that increase its assessment, or, if circumstances require the FDIC to impose additional special assessments or further increase its quarterly assessment rates, our results of operations could be adversely impacted.
We will become subject to more stringent capital requirements, which could adversely impact our return on equity, require us to raise additional capital, or constrain us from paying dividends or repurchasing shares
In July 2013, the federal banking agencies approved a new rule that substantially amends the regulatory risk-based capital rules applicable to the Bank and the Company. The final rule implements the Basel III regulatory capital reforms and changes required by the Dodd-Frank Act.
The final rule includes new minimum risk-based capital and leverage ratios, which became effective for us on January 1, 2015, and refines the definition of what constitutes “capital” for purposes of calculating these ratios. The new minimum capital requirements will be: (i) a new common equity Tier 1 capital ratio of 4.5%; (ii) a Tier 1 to risk-based assets capital ratio of 6% (increased from 4%); (iii) a total capital ratio of 8% (unchanged from current rules); and (iv) a Tier 1 leverage ratio of 4%. The final rule also requires unrealized gains and losses on certain “available-for-sale” securities holdings to be included for purposes of calculating regulatory capital requirements unless a one-time opt-out is exercised. The Bank exercised this one-time opt-out option. The final rule also establishes a “capital conservation buffer” of 2.5%, and will result in the following minimum ratios: (i) a common equity Tier 1 capital ratio of 7.0%, (ii) a Tier 1 to risk-based assets capital ratio of 8.5%, and (iii) a total capital ratio of 10.5%. The phase in of the new capital conservation buffer requirement began in January 2016 at 0.625% of risk-weighted
15
assets and would increase each year until fully implemented in January 2019. An institution will be subject to limitations on paying dividends, engaging in share repurchases, and paying discretionary bonuses if its capital level falls below the buffer amount. These limitations will establish a maximum percentage of eligible retained income that can be utilized for such actions.
We have analyzed the effects of these new capital requirements, and as of December 31, 2015 we believe that the Bank and the Company met all of these new requirements, including the full 2.5% capital conservation buffer.
The application of more stringent capital requirements could, among other things, result in lower returns on equity, require the raising of additional capital, and result in regulatory actions if we were to be unable to comply with such requirements. Furthermore, the imposition of liquidity requirements in connection with the implementation of Basel III could result in our having to lengthen the term of our funding, restructure our business models, and/or increase our holdings of liquid assets. Implementation of changes to asset risk weightings for risk-based capital calculations, items included or deducted in calculating regulatory capital and/or additional capital conservation buffers could result in management modifying its business strategy, and could limit our ability to make distributions, including paying out dividends or buying back shares. Specifically, beginning in 2016, the Bank’s ability to pay dividends will be limited if it does not have the capital conservation buffer required by the new capital rules, which may limit our ability to pay dividends to stockholders. See “Supervision and Regulation-Federal Banking Regulation-New Capital Rule.”
The residential loans in our loan portfolio are sensitive to regional and local economic conditions
We originate fixed and adjustable rate loans secured by one-to-four family residential real estate. Our general practice is to sell a majority of our newly originated fixed-rate residential real estate loans and to hold in portfolio a limited number of adjustable-rate residential real estate loans. Our portfolio also includes home equity lines of credit and fixed-rate second mortgage loans. Residential real estate lending is sensitive to regional and local economic conditions that significantly impact the ability of borrowers to meet their loan payment obligations, making loss levels difficult to predict. Residential loans with high combined loan-to-value ratios generally are more sensitive to declining property values than those with lower combined loan-to-value ratios and therefore may experience a higher incidence of default and severity of losses. In addition, if the borrowers sell their homes, the borrowers may be unable to repay their loans in full from the sale proceeds. As a result, these loans may experience higher rates of delinquencies, defaults and losses, which could in turn adversely affect our financial condition and results of operations.
Recent regulations could restrict our ability to originate and sell residential loans
The Consumer Financial Protection Bureau has issued a rule designed to clarify for lenders how they can avoid legal liability under the Dodd-Frank Act, which would hold lenders accountable for ensuring a borrower’s ability to repay a mortgage. Loans that meet this “qualified mortgage” definition will be presumed to have complied with the ability-to-repay standard. Under the Consumer Financial Protection Bureau’s rule, a “qualified mortgage” loan must not contain certain specified features, including:
• | excessive up-front points and fees (those exceeding 3% of the total loan amount, less “bona fide discount points” for prime loans); |
• | interest-only payments; |
• | negative-amortization; and |
• | terms longer than 30 years. |
Also, to qualify as a “qualified mortgage,” a borrower’s total monthly debt-to-income ratio may not exceed 43%. Lenders must also verify and document the income and financial resources relied upon to qualify the borrower for the loan and underwrite the loan based on a fully amortizing payment schedule and maximum interest rate during the first five years, taking into account all applicable taxes, insurance and assessments.
In addition, the Dodd-Frank Act requires the regulatory agencies to issue regulations that require securitizers of loans to retain not less than 5% of the credit risk for any asset that is not a “qualified residential mortgage.” The regulatory agencies have issued a final rule to implement this requirement, which provides that the definition of “qualified residential mortgage” is the same as the definition of “qualified mortgage” issued by the Consumer Financial Protection Bureau for purposes of its regulations. These final rules could have a significant effect on the secondary market for loans and the types of loans we originate, and restrict our ability to make loans, any of which could limit our growth or profitability.
16
Trading activity in the Company's common stock could result in material price fluctuations
It is possible that trading activity in the Company's common stock, including short-selling or significant sales by our larger stockholders, could result in material price fluctuations of the price per share of the Company's common stock. In addition, such trading activity and the resultant volatility could make it more difficult for the Company to sell equity or equity-related securities in the future at a time and price it deems appropriate, or to use its stock as consideration for an acquisition.
Various factors may make takeover attempts that you might want to succeed more difficult to achieve, which may affect the value of shares of our common stock
Provisions of our articles of incorporation and bylaws, federal regulations, Maryland law and various other factors may make it more difficult for companies or persons to acquire control of the Company without the consent of our board of directors. You may want a takeover attempt to succeed because, for example, a potential acquirer could offer a premium over the then prevailing price of our shares of common stock. Provisions of our articles of incorporation and bylaws also may make it difficult to remove our current board of directors or management if our board of directors opposes the removal. We have elected to be subject to the Maryland Business Combination Act, which places restrictions on mergers and other business combinations with large stockholders. In addition, our articles of incorporation provide that certain mergers and other similar transactions, as well as amendments to our articles of incorporation, must be approved by stockholders owning at least two-thirds of our shares of common stock entitled to vote on the matter unless first approved by at least two-thirds of the number of our authorized directors, assuming no vacancies. If approved by at least two-thirds of the number of our authorized directors, assuming no vacancies, the action must still be approved by a majority of our shares entitled to vote on the matter. In addition, a director can be removed from office, but only for cause, if such removal is approved by stockholders owning at least two-thirds of our shares of common stock entitled to vote on the matter. However, if at least two-thirds of the number of our authorized directors, assuming no vacancies, approves the removal of a director, the removal may be with or without cause, but must still be approved by a majority of our voting shares entitled to vote on the matter. Additional provisions include limitations on the voting rights of any beneficial owners of more than 10% of our common stock. Our bylaws, which can only be amended by the board of directors, also contain provisions regarding the timing, content and procedural requirements for stockholder proposals and nominations.
Non-Compliance with USA PATRIOT Act, Bank Secrecy Act, or other laws and regulations could result in fines or sanctions
Financial institutions are required under the USA PATRIOT and Bank Secrecy Acts to develop programs to prevent financial institutions from being used for money-laundering and terrorist activities. Financial institutions are also obligated to file suspicious activity reports with the U.S. Treasury Department's Office of Financial Crimes Enforcement Network if such activities are detected. These rules also require financial institutions to establish procedures for identifying and verifying the identity of customers seeking to open new financial accounts. Failure or the inability to comply with these regulations could result in fines or penalties, curtailment of expansion opportunities, intervention or sanctions by regulators and costly litigation or expensive additional controls and systems. During the last few years, several banking institutions have received large fines for non-compliance with these laws and regulations. In addition, the U.S. Government imposed and will continue to expand laws and regulations relating to residential and consumer lending activities that create significant new compliance burdens and financial risks. We have developed policies and continue to augment procedures and systems designed to assist in compliance with these laws and regulations, but these policies may not be effective to provide such compliance.
ITEM 1B. | UNRESOLVED STAFF COMMENTS |
None.
ITEM 2. | PROPERTIES |
We conduct our business at 19 banking offices located in the Chicago metropolitan area. We own our banking center facilities, except for our Chicago-Lincoln Park, and Northbrook offices, which are leased. We also operate four satellite loan and lease production offices, which are leased. We believe that all of our properties and equipment are well maintained, in good operating condition and adequate for all of our present and anticipated needs.
We believe our facilities in the aggregate are suitable and adequate to operate our banking and related business. Additional information with respect to premises and equipment is presented in Note 7 of "Notes to Consolidated Financial Statements" in Item 8 of this Form 10-K.
17
ITEM 3. | LEGAL PROCEEDINGS |
The Company and its subsidiaries are subject to various legal actions arising in the normal course of business. In the opinion of management, based on currently available information, the resolution of these legal actions is not expected to have a material adverse effect on the Company’s results of operations.
ITEM 4. | MINE SAFETY DISCLOSURES |
Not applicable.
PART II
ITEM 5. | MARKET FOR REGISTRANT’S COMMON EQUITY, RELATED STOCKHOLDER MATTERS AND ISSUER PURCHASES OF EQUITY SECURITIES |
Our shares of common stock are traded on the NASDAQ Global Select Market under the symbol “BFIN.” The approximate number of holders of record of the Company’s common stock as of December 31, 2015 was 1,355. Certain shares of the Company’s common stock are held in “nominee” or “street” name, and accordingly, the number of beneficial owners of such shares is not known or included in the foregoing number.
The following table presents quarterly market information provided by the NASDAQ Stock Market for the Company’s common stock and cash dividends paid for the periods ended December 31, 2015 and 2014.
2014 and 2015 Quarterly Periods | High | Low | Close | Cash Dividends Paid | ||||||||||||
Quarter ended December 31, 2015 | $ | 13.22 | $ | 12.10 | $ | 12.63 | $ | 0.04 | ||||||||
Quarter ended September 30, 2015 | 12.48 | 11.57 | 12.43 | 0.08 | ||||||||||||
Quarter ended June 30, 2015 | 13.62 | 11.47 | 11.78 | 0.04 | ||||||||||||
Quarter ended March 31, 2015 | 13.16 | 11.07 | 13.14 | 0.04 | ||||||||||||
Quarter ended December 31, 2014 | $ | 12.17 | $ | 10.24 | $ | 11.86 | $ | 0.03 | ||||||||
Quarter ended September 30, 2014 | 10.69 | 10.43 | 10.55 | 0.04 | ||||||||||||
Quarter ended June 30, 2014 | 11.24 | 9.40 | 11.16 | 0.01 | ||||||||||||
Quarter ended March 31, 2014 | 10.33 | 9.06 | 9.98 | — | ||||||||||||
The Company is subject to federal regulatory limitations on the payment of dividends. Federal Reserve Board Supervisory Letter SR 09-4 provides that a holding company should, among other things, notify and make a submission to the Federal Reserve Bank prior to declaring a dividend if its net income for the current quarter is not sufficient to fully fund the dividend, and consider eliminating, deferring or significantly reducing its dividends if its net income for the current quarter is not sufficient to fully fund the dividends, or if its net income for the past four quarters, net of dividends previously paid during that period, is not sufficient to fully fund the dividends.
The Company is also subject to state law limitations on the payment of dividends. Maryland law generally limits dividends to an amount equal to the excess of our capital surplus over payments that would be owed upon dissolution to stockholders whose preferential rights upon dissolution are superior to those receiving the dividend, and to an amount that would not make us insolvent provided, however, that even if the Company’s assets are less than the amount necessary to satisfy the requirement set forth above, the Company may make a distribution from: (1) the Company’s net earnings for the fiscal year in which the distribution is made; (2) the Company’s net earnings for the preceding fiscal year; or (3) the sum of the Company’s net earnings for the preceding eight fiscal quarters. Dividends from the Bank provide a significant source of cash for the Company. The availability of dividends from the Bank is limited by various statutes and regulations. For a discussion of the Bank’s ability to pay dividends, see Part I, Item 1, “Business — Supervision and Regulation — Federal Banking Regulation — Capital Distributions.”
Recent Sales of Unregistered Securities
The Company had no sales of unregistered stock during the quarter ended December 31, 2015.
18
Repurchases of Equity Securities
On March 30, 2015, the Company announced that its Board had authorized the repurchase of up to 1,055,098 shares of the Company’s common stock, which represents approximately 5% of the Company’s issued and outstanding shares of common stock. On December 28, 2015, the Board extended this repurchase authorization from December 31, 2015 to December 31, 2016, and increased the number of shares that can be repurchased in accordance with the authorization by 1,046,868. As of December 31, 2015, the Company had repurchased 804,649 shares of its common stock out of the 2,101,966 shares of common stock authorized under this repurchase authorization. Since its inception, the Company has repurchased 5,043,783 shares of its common stock.
19
Stock Performance Graph
The following line graph shows a comparison of the cumulative returns for the Company, the Russell 2000 Index, the NASDAQ Bank Index, the ABA Community Bank NASDAQ Index and the KBW Regional Banking Index for the period beginning December 31, 2005 and ending December 31, 2015. The information assumes that $100 was invested at the closing price on December 31, 2005 in the Common Stock and each index, and that all dividends were reinvested.
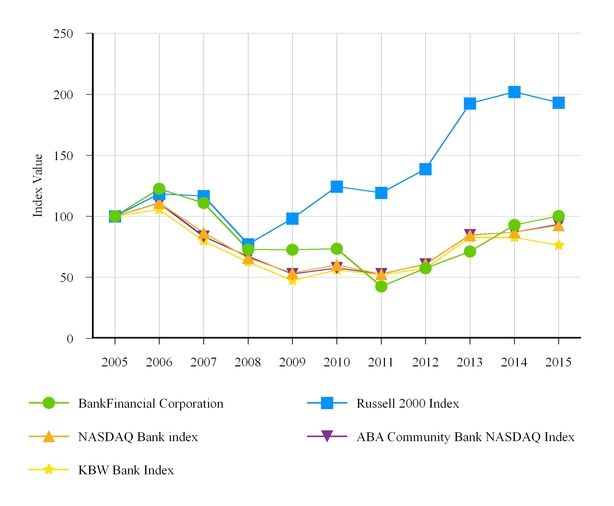
December 31, | |||||||||||||||||||||||||||||||||
2005 | 2006 | 2007 | 2008 | 2009 | 2010 | 2011 | 2012 | 2013 | 2014 | 2015 | |||||||||||||||||||||||
BankFinancial Corporation | 100.00 | 122.60 | 110.83 | 72.76 | 72.58 | 73.47 | 42.59 | 57.46 | 71.22 | 92.82 | 100.26 | ||||||||||||||||||||||
Russell 2000 Index | 100.00 | 118.37 | 116.51 | 77.15 | 98.11 | 124.46 | 119.26 | 138.76 | 192.63 | 202.06 | 193.14 | ||||||||||||||||||||||
NASDAQ Bank Index | 100.00 | 111.01 | 86.51 | 65.81 | 53.63 | 60.01 | 52.55 | 60.85 | 84.52 | 86.92 | 92.68 | ||||||||||||||||||||||
ABA Community Bank NASDAQ Index | 100.00 | 110.83 | 83.35 | 67.04 | 52.71 | 57.58 | 52.68 | 60.76 | 84.60 | 86.98 | 93.46 | ||||||||||||||||||||||
KBW Bank Index | 100.00 | 105.62 | 79.81 | 62.53 | 47.38 | 56.01 | 52.01 | 57.45 | 82.54 | 82.70 | 76.29 | ||||||||||||||||||||||
20
ITEM 6. | SELECTED FINANCIAL DATA |
The following information is derived from the audited consolidated financial statements of the Company. For additional information, reference is made to Item 7, “Management’s Discussion and Analysis of Financial Condition and Results of Operations,” and the Consolidated Financial Statements of the Company and related notes included elsewhere in this Annual Report.
At and For the Years Ended December 31, | |||||||||||||||||||
2015 | 2014 | 2013 | 2012 | 2011 | |||||||||||||||
(Dollars in thousands, except per share data) | |||||||||||||||||||
Selected Financial Condition Data: | |||||||||||||||||||
Total assets | $ | 1,512,443 | $ | 1,465,410 | $ | 1,453,594 | $ | 1,481,192 | $ | 1,563,575 | |||||||||
Loans, net | 1,232,257 | 1,172,356 | 1,098,077 | 1,030,465 | 1,227,391 | ||||||||||||||
Loans held-for-sale | — | — | — | 2,166 | 1,918 | ||||||||||||||
Securities, at fair value | 114,753 | 121,174 | 110,907 | 77,832 | 92,832 | ||||||||||||||
Core deposit intangible | 1,305 | 1,855 | 2,433 | 3,038 | 3,671 | ||||||||||||||
Deposits | 1,212,919 | 1,211,713 | 1,252,708 | 1,282,351 | 1,332,552 | ||||||||||||||
Borrowings | 64,318 | 12,921 | 3,055 | 5,567 | 9,322 | ||||||||||||||
Equity | 212,364 | 216,121 | 175,627 | 172,890 | 199,857 | ||||||||||||||
Selected Operating Data: | |||||||||||||||||||
Interest and dividend income | $ | 48,962 | $ | 49,349 | $ | 49,392 | $ | 60,727 | $ | 69,708 | |||||||||
Interest expense | 2,814 | 3,046 | 3,653 | 4,447 | 6,915 | ||||||||||||||
Net interest income | 46,148 | 46,303 | 45,739 | 56,280 | 62,793 | ||||||||||||||
Provision for (recovery of) loan losses | (3,206 | ) | (736 | ) | (687 | ) | 31,522 | 22,723 | |||||||||||
Net interest income after provision for (recovery of) loan losses | 49,354 | 47,039 | 46,426 | 24,758 | 40,070 | ||||||||||||||
Noninterest income | 6,691 | 6,709 | 8,134 | 7,723 | 8,144 | ||||||||||||||
Noninterest expense (1) | 41,945 | 44,451 | 51,262 | 59,590 | 84,535 | ||||||||||||||
Income (loss) before income taxes | 14,100 | 9,297 | 3,298 | (27,109 | ) | (36,321 | ) | ||||||||||||
Income tax expense (benefit) (2) | 5,425 | (31,317 | ) | — | — | 12,375 | |||||||||||||
Net income (loss) | $ | 8,675 | $ | 40,614 | $ | 3,298 | $ | (27,109 | ) | $ | (48,696 | ) | |||||||
Basic earnings (loss) per common share | $ | 0.44 | $ | 2.01 | $ | 0.16 | $ | (1.36 | ) | $ | (2.46 | ) | |||||||
Diluted earnings (loss) per common share | $ | 0.44 | $ | 2.01 | $ | 0.16 | $ | (1.36 | ) | $ | (2.46 | ) | |||||||
(footnotes on following page)
21
At and For the Years Ended December 31, | |||||||||||||||||||
2015 | 2014 | 2013 | 2012 | 2011 | |||||||||||||||
Selected Financial Ratios and Other Data: | |||||||||||||||||||
Performance Ratios: | |||||||||||||||||||
Return on assets (ratio of net income (loss) to average total assets) | 0.60 | % | 2.83 | % | 0.23 | % | (1.78 | )% | (3.00 | )% | |||||||||
Return on equity (ratio of net income (loss) to average equity) | 4.03 | 22.58 | 1.89 | (13.36 | ) | (19.47 | ) | ||||||||||||
Net interest rate spread (3) | 3.36 | 3.35 | 3.28 | 3.86 | 4.09 | ||||||||||||||
Net interest margin (4) | 3.43 | 3.40 | 3.33 | 3.93 | 4.20 | ||||||||||||||
Efficiency ratio (5) | 79.38 | 83.85 | 95.15 | 93.11 | 85.53 | ||||||||||||||
Noninterest expense to average total assets (6) | 2.90 | 3.10 | 3.53 | 3.92 | 3.74 | ||||||||||||||
Average interest-earning assets to average interest-bearing liabilities | 132.32 | 123.09 | 121.50 | 123.17 | 122.68 | ||||||||||||||
Dividends declared per share | $ | 0.20 | $ | 0.08 | $ | 0.04 | $ | 0.03 | $ | 0.22 | |||||||||
Dividend payout ratio | 47.8 | % | 4.2 | % | 25.6 | % | N.M. | N.M. | |||||||||||
Asset Quality Ratios: | |||||||||||||||||||
Nonperforming assets to total assets (7) | 0.70 | % | 1.27 | % | 1.70 | % | 2.61 | % | 6.33 | % | |||||||||
Nonperforming loans to total loans | 0.29 | 1.03 | 1.66 | 2.70 | 6.08 | ||||||||||||||
Allowance for loan losses to nonperforming loans | 271.30 | 98.17 | 76.89 | 63.64 | 41.47 | ||||||||||||||
Allowance for loan losses to total loans | 0.78 | 1.01 | 1.27 | 1.72 | 2.52 | ||||||||||||||
Net charge-offs to average loans outstanding | (0.08 | ) | 0.13 | 0.31 | 3.91 | 1.04 | |||||||||||||
Capital Ratios: | |||||||||||||||||||
Equity to total assets at end of period | 14.04 | % | 14.75 | % | 12.08 | % | 11.67 | % | 12.78 | % | |||||||||
Average equity to average assets | 14.88 | 12.54 | 12.05 | 13.36 | 15.42 | ||||||||||||||
Tier 1 leverage ratio (Bank only) | 11.33 | 11.45 | 10.16 | 9.60 | 10.48 | ||||||||||||||
Other Data: | |||||||||||||||||||
Number of full-service offices (8) | 19 | 19 | 20 | 20 | 20 | ||||||||||||||
Employees (full-time equivalents) | 251 | 269 | 301 | 352 | 357 | ||||||||||||||
(1) | Noninterest expense for the year ended December 31, 2011 includes a full goodwill impairment of $23.9 million. |
(2) | Income tax expense (benefit) for the year ended December 31, 2014 includes a full recovery of the deferred tax asset valuation allowance of $35.1 million, and income tax expense (benefit) for the year ended December 31, 2011 includes the establishment of a full valuation allowance for the deferred tax asset of $22.6 million. |
(3) | The net interest rate spread represents the difference between the yield on average interest-earning assets and the cost of average interest-bearing liabilities for the period. |
(4) | The net interest margin represents net interest income divided by average total interest-earning assets for the period. |
(5) | The efficiency ratio represents noninterest expense, less goodwill impairment, divided by the sum of net interest income and noninterest income. |
(6) | The noninterest expense to average total assets ratio represents noninterest expense less goodwill impairment, divided by average total assets. |
(7) | Nonperforming assets include nonperforming loans and other real estate owned. |
(8) The Bank's Hyde Park East branch was closed on January 2, 2014.
N.M. Not Meaningful
22
ITEM 7. | MANAGEMENT’S DISCUSSION AND ANALYSIS OF FINANCIAL CONDITION AND RESULTS OF OPERATIONS |
The discussion and analysis that follows focuses on certain factors affecting our consolidated financial condition at December 31, 2015 and 2014, and our consolidated results of operations for the three years ended December 31, 2015. Our consolidated financial statements, the related notes and the discussion of our critical accounting policies appearing elsewhere in this Annual Report should be read in conjunction with this discussion and analysis.
Overview of 2015
Due to increased marketing, expansion of commercial banking officers and markets, and the introduction of new commercial loan and lease products, total commercial loans increased by 7.8% in 2015, with diversified growth in multifamily loans, commercial and industrial loans and commercial leases. Since 2012, the Company has experienced an average 9.4% annual net increase in commercial loan balances.
The deposit portfolio remained stable during 2015 as we managed our deposit portfolio to retain and increase higher value core deposit relationships and maintain the lowest practicable cost of funds. We ended 2015 with our highest-ever core deposit ratio at 82% of total deposits.
Our net interest margin remained stable during 2015 as our loan growth offset the impact of lower market yields on loan originations and loan renewals, and our decision not to renew certain higher yielding loans based on their risk characteristics.
Noninterest income from customer loan, deposit, wealth management and trust fees increased, while income from mortgage banking operations declined as planned. We reduced our noninterest expense by 5.6% in 2015, focusing principally on efficiencies related to staffing, facilities and our ongoing initiatives to utilize technology-based transaction processing and customer information delivery capabilities. At the same time, we increased advertising, marketing and staffing in all aspects of commercial lending to further accelerate commercial loan and lease growth.
We successfully executed our plan to reduce nonperforming assets and future nonperforming asset expenses during 2015. Nonperforming loans to total loans declined from 1.03% at December 31, 2014 to 0.29% at December 31, 2015 of total loans and our ratio of nonperforming assets to total assets declined to 0.70% at December 31, 2015. In addition, consistent with our practices in previous years, we actively managed our loan portfolio to exit $24.5 million of multi-family and commercial real estate relationships based on their risk characteristics.
The Company has a strong capital position, and is well-capitalized under all applicable current and anticipated regulatory standards. In particular, the Company’s Tier 1 Risk-Based Capital ratio continues to benefit from the Company’s emphasis on originating high-quality multifamily loans that are eligible for the 50% risk-weight category under the risk-based capital rules, and selected commercial equipment leases to government entities that are eligible for the 20% risk-weight category.
The Company’s tangible book value per share increased to $10.40 from $10.15 in 2014. We increased dividends paid to shareholders by $2.5 million and reduced the total shares outstanding by 804,649 during 2015.
Outlook for 2016
We begin 2016 in a strong financial condition and with positive momentum. The combined effect of continued low market interest rates and yields and competitive forces in the Chicago metropolitan area and in our other business units is expected to maintain pressure on asset yields throughout 2016. The Company’s interest rate risk position is neutral to slightly asset-sensitive, such that an increase in market interest rates will tend to be a positive factor in the Company’s earnings.
Our focus in 2016 will be on balance sheet growth as we continue to deploy our available surplus capital. We will continue the evolution of our loan portfolio towards a configuration that permits better growth rates in multiple, independent segments with comparable risk-adjusted yields.
We expect to expand our marketing of new deposit products to further improve deposit-related revenue in 2016; in addition, we may also be successful in further increasing revenues related to trust, non-deposit wealth management, and commercial property and casualty insurance sales due to new product capabilities and increased dedicated sales capacity. Core noninterest expense is expected to hold steady or continue to decline slightly despite increases in advertising and marketing expenses related to loan and deposit growth initiatives. Through these actions, we hope to further improve our core operating earnings in 2016 to a level consistent with, or in excess of, peer institutions in our market.
23
Results of Operation
Net Income
Comparison of Year 2015 to 2014. We recorded net income of $8.7 million for the year ended December 31, 2015, compared to net income of $40.6 million for 2014. Net income for 2014 included a tax benefit of $35.1 million that we recorded to reflect the reversal of a valuation allowance that we established in 2011 for deferred tax assets. Excluding this tax benefit, net income for the year ended December 31, 2014 would have been $5.5 million. The $3.2 million, or 57.8%, increase in year over year earnings exclusive of the 2014 tax benefit was primarily due to the combined effect of a $2.5 million increase in the recovery of provision for loan losses and a $2.5 million decrease in noninterest expense for the year ended December 31, 2015. Our earnings per share of common stock was $0.44 for the year ended December 31, 2015, compared to $2.01 per share of common stock for the year ended December 31, 2014. Excluding the tax benefit that we recorded for the recovery of the deferred tax assets valuation allowance, our earnings per share of common stock would have been $0.27 for the year ended December 31, 2014.
Comparison of Year 2014 to 2013. We recorded net income of $40.6 million for the year ended December 31, 2014, compared to net income of $3.3 million for 2013. Net income for 2014 included a tax benefit of $35.1 million that we recorded to reflect the reversal of a valuation allowance that we established in 2011 for deferred tax assets. Excluding this tax benefit, net income for the year ended December 31, 2014 would have been $5.5 million. Net income for 2013 included a $1.3 million gain on sale of owner-occupied and investor-owned one-to-four family residential loans designated as held-for-sale. Our earnings per share of common stock was $2.01 for the year ended December 31, 2014, compared to $0.16 per share of common stock for the year ended December 31, 2013. Excluding the tax benefit that we recorded for the recovery of the deferred tax assets valuation allowance, our earnings per share of common stock would have been $0.27 for the year ended December 31, 2014.
Net Interest Income
Net interest income is our primary source of revenue. Net interest income equals the excess of interest income (including discount accretion on purchased impaired loans) plus fees earned on interest earning assets over interest expense incurred on interest-bearing liabilities. The level of interest rates and the volume and mix of interest-earning assets and interest-bearing liabilities impact net interest income. Interest rate spread and net interest margin are utilized to measure and explain changes in net interest income. Interest rate spread is the difference between the yield on interest-earning assets and the rate paid for interest-bearing liabilities that fund those assets. The net interest margin is expressed as the percentage of net interest income to average interest-earning assets. The net interest margin exceeds the interest rate spread because noninterest-bearing sources of funds, principally noninterest-bearing demand deposits and stockholders' equity, also support interest-earning assets.
The accounting policies underlying the recognition of interest income on loans, securities, and other interest-earning assets are included in Note 1 of “Notes to Consolidated Financial Statements” in Item 8 of this Form 10-K.
24
Average Balance Sheets
The following table sets forth average balance sheets, average yields and costs, and certain other information. No tax-equivalent yield adjustments were made, as the effect of these adjustments would not be material. Average balances are daily average balances. Nonaccrual loans are included in the computation of average balances, but have been reflected in the table as loans carrying a zero yield. The yields set forth below include the effect of deferred fees and expenses, discounts and premiums, purchase accounting adjustments that are amortized or accreted to interest income or expense.
Years Ended December 31, | ||||||||||||||||||||||||||||||||
2015 | 2014 | 2013 | ||||||||||||||||||||||||||||||
Average Outstanding Balance | Interest | Yield/Rate | Average Outstanding Balance | Interest | Yield/Rate | Average Outstanding Balance | Interest | Yield/Rate | ||||||||||||||||||||||||
(Dollars in thousands) | ||||||||||||||||||||||||||||||||
Interest-earning Assets: | ||||||||||||||||||||||||||||||||
Loans | $ | 1,163,658 | $ | 47,488 | 4.08 | % | $ | 1,126,511 | $ | 47,802 | 4.24 | % | $ | 1,031,240 | $ | 47,691 | 4.62 | % | ||||||||||||||
Securities | 109,834 | 1,141 | 1.04 | 114,708 | 1,154 | 1.01 | 72,699 | 981 | 1.35 | |||||||||||||||||||||||
Stock in FHLBC | 6,257 | 31 | 0.50 | 6,202 | 28 | 0.45 | 6,736 | 22 | 0.33 | |||||||||||||||||||||||
Other | 64,434 | 302 | 0.47 | 113,535 | 365 | 0.32 | 262,425 | 698 | 0.27 | |||||||||||||||||||||||
Total interest-earning assets | 1,344,183 | 48,962 | 3.64 | 1,360,956 | 49,349 | 3.63 | 1,373,100 | 49,392 | 3.60 | |||||||||||||||||||||||
Noninterest-earning assets | 101,217 | 73,126 | 78,461 | |||||||||||||||||||||||||||||
Total assets | $ | 1,445,400 | $ | 1,434,082 | $ | 1,451,561 | ||||||||||||||||||||||||||
Interest-bearing Liabilities: | ||||||||||||||||||||||||||||||||
Savings deposits | $ | 155,686 | 164 | 0.11 | $ | 153,671 | 158 | 0.10 | $ | 147,444 | 152 | 0.10 | ||||||||||||||||||||
Money market accounts | 336,179 | 1,054 | 0.31 | 347,367 | 1,116 | 0.32 | 343,823 | 1,169 | 0.34 | |||||||||||||||||||||||
NOW accounts | 289,357 | 360 | 0.12 | 349,021 | 357 | 0.10 | 347,528 | 379 | 0.11 | |||||||||||||||||||||||
Certificates of deposit | 225,990 | 1,216 | 0.54 | 252,629 | 1,407 | 0.56 | 288,351 | 1,939 | 0.67 | |||||||||||||||||||||||
Total deposits | 1,007,212 | 2,794 | 0.28 | 1,102,688 | 3,038 | 0.28 | 1,127,146 | 3,639 | 0.32 | |||||||||||||||||||||||
Borrowings | 8,674 | 20 | 0.23 | 2,980 | 8 | 0.27 | 2,964 | 14 | 0.47 | |||||||||||||||||||||||
Total interest-bearing liabilities | 1,015,886 | 2,814 | 0.28 | 1,105,668 | 3,046 | 0.28 | 1,130,110 | 3,653 | 0.32 | |||||||||||||||||||||||
Noninterest-bearing deposits | 192,528 | 129,282 | 129,755 | |||||||||||||||||||||||||||||
Noninterest-bearing liabilities | 21,882 | 19,285 | 16,818 | |||||||||||||||||||||||||||||
Total liabilities | 1,230,296 | 1,254,235 | 1,276,683 | |||||||||||||||||||||||||||||
Equity | 215,104 | 179,847 | 174,878 | |||||||||||||||||||||||||||||
Total liabilities and equity | $ | 1,445,400 | $ | 1,434,082 | $ | 1,451,561 | ||||||||||||||||||||||||||
Net interest income | $ | 46,148 | $ | 46,303 | $ | 45,739 | ||||||||||||||||||||||||||
Net interest rate spread (1) | 3.36 | % | 3.35 | % | 3.28 | % | ||||||||||||||||||||||||||
Net interest-earning assets (2) | $ | 328,297 | $ | 255,288 | $ | 242,990 | ||||||||||||||||||||||||||
Net interest margin (3) | 3.43 | % | 3.40 | % | 3.33 | % | ||||||||||||||||||||||||||
Ratio of interest-earning assets to interest-bearing liabilities | 132.32 | % | 123.09 | % | 121.50 | % | ||||||||||||||||||||||||||
(1) | Net interest rate spread represents the difference between the yield on average interest-earning assets and the cost of average interest-bearing liabilities. |
(2) | Net interest-earning assets represents total interest-earning assets less total interest-bearing liabilities. |
(3) | Net interest margin represents net interest income divided by average total interest-earning assets. |
25
Comparison of Year 2015 to 2014. Net interest income decreased by $155,000, or 0.3%, to $46.1 million for the year ended December 31, 2015, from $46.3 million for the year ended December 31, 2014. Our net interest rate spread increased one basis point to 3.36% for the year ended December 31, 2015, from 3.35% for 2014. Our net interest margin increased by three basis points to 3.43% for the year ended December 31, 2015, from 3.40% for 2014. Our average interest-earning assets decreased $16.8 million to $1.344 billion for the year ended December 31, 2015, from $1.361 billion for the year ended 2014. Our average interest-bearing liabilities decreased $89.8 million to $1.016 billion for the year ended December 31, 2015, from $1.106 billion for 2014.
Comparison of Year 2014 to 2013. Net interest income increased by $564,000, or 1.2%, to $46.3 million for the year ended December 31, 2014, from $45.7 million for the year ended December 31, 2013. Our net interest rate spread increased seven basis points to 3.35% for the year ended December 31, 2014, compared to 3.28% for 2013. Our net interest margin increased by seven basis points to 3.40% for the year ended December 31, 2014 from 3.33% for 2013. Our average interest-earning assets decreased $12.1 million to $1.361 billion for the year ended December 31, 2014, from $1.373 billion for 2013, and our average interest-bearing liabilities decreased $24.4 million to $1.106 billion for the year ended December 31, 2014, from $1.130 billion for 2013.
Rate/Volume Analysis
The following table presents the dollar amount of changes in interest income and interest expense for the major categories of our interest-earning assets and interest-bearing liabilities. Information is provided for each category of interest-earning assets and interest-bearing liabilities with respect to changes attributable to changes in volume (i.e., changes in average balances multiplied by the prior-period average rate), and changes attributable to rate (i.e., changes in average rate multiplied by prior-period average balances). For purposes of this table, changes attributable to both rate and volume that cannot be segregated have been allocated proportionately to the change due to volume and the change due to rate.
Years Ended December 31, | |||||||||||||||||||||||
2015 vs. 2014 | 2014 vs. 2013 | ||||||||||||||||||||||
Increase (Decrease) Due to | Increase (Decrease) Due to | ||||||||||||||||||||||
Volume | Rate | Total Increase (Decrease) | Volume | Rate | Total Increase (Decrease) | ||||||||||||||||||
(Dollars in thousands) | |||||||||||||||||||||||
Interest-earning assets: | |||||||||||||||||||||||
Loans | $ | 1,535 | $ | (1,849 | ) | $ | (314 | ) | $ | 4,205 | $ | (4,094 | ) | $ | 111 | ||||||||
Securities | (48 | ) | 35 | (13 | ) | 465 | (292 | ) | 173 | ||||||||||||||
Stock in FHLBC | — | 3 | 3 | (2 | ) | 8 | 6 | ||||||||||||||||
Other | (194 | ) | 131 | (63 | ) | (449 | ) | 116 | (333 | ) | |||||||||||||
Total interest-earning assets | 1,293 | (1,680 | ) | (387 | ) | 4,219 | (4,262 | ) | (43 | ) | |||||||||||||
Interest-bearing liabilities: | |||||||||||||||||||||||
Savings deposits | 1 | 5 | 6 | 6 | — | 6 | |||||||||||||||||
Money market accounts | (31 | ) | (31 | ) | (62 | ) | 13 | (66 | ) | (53 | ) | ||||||||||||
NOW accounts | (63 | ) | 66 | 3 | 4 | (26 | ) | (22 | ) | ||||||||||||||
Certificates of deposit | (143 | ) | (48 | ) | (191 | ) | (229 | ) | (303 | ) | (532 | ) | |||||||||||
Borrowings | 13 | (1 | ) | 12 | — | (6 | ) | (6 | ) | ||||||||||||||
Total interest-bearing liabilities | (223 | ) | (9 | ) | (232 | ) | (206 | ) | (401 | ) | (607 | ) | |||||||||||
Change in net interest income | $ | 1,516 | $ | (1,671 | ) | $ | (155 | ) | $ | 4,425 | $ | (3,861 | ) | $ | 564 | ||||||||
26
Provision for Loan Losses
We establish provisions for loan losses, which are charged to operations in order to maintain the allowance for loan losses at a level we consider necessary to absorb probable incurred credit losses in the loan portfolio. In determining the level of the allowance for loan losses, we consider past and current loss experience, evaluations of real estate collateral, current economic conditions, volume and type of lending, adverse situations that may affect a borrower’s ability to repay a loan and the levels of nonperforming and other classified loans. The amount of the allowance is based on estimates and the ultimate losses may vary from such estimates as more information becomes available or events change. We assess the allowance for loan losses on a quarterly basis and make provisions for loan losses in order to maintain the allowance.
We recorded net recoveries of loan losses of $3.2 million, $736,000 and $687,000, respectively, for the years ended December 31, 2015, 2014 and 2013. The provision for loan losses is a function of the allowance for loan loss methodology we use to determine the appropriate level of the allowance for inherent loan losses after net charge-offs have been deducted. The portion of the allowance for loan losses attributable to loans collectively evaluated for impairment decreased $1.9 million, or 16.3%, to $9.6 million at December 31, 2015, from $11.5 million at December 31, 2014. This decrease occurred primarily because the growth in our loan portfolio focused on loan types with lower loss ratios based on our historical loss experience, and improvements in the historical loan loss factors that occurred as the losses incurred in earlier periods aged and thus were either eliminated from the calculation or assigned a lower weight. Net recoveries were $907,000 in 2015, compared to net charge-offs of $1.4 million in 2014 and $3.2 million in 2013. For further analysis and information on how we determine the appropriate level for the allowance for loan losses and analysis of credit quality, see “Critical Accounting Policies,” “Risk Classification of Loans” and “Allowance for Loan Losses.”
Noninterest Income
Years Ended December 31, | Change | ||||||||||||||||||
2015 | 2014 | 2013 | 2015 vs. 2014 | 2014 vs. 2013 | |||||||||||||||
(Dollars in thousands) | |||||||||||||||||||
Deposit service charges and fees | $ | 2,248 | $ | 1,977 | $ | 2,005 | $ | 271 | $ | (28 | ) | ||||||||
Other fee income | 2,143 | 2,238 | 2,250 | (95 | ) | (12 | ) | ||||||||||||
Insurance commissions and annuities income | 386 | 431 | 474 | (45 | ) | (43 | ) | ||||||||||||
Gain on sale of loans, net | 102 | 158 | 1,469 | (56 | ) | (1,311 | ) | ||||||||||||
Loss on sale of securities | — | (7 | ) | — | 7 | (7 | ) | ||||||||||||
Gain (loss) on disposition of premises and equipment | (1 | ) | 5 | (43 | ) | (6 | ) | 48 | |||||||||||
Loan servicing fees | 354 | 418 | 461 | (64 | ) | (43 | ) | ||||||||||||
Amortization of servicing assets | (137 | ) | (135 | ) | (233 | ) | (2 | ) | 98 | ||||||||||
Recovery (impairment) of servicing assets | (3 | ) | (8 | ) | 65 | 5 | (73 | ) | |||||||||||
Earnings on bank owned life insurance | 194 | 235 | 313 | (41 | ) | (78 | ) | ||||||||||||
Trust income | 712 | 683 | 711 | 29 | (28 | ) | |||||||||||||
Other | 693 | 714 | 662 | (21 | ) | 52 | |||||||||||||
Total noninterest income | $ | 6,691 | $ | 6,709 | $ | 8,134 | $ | (18 | ) | $ | (1,425 | ) | |||||||
Comparison of Year 2015 to 2014. Our noninterest income remained stable at $6.7 million for the years ended December 31, 2015 and 2014. Deposit service charges and fees increased $271,000, or 13.7%, to $2.2 million for the year ended December 31, 2015, from $2.0 million for the year ended December 31, 2014, primarily due to increased fees from deposit accounts. Other fee income decreased $95,000, or 4.2%, to $2.1 million for the year ended December 31, 2015, from $2.2 million for the year ended December 31, 2014. The decrease is primarily due to decreased ATM surcharges and service charges in 2015 compared to 2014. Bank-owned life insurance produced earnings of $194,000 for 2015, a decrease of $41,000, or 17.4%, compared to $235,000 for 2014, due to decreased annualized policy returns.
Comparison of Year 2014 to 2013. Our noninterest income decreased by $1.4 million to $6.7 million for the year ended December 31, 2014, from $8.1 million for the year ended December 31, 2013, primarily due to a decrease in gain on sale of loans. Noninterest income for the year ended December 31, 2014 included a $158,000 gain on sale of loans, compared to a $1.5 million gain on sale of loans for the year ended December 31, 2013, which included recurring loan sale activity combined with the completion of the sale of the owner-occupied and investor-owned one-to four family residential loans that we designated as held-for-sale at December 31, 2012. The completion of this sale represented approximately $1.3 million of the $1.5 million gain on sale of loans that we recorded for the year ended December 31, 2013. We recorded an impairment of servicing assets of $8,000
27
for the year ended December 31, 2014, compared to a recovery of servicing assets of $65,000 in 2013. Bank-owned life insurance produced earnings of $235,000 for 2014, a decrease of $78,000, or 24.9%, compared to $313,000 for 2013, due to decreased annualized policy returns.
Noninterest Expense
Years Ended December 31, | Change | ||||||||||||||||||
2015 | 2014 | 2013 | 2015 vs. 2014 | 2014 vs. 2013 | |||||||||||||||
(Dollars in thousands) | |||||||||||||||||||
Compensation and benefits | $ | 22,222 | $ | 22,874 | $ | 26,195 | $ | (652 | ) | $ | (3,321 | ) | |||||||
Office occupancy and equipment | 6,522 | 6,878 | 7,547 | (356 | ) | (669 | ) | ||||||||||||
Advertising and public relations | 991 | 1,107 | 925 | (116 | ) | 182 | |||||||||||||
Information technology | 2,669 | 2,676 | 3,091 | (7 | ) | (415 | ) | ||||||||||||
Supplies, telephone and postage | 1,586 | 1,579 | 1,697 | 7 | (118 | ) | |||||||||||||
Amortization of intangibles | 550 | 578 | 605 | (28 | ) | (27 | ) | ||||||||||||
Nonperforming asset management | 681 | 838 | 2,638 | (157 | ) | (1,800 | ) | ||||||||||||
Loss (gain) on sale other real estate owned | (58 | ) | 35 | 148 | (93 | ) | (113 | ) | |||||||||||
Valuation adjustments of other real estate owned | 548 | 438 | 550 | 110 | (112 | ) | |||||||||||||
Operations of other real estate owned | 573 | 935 | 915 | (362 | ) | 20 | |||||||||||||
FDIC insurance premiums | 904 | 1,416 | 1,913 | (512 | ) | (497 | ) | ||||||||||||
Other | 4,757 | 5,097 | 5,038 | (340 | ) | 59 | |||||||||||||
Total noninterest expense | $ | 41,945 | $ | 44,451 | $ | 51,262 | $ | (2,506 | ) | $ | (6,811 | ) | |||||||
Comparison of Year 2015 to 2014. For the year ended December 31, 2015, noninterest expense decreased by $2.5 million, or 5.6%, to $41.9 million, compared to $44.5 million for the year ended December 31, 2014. Compensation and benefits expense decreased $652,000, or 2.9%, to $22.2 million for the year ended December 31, 2015, compared to $22.9 million in 2014. The decrease was due in part to the reduction in full time equivalent employees to 251 at December 31, 2015 from 269 at December 31, 2014, the impact of which was partially offset by a $600,000 increase in stock-based compensation to $1.7 million for the year ended December 31, 2015, from $1.1 million for 2014. Noninterest expense for 2015 included $1.7 million of nonperforming asset management and OREO expenses, compared to $2.2 million for 2014. Nonperforming asset management expenses decreased $157,000, or 18.7%, to $681,000 for the year ended December 31, 2015, compared to $838,000 in 2014. The decrease was primarily due to a decline in nonperforming assets and a corresponding decline in expenses relating to resolutions and accelerated dispositions of nonperforming assets. The most significant decrease in nonperforming asset management expense related to real estate taxes, which totaled $247,000 for the year ended December 31, 2015, compared to $417,000 for 2014. OREO expenses for the year ended December 31, 2015 totaled $1.1 million, and included a $548,000 valuation adjustment to OREO properties, compared to a $438,000 valuation adjustment in 2014. Noninterest expense for the for the year ended December 31, 2015 included a provision of $80,000 for mortgage representation and warranty reserve for mortgage loans sold, compared to a $73,000 provision for 2014.
Comparison of Year 2014 to 2013. For the year ended December 31, 2014, noninterest expense decreased by $6.8 million, or 13.3%, to $44.5 million from $51.3 million for 2013. Compensation and benefits expense decreased $3.3 million, or 12.7%, to $22.9 million for the year ended December 31, 2014, compared to $26.2 million in 2013. The decrease was due in substantial part to the reduction in full time equivalent employees to 269 at December 31, 2014 from 301 at December 31, 2013. Stock-based compensation for the year ended December 31, 2014 was $1.1 million, compared to $933,000 for 2013. This increase was attributable to an increase in ESOP expense resulting from the $2.70 increase in the Company’s stock price that occurred between December 31, 2013 and December 31, 2014. Noninterest expense for 2014 included $2.2 million of nonperforming asset management and OREO expenses, compared to $4.3 million for 2013. Nonperforming asset management expenses decreased $1.8 million, or 68.2%, to $838,000 for the year ended December 31, 2014, compared to $2.6 million in 2013. The decrease was primarily due to a decline in nonperforming assets and a corresponding decline in expenses relating to resolutions and accelerated dispositions of nonperforming assets. The most significant decreases in nonperforming asset management expense related to legal expenses, receiver fees, and real estate taxes, which totaled $665,000 for the year ended December 31, 2014, compared to $2.5 million for 2013. OREO expenses for the year ended December 31, 2014 totaled $1.4 million, and included a $438,000 valuation adjustment to OREO properties, compared to a $550,000 valuation adjustment in 2013. Noninterest expense for the year ended December 31, 2014 included a provision of $73,000 for mortgage representation and warranty reserve for mortgage loans sold, compared to a $118,000 provision for 2013, and $53,000 in compensatory fees and final settlements of loans serviced for others.
28
Noninterest expense for the year ended December 31, 2013 included the payment of $203,000 of settlements concerning two sold mortgage loans.
Income Taxes
Comparison of Year 2015 to 2014. For the year ended December 31, 2015 we recorded income tax expense of $5.4 million, compared to an income tax benefit of $31.3 million recorded in 2014, which included the full recovery of the valuation allowance of $35.1 million we established for deferred tax assets in 2011. The effective tax rate for the year ended December 31, 2015 was 38.48%.
Comparison of Year 2014 to 2013. For the year ended December 31, 2014 we recorded an income tax benefit of $31.3 million, which included the full recovery of the valuation allowance of $35.1 million we established for deferred tax assets in 2011. We reversed the valuation allowance for deferred tax assets as of December 31, 2014 based on management’s determination that it was more likely than not that the Company would realize the tax attributes underlying the deferred tax assets before they expired. In making this determination, management considered all available negative and positive evidence. For the year ended December 31, 2013, we recorded no income tax expense or benefit due to the existence of a full valuation allowance for deferred tax assets. See Note 12 of the "Notes to Consolidated Financial Statements" in Item 8 of this Form 10-K for further information. Excluding the full recovery of the valuation allowance, the effective tax rate for the year ended December 31, 2014 was 39.13%.
Comparison of Financial Condition at December 31, 2015 and December 31, 2014
Total assets increased $47.0 million, or 3.2%, to $1.512 billion at December 31, 2015, from $1.465 billion at December 31, 2014. The increase in total assets was primarily due to an increase in loans receivable, which was partially offset by a decrease in securities and deferred taxes. Net loans increased $59.9 million, or 5.1%, to $1.232 billion at December 31, 2015, from $1.172 billion at December 31, 2014. Net securities decreased by $6.4 million, or 5.3%, to $114.8 million at December 31, 2015, from $121.2 million at December 31, 2014.
Our loan portfolio consists primarily of investment and business loans (multi-family, nonresidential real estate, commercial, construction and land loans, and commercial leases), which together totaled 87.0% of gross loans at December 31, 2015. Net loans receivable increased $59.9 million, or 5.1%, to $1.232 billion at December 31, 2015. Multi-family mortgage loans increased by $25.7 million, or 5.3%; commercial loans increased by $12.6 million, or 18.9%; nonresidential real estate loans decreased $7.8 million, or 3.3%; construction and land loans decreased by $572,000, or 30.3%; one-to-four family residential mortgage loans decreased by $20.8 million, or 11.6%; and commercial leases increased by $48.3 million, or 22.2%.
Our allowance for loan losses decreased by $2.3 million, or 19.2%, to $9.7 million at December 31, 2015, from $12.0 million at December 31, 2014. The decrease reflected the combined impact of a $3.2 million recovery of loan losses and $907,000 of net recoveries.
Securities decreased $6.4 million, or 5.3%, to $114.8 million at December 31, 2015, from $121.2 million at December 31, 2014, due primarily to proceeds from maturities of $59.8 million and repayments of $7.0 million on residential mortgage-backed securities and collateralized mortgage obligations, were partially offset by securities purchases of $60.7 million. During 2015 and 2014, we also invested in FDIC insured certificates of deposit issued by other insured depository institutions.
Deposits increased $1.2 million, or 0.1%, to $1.213 billion at December 31, 2015, from $1.212 billion at December 31, 2014, due to an increase in savings and checking accounts that was partially offset by a decrease in certificates of deposits. Core deposits (savings, money market, noninterest-bearing demand and NOW accounts) increased as a percentage of total deposits, representing 81.6% of total deposits at December 31, 2015, compared to 80.8% of total deposits at December 31, 2014.
The changes in the balances of noninterest bearing demand deposits and money market and interest-bearing NOW accounts were due in substantial part to efforts we undertook through the third quarter of 2015 to simplify our deposit account options. As part of this process, we discontinued several older account types and converted the discontinued account types to current account types. During the third quarter of 2015, we converted approximately 9,400 older account types, totaling $80 million, to current account types. Approximately 48% of the converted accounts, or 4,500 accounts, were interest-bearing demand accounts that were converted to noninterest bearing demand accounts. Approximately $45 million of the accounts that were converted to non-interest bearing account types have balances that could migrate to interest-bearing accounts if interest rates were to increase materially; accordingly, we have incorporated the possibility of such migration into our various interest-rate risk management scenarios.
Certificates of deposit decreased $10.2 million, or 4.4%, to $222.7 million at December 31, 2015, from $232.9 million at December 31, 2014. The decrease was primarily due to a lessening of our competitive pricing position pending the deployment of our excess liquidity through further loan growth.
29
Total stockholders’ equity was $212.4 million at December 31, 2015, compared to $216.1 million at December 31, 2014. The decrease in total stockholders’ equity was primarily due to the combined impact of our repurchase of 804,649 shares of our common stock at a total cost of $10.0 million, and our declaration and payment of cash dividends totaling $4.1 million during the year ended December 31, 2015. These items were partially offset by net income of $8.7 million that we recorded for the year ended December 31, 2015. The unallocated shares of common stock that our ESOP owns were reflected as a $9.3 million reduction to stockholders’ equity at December 31, 2015, compared to a $10.3 million reduction to stockholders’ equity at December 31, 2014.
Securities
Our investment policy is established by our Board of Directors. The policy emphasizes safety of the investment, liquidity requirements, potential returns, cash flow targets, and consistency with our interest rate risk management strategy.
At December 31, 2015, our mortgage-backed securities and collateralized mortgage obligations (“CMOs”) reflected in the following table were issued by U.S. government-sponsored enterprises and agencies, Freddie Mac, Fannie Mae and Ginnie Mae, and are obligations which the federal government has affirmed its commitment to support. All securities reflected in the table were classified as available-for-sale at December 31, 2015, 2014 and 2013.
We hold FHLBC common stock to qualify for membership in the Federal Home Loan Bank System and to be eligible to borrow funds under the FHLBC’s advance program. The aggregate cost of our FHLBC common stock as of December 31, 2015 was $6.3 million based on its par value. There is no market for FHLBC common stock. We purchased $189,000 of FHLBC stock during 2014 and redeemed $2.3 million of excess FHLBC stock during 2013. At December 31, 2015 we owned 431,000 shares of FHLBC common stock in excess of the number of shares we were required to own to maintain our membership in the Federal Home Loan Bank System and to be eligible to obtain advances.
The following table sets forth the composition, amortized cost and fair value of our securities.
At December 31, | |||||||||||||||||||||||
2015 | 2014 | 2013 | |||||||||||||||||||||
Amortized Cost | Fair Value | Amortized Cost | Fair Value | Amortized Cost | Fair Value | ||||||||||||||||||
(Dollars in thousands) | |||||||||||||||||||||||
Securities: | |||||||||||||||||||||||
Certificates of deposits | $ | 87,901 | $ | 87,901 | $ | 86,049 | $ | 86,049 | $ | 65,010 | $ | 65,010 | |||||||||||
Municipal securities | — | — | — | — | 180 | 187 | |||||||||||||||||
Equity mutual fund | 500 | 507 | 500 | 509 | 500 | 497 | |||||||||||||||||
SBA - guaranteed loan participation certificates | 23 | 23 | 29 | 29 | 35 | 35 | |||||||||||||||||
Total | 88,424 | 88,431 | 86,578 | 86,587 | 65,725 | 65,729 | |||||||||||||||||
Mortgage-backed Securities: | |||||||||||||||||||||||
Mortgage-backed securities - residential | 18,330 | 19,180 | 23,433 | 24,611 | 27,229 | 28,364 | |||||||||||||||||
CMOs and REMICs - residential | 7,111 | 7,142 | 9,936 | 9,976 | 16,851 | 16,814 | |||||||||||||||||
Total mortgage-backed securities | 25,441 | 26,322 | 33,369 | 34,587 | 44,080 | 45,178 | |||||||||||||||||
$ | 113,865 | $ | 114,753 | $ | 119,947 | $ | 121,174 | $ | 109,805 | $ | 110,907 | ||||||||||||
The fair values of marketable equity securities are generally determined by quoted prices, in active markets, for each specific security. If quoted market prices are not available for a marketable equity security, we determine its fair value based on the quoted price of a similar security traded in an active market. The fair values of debt securities are generally determined by matrix pricing, which is a mathematical technique widely used in the industry to value debt securities without relying exclusively on quoted prices for the specific securities, but rather by relying on the securities’ relationship to other benchmark quoted securities. The fair value of a security is used to determine the amount of any unrealized losses that must be reflected in our other comprehensive income and the net book value of our securities.
We evaluate marketable investment securities with significant declines in fair value on a quarterly basis to determine whether they should be considered other-than-temporarily impaired under current accounting guidance, which generally provides that if a
30
marketable security is in an unrealized loss position, whether due to general market conditions or industry or issuer-specific factors, the holder of the securities must assess whether the impairment is other-than-temporary.
Portfolio Maturities and Yields
The composition and maturities of the securities portfolio and the mortgage-backed securities portfolio at December 31, 2015 are summarized in the following table. Maturities are based on the final contractual payment dates, and do not reflect the impact of prepayments or early redemptions that may occur. Municipal securities yields have not been adjusted to a tax-equivalent basis, as the amount is immaterial.
One Year or Less | More than One Year through Five Years | More than Five Years through Ten Years | More than Ten Years | ||||||||||||||||||||||||
Amortized Cost | Weighted Average Yield | Amortized Cost | Weighted Average Yield | Amortized Cost | Weighted Average Yield | Amortized Cost | Weighted Average Yield | ||||||||||||||||||||
(Dollars in thousands) | |||||||||||||||||||||||||||
Securities: | |||||||||||||||||||||||||||
Certificates of deposit | $ | 87,901 | 0.85 | % | $ | — | — | % | $ | — | — | % | $ | — | — | % | |||||||||||
Municipal securities | — | — | — | — | — | — | — | — | |||||||||||||||||||
Equity mutual fund | 500 | 1.85 | — | — | — | — | — | — | |||||||||||||||||||
SBA guaranteed loan participation certificates | — | — | 23 | 1.75 | — | — | — | — | |||||||||||||||||||
88,401 | 0.85 | 23 | 1.75 | — | — | — | — | ||||||||||||||||||||
Mortgage-backed Securities: | |||||||||||||||||||||||||||
Pass-through securities: | |||||||||||||||||||||||||||
Fannie Mae | — | — | — | — | 3 | 2.36 | 8,896 | 3.04 | |||||||||||||||||||
Freddie Mac | — | — | 77 | 2.33 | — | — | 1,256 | 3.26 | |||||||||||||||||||
Ginnie Mae | — | — | — | — | 71 | 1.88 | 8,027 | 2.36 | |||||||||||||||||||
CMOs and REMICs | — | — | — | — | 546 | 1.81 | 6,565 | 0.65 | |||||||||||||||||||
— | — | 77 | 2.33 | 620 | 1.82 | 24,744 | 2.19 | ||||||||||||||||||||
Total securities | $ | 88,401 | 0.85 | % | $ | 100 | 2.19 | % | $ | 620 | 1.82 | % | $ | 24,744 | 2.19 | % | |||||||||||
31
Loan Portfolio
We originate multi-family mortgage loans, nonresidential real estate loans, commercial loans and commercial leases. In addition, we originate one-to-four family residential mortgage loans and consumer loans, and purchase and sell loan participations from time-to-time. We do not originate construction and land loans, but our loan portfolio contains residual balances of this loan type primarily resulting from our acquisition of another institution. Our principal loan products are discussed in Note 4 of the "Notes to Consolidated Financial Statements" in Item 8 of this Form 10-K.
The following table sets forth the composition of our loan portfolio, excluding loans held-for-sale, by type of loan.
At December 31, | ||||||||||||||||||||||||||||||||||
2015 | 2014 | 2013 | 2012 | 2011 | ||||||||||||||||||||||||||||||
Amount | Percent | Amount | Percent | Amount | Percent | Amount | Percent | Amount | Percent | |||||||||||||||||||||||||
(Dollars in thousands) | ||||||||||||||||||||||||||||||||||
One-to-four family residential | $ | 159,501 | 12.86 | % | $ | 180,337 | 15.24 | % | $ | 201,382 | 18.12 | % | $ | 218,596 | 20.86 | % | $ | 272,032 | 21.62 | % | ||||||||||||||
Multi-family mortgage | 506,026 | 40.80 | 480,349 | 40.60 | 396,058 | 35.64 | 352,019 | 33.60 | 423,615 | 33.67 | ||||||||||||||||||||||||
Nonresidential real estate | 226,735 | 18.28 | 234,500 | 19.82 | 263,567 | 23.72 | 264,672 | 25.26 | 311,641 | 24.77 | ||||||||||||||||||||||||
Construction and land | 1,313 | 0.10 | 1,885 | 0.16 | 6,570 | 0.59 | 8,552 | 0.82 | 19,852 | 1.58 | ||||||||||||||||||||||||
Commercial loans | 79,516 | 6.41 | 66,882 | 5.65 | 54,255 | 4.88 | 61,388 | 5.86 | 93,932 | 7.46 | ||||||||||||||||||||||||
Commercial leases | 265,405 | 21.40 | 217,143 | 18.36 | 187,112 | 16.84 | 139,783 | 13.34 | 134,990 | 10.73 | ||||||||||||||||||||||||
Consumer | 1,831 | 0.15 | 2,051 | 0.17 | 2,317 | 0.21 | 2,745 | 0.26 | 2,147 | 0.17 | ||||||||||||||||||||||||
1,240,327 | 100.00 | % | 1,183,147 | 100.00 | % | 1,111,261 | 100.00 | % | 1,047,755 | 100.00 | % | 1,258,209 | 100.00 | % | ||||||||||||||||||||
Net deferred loan origination costs | 1,621 | 1,199 | 970 | 745 | 908 | |||||||||||||||||||||||||||||
Allowance for loan losses | (9,691 | ) | (11,990 | ) | (14,154 | ) | (18,035 | ) | (31,726 | ) | ||||||||||||||||||||||||
Total loans, net | $ | 1,232,257 | $ | 1,172,356 | $ | 1,098,077 | $ | 1,030,465 | $ | 1,227,391 | ||||||||||||||||||||||||
We engage in multi-family lending activities in carefully selected Metropolitan Statistical Areas outside of our primary lending area and engage in healthcare lending and commercial leasing activities on a nationwide basis. At December 31, 2015, $309.7 million, or 61.1%, or our multi-family loans were in the Metropolitan Statistical Area for Chicago, Illinois, while $47.5 million, or 9.4%, were in the Metropolitan Statistical Area for Dallas, Texas, $53.8 million, or 10.6%, were in the Metropolitan Statistical Area for Denver, Colorado, $22.4 million, or 4.4%, were in the Metropolitan Statistical Area for Minneapolis, Minnesota, and $11.5 million, or 2.3%, were in the Metropolitan Statistical Area for Tampa, Florida.
32
Loan Portfolio Maturities
The following table summarizes the scheduled repayments of our loan portfolio at December 31, 2015. Demand loans, loans having no stated repayment schedule or maturity and overdraft loans are reported as being due in one year or less.
Within One Year | One Year Through Five Years | Beyond Five Years | Total | ||||||||||||
(Dollars in thousands) | |||||||||||||||
Scheduled Repayments of Loans: | |||||||||||||||
One-to-four family residential | $ | 18,398 | $ | 46,131 | $ | 94,972 | $ | 159,501 | |||||||
Multi-family mortgage | 34,991 | 98,917 | 372,118 | 506,026 | |||||||||||
Nonresidential real estate | 67,225 | 144,932 | 14,578 | 226,735 | |||||||||||
Construction and land | 950 | 363 | — | 1,313 | |||||||||||
Commercial loans and leases | 152,977 | 179,465 | 12,479 | 344,921 | |||||||||||
Consumer | 429 | 1,003 | 399 | 1,831 | |||||||||||
$ | 274,970 | $ | 470,811 | $ | 494,546 | $ | 1,240,327 | ||||||||
Total | |||||||||||||||
Loans Maturing After One Year: | |||||||||||||||
Predetermined (fixed) interest rates | $ | 426,565 | |||||||||||||
Adjustable interest rates | 538,792 | ||||||||||||||
$ | 965,357 | ||||||||||||||
33
Nonperforming Loans and Assets
We review loans on a regular basis, and generally place loans on nonaccrual status when either principal or interest is 90 days or more past due. In addition, the Company places loans on nonaccrual status when we do not expect to receive full payment of interest or principal. Interest accrued and unpaid at the time a loan is placed on nonaccrual status is reversed from interest income. Interest payments received on nonaccrual loans are recognized in accordance with our significant accounting policies. Once a loan is placed on nonaccrual status, the borrower must generally demonstrate at least six months of payment performance before the loan is eligible to return to accrual status. We may have loans classified as 90 days or more delinquent and still accruing. Generally, we do not utilize this category of loan classification unless: (1) the loan is repaid in full shortly after the period end date; (2) the loan is well secured and there are no asserted or pending legal barriers to its collection; or (3) the borrower has remitted all scheduled payments and is otherwise in substantial compliance with the terms of the loan, but the processing of loan payments actually received or the renewal of the loan has not occurred for administrative reasons. At December 31, 2015, we had no loans in this category.
We typically obtain new third-party appraisals or collateral valuations when we place a loan on nonaccrual status, conduct impairment testing or complete a troubled debt restructuring (“TDR”) unless the existing valuation information for the collateral is sufficiently current to comply with the requirements of our Appraisal and Collateral Valuation Policy (“ACV Policy”). We also obtain new third–party appraisals or collateral valuations when the judicial foreclosure process concludes with respect to real estate collateral, and when we otherwise acquire actual or constructive title to real estate collateral. In addition to third–party appraisals, we use updated valuation information based on Multiple Listing Service data, broker opinions of value, actual sales prices of similar assets sold by us and approved sales prices in response to offers to purchase similar assets owned by us to provide interim valuation information for consolidated financial statement and management purposes. Our ACV Policy establishes the maximum useful life of a real estate appraisal at 18 months. Because appraisals and updated valuations utilize historical or “ask-side” data in reaching valuation conclusions, the appraised or updated valuation may or may not reflect the actual sales price that we will receive at the time of sale.
Real estate appraisals may include up to three approaches to value: the sales comparison approach, the income approach (for income-producing property) and the cost approach. Not all appraisals utilize all three approaches. Depending on the nature of the collateral and market conditions, we may emphasize one approach over another in determining the fair value of real estate collateral. Appraisals may also contain different estimates of value based on the level of occupancy or planned future improvements. “As-is” valuations represent an estimate of value based on current market conditions with no changes to the use or condition of the real estate collateral. “As-stabilized” or “as-completed” valuations assume the real estate collateral will be improved to a stated standard or achieve its highest and best use in terms of occupancy. “As-stabilized” or “as-completed” valuations may be subject to a present value adjustment for market conditions or the schedule of improvements.
As part of the asset classification process, we develop an exit strategy for real estate collateral or OREO by assessing overall market conditions, the current use and condition of the asset, and its highest and best use. For most income–producing real estate, we believe that investors value most highly a stable income stream from the asset; consequently, we perform a comparative evaluation to determine whether conducting a sale on an “as-is”, “as-stabilized” or “as-improved” basis is most likely to produce the highest net realizable value. If we determine that the “as-stabilized” or “as-improved” basis is appropriate, we then complete the necessary improvements or tenant stabilization tasks, with the applicable time value discount and improvement expenses incorporated into our estimates of the expected costs to sell. As of December 31, 2015, substantially all impaired real estate loan collateral and OREO were valued on an “as–is basis.”
Estimates of the net realizable value of real estate collateral also include a deduction for the expected costs to sell the collateral or such other deductions from the cash flows resulting from the operation and liquidation of the asset as are appropriate. For most real estate collateral subject to the judicial foreclosure process, we apply a 10.0% deduction to the value of the asset to determine the expected costs to sell the asset. This estimate includes one year of real estate taxes, sales commissions and miscellaneous repair and closing costs. If we receive a purchase offer that requires unbudgeted repairs, or if the expected resolution period for the asset exceeds one year, we then include, on a case-by-case basis, the costs of the additional real estate taxes and repairs and any other material holding costs in the expected costs to sell the collateral. For OREO, we apply a 7.0% deduction to determine the expected costs to sell, as expenses for real estate taxes and repairs are expensed when incurred.
34
Nonperforming Assets Summary
The following table below sets forth the amounts and categories of our nonperforming loans and nonperforming assets.
At December 31, | |||||||||||||||||||
2015 | 2014 | 2013 | 2012 | 2011 | |||||||||||||||
(Dollars in thousands) | |||||||||||||||||||
Nonaccrual loans | |||||||||||||||||||
One-to-four family residential | $ | 2,455 | $ | 4,408 | $ | 4,741 | $ | 7,299 | $ | 10,622 | |||||||||
Multi-family mortgage | 821 | 4,481 | 7,098 | 3,517 | 14,807 | ||||||||||||||
Nonresidential real estate | 296 | 3,245 | 5,847 | 8,985 | 29,927 | ||||||||||||||
Construction and land | — | — | 382 | 2,210 | 3,246 | ||||||||||||||
Commercial | — | 76 | 100 | 256 | 2,920 | ||||||||||||||
Commercial leases | — | — | — | — | 22 | ||||||||||||||
Consumer | — | 3 | 12 | — | 3 | ||||||||||||||
3,572 | 12,213 | 18,180 | 22,267 | 61,547 | |||||||||||||||
Loans Past Due Over 90 Days, still accruing | — | — | 228 | 329 | 350 | ||||||||||||||
Loans held-for-sale | — | — | — | 1,752 | — | ||||||||||||||
Other real estate owned | |||||||||||||||||||
One-to-four family residential | 2,621 | 1,263 | 1,077 | 1,760 | 5,328 | ||||||||||||||
Multi-family mortgage | 951 | 2,307 | 1,921 | 720 | 3,655 | ||||||||||||||
Nonresidential real estate | 1,747 | 885 | 1,181 | 3,504 | 4,905 | ||||||||||||||
Land | 1,692 | 1,903 | 2,127 | 1,323 | 2,237 | ||||||||||||||
7,011 | 6,358 | 6,306 | 7,307 | 16,125 | |||||||||||||||
Nonperforming assets (excluding purchased impaired loans and purchased other real estate owned) | 10,583 | 18,571 | 24,714 | 31,655 | 78,022 | ||||||||||||||
Purchased impaired loans (1), (2) | |||||||||||||||||||
One-to-four family residential | 380 | 3,941 | |||||||||||||||||
Multi-family mortgage | — | 1,418 | |||||||||||||||||
Nonresidential real estate | 2,568 | 3,375 | |||||||||||||||||
Construction and land | 1,021 | 4,788 | |||||||||||||||||
Commercial | 20 | 1,078 | |||||||||||||||||
3,989 | 14,600 | ||||||||||||||||||
Purchased other real estate owned (1), (2) | |||||||||||||||||||
One-to-four family residential | 320 | 327 | |||||||||||||||||
Nonresidential real estate | 462 | 2,546 | |||||||||||||||||
Land | 2,269 | 3,482 | |||||||||||||||||
3,051 | 6,355 | ||||||||||||||||||
Purchased impaired loans and other real estate owned | 7,040 | 20,955 | |||||||||||||||||
Total nonperforming assets | $ | 10,583 | $ | 18,571 | $ | 24,714 | $ | 38,695 | $ | 98,977 | |||||||||
Ratios | |||||||||||||||||||
Nonperforming loans to total loans | 0.29 | % | 1.03 | % | 1.66 | % | 2.70 | % | 6.08 | % | |||||||||
Nonperforming assets to total assets | 0.70 | % | 1.27 | % | 1.70 | % | 2.61 | % | 6.33 | % | |||||||||
(1) | Purchased impaired loans and purchased other real estate owned are no longer segregated after 2012. |
(2) | Purchased impaired loans and purchased other real estate owned resulted from the Downers Grove National Bank acquisition. |
35
Nonperforming Assets
Nonperforming assets decreased by $8.0 million in 2015, due in substantial part to the execution of the Company's plan to materially reduce nonperforming asset expenses and accelerate a return to the Company's historical asset quality levels. Nonperforming assets totaled $10.6 million at December 31, 2015, and $18.6 million at December 31, 2014. The decrease in nonperforming assets for the year ended December 31, 2015 reflected the disposition of $4.7 million of OREO, and numerous other nonperforming asset resolutions.
Approximately $5.9 million nonaccrual loans were transferred to OREO during the year ended December 31, 2015. These were primarily land, multifamily and nonresidential loans, comprising the majority of the decrease in nonaccrual loans for the period. We continue to experience modest quantities of defaults on residential loans principally due either to the borrower’s personal financial condition or deteriorated collateral value.
Loan Extensions and Modifications
Maturing loans are subject to our standard loan underwriting policies and practices. Due to the need to obtain updated borrower and guarantor financial information, collateral information or to prepare revised loan documentations, loans in the process of renewal may appear as past due because the information needed to underwrite a renewal of the loan is not available to us prior to the maturity date of the loan. At times, short-term administrative extensions, which are typically 90 days in duration, are granted to facilitate proper underwriting. In general, loan modifications are subject to a risk-adjusted pricing analysis.
When appropriate, we evaluate loan extensions or modifications in accordance with ASC 310-40 and related federal regulatory guidance concerning TDRs and the FFIEC workout guidance to determine the required treatment for nonaccrual status and risk classification purposes. In general, if we grant a loan modification or extension that involves either the absence of principal amortization (other than for revolving lines of credit which are customarily granted on interest-only terms), or if we grant a material extension of an existing loan amortization period in excess of our underwriting standards, the loan will be placed on nonaccrual status and impairment testing conducted to determine whether a specific valuation allowance or loss classification / charge-off is required. If the loan is well secured by an abundance of collateral and the collectability of both interest and principal is probable, the loan may remain on accrual status, but it will be classified as a TDR due to the concession made in the loan principal amortization payment component. A loan in full compliance with the payment requirements specified in a loan modification will not be considered as past due, but may nonetheless be placed on nonaccrual status or be classified as a TDR, as appropriate under the circumstances.
In accordance with the FFIEC workout guidance, the Company will restructure a note into two separate notes (A/B structure), charging off the entire B portion of the note. The A note is structured with appropriate loan-to-value and cash flow coverage ratios that provide for a high likelihood of repayment. The A note is classified as a non-performing note until the borrower has displayed a historical payment performance for a reasonable time prior to and subsequent to the restructuring. A period of sustained repayment for at least six months generally is required to return the note to accrual status provided that management has determined that the performance is reasonably expected to continue. The A note will be classified as a restructured note (either performing or nonperforming) through the calendar year of the restructuring that the historical payment performance has been established.
Troubled Debt Restructurings
The Company had $2.7 million of TDRs at December 31, 2015, compared to $3.0 million at December 31, 2014, with $0 and $38,000 in specific valuation allowances allocated to those loans at December 31, 2015 and 2014, respectively. The Company had no outstanding commitments to borrowers whose loans are classified as TDRs.
36
The following table presents the Company's TDRs by class.
At December 31, | |||||||
2015 | 2014 | ||||||
(Dollars in thousands) | |||||||
One-to-four family residential real estate | $ | 1,385 | $ | 1,917 | |||
Multi-family mortgage | 1,119 | 510 | |||||
Accrual troubled debt restructured loans | 2,504 | 2,427 | |||||
One-to-four family residential real estate | 174 | 230 | |||||
Multi-family mortgage | — | 346 | |||||
Nonaccrual troubled debt restructured loans | 174 | 576 | |||||
Total troubled debt restructured loans | $ | 2,678 | $ | 3,003 | |||
Risk Classification of Loans
Our policies, consistent with regulatory guidelines, provide for the classification of loans and other assets that are considered to be of lesser quality as substandard, doubtful, or loss assets, or designated as special mention.
A substandard asset is inadequately protected by the current sound worth and paying capacity of the obligor or of the collateral pledged, if any. Assets so classified must have a well-defined weakness, or weaknesses, that jeopardize the liquidation of the debt. They are characterized by the distinct possibility that the Bank will sustain some loss if the deficiencies are not corrected. The risk-rating guidance published by the OCC clarifies that a loan with a well-defined weakness does not have to present a probability of default for the loan to be rated substandard, and that an individual loan’s loss potential does not have to be distinct for the loan to be rated substandard. An asset classified as doubtful has all the weaknesses inherent in one classified as substandard with the added characteristic that the weaknesses make collection or liquidation in full, on the basis of currently existing facts, conditions, and values, highly questionable and improbable. Assets classified as loss are those considered uncollectible and of such little value that their continuance as assets is not warranted; such balances are promptly charged-off as required by applicable federal regulations. A special mention asset has potential weaknesses that deserve management’s close attention. If left uncorrected, these potential weaknesses may result in deterioration of the repayment prospects for the asset or in the institution’s credit position at some future date. Special mention assets are not adversely classified and do not expose an institution to sufficient risk to warrant adverse classification.
Based on a review of our assets at December 31, 2015, classified loans consisted of $12.5 million performing substandard loans and $3.3 million of nonperforming loans. As of December 31, 2015, we had $2.2 million of loans designated as special mention.
Allowance for Loan Losses
We establish provisions for loan losses, which are charged to operations in order to maintain the allowance for loan losses at a level we consider necessary to absorb probable incurred credit losses in the loan portfolio. In determining the level of the allowance for loan losses, we consider past and current loss experience, trends in nonaccrual loans, evaluations of real estate collateral, current economic conditions, volume and type of lending, adverse situations that may affect a borrower’s ability to repay a loan and the levels of nonperforming and other classified loans. The amount of the allowance is based on estimates and the ultimate losses may vary from the estimates as more information becomes available or events change.
We provide for loan losses based on the allowance method. Accordingly, all loan losses are charged to the related allowance and all recoveries are credited to it. Additions to the allowance for loan losses are provided by charges to income based on various factors that, in our judgment, deserve current recognition in estimating probable incurred credit losses. We review the loan portfolio on an ongoing basis and make provisions for loan losses on a quarterly basis to maintain the allowance for loan losses in accordance with accounting principles generally accepted in the United States of America. The allowance for loan losses consists of two components:
• | specific allowances established for any impaired residential non-owner occupied mortgage, multi-family mortgage, nonresidential real estate, construction and land, commercial, and commercial lease loans for which the recorded investment in the loan exceeds the measured value of the loan; and |
37
• | general allowances for loan losses for each loan class based on historical loan loss experience; and adjustments to historical loss experience (general allowances), maintained to cover uncertainties that affect our estimate of probable incurred credit losses for each loan class. |
The adjustments to historical loss experience are based on our evaluation of several factors, including levels of, and trends in, past due and classified loans; levels of, and trends in, charge-offs and recoveries; trends in volume and terms of loans, including any credit concentrations in the loan portfolio; experience, and ability of lending management and other relevant staff; and national and local economic trends and conditions.
We evaluate the allowance for loan losses based upon the combined total of the specific and general components. Generally, when the loan portfolio increases, absent other factors, the allowance for loan loss methodology results in a higher dollar amount of estimated probable incurred credit losses than would be the case without the increase. Conversely, when the loan portfolio decreases, absent other factors, the allowance for loan loss methodology generally results in a lower dollar amount of estimated probable losses than would be the case without the decrease.
We review our loan portfolio on an ongoing basis to determine whether any loans require classification and impairment testing in accordance with applicable regulations and accounting principles. When we classify loans as either substandard or doubtful and in certain other cases, we review the collateral and future cash flow projections to determine if a specific reserve is necessary. The allowance for loan losses represents amounts that have been established to recognize incurred credit losses in the loan portfolio that are both probable and reasonably estimable at the date of the consolidated financial statements. When we classify problem loans as loss, we charge-off such amounts.
Our calculation of the general component of the allowance for loan losses includes the FASB disclosure requirement that each loan portfolio category must be segmented into specific loan classes (FASB Standards Update 2010-20 (ASU 210-20), “Receivables (Topic 310): Disclosures about the Credit Quality of Financing Receivables and the Allowance for Credit Losses”). Loan class segmentation tables are presented in Note 4 of the "Notes to Consolidated Financial Statements" in Item 8 of this Form 10-K. To maintain consistency, the loan class segmentation was also applied within the 12-quarter loss history that we use to calculate the general component of the allowance for loan losses, inherent risk factor weightings were adjusted based on our evaluation of their relevance to the new loan classes, and duplicative historical loss factors were eliminated from the loan class segmentation.
While we use the best information available to make evaluations, future adjustments to the allowance may become necessary if conditions differ substantially from the information that we used in making the evaluations. Our determinations as to the risk classification of our loans and the amount of our allowance for loan losses are subject to review by our regulatory agencies, which can require that we establish additional loss allowances.
38
Net Charge-offs and Recoveries
The following table sets forth activity in our allowance for loan losses.
At or For the Years Ended December 31, | |||||||||||||||||||
2015 | 2014 | 2013 | 2012 | 2011 | |||||||||||||||
(Dollars in thousands) | |||||||||||||||||||
Balance at beginning of year | $ | 11,990 | $ | 14,154 | $ | 18,035 | $ | 31,726 | $ | 22,180 | |||||||||
Charge-offs | |||||||||||||||||||
One-to-four family residential | (386 | ) | (873 | ) | (1,505 | ) | (12,366 | ) | (5,316 | ) | |||||||||
Multi-family mortgage | (198 | ) | (1,230 | ) | (1,832 | ) | (7,203 | ) | (3,514 | ) | |||||||||
Nonresidential real estate | (391 | ) | (1,727 | ) | (577 | ) | (18,167 | ) | (698 | ) | |||||||||
Construction and land | — | (1 | ) | (943 | ) | (4,311 | ) | (2,519 | ) | ||||||||||
Commercial loans | (152 | ) | (123 | ) | (425 | ) | (4,960 | ) | (1,394 | ) | |||||||||
Commercial leases | — | (8 | ) | — | (121 | ) | (72 | ) | |||||||||||
Consumer | (16 | ) | (12 | ) | (55 | ) | (103 | ) | (93 | ) | |||||||||
(1,143 | ) | (3,974 | ) | (5,337 | ) | (47,231 | ) | (13,606 | ) | ||||||||||
Recoveries | |||||||||||||||||||
One-to-four family residential | 702 | 418 | 447 | 233 | 51 | ||||||||||||||
Multi-family mortgage | 182 | 100 | 236 | 539 | 125 | ||||||||||||||
Nonresidential real estate | 509 | 423 | 519 | 328 | 73 | ||||||||||||||
Construction and land | 44 | 377 | 463 | 250 | — | ||||||||||||||
Commercial loans | 611 | 1,225 | 470 | 626 | 173 | ||||||||||||||
Commercial leases | 1 | — | — | — | — | ||||||||||||||
Consumer | 1 | 3 | 8 | 42 | 7 | ||||||||||||||
2,050 | 2,546 | 2,143 | 2,018 | 429 | |||||||||||||||
Net recoveries (charge-offs) | 907 | (1,428 | ) | (3,194 | ) | (45,213 | ) | (13,177 | ) | ||||||||||
Provision for (recovery of) loan losses | (3,206 | ) | (736 | ) | (687 | ) | 31,522 | 22,723 | |||||||||||
Balance at end of year | $ | 9,691 | $ | 11,990 | $ | 14,154 | $ | 18,035 | $ | 31,726 | |||||||||
Ratios | |||||||||||||||||||
Net charge-offs to average loans outstanding | (0.08 | )% | 0.13 | % | 0.31 | % | 3.91 | % | 1.04 | % | |||||||||
Allowance for loan losses to nonperforming loans | 271.30 | 98.17 | 76.89 | 63.64 | 41.47 | ||||||||||||||
Allowance for loan losses to total loans | 0.78 | 1.01 | 1.27 | 1.72 | 2.52 | ||||||||||||||
We had a recovery of loan losses of $3.2 million in 2015, compared to a recovery of $736,000 in 2014. The provision for or recovery of loan losses is a function of the allowance for loan loss methodology that we use to determine the appropriate level of the allowance for inherent loan losses after net charge-offs have been deducted. The portion of the allowance for loan losses attributable to loans collectively evaluated for impairment decreased $1.9 million, or 16.3%, to $9.6 million at December 31, 2015, from $11.5 million at December 31, 2014. The reserve established for loans individually evaluated for impairment decreased $426,000, or 90.6%, to $44,000 at December 31, 2015, from $470,000 at December 31, 2014. Net recoveries were $907,000 for the year ended December 31, 2015, compared to net charge-offs of $1.4 million and $3.2 million for the years ended December 31, 2014, and December 31, 2013, respectively. Although our loan portfolio increased by $57.2 million for the year ended December 31, 2015, the combined impact of these two factors was sufficient to fully fund the allowance to reflect the growth in our loan portfolio.
The reduction in our allowance for loans and lease losses was predominately due to a 19 basis point reduction in our weighted average historical loss rates.
A loan balance is classified as a loss and charged-off when it is confirmed that there is no readily apparent source of repayment for the portion of the loan that is classified as loss. Confirmation can occur upon the receipt of updated third-party appraisal
39
valuation information indicating that there is a low probability of repayment upon sale of the collateral, the final disposition of collateral where the net proceeds are insufficient to pay the loan balance in full, our failure to obtain possession of certain consumer-loan collateral within certain time limits specified by applicable federal regulations, the conclusion of legal proceedings where the borrower’s obligation to repay is legally discharged (such as a Chapter 7 bankruptcy proceeding), or when it appears that further formal collection procedures are not likely to result in net proceeds in excess of the costs to collect.
Allocation of Allowance for Loan Losses
The following table sets forth our allowance for loan losses allocated by loan category. The allowance for loan losses allocated to each category is not necessarily indicative of future losses in any particular category and does not restrict the use of the allowance to absorb losses in other categories.
At December 31, | ||||||||||||||||||||||||||||||||
2015 | 2014 | 2013 | ||||||||||||||||||||||||||||||
Allowance for Loan Losses | Loan Balances by Category | Percent of Loans in Each Category to Total Loans | Allowance for Loan Losses | Loan Balances by Category | Percent of Loans in Each Category to Total Loans | Allowance for Loan Losses | Loan Balances by Category | Percent of Loans in Each Category to Total Loans | ||||||||||||||||||||||||
(Dollars in thousands) | ||||||||||||||||||||||||||||||||
One-to-four family residential | $ | 1,704 | $ | 159,501 | 12.86 | % | $ | 2,148 | $ | 180,337 | 15.24 | % | $ | 3,848 | $ | 201,382 | 18.12 | % | ||||||||||||||
Multi-family mortgage | 3,610 | 506,026 | 40.80 | 5,205 | 480,349 | 40.60 | 4,444 | 396,058 | 35.64 | |||||||||||||||||||||||
Nonresidential real estate | 2,582 | 226,735 | 18.28 | 2,940 | 234,500 | 19.82 | 3,735 | 263,567 | 23.72 | |||||||||||||||||||||||
Construction and land | 43 | 1,313 | 0.10 | 80 | 1,885 | 0.16 | 393 | 6,570 | 0.59 | |||||||||||||||||||||||
Commercial loans | 654 | 79,516 | 6.41 | 554 | 66,882 | 5.65 | 731 | 54,255 | 4.88 | |||||||||||||||||||||||
Commercial leases | 1,073 | 265,405 | 21.40 | 1,009 | 217,143 | 18.36 | 946 | 187,112 | 16.84 | |||||||||||||||||||||||
Consumer | 25 | 1,831 | 0.15 | 54 | 2,051 | 0.17 | 57 | 2,317 | 0.21 | |||||||||||||||||||||||
$ | 9,691 | $ | 1,240,327 | 100.00 | % | $ | 11,990 | $ | 1,183,147 | 100.00 | % | $ | 14,154 | $ | 1,111,261 | 100.00 | % | |||||||||||||||
At December 31, | |||||||||||||||||||||
2012 | 2011 | ||||||||||||||||||||
Allowance for Loan Losses | Loan Balances by Category | Percent of Loans in Each Category to Total Loans | Allowance for Loan Losses | Loan Balances by Category | Percent of Loans in Each Category to Total Loans | ||||||||||||||||
(Dollars in thousands) | |||||||||||||||||||||
One-to-four family residential | $ | 4,726 | $ | 218,596 | 20.86 | % | $ | 6,103 | $ | 272,032 | 21.62 | % | |||||||||
Multi-family mortgage | 4,580 | 352,019 | 33.60 | 6,082 | 423,615 | 33.67 | |||||||||||||||
Nonresidential real estate | 5,545 | 264,672 | 25.26 | 13,756 | 311,641 | 24.77 | |||||||||||||||
Construction and land | 1,031 | 8,552 | 0.82 | 1,684 | 19,852 | 1.58 | |||||||||||||||
Commercial loans | 1,324 | 61,388 | 5.86 | 3,539 | 93,932 | 7.46 | |||||||||||||||
Commercial leases | 666 | 139,783 | 13.34 | 504 | 134,990 | 10.73 | |||||||||||||||
Consumer | 163 | 2,745 | 0.26 | 58 | 2,147 | 0.17 | |||||||||||||||
$ | 18,035 | $ | 1,047,755 | 100.00 | % | $ | 31,726 | $ | 1,258,209 | 100.00 | % | ||||||||||
40
Sources of Funds
Deposits. At December 31, 2015, our deposits totaled $1.213 billion. Interest-bearing deposits totaled $958.1 million and noninterest-bearing demand deposits totaled $254.8 million. NOW, savings and money market accounts totaled $735.4 million. Noninterest-bearing demand deposits at December 31, 2015 included $69,000 in internal checking accounts. At December 31, 2015, we had $222.7 million of certificates of deposit outstanding, of which $151.5 million had maturities of one year or less. Although a significant portion of our certificates of deposit are shorter-term certificates of deposit, we believe, based on historical experience and our current pricing strategy, that we will retain a significant portion of these accounts upon maturity.
The following table sets forth the distribution of total deposit accounts, by account type.
Years Ended December 31, | |||||||||||||||||||||||||||||
2015 | 2014 | 2013 | |||||||||||||||||||||||||||
Average Balance | Percent | Weighted Average Rate | Average Balance | Percent | Weighted Average Rate | Average Balance | Percent | Weighted Average Rate | |||||||||||||||||||||
(Dollars in thousands) | |||||||||||||||||||||||||||||
Noninterest-bearing demand: | |||||||||||||||||||||||||||||
Retail | $ | 99,839 | 8.32 | % | — | % | $ | 37,932 | 3.08 | % | — | % | $ | 37,779 | 3.01 | % | — | % | |||||||||||
Commercial | 92,689 | 7.73 | — | 91,350 | 7.41 | — | 91,976 | 7.31 | — | ||||||||||||||||||||
Total noninterest-bearing demand | 192,528 | 16.05 | — | 129,282 | 10.49 | — | 129,755 | 10.32 | — | ||||||||||||||||||||
Savings deposits | 155,686 | 12.97 | 0.11 | 153,671 | 12.47 | 0.10 | 147,444 | 11.73 | 0.10 | ||||||||||||||||||||
Money market accounts | 336,179 | 28.02 | 0.31 | 347,367 | 28.20 | 0.32 | 343,823 | 27.36 | 0.34 | ||||||||||||||||||||
Interest-bearing NOW accounts | 289,357 | 24.12 | 0.12 | 349,021 | 28.33 | 0.10 | 347,528 | 27.65 | 0.11 | ||||||||||||||||||||
Certificates of deposit | 225,990 | 18.84 | 0.54 | 252,629 | 20.51 | 0.56 | 288,351 | 22.94 | 0.67 | ||||||||||||||||||||
$ | 1,199,740 | 100.00 | % | $ | 1,231,970 | 100.00 | % | $ | 1,256,901 | 100.00 | % | ||||||||||||||||||
The following table sets forth certificates of deposit by time remaining until maturity at December 31, 2015:
Maturity | |||||||||||||||||||
3 Months or Less | Over 3 to 6 Months | Over 6 to 12 Months | Over 12 Months | Total | |||||||||||||||
(Dollars in thousands) | |||||||||||||||||||
Certificates of deposit less than $100,000 | $ | 33,472 | $ | 28,463 | $ | 45,325 | $ | 41,470 | $ | 148,730 | |||||||||
Certificates of deposit of $100,000 or more | 11,409 | 10,155 | 22,721 | 29,686 | 73,971 | ||||||||||||||
Total certificates of deposit | $ | 44,881 | $ | 38,618 | $ | 68,046 | $ | 71,156 | $ | 222,701 | |||||||||
Borrowings. Our borrowings consist primarily of Federal Home Loan Bank advances and repurchase agreements. The following table sets forth information concerning balances and interest rates on our borrowings.
At or For the Years Ended December 31, | |||||||||
2015 | 2014 | 2013 | |||||||
(Dollars in thousands) | |||||||||
Balance at end of year | 64,318 | 12,921 | $ | 3,055 | |||||
Average balance during year | 8,674 | 2,980 | 2,964 | ||||||
Maximum outstanding at any month end | 64,318 | 12,921 | 3,398 | ||||||
Weighted average interest rate at end of year | 0.28 | % | 0.16 | % | 0.25 | % | |||
Average interest rate during year | 0.23 | % | 0.27 | % | 0.47 | % | |||
41
At December 31, 2015, we had the capacity to borrow an additional $307.8 million under our credit facilities with the FHLBC. Furthermore, we had unpledged securities that could be used to support in excess of $20.9 million of additional FHLBC borrowings.
At December 31, 2015, we had a line of credit with the Federal Reserve Bank of Chicago. At December 31, 2015, there were no outstanding federal funds borrowings and there was no outstanding balance on the line of credit.
Impact of Inflation and Changing Prices
The Company’s consolidated financial statements and the related notes have been prepared in conformity with accounting principles generally accepted in the United States of America (“GAAP”). GAAP generally requires the measurement of financial position and operating results in terms of historical dollars without considering changes in the relative purchasing power of money over time due to inflation. The impact of inflation, if any, is reflected in the increased cost of our operations. Unlike industrial companies, our assets and liabilities are primarily monetary in nature. As a result, changes in market interest rates have a greater impact on performance than the effects of inflation.
Management of Interest Rate Risk
Qualitative Analysis. A significant form of market risk is interest rate risk. Interest rate risk results from timing differences in the maturity or repricing of our assets, liabilities and off balance sheet contracts (i.e., forward loan commitments), the effect of loan prepayments and deposit withdrawals, the difference in the behavior of lending and funding rates arising from the use of different indices and “yield curve risk” arising from changing rate relationships across the spectrum of maturities for constant or variable credit risk investments. In addition to directly affecting net interest income, changes in market interest rates can also affect the amount of new loan originations, the ability of borrowers to repay variable rate loans, the volume of loan prepayments and refinancings, the carrying value of investment securities classified as available-for-sale and the flow and mix of deposits.
The general objective of our interest rate risk management is to determine the appropriate level of risk given our business strategy and then manage that risk in a manner that is consistent with our policy to reduce, to the extent possible, the exposure of our net interest income to changes in market interest rates. Our Asset/Liability Management Committee (“ALCO”), which consists of certain members of senior management, evaluates the interest rate risk inherent in certain assets and liabilities, our operating environment and capital and liquidity requirements, and modifies our lending, investing and deposit gathering strategies accordingly. The Board of Directors’ Asset/Liability Management Committee then reviews the ALCO’s activities and strategies, the effect of those strategies on our net interest margin, and the effect that changes in market interest rates would have on the economic value of our loan and securities portfolios as well as the intrinsic value of our deposits and borrowings, and reports to the full Board of Directors.
We actively evaluate interest rate risk in connection with our lending, investing and deposit activities. In an effort to better manage interest-rate risk, we have de-emphasized the origination of residential mortgage loans, and have increased our emphasis on the origination of nonresidential real estate loans, multi-family mortgage loans, commercial loans and commercial leases. In addition, depending on market interest rates and our capital and liquidity position, we generally sell all or a portion of our longer-term, fixed-rate residential loans, usually on a servicing-retained basis. Further, we primarily invest in shorter-duration securities, which generally have lower yields compared to longer-term investments. Shortening the average maturity of our interest-earning assets by increasing our investments in shorter-term loans and securities, as well as loans with variable rates of interest, helps to better match the maturities and interest rates of our assets and liabilities, thereby reducing the exposure of our net interest income to changes in market interest rates. Finally, we have classified all of our investment portfolio as available-for-sale so as to provide flexibility in liquidity management.
We utilize a combination of analyses to monitor the Bank’s exposure to changes in interest rates. The economic value of equity analysis is a model that estimates the change in net portfolio value (“NPV”) over a range of interest rate scenarios. NPV is the discounted present value of expected cash flows from assets, liabilities and off-balance sheet contracts. In calculating changes in NPV, we assume estimated loan prepayment rates, reinvestment rates and deposit decay rates that seem most likely based on historical experience during prior interest rate changes.
Our net interest income analysis utilizes the data derived from the dynamic GAP analysis, described below, and applies several additional elements, including actual interest rate indices and margins, contractual limitations such as interest rate floors and caps and the U.S. Treasury yield curve as of the balance sheet date. In addition, we apply consistent parallel yield curve shifts (in both directions) to determine possible changes in net interest income if the theoretical yield curve shifts occurred instantaneously. Net interest income analysis also adjusts the dynamic GAP repricing analysis based on changes in prepayment rates resulting from the parallel yield curve shifts.
42
Our dynamic GAP analysis determines the relative balance between the repricing of assets and liabilities over multiple periods of time (ranging from overnight to five years). Dynamic GAP analysis includes expected cash flows from loans and mortgage-backed securities, applying prepayment rates based on the differential between the current interest rate and the market interest rate for each loan and security type. This analysis identifies mismatches in the timing of asset and liability repricing but does not necessarily provide an accurate indicator of interest rate risk because it omits the factors incorporated into the net interest income analysis.
Quantitative Analysis. The following table sets forth, as of December 31, 2015, the estimated changes in the Bank’s NPV and net interest income that would result from the designated instantaneous parallel shift in the U.S. Treasury yield curve. Computations of prospective effects of hypothetical interest rate changes are based on numerous assumptions including relative levels of market interest rates, loan prepayments and deposit decay, and should not be relied upon as indicative of actual results.
Estimated Increase (Decrease) in NPV | Increase (Decrease) in Estimated Net Interest Income | ||||||||||||
Change in Interest Rates (basis points) | Amount | Percent | Amount | Percent | |||||||||
(Dollars in thousands) | |||||||||||||
+400 | $ | (33,647 | ) | (13.79 | )% | $ | 113 | 0.24 | % | ||||
+300 | (21,734 | ) | (8.91 | ) | 120 | 0.25 | |||||||
+200 | (11,598 | ) | (4.75 | ) | 207 | 0.43 | |||||||
+100 | 2,876 | 1.18 | 207 | 0.43 | |||||||||
0 | — | — | — | — | |||||||||
-25 | (491 | ) | (0.20 | ) | (301 | ) | (0.63 | ) | |||||
The table set forth above indicates that at December 31, 2015, in the event of an immediate 25 basis point decrease in interest rates, the Bank would be expected to experience a 0.20% decrease in NPV and a $301,000 decrease in net interest income. In the event of an immediate 200 basis point increase in interest rates, the Bank would be expected to experience a 4.75% decrease in NPV and a $207,000 increase in net interest income. This data does not reflect any actions that we may undertake in response to changes in interest rates, such as changes in rates paid on certain deposit accounts based on local competitive factors, which could reduce the actual impact on NPV and net interest income, if any.
Certain shortcomings are inherent in the methodology used in the above interest rate risk measurements. Modeling changes in NPV and net interest income requires that we make certain assumptions that may or may not reflect the manner in which actual yields and costs respond to changes in market interest rates. The NPV and net interest income table presented above assumes that the composition of our interest-rate-sensitive assets and liabilities existing at the beginning of a period remains constant over the period being measured and, accordingly, the data does not reflect any actions that we may undertake in response to changes in interest rates, such as changes in rates paid on certain deposit accounts based on local competitive factors. The table also assumes that a particular change in interest rates is reflected uniformly across the yield curve regardless of the duration to maturity or the repricing characteristics of specific assets and liabilities. Accordingly, although the NPV and net interest income table provides an indication of our sensitivity to interest rate changes at a particular point in time, such measurements are not intended to and do not provide a precise forecast of the effect of changes in market interest rates on our net interest income and will differ from actual results.
Liquidity Management
Liquidity Management – Bank. The overall objective of our liquidity management is to ensure the availability of sufficient cash funds to meet all financial commitments and to take advantage of investment opportunities. We manage liquidity in order to meet deposit withdrawals on demand or at contractual maturity, to repay borrowings as they mature, and to fund new loans and investments as opportunities arise.
Our primary sources of funds are deposits, principal and interest payments on loans and securities, and, to a lesser extent, wholesale borrowings, the proceeds from maturing securities and short-term investments, and the proceeds from the sales of loans and securities. The scheduled amortization of loans and securities, as well as proceeds from borrowings, are predictable sources of funds. Other funding sources, however, such as deposit inflows, mortgage prepayments and mortgage loan sales are greatly influenced by market interest rates, economic conditions and competition.
Our cash flows are derived from operating activities, investing activities and financing activities as reported in the Consolidated Statements of Cash Flows in our Consolidated Financial Statements. Our primary investing activities are the origination for
43
investment of one-to-four family residential mortgage loans, multi-family mortgage loans, nonresidential real estate loans, commercial leases, construction and land loans, and commercial loans and the purchase of investment securities and mortgage-backed securities. During the years ended December 31, 2015, 2014 and 2013, our loans originated for investment totaled $509.0 million, $513.4 million, and $524.6 million, respectively. Purchases of securities totaled $60.7 million, $73.1 million and $74.2 million for the years ended December 31, 2015, 2014, and 2013, respectively.
These activities were funded primarily by principal repayments on loans and securities, and the sale of loans and securities. During the years ended December 31, 2015, 2014 and 2013, principal repayments on loans totaled $441.8 million, $432.6 million, and $453.2 million, respectively. During the years ended December 31, 2015, 2014 and 2013, principal repayments on securities totaled $7.0 million, $7.2 million, and $13.5 million, respectively. During the years ended December 31, 2015, 2014 and 2013, proceeds from maturities and sales of securities totaled $59.8 million, $55.8 million, and $26.8 million, respectively. During the years ended December 31, 2015, 2014 and 2013, the proceeds from the sale of loans held-for-sale totaled $3.9 million, $5.5 million and $11.7 million, respectively.
Loan origination commitments totaled $52.3 million at December 31, 2015, and consisted of $29.4 million of fixed-rate loans and $22.9 million of adjustable-rate loans. Unused lines of credit and standby letters of credit granted to customers totaled $126.3 million and $1.1 million, respectively, at December 31, 2015. At December 31, 2015, commitments to sell mortgages totaled $64,000.
Deposit flows are generally affected by the level of market interest rates, the interest rates and other terms and conditions on deposit products offered by our banking competitors, and other factors. We had a net deposit increase of $1.2 million, for the year ended December 31, 2015, compared to net deposit decreases of $41.0 million and $29.6 million for the years ended December 31, 2014 and 2013, respectively. At times during recent periods, we have not actively competed for higher cost deposit accounts, including certificates of deposit, choosing instead to fund loan growth from the loan and lease repayments. Certificates of deposit that are scheduled to mature in one year or less from December 31, 2015 totaled $151.5 million. Based upon prior experience and our current pricing strategy, we believe that we will retain a significant portion of these deposits upon their maturities.
We anticipate that we will have sufficient funds available to meet current loan commitments and lines of credit and maturing certificates of deposit that are not renewed or extended. We generally remain fully invested and may utilize additional sources of funds through FHLBC advances, of which $62.0 million were outstanding at December 31, 2015. At December 31, 2015 we had the ability to borrow an additional $307.8 million under our credit facilities with the FHLBC. Furthermore, we have unpledged securities that could be used to support borrowings in excess of $20.9 million. Finally, at December 31, 2015, we had a line of credit available with the Federal Reserve Bank of Chicago. At December 31, 2015, there was no outstanding balance on this credit line.
Liquidity Management - Company. The liquidity needs of the Company on an unconsolidated basis consist primarily of operating expenses, dividends to stockholders and stock repurchases. The primary sources of liquidity for the Company currently are $15.3 million of cash and cash equivalents and any cash dividends it may receive from the Bank.
During 2015, we paid $10.0 million to repurchase shares of our common stock and paid $4.1 million in cash dividends to stockholders, using the dividends received from the Bank.
As of December 31, 2015, we were not aware of any known trends, events or uncertainties that had or were reasonably likely to have a material impact on our liquidity. As of December 31, 2015, we had no other material commitments for capital expenditures.
Capital Management
Capital Management - Bank. The overall objectives of our capital management are to ensure the availability of sufficient capital to support loan, deposit and other asset and liability growth opportunities and to maintain capital to absorb unforeseen losses or write-downs that are inherent in the business risks associated with the banking industry. We seek to balance the need for higher capital levels to address such unforeseen risks and the goal to achieve an adequate return on the capital invested by our stockholders.
The Bank is subject to regulatory capital requirements administered by the federal banking agencies. Failure to meet minimum capital requirements can trigger certain mandatory, and possibly additional discretionary, actions by the OCC that, if undertaken, could have a direct material effect on the Bank’s financial statements. Under capital adequacy guidelines and the regulatory framework for prompt corrective action, the Bank must meet specific capital guidelines that involve quantitative measures of the Bank’s assets, liabilities, and certain off-balance-sheet items as calculated under regulatory accounting practices. The Bank’s capital amounts and classification are also subject to qualitative judgments by regulators about components, risk weightings, and other factors.
44
The prompt corrective action regulations provide five classifications, including well capitalized, adequately capitalized, undercapitalized, significantly undercapitalized, and critically undercapitalized, although these terms are not used to represent overall financial condition. Adequately capitalized institutions require regulatory approval to accept brokered deposits. If undercapitalized, a financial institution’s capital distributions, asset growth and expansion are limited, and for the submission of a capital restoration is required.
The Company and the Bank have each adopted Regulatory Capital Plans that require the Bank to maintain a Tier 1 leverage ratio of at least 8% and a total risk-based capital ratio of at least 12%. The minimum capital ratios set forth in the Regulatory Capital Plans will be increased and other minimum capital requirements will be established if and as necessary. In accordance with the Regulatory Capital Plans, neither the Company nor the Bank will pursue any acquisition or growth opportunity, declare any dividend or conduct any stock repurchase that would cause the Bank's total risk-based capital ratio and/or its Tier 1 leverage ratio to fall below the established minimum capital levels. In addition, the Company will continue to maintain its ability to serve as a source of financial strength to the Bank by holding at least $5.0 million of cash or liquid assets for that purpose.
At December 31, 2015, actual and required capital ratios were:
Consolidated Actual Ratio | BankFinancial F.S.B. Actual Ratio | Required for Capital Adequacy Purposes | To be Well-Capitalized under Prompt Corrective Action Provisions | ||||||||
Total capital (to risk-weighted assets) | 17.89 | % | 15.41 | % | 8.00 | % | 10.00 | % | |||
Tier 1 (core) capital (to risk-weighted assets) | 17.01 | 14.54 | 6.00 | 8.00 | |||||||
Common Tier 1 (CET1) | 17.01 | 14.54 | 4.50 | 6.50 | |||||||
Tier 1 (core) capital (to adjusted total assets) | 13.26 | 11.33 | 4.00 | 5.00 | |||||||
As of December 31, 2015 the Bank was well capitalized under the regulatory framework for prompt corrective action. There are no conditions or events that management believes have changed the Bank’s prompt corrective action capitalization category.
Capital Management - Company. On June 23, 2005, the Company completed its mutual-to-stock conversion and sold 24,466,250 shares of common stock in a subscription offering at $10.00 per share and raised $240.3 million in offering proceeds, net of offering expenses. The Company contributed $120.9 million of the net proceeds to the Bank, paid off $30 million of term borrowings, loaned $19.6 million to our ESOP and retained the remaining net proceeds of $72 million. Subsequent to the mutual-to-stock conversion, the Bank declared aggregate dividends of $60.0 million to the Company. During this period the Company paid dividends totaling $36.8 million and expended $64.6 million for share repurchases.
Total stockholders’ equity was $212.4 million at December 31, 2015, compared to $216.1 million at December 31, 2014. The decrease in total stockholders’ equity was primarily due to the combined impact of our repurchase of 804,649 shares of our common stock at a total cost of $10.0 million, and our declaration and payment of cash dividends totaling $4.1 million during the year ended December 31, 2015. These items were partially offset by net income of $8.7 million that we recorded for the year ended December 31, 2015. The unallocated shares of common stock that our ESOP owns were reflected as a $9.3 million reduction to stockholders’ equity at December 31, 2015, compared to a $10.3 million reduction to stockholders’ equity at December 31, 2014.
Cash Dividends. Our Board of Directors declared four quarterly cash dividends of $0.04 per share and one special dividend of $0.04 per share during 2015, totaling $4.1 million.
Stock Repurchase Program. On March 30, 2015, the Company announced that its Board had authorized the repurchase of up to 1,055,098 shares of the Company’s common stock, which represents approximately 5% of the Company’s issued and outstanding shares of common stock. On December 28, 2015, the Board extended this repurchase authorization from December 31, 2015 to December 31, 2016, and increased the number of shares that can be repurchased in accordance with the authorization by 1,046,868. As of December 31, 2015, the Company had repurchased 804,649 shares of its common stock out of the 2,101,966 shares of common stock authorized under this repurchase authorization. Since its inception, the Company has repurchased 5,043,783 shares of its common stock.
Off-Balance Sheet Arrangements and Aggregate Contractual Obligations
Commitments. As a financial services provider, we routinely are a party to various financial instruments with off-balance sheet risks, such as commitments to extend credit, standby letters of credit, unused lines of credit and commitments to sell loans. While
45
these contractual obligations represent our future cash requirements, a significant portion of commitments to extend credit may expire without being drawn upon. Such commitments are subject to the same credit policies and approval process afforded to loans that we make. Although we consider commitments to extend credit in determining our allowance for loan losses, at December 31, 2015, we had made no provision for losses on commitments to extend credit, and had no specific or general allowance for losses on such commitments, as we have had no historical loss experience with commitments to extend credit and we believed that no probable and reasonably estimable losses were inherent in our portfolio as a result of our commitments to extend credit. For additional information, see Note 16 of the "Notes to Consolidated Financial Statements" in Item 8 of this Form 10-K.
Contractual Obligations. In the ordinary course of our operations, we enter into certain contractual obligations. Such obligations include operating leases for premises and equipment.
The following table summarizes our significant fixed and determinable contractual obligations and other funding needs by payment date at December 31, 2015. The payment amounts represent those amounts due to the recipient and do not include any unamortized premiums or discounts or other similar carrying amount adjustments.
Payments Due by Period | |||||||||||||||||||
Less than One Year | One to Three Years | Three to Five Years | More than Five Years | Total | |||||||||||||||
(Dollars in thousands) | |||||||||||||||||||
Contractual Obligations | |||||||||||||||||||
Certificates of deposit | $ | 151,545 | $ | 60,231 | $ | 10,925 | $ | — | $ | 222,701 | |||||||||
Borrowings | 62,000 | — | — | — | 62,000 | ||||||||||||||
Standby letters of credit | 1,070 | 5 | — | — | 1,075 | ||||||||||||||
Operating leases | 448 | 948 | 930 | 4,708 | 7,034 | ||||||||||||||
Total | $ | 215,063 | $ | 61,184 | $ | 11,855 | $ | 4,708 | $ | 292,810 | |||||||||
Commitments to extend credit | $ | 178,655 | $ | — | $ | — | $ | — | $ | 178,655 | |||||||||
Critical Accounting Policies
Critical accounting policies are defined as those that are reflective of significant judgments and uncertainties, and could potentially result in materially different results under different assumptions and conditions. We believe that the most critical accounting policies upon which our financial condition and results of operation depend, and which involve the most complex subjective decisions or assessments, are as follows:
Allowance for Loan Losses. Arriving at an appropriate level of allowance for loan losses involves a high degree of judgment. Our allowance for loan losses provides for probable incurred losses based upon evaluations of known and inherent risks in the loan portfolio. We review the level of the allowance on a quarterly basis and establish the provision for loan losses based upon historical loan loss experience, the nature and volume of the loan portfolio, information about specific borrower situations, estimated collateral values, economic conditions and other factors to assess the adequacy of the allowance for loan losses. Among the material estimates that we must make to establish the allowance are loss exposure at default; the amount and timing of future cash flows on affected loans; the value of collateral; and a determination of loss factors to be applied to the various elements of the loan portfolio. All of these estimates are susceptible to significant change. Although we believe that we use the best information available to us to establish the allowance for loan losses, future adjustments to the allowance may be necessary if borrower financial, collateral valuation or economic conditions differ substantially from the information and assumptions used in making the evaluation. In addition, as an integral part of their supervisory and/or examination process, our regulatory agencies periodically review the methodology and sufficiency of the allowance for loan losses. These agencies may require us to recognize additions to the allowance based on their inclusion, exclusion or modification of risk factors or differences in judgments of information available to them at the time of their examination. A large loss could deplete the allowance and require increased provisions to replenish the allowance, which would negatively affect earnings.
Income Taxes. We consider accounting for income taxes a critical accounting policy due to the subjective nature of certain estimates that are involved in the calculation. We use the asset/liability method of accounting for income taxes in which deferred tax assets and liabilities are established for the temporary differences between the financial reporting basis and the tax basis of our assets and liabilities. Under GAAP, a deferred tax asset valuation allowance is required to be recognized if it is “more likely than not”
46
that the deferred tax asset will not be realized. The determination of the realizability of the deferred tax assets is dependent upon judgments made following management’s evaluation of all available positive and negative evidence, including prior pre-tax losses and the events or conditions that caused them, forecasts of future taxable income, and current and future economic and business conditions. In assessing the realization of deferred tax assets at December 31, 2011, the Company concluded that it was more likely than not that the Company will not realize the benefits of these deductible differences at December 31, 2011, and therefore, a full valuation allowance for deferred tax assets in the amount of $22.6 million was recorded for the ending December 31, 2011. The Company reversed its DTA valuation allowance as of December 31, 2014 due to management’s determination that it was more likely than not that the Company’s DTA would be realized. The determination resulted from management’s consideration of all available negative and positive evidence.
Although we determined a valuation allowance was not required for any deferred tax assets at December 31, 2015 and 2014, there is no guarantee that a valuation allowance will not be required in the future.
ITEM 7A.QUANTITATIVE AND QUALITATIVE DISCLOSURE ABOUT MARKET RISK
For information regarding market risk see Item 7 - “Management’s Discussion and Analysis of Financial Condition and Results of Operations - Management of Interest Rate Risk.”
47
ITEM 8.FINANCIAL STATEMENTS AND SUPPLEMENTARY DATA
REPORT OF MANAGEMENT ON INTERNAL CONTROL OVER FINANCIAL REPORTING
Management of BankFinancial Corporation is responsible for establishing and maintaining effective internal control over financial reporting.
Management evaluates the effectiveness of internal control over financial reporting and tests for reliability of recorded financial information through a program of ongoing internal audits. Any system of internal control, no matter how well designed, has inherent limitations, including the possibility that a control can be circumvented or overridden and misstatements due to error or fraud may occur and not be detected. Also, because of changes in conditions, internal control effectiveness may vary over time. Accordingly, even an effective system of internal control will provide only reasonable assurance with respect to financial statement preparation.
The Company’s internal control over financial reporting is a process designed to provide reasonable assurance regarding the reliability of financial reporting and the preparation of financial statements for external purposes in accordance with accounting principles generally accepted in the United States of America. The Company’s internal control over financial reporting includes those policies and procedures that (i) pertain to the maintenance of records that, in reasonable detail, accurately and fairly reflect the transactions and dispositions of the assets of the Company; (ii) provide reasonable assurance that transactions are recorded as necessary to permit preparation of financial statements in accordance with accounting principles generally accepted in the United States of America, and that receipts and expenditures of the Company are being made only in accordance with authorizations of management and directors of the Company; and (iii) provide reasonable assurance regarding prevention or timely detection of unauthorized acquisition, use, or disposition of the Company’s assets that could have a material effect on the financial statements.
Management assessed the Company’s internal control over financial reporting as of December 31, 2015, as required by Section 404 of the Sarbanes-Oxley Act of 2002, based on the criteria for effective internal control over financial reporting described in the “2013 Internal Control-Integrated Framework issued by the Committee of Sponsoring Organizations of the Treadway Commission. Based on this assessment, management concludes that, as of December 31, 2015, the Company’s internal control over financial reporting is effective.
The Company’s independent registered public accounting firm has issued their report on the effectiveness of the Company’s internal control over financial reporting. That report follows under the heading, Report of Independent Registered Public Accounting Firm.
/s/ F. Morgan Gasior | /s/ Paul A. Cloutier | |
F. Morgan Gasior | Paul A. Cloutier | |
Chairman of the Board, Chief Executive Officer and President | Executive Vice President and Chief Financial Officer | |
48
REPORT OF INDEPENDENT REGISTERED PUBLIC ACCOUNTING FIRM
We have audited the accompanying consolidated statements of financial condition of BankFinancial Corporation (the “Company”) as of December 31, 2015 and 2014, and the related consolidated statements of operations, comprehensive income, changes in stockholders’ equity and cash flows for each of the years in the three-year period ended December 31, 2015. We also have audited the Company’s internal control over financial reporting as of December 31, 2015, based on criteria established in the 2013 Internal Control—Integrated Framework issued by the Committee of Sponsoring Organizations of the Treadway Commission (COSO). The Company’s management is responsible for these financial statements, for maintaining effective internal control over financial reporting, and for its assessment of the effectiveness of internal control over financial reporting, included in the accompanying Report of Management on Internal Control Over Financial Reporting. Our responsibility is to express an opinion on these financial statements and an opinion on the Company’s internal control over financial reporting based on our audits.
We conducted our audits in accordance with the standards of the Public Company Accounting Oversight Board (United States). Those standards require that we plan and perform the audits to obtain reasonable assurance about whether the financial statements are free of material misstatement and whether effective internal control over financial reporting was maintained in all material respects. Our audits of the financial statements included examining, on a test basis, evidence supporting the amounts and disclosures in the financial statements, assessing the accounting principles used and significant estimates made by management, and evaluating the overall financial statement presentation. Our audit of internal control over financial reporting included obtaining an understanding of internal control over financial reporting, assessing the risk that a material weakness exists, and testing and evaluating the design, and operating effectiveness of internal control based on the assessed risk. Our audits also included performing such other procedures as we considered necessary in the circumstances. We believe that our audits provide a reasonable basis for our opinions.
A company’s internal control over financial reporting is a process designed to provide reasonable assurance regarding the reliability of financial reporting and the preparation of financial statements for external purposes in accordance with generally accepted accounting principles. A company’s internal control over financial reporting includes those policies and procedures that (1) pertain to the maintenance of records that, in reasonable detail, accurately and fairly reflect the transactions and dispositions of the assets of the company; (2) provide reasonable assurance that transactions are recorded as necessary to permit preparation of financial statements in accordance with generally accepted accounting principles, and that receipts and expenditures of the company are being made only in accordance with authorizations of management and directors of the company; and (3) provide reasonable assurance regarding prevention or timely detection of unauthorized acquisition, use, or disposition of the company’s assets that could have a material effect on the financial statements.
Because of its inherent limitations, internal control over financial reporting may not prevent or detect misstatements. Also, projections of any evaluation of effectiveness to future periods are subject to the risk that controls may become inadequate because of changes in conditions, or that the degree of compliance with the policies or procedures may deteriorate.
In our opinion, the consolidated financial statements referred to above present fairly, in all material respects, the financial position of BankFinancial Corporation as of December 31, 2015 and 2014, and the results of its operations and its cash flows for each of the years in the three-year period ended December 31, 2015 in conformity with accounting principles generally accepted in the United States of America. Also in our opinion, the Company maintained, in all material respects, effective internal control over financial reporting as of December 31, 2015, based on criteria established in the 2013 Internal Control—Integrated Framework issued by the Committee of Sponsoring Organizations of the Treadway Commission.
/s/ Crowe Horwath LLP
Oak Brook, Illinois
February 10, 2016
49
BANKFINANCIAL CORPORATION
CONSOLIDATED STATEMENTS OF FINANCIAL CONDITION
(In thousands, except share and per share data)
December 31, | |||||||
2015 | 2014 | ||||||
Assets | |||||||
Cash and due from other financial institutions | $ | 13,192 | $ | 9,693 | |||
Interest-bearing deposits in other financial institutions | 46,185 | 49,888 | |||||
Cash and cash equivalents | 59,377 | 59,581 | |||||
Securities, at fair value | 114,753 | 121,174 | |||||
Loans receivable, net of allowance for loan losses: December 31, 2015, $9,691 and December 31, 2014, $11,990 | 1,232,257 | 1,172,356 | |||||
Other real estate owned, net | 7,011 | 6,358 | |||||
Stock in Federal Home Loan Bank, at cost | 6,257 | 6,257 | |||||
Premises and equipment, net | 32,726 | 34,286 | |||||
Accrued interest receivable | 4,226 | 3,926 | |||||
Core deposit intangible | 1,305 | 1,855 | |||||
Bank owned life insurance | 22,387 | 22,193 | |||||
Deferred taxes | 26,695 | 31,643 | |||||
Other assets | 5,449 | 5,781 | |||||
Total assets | $ | 1,512,443 | $ | 1,465,410 | |||
Liabilities | |||||||
Deposits | |||||||
Noninterest-bearing | $ | 254,830 | $ | 134,129 | |||
Interest-bearing | 958,089 | 1,077,584 | |||||
Total deposits | 1,212,919 | 1,211,713 | |||||
Borrowings | 64,318 | 12,921 | |||||
Advance payments by borrowers for taxes and insurance | 11,528 | 11,489 | |||||
Accrued interest payable and other liabilities | 11,314 | 13,166 | |||||
Total liabilities | 1,300,079 | 1,249,289 | |||||
Commitments and contingent liabilities | |||||||
Stockholders’ equity | |||||||
Preferred Stock, $0.01 par value, 25,000,000 shares authorized, none issued or outstanding | — | — | |||||
Common Stock, $0.01 par value, 100,000,000 shares authorized; 20,297,317 shares issued at December 31, 2015 and 21,101,966 shares issued at December 31, 2014 | 203 | 211 | |||||
Additional paid-in capital | 184,797 | 193,845 | |||||
Retained earnings | 36,114 | 31,584 | |||||
Unearned Employee Stock Ownership Plan shares | (9,297 | ) | (10,276 | ) | |||
Accumulated other comprehensive income | 547 | 757 | |||||
Total stockholders’ equity | 212,364 | 216,121 | |||||
Total liabilities and stockholders’ equity | $ | 1,512,443 | $ | 1,465,410 | |||
See accompanying notes to the consolidated financial statements
50
BANKFINANCIAL CORPORATION
CONSOLIDATED STATEMENTS OF OPERATIONS
(In thousands, except share and per share data)
For the years ended December 31, | |||||||||||
2015 | 2014 | 2013 | |||||||||
Interest and dividend income | |||||||||||
Loans, including fees | $ | 47,488 | $ | 47,802 | $ | 47,691 | |||||
Securities | 1,141 | 1,154 | 981 | ||||||||
Other | 333 | 393 | 720 | ||||||||
Total interest income | 48,962 | 49,349 | 49,392 | ||||||||
Interest expense | |||||||||||
Deposits | 2,794 | 3,038 | 3,639 | ||||||||
Borrowings | 20 | 8 | 14 | ||||||||
Total interest expense | 2,814 | 3,046 | 3,653 | ||||||||
Net interest income | 46,148 | 46,303 | 45,739 | ||||||||
Provision for (recovery of) loan losses | (3,206 | ) | (736 | ) | (687 | ) | |||||
Net interest income after provision for (recovery of) loan losses | 49,354 | 47,039 | 46,426 | ||||||||
Noninterest income | |||||||||||
Deposit service charges and fees | 2,248 | 1,977 | 2,005 | ||||||||
Other fee income | 2,143 | 2,238 | 2,250 | ||||||||
Insurance commissions and annuities income | 386 | 431 | 474 | ||||||||
Gain on sale of loans, net | 102 | 158 | 1,469 | ||||||||
Loss on sale of securities (includes $7 accumulated other comprehensive income reclassifications for unrealized net losses on available for sale securities for the year ended December 31, 2014) | — | (7 | ) | — | |||||||
Gain (loss) on disposition of premises and equipment, net | (1 | ) | 5 | (43 | ) | ||||||
Loan servicing fees | 354 | 418 | 461 | ||||||||
Amortization and impairment of servicing assets | (140 | ) | (143 | ) | (168 | ) | |||||
Earnings on bank owned life insurance | 194 | 235 | 313 | ||||||||
Trust | 712 | 683 | 711 | ||||||||
Other | 693 | 714 | 662 | ||||||||
Total noninterest income | 6,691 | 6,709 | 8,134 | ||||||||
Noninterest expense | |||||||||||
Compensation and benefits | 22,222 | 22,874 | 26,195 | ||||||||
Office occupancy and equipment | 6,522 | 6,878 | 7,547 | ||||||||
Advertising and public relations | 991 | 1,107 | 925 | ||||||||
Information technology | 2,669 | 2,676 | 3,091 | ||||||||
Supplies, telephone, and postage | 1,586 | 1,579 | 1,697 | ||||||||
Amortization of intangibles | 550 | 578 | 605 | ||||||||
Nonperforming asset management | 681 | 838 | 2,638 | ||||||||
Operations of other real estate owned | 1,063 | 1,408 | 1,613 | ||||||||
FDIC insurance premiums | 904 | 1,416 | 1,913 | ||||||||
Other | 4,757 | 5,097 | 5,038 | ||||||||
Total noninterest expense | 41,945 | 44,451 | 51,262 | ||||||||
Income before income taxes | 14,100 | 9,297 | 3,298 | ||||||||
Income tax expense (benefit) | 5,425 | (31,317 | ) | — | |||||||
Net income | $ | 8,675 | $ | 40,614 | $ | 3,298 | |||||
Basic earnings per common share | $ | 0.44 | $ | 2.01 | $ | 0.16 | |||||
Diluted earnings per common share | $ | 0.44 | $ | 2.01 | $ | 0.16 | |||||
Weighted average common shares outstanding | 19,918,003 | 20,177,271 | 20,020,838 | ||||||||
Diluted weighted average common shares outstanding | 19,921,519 | 20,186,376 | 20,025,321 | ||||||||
See accompanying notes to the consolidated financial statements
51
BANKFINANCIAL CORPORATION
CONSOLIDATED STATEMENTS OF COMPREHENSIVE INCOME
(In thousands)
For the years ended December 31, | |||||||||||
2015 | 2014 | 2013 | |||||||||
Net income | $ | 8,675 | $ | 40,614 | $ | 3,298 | |||||
Unrealized holding gain (loss) on securities arising during the period | (339 | ) | 118 | (699 | ) | ||||||
Tax effect | 129 | 213 | — | ||||||||
Unrecognized holding gain (loss) on securities arising during the period, net of tax | (210 | ) | 331 | (699 | ) | ||||||
Reclassification adjustment for losses included in net income | — | 7 | — | ||||||||
Other comprehensive income (loss) | (210 | ) | 338 | (699 | ) | ||||||
Comprehensive income | $ | 8,465 | $ | 40,952 | $ | 2,599 | |||||
See accompanying notes to the consolidated financial statements
52
BANKFINANCIAL CORPORATION
CONSOLIDATED STATEMENTS OF CHANGES IN STOCKHOLDERS’ EQUITY
(In thousands, except shares and per share data)
Common Stock | Additional Paid-in Capital | Retained Earnings (Deficit) | Unearned Employee Stock Ownership Plan Shares | Accumulated Other Comprehen-sive Income (Loss) | Total | ||||||||||||||||||
Balance at January 1, 2013 | $ | 211 | $ | 193,590 | $ | (9,796 | ) | $ | (12,233 | ) | $ | 1,118 | $ | 172,890 | |||||||||
Net income | — | — | 3,298 | — | — | 3,298 | |||||||||||||||||
Other comprehensive loss, net of tax effect | — | — | — | — | (699 | ) | (699 | ) | |||||||||||||||
Nonvested stock awards-stock-based compensation expense | — | 86 | — | — | — | 86 | |||||||||||||||||
Cash dividends declared on common stock ($0.04 per share) | — | — | (844 | ) | — | — | (844 | ) | |||||||||||||||
ESOP shares earned | — | (82 | ) | — | 978 | — | 896 | ||||||||||||||||
Balance at December 31, 2013 | 211 | 193,594 | (7,342 | ) | (11,255 | ) | 419 | 175,627 | |||||||||||||||
Net income | — | — | 40,614 | — | — | 40,614 | |||||||||||||||||
Other comprehensive income, net of tax effect | — | — | — | — | 338 | 338 | |||||||||||||||||
Nonvested stock awards-stock-based compensation expense | — | 70 | — | — | — | 70 | |||||||||||||||||
Cash dividends declared on common stock ($0.08 per share) | — | — | (1,688 | ) | — | — | (1,688 | ) | |||||||||||||||
ESOP shares earned | — | 181 | — | 979 | — | 1,160 | |||||||||||||||||
Balance at December 31, 2014 | 211 | 193,845 | 31,584 | (10,276 | ) | 757 | 216,121 | ||||||||||||||||
Net income | — | — | 8,675 | — | — | 8,675 | |||||||||||||||||
Other comprehensive loss, net of tax effect | — | — | — | — | (210 | ) | (210 | ) | |||||||||||||||
Repurchase and retirement of common stock (804,649 shares) | (8 | ) | (9,962 | ) | — | — | — | (9,970 | ) | ||||||||||||||
Nonvested stock awards-stock-based compensation expense | — | 657 | — | — | — | 657 | |||||||||||||||||
Cash dividends declared on common stock ($0.20 per share) | — | — | (4,145 | ) | — | — | (4,145 | ) | |||||||||||||||
ESOP shares earned | — | 257 | — | 979 | — | 1,236 | |||||||||||||||||
Balance at December 31, 2015 | $ | 203 | $ | 184,797 | $ | 36,114 | $ | (9,297 | ) | $ | 547 | $ | 212,364 | ||||||||||
See accompanying notes to the consolidated financial statements
53
For the years ended December 31, | |||||||||||
2015 | 2014 | 2013 | |||||||||
Cash flows from operating activities | |||||||||||
Net income | $ | 8,675 | $ | 40,614 | $ | 3,298 | |||||
Adjustments to reconcile to net income to net cash from operating activities | |||||||||||
Recovery of loan losses | (3,206 | ) | (736 | ) | (687 | ) | |||||
ESOP shares earned | 1,236 | 1,160 | 896 | ||||||||
Stock–based compensation expense | 657 | 70 | 86 | ||||||||
Depreciation and amortization | 3,682 | 3,811 | 4,453 | ||||||||
Amortization and accretion on securities and loans | (312 | ) | (438 | ) | (736 | ) | |||||
Amortization of core deposit and other intangible assets | 550 | 578 | 605 | ||||||||
Amortization and impairment of servicing assets | 140 | 143 | 168 | ||||||||
Net change in net deferred loan origination costs | (422 | ) | (229 | ) | (225 | ) | |||||
Net loss on sale of other real estate owned | (59 | ) | 35 | 148 | |||||||
Net gain on sale of loans | (102 | ) | (158 | ) | (1,469 | ) | |||||
Net loss on sale of securities | — | 7 | — | ||||||||
Net (gain) loss on disposition of premises and equipment | 1 | (5 | ) | 43 | |||||||
Loans originated for sale | (3,838 | ) | (5,323 | ) | (10,771 | ) | |||||
Proceeds from sale of loans | 3,940 | 5,481 | 11,670 | ||||||||
Other real estate owned valuation adjustments | 548 | 438 | 550 | ||||||||
Net change in: | |||||||||||
Deferred income tax | 5,079 | (31,643 | ) | — | |||||||
Accrued interest receivable | (300 | ) | 7 | 213 | |||||||
Earnings on bank owned life insurance | (194 | ) | (235 | ) | (313 | ) | |||||
Other assets | 659 | 2,874 | (243 | ) | |||||||
Accrued interest payable and other liabilities | (1,852 | ) | 1,394 | 2,093 | |||||||
Net cash from operating activities | 14,882 | 17,845 | 9,779 | ||||||||
Cash flows from investing activities | |||||||||||
Securities | |||||||||||
Proceeds from maturities | 59,804 | 52,103 | 26,813 | ||||||||
Proceeds from principal repayments | 6,984 | 7,179 | 13,492 | ||||||||
Proceeds from sales of securities | — | 3,663 | — | ||||||||
Purchases of securities | (60,744 | ) | (73,142 | ) | (74,220 | ) | |||||
Loans receivable | |||||||||||
Loan participations sold | 3,350 | — | — | ||||||||
Principal payments on loans receivable | 441,820 | 432,571 | 453,153 | ||||||||
Originated for investment | (509,018 | ) | (513,384 | ) | (524,592 | ) | |||||
Proceeds from sale of loans | — | — | 2,868 | ||||||||
Proceeds of redemption of Federal Home Loan Bank of Chicago stock | — | — | 2,344 | ||||||||
Purchase of Federal Home Loan Bank of Chicago stock | — | (189 | ) | — | |||||||
Proceeds from sale of other real estate owned | 4,733 | 4,914 | 8,838 | ||||||||
Purchase of premises and equipment, net | (542 | ) | (1,176 | ) | (10 | ) | |||||
Net cash used in investing activities | (53,613 | ) | (87,461 | ) | (91,314 | ) | |||||
(Continued)
54
For the years ended December 31, | |||||||||||
2015 | 2014 | 2013 | |||||||||
Cash flows from financing activities | |||||||||||
Net change in deposits | $ | 1,206 | $ | (40,995 | ) | $ | (29,643 | ) | |||
Net change in borrowings | 51,397 | 9,866 | (2,512 | ) | |||||||
Net change in advance payments by borrowers for taxes and insurance | 39 | 1,057 | (273 | ) | |||||||
Repurchase and retirement of common stock | (9,970 | ) | — | — | |||||||
Cash dividends paid on common stock | (4,145 | ) | (1,688 | ) | (844 | ) | |||||
Net cash from (used in) financing activities | 38,527 | (31,760 | ) | (33,272 | ) | ||||||
Net change in cash and cash equivalents | (204 | ) | (101,376 | ) | (114,807 | ) | |||||
Beginning cash and cash equivalents | 59,581 | 160,957 | 275,764 | ||||||||
Ending cash and cash equivalents | $ | 59,377 | $ | 59,581 | $ | 160,957 | |||||
Supplemental disclosures of cash flow information: | |||||||||||
Interest paid | $ | 2,844 | $ | 3,070 | $ | 3,697 | |||||
Income taxes paid | 363 | 114 | — | ||||||||
Income taxes refunded | 7 | — | 461 | ||||||||
Loans transferred to other real estate owned | 5,875 | 5,449 | 5,512 | ||||||||
See accompanying notes to the consolidated financial statements
55
BANKFINANCIAL CORPORATION
NOTES TO CONSOLIDATED FINANCIAL STATEMENTS
(Table amounts in thousands, except share and per share data)
NOTE 1 – SUMMARY OF SIGNIFICANT ACCOUNTING POLICIES
Basis of Presentation: BankFinancial Corporation, a Maryland corporation headquartered in Burr Ridge, Illinois (the “Company”), is the owner of all of the issued and outstanding capital stock of BankFinancial, F.S.B. (the “Bank”).
Principles of Consolidation: The consolidated financial statements include the accounts of and transactions of BankFinancial Corporation, the Bank, and the Bank’s wholly-owned subsidiaries, Financial Assurance Services, Inc. and BF Asset Recovery Corporation (collectively, “the Company”). All significant intercompany accounts and transactions have been eliminated.
Nature of Business: The Company’s revenues, operating income, and assets are primarily from the banking industry. Loan origination customers are mainly located in the greater Chicago metropolitan area. To supplement loan originations, the Company purchases mortgage loans. The loan portfolio is concentrated in loans that are primarily secured by real estate.
Use of Estimates: To prepare financial statements in conformity with accounting principles generally accepted in the United States of America (“GAAP”), management makes estimates and assumptions based on available information. These estimates and assumptions affect the amounts reported in the financial statements and the disclosures provided, and actual results could differ.
Interest-bearing Deposits in Other Financial Institutions: Interest-bearing deposits in other financial institutions maturing in less than 90 days are carried at cost.
Cash Flows: Cash and cash equivalents include cash, deposits with other financial institutions maturing in less than 90 days, and daily federal funds sold. Net cash flows are reported for customer loan and deposit transactions, interest bearing deposits in other financial institutions, borrowings, and advance payments by borrowers for taxes and insurance.
Securities: Debt securities are classified as available-for-sale when they might be sold before maturity. Equity securities with readily determinable fair values are classified as available-for-sale. Securities available-for-sale are carried at fair value, with unrealized holding gains and losses reported in other comprehensive income (loss), net of tax. Interest income includes amortization of purchase premium or discount. Premiums and discounts on securities are amortized on the level-yield method without anticipating prepayments, except for mortgage-backed securities where prepayments are anticipated. Gains and losses on sales are based on the amortized cost of the security sold. Declines in the fair value of securities below their cost that are other-than-temporary are reflected as realized losses. In determining if losses are other-than-temporary, management considers: (1) the length of time and extent that fair value has been less than cost or adjusted cost, as applicable, (2) the financial condition and near term prospects of the issuer, and (3) whether the Company has the intent to sell the debt security or it is more likely than not that the Company will be required to sell the debt security before the anticipated recovery.
Securities also include investments in certificates of deposit with maturities of greater than 90 days. These certificates of deposit are placed with insured institutions for varying maturities and amounts that are fully insured by the Federal Deposit Insurance Corporation (“FDIC”).
Federal Home Loan Bank Stock: The Bank is a member of the Federal Home Loan Bank system. Members are required to own a certain amount of stock based on the level of borrowings and other factors, and may invest in additional amounts. Federal Home Loan Bank of Chicago (“FHLBC”) stock is carried at cost and classified as a restricted security. Accounting guidance for FHLBC stock provides that, for impairment testing purposes, the value of long term investments such as our FHLBC common stock is based on the “ultimate recoverability” of the par value of the security without regard to temporary declines in value. Both cash and stock dividends are reported as income.
Loans Held–for–Sale: Mortgage loans originated and intended for sale in the secondary market are carried at the lower of aggregate cost or estimated fair market value, as determined by outstanding commitments from investors. Net unrealized losses, if any, are recorded as a valuation allowance and charged to earnings. Mortgage loans held–for–sale are generally sold with servicing rights retained. The carrying value of mortgage loans sold is reduced by the fair value of the servicing right. Gains and losses on sales of mortgage loans are based on the difference between the selling price and the carrying value of the related loan sold.
Held for investment loans that have been transferred to held-for-sale are carried at the lower of cost or fair value. For held-for-sale loans, any decreases in value below cost after transfer are recognized in mortgage banking revenue in the Consolidated Statements of Operations and increases in fair value above cost are not recognized until the loans are sold. The credit component of any write down upon transfer to held-for-sale is reflected in charge-offs to the allowance for loan losses.
Fair market value is determined based on quoted market rates and our judgment of relevant market conditions. Gains and losses on the disposition of loans held-for-sale are determined on the specific identification method. Transferred mortgage loans sold in the secondary market are sold without retaining servicing rights.
56
BANKFINANCIAL CORPORATION
NOTES TO CONSOLIDATED FINANCIAL STATEMENTS
(Table amounts in thousands, except share and per share data)
NOTE 1 - SUMMARY OF SIGNIFICANT ACCOUNTING POLICIES (continued)
Loans and Loan Income: Loans that management has the intent and ability to hold for the foreseeable future or until maturity or payoff are reported at the principal balance outstanding, net of the allowance for loan losses, premiums and discounts on loans purchased, and net deferred loan costs. Interest income on loans is recognized in income over the term of the loan based on the amount of principal outstanding.
Premiums and discounts associated with loans purchased are amortized over the contractual term of the loan using the level–yield method. Loan origination fees, net of certain direct origination costs, are deferred and recognized in interest income using the level‑yield method without anticipating prepayments.
Interest income is reported on the interest method. Interest income is discontinued at the time a loan is 90 days past due or when we do not expect to receive full payment of interest or principal. Past due status is based on the contractual terms of the loan.
All interest accrued but not received for loans that have been placed on nonaccrual status is reversed against interest income. Interest received on such loans is accounted for on the cash–basis or cost–recovery method until qualifying for return to accrual status. Once a loan is placed on non-accrual status, the borrower must generally demonstrate at least six months of payment performance before the loan is eligible to return to accrual status. Generally, the Company utilizes the “90 days delinquent, still accruing” category of loan classification when: (1) the loan is repaid in full shortly after the period end date; (2) the loan is well secured and there are no asserted or pending legal barriers to its collection; or (3) the borrower has remitted all scheduled payments and is otherwise in substantial compliance with the terms of the loan, but the processing of payments actually received or the renewal of a loan has not occurred for administrative reasons.
Impaired Loans: Impaired loans consist of nonaccrual loans and troubled debt restructurings (“TDRs”). A loan is considered impaired when, based on current information and events, management believes that it is probable that we will be unable to collect all amounts due (both principal and interest) according to the original contractual terms of the loan agreement. Once a loan is determined to be impaired, the amount of impairment is measured based on the loan's observable fair value, the fair value of the underlying collateral less selling costs if the loan is collateral-dependent, or the present value of expected future cash flows discounted at the loan's effective interest rate. If the measurement of the impaired loan is less than the recorded investment in the loan, the bank's allowance for the impaired collateral dependent loan under ASC 310-10-35 is based on fair value (less costs to sell), but the charge-off (the confirmed “loss”) is based on the higher appraised value. The remaining recorded investment in the loan after the charge-off will have a loan loss allowance for the amount by which the estimated fair value of the collateral (less costs to sell) is less than its appraised value.
Impaired loans with specific reserves are reviewed quarterly for any changes that would affect the specific reserve. Any impaired loan for which a determination has been made that the economic value is permanently reduced is charged-off against the allowance for loan losses to reflect its current economic value in the period in which the determination has been made.
At the time a collateral-dependent loan is initially determined to be impaired, we review the existing collateral appraisal. If the most recent appraisal is greater than a year old, a new appraisal is obtained on the underlying collateral. Appraisals are updated with a new independent appraisal at least annually and are formally reviewed by our internal appraisal department upon receipt of a new appraisal. All impaired loans and their related reserves are reviewed and updated each quarter. With an immaterial number of exceptions, all appraisals and internal reviews are current under this methodology at December 31, 2015.
Purchased Impaired Loans: Purchased impaired loans are recorded at their estimated fair values on the respective purchase dates and are accounted for prospectively based on expected cash flows. No allowance for credit losses is recorded on these loans at the acquisition date. In determining the acquisition date fair value of purchased impaired loans, and in subsequent accounting, the Company reviews these loans on an individual basis. Expected future cash flows in excess of the fair value of loans at the purchase date (''accretable yield'') are recorded as interest income over the life of the loans if the timing and amount of the future cash flows can be reasonably estimated. The non-accretable yield represents estimated losses in the portfolio and is equal to the difference between contractually required payments and the cash flows expected to be collected at acquisition.
Subsequent to the purchase date, increases in cash flows over those expected at the purchase date are recognized as interest income prospectively. The present value of any decreases in expected cash flows after the purchase date is recognized by recording a charge-off through the allowance for loan losses.
57
BANKFINANCIAL CORPORATION
NOTES TO CONSOLIDATED FINANCIAL STATEMENTS
(Table amounts in thousands, except share and per share data)
NOTE 1 - SUMMARY OF SIGNIFICANT ACCOUNTING POLICIES (continued)
Troubled Debt Restructurings: A loan is classified as a troubled debt restructuring when a borrower is experiencing financial difficulties that leads to a restructuring of the loan, and the Company grants concessions to the borrower in the restructuring that it would not otherwise consider. These concessions may include rate reductions, principal forgiveness, extension of maturity date and other actions intended to minimize potential losses.
In determining whether a debtor is experiencing financial difficulties, the Company considers if the debtor is in payment default or would be in payment default in the foreseeable future without the modification, the debtor declared or is in the process of declaring bankruptcy, there is substantial doubt that the debtor will continue as a going concern, the debtor has securities that have been or are in the process of being delisted, the debtor's entity-specific projected cash flows will not be sufficient to service any of its debt, or the debtor cannot obtain funds from sources other than the existing creditors at a market rate for debt with similar risk characteristics.
In determining whether the Company has granted a concession, the Company assesses, if it does not expect to collect all amounts due, whether the current value of the collateral will satisfy the amounts owed, whether additional collateral or guarantees from the debtor will serve as adequate compensation for other terms of the restructuring, and whether the debtor otherwise has access to funds at a market rate for debt with similar risk characteristics.
A loan that is modified at a market rate of interest will not be classified as troubled debt restructuring in the calendar year subsequent to the restructuring if it is in compliance with the modified terms. Payment performance prior and subsequent to the restructuring is taken into account in assessing whether it is likely that the borrower can meet the new terms. This may result in the loan being returned to accrual at the time of restructuring. A period of sustained repayment for at least six months generally is required for return to accrual status.
Periodically, the Company will restructure a note into two separate notes (A/B structure), charging off the entire B portion of the note. The A note is structured with appropriate loan-to-value and cash flow coverage ratios that provide for a high likelihood of repayment. The A note is classified as a non-performing note until the borrower has displayed a historical payment performance for a reasonable time prior to and subsequent to the restructuring. A period of sustained repayment for at least six months generally is required to return the note to accrual status provided that management has determined that the performance is reasonably expected to continue. The A note will be classified as a restructured note (either performing or nonperforming) through the calendar year of the restructuring that the historical payment performance has been established.
Allowance for Loan Losses: The Company establishes provisions for loan losses, which are charged to the Company’s results of operations to maintain the allowance for loan losses to absorb probable incurred credit losses in the loan portfolio. In determining the level of the allowance for loan losses, the Company considers past and current loss experience, trends in classified loans, evaluations of real estate collateral, current economic conditions, volume and type of lending, adverse situations that may affect a borrower’s ability to repay a loan and the levels of nonperforming and other classified loans. The amount of the allowance is based on estimates and the ultimate losses may vary from the estimates as more information becomes available or events change.
The Company provides for loan losses based on the allowance method. Accordingly, all loan losses are charged to the related allowance and all recoveries are credited to it. Additions to the allowance for loan losses are provided by charges to income based on various factors that, in our judgment, deserve current recognition in estimating probable incurred credit losses. The Company reviews the loan portfolio on an ongoing basis and makes provisions for loan losses on a quarterly basis to maintain the allowance for loan losses in accordance with GAAP. The allowance for loan losses consists of two components:
• | specific allowances established for any impaired residential non-owner occupied mortgage, multi-family mortgage, nonresidential real estate, construction and land, commercial, and commercial lease loans for which the recorded investment in the loan exceeds the measured value of the loan; and |
• | general allowances for loan losses for each loan class based on historical loan loss experience; and adjustments to historical loss experience (general allowances), maintained to cover uncertainties that affect our estimate of probable incurred credit losses for each loan class. If the remaining unamortized discount related to a specific pool of purchased performing loans exceeds the estimated credit losses associated with these loans, no general valuation allowance is recorded against the loans. |
The adjustments to historical loss experience are based on our evaluation of several factors, including levels of, and trends in, past due and classified loans; levels of, and trends in, charge–offs and recoveries; trends in volume and terms of loans, including any credit concentrations in the loan portfolio; experience and ability of lending management and other relevant staff; and national and local economic trends and conditions.
58
BANKFINANCIAL CORPORATION
NOTES TO CONSOLIDATED FINANCIAL STATEMENTS
(Table amounts in thousands, except share and per share data)
NOTE 1 - SUMMARY OF SIGNIFICANT ACCOUNTING POLICIES (continued)
The Company evaluates the allowance for loan losses based upon the combined total of the specific and general components. Generally, when the loan portfolio increases, absent other factors, the allowance for loan loss methodology results in a higher dollar amount of estimated probable incurred credit losses than would be the case without the increase. Conversely, when the loan portfolio decreases, absent other factors, the allowance for loan loss methodology generally results in a lower dollar amount of estimated probable losses than would be the case without the decrease.
The loss ratio used in computing the required general loan loss reserve allowance for a given class of loan consists of (i) the actual loss ratio (measured on a weighted, rolling twelve-quarter basis), (ii) the change in credit quality within the specific loan class during the period, (iii) the actual inherent risk factor assigned to the specific loan class and (iv) the actual concentration of risk factor assigned to the specific loan class (collectively, “the Specific Loan Class Risk Factors”). The Specific Loan Class Risk Factors are weighted equally in the calculation. In addition, two additional quantitative factors, the National Economic risk factor and the Local Economic risk factor, are also components of the computation but are given different weightings in their computation due to their relative applicability to the specific loan class in the context of the effect of national and local economic conditions on their risk profile and performance.
Mortgage Servicing Rights: Mortgage servicing rights are recognized separately when they are acquired through sales of loans. When mortgage loans are sold, servicing rights are initially recorded at fair value and gains on sales of loans are recorded in the statement of operations. Fair value is based on market prices for comparable mortgage servicing contracts, when available, or alternatively, is based on a valuation model that calculates the present value of estimated future net servicing income. The valuation model incorporates assumptions that market participants would use in estimating future net servicing income, such as the servicing cost per loan, the discount rate, the escrow float rate, an inflation rate, ancillary income, prepayment speeds and default rates and losses. The Company compares the valuation model inputs and results to published industry data in order to validate the model results and assumptions. All classes of servicing assets are subsequently measured using the amortization method which requires servicing rights to be amortized into noninterest income in proportion to, and over the period of, the estimated future net servicing income of the underlying loans.
Servicing assets are evaluated for impairment based upon the fair value of the rights as compared to carrying amount. Impairment is determined by stratifying rights into groupings based on predominant risk characteristics, such as interest rate, loan type and investor type. Impairment is recognized through a valuation allowance for an individual grouping, to the extent that fair value is less than the carrying amount. If the Company later determines that all or a portion of the impairment no longer exists for a particular grouping, a reduction of the allowance may be recorded as an increase to income. Changes in valuation allowances are reported with amortization and impairment of servicing assets on the statement of operations. The fair values of servicing rights are subject to significant fluctuations as a result of changes in estimated and actual prepayment speeds and default rates and losses.
Servicing fee income that is reported on the statement of operations as loan servicing fees is recorded for fees earned for servicing loans. The fees are based on a contractual percentage of the outstanding principal; or a fixed amount per loan and are recorded as income when earned. Late fees and ancillary fees related to loan servicing are not material.
Other Real Estate Owned: Foreclosed assets are initially recorded at fair value less cost to sell when acquired, establishing a new cost basis. Physical possession of residential real estate property collateralizing a consumer mortgage loan occurs when the legal title is obtained upon completion of foreclosure or when the borrower conveys all interest in the property to satisfy the loan through completion of a deed in lieu of foreclosure or through a similar legal agreement. These assets are subsequently accounted for at a lower of cost or fair value less estimated cost to sell. If fair value declines subsequent to foreclosure, a valuation allowance is recorded through expense. Operating expenses, gains and losses on disposition, and changes in the valuation allowance are reported in noninterest expense as operations of other real estate owned ("OREO").
Premises and Equipment: Land is carried at cost. Premises and equipment are stated at cost less accumulated depreciation. Depreciation is included in noninterest expense and is computed on the straight-line method over the estimated useful lives of the assets. Useful lives are estimated to be 25 to 40 years for buildings and improvements that extend the life of the original building, ten to 20 years for routine building improvements, five to 15 years for furniture and equipment, two to five years for computer hardware and software and no greater than four years on automobiles. The cost of maintenance and repairs is charged to expense as incurred and significant repairs are capitalized.
Other Intangible Assets: Intangible assets acquired in a purchase business combination with definite useful lives are amortized over their estimated useful lives to their estimated residual values. Core deposit intangible assets (“CDI”), are recognized at the time of acquisition based on valuations prepared by independent third parties or other estimates of fair value. In preparing such
59
BANKFINANCIAL CORPORATION
NOTES TO CONSOLIDATED FINANCIAL STATEMENTS
(Table amounts in thousands, except share and per share data)
NOTE 1 - SUMMARY OF SIGNIFICANT ACCOUNTING POLICIES (continued)
valuations, variables such as deposit servicing costs, attrition rates, and market discount rates are considered. CDI assets are amortized to expense over their useful lives.
Bank Owned Life Insurance: The Company has purchased life insurance policies on certain key executives. The Company owned life insurance is recorded at the amount that can be realized under the insurance contract at the balance sheet date, which is the cash surrender value adjusted for other charges or other amounts due that are probable at settlement.
Long-Term Assets: Premises and equipment, core deposit and other intangible assets, and other long-term assets are reviewed for impairment when events indicate that their carrying amount may not be recoverable from future undiscounted cash flows. If impaired, the assets are recorded at fair value.
Loan Commitments and Related Financial Instruments: Financial instruments include off-balance-sheet credit instruments, such as commitments to make loans and commercial letters of credit, issued to meet customer financing needs. The face amount for these items represents the exposure to loss, before considering customer collateral or ability to repay. Such financial instruments are recorded when they are funded.
Income Taxes: Income tax expense is the total of the current year income tax due or refundable and the change in deferred tax assets and liabilities. Under GAAP, a deferred tax asset valuation allowance is required to be recognized if it is “more likely than not” that the deferred tax asset will not be realized. The determination of the realizability of the deferred tax assets is highly subjective and dependent upon judgment concerning management’s evaluation of both positive and negative evidence, the forecasts of future taxable income, applicable tax planning strategies, and assessments of current and future economic and business conditions. The Company considers both positive and negative evidence regarding the ultimate realizability of our deferred tax assets. Examples of positive evidence may include the existence, if any, of taxes paid in available carry-back years and the likelihood that taxable income will be generated in future periods. Examples of negative evidence may include a cumulative loss in the current year and prior two years and negative general business and economic trends. Deferred tax assets and liabilities are measured using enacted tax rates expected to apply to taxable income in the years in which those temporary differences are expected to be recovered or settled. The effect on deferred tax assets and liabilities of a change in tax rates is recognized in income in the period of the enactment date.
This analysis is updated quarterly and adjusted as necessary. At December 31, 2015, the Company had a net deferred tax asset of $26.7 million, after recording a full recovery of the valuation allowance in 2014.
A tax position is recognized as a benefit only if it "more likely than not" that the tax position would be sustained in a tax examination, presuming that a tax examination will occur. The amount recognized is the largest amount of tax benefit that is greater than 50% likely to be realized on examination. For tax positions not meeting the more likely than not" test, no tax benefit is recorded.
Retirement Plans: Employee 401(k) and profit sharing plan expense is the amount of matching contributions and any annual discretionary contribution made at the discretion of the Company’s Board of Directors. Deferred compensation expense allocates the benefits over years of service.
Employee Stock Ownership Plan (“ESOP”): The cost of shares issued to the ESOP, but not yet allocated to participants, is shown as a reduction of stockholders’ equity. Compensation expense is based on the market price of shares as they are committed to be released to participant accounts. Dividends on allocated ESOP shares reduce retained earnings; dividends on unearned ESOP shares reduce debt and accrued interest.
Earnings (Loss) Per Common Share: Basic earnings (loss) per common share is net income (loss) divided by the weighted average number of common shares outstanding during the period. ESOP shares are considered outstanding for this calculation unless unearned. Diluted earnings (loss) per common share is net income (loss) divided by the weighted average number of common shares outstanding during the period plus the dilutive effect of restricted stock shares and the additional potential shares issuable under stock options.
Loss Contingencies: Loss contingencies, including claims and legal actions arising in the ordinary course of business, are recorded as liabilities when the likelihood of loss is probable and an amount or range of loss can be reasonably estimated. Management does not believe that there are such matters that will have a material effect on the financial statements as of December 31, 2015.
Restrictions on Cash: Cash on hand or on deposit with the Federal Reserve Bank which is required to meet regulatory reserve and clearing requirements.
60
BANKFINANCIAL CORPORATION
NOTES TO CONSOLIDATED FINANCIAL STATEMENTS
(Table amounts in thousands, except share and per share data)
NOTE 1 - SUMMARY OF SIGNIFICANT ACCOUNTING POLICIES (continued)
Fair Values of Financial Instruments: Fair values of financial instruments are estimated using relevant market value information and other assumptions, as more fully disclosed in a separate note. Fair value estimates involve uncertainties and matters of significant judgment regarding interest rates, credit risk, prepayments, and other factors, especially in the absence of broad markets for particular items. Changes in assumptions or in market conditions could significantly affect the estimates.
Comprehensive Income (Loss): Comprehensive income (loss) consists of net income (loss) and other comprehensive income (loss). Other comprehensive income (loss) includes unrealized gains and losses on securities, net of tax, which are also recognized as separate components of stockholders’ equity.
Stock-based Compensation: Compensation cost is recognized for stock options and restricted stock awards issued to employees, based on the fair value of these awards at the date of grant. The Black-Scholes model is utilized to estimate the fair value of stock options, while the market price of the Company’s common stock at the date of grant is used for restricted stock awards. Compensation cost is recognized over the required service period, generally defined as the vesting period.
Transfers of Financial Assets: Transfers of financial assets are accounted for as sales when control over the assets has been relinquished. Control over transferred assets is deemed to be surrendered when the assets have been isolated from the Company, the transferee obtains the right (free of conditions that constrain it from taking advantage of that right) to pledge or exchange the transferred assets, and the Company does not maintain effective control over the transferred assets through an agreement to repurchase them before their maturity.
Operating Segments: While management monitors the revenue streams of the various products and services, operations are managed and financial performance is evaluated on a Company-wide basis. Operating results are not reviewed by senior management to make resource allocation or performance decisions. Accordingly, all of the financial service operations are considered by management to be aggregated in one reportable operating segment.
Reclassifications: Certain reclassifications have been made in the prior year’s financial statements to conform to the current year’s presentation.
Recent Accounting Pronouncements
In January 2014, the FASB amended existing guidance to clarify when a creditor should derecognize a loan receivable and recognized collateral asset. An in substance repossession or foreclosure occurs, and a creditor is considered to have received physical possession of residential real estate property collateralizing a consumer mortgage loan, upon either (1) the creditor obtaining legal title to the residential real estate property upon completion of a foreclosure or (2) the borrower conveying all interest in the residential real estate property to the creditor to satisfy that loan through completion of a deed in lieu of foreclosure or through a similar legal agreement. Additionally, the amendment requires interim and annual disclosure of both (1) the amount of foreclosed residential real estate property held by the creditor and (2) the recorded investment in consumer mortgage loans collateralized by residential real estate property that are in the process of foreclosure according to local requirements of the applicable jurisdiction. This amendment is effective for interim and annual reporting periods beginning after December 15, 2014. The adoption of this standard did not have a material impact on the Company’s results of operation or financial position but did require expansion of the Company’s disclosures.
In May 2014, the FASB issued an update (ASU No. 2014-09, Revenue from Contracts with Customers) creating FASB Topic 606, Revenue from Contracts with Customers. The guidance in this update affects any entity that either enters into contracts with customers to transfer goods or services or enters into contracts for the transfer of nonfinancial assets unless those contracts are within the scope of other standards (for example, insurance contracts or lease contracts). The core principle of the guidance is that an entity should recognize revenue to depict the transfer of promised goods or services to customers in an amount that reflects the consideration to which the entity expects to be entitled in exchange for those goods or services. The guidance provides steps to follow to achieve the core principle. An entity should disclose sufficient information to enable users of financial statements to understand the nature, amount, timing and uncertainty of revenue and cash flows arising from contracts with customers. Qualitative and quantitative information is required about contracts with customers, significant judgments and changes in judgments, and assets recognized from the costs to obtain or fulfill a contract. The amendments in this update originally were to become effective for annual periods and interim periods within those annual periods beginning after December 15, 2016. During 2015, FASB delayed the effectiveness by one year to annual periods and interim periods beginning after December 15, 2017. We are currently evaluating the impact of adopting the new guidance on the consolidated financial statements.
61
BANKFINANCIAL CORPORATION
NOTES TO CONSOLIDATED FINANCIAL STATEMENTS
(Table amounts in thousands, except share and per share data)
NOTE 1 - SUMMARY OF SIGNIFICANT ACCOUNTING POLICIES (continued)
On January 5, 2016, the FASB issued an update (ASU No. 2016-01, Financial Instruments - Recognition and Measurement of Financial Assets and Liabilities). The new guidance is intended to improve the recognition and measurement of financial instruments by requiring: equity investments (other than equity method or consolidation) to be measured at fair value with changes in fair value recognized in net income; public business entities to use the exit price notion when measuring the fair value of financial instruments for disclosure purposes; separate presentation of financial assets and financial liabilities by measurement category and form of financial assets (i.e. securities or loans and receivables) on the balance sheet or the accompanying notes to the financial statements; eliminating the requirement to disclose the fair value of financial instruments measured at amortized cost for organizations that are not public business entities; eliminating the requirement for non-public business entities to disclose the method(s) and significant assumptions used to estimate the fair value that is to be required to be disclosed for financial instruments measured at amortized cost on the balance sheet; and requiring a reporting organization to present separately in other comprehensive income the portion of the total change in fair value of a liability resulting from the change in the instrument-specific credit risk (also referred to as “own credit”) when the organization has elected to measure the liability at fair value in accordance with the fair value option for financial instruments. The new guidance is effective for public business entities for fiscal years beginning after December 15, 2017. We are currently evaluating the impact of adopting the new guidance on the consolidated financial statements.
NOTE 2 - EARNINGS PER SHARE
Amounts reported in earnings per share reflect net income available to common stockholders for the period divided by the weighted average number of shares of common stock outstanding during the period, exclusive of unearned ESOP shares and unvested restricted stock shares. Stock options and restricted stock are regarded as potential common stock and are considered in the diluted earnings per share calculations to the extent that they would have a dilutive effect if converted to common stock.
For the years ended December 31, | |||||||||||
2015 | 2014 | 2013 | |||||||||
Net income available to common stockholders | $ | 8,675 | $ | 40,614 | $ | 3,298 | |||||
Average common shares outstanding | 20,708,775 | 21,101,966 | 21,091,399 | ||||||||
Less: | |||||||||||
Unearned ESOP shares | (780,227 | ) | (905,235 | ) | (1,054,140 | ) | |||||
Unvested restricted stock shares | (10,545 | ) | (19,460 | ) | (16,421 | ) | |||||
Weighted average common shares outstanding | 19,918,003 | 20,177,271 | 20,020,838 | ||||||||
Add - Net effect of dilutive stock options and unvested restricted stock | 3,516 | 9,105 | 4,483 | ||||||||
Weighted average dilutive common shares outstanding | 19,921,519 | 20,186,376 | 20,025,321 | ||||||||
Basic earnings per common share | $ | 0.44 | $ | 2.01 | $ | 0.16 | |||||
Diluted earnings per common share | $ | 0.44 | $ | 2.01 | $ | 0.16 | |||||
Number of antidilutive stock options excluded from the diluted earnings per share calculation | 536,459 | — | — | ||||||||
Weighted average exercise price of anti-dilutive option shares | $ | 12.99 | $ | — | $ | — | |||||
62
BANKFINANCIAL CORPORATION
NOTES TO CONSOLIDATED FINANCIAL STATEMENTS
(Table amounts in thousands, except share and per share data)
NOTE 3 – SECURITIES
The fair value of securities and the related gross unrealized gains and losses recognized in accumulated other comprehensive income is as follows:
Amortized Cost | Gross Unrealized Gains | Gross Unrealized Losses | Fair Value | ||||||||||||
December 31, 2015 | |||||||||||||||
Certificates of deposit | $ | 87,901 | $ | — | $ | — | $ | 87,901 | |||||||
Equity mutual fund | 500 | 7 | — | 507 | |||||||||||
Mortgage-backed securities - residential | 18,330 | 880 | (30 | ) | 19,180 | ||||||||||
Collateralized mortgage obligations - residential | 7,111 | 41 | (10 | ) | 7,142 | ||||||||||
SBA-guaranteed loan participation certificates | 23 | — | — | 23 | |||||||||||
$ | 113,865 | $ | 928 | $ | (40 | ) | $ | 114,753 | |||||||
December 31, 2014 | |||||||||||||||
Certificates of deposit | $ | 86,049 | $ | — | $ | — | $ | 86,049 | |||||||
Equity mutual fund | 500 | 9 | — | 509 | |||||||||||
Mortgage-backed securities - residential | 23,433 | 1,218 | (40 | ) | 24,611 | ||||||||||
Collateralized mortgage obligations - residential | 9,936 | 53 | (13 | ) | 9,976 | ||||||||||
SBA-guaranteed loan participation certificates | 29 | — | — | 29 | |||||||||||
$ | 119,947 | $ | 1,280 | $ | (53 | ) | $ | 121,174 | |||||||
Mortgage-backed securities and collateralized mortgage obligations reflected in the preceding table were issued by U.S. government-sponsored entities and agencies, Freddie Mac, Fannie Mae and Ginnie Mae, and are obligations which the government has affirmed its commitment to support. All securities reflected in the preceding table were classified as available-for-sale at December 31, 2015 and 2014.
The amortized cost and fair values of securities at December 31, 2015 by contractual maturity are shown below. Securities not due at a single maturity date are shown separately. Expected maturities may differ from contractual maturities because borrowers may have the right to call or prepay obligations with or without call or prepayment penalties.
December 31, 2015 | |||||||
Amortized Cost | Fair Value | ||||||
Due in one year or less | $ | 87,901 | $ | 87,901 | |||
Equity mutual fund | 500 | 507 | |||||
Mortgage-backed securities - residential | 18,330 | 19,180 | |||||
Collateralized mortgage obligations - residential | 7,111 | 7,142 | |||||
SBA-guaranteed loan participation certificates | 23 | 23 | |||||
$ | 113,865 | $ | 114,753 | ||||
Investment securities available for sale with carrying amounts of $6.0 million and $6.8 million at December 31, 2015 and 2014, respectively, were pledged as collateral on customer repurchase agreements and for other purposes as required or permitted by law.
63
BANKFINANCIAL CORPORATION
NOTES TO CONSOLIDATED FINANCIAL STATEMENTS
(Table amounts in thousands, except share and per share data)
NOTE 3 – SECURITIES (continued)
Sales of securities were as follows:
For the years ended December 31, | |||||||||||
2015 | 2014 | 2013 | |||||||||
Proceeds | $ | — | $ | 3,663 | $ | — | |||||
Gross gains | — | — | — | ||||||||
Gross losses | — | 7 | — | ||||||||
Securities with unrealized losses at December 31, 2015 and 2014 not recognized in income are as follows:
Less than 12 Months | 12 Months or More | Total | |||||||||||||||||||||
Fair Value | Unrealized Loss | Fair Value | Unrealized Loss | Fair Value | Unrealized Loss | ||||||||||||||||||
December 31, 2015 | |||||||||||||||||||||||
Mortgage-backed securities - residential | $ | — | $ | — | $ | 1,724 | $ | (30 | ) | $ | 1,724 | $ | (30 | ) | |||||||||
Collateralized mortgage obligations - residential | — | — | 1,299 | (10 | ) | 1,299 | (10 | ) | |||||||||||||||
$ | — | $ | — | $ | 3,023 | $ | (40 | ) | $ | 3,023 | $ | (40 | ) | ||||||||||
December 31, 2014 | |||||||||||||||||||||||
Mortgage-backed securities - residential | — | — | 2,126 | (40 | ) | 2,126 | (40 | ) | |||||||||||||||
Collateralized mortgage obligations - residential | — | — | 1,847 | (13 | ) | 1,847 | (13 | ) | |||||||||||||||
$ | — | $ | — | $ | 3,973 | $ | (53 | ) | $ | 3,973 | $ | (53 | ) | ||||||||||
The Company evaluates marketable investment securities with significant declines in fair value on a quarterly basis to determine whether they should be considered other-than-temporarily impaired under current accounting guidance, which generally provides that if a marketable security is in an unrealized loss position, whether due to general market conditions or industry or issuer-specific factors, the holder of the securities must assess whether the impairment is other-than-temporary.
Certain residential mortgage-backed securities and collateralized mortgage obligations that the Company holds in its investment portfolio were in an unrealized loss position at December 31, 2015, but the unrealized loss was not considered significant under the Company’s impairment testing methodology. In addition, the Company does not intend to sell these securities, and it is not likely that the Company will be required to sell the securities before their anticipated recovery occurs.
64
BANKFINANCIAL CORPORATION
NOTES TO CONSOLIDATED FINANCIAL STATEMENTS
(Table amounts in thousands, except share and per share data)
NOTE 4 – LOANS RECEIVABLE
Loans receivable are as follows:
December 31, | |||||||
2015 | 2014 | ||||||
One-to-four family residential real estate | $ | 159,501 | $ | 180,337 | |||
Multi-family mortgage | 506,026 | 480,349 | |||||
Nonresidential real estate | 226,735 | 234,500 | |||||
Construction and land | 1,313 | 1,885 | |||||
Commercial loans | 79,516 | 66,882 | |||||
Commercial leases | 265,405 | 217,143 | |||||
Consumer | 1,831 | 2,051 | |||||
1,240,327 | 1,183,147 | ||||||
Net deferred loan origination costs | 1,621 | 1,199 | |||||
Allowance for loan losses | (9,691 | ) | (11,990 | ) | |||
Loans, net | $ | 1,232,257 | $ | 1,172,356 | |||
Loan Origination/Risk Management. The Company has certain lending policies and procedures in place that are designed to maximize loan income within an acceptable level of risk. The Company reviews and approves these policies and procedures on a periodic basis. A reporting system supplements the review process by providing management with frequent reports related to loan production, loan quality, concentrations of credit, loan delinquencies and nonperforming and potential problem loans via trend and risk rating migration. The Company requires title insurance insuring the priority of our lien, fire and extended coverage casualty insurance, and, if appropriate, flood insurance, in order to protect our security interest in the underlying property.
The majority of the loans the Company originates are investment and business loans (multi-family, nonresidential real estate, commercial, construction and land loans, and commercial leases). In addition, we originate one-to-four family residential mortgage loans and consumer loans, and purchase and sell loan participations from time-to-time. The following briefly describes our principal loan products.
The Company originates real estate loans principally secured by first liens on nonresidential real estate. The nonresidential real estate properties are predominantly office buildings, light industrial buildings, shopping centers and mixed-use developments and, to a lesser extent, more specialized properties such as nursing homes and other healthcare facilities. The Company may, from time to time, purchase commercial real estate loan participations.
Multi-family mortgage loans generally are secured by multi-family rental properties such as apartment buildings, including subsidized apartment units. In general, loan amounts range between $250,000 and $3.0 million. Approximately 38.7% of the collateral is located outside of our primary market area; however, we do not have a concentration in any single market outside of our primary market territory. In underwriting multi-family mortgage loans, the Company considers a number of factors, which include the projected net cash flow to the loan’s debt service requirement (generally requiring a minimum ratio of 120%), the age and condition of the collateral, the financial resources and income level of the borrower and the borrower’s experience in owning or managing similar properties and, proximity to diverse employment opportunities. Multi-family mortgage loans are generally originated in amounts up to 80% of the appraised value of the property securing the loan. Personal guarantees are usually obtained from multi-family mortgage borrowers.
Loans secured by multi-family mortgages generally involve a greater degree of credit risk than one- to four-family residential mortgage loans and carry larger loan balances. This increased credit risk is a result of several factors, including the concentration of principal in a limited number of loans and borrowers, the effects of general economic conditions on income producing properties, and the increased difficulty of evaluating and monitoring these types of loans. Furthermore, the repayment of loans secured by multi-family mortgages typically depends upon the successful operation of the related real estate property. If the cash flow from the project is reduced below acceptable thresholds, the borrower’s ability to repay the loan may be impaired.
The Company emphasizes nonresidential real estate loans with initial principal balances between $250,000 and $3.0 million. Substantially all of our nonresidential real estate loans are secured by properties located in our primary market area. The Company’s
65
BANKFINANCIAL CORPORATION
NOTES TO CONSOLIDATED FINANCIAL STATEMENTS
(Table amounts in thousands, except share and per share data)
NOTE 4 – LOANS RECEIVABLE (continued)
nonresidential real estate loans are generally written as three- or five-year adjustable-rate mortgages or mortgages with balloon maturities of three or five years. Amortization on these loans is typically based on 20- to 30-year schedules. The Company also originates some 15-year fixed-rate, fully amortizing loans.
In the underwriting of nonresidential real estate loans, the Company generally lends up to 80% of the property’s appraised value. Decisions to lend are based on the economic viability of the property as the primary source of repayment and the creditworthiness of the borrower. In evaluating a proposed commercial real estate loan, we emphasize the ratio of the property’s projected net cash flow to the loan’s debt service requirement (generally requiring a minimum ratio of 120%), computed after deduction for a vacancy factor and property expenses we deem appropriate. Personal guarantees are pursued and usually obtained from nonresidential real estate borrowers.
Nonresidential real estate loans generally carry higher interest rates and have shorter terms than those on one- to four-family residential mortgage loans. Nonresidential real estate loans, however, entail significant additional credit risks compared to one- to four-family residential mortgage loans, as they typically involve larger loan balances concentrated with single borrowers or groups of related borrowers. In addition, the payment of loans secured by income-producing properties typically depends on the successful operation of the related real estate project and thus may be subject to a greater extent to adverse conditions in the real estate market and in the general economy.
The Company makes various types of secured and unsecured commercial loans to customers in our market area for the purpose of financing equipment acquisition, expansion, working capital and other general business purposes. The terms of these loans generally range from less than one year to five years. The loans are either negotiated on a fixed-rate basis or carry adjustable interest rates indexed to (i) a lending rate that is determined internally, or (ii) a short-term market rate index.
Commercial credit decisions are based upon our credit assessment of the loan applicant. The Company determines the applicant’s ability to repay in accordance with the proposed terms of the loans and we assess the risks involved. An evaluation is made of the applicant to determine character and capacity to manage. Personal guarantees of the principals are pursued and usually obtained. In addition to evaluating the loan applicant’s financial statements, we consider the adequacy of the primary and secondary sources of repayment for the loan. Credit agency reports of the applicant’s credit history supplement our analysis of the applicant’s creditworthiness and at times are supplemented with inquiries to other banks and trade investigations. Moreover, assets listed on personal financial statements are verified. Collateral supporting a secured transaction also is analyzed to determine its marketability. Commercial business loans generally have higher interest rates than residential loans of like duration because they have a higher risk of default since their repayment generally depends on the successful operation of the borrower’s business and the sufficiency of any collateral. Pricing of commercial loans is based primarily on the credit risk of the borrower, with due consideration given to borrowers with appropriate deposit relationships.
The Company also lends money to small and mid-size leasing companies for equipment financing leases. Generally, commercial leases are secured by an assignment by the leasing company of the lease payments and by a secured interest in the equipment being leased. In most cases, the lessee acknowledges our security interest in the leased equipment and agrees to send lease payments directly to us. Consequently, the Company underwrites lease loans by examining the creditworthiness of the lessee rather than the lessor. Lease loans generally are non-recourse to the leasing company.
The Company’s commercial leases are secured primarily by technology equipment, medical equipment, material handling equipment and other capital equipment. Lessees tend to be publicly-traded companies with investment-grade rated debt or companies that have not issued public debt and therefore do not have a public debt rating. The Company requires that a minimum of 50% of our commercial lessees have an investment grade public debt rating by Moody’s or Standard & Poors, or the equivalent. Commercial leases to these entities have a maximum maturity of seven years and a maximum outstanding credit exposure of $15.0 million to any single entity. If the lessee does not have a public debt rating, they are subject to the same internal credit analysis as any other customer. Typically, commercial leases to these lessees have a maximum maturity of five years and a maximum outstanding credit exposure of $5.0 million to any single entity. In addition, the Company will originate commercial leases to lessees with below-investment grade public debt ratings and have a maximum outstanding credit exposure of $10.0 million to any single entity. Lease loans are almost always fully amortizing, with fixed interest rates.
Although the Company does not actively originate construction and land loans presently, construction and land loans generally consist of land acquisition loans to help finance the purchase of land intended for further development, including single-family homes, multi-family housing and commercial income property, development loans to builders in our market area to finance improvements to real estate, consisting mostly of single-family subdivisions, typically to finance the cost of utilities, roads, sewers
66
BANKFINANCIAL CORPORATION
NOTES TO CONSOLIDATED FINANCIAL STATEMENTS
(Table amounts in thousands, except share and per share data)
NOTE 4 – LOANS RECEIVABLE (continued)
and other development costs. These builders generally rely on the sale of single-family homes to repay development loans, although in some cases the improved building lots may be sold to another builder, often in conjunction with development loans. Construction and land loans typically involve a higher degree of credit risk than financing on improved, owner-occupied real estate. The risk of loss on construction and land loans is largely dependent upon the accuracy of the initial appraisal of the property’s value upon completion of construction or development; the estimated cost of construction, including interest; and the estimated time to complete and/or sell or lease such property. The Company seeks to minimize these risks by maintaining consistent lending policies and underwriting standards. However, if the estimate of value proves to be inaccurate, the cost of completion is greater than expected, the length of time to complete and/or sell or lease the collateral property is greater than anticipated, or if there is a downturn in the local economy or real estate market, the property could have a value upon completion that is insufficient to assure full repayment of the loan. This could have a material adverse effect on the quality of the construction and land loan portfolio, and could result in significant losses or delinquencies.
The Company offers conforming and non-conforming, fixed-rate and adjustable-rate residential mortgage loans with maturities of up to 30 years and maximum loan amounts generally of up to $2.5 million. The Company currently offers fixed-rate conventional mortgage loans with terms of 10 to 30 years that are fully amortizing with monthly payments, and adjustable-rate conventional mortgage loans with initial terms of between one and five years that amortize up to 30 years. One- to four-family residential mortgage loans are generally underwritten according to Fannie Mae guidelines, and loans that conform to such guidelines are referred to as “conforming loans.” The Company generally originates both fixed- and adjustable-rate loans in amounts up to the maximum conforming loan limits as established by Fannie Mae, which is currently $417,000 for single-family homes. Private mortgage insurance is required for first mortgage loans with loan-to-value ratios in excess of 80%.
The Company also originates loans above conforming limits, sometimes referred to as “jumbo loans,” that have been underwritten to the credit standards of Fannie Mae. These loans are generally eligible for sale to various firms that specialize in the purchase of such non-conforming loans. In the Chicago metropolitan area, larger residential loans are not uncommon. The Company also originates loans at higher rates that do not fully meet the credit standards of Fannie Mae but are deemed to be acceptable risks.
The primary markets served by the Company have seen gradually broadening signs of stability amid widespread economic weakness and high unemployment. The ability of the Company’s borrowers to repay their loans, and the value of the collateral securing such loans, could be adversely impacted by a return to economic weakness in its local markets as a result of unemployment, declining real estate values, or increased residential and office vacancies. This not only could result in the Company experiencing charge-offs and/or nonperforming assets, but also could necessitate an increase in the provision for loan losses. These events, if they were to recur, would have an adverse impact on the Company’s results of operations and its capital.
67
BANKFINANCIAL CORPORATION
NOTES TO CONSOLIDATED FINANCIAL STATEMENTS
(Table amounts in thousands, except share and per share data)
NOTE 4 – LOANS RECEIVABLE (continued)
The following tables present the balance in the allowance for loan losses and the loans receivable by portfolio segment and based on impairment method:
Allowance for loan losses | Loan Balances | ||||||||||||||||||||||
Individually evaluated for impairment | Collectively evaluated for impairment | Total | Individually evaluated for impairment | Collectively evaluated for impairment | Total | ||||||||||||||||||
December 31, 2015 | |||||||||||||||||||||||
One-to-four family residential real estate | $ | — | $ | 1,704 | $ | 1,704 | $ | 2,672 | $ | 156,829 | $ | 159,501 | |||||||||||
Multi-family mortgage | 41 | 3,569 | 3,610 | 2,879 | 503,147 | 506,026 | |||||||||||||||||
Nonresidential real estate | 3 | 2,579 | 2,582 | 2,099 | 224,636 | 226,735 | |||||||||||||||||
Construction and land | — | 43 | 43 | — | 1,313 | 1,313 | |||||||||||||||||
Commercial loans | — | 654 | 654 | — | 79,516 | 79,516 | |||||||||||||||||
Commercial leases | — | 1,073 | 1,073 | — | 265,405 | 265,405 | |||||||||||||||||
Consumer | — | 25 | 25 | — | 1,831 | 1,831 | |||||||||||||||||
$ | 44 | $ | 9,647 | $ | 9,691 | $ | 7,650 | $ | 1,232,677 | 1,240,327 | |||||||||||||
Net deferred loan origination costs | 1,621 | ||||||||||||||||||||||
Allowance for loan losses | (9,691 | ) | |||||||||||||||||||||
Loans, net | $ | 1,232,257 | |||||||||||||||||||||
Allowance for loan losses | Loan Balances | ||||||||||||||||||||||
Individually evaluated for impairment | Collectively evaluated for impairment | Total | Individually evaluated for impairment | Collectively evaluated for impairment | Total | ||||||||||||||||||
December 31, 2014 | |||||||||||||||||||||||
One-to-four family residential real estate | $ | 8 | $ | 2,140 | $ | 2,148 | $ | 4,174 | $ | 176,163 | $ | 180,337 | |||||||||||
Multi-family mortgage | 226 | 4,979 | 5,205 | 5,282 | 475,067 | 480,349 | |||||||||||||||||
Nonresidential real estate | 236 | 2,704 | 2,940 | 4,690 | 229,810 | 234,500 | |||||||||||||||||
Construction and land | — | 80 | 80 | — | 1,885 | 1,885 | |||||||||||||||||
Commercial loans | — | 554 | 554 | 76 | 66,806 | 66,882 | |||||||||||||||||
Commercial leases | — | 1,009 | 1,009 | — | 217,143 | 217,143 | |||||||||||||||||
Consumer | — | 54 | 54 | — | 2,051 | 2,051 | |||||||||||||||||
$ | 470 | $ | 11,520 | $ | 11,990 | $ | 14,222 | $ | 1,168,925 | 1,183,147 | |||||||||||||
Net deferred loan origination costs | 1,199 | ||||||||||||||||||||||
Allowance for loan losses | (11,990 | ) | |||||||||||||||||||||
Loans, net | $ | 1,172,356 | |||||||||||||||||||||
68
BANKFINANCIAL CORPORATION
NOTES TO CONSOLIDATED FINANCIAL STATEMENTS
(Table amounts in thousands, except share and per share data)
NOTE 4 – LOANS RECEIVABLE (continued)
Activity in the allowance for loan losses is as follows:
For the years ended December 31, | |||||||||||
2015 | 2014 | 2013 | |||||||||
Beginning balance | $ | 11,990 | $ | 14,154 | $ | 18,035 | |||||
Loans charged off: | |||||||||||
One-to-four family residential real estate | (386 | ) | (873 | ) | (1,505 | ) | |||||
Multi-family mortgage | (198 | ) | (1,230 | ) | (1,832 | ) | |||||
Nonresidential real estate | (391 | ) | (1,727 | ) | (577 | ) | |||||
Construction and land | — | (1 | ) | (943 | ) | ||||||
Commercial loans | (152 | ) | (123 | ) | (425 | ) | |||||
Commercial leases | — | (8 | ) | — | |||||||
Consumer | (16 | ) | (12 | ) | (55 | ) | |||||
(1,143 | ) | (3,974 | ) | (5,337 | ) | ||||||
Recoveries: | |||||||||||
One-to-four family residential real estate | 702 | 418 | 447 | ||||||||
Multi-family mortgage | 182 | 100 | 236 | ||||||||
Nonresidential real estate | 509 | 423 | 519 | ||||||||
Construction and land | 44 | 377 | 463 | ||||||||
Commercial loans | 611 | 1,225 | 470 | ||||||||
Commercial leases | 1 | — | — | ||||||||
Consumer | 1 | 3 | 8 | ||||||||
2,050 | 2,546 | 2,143 | |||||||||
Net recoveries (charge-off) | 907 | (1,428 | ) | (3,194 | ) | ||||||
Recovery of loan losses | (3,206 | ) | (736 | ) | (687 | ) | |||||
Ending balance | $ | 9,691 | $ | 11,990 | $ | 14,154 | |||||
Purchased Impaired Loans
As a result of its acquisition of Downers Grove National Bank, the Company holds purchased loans for which there was evidence of deterioration of credit quality since origination and for which it was probable that all contractually required payments would not be collected as of the date of the acquisition. The Company held no purchased impaired loans at December 31, 2015 and one purchased impaired loan at December 31, 2014, with a recorded investment value of $52,000.
69
BANKFINANCIAL CORPORATION
NOTES TO CONSOLIDATED FINANCIAL STATEMENTS
(Table amounts in thousands, except share and per share data)
NOTE 4 – LOANS RECEIVABLE (continued)
Impaired loans
Several of the following disclosures are presented by “recorded investment,” which the FASB defines as “the amount of the investment in a loan, which is not net of a valuation allowance, but which does reflect any direct write-down of the investment.” The following represents the components of recorded investment:
Loan principal balance
Less unapplied payments
Plus negative unapplied balance
Less escrow balance
Plus negative escrow balance
Plus unamortized net deferred loan costs
Less unamortized net deferred loan fees
Plus unamortized premium
Less unamortized discount
Less previous charge-offs
Plus recorded accrued interest
Less reserve for uncollected interest
= Recorded investment
The following tables present loans individually evaluated for impairment by class of loans:
Loan Balance | Recorded Investment | Partial Charge-off | Allowance for Loan Losses Allocated | Average Investment in Impaired Loans | Interest Income Recognized | ||||||||||||||||||
December 31, 2015 | |||||||||||||||||||||||
With no related allowance recorded | |||||||||||||||||||||||
One-to-four family residential real estate | $ | 3,203 | $ | 2,637 | $ | 637 | $ | — | $ | 2,708 | $ | 24 | |||||||||||
One-to-four family residential real estate - non-owner occupied | 23 | 21 | 2 | — | 859 | — | |||||||||||||||||
Multi-family mortgage | 1,863 | 1,837 | — | — | 1,962 | 78 | |||||||||||||||||
Wholesale commercial lending | 511 | 507 | — | — | 514 | 34 | |||||||||||||||||
Nonresidential real estate | 2,066 | 2,049 | — | — | 1,877 | 102 | |||||||||||||||||
7,666 | 7,051 | 639 | — | 7,920 | 238 | ||||||||||||||||||
With an allowance recorded | |||||||||||||||||||||||
Multi-family mortgage | 518 | 518 | — | 41 | 1,181 | — | |||||||||||||||||
Nonresidential real estate | 62 | 39 | 27 | 3 | 1,439 | — | |||||||||||||||||
580 | 557 | 27 | 44 | 2,620 | — | ||||||||||||||||||
$ | 8,246 | $ | 7,608 | $ | 666 | $ | 44 | $ | 10,540 | $ | 238 | ||||||||||||
70
BANKFINANCIAL CORPORATION
NOTES TO CONSOLIDATED FINANCIAL STATEMENTS
(Table amounts in thousands, except share and per share data)
NOTE 4 – LOANS RECEIVABLE (continued)
Loan Balance | Recorded Investment | Partial Charge-off | Allowance for Loan Losses Allocated | Average Investment in Impaired Loans | Interest Income Recognized | ||||||||||||||||||
December 31, 2014 | |||||||||||||||||||||||
With no related allowance recorded | |||||||||||||||||||||||
One-to-four family residential real estate | $ | 3,246 | $ | 2,656 | $ | 649 | $ | — | $ | 2,777 | $ | 44 | |||||||||||
One-to-four family residential real estate - non-owner occupied | 1,481 | 1,425 | 57 | — | 745 | 76 | |||||||||||||||||
Multi-family mortgage | 3,174 | 2,593 | 481 | — | 3,419 | 120 | |||||||||||||||||
Wholesale commercial lending | 519 | 513 | — | — | 401 | — | |||||||||||||||||
Nonresidential real estate | 2,118 | 2,068 | 6 | — | 4,175 | 72 | |||||||||||||||||
Commercial loans - secured | 76 | 76 | — | — | 93 | 3 | |||||||||||||||||
10,614 | 9,331 | 1,193 | — | 11,610 | 315 | ||||||||||||||||||
With an allowance recorded | |||||||||||||||||||||||
One-to-four family residential real estate - non-owner occupied | 115 | 78 | 37 | 8 | 202 | — | |||||||||||||||||
Multi-family mortgage | 2,713 | 2,131 | 624 | 226 | 2,343 | 48 | |||||||||||||||||
Nonresidential real estate | 2,950 | 2,605 | 326 | 236 | 1,718 | 67 | |||||||||||||||||
5,778 | 4,814 | 987 | 470 | 4,263 | 115 | ||||||||||||||||||
$ | 16,392 | $ | 14,145 | $ | 2,180 | $ | 470 | $ | 15,873 | $ | 430 | ||||||||||||
Nonaccrual loans
The following tables present the recorded investment in nonaccrual and loans past due over 90 days still on accrual by class of loans:
Loan Balance | Recorded Investment | Loans Past Due Over 90 Days, still accruing | |||||||||
December 31, 2015 | |||||||||||
One-to-four family residential real estate | $ | 2,704 | $ | 2,263 | $ | — | |||||
One-to-four family residential real estate – non owner occupied | 92 | 192 | — | ||||||||
Multi-family mortgage | 829 | 821 | — | ||||||||
Nonresidential real estate | 324 | 296 | — | ||||||||
$ | 3,949 | $ | 3,572 | $ | — | ||||||
December 31, 2014 | |||||||||||
One-to-four family residential real estate | $ | 4,793 | $ | 4,210 | $ | — | |||||
One-to-four family residential real estate – non owner occupied | 291 | 198 | — | ||||||||
Multi-family mortgage | 5,638 | 4,481 | — | ||||||||
Nonresidential real estate | 4,023 | 3,245 | — | ||||||||
Commercial loans – secured | 76 | 76 | — | ||||||||
Consumer loans | 3 | 3 | — | ||||||||
$ | 14,824 | $ | 12,213 | $ | — | ||||||
71
BANKFINANCIAL CORPORATION
NOTES TO CONSOLIDATED FINANCIAL STATEMENTS
(Table amounts in thousands, except share and per share data)
NOTE 4 – LOANS RECEIVABLE (continued)
Nonaccrual loans and impaired loans are defined differently. Some loans may be included in both categories, and some may only be included in one category. Nonaccrual loans include both smaller balance homogeneous loans that are collectively evaluated for impairment and individually classified impaired loans.
The Company’s reserve for uncollected loan interest was $181,000 and $464,000 at December 31, 2015 and 2014, respectively. Except for purchased impaired loans, when a loan is on non-accrual status and the ultimate collectability of the total principal of an impaired loan is in doubt, all payments are applied to principal under the cost recovery method. Alternatively, when a loan is on non-accrual status but there is doubt concerning only the ultimate collectability of interest, contractual interest is credited to interest income only when received, under the cash basis method pursuant to the provisions of FASB ASC 310–10, as applicable. In all cases, the average balances are calculated based on the month–end balances of the financing receivables within the period reported pursuant to the provisions of FASB ASC 310–10, as applicable.
Past Due Loans
The following tables present the aging of the recorded investment in past due loans at December 31, 2015 by class of loans:
30-59 Days Past Due | 60-89 Days Past Due | 90 Days or Greater Past Due | Total Past Due | Loans Not Past Due | Total | ||||||||||||||||||
One-to-four family residential real estate | $ | 2,000 | $ | 572 | $ | 1,997 | $ | 4,569 | $ | 109,893 | $ | 114,462 | |||||||||||
One-to-four family residential real estate - non-owner occupied | 299 | 164 | 192 | 655 | 43,557 | 44,212 | |||||||||||||||||
Multi-family mortgage - Illinois | 651 | 283 | 821 | 1,755 | 312,620 | 314,375 | |||||||||||||||||
Multi-family mortgage - Other | — | — | — | — | 188,178 | 188,178 | |||||||||||||||||
Nonresidential real estate | — | — | 296 | 296 | 223,018 | 223,314 | |||||||||||||||||
Construction | — | — | — | — | 21 | 21 | |||||||||||||||||
Land | — | — | — | — | 1,279 | 1,279 | |||||||||||||||||
Commercial loans: | |||||||||||||||||||||||
Regional Commercial Banking | 4 | 150 | — | 154 | 29,890 | 30,044 | |||||||||||||||||
Health Care | — | — | — | — | 31,862 | 31,862 | |||||||||||||||||
Direct Commercial Lessor | — | — | — | — | 17,873 | 17,873 | |||||||||||||||||
Commercial leases: | — | ||||||||||||||||||||||
Investment rated commercial leases | 50 | 363 | — | 413 | 170,859 | 171,272 | |||||||||||||||||
Other commercial leases | — | — | — | — | 95,800 | 95,800 | |||||||||||||||||
Consumer | 21 | — | — | 21 | 1,819 | 1,840 | |||||||||||||||||
Total | $ | 3,025 | $ | 1,532 | $ | 3,306 | $ | 7,863 | $ | 1,226,669 | $ | 1,234,532 | |||||||||||
72
BANKFINANCIAL CORPORATION
NOTES TO CONSOLIDATED FINANCIAL STATEMENTS
(Table amounts in thousands, except share and per share data)
NOTE 4 – LOANS RECEIVABLE (continued)
The following tables present the aging of the recorded investment in past due loans as December 31, 2014 by class of loans:
30-59 Days Past Due | 60-89 Days Past Due | Greater than 90 Days Past Due | Total Past Due | Loans Not Past Due | Total | ||||||||||||||||||
One-to-four family residential real estate | $ | 1,415 | $ | 276 | $ | 3,844 | $ | 5,535 | $ | 126,054 | $ | 131,589 | |||||||||||
One-to-four family residential real estate - non-owner occupied | 320 | 165 | 198 | 683 | 47,350 | 48,033 | |||||||||||||||||
Multi-family mortgage | 2,314 | 1,187 | 3,363 | 6,864 | 328,516 | 335,380 | |||||||||||||||||
Wholesale commercial lending | — | — | — | — | 141,052 | 141,052 | |||||||||||||||||
Nonresidential real estate | 376 | 444 | 3,245 | 4,065 | 227,078 | 231,143 | |||||||||||||||||
Construction | — | — | — | — | 63 | 63 | |||||||||||||||||
Land | — | — | — | — | 1,814 | 1,814 | |||||||||||||||||
Commercial loans: | |||||||||||||||||||||||
Regional Commercial Banking | — | 1 | 76 | 77 | 24,777 | 24,854 | |||||||||||||||||
Health Care | — | — | — | — | 24,799 | 24,799 | |||||||||||||||||
Direct Commercial Lessor | — | — | — | — | 17,380 | 17,380 | |||||||||||||||||
Commercial leases: | — | ||||||||||||||||||||||
Investment rated commercial leases | 426 | — | — | 426 | 160,830 | 161,256 | |||||||||||||||||
Other commercial leases | 144 | — | — | 144 | 57,098 | 57,242 | |||||||||||||||||
Consumer | 18 | 1 | 3 | 22 | 2,038 | 2,060 | |||||||||||||||||
$ | 5,013 | $ | 2,074 | $ | 10,729 | $ | 17,816 | $ | 1,158,849 | $ | 1,176,665 | ||||||||||||
Troubled Debt Restructurings
The Company evaluates loan extensions or modifications in accordance with FASB ASC 310–40 with respect to the classification of the loan as a TDR. In general, if the Company grants a loan extension or modification to a borrower for other than an insignificant period of time that includes a below–market interest rate, principal forgiveness, payment forbearance or other concession intended to minimize the economic loss to the Company, the loan extension or loan modification is classified as a TDR. In cases where borrowers are granted new terms that provide for a reduction of either interest or principal then due and payable, management measures any impairment on the restructured loan in the same manner as for impaired loans as noted above.
The Company had $2.7 million of TDRs at December 31, 2015, compared to $3.0 million at December 31, 2014, with zero and $38,000 in specific valuation reserves allocated at December 31, 2015 and 2014, respectively. The Company had no outstanding commitments to borrowers whose loans are classified as TDRs.
The following table presents loans classified as TDRs:
December 31, | |||||||
2015 | 2014 | ||||||
One-to-four family residential real estate | $ | 1,385 | $ | 1,917 | |||
Multi-family mortgage | 1,119 | 510 | |||||
Accrual troubled debt restructured loans | 2,504 | 2,427 | |||||
One-to-four family residential real estate | 174 | 230 | |||||
Multi-family mortgage | — | 346 | |||||
Nonaccrual troubled debt restructured loans | 174 | 576 | |||||
$ | 2,678 | $ | 3,003 | ||||
73
BANKFINANCIAL CORPORATION
NOTES TO CONSOLIDATED FINANCIAL STATEMENTS
(Table amounts in thousands, except share and per share data)
NOTE 4 – LOANS RECEIVABLE (continued)
During the years ending December 31, 2015 and 2014, the terms of certain loans were modified and classified as TDRs. The modification of the terms of such loans included one or a combination of the following: a reduction of the stated interest rate of the loan; an extension of the maturity date at a stated rate of interest lower than the current market rate for new debt with similar risk; or a permanent reduction of the recorded investment in the loan.
The following tables present TDRs that occurred during the year:
For the years ended December 31, | |||||||||||||||||||||
2015 | 2014 | ||||||||||||||||||||
Number of loans | Pre- Modification outstanding recorded investment | Post- Modification outstanding recorded investment | Number of loans | Pre- Modification outstanding recorded investment | Post- Modification outstanding recorded investment | ||||||||||||||||
One-to-four family residential real estate | 6 | $ | 401 | $ | 274 | 4 | $ | 485 | $ | 444 | |||||||||||
Multi-family mortgage | 1 | 615 | 615 | — | — | — | |||||||||||||||
Commercial loans - secured | — | — | — | 1 | 210 | 5 | |||||||||||||||
7 | $ | 1,016 | $ | 889 | 5 | $ | 695 | $ | 449 | ||||||||||||
Due to reduction in interest rate | Due to extension of maturity date | Due to permanent reduction in recorded investment | Total | ||||||||||||
For the year ended December 31, 2015 | |||||||||||||||
One-to-four family residential real estate | $ | — | $ | 142 | $ | 132 | $ | 274 | |||||||
Multi-family mortgage | — | 615 | — | 615 | |||||||||||
$ | — | $ | 757 | $ | 132 | $ | 889 | ||||||||
For the year ended December 31, 2014 | |||||||||||||||
One-to-four family residential real estate | $ | 19 | $ | 373 | $ | 52 | $ | 444 | |||||||
Commercial loans - secured | — | — | 5 | 5 | |||||||||||
$ | 19 | $ | 373 | $ | 57 | $ | 449 | ||||||||
The TDRs described had no material impact on interest income, resulted in no change to the allowance for loan losses allocated and resulted in charge offs of $127,000 for the year ended December 31, 2015. The TDRs described above decreased interest income by $2,000, resulted in no change to the allowance for loan losses and resulted in charge offs of $248,000 for the year ended December 31, 2014.
The following table presents TDRs for which there was a payment default within twelve months following the modification:
For the years ended December 31, | |||||||||||||
2015 | 2014 | ||||||||||||
Number of loans | Recorded investment | Number of loans | Recorded investment | ||||||||||
One-to-four family residential real estate | 2 | $ | 43 | 2 | $ | 78 | |||||||
A loan is considered to be in payment default once it is 90 days contractually past due under the modified terms.
The TDRs that subsequently defaulted described above had no material impact on the allowance for loans losses during the years ending December 31, 2015 and 2014.
The terms of certain other loans were modified during the year ending December 31, 2015 that did not meet the definition of a TDR. These loans have a total recorded investment of $1.9 million and $1.0 million at December 31, 2015 and 2014. The
74
BANKFINANCIAL CORPORATION
NOTES TO CONSOLIDATED FINANCIAL STATEMENTS
(Table amounts in thousands, except share and per share data)
NOTE 4 – LOANS RECEIVABLE (continued)
modification of these loans involved either a modification of the terms of a loan to borrowers who were not experiencing financial difficulties or a delay in a payment that was considered to be insignificant.
In order to determine whether a borrower is experiencing financial difficulty, an evaluation is performed of the probability that the borrower will be in payment default on any of its debt in the foreseeable future without the modification. This evaluation is performed under the Company’s internal underwriting policy.
Credit Quality Indicators:
The Company categorizes loans into risk categories based on relevant information about the ability of borrowers to service their debt, including current financial information, historical payment experience, credit documentation, public information, and current economic trends, among other factors. The Company analyzes loans individually by classifying the loans based on credit risk. This analysis includes non-homogeneous loans, such as commercial and commercial real estate loans. This analysis is performed on a monthly basis. The Company uses the following definitions for risk ratings:
Special Mention. A Special Mention asset has potential weaknesses that deserve management’s close attention. If left uncorrected, these potential weaknesses may result in deterioration of the repayment prospects for the asset or in the institution’s credit position at some future date. Special Mention assets are not adversely classified and do not expose an institution to sufficient risk to warrant adverse classification.
Substandard. Loans categorized as substandard continue to accrue interest, but exhibit a well-defined weakness or weaknesses that may jeopardize the liquidation of the debt. The loans continue to accrue interest because they are well secured and collection of principal and interest is expected within a reasonable time. The risk rating guidance published by the Office of the Comptroller of the Currency clarifies that a loan with a well-defined weakness does not have to present a probability of default for the loan to be rated Substandard, and that an individual loan’s loss potential does not have to be distinct for the loan to be rated Substandard.
Nonaccrual. An asset classified Nonaccrual has all the weaknesses inherent in one classified substandard with the added characteristic that the weaknesses make collection or liquidation in full, on the basis of currently existing facts, conditions, and values, highly questionable and improbable. The loans were placed on nonaccrual status.
Loans not meeting the criteria above that are analyzed individually as part of the above described process are considered “Pass” rated loans.
75
BANKFINANCIAL CORPORATION
NOTES TO CONSOLIDATED FINANCIAL STATEMENTS
(Table amounts in thousands, except share and per share data)
NOTE 4 – LOANS RECEIVABLE (continued)
As of December 31, 2015, and based on the most recent analysis performed, the risk category of loans by class of loans is as follows:
Pass | Special Mention | Substandard | Nonaccrual | Total | |||||||||||||||
One-to-four family residential real estate | $ | 112,449 | $ | — | $ | 576 | $ | 1,936 | $ | 114,961 | |||||||||
One-to-four family residential real estate - non-owner occupied | 43,858 | 219 | 271 | 192 | 44,540 | ||||||||||||||
Multi-family mortgage - Illinois | 312,329 | 344 | 4,656 | 828 | 318,157 | ||||||||||||||
Multi-family mortgage - Other | 187,358 | — | 511 | — | 187,869 | ||||||||||||||
Nonresidential real estate | 219,859 | 1,600 | 4,981 | 295 | 226,735 | ||||||||||||||
Construction | 21 | — | — | — | 21 | ||||||||||||||
Land | 450 | — | 842 | — | 1,292 | ||||||||||||||
Commercial loans: | |||||||||||||||||||
Regional commercial banking | 29,377 | — | 614 | — | 29,991 | ||||||||||||||
Health care | 31,809 | — | — | — | 31,809 | ||||||||||||||
Direct commercial lessor | 17,716 | — | — | — | 17,716 | ||||||||||||||
Commercial leases: | |||||||||||||||||||
Investment rated commercial leases | 170,100 | — | — | — | 170,100 | ||||||||||||||
Other commercial leases | 95,305 | — | — | — | 95,305 | ||||||||||||||
Consumer | 1,831 | — | — | — | 1,831 | ||||||||||||||
$ | 1,222,462 | $ | 2,163 | $ | 12,451 | $ | 3,251 | $ | 1,240,327 | ||||||||||
As of December 31, 2014, and based on the most recent analysis performed, the risk category of loans by class of loans is as follows:
Pass | Special Mention | Substandard | Nonaccrual | Total | ||||||||||||||||
One-to-four family residential real estate | $ | 126,102 | $ | 615 | $ | 1,046 | $ | 4,228 | $ | 131,991 | ||||||||||
One-to-four family residential real estate - non-owner occupied | 46,253 | 931 | 964 | 198 | 48,346 | |||||||||||||||
Multi-family mortgage - Illinois | 330,878 | 609 | 3,430 | 4,515 | 339,432 | |||||||||||||||
Multi-family mortgage - Other | 140,398 | — | 519 | — | 140,917 | |||||||||||||||
Nonresidential real estate | 223,385 | 1,170 | 6,698 | 3,247 | 234,500 | |||||||||||||||
Construction | 60 | — | — | — | 60 | |||||||||||||||
Land | 1,212 | — | 613 | — | 1,825 | |||||||||||||||
Commercial loans: | ||||||||||||||||||||
Regional commercial banking | 23,978 | 40 | 705 | 76 | 24,799 | |||||||||||||||
Health care | 24,770 | — | — | — | 24,770 | |||||||||||||||
Direct commercial lessor | 17,313 | — | — | — | 17,313 | |||||||||||||||
Commercial leases: | ||||||||||||||||||||
Investment rated commercial leases | 160,208 | — | — | — | 160,208 | |||||||||||||||
Other commercial leases | 56,935 | — | — | — | 56,935 | |||||||||||||||
Consumer | 2,048 | — | — | 3 | 2,051 | |||||||||||||||
$ | 1,153,540 | $ | 3,365 | $ | 13,975 | $ | 12,267 | $ | 1,183,147 | |||||||||||
76
NOTE 5 – OTHER REAL ESTATE OWNED
Real estate that is acquired through foreclosure or a deed in lieu of foreclosure is classified as OREO until it is sold. When real estate is acquired through foreclosure or by deed in lieu of foreclosure, it is recorded at its fair value, less the estimated costs of disposal. If the fair value of the property is less than the loan balance, the difference is charged against the allowance for loan losses.
The following represents the roll forward of OREO and the composition of OREO properties.
At and For the Years Ended December 31, | ||||||||
2015 | 2014 | |||||||
(Dollars in thousands) | ||||||||
Beginning balance | $ | 6,358 | $ | 6,306 | ||||
New foreclosed properties | 5,875 | 5,449 | ||||||
Valuation adjustments | (548 | ) | (448 | ) | ||||
Sales | (4,674 | ) | (4,949 | ) | ||||
Ending balance | $ | 7,011 | $ | 6,358 | ||||
December 31, 2015 | December 31, 2014 | ||||||||||||||||||||||
Balance | Valuation Allowance | Net OREO Balance | Balance | Valuation Allowance | Net OREO Balance | ||||||||||||||||||
(Dollars in thousands) | |||||||||||||||||||||||
One–to–four family residential | $ | 2,684 | $ | (63 | ) | $ | 2,621 | $ | 1,318 | $ | (55 | ) | $ | 1,263 | |||||||||
Multi-family mortgage | 1,025 | (74 | ) | 951 | 2,530 | (223 | ) | 2,307 | |||||||||||||||
Nonresidential real estate | 1,986 | (239 | ) | 1,747 | 964 | (79 | ) | 885 | |||||||||||||||
Land | 2,358 | (666 | ) | 1,692 | 2,442 | (539 | ) | 1,903 | |||||||||||||||
8,053 | (1,042 | ) | 7,011 | 7,254 | (896 | ) | 6,358 | ||||||||||||||||
Activity in the valuation allowance is as follows:
At and For the Years Ended December 31, | ||||||||
2015 | 2014 | |||||||
(Dollars in thousands) | ||||||||
Beginning of year | $ | 896 | $ | 902 | ||||
Additions charged to expense | 548 | 438 | ||||||
Reductions from sales of other real estate owned | (402 | ) | (444 | ) | ||||
End of year | $ | 1,042 | $ | 896 | ||||
NOTE 6 – SECONDARY MORTGAGE MARKET ACTIVITIES
First mortgage loans serviced for others are not included in the accompanying consolidated statements of financial condition. The unpaid principal balances of these loans were $132.4 million and $148.3 million at December 31, 2015, and 2014, respectively. Custodial escrow balances maintained in connection with the foregoing loan servicing activities were $3.4 million at December 31, 2015, and 2014.
77
BANKFINANCIAL CORPORATION
NOTES TO CONSOLIDATED FINANCIAL STATEMENTS
(Table amounts in thousands, except share and per share data)
NOTE 6 – SECONDARY MORTGAGE MARKET ACTIVITIES (continued)
Capitalized mortgage servicing rights are included in other assets in the accompanying consolidated statements of financial condition. Activity for capitalized mortgage servicing rights and the related valuation allowance was as follows.
December 31, | |||||||
2015 | 2014 | ||||||
Servicing rights | |||||||
Beginning of year | $ | 834 | $ | 931 | |||
Additions | 27 | 38 | |||||
Amortized to expense | (137 | ) | (135 | ) | |||
End of year | $ | 724 | $ | 834 | |||
Valuation allowance | |||||||
Beginning of year | $ | 13 | $ | 5 | |||
Additions expensed | 3 | 8 | |||||
Reductions credited to expense | — | — | |||||
End of year | $ | 16 | $ | 13 | |||
Carrying value of mortgage servicing rights | $ | 708 | $ | 821 | |||
Fair value of mortgage servicing rights | $ | 815 | $ | 1,190 | |||
The estimated fair value of mortgage servicing rights is the present value of the expected future cash flows over the projected life of the loan. Assumptions used in the present value calculation are based on actual performance of the underlying servicing along with general market consensus. The expected cash flow is the net amount of all mortgage servicing income and expense items. The expected cash flows are discounted at an interest rate appropriate for the associated risk given the current market conditions. Significant assumptions are as follows:
December 31, | |||||
2015 | 2014 | ||||
Prepayment speed | 13.92 | % | 13.69 | % | |
Discount rate | 12.00 | % | 12.00 | % | |
Average servicing cost per loan | $60.00 | $63.00 | |||
Escrow float rate | 0.25 | % | 1.83 | % | |
Key economic assumptions used in measuring the fair value of the Company’s mortgage servicing rights as of December 31, 2015 and the effect on the fair value of our mortgage servicing rights from adverse changes in those assumptions, are as follows:
Fair value of mortgage servicing rights | $ | 815 | |
Weighted average annual prepayment speed | 13.92 | % | |
Decrease in fair value from 10% adverse change | (22 | ) | |
Decrease in fair value from 20% adverse change | (41 | ) | |
Weighted-average annual discount rate | 12.00 | % | |
Decrease in fair value from 10% adverse change | (28 | ) | |
Decrease in fair value from 20% adverse change | (54 | ) | |
These sensitivities are hypothetical and should be used with caution. As the above table indicates, changes in fair value based on variations in individual assumptions generally cannot be used to predict changes in fair value based upon further variations of the same assumptions. Also, the effect of a variation in a particular assumption on the fair value of the retained interest is calculated in the above table independently, without changing any other assumption. In reality, changes in one factor may result in changes in another factor, which might magnify or counteract the sensitivities.
78
BANKFINANCIAL CORPORATION
NOTES TO CONSOLIDATED FINANCIAL STATEMENTS
(Table amounts in thousands, except share and per share data)
NOTE 6 – SECONDARY MORTGAGE MARKET ACTIVITIES (continued)
The weighted average amortization period is 62 months. The estimated amortization expense for each of the next five years is as follows:
2016 | $ | 142 | |
2017 | 115 | ||
2018 | 92 | ||
2019 | 72 | ||
2020 | 58 | ||
NOTE 7 – PREMISES AND EQUIPMENT
Year end premises and equipment are as follows:
December 31, | |||||||
2015 | 2014 | ||||||
Land and land improvements | $ | 13,594 | $ | 13,569 | |||
Buildings and improvements | 37,316 | 37,181 | |||||
Furniture and equipment | 9,693 | 9,487 | |||||
Computer equipment | 7,224 | 7,232 | |||||
67,827 | 67,469 | ||||||
Accumulated depreciation | (35,101 | ) | (33,183 | ) | |||
$ | 32,726 | $ | 34,286 | ||||
Depreciation of premises and equipment was $2.1 million, $2.2 million and $2.9 million for the years ended December 31, 2015, 2014 and 2013, respectively.
The Company leases certain branch facilities under non-cancelable operating lease agreements expiring in various years through 2032. Rent expense, net of sublease income, for facilities was $393,000, $387,000, and $476,000 in 2015, 2014, and 2013, respectively, excluding taxes, insurance, and maintenance. The projected minimum rental expense under existing leases, not including taxes, insurance, and maintenance, as of December 31, 2015 is as follows:
2016 | $ | 448 | |
2017 | 469 | ||
2018 | 479 | ||
2019 | 471 | ||
2020 | 459 | ||
Thereafter | 4,708 | ||
$ | 7,034 | ||
The Company has subleased some of its branch facilities and currently is entitled to receive income as follows:
2016 | $ | 43 | |
2017 | 7 | ||
$ | 50 | ||
79
BANKFINANCIAL CORPORATION
NOTES TO CONSOLIDATED FINANCIAL STATEMENTS
(Table amounts in thousands, except share and per share data)
NOTE 8 – CORE DEPOSIT INTANGIBLE
The following table presents the changes in the carrying amount of core deposit intangible, gross carrying amount, accumulated amortization, and net book value:
December 31, | |||||||
2015 | 2014 | ||||||
Balance at the beginning of the year | $ | 1,855 | $ | 2,433 | |||
Amortization | (550 | ) | (578 | ) | |||
Additions | — | — | |||||
Net Carrying Value | $ | 1,305 | $ | 1,855 | |||
Gross carrying amount | $ | 5,932 | $ | 5,932 | |||
Accumulated amortization | (4,627 | ) | (4,077 | ) | |||
Net Carrying Value | $ | 1,305 | $ | 1,855 | |||
Aggregate amortization expense was $550,000, $578,000 and $605,000 for 2015, 2014 and 2013, respectively.
Estimated amortization expense for each of the next five years is as follows:
2016 | $ | 523 | |
2017 | 496 | ||
2018 | 184 | ||
2019 | 61 | ||
2020 | 34 | ||
NOTE 9 – DEPOSITS
Composition of deposits are as follows:
December 31, | |||||||
2015 | 2014 | ||||||
Noninterest-bearing demand deposits | $ | 254,830 | $ | 134,129 | |||
Savings deposits | 156,752 | 154,532 | |||||
Money market accounts | 329,654 | 338,246 | |||||
Interest-bearing NOW accounts | 248,982 | 351,947 | |||||
Certificates of deposit | 222,701 | 232,859 | |||||
$ | 1,212,919 | $ | 1,211,713 | ||||
Time deposits that meet or exceed the FDIC Insurance limit of $250,000 were $15.2 million and $13.1 million at December 31, 2015 and 2014, respectively.
Scheduled maturities of certificates of deposit for the next five years are as follows:
2016 | $ | 151,545 | |
2017 | 44,515 | ||
2018 | 15,716 | ||
2019 | 3,650 | ||
2020 | 7,275 | ||
80
BANKFINANCIAL CORPORATION
NOTES TO CONSOLIDATED FINANCIAL STATEMENTS
(Table amounts in thousands, except share and per share data)
NOTE 10 – BORROWINGS
Year-end borrowed funds are as follows:
December 31, | |||||||||||||
2015 | 2014 | ||||||||||||
Contractual Rate | Amount | Contractual Rate | Amount | ||||||||||
Fixed-rate advance from FHLBC, due within 1 year | 0.29 | % | $ | 62,000 | 0.13 | % | $ | 10,000 | |||||
Securities sold under agreements to repurchase | 0.25 | 2,318 | 0.25 | 2,921 | |||||||||
0.28 | % | $ | 64,318 | 0.16 | % | $ | 12,921 | ||||||
The Company maintains a collateral pledge agreement covering secured advances whereby the Company has agreed to keep on hand, free of all other pledges, liens, and encumbrances, specifically identified whole first mortgages on improved residential property not more than 90-days delinquent to secure advances from the FHLBC. All of the Bank’s FHLBC common stock is pledged as additional collateral for these advances. At December 31, 2015, $94.3 million and $303.0 million of first mortgage and multi-family mortgage loans, respectively, collateralized potential advances. At December 31, 2015, we had the ability to borrow an additional $307.8 million under our credit facilities with the FHLBC. The Company also had available pre-approved overnight federal funds borrowing. At December 31, 2015 and 2014, there was no outstanding balance on these lines.
NOTE 11 – SECURITIES SOLD UNDER AGREEMENTS TO REPURCHASE
Securities sold under agreements to repurchase are shown below.
December 31, 2015 | ||||||||||||||||||||
Overnight and Continuous | Up to 30 days | 30 - 90 days | Greater Than 90 days | Total | ||||||||||||||||
Repurchase agreements and repurchase-to-maturity transactions | $ | 2,318 | $ | — | $ | — | $ | — | $ | 2,318 | ||||||||||
Gross amount of recognized liabilities for repurchase agreements in Statement of Condition | $ | 2,318 | ||||||||||||||||||
December 31, 2014 | ||||||||||||||||||||
Overnight and Continuous | Up to 30 days | 30 - 90 days | Greater Than 90 days | Total | ||||||||||||||||
Repurchase agreements and repurchase-to-maturity transactions | $ | 2,921 | $ | — | $ | — | $ | — | $ | 2,921 | ||||||||||
Gross amount of recognized liabilities for repurchase agreements in Statement of Condition | $ | 2,921 | ||||||||||||||||||
Securities sold under agreements to repurchase were secured by mortgage-backed securities with a carrying amount of $6.0 million and $6.8 million at December 31, 2015 and December 31, 2014, respectively. Also included in total borrowings were advances from the FHLBC of $62.0 million and $10.0 million at December 31, 2015 and December 31, 2014, respectively.
As the securities’ values fluctuate due to market conditions, the Company has no control over the market value. The Company is obligated to promptly transfer additional securities if the market value of the securities fall below the repurchase price, per the agreement.
81
BANKFINANCIAL CORPORATION
NOTES TO CONSOLIDATED FINANCIAL STATEMENTS
(Table amounts in thousands, except share and per share data)
NOTE 12 – INCOME TAXES
The income tax expense (benefit) is as follows:
For the years ended December 31, | |||||||||||
2015 | 2014 | 2013 | |||||||||
Current | $ | 346 | $ | 363 | $ | — | |||||
Deferred expense (benefit) | 5,079 | 3,437 | (1,310 | ) | |||||||
Deferred tax valuation allowance | — | (35,117 | ) | 1,310 | |||||||
Total income tax expense (benefit) | $ | 5,425 | $ | (31,317 | ) | $ | — | ||||
A reconciliation of the provision for income taxes computed at the statutory federal corporate tax rate of 34% for 2015, 2014 and 2013 to the income tax expense (benefit) in the consolidated statements of operations follows:
For the years ended December 31, | |||||||||||
2015 | 2014 | 2013 | |||||||||
Expense computed at the statutory federal tax rate | $ | 4,794 | $ | 3,161 | $ | 1,121 | |||||
State taxes and other, net | 626 | 664 | 92 | ||||||||
Tax adjustments | — | — | (2,390 | ) | |||||||
Bank owned life insurance | (66 | ) | (80 | ) | (106 | ) | |||||
ESOP/Share based compensation | 71 | 55 | (27 | ) | |||||||
Deferred tax valuation allowance | — | (35,117 | ) | 1,310 | |||||||
$ | 5,425 | $ | (31,317 | ) | $ | — | |||||
Effective income tax rate | 38.48 | % | N.M. | — | % | ||||||
N.M. Not Meaningful
Retained earnings at December 31, 2015 and 2014 include $14.9 million for which no deferred federal income tax liability has been recorded. This amount represents an allocation of income to bad debt deductions for tax purposes alone.
The net deferred tax asset is as follows:
December 31, | |||||||
2015 | 2014 | ||||||
Gross Deferred tax assets | |||||||
Allowance for loan losses | $ | 3,716 | $ | 4,598 | |||
Alternative minimum tax, general business credit and net operating loss carryforwards | 24,799 | 28,842 | |||||
Tax deductible goodwill and core deposit intangible | 1,783 | 2,091 | |||||
Other | 2,237 | 1,703 | |||||
32,535 | 37,234 | ||||||
Gross Deferred tax liabilities | |||||||
Net deferred loan origination costs | (1,811 | ) | (1,587 | ) | |||
Purchase accounting adjustments | (2,801 | ) | (2,728 | ) | |||
Other | (888 | ) | (805 | ) | |||
Unrealized gain on securities | (340 | ) | (471 | ) | |||
(5,840 | ) | (5,591 | ) | ||||
$ | 26,695 | $ | 31,643 | ||||
As of December 31, 2015 and 2014, the Company’s net deferred tax asset (“DTA”) was $26.7 million and $31.6 million, respectively. The Company previously established a full valuation allowance against the DTA effective December 31, 2011, based on the
82
BANKFINANCIAL CORPORATION
NOTES TO CONSOLIDATED FINANCIAL STATEMENTS
(Table amounts in thousands, except share and per share data)
NOTE 12 – INCOME TAXES (continued)
Company’s cumulative pre-tax operating losses for the previous three years and other factors, including then existing local and national economic conditions and the Company’s then elevated level of nonperforming assets and corresponding credit costs (i.e., charge-offs, loan loss provisions, non-performing asset and other real estate owned management expenses, and gains and losses on sales of other real estate owned and bulk loan sales).
A DTA valuation allowance is required under ASC 740 when the realization of a DTA is assessed and the assessment indicates that it is “more likely than not” (i.e. more than 50% likely) that all or a portion of the DTA will not be realized. All available evidence, both positive and negative must be considered to determine whether, based on the weight of that evidence, a valuation allowance against the net DTA is required. Objectively verifiable evidence is assigned greater weight than evidence that is not objectively verifiable. The valuation allowance is analyzed quarterly for changes affecting the DTA.
The Company reversed its DTA valuation allowance as of December 31, 2014 based on management’s determination that it is more likely than not that the Company will be able to utilize the entire DTA and that maintaining a valuation allowance for the DTA was no longer warranted under ASC 740. Accordingly, the valuation allowance for the DTA was reversed and the Company recorded an associated tax benefit of $35.1 million in 2014.
The recovery of the DTA valuation allowance was supported by numerous positive factors, including eight consecutive quarters of sustained pre-tax income, strengthened asset quality trends, the absence of other previously-existing negative factors, the length of the Company’s net operating loss carryforward periods and financial projections indicating that the DTA will be realized before the underlying tax attributes begin to expire. The Company’s ability to realize the DTA is dependent upon the generation of future taxable income during the periods in which the tax attributes underlying the DTA become deductible. The amount of the DTA that will ultimately be realized will be impacted by the Company’s future taxable income and any changes to the many variables that could impact future taxable income.
As of December 31, 2015, management determined that it is more likely than not that the Company will be able to utilize the entire DTA.
At December 31, 2015, the Company had a federal net operating loss carryforward of $45.2 million, which will begin to expire in 2032, a federal tax credit carryforward of $1.3 million which will begin to expire in 2022, a $2.9 million alternative minimum tax credit carryforward that can be carried forward indefinitely, and a $39.7 million federal alternative minimum tax net operating loss carryforward which will begin to expire in 2032. In addition, at December 31, 2015 the Company had a federal net operating loss carryforward relating to its acquisition of Downers Grove National Bank, which is subject to utilization limitations under Section 382 of the Internal Revenue Code, of $7.9 million which will begin to expire in 2030. At December 31, 2015, the Company had a state net operating loss carryforward for the State of Illinois of $85.2 million, which will begin to expire in 2022.
Unrecognized Tax Benefits
A reconciliation of the beginning and ending amount of unrecognized tax benefits is as follows:
December 31, | |||||||
2015 | 2014 | ||||||
Beginning of year | $ | 79 | $ | 65 | |||
Additions based on tax positions related to the current year | — | 63 | |||||
Additions for tax positions of prior years | 29 | 1 | |||||
Reductions due to the statute of limitations and reductions for tax positions of prior years | — | (50 | ) | ||||
End of year | $ | 108 | $ | 79 | |||
The Company does not expect the total amount of unrecognized tax benefits to significantly increase or decrease in the next twelve months. The Company recognizes interest and/or penalties related to income tax matters in income tax expense. At December 31, 2015 and 2014, the Company has immaterial amounts accrued for potential interest and penalties.
The Company and its subsidiary are subject to U.S. federal income tax as well as income tax of the States of Illinois, Indiana, Wisconsin, New Jersey, Colorado, Minnesota, Florida and Texas. The Company is no longer subject to examination by the federal taxing authorities for years before 2012 and the Illinois taxing authorities for years before 2012.
83
BANKFINANCIAL CORPORATION
NOTES TO CONSOLIDATED FINANCIAL STATEMENTS
(Table amounts in thousands, except share and per share data)
NOTE 13 – REGULATORY MATTERS
The Bank and bank holding company are subject to regulatory capital requirements administered by the federal banking agencies. capital adequacy guidelines and, additionally for banks, prompt corrective action regulations, involve quantitative measure of assets, liabilities, and certain off-balance-sheet items calculated under regulatory accounting practices. Capital amounts and classifications are also subject to qualitative judgments by regulators. Failure to meet minimum capital requirements can initiate regulatory actions. The final rules implementing Basel Committee on Banking Supervision's capital guidelines for U.S. banks (Basel III rules) became effective for the Company on January 1, 2015 with full compliance with all of the requirements being phased in over a multi-year schedule, and fully phased in by January 1, 2019. The net unrealized gain or loss on available for sale securities is not included in computing regulatory capital. Capital amounts and ratios for December 31, 2014 are calculated using Basel I rules.
Prompt corrective action regulations provide five classifications: well capitalized, adequately capitalized, undercapitalized, significantly undercapitalized, and critically undercapitalized, although these terms are not used to represent overall financial condition. If adequately capitalized, regulatory approval is required to accept brokered deposits. If undercapitalized, capital distributions are limited, as is asset growth and expansion, and capital restoration plans are required. As of December 31, 2015 and 2014, the OCC categorized the Bank as well–capitalized under the regulatory framework for prompt corrective action. There are no conditions or events since those notifications that management believes have changed the institution’s well–capitalized status.
Actual and required capital amounts and ratios were:
Actual | Required for Capital Adequacy Purposes | To be Well-Capitalized under Prompt Corrective Action Provisions | ||||||||||||||||||
Amount | Ratio | Amount | Ratio | Amount | Ratio | |||||||||||||||
December 31, 2015 | ||||||||||||||||||||
Total capital (to risk-weighted assets): | ||||||||||||||||||||
Consolidated | $ | 198,738 | 17.89 | % | $ | 88,898 | 8.00 | % | N/A | N/A | ||||||||||
BankFinancial, F.S.B. | 171,239 | 15.41 | 88,881 | 8.00 | $ | 111,102 | 10.00 | % | ||||||||||||
Tier 1 (core) capital (to risk-weighted assets): | ||||||||||||||||||||
Consolidated | 189,044 | 17.01 | 66,674 | 6.00 | N/A | N/A | ||||||||||||||
BankFinancial, F.S.B. | 161,545 | 14.54 | 66,661 | 6.00 | 88,881 | 8.00 | ||||||||||||||
Common Tier 1 (CET1) | ||||||||||||||||||||
Consolidated | 189,044 | 17.01 | 50,005 | 4.50 | N/A | N/A | ||||||||||||||
BankFinancial, F.S.B. | 161,545 | 14.54 | 49,996 | 4.50 | 72,216 | 6.50 | ||||||||||||||
Tier 1 (core) capital (to adjusted average total assets): | ||||||||||||||||||||
Consolidated | 189,044 | 13.26 | 57,043 | 4.00 | N/A | N/A | ||||||||||||||
BankFinancial, F.S.B. | 161,545 | 11.33 | 57,039 | 4.00 | 71,299 | 5.00 | ||||||||||||||
December 31, 2014 | ||||||||||||||||||||
Total capital (to risk-weighted assets): | ||||||||||||||||||||
Consolidated | $ | 199,284 | 18.31 | % | $ | 87,084 | 8.00 | % | N/A | N/A | ||||||||||
BankFinancial, F.S.B. | 176,414 | 16.21 | 87,058 | 8.00 | $ | 108,822 | 10.00 | % | ||||||||||||
Tier 1 (core) capital (to risk-weighted assets): | ||||||||||||||||||||
Consolidated | 187,290 | 17.21 | 43,542 | 4.00 | N/A | N/A | ||||||||||||||
BankFinancial, F.S.B. | 164,420 | 15.11 | 43,529 | 4.00 | 65,293 | 6.00 | ||||||||||||||
Tier 1 (core) capital (to adjusted average total assets): | ||||||||||||||||||||
Consolidated | 187,290 | 13.04 | 57,363 | 4.00 | N/A | N/A | ||||||||||||||
BankFinancial, F.S.B. | 164,420 | 11.45 | 57,431 | 4.00 | 71,789 | 5.00 | ||||||||||||||
84
BANKFINANCIAL CORPORATION
NOTES TO CONSOLIDATED FINANCIAL STATEMENTS
(Table amounts in thousands, except share and per share data)
NOTE 13 – REGULATORY MATTERS (continued)
The Company and the Bank have adopted Capital Plans that requires the Bank to maintain a Tier 1 leverage ratio of at least 8% and a total risk-based capital ratio of at least 12%. The minimum capital ratios set forth in the Capital Plans will be increased and other minimum capital requirements will be established if and as necessary to comply with the Basel III requirements as such requirements become applicable to the Company and the Bank. In accordance with the Capital Plans, neither the Company nor the Bank will pursue any acquisition or growth opportunity, declare any dividend or conduct any stock repurchase that would cause the Bank’s total risk-based capital ratio and/or its Tier 1 leverage ratio to fall below the established minimum capital levels. In addition, the Company will continue to maintain its ability to serve as a source of financial strength to the Bank by holding at least $5.0 million of cash or liquid assets for that purpose. At December 31, 2015, management believes the Company and the Bank's Basel III capital calculations exceed requirements.
Federal regulations require the Bank to comply with a Qualified Thrift Lender (“QTL”) test, which generally requires that 65% of assets be maintained in housing-related finance and other specified assets. If the QTL test is not met, limits are placed on growth, branching, new investment, FHLBC advances, and dividends or the institution must convert to a commercial bank charter. Management considers the QTL test to have been met as of December 31, 2015.
The Bank is subject to regulatory restrictions on the amount of dividends it may declare and pay to the Company without prior regulatory approval, and to regulatory notification requirements for dividends that do not require prior regulatory approval.
NOTE 14 – EMPLOYEE BENEFIT PLANS
Employee Stock Ownership Plan. Employees are eligible to participate in the ESOP after attainment of age 21 and completion of one year of service. In connection with the conversion and reorganization, the ESOP borrowed $19.6 million from the Company, and used the proceeds of the loan to purchase 1,957,300 shares of common stock issued in the subscription offering at $10.00 per share. The loan is secured by the shares and will be repaid by the ESOP with funds from the Bank’s discretionary contributions to the ESOP and earnings on ESOP assets. The Bank has committed to make discretionary contributions to the ESOP sufficient to service the loan over a period not to exceed 20 years. When loan payments are made, ESOP shares are allocated to participants based on relative compensation and expense is recorded. Participants receive their earned shares at the end of employment.
Contributions to the ESOP were $1.5 million for the years ended December 31, 2015 and 2014, including dividends and interest received on unallocated shares of $206,000 and $90,000 in 2015 and 2014, respectively.
Expense related to the ESOP, net of dividends and interest received on unallocated ESOP shares, was $1.0 million, $1.1 million and $847,000 for the years ended December 31, 2015, 2014 and 2013, respectively.
Shares held by the ESOP were as follows:
December 31, | |||||||
2015 | 2014 | ||||||
Allocated to participants | 1,027,583 | 929,718 | |||||
Distributed to participants | (281,387 | ) | (202,235 | ) | |||
Unearned | 929,717 | 1,027,582 | |||||
Total ESOP shares | 1,675,913 | 1,755,065 | |||||
Fair value of unearned shares | $ | 11,742 | $ | 12,187 | |||
Profit Sharing Plan/401(k) Plan. The Company has a defined contribution plan (“profit sharing plan”) covering all of its eligible employees. Employees are eligible to participate in the profit sharing plan after attainment of age 21 and completion of one year of service. The Company provides a match of $0.50 on each $1.00 of contribution up to 6% of eligible compensation beginning April 1, 2007. The Company may also contribute an additional amount annually at the discretion of the Board of Directors. Contributions totaling $308,000, $348,000, and $346,000 were made for the years ended December 31, 2015, 2014 and 2013, respectively.
85
BANKFINANCIAL CORPORATION
NOTES TO CONSOLIDATED FINANCIAL STATEMENTS
(Table amounts in thousands, except share and per share data)
NOTE 15 – EQUITY INCENTIVE PLANS
On June 27, 2006, the Company’s stockholders approved the BankFinancial Corporation 2006 Equity Incentive Plan, which authorized the Human Resources Committee of the Board of Directors of the Company to grant a variety of cash- and equity-based incentive awards, including stock options, stock appreciation rights, restricted stock, performance shares and other incentive awards, to employees and directors aggregating up to 3,425,275 shares of the Company’s common stock.
The Human Resources Committee may grant stock options to purchase shares of the Company’s common stock to certain employees and directors of the Company. The exercise price for the stock options is the fair market value of the common stock on the dates of the grants.
The fair value of each option award is estimated on the date of grant using a closed form option valuation (Black-Scholes) model that uses the assumptions noted in the table below. The risk-free interest rate was determined using the yield available on the option grant date for a zero-coupon U.S. Treasury security with a term equivalent to the expected life of the option. The expected life for options granted represents the period the option is expected to be outstanding and was determined by applying the simplified method as allowed by SAB 107. The expected volatility for options issued in 2015 was determined using the Company’s historical data. Estimated forfeitures were assumed to be zero due to the lack of historical experience for the Company. During 2015, the Company awarded a total of 1,752,156 stock options to officers and directors.
The Company estimated the grant date fair value of options awarded in 2015 using Black-Scholes Option-Pricing model with the following assumptions:
2015 Assumptions | |||
Risk-free interest rate | 0.60 | % | |
Expected option life (years) | 1.27 | ||
Expected stock price volatility | 17.28 | % | |
Dividend yield | 1.299 | % | |
The stock options generally vest annually over a one year period; vesting is subject to acceleration in certain circumstances. The stock options will expire if not exercised within two years from the date of grant. The Company recognized $568,000 of stock-based compensation expenses relating to the granting of stock options for the year ended December 31, 2015. There was no expense for the years ended December 31, 2014 and 2013. As of December 31, 2014, there were no stock options outstanding. There are 694,469 stock options available for grant at December 31, 2015.
A summary of the activity in the stock option plan for 2015 follows:
Stock Options | Number of Shares | Weighted Average Exercise Price | Weighted Average Remaining Contractual Term (in years) | Aggregate Intrinsic Value (1) | |||||||||
Stock options outstanding at December 31, 2014 | — | $ | — | $ | — | ||||||||
Stock options granted | 1,752,156 | 12.30 | |||||||||||
Stock options exercised | — | — | |||||||||||
Stock options expired | — | — | |||||||||||
Stock options forfeited | — | — | |||||||||||
Stock options outstanding at December 31, 2015 | 1,752,156 | $ | 12.30 | 1.48 | 778 | ||||||||
Stock options exercisable at December 31, 2015 | 607,849 | 12.30 | 1.48 | 389 | |||||||||
Fully vested and expected to vest | 607,849 | 12.30 | 1.48 | 389 | |||||||||
86
BANKFINANCIAL CORPORATION
NOTES TO CONSOLIDATED FINANCIAL STATEMENTS
(Table amounts in thousands, except share and per share data)
NOTE 15 – EQUITY INCENTIVE PLANS
The weighted average fair value of the options granted is $0.88 per option. As of December 31, 2015, there was $980,000 of total unrecognized compensation cost related to the nonvested stock options granted under the Plan. The cost is expected to be recognized in 2016.
The Human Resources Committee of the Board of Directors may grant shares of restricted stock to certain employees and directors of the Company. The awards generally vest annually over varying periods from three to five years and vesting is subject to acceleration in certain circumstances. The cost of such awards will be accrued ratably as compensation expense over such respective periods based on expected vesting dates. The Company recognized $70,000, $70,000, and $86,000 of expenses relating to the grant of shares of restricted stock during the years ended December 31, 2015, 2014 and 2013, respectively. As of December 31, 2015, the total unrecognized compensation cost related to unvested shares of restricted stock was $11,000. The cost is expected to be recognized over a weighted average period of 5.2 months. There are 103,800 shares of restricted stock available for grant at December 31, 2015.
Restricted Stock | Number of Shares (1) | Weighted Average Fair Value at Grant Date | Weighted Average Term to Vest (in years) | Aggregate Intrinsic Value (2) | |||||||||
Shares outstanding at January 1, 2014 | 25,750 | $ | 8.14 | 1.27 | $ | 236 | |||||||
Shares granted | — | — | |||||||||||
Shares vested | (8,928 | ) | — | ||||||||||
Shares forfeited | — | — | |||||||||||
Shares outstanding at December 31, 2014 | 16,822 | $8.14 | 0.44 | $ | 199 | ||||||||
Shares granted | — | — | |||||||||||
Shares vested | (8,888 | ) | — | ||||||||||
Shares forfeited | — | — | |||||||||||
Shares outstanding at December 31, 2015 | 7,934 | $ | 8.14 | 0.31 | $ | 100 | |||||||
(1) | The end of period balances consist only of unvested shares. |
(2) | Restricted stock aggregate intrinsic value represents the number of shares of restricted stock multiplied by the market price of the common stock underlying the outstanding shares on the date shown. |
NOTE 16 – LOAN COMMITMENTS AND OTHER OFF-BALANCE SHEET ACTIVITIES
The Company is party to various financial instruments with off-balance-sheet risk. The Company uses these financial instruments in the normal course of business to meet the financing needs of customers and to effectively manage exposure to interest rate risk. These financial instruments include commitments to extend credit, standby letters of credit, unused lines of credit, and commitments to sell loans. When viewed in terms of the maximum exposure, those instruments may involve, to varying degrees, elements of credit and interest rate risk in excess of the amount recognized in the consolidated statements of financial condition. Credit risk is the possibility that a counterparty to a financial instrument will be unable to perform its contractual obligations. Interest rate risk is the possibility that, due to changes in economic conditions, the Company’s net interest income will be adversely affected.
The following is a summary of the contractual or notional amount of each significant class of off-balance-sheet financial instruments outstanding. The Company’s exposure to credit loss in the event of nonperformance by the counterparty for commitments to extend credit, standby letters of credit, and unused lines of credit is represented by the contractual notional amount of these instruments.
87
BANKFINANCIAL CORPORATION
NOTES TO CONSOLIDATED FINANCIAL STATEMENTS
(Table amounts in thousands, except share and per share data)
NOTE 16 – LOAN COMMITMENTS AND OTHER OFF-BALANCE SHEET ACTIVITIES (continued)
The contractual or notional amounts are as follows:
December 31, | |||||||
2015 | 2014 | ||||||
Financial instruments wherein contractual amounts represent credit risk | |||||||
Commitments to extend credit | $ | 52,322 | $ | 30,477 | |||
Standby letters of credit | 1,075 | 1,095 | |||||
Unused lines of credit | 126,333 | 109,580 | |||||
Commitments to sell mortgages | 64 | — | |||||
Commitments to extend credit are generally made for periods of 60 days or less. The fixed-rate loans commitment totaled $29.4 million with interest rates ranging from 2.25% to 6.65% and maturities ranging from 1.5 to 30 years.
Since many of the commitments are expected to expire without being drawn upon, the total commitment amounts do not necessarily represent future cash requirements. The Company evaluates each customer’s creditworthiness on a case-by-case basis. The amount of collateral obtained, if it is deemed necessary by the Company upon extension of credit, is based on management’s credit evaluation of the customers.
The Bank, as a member of Visa USA, received 51,404 unrestricted shares of Visa, Inc. Class B common stock in connection with Visa, Inc.’s initial public offering in 2007, and 32,398 additional shares of Class B common stock, due to a stock split, that were deposited into a litigation escrow that Visa, Inc. established under its retrospective responsibility plan. The retroactive responsibility plan obligates all former Visa USA members to indemnify Visa USA, in proportion to their equity interests in Visa USA, for certain litigation losses and expenses, including settlement expenses, for the lawsuits covered by the retrospective responsibility plan. The primary method for discharging the indemnification obligations under the retrospective responsibility plan is a reduction of the ratio at which the Visa, Inc. Class B shares held in the litigation escrow can be converted into publicly traded Class A common shares of Visa, Inc. Due to the restrictions that the retrospective responsibility plan imposes on the Company’s Visa, Inc. Class B shares, the Company has not recorded the Class B shares as an asset.
NOTE 17 – FAIR VALUE
Fair value is the exchange price that would be received for an asset or paid to transfer a liability (exit price) in the principal or most advantageous market for the asset or liability in an orderly transaction between market participants on the measurement date. There are three levels of inputs that may be used to measure fair values:
• | Level 1 – Quoted prices (unadjusted) for identical assets or liabilities in active markets that the entity has the ability to access as of the measurement date. |
• | Level 2 – Significant other observable inputs other than Level 1 prices such as quoted prices for similar assets or liabilities; quoted prices in markets that are not active; or other inputs that are observable or can be corroborated by observable market data. |
• | Level 3 – Significant unobservable inputs that reflect a company’s own assumptions about the assumptions that market participants would use in pricing an asset or liability. |
The Company used the following methods and significant assumptions to estimate the fair value of each type of financial instrument:
Securities: The fair values of marketable equity securities are generally determined by quoted prices, in active markets, for each specific security (Level 1). If Level 1 measurement inputs are not available for a marketable equity security, we determine its fair value based on the quoted price of a similar security traded in an active market (Level 2). The fair values of debt securities are generally determined by matrix pricing, which is a mathematical technique widely used in the industry to value debt securities without relying exclusively on quoted prices for the specific securities, but rather by relying on the securities’ relationship to other benchmark quoted securities (Level 2).
Impaired Loans: The fair value of impaired loans with specific allocations of the allowance for loan losses is generally based on recent real estate appraisals. These appraisals may utilize a single valuation approach or a combination of approaches including comparable sales and the income approach. Adjustments are routinely made in the appraisal process by the independent appraisers
88
BANKFINANCIAL CORPORATION
NOTES TO CONSOLIDATED FINANCIAL STATEMENTS
(Table amounts in thousands, except share and per share data)
NOTE 17 – FAIR VALUE (continued)
to adjust for differences between the comparable sales and income data available for similar loans and collateral underlying such loans. Non-real estate collateral may be valued using an appraisal, net book value per the borrower’s financial statements, or aging reports, adjusted or discounted based on management’s historical knowledge, changes in market conditions from the time of the valuation, and management’s expertise and knowledge of the client and client’s business, resulting in a Level 3 fair value classification. Impaired loans are evaluated on a quarterly basis for additional impairment and adjusted in accordance with the allowance policy.
Other Real Estate Owned: Assets acquired through or instead of loan foreclosure are initially recorded at fair value less costs to sell when acquired, establishing a new cost basis. These assets are subsequently accounted for at lower of cost or fair value less estimated costs to sell. Fair value is commonly based on recent real estate appraisals which are updated no less frequently than annually. These appraisals may utilize a single valuation approach or a combination of approaches including comparable sales and the income approach with data from comparable properties. Adjustments are routinely made in the appraisal process by the independent appraisers to adjust for differences between the comparable sales and income data available. Real estate owned properties are evaluated on a quarterly basis for additional impairment and adjusted accordingly.
Mortgage Servicing Rights: On a quarterly basis, loan servicing rights are evaluated for impairment based upon the fair value of the rights as compared to carrying amount. The fair values of mortgage servicing rights are based on a valuation model that calculates the present value of estimated net servicing income. The valuation model incorporates assumptions that market participants would use in estimating future net servicing income. The Company is able to compare the valuation model inputs and results to widely available published industry data for reasonableness (Level 2).
The following table sets forth the Company’s financial assets that were accounted for at fair value and are classified in their entirety based on the lowest level of input that is significant to the fair value measurement.
Fair Value Measurements Using | |||||||||||||||
Quoted Prices in Active Markets for Identical Assets (Level 1) | Significant Observable Inputs (Level 2) | Significant Unobservable Inputs (Level 3) | Fair Value | ||||||||||||
December 31, 2015 | |||||||||||||||
Securities: | |||||||||||||||
Certificates of deposit | $ | — | $ | 87,901 | $ | — | $ | 87,901 | |||||||
Equity mutual fund | 507 | — | — | 507 | |||||||||||
Mortgage-backed securities – residential | — | 19,180 | — | 19,180 | |||||||||||
Collateralized mortgage obligations – residential | — | 7,142 | — | 7,142 | |||||||||||
SBA-guaranteed loan participation certificates | — | 23 | — | 23 | |||||||||||
$ | 507 | $ | 114,246 | $ | — | $ | 114,753 | ||||||||
December 31, 2014 | |||||||||||||||
Securities: | |||||||||||||||
Certificates of deposit | $ | — | $ | 86,049 | $ | — | $ | 86,049 | |||||||
Equity mutual fund | 509 | — | — | 509 | |||||||||||
Mortgage-backed securities - residential | — | 24,611 | — | 24,611 | |||||||||||
Collateralized mortgage obligations – residential | — | 9,976 | — | 9,976 | |||||||||||
SBA-guaranteed loan participation certificates | — | 29 | — | 29 | |||||||||||
$ | 509 | $ | 120,665 | $ | — | $ | 121,174 | ||||||||
89
BANKFINANCIAL CORPORATION
NOTES TO CONSOLIDATED FINANCIAL STATEMENTS
(Table amounts in thousands, except share and per share data)
NOTE 17 – FAIR VALUE (continued)
The following table sets forth the Company’s assets that were measured at fair value on a non-recurring basis:
Fair Value Measurement Using | |||||||||||||||
Quoted Prices in Active Markets for Identical Assets (Level 1) | Significant Observable Inputs (Level 2) | Significant Unobservable Inputs (Level 3) | Fair Value | ||||||||||||
December 31, 2015 | |||||||||||||||
Impaired loans: | |||||||||||||||
Multi-family mortgage | $ | — | $ | — | $ | 477 | $ | 477 | |||||||
Nonresidential real estate | — | — | 36 | 36 | |||||||||||
Impaired loans | $ | — | $ | — | $ | 513 | $ | 513 | |||||||
Other real estate owned: | |||||||||||||||
One–to–four family residential real estate | $ | — | $ | — | $ | 42 | $ | 42 | |||||||
Multi-family mortgage | — | — | 354 | 354 | |||||||||||
Nonresidential real estate | — | — | 474 | 474 | |||||||||||
Land | — | — | 794 | 794 | |||||||||||
Other real estate owned | $ | — | $ | — | $ | 1,664 | $ | 1,664 | |||||||
Mortgage servicing rights | $ | — | $ | 281 | $ | — | $ | 281 | |||||||
December 31, 2014 | |||||||||||||||
Impaired loans: | |||||||||||||||
One–to–four family residential real estate | $ | — | $ | — | $ | 70 | $ | 70 | |||||||
Multi-family mortgage | — | — | 1,905 | 1,905 | |||||||||||
Nonresidential real estate | — | — | 2,369 | 2,369 | |||||||||||
Impaired loans | $ | — | $ | — | $ | 4,344 | $ | 4,344 | |||||||
Other real estate owned: | |||||||||||||||
One–to–four family residential real estate | $ | — | $ | — | $ | 55 | $ | 55 | |||||||
Multi-family mortgage | — | — | 1,265 | 1,265 | |||||||||||
Nonresidential real estate | — | — | 126 | 126 | |||||||||||
Land | — | — | 753 | 753 | |||||||||||
Other real estate owned | $ | — | $ | — | $ | 2,199 | $ | 2,199 | |||||||
Mortgage servicing rights | $ | — | $ | 160 | $ | — | $ | 160 | |||||||
90
BANKFINANCIAL CORPORATION
NOTES TO CONSOLIDATED FINANCIAL STATEMENTS
(Table amounts in thousands, except share and per share data)
NOTE 17 – FAIR VALUE (continued)
Impaired loans, which are measured for impairment using the fair value of the collateral for collateral–dependent loans, had a carrying amount of $557,000, with a valuation allowance of $44,000 at December 31, 2015, compared to a carrying amount of $4.8 million and a valuation allowance of $470,000 at December 31, 2014, resulting in a decrease in the provision for loan losses of $426,000 for the year ended December 31, 2015, compared to an increase in the provision for loan losses of $95,000 for the year ended December 31, 2014.
OREO is carried at the lower of cost or fair value less costs to sell, had a carrying value of $2.5 million less a valuation allowance of $881,000, or $1.7 million, at December 31, 2015, compared to $3.0 million less a valuation allowance of $803,000, or $2.2 million at December 31, 2014. There were $548,000 and $438,000 of valuation allowance additions charged to expense of other real estate owned recorded for the years ended December 31, 2015 and 2014, respectively.
Mortgage servicing rights, which are carried at lower of cost or fair value, had a carrying amount of $281,000 at December 31, 2015, and $160,000 at December 31, 2014. A pretax impairment of $3,000 on our mortgage servicing rights portfolio was included in noninterest income for the year ended December 31, 2015, compared to an $8,000 impairment for the same period in 2014.
The following table presents quantitative information, based on certain empirical data with respect to Level 3 fair value measurements for financial instruments measured at fair value on a non-recurring basis at December 31, 2015:
Fair Value | Valuation Technique | Unobservable Input | Range (Weighted Average) | ||||||
Impaired loans | |||||||||
Multi-family mortgage | $ | 477 | Sales comparison | Comparison between sales and income approaches | 39.3% | ||||
Income approach | Cap Rate | 8.75% | |||||||
Nonresidential real estate | 36 | Sales comparison | Comparison between sales and income approaches | 1.2% | |||||
$ | 513 | ||||||||
Other real estate owned | |||||||||
One-to-four family residential real estate | 42 | Sales comparison | Discount applied to valuation | -0.35% to 2.8% (0.03%) | |||||
Multi-family mortgage | 354 | Sales comparison | Comparison between sales and income approaches | -67.74% to 10.37% (-13%) | |||||
Nonresidential real estate | 474 | Sales comparison | Comparison between sales and income approaches | -15.6% to 1.46% (-5%) | |||||
Land | 794 | Sales comparison | Discount applied to valuation | -7.7%-17.24% (6%) | |||||
$ | 1,664 | ||||||||
91
BANKFINANCIAL CORPORATION
NOTES TO CONSOLIDATED FINANCIAL STATEMENTS
(Table amounts in thousands, except share and per share data)
NOTE 17 – FAIR VALUE (continued)
The following table presents quantitative information, based on certain empirical data with respect to Level 3 fair value measurements for financial instruments measured at fair value on a non-recurring basis at December 31, 2014:
Fair Value | Valuation Technique | Unobservable Input | Range (Weighted Average) | ||||||
Impaired loans | |||||||||
One-to-four family residential real estate | $ | 70 | Sales comparison | Discount applied to valuation | 4.8% | ||||
Multi-family mortgage | 1,905 | Sales comparison | Comparison between sales and income approaches | -2.1%-43.7% (41%) | |||||
Income approach | Cap Rate | 9.6% to 13.8% (10%) | |||||||
Nonresidential real estate | 2,369 | Sales comparison | Comparison between sales and income approaches | -2.1%-33.9% (24%) | |||||
Income approach | Cap Rate | 10%-11% (10%) | |||||||
$ | 4,344 | ||||||||
Other real estate owned | |||||||||
One-to-four family residential real estate | $ | 55 | Sales comparison | Discount applied to valuation | 6.3%-7.7% (7%) | ||||
Multi-family mortgage | 1,265 | Sales comparison | Comparison between sales and income approaches | -6.6%-13.5% (0.4%) | |||||
Nonresidential real estate | 126 | Sales comparison | Comparison between sales and income approaches | 32.3% | |||||
Land | 753 | Sales comparison | Discount applied to valuation | -21.9%-4.2% (-10%) | |||||
$ | 2,199 | ||||||||
92
BANKFINANCIAL CORPORATION
NOTES TO CONSOLIDATED FINANCIAL STATEMENTS
(Table amounts in thousands, except share and per share data)
NOTE 17 – FAIR VALUE (continued)
The carrying amount and estimated fair value of financial instruments is as follows:
Fair Value Measurements at December 31, 2015 Using: | |||||||||||||||||||
Carrying Amount | Level 1 | Level 2 | Level 3 | Total | |||||||||||||||
Financial assets | |||||||||||||||||||
Cash and cash equivalents | $ | 59,377 | $ | 13,192 | $ | 46,185 | $ | — | $ | 59,377 | |||||||||
Securities | 114,753 | 507 | 114,246 | — | 114,753 | ||||||||||||||
Loans receivable, net of allowance for loan losses | 1,232,257 | — | 1,240,791 | 513 | 1,241,304 | ||||||||||||||
FHLBC stock | 6,257 | — | — | — | N/A | ||||||||||||||
Accrued interest receivable | 4,226 | — | 4,226 | — | 4,226 | ||||||||||||||
Financial liabilities | |||||||||||||||||||
Noninterest-bearing demand deposits | $ | 254,830 | $ | — | $ | 254,830 | $ | — | $ | 254,830 | |||||||||
Savings deposits | 156,752 | — | 156,752 | — | 156,752 | ||||||||||||||
NOW and money market accounts | 578,636 | — | 578,636 | — | 578,636 | ||||||||||||||
Certificates of deposit | 222,701 | — | 222,026 | — | 222,026 | ||||||||||||||
Borrowings | 64,318 | — | 64,318 | — | 64,318 | ||||||||||||||
Accrued interest payable | 39 | — | 39 | — | 39 | ||||||||||||||
Fair Value Measurements at December 31, 2014 Using: | |||||||||||||||||||
Carrying Amount | Level 1 | Level 2 | Level 3 | Total | |||||||||||||||
Financial assets | |||||||||||||||||||
Cash and cash equivalents | $ | 59,581 | $ | 9,693 | $ | 49,888 | $ | — | $ | 59,581 | |||||||||
Securities | 121,174 | 509 | 120,665 | — | 121,174 | ||||||||||||||
Loans receivable, net of allowance for loan losses | 1,172,356 | — | 1,166,181 | 4,344 | 1,170,525 | ||||||||||||||
FHLBC stock | 6,257 | — | — | — | N/A | ||||||||||||||
Accrued interest receivable | 3,926 | — | 3,926 | — | 3,926 | ||||||||||||||
Financial liabilities | |||||||||||||||||||
Noninterest-bearing demand deposits | $ | 134,129 | $ | — | $ | 134,129 | $ | — | $ | 134,129 | |||||||||
Savings deposits | 154,532 | — | 154,532 | — | 154,532 | ||||||||||||||
NOW and money market accounts | 690,193 | — | 690,193 | — | 690,193 | ||||||||||||||
Certificates of deposit | 232,859 | — | 232,588 | — | 232,588 | ||||||||||||||
Borrowings | 12,921 | — | 12,908 | — | 12,908 | ||||||||||||||
Accrued interest payable | 89 | — | 89 | — | 89 | ||||||||||||||
For purposes of the above, the following assumptions were used:
Cash and Cash Equivalents: The estimated fair values for cash and cash equivalents are based on their carrying value due to the short-term nature of these assets.
93
BANKFINANCIAL CORPORATION
NOTES TO CONSOLIDATED FINANCIAL STATEMENTS
(Table amounts in thousands, except share and per share data)
NOTE 17 – FAIR VALUE (continued)
Loans: The estimated fair value for loans has been determined by calculating the present value of future cash flows based on the current rate the Company would charge for similar loans with similar maturities, applied for an estimated time period until the loan is assumed to be repriced or repaid. The methods utilized to estimate fair value of loans do not necessarily represent an exit price. The estimated fair values of loans held-for-sale are based on outstanding commitments from third party investors.
FHLBC Stock: It is not practicable to determine the fair value of FHLBC stock due to the restrictions placed on its transferability.
Deposit Liabilities: The estimated fair value for certificates of deposit has been determined by calculating the present value of future cash flows based on estimates of rates the Company would pay on such deposits, applied for the time period until maturity. The estimated fair values of noninterest-bearing demand, NOW, money market, and savings deposits are assumed to approximate their carrying values as management establishes rates on these deposits at a level that approximates the local market area. Additionally, these deposits can be withdrawn on demand.
Borrowings: The estimated fair values of advances from the FHLBC and notes payable are based on current market rates for similar financing. The estimated fair value of securities sold under agreements to repurchase is assumed to equal its carrying value due to the short-term nature of the liability.
Accrued Interest: The estimated fair values of accrued interest receivable and payable are assumed to equal their carrying value.
Off-Balance-Sheet Instruments: Off-balance-sheet items consist principally of unfunded loan commitments, standby letters of credit, and unused lines of credit. The estimated fair values of unfunded loan commitments, standby letters of credit, and unused lines of credit are not material.
While the above estimates are based on management’s judgment of the most appropriate factors, as of the balance sheet date, there is no assurance that the estimated fair values would have been realized if the assets were disposed of or the liabilities settled at that date, since market values may differ depending on the various circumstances. The estimated fair values would also not apply to subsequent dates.
In addition, other assets and liabilities that are not financial instruments, such as premises and equipment, are not included in the above disclosures.
NOTE 18 – COMPANY ONLY CONDENSED FINANCIAL INFORMATION
Condensed financial information of BankFinancial Corporation as of December 31, 2015 and 2014 and for the three years ended December 31, 2015 follows:
Condensed Statements of Financial Condition
December 31, | |||||||
2015 | 2014 | ||||||
Assets | |||||||
Cash in subsidiary | $ | 15,309 | $ | 9,724 | |||
Loan receivable from ESOP | 11,799 | 12,791 | |||||
Investment in subsidiary | 183,039 | 192,182 | |||||
Deferred tax asset | 1,865 | 1,082 | |||||
Other assets | 352 | 342 | |||||
$ | 212,364 | $ | 216,121 | ||||
Liabilities and Stockholders' Equity | |||||||
Total stockholders’ equity | $ | 212,364 | $ | 216,121 | |||
94
BANKFINANCIAL CORPORATION
NOTES TO CONSOLIDATED FINANCIAL STATEMENTS
(Table amounts in thousands, except share and per share data)
NOTE 18 – COMPANY ONLY CONDENSED FINANCIAL INFORMATION (continued)
Condensed Statements of Operations
For the years ended December 31, | |||||||||||
2015 | 2014 | 2013 | |||||||||
Interest income | $ | 544 | $ | 584 | $ | 623 | |||||
Dividends from subsidiary | 19,710 | — | — | ||||||||
Other expense | 1,536 | 1,451 | 1,473 | ||||||||
Income (loss) before income tax and undistributed subsidiary income | 18,718 | (867 | ) | (850 | ) | ||||||
Income tax benefit | (783 | ) | (1,082 | ) | — | ||||||
Income (loss) before equity in undistributed subsidiary income | 19,501 | 215 | (850 | ) | |||||||
Equity in undistributed subsidiary excess distributions | (10,826 | ) | 40,399 | 4,148 | |||||||
Net income | $ | 8,675 | $ | 40,614 | $ | 3,298 | |||||
Condensed Statements of Cash Flows
For the years ended December 31, | |||||||||||
2015 | 2014 | 2013 | |||||||||
Cash flows from operating activities | |||||||||||
Net income | $ | 8,675 | $ | 40,614 | $ | 3,298 | |||||
Adjustments: | |||||||||||
Equity in undistributed subsidiary excess distributions | 10,826 | (40,399 | ) | (4,148 | ) | ||||||
Change in other assets | (793 | ) | (1,172 | ) | 373 | ||||||
Change in accrued expenses and other liabilities | — | (23 | ) | 2 | |||||||
Net cash from (used in) operating activities | 18,708 | (980 | ) | (475 | ) | ||||||
Cash flows from investing activities | |||||||||||
Principal payments received on ESOP loan | 992 | 951 | 912 | ||||||||
Net cash from investing activities | 992 | 951 | 912 | ||||||||
Cash flows from financing activities | |||||||||||
Repurchase and retirement of common stock | (9,970 | ) | — | — | |||||||
Cash dividends paid on common stock | (4,145 | ) | (1,688 | ) | (844 | ) | |||||
Net cash used in financing activities | (14,115 | ) | (1,688 | ) | (844 | ) | |||||
Net change in cash in subsidiary | 5,585 | (1,717 | ) | (407 | ) | ||||||
Beginning cash in subsidiary | 9,724 | 11,441 | 11,848 | ||||||||
Ending cash in subsidiary | $ | 15,309 | $ | 9,724 | $ | 11,441 | |||||
95
BANKFINANCIAL CORPORATION
NOTES TO CONSOLIDATED FINANCIAL STATEMENTS
(Table amounts in thousands, except share and per share data)
NOTE 19 – SELECTED QUARTERLY FINANCIAL DATA (unaudited)
For the year ended December 31, 2015 | |||||||||||||||
First Quarter | Second Quarter | Third Quarter | Fourth Quarter | ||||||||||||
Interest income | $ | 12,211 | $ | 12,193 | $ | 12,147 | $ | 12,411 | |||||||
Interest expense | 686 | 691 | 699 | 738 | |||||||||||
Net interest income | 11,525 | 11,502 | 11,448 | 11,673 | |||||||||||
Recovery of loan losses | (724 | ) | (488 | ) | (956 | ) | (1,038 | ) | |||||||
Net interest income | 12,249 | 11,990 | 12,404 | 12,711 | |||||||||||
Noninterest income | 1,536 | 1,689 | 1,709 | 1,757 | |||||||||||
Noninterest expense | 10,513 | 10,031 | 10,232 | 11,169 | |||||||||||
Income before income taxes | 3,272 | 3,648 | 3,881 | 3,299 | |||||||||||
Income tax expense | 1,286 | 1,424 | 1,532 | 1,183 | |||||||||||
Net income | $ | 1,986 | $ | 2,224 | $ | 2,349 | $ | 2,116 | |||||||
Basic earnings per common share | $ | 0.10 | $ | 0.11 | $ | 0.12 | $ | 0.11 | |||||||
Diluted earnings per common share | $ | 0.10 | $ | 0.11 | $ | 0.12 | $ | 0.11 | |||||||
The Company recorded net income of $2.1 million, or $0.11 per common share, for the fourth quarter of 2015. The Company’s net interest income before provision for loan losses increased to $11.7 million due to stronger loan originations and improved asset quality. The Company’s fourth quarter 2015 operating results included a $1.0 million recovery of loan losses. The primary reasons for this decrease was the growth in our loan portfolio focused on loan types with lower loss ratios based on our historical loss experience, and improvements in the historical loan loss factors that occurred as the losses incurred in earlier periods aged and thus were either eliminated from the calculation or assigned a lower weight. Noninterest expense included $522,000 of nonperforming asset management and OREO expense.
For the year ended December 31, 2014 | |||||||||||||||
First Quarter | Second Quarter | Third Quarter | Fourth Quarter | ||||||||||||
Interest income | $ | 12,086 | $ | 12,482 | $ | 12,368 | $ | 12,413 | |||||||
Interest expense | 812 | 774 | 746 | 714 | |||||||||||
Net interest income | 11,274 | 11,708 | 11,622 | 11,699 | |||||||||||
Provision for (recovery of) loan losses | 476 | 957 | (1,413 | ) | (756 | ) | |||||||||
Net interest income | 10,798 | 10,751 | 13,035 | 12,455 | |||||||||||
Noninterest income | 1,532 | 1,660 | 1,748 | 1,769 | |||||||||||
Noninterest expense | 11,371 | 10,982 | 11,157 | 10,941 | |||||||||||
Income before income taxes | 959 | 1,429 | 3,626 | 3,283 | |||||||||||
Income tax expense (benefit) | 17 | 25 | 36 | (31,395 | ) | ||||||||||
Net income | $ | 942 | $ | 1,404 | $ | 3,590 | $ | 34,678 | |||||||
Basic earnings per common share | $ | 0.05 | $ | 0.07 | $ | 0.17 | $ | 1.72 | |||||||
Diluted earnings per common share | $ | 0.05 | $ | 0.07 | $ | 0.17 | $ | 1.72 | |||||||
The Company recorded net income of $34.7 million, or $1.72 per common share, for the fourth quarter of 2014. The Company’s fourth quarter 2014 operating results include a full recovery of the deferred tax valuation allowance of $35.1 million. The Company’s net interest income before provision for loan losses increased to $11.7 million due to stronger loan originations and improved asset quality. The Company’s fourth quarter 2014 operating results included a $756,000 recovery of loan losses. Noninterest expense included $467,000 of nonperforming asset management and OREO expense.
96
ITEM 9. | CHANGES IN AND DISAGREEMENTS WITH ACCOUNTANTS ON ACCOUNTING AND FINANCIAL DISCLOSURE |
None.
ITEM 9A. | CONTROLS AND PROCEDURES |
(a) Evaluation of disclosure controls and procedures.
Under the supervision and with the participation of our management, including our Principal Executive Officer and Principal Financial Officer, we evaluated the effectiveness of the design and operation of our disclosure controls and procedures (as defined in Rule 13a-15(e) and 15d-15(e) under the Exchange Act) as of the end of the fiscal year ( “Evaluation Date”). Based upon that evaluation, the Principal Executive Officer and Principal Financial Officer concluded that, as of the Evaluation Date, our disclosure controls and procedures were effective.
(b) Management’s Annual Report on Internal Control Over Financial Reporting.
The annual report of management on the effectiveness of our internal control over financial reporting and the attestation report thereon issued by our independent registered public accounting firm are set forth under “Report of Management on Internal Control Over Financial Reporting” and “Report of Independent Registered Public Accounting Firm on Internal Control Over Financial Reporting” under Item 8 “Financial Statements and Supplementary Data.”
(c) Changes in internal controls.
There were no changes made in our internal controls during the fourth quarter of 2015 or, to our knowledge, in other factors that have materially affected, or are reasonably likely to materially affect, these controls.
See the Certifications pursuant to Section 302 of the Sarbanes-Oxley Act of 2002.
ITEM 9B. | OTHER INFORMATION |
Not Applicable.
PART III
ITEM 10. | DIRECTORS, EXECUTIVE OFFICERS AND CORPORATE GOVERNANCE |
Directors and Executive Officers
The information concerning our directors and executive officers required by this item will be filed with the Securities and Exchange Commission by amendment to this Form 10-K, not later than 120 days after the end of our fiscal year.
Section 16(a) Beneficial Ownership Reporting Compliance
The information concerning compliance with the reporting requirements of Section 16(a) of the Securities Exchange Act of 1934 by our directors, officers and 10 percent stockholders required by this item will be filed with the Securities and Exchange Commission by amendment to this Form 10-K, not later than 120 days after the end of our fiscal year.
Code of Ethics
We have adopted a Code of Ethics for Senior Financial Officers that applies to our principal executive officer, principal financial officer, principal accounting officer, and persons performing similar functions. A copy of our Code of Ethics was attached as Exhibit 14 to our Annual Report on Form 10-K filed with the Securities and Exchange Commission on March 27, 2006. We have also adopted a Code of Business Conduct, pursuant to NASDAQ requirements, that applies generally to our directors, officers, and employees.
ITEM 11. | EXECUTIVE COMPENSATION |
The information concerning compensation required by this item will be filed with the Securities and Exchange Commission by amendment to this Form 10-K, not later than 120 days after the end of our fiscal year.
97
ITEM 12. | SECURITY OWNERSHIP OF CERTAIN BENEFICIAL OWNERS AND MANAGEMENT AND RELATED STOCKHOLDER MATTERS |
The information concerning security ownership of certain beneficial owners and management required by this item will be filed with the Securities and Exchange Commission by amendment to this Form 10-K, not later than 120 days after the end of our fiscal year.
Securities Authorized for Issuance under Equity Compensation Plans
The following table sets forth information regarding the securities that were authorized for issuance under our 2006 Equity Incentive Plan as of December 31, 2015:
Column (A) | Column (B) | Column (C) | ||||||||
Plan Category | Number of Securities to be Issued Upon Exercise of Outstanding Options, Warrants and Rights | Weighted-Average Exercise Price of Outstanding Options, Warrants and Rights | Number of Securities Remaining Available for Future Issuance under 2006 Equity Incentive Plan (Excluding Securities Reflected in Column (A)) | |||||||
Equity compensation plans approved by stockholders | 1,760,090 | $ | 12.30 | 798,269 | ||||||
Equity compensation plans not approved by stockholders | — | — | — | |||||||
Total | 1,760,090 | $ | 12.30 | 798,269 | ||||||
Column (A) represents stock options and restricted stock outstanding under the Company’s 2006 Equity Incentive Plan. Future equity awards under the 2006 Equity Incentive Plan may take the form of stock options, stock appreciation rights, performance unit awards, restricted stock, restricted performance stock, restricted stock units, stock awards or cash. Column (B) represents the weighted-average exercise price of the outstanding stock options only; the outstanding restricted stock awards are not included in this calculation. Column (C) represents the maximum aggregate number of future equity awards that can be made under the 2006 Equity Incentive Plan as of December 31, 2015.
ITEM 13. | CERTAIN RELATIONSHIPS AND RELATED TRANSACTIONS, AND DIRECTOR INDEPENDENCE |
The information concerning certain relationships and related transactions required by this will be filed with the Securities and Exchange Commission by amendment to this Form 10-K, not later than 120 days after the end of our fiscal year.
ITEM 14. | PRINCIPAL ACCOUNTANT FEES AND SERVICES |
The information concerning principal accountant fees and services will be filed with the Securities and Exchange Commission by amendment to this Form 10-K, not later than 120 days after the end of our fiscal year.
PART IV
ITEM 15. EXHIBITS AND FINANCIAL STATEMENT SCHEDULES
(a)(1) Financial Statements
The following consolidated financial statement of the registrant and its subsidiaries are filed as part of this document under Item 8 - “Financial Statements and Supplementary Data.”
(A) | Report of Independent Registered Accounting Firm |
(B) | Consolidated Statements of Financial Condition at December 31, 2015 and 2014 |
(C) | Consolidated Statements of Operations for the years ended December 31, 2015, 2014 and 2013 |
(D) | Consolidated Statements of Comprehensive Income for the years ended December 31, 2015, 2014 and 2013 |
(E) | Consolidated Statements of Changes in Stockholders’ Equity for the years ended December 31, 2015, 2014 and 2013 |
(F) | Consolidated Statements of Cash Flows for the years ended December 31, 2015, 2014 and 2013 |
(G) | Notes to Consolidated Financial Statements |
(a)(2) Financial Statement Schedules
98
None.
(a)(3) Exhibits
The documents set forth below are filed herewith or incorporated herein by reference to the location indicated.
Exhibit | Location | |||
3.1 | Articles of Incorporation of BankFinancial Corporation | Exhibit 3.1 to the Registration Statement on Form S-1 of the Company, originally filed with the Securities and Exchange Commission on September 23, 2004 | ||
3.2 | Bylaws of BankFinancial Corporation | Exhibit 3.2 to the Registration Statement on Form S-1 of the Company, originally filed with the Securities and Exchange Commission on September 23, 2004 | ||
3.3 | Articles of Amendment to Charter of BankFinancial Corporation | Exhibit 3.3 to the Registration Statement on Form S-1 of the Company, originally filed with the Securities and Exchange Commission on September 23, 2004 | ||
3.4 | Restated Bylaws of BankFinancial Corporation | Exhibit 3.1 to the Report on Form 8-K of the Company, originally filed with the Securities and Exchange Commission on November 4, 2014 | ||
4 | Form of Common Stock Certificate of BankFinancial Corporation | Exhibit 4 to the Registration Statement on Form S-1 of the Company, originally filed with the Securities and Exchange Commission on September 23, 2004 | ||
10.1 | Employee Stock Ownership Plan | Exhibit 10.1 to the Registration Statement on Form S-1 of the Company, originally filed with the Securities and Exchange Commission on September 23, 2004 | ||
10.2 | BankFinancial FSB Employment Agreement with F. Morgan Gasior | Exhibit 10.1 to the Current Report on Form 8-K of the Company, originally filed with the Securities and Exchange Commission on May 5, 2008 | ||
10.3 | BankFinancial FSB Employment Agreement with James J. Brennan | Exhibit 10.3 to the Current Report on Form 8-K of the Company, originally filed with the Securities and Exchange Commission on May 5, 2008. | ||
10.4 | BankFinancial FSB Employment Agreement with Paul A. Cloutier | Exhibit 10.2 to the Current Report on Form 8-K of the Company, originally filed with the Securities and Exchange Commission on May 5, 2008 | ||
10.5 | Form of Incentive Stock Option Award Terms | Exhibit 10.1 to the Report on Form 8-K of the Company, originally filed with the Securities and Exchange Commission on September 5, 2006 | ||
10.6 | 2006 BankFinancial Corporation Equity Incentive Plan | Appendix C to the Definitive Form 14A, originally filed with the Securities and Exchange Commission on May 25, 2006 (File No. 000-51331) | ||
10.7 | Form of Performance Based Incentive Stock Option Award Terms | Exhibit 10.2 to the Report on Form 8-K of the Company, originally filed with the Securities and Exchange Commission on September 5, 2006 | ||
10.8 | Form of Non-Qualified Stock Option Award Terms | Exhibit 10.3 to the Report on Form 8-K of the Company, originally filed with the Securities and Exchange Commission on September 5, 2006 | ||
10.9 | Form of Performance Based Non-Qualified Stock Option Award Terms | Exhibit 10.4 to the Report on Form 8-K of the Company, originally filed with the Securities and Exchange Commission on September 5, 2006 | ||
10.10 | Form of Restricted Stock Unit Award Agreement | Exhibit 10.5 to the Report on Form 8-K of the Company, originally filed with the Securities and Exchange Commission on September 5, 2006 | ||
10.11 | Form of Performance Based Restricted Stock Award Agreement | Exhibit 10.6 to the Report on Form 8-K of the Company, originally filed with the Securities and Exchange Commission on September 5, 2006 | ||
99
Exhibit | Location | |||
10.12 | Form of Restricted Stock Award Agreement | Exhibit 10.7 to the Report on Form 8-K of the Company, originally filed with the Securities and Exchange Commission on September 5, 2006 | ||
10.13 | Form of Stock Appreciation Rights Agreement | Exhibit 10.8 to the Report on Form 8-K of the Company, originally filed with the Securities and Exchange Commission on September 5, 2006 | ||
10.14 | BankFinancial Corporation Employment Agreement with F. Morgan Gasior | Exhibit 10.1 to the Report on Form 8-K of the Company, originally filed with the Securities and Exchange Commission on October 20, 2008 | ||
10.15 | BankFinancial Corporation Employment Agreement with Paul A. Cloutier | Exhibit 10.2 to the Report on Form 8-K of the Company, originally filed with the Securities and Exchange Commission on October 20, 2008 | ||
10.16 | BankFinancial Corporation Employment Agreement with James J. Brennan | Exhibit 10.3 to the Report on Form 8-K of the Company, originally filed with the Securities and Exchange Commission on October 20, 2008. | ||
10.17 | BankFinancial Corporation Employment Agreement with Elizabeth A. Doolan | Exhibit 10.28 to the Annual Report on Form 10-K of the Company, originally filed with the Securities and Exchange Commission on February 23, 2009. | ||
10.18 | BankFinancial FSB Employment Agreement with Elizabeth A. Doolan | Exhibit 10.29 to the Annual Report on Form 10-K of the Company, originally filed with the Securities and Exchange Commission on February 23, 2009. | ||
10.19 | BankFinancial FSB Employment Agreement with Gregg T. Adams | Exhibit 10.30 to the Annual Report on Form 10-K/A of the Company originally filed with the Securities and Exchange Commission on April 30, 2010. | ||
10.20 | BankFinancial FSB Employment Agreement with John G. Manos | Exhibit 10.31 to the Annual Report on Form 10-K/A of the Company originally filed with the Securities and Exchange Commission on April 30, 2010. | ||
10.21 | Form of Amendment No. 1 to BankFinancial FSB Employment Agreement | Exhibit 10.33 to the Annual Report on Form 10-K of the Company, originally filed with the Securities and Exchange Commission on March 11, 2013 | ||
10.22 | Form of Amendment No. 1 to BankFinancial FSB Employment Agreement | Exhibit 10.34 to the Annual Report on Form 10-K of the Company, originally filed with the Securities and Exchange Commission on March 11, 2013 | ||
10.23 | Form of Amendment No. 1 to BankFinancial Corporation Employment Agreement | Exhibit 10.35 to the Annual Report on Form 10-K of the Company, originally filed with the Securities and Exchange Commission on March 11, 2013 | ||
10.24 | Amended and Restated BankFinancial FSB Employment Agreement with William J. Deutsch, Jr. | Exhibit 10.3 to the Report on Form 8-K of the Company, originally filed with the Securities and Exchange Commission on May 20, 2013 | ||
10.25 | Form of Extension of Term of Employment Period, for Named Executive Officers of BankFinancial Corporation (pursuant to terms of existing agreements) | Exhibit 10.1 to the Report on Form 8-K of the Company, originally filed with the Securities and Exchange Commission on June 25, 2014 | ||
10.26 | Form of Extension of Term of Employment Period, for Named Executive Officers of BankFinancial FSB (pursuant to terms of existing agreements) | Exhibit 10.1 to the Report on Form 8-K of the Company, originally filed with the Securities and Exchange Commission on November 4, 2014 | ||
10.27 | Consulting Agreement with former Executive Christa N. Calabrese, effective March 31, 2014, lasts 12 months | Exhibit 10.2 to the Report on Form 8-K of the Company, originally filed with the Securities and Exchange Commission on April 2, 2014 | ||
14 | Code of Ethics for Senior Financial Officers | Exhibit 14 to the Annual Report on Form 10-K of the Company, originally filed with the Securities and Exchange Commission on March 27, 2006 | ||
21 | Subsidiaries of Registrant | Exhibit 21 to the Registration Statement on Form S-1 of the Company, originally filed with the Securities and Exchange Commission on September 23, 2004 | ||
23 | Consent of Crowe Horwath LLP | Filed herewith | ||
100
Exhibit | Location | |||
31.1 | Certification of Chief Executive Officer pursuant to Section 302 of the Sarbanes-Oxley Act of 2002 | Filed herewith | ||
31.2 | Certification of Chief Financial Officer pursuant to Section 302 of the Sarbanes-Oxley Act of 2002 | Filed herewith | ||
32 | Certification of Chief Executive Officer and Chief Financial Officer pursuant to Section 906 of the Sarbanes-Oxley Act of 2002* | Furnished herewith | ||
101 | The following financial statements from the BankFinancial Corporation Quarterly Report on Form 10-K for the year ended December 31, 2015, formatted in Extensive Business Reporting Language (XBRL): (i) consolidated statements of financial condition, (ii) consolidated statements of operations, (iii) consolidated statements of comprehensive income, (iv)consolidated statements of changes in stockholders' equity, (v)consolidated statements of cash flows and (vi) the notes to consolidated financial statements. | Filed herewith | ||
* | A signed original of this written statement required by Section 906 has been provided to the Company and will be retained by the Company and furnished to the Securities and Exchange Commission or its staff upon request. |
101
SIGNATURES
Pursuant to the requirements of Section 13 or 15(d) of the Securities Exchange Act of 1934, the Registrant has duly caused this report to be signed on its behalf by the undersigned, thereunto duly authorized.
BANKFINANCIAL CORPORATION | |||
Date: | February 10, 2016 | By: | /s/ F. Morgan Gasior |
F. Morgan Gasior | |||
Chairman of the Board, Chief Executive Officer and President | |||
(Duly Authorized Representative) | |||
Pursuant to the requirements of the Securities Exchange of 1934, this report has been signed below by the following persons on behalf of the Registrant and in the capacities and on the dates indicated.
Signatures | Title | Date | ||
/s/ F. Morgan Gasior | Chairman of the Board, Chief Executive Officer and President | February 10, 2016 | ||
F. Morgan Gasior | (Principal Executive Officer) | |||
/s/ Paul A. Cloutier | Executive Vice President and Chief Financial Officer | February 10, 2016 | ||
Paul A. Cloutier | (Principal Financial Officer) | |||
/s/ Elizabeth A. Doolan | Senior Vice President and Controller | February 10, 2016 | ||
Elizabeth A. Doolan | (Principal Accounting Officer) | |||
/s/ Cassandra J. Francis | Director | February 10, 2016 | ||
Cassandra J. Francis | ||||
/s/ John M. Hausmann | Director | February 10, 2016 | ||
John M. Hausmann | ||||
/s/ Thomas F. O'Neill | Director | February 10, 2016 | ||
Thomas F. O'Neill | ||||
/s/ John W. Palmer | Director | February 10, 2016 | ||
John W. Palmer | ||||
/s/ Terry R. Wells | Director | February 10, 2016 | ||
Terry R. Wells | ||||
/s/ Glen R. Wherfel | Director | February 10, 2016 | ||
Glen R. Wherfel | ||||
102