Attached files
| file | filename |
|---|---|
| 8-K - 8-K - SEACOR HOLDINGS INC /NEW/ | a8-krestifelpresentation.htm |
STIFEL 2016 TRANSPORTATION & LOGISTICS CONFERENCE CHARLES FABRIKANT EXECUTIVE CHAIRMAN AND CHIEF EXECUTIVE OFFICER February 9, 2016
Forward-Looking Statement This presentation includes “forward-looking statements” within the meaning of the Private Securities Litigation Reform Act of 1995. Certain statements discussed in this presentation as well as in other reports, materials and oral statements that the SEACOR Holdings Inc. (“Company”) releases from time to time constitute “forward-looking statements” within the meaning of the Private Securities Litigation Reform Act of 1995. Generally, words such as “anticipate,” “estimate,” “expect,” “project,” “intend,” “believe,” “plan,” “target,” “forecast” and similar expressions are intended to identify forward-looking statements. Such forward-looking statements concern management's expectations, strategic objectives, business prospects, anticipated economic performance and financial condition and other similar matters. These statements are not guarantees of future performance and actual events or results may differ significantly from these statements. Actual events or results are subject to significant known and unknown risks, uncertainties and other important factors, including decreased demand and loss of revenues as a result of a decline in the price of oil and an oversupply of newly built offshore support vessels, additional safety and certification requirements for drilling activities in the U.S. Gulf of Mexico and delayed approval of applications for such activities, the possibility of U.S. government implemented moratoriums directing operators to cease certain drilling activities in the U.S. Gulf of Mexico and any extension of such moratoriums (the “Moratoriums”), weakening demand for the Company’s services as a result of unplanned customer suspensions, cancellations, rate reductions or non-renewals of vessel charters or failures to finalize commitments to charter vessels in response to a decline in the price of oil, an oversupply of newly built offshore support vessels and Moratoriums, increased government legislation and regulation of the Company’s businesses could increase cost of operations, increased competition if the Jones Act is repealed, liability, legal fees and costs in connection with the provision of emergency response services, including the Company’s involvement in response to the oil spill as a result of the sinking of the Deepwater Horizon in April 2010, decreased demand for the Company’s services as a result of declines in the global economy, declines in valuations in the global financial markets and a lack of liquidity in the credit sectors, including, interest rate fluctuations, availability of credit, inflation rates, change in laws, trade barriers, commodity prices and currency exchange fluctuations, the cyclical nature of the oil and gas industry, activity in foreign countries and changes in foreign political, military and economic conditions, changes in foreign and domestic oil and gas exploration and production activity, safety record requirements related to Offshore Marine Services and Shipping Services, decreased demand for Shipping Services due to construction of additional refined petroleum product, natural gas or crude oil pipelines or due to decreased demand for refined petroleum products, crude oil or chemical products or a change in existing methods of delivery, compliance with U.S. and foreign government laws and regulations, including environmental laws and regulations and economic sanctions, the dependence of Offshore Marine Services, Inland River Services, Shipping Services and Illinois Corn Processing on several customers, consolidation of the Company's customer base, the ongoing need to replace aging vessels, industry fleet capacity, restrictions imposed by the Shipping Acts on the amount of foreign ownership of the Company's Common Stock, operational risks of Offshore Marine Services, Inland River Services and Shipping Services, effects of adverse weather conditions and seasonality, the level of grain export volume, the effect of fuel prices on barge towing costs, variability in freight rates for inland river barges, the effect of international economic and political factors on Inland River Services' operations, the effect of the spread between the input costs of corn and natural gas compared with the price of alcohol and distillers grains on Illinois Corn Processing's operations, adequacy of insurance coverage, the potential for a material weakness in the Company's internal controls over financial reporting and the Company's ability to remediate such potential material weakness, the attraction and retention of qualified personnel by the Company, and various other matters and factors, many of which are beyond the Company's control as well as those discussed in Item 1A (Risk Factors) of the Company's Annual report on Form 10-K. In addition, these statements constitute the Company's cautionary statements under the Private Securities Litigation Reform Act of 1995. It should be understood that it is not possible to predict or identify all such factors. Consequently, the preceding should not be considered to be a complete discussion of all potential risks or uncertainties. Forward-looking statements speak only as of the date of the document in which they are made. The Company disclaims any obligation or undertaking to provide any updates or revisions to any forward-looking statement to reflect any change in the Company's expectations or any change in events, conditions or circumstances on which the forward-looking statement is based, except as required by law. The forward- looking statements in this presentation should be evaluated together with the many uncertainties that affect the Company’s businesses, particularly those mentioned under “Forward-Looking Statements” in Item 7 on the Company’s Form 10-K and SEACOR’s periodic reporting on Form 8-K (if any), which are incorporated by reference. 2
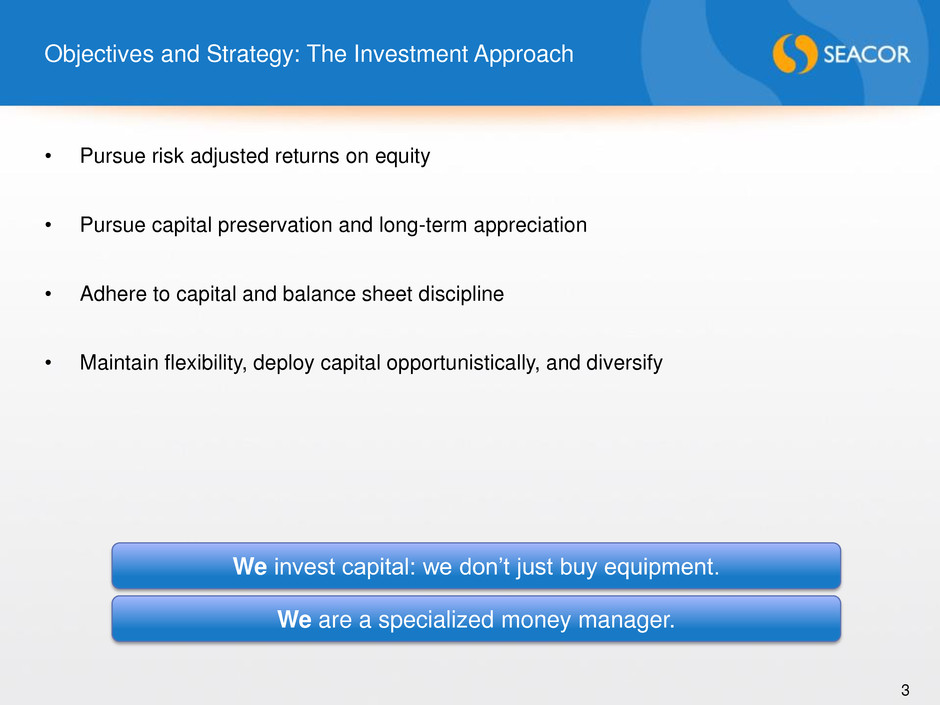
Objectives and Strategy: The Investment Approach 3 • Pursue risk adjusted returns on equity • Pursue capital preservation and long-term appreciation • Adhere to capital and balance sheet discipline • Maintain flexibility, deploy capital opportunistically, and diversify We are a specialized money manager. We invest capital: we don’t just buy equipment.
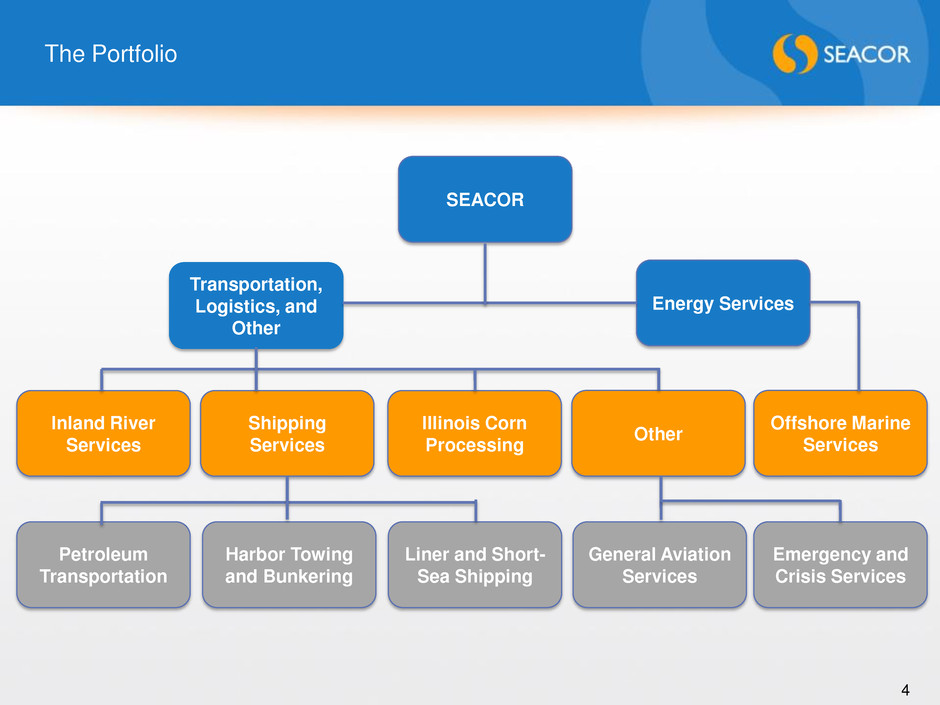
The Portfolio 4 Transportation, Logistics, and Other SEACOR Energy Services Offshore Marine Services Shipping Services Inland River Services Petroleum Transportation Harbor Towing and Bunkering Liner and Short- Sea Shipping Illinois Corn Processing Other Emergency and Crisis Services General Aviation Services
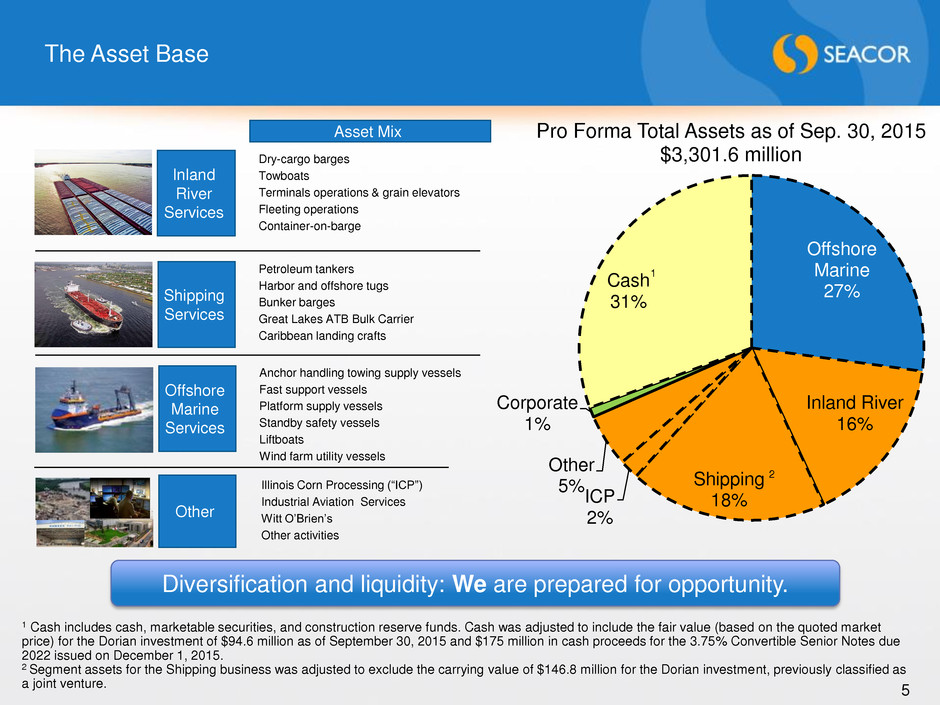
The Asset Base 5 Asset Mix Offshore Marine Services Anchor handling towing supply vessels Fast support vessels Platform supply vessels Standby safety vessels Liftboats Wind farm utility vessels Inland River Services Dry-cargo barges Towboats Terminals operations & grain elevators Fleeting operations Container-on-barge Shipping Services Petroleum tankers Harbor and offshore tugs Bunker barges Great Lakes ATB Bulk Carrier Caribbean landing crafts Other Illinois Corn Processing (“ICP”) Industrial Aviation Services Witt O’Brien’s Other activities Offshore Marine 27% Inland River 16% Shipping 18% ICP 2% Other 5% Corporate 1% Cash 31% Pro Forma Total Assets as of Sep. 30, 2015 $3,301.6 million Diversification and liquidity: We are prepared for opportunity. 1 Cash includes cash, marketable securities, and construction reserve funds. Cash was adjusted to include the fair value (based on the quoted market price) for the Dorian investment of $94.6 million as of September 30, 2015 and $175 million in cash proceeds for the 3.75% Convertible Senior Notes due 2022 issued on December 1, 2015. 2 Segment assets for the Shipping business was adjusted to exclude the carrying value of $146.8 million for the Dorian investment, previously classified as a joint venture. 1 2
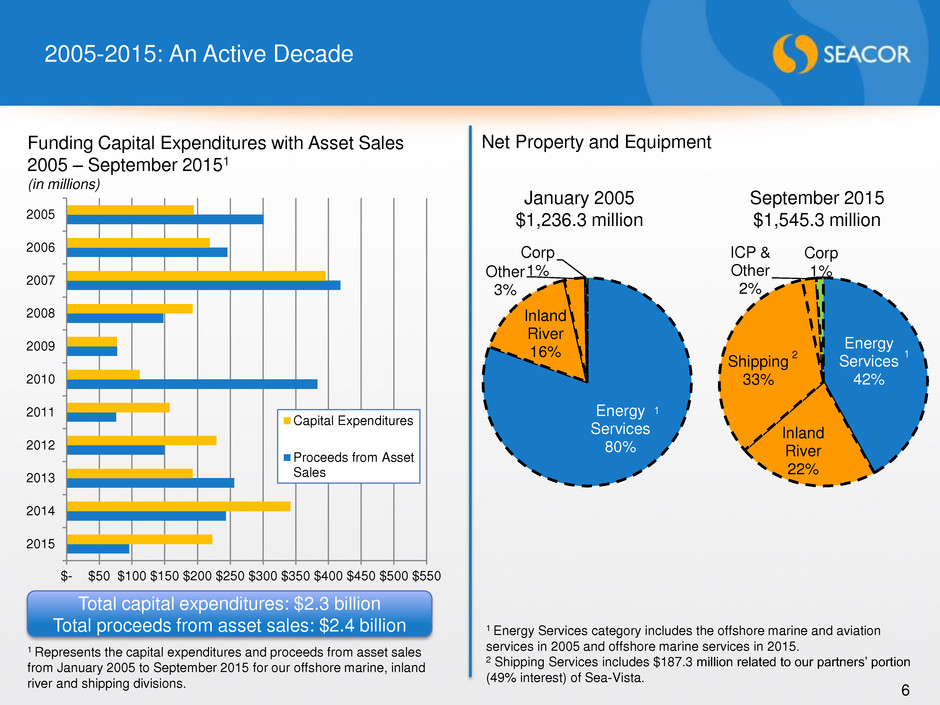
2005-2015: An Active Decade 6 Energy Services 42% Inland River 22% Shipping 33% ICP & Other 2% Corp 1% Net Property and Equipment September 2015 $1,545.3 million 2 1 Energy Services category includes the offshore marine and aviation services in 2005 and offshore marine services in 2015. 2 Shipping Services includes $187.3 million related to our partners’ portion (49% interest) of Sea-Vista. Energy Services 80% Inland River 16% Other 3% Corp 1% 1 1 Funding Capital Expenditures with Asset Sales 2005 – September 20151 (in millions) $- $50 $100 $150 $200 $250 $300 $350 $400 $450 $500 $550 2015 2014 2013 2012 2011 2010 2009 2008 2007 2006 2005 Capital Expenditures Proceeds from Asset Sales 1 Represents the capital expenditures and proceeds from asset sales from January 2005 to September 2015 for our offshore marine, inland river and shipping divisions. Total capital expenditures: $2.3 billion Total proceeds from asset sales: $2.4 billion January 2005 $1,236.3 million
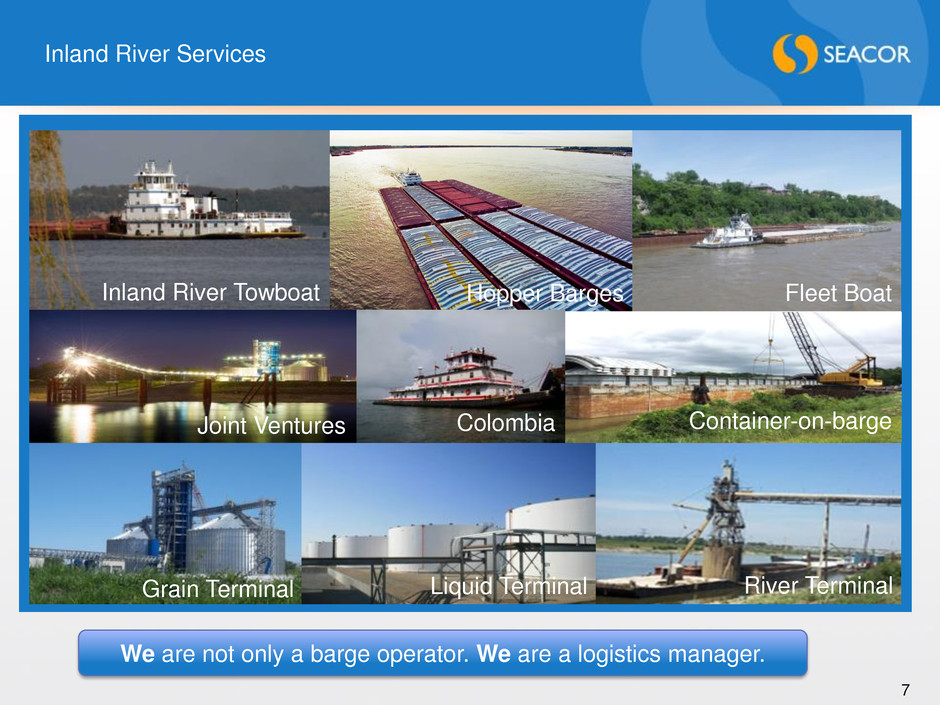
Inland River Services 7 Inland River Towboat Hopper Barges Fleet Boat Grain Terminal Liquid Terminal River Terminal Container-on-barge Joint Ventures Colombia We are not only a barge operator. We are a logistics manager.
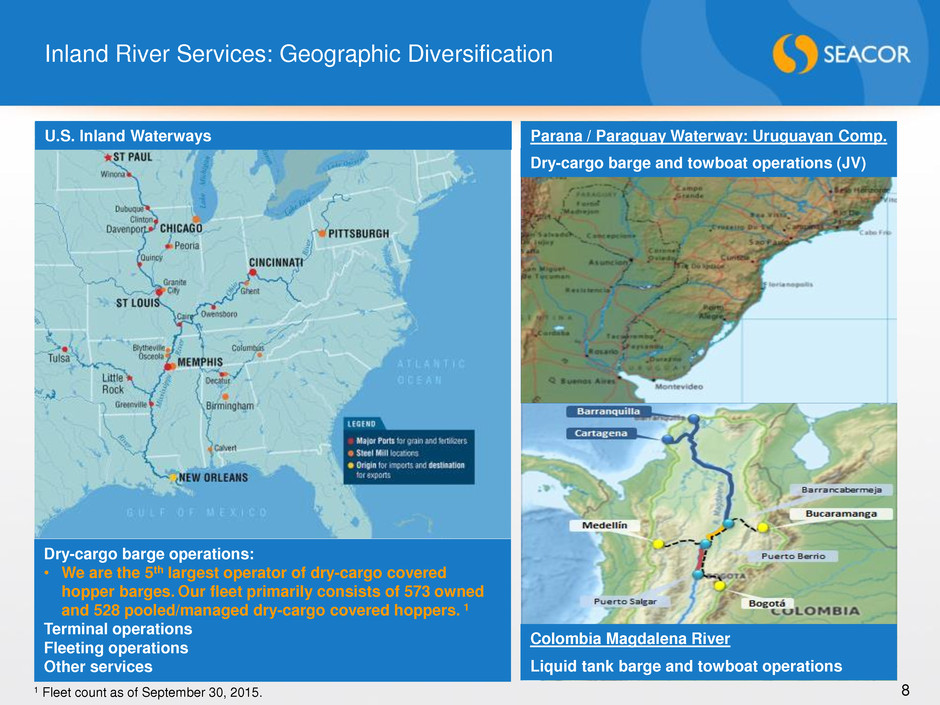
Inland River Services: Geographic Diversification 8 U.S. Inland Waterways Parana / Paraguay Waterway: Uruguayan Comp. Colombia Magdalena River Liquid tank barge and towboat operations Dry-cargo barge and towboat operations (JV) Dry-cargo barge operations: • We are the 5th largest operator of dry-cargo covered hopper barges. Our fleet primarily consists of 573 owned and 528 pooled/managed dry-cargo covered hoppers. 1 Terminal operations Fleeting operations Other services 1 Fleet count as of September 30, 2015.
Inland River Services: Market Drivers and Opportunities 9 • Market Drivers: – Dry-Cargo Barge Operations: agricultural exports, fertilizer movements, and industrial activity – Terminal Operations (St. Louis): demand for storage, rail moves, and redistribution of bulk commodities, petroleum and ethanol • Primary Revenue Source: Spot Activity, Terminal Rental and Related Services • Opportunities: – Consolidate markets in the United States and/or Latin America – Acquire equipment at favorable prices – Reduce dependence on third party barges and towboats – Capitalize on shipyard availability: pursue innovation in boat design Industry Covered Hopper Fleet: 11,686 barges1 1 Informa Economics, Inc. (March 2015).
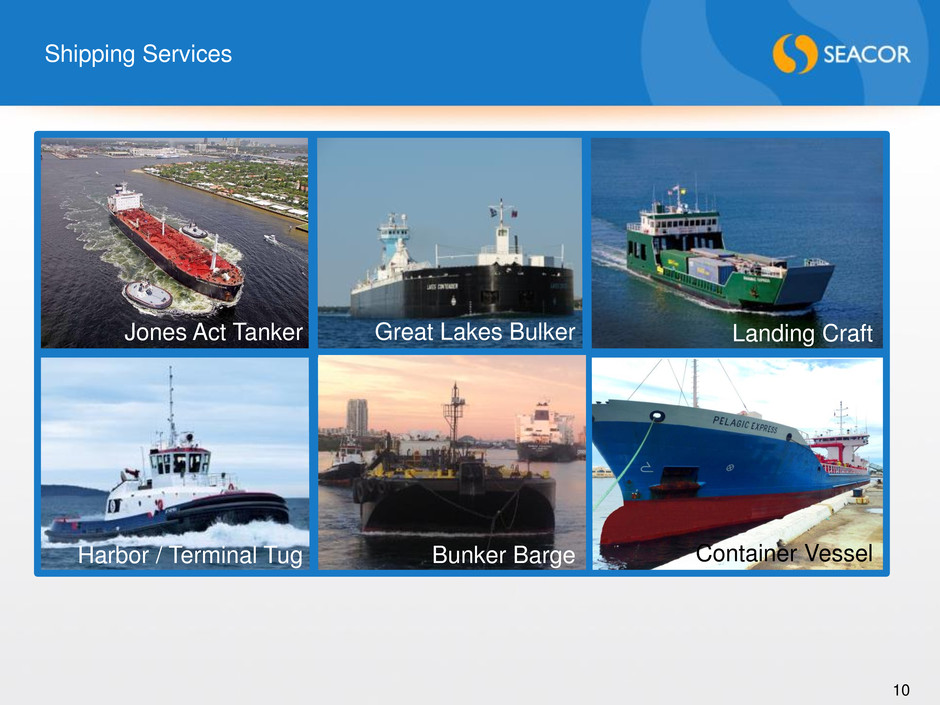
Shipping Services 10 Seabulk Trader Jones Act Tanker Great Lakes Bulker Container Vessel Ocean Bunker Barge Landing craft here Landing Craft Ocean Bunker Barge Harbor / Terminal Tug Bunker Barge
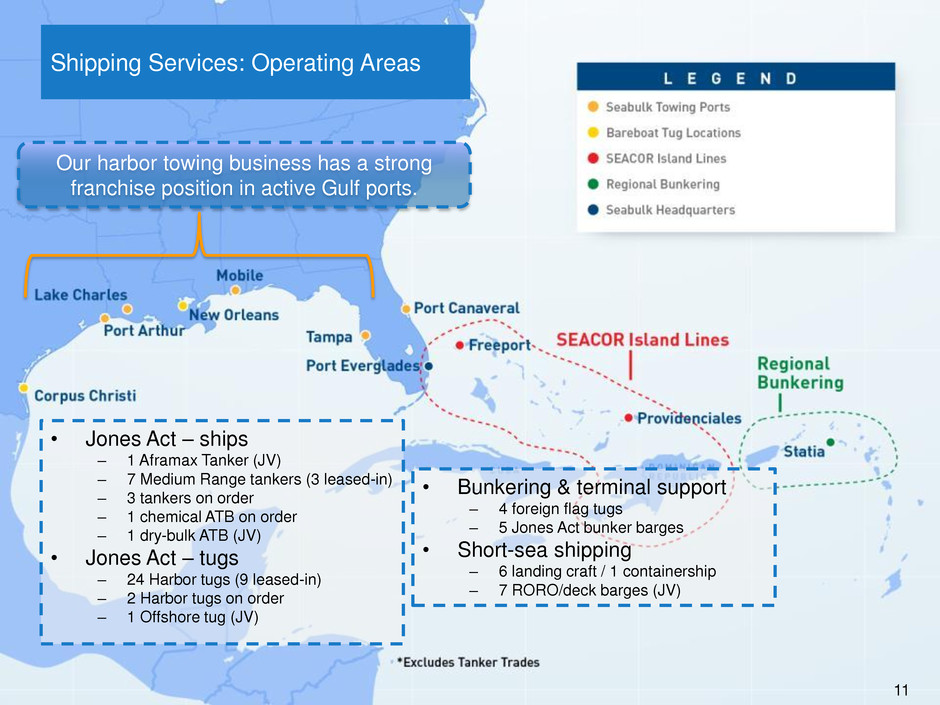
Shipping Services: Operating Areas 11 Our harbor towing business has a strong franchise position in active Gulf ports. • Jones Act – ships – 1 Aframax Tanker (JV) – 7 Medium Range tankers (3 leased-in) – 3 tankers on order – 1 chemical ATB on order – 1 dry-bulk ATB (JV) • Jones Act – tugs – 24 Harbor tugs (9 leased-in) – 2 Harbor tugs on order – 1 Offshore tug (JV) • Bunkering & terminal support – 4 foreign flag tugs – 5 Jones Act bunker barges • Short-sea shipping – 6 landing craft / 1 containership – 7 RORO/deck barges (JV)
Shipping Services: Market Drivers and Opportunities 12 • Petroleum Transportation: – Market Drivers: refined products, crude oil and chemical product demand and distribution – Primary Revenue Source: time charter or COA with 3 to 5 year term contracts – Opportunity: consolidation • Harbor Towing: – Market Drivers: • volumes and size (gross tons) of vessels calling port • petroleum distribution, global trade and U.S. imports – Primary Revenue Source: tug assistance – Opportunity: expansion to additional ports and overseas • Liner Shipping: – Market drivers: island real estate development and construction projects – Primary Revenue Source: freight consolidation and delivery – Opportunity: service to additional islands
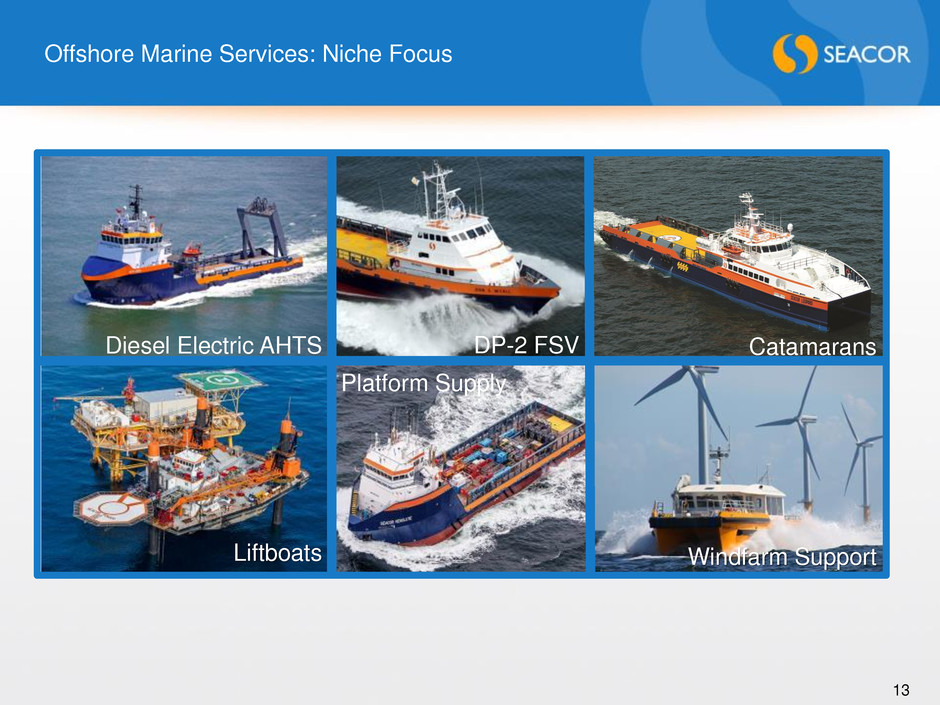
Offshore Marine Services: Niche Focus 13 DP-2 FSV Diesel Electric AHTS Windfarm Support Platform Supply Liftboats Catamarans
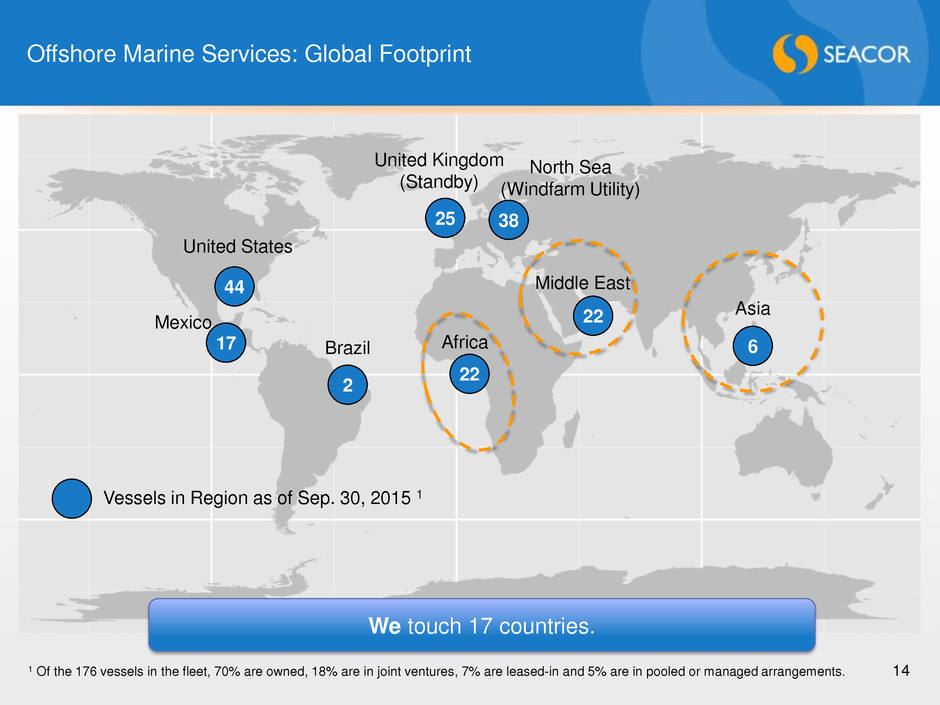
Offshore Marine Services: Global Footprint We touch 17 countries. 44 2 25 22 22 6 38 Vessels in Region as of Sep. 30, 2015 1 United States 17 Mexico Brazil Middle East Africa United Kingdom (Standby) North Sea (Windfarm Utility) Asia 14 1 Of the 176 vessels in the fleet, 70% are owned, 18% are in joint ventures, 7% are leased-in and 5% are in pooled or managed arrangements.
Offshore Marine Services: Market Drivers and Opportunities 15 • Market drivers: – Drilling – Construction – Decommissioning – Alternative Energy • Primary Revenue Source: term charters • Opportunity: – Acquire cheap assets – Orchestrate consolidations – Invest in new technology Capitalize on downturn; a marathon, not a sprint. • Market drivers: – Production – Maintenance – Oil Price
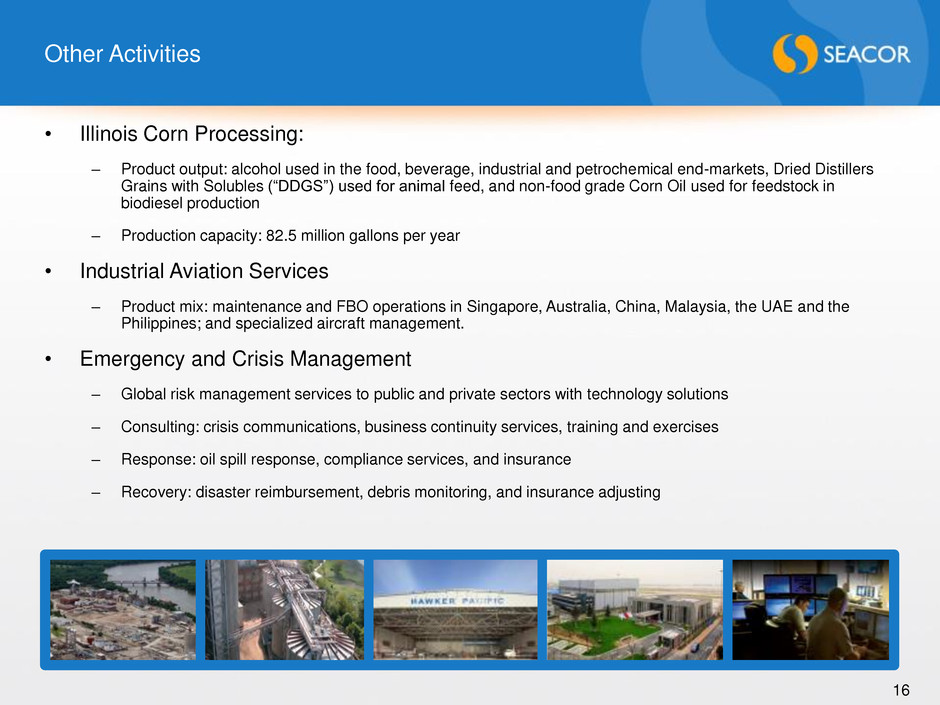
Other Activities 16 • Illinois Corn Processing: – Product output: alcohol used in the food, beverage, industrial and petrochemical end-markets, Dried Distillers Grains with Solubles (“DDGS”) used for animal feed, and non-food grade Corn Oil used for feedstock in biodiesel production – Production capacity: 82.5 million gallons per year • Industrial Aviation Services – Product mix: maintenance and FBO operations in Singapore, Australia, China, Malaysia, the UAE and the Philippines; and specialized aircraft management. • Emergency and Crisis Management – Global risk management services to public and private sectors with technology solutions – Consulting: crisis communications, business continuity services, training and exercises – Response: oil spill response, compliance services, and insurance – Recovery: disaster reimbursement, debris monitoring, and insurance adjusting
Financial Overview 17
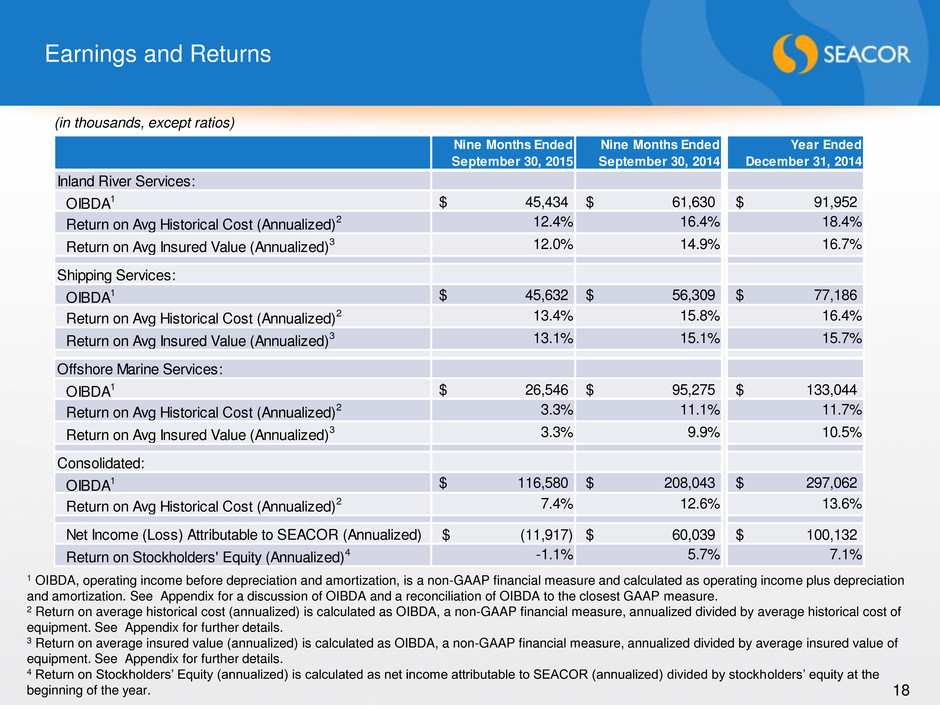
Earnings and Returns 18 (in thousands, except ratios) 1 OIBDA, operating income before depreciation and amortization, is a non-GAAP financial measure and calculated as operating income plus depreciation and amortization. See Appendix for a discussion of OIBDA and a reconciliation of OIBDA to the closest GAAP measure. 2 Return on average historical cost (annualized) is calculated as OIBDA, a non-GAAP financial measure, annualized divided by average historical cost of equipment. See Appendix for further details. 3 Return on average insured value (annualized) is calculated as OIBDA, a non-GAAP financial measure, annualized divided by average insured value of equipment. See Appendix for further details. 4 Return on Stockholders’ Equity (annualized) is calculated as net income attributable to SEACOR (annualized) divided by stockholders’ equity at the beginning of the year. Nine Months Ended September 30, 2015 Nine Months Ended September 30, 2014 Year Ended December 31, 2014 Inland River Services: OIBDA1 45,434$ 61,630$ 91,952$ Return on Avg Historical Cost (Annualized)2 12.4% 16.4% 18.4% Return on Avg Insured Value (Annualized)3 12.0% 14.9% 16.7% Shipping Services: OIBDA1 45,632$ 56,309$ 77,186$ Return on Avg Historical Cost (Annualized)2 13.4% 15.8% 16.4% Return on Avg Insured Value (Annualized)3 13.1% 15.1% 15.7% Offshore Marine Services: OIBDA1 26,546$ 95,275$ 133,044$ Return on Avg Historical Cost (Annualized)2 3.3% 11.1% 11.7% Return on Avg Insured Value (Annualized)3 3.3% 9.9% 10.5% Consolidated: OIBDA1 116,580$ 208,043$ 297,062$ Return on Avg Historical Cost (Annualized)2 7.4% 12.6% 13.6% Net Income (Loss) Attributable to SEACOR (Annualized) (11,917)$ 60,039$ 100,132$ Return on Stockholders' Equity (Annualized)4 -1.1% 5.7% 7.1%
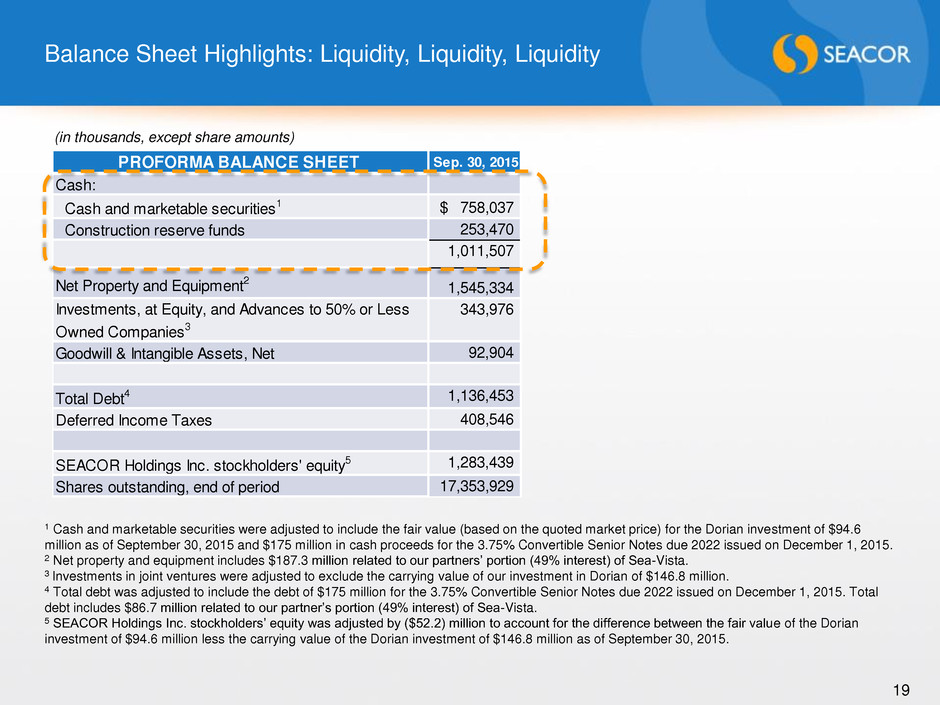
PROFORMA BALANCE SHEET Sep. 30, 2015 Cash: Cash and marketable securities1 758,037$ Construction reserve funds 253,470 1,011,507 Net Property and Equipment2 1,545,334 Investments, at Equity, and Advances to 50% or Less Owned Companies3 343,976 Goodwill & Intangible Assets, Net 92,904 Total Debt4 1,136,453 Deferred Income Taxes 408,546 SEACOR Holdings Inc. stockholders' equity5 1,283,439 Shares outstanding, end of period 17,353,929 Balance Sheet Highlights: Liquidity, Liquidity, Liquidity 19 (in thousands, except share amounts) 1 Cash and marketable securities were adjusted to include the fair value (based on the quoted market price) for the Dorian investment of $94.6 million as of September 30, 2015 and $175 million in cash proceeds for the 3.75% Convertible Senior Notes due 2022 issued on December 1, 2015. 2 Net property and equipment includes $187.3 million related to our partners’ portion (49% interest) of Sea-Vista. 3 Investments in joint ventures were adjusted to exclude the carrying value of our investment in Dorian of $146.8 million. 4 Total debt was adjusted to include the debt of $175 million for the 3.75% Convertible Senior Notes due 2022 issued on December 1, 2015. Total debt includes $86.7 million related to our partner’s portion (49% interest) of Sea-Vista. 5 SEACOR Holdings Inc. stockholders’ equity was adjusted by ($52.2) million to account for the difference between the fair value of the Dorian investment of $94.6 million less the carrying value of the Dorian investment of $146.8 million as of September 30, 2015.
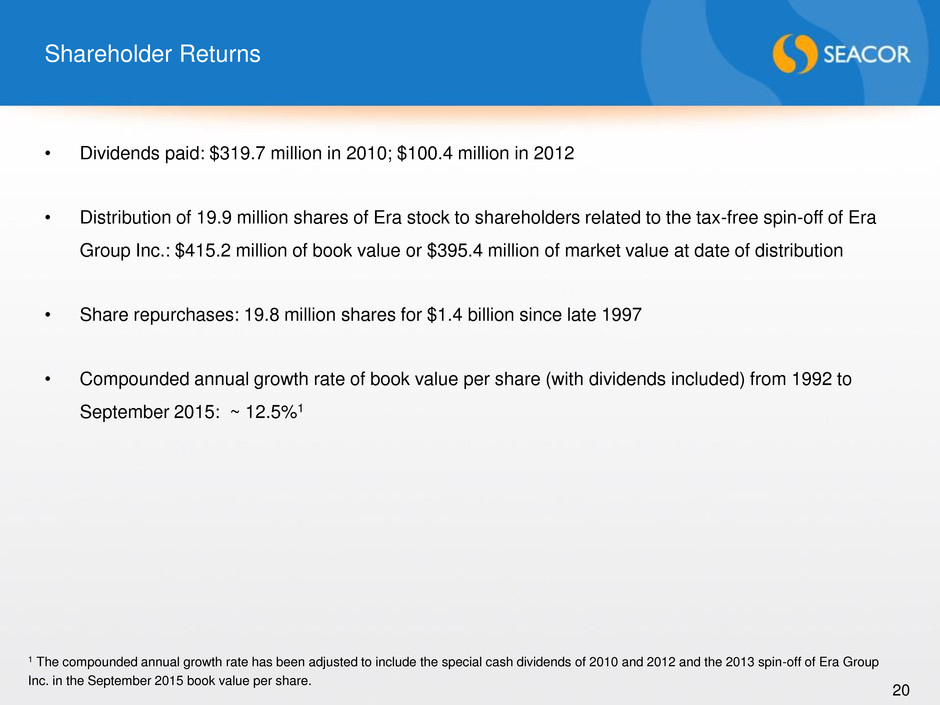
Shareholder Returns 20 • Dividends paid: $319.7 million in 2010; $100.4 million in 2012 • Distribution of 19.9 million shares of Era stock to shareholders related to the tax-free spin-off of Era Group Inc.: $415.2 million of book value or $395.4 million of market value at date of distribution • Share repurchases: 19.8 million shares for $1.4 billion since late 1997 • Compounded annual growth rate of book value per share (with dividends included) from 1992 to September 2015: ~ 12.5%1 1 The compounded annual growth rate has been adjusted to include the special cash dividends of 2010 and 2012 and the 2013 spin-off of Era Group Inc. in the September 2015 book value per share.
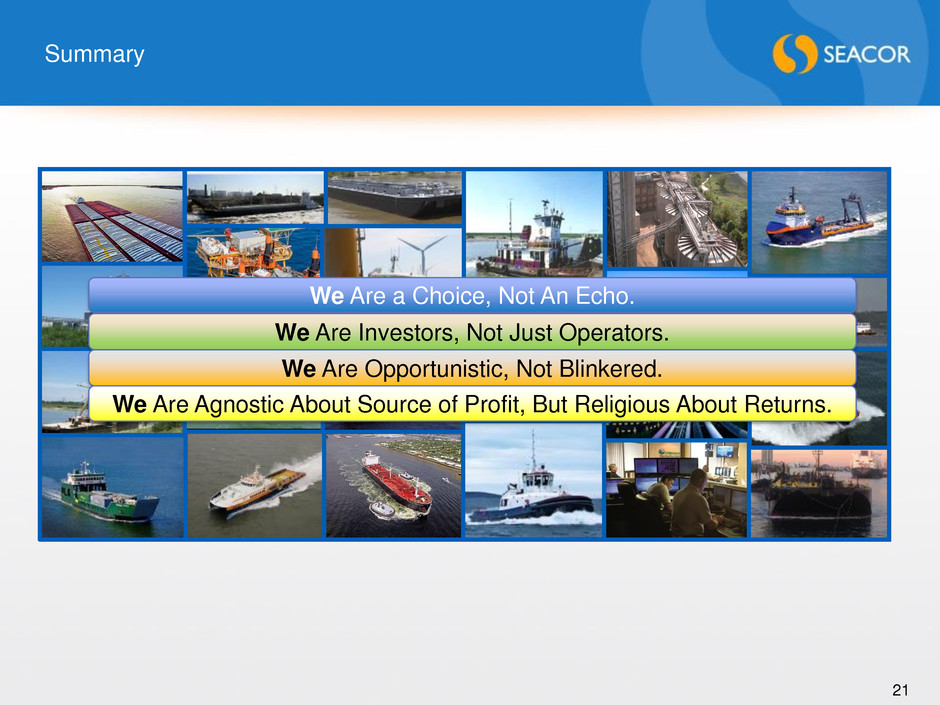
21 We Are a Choice, Not An Echo. We Are Investors, Not Just Operators. We Are Opportunistic, Not Blinkered. We Are Agnostic About Source of Profit, But Religious About Returns. Summary
Appendix 22
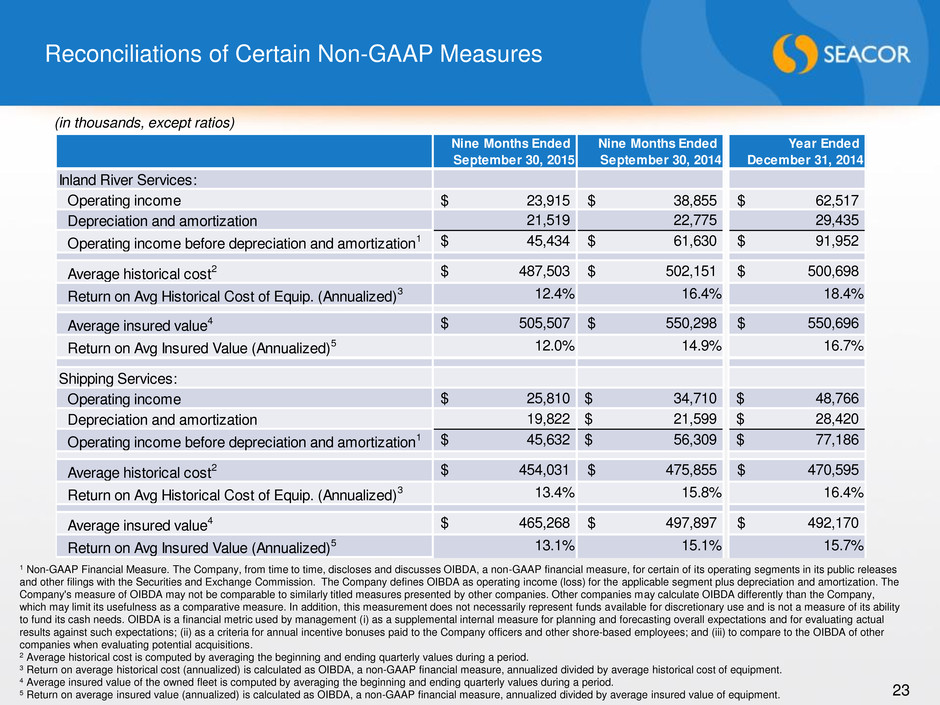
Reconciliations of Certain Non-GAAP Measures 23 (in thousands, except ratios) 1 Non-GAAP Financial Measure. The Company, from time to time, discloses and discusses OIBDA, a non-GAAP financial measure, for certain of its operating segments in its public releases and other filings with the Securities and Exchange Commission. The Company defines OIBDA as operating income (loss) for the applicable segment plus depreciation and amortization. The Company's measure of OIBDA may not be comparable to similarly titled measures presented by other companies. Other companies may calculate OIBDA differently than the Company, which may limit its usefulness as a comparative measure. In addition, this measurement does not necessarily represent funds available for discretionary use and is not a measure of its ability to fund its cash needs. OIBDA is a financial metric used by management (i) as a supplemental internal measure for planning and forecasting overall expectations and for evaluating actual results against such expectations; (ii) as a criteria for annual incentive bonuses paid to the Company officers and other shore-based employees; and (iii) to compare to the OIBDA of other companies when evaluating potential acquisitions. 2 Average historical cost is computed by averaging the beginning and ending quarterly values during a period. 3 Return on average historical cost (annualized) is calculated as OIBDA, a non-GAAP financial measure, annualized divided by average historical cost of equipment. 4 Average insured value of the owned fleet is computed by averaging the beginning and ending quarterly values during a period. 5 Return on average insured value (annualized) is calculated as OIBDA, a non-GAAP financial measure, annualized divided by average insured value of equipment. Nine Months Ended September 30, 2015 Nine Months Ended September 30, 2014 Year Ended December 31, 2014 Inland River Services: Operating income 23,915$ 38,855$ 62,517$ Depreciation and amortization 21,519 22,775 29,435 Operating income before depreciation and amortization1 45,434$ 61,630$ 91,952$ Average historical cost2 487,503$ 502,151$ 500,698$ Return on Avg Historical Cost of Equip. (Annualized)3 12.4% 16.4% 18.4% Average insured value4 505,507$ 550,298$ 550,696$ Return on Avg Insured Value (Annualized)5 12.0% 14.9% 16.7% Shipping Services: Operating income 25,810$ 34,710$ 48,766$ Depreciation and amortization 19,822 21,599$ 28,420$ Operating income before depreciation and amortization1 45,632$ 56,309$ 77,186$ Average historical cost2 454,031$ 475,855$ 470,595$ Return on Avg Historical Cost of Equip. (Annualized)3 13.4% 15.8% 16.4% Average insured value4 465,268$ 497,897$ 492,170$ Return on Avg Insured Value (Annualized)5 13.1% 15.1% 15.7%
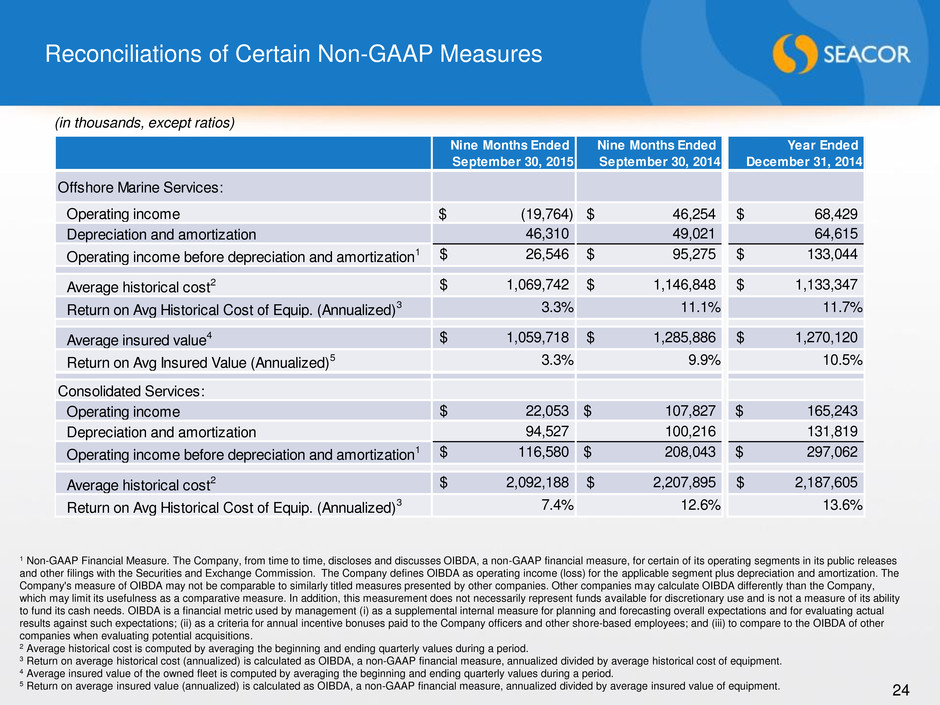
Reconciliations of Certain Non-GAAP Measures 24 (in thousands, except ratios) Nine Months Ended September 30, 2015 Nine Months Ended September 30, 2014 Year Ended December 31, 2014 Offshore Marine Services: Operating income $ (19,764) 46,254$ 68,429$ Depreciation and amortization 46,310 49,021 64,615 Operating income before depreciation and amortization1 26,546$ 95,275$ 133,044$ Average historical cost2 1,069,742$ 1,146,848$ 1,133,347$ Return on Avg Historical Cost of Equip. (Annualized)3 3.3% 11.1% 11.7% Average insured value4 1,059,718$ 1,285,886$ 1,270,120$ Return on Avg Insured Value (Annualized)5 3.3% 9.9% 10.5% Consolidated Services: Operating income 22,053$ 107,827$ 165,243$ Depreciation and amortization 94,527 100,216 131,819 Operating income before depreciation and amortization1 116,580$ 208,043$ 297,062$ Average historical cost2 2,092,188$ 2,207,895$ 2,187,605$ Return on Avg Historical Cost of Equip. (Annualized)3 7.4% 12.6% 13.6% 1 Non-GAAP Financial Measure. The Company, from time to time, discloses and discusses OIBDA, a non-GAAP financial measure, for certain of its operating segments in its public releases and other filings with the Securities and Exchange Commission. The Company defines OIBDA as operating income (loss) for the applicable segment plus depreciation and amortization. The Company's measure of OIBDA may not be comparable to similarly titled measures presented by other companies. Other companies may calculate OIBDA differently than the Company, which may limit its usefulness as a comparative measure. In addition, this measurement does not necessarily represent funds available for discretionary use and is not a measure of its ability to fund its cash needs. OIBDA is a financial metric used by management (i) as a supplemental internal measure for planning and forecasting overall expectations and for evaluating actual results against such expectations; (ii) as a criteria for annual incentive bonuses paid to the Company officers and other shore-based employees; and (iii) to compare to the OIBDA of other companies when evaluating potential acquisitions. 2 Average historical cost is computed by averaging the beginning and ending quarterly values during a period. 3 Return on average historical cost (annualized) is calculated as OIBDA, a non-GAAP financial measure, annualized divided by average historical cost of equipment. 4 Average insured value of the owned fleet is computed by averaging the beginning and ending quarterly values during a period. 5 Return on average insured value (annualized) is calculated as OIBDA, a non-GAAP financial measure, annualized divided by average insured value of equipment.
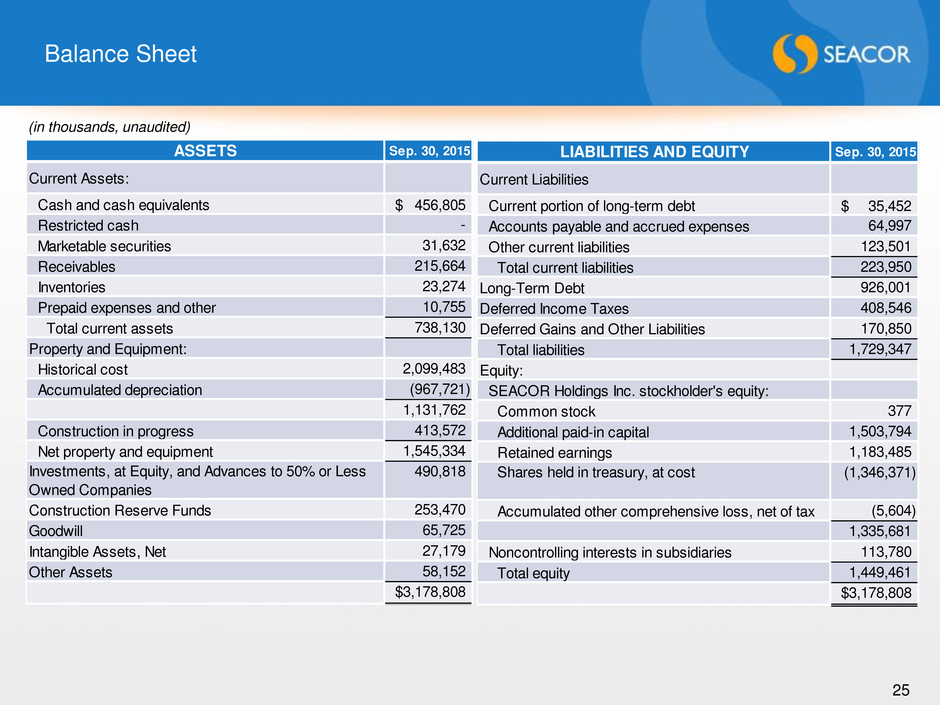
Balance Sheet 25 LIABILITIES AND EQUITY Sep. 30, 2015 Current Liabilities Current portion of long-term debt 35,452$ Accounts payable and accrued expenses 64,997 Other current liabilities 123,501 Total current liabilities 223,950 Long-Term Debt 926,001 Deferred Income Taxes 408,546 Deferred Gains and Other Liabilities 170,850 Total liabilities 1,729,347 Equity: SEACOR Holdings Inc. stockholder's equity: Common stock 377 Additional paid-in capital 1,503,794 Retained earnings 1,183,485 Shares held in treasury, at cost (1,346,371) Accumulated other comprehensive loss, net of tax (5,604) 1,335,681 Noncontrolling interests in subsidiaries 113,780 Total equity 1,449,461 3,178,808$ (in thousands, unaudited) ASSETS Sep. 30, 2015 Current Assets: Cash and cash equivalents 456,805$ Restricted cash - Marketable securities 31,632 Receivables 215,664 Inventories 23,274 Prepaid expenses and other 10,755 Total current assets 738,130 Property and Equipment: Historical cost 2,099,483 Accumulated depreciation (967,721) 1,131,762 Construction in progress 413,572 Net property and equipment 1,545,334 Investments, at Equity, and Advances to 50% or Less Own d Companies 490,818 Construction Reserve Funds 253,470 Goodwill 65,725 Intangible Assets, Net 27,179 Other Assets 58,152 3,178,808$
