Attached files
| file | filename |
|---|---|
| 8-K - FORM 8-K - FIRST FINANCIAL BANCORP /OH/ | a8-kinvestorpresentation20.htm |

1 EXHIBIT 99.1
2 Certain statements contained in this release which are not statements of historical fact constitute forward-looking statements within the meaning of the Private Securities Litigation Reform Act. Examples of forward-looking statements include, but are not limited to, projections of revenues, income or loss, earnings or loss per share, the payment or non- payment of dividends, capital structure and other financial items, statements of plans and objectives of First Financial or its management or board of directors and statements of future economic performances and statements of assumptions underlying such statements. Words such as ‘‘believes,’’ ‘‘anticipates,’’ “likely,” “expected,” ‘‘intends,’’ and other similar expressions are intended to identify forward-looking statements but are not the exclusive means of identifying such statements. Management’s analysis contains forward-looking statements that are provided to assist in the understanding of anticipated future financial performance. However, such performance involves risks and uncertainties that may cause actual results to differ materially. These factors include, but are not limited to: economic, market, liquidity, credit, interest rate, operational and technological risks associated with the Company’s business; the effect of and changes in policies and laws or regulatory agencies (notably the recently enacted Dodd-Frank Wall Street Reform and Consumer Protection Act); management’s ability to effectively execute its business plan; mergers and acquisitions, including costs or difficulties related to the integration of acquired companies; the Company’s ability to comply with the terms of loss sharing agreements with the FDIC; the effect of changes in accounting policies and practices; and the costs and effects of litigation and of unexpected or adverse outcomes in such litigation. Please refer to the Company’s Annual Report on Form 10-K for the year ended December 31, 2014, as well as its other filings with the SEC, for a more detailed discussion of these risks, uncertainties and other factors that could cause actual results to differ from those discussed in the forward-looking statements. Such forward-looking statements are meaningful only on the date when such statements are made, and the Company undertakes no obligation to update any forward-looking statement to reflect events or circumstances after the date on which such a statement is made to reflect the occurrence of unanticipated events. Forward Looking Statement Disclosure
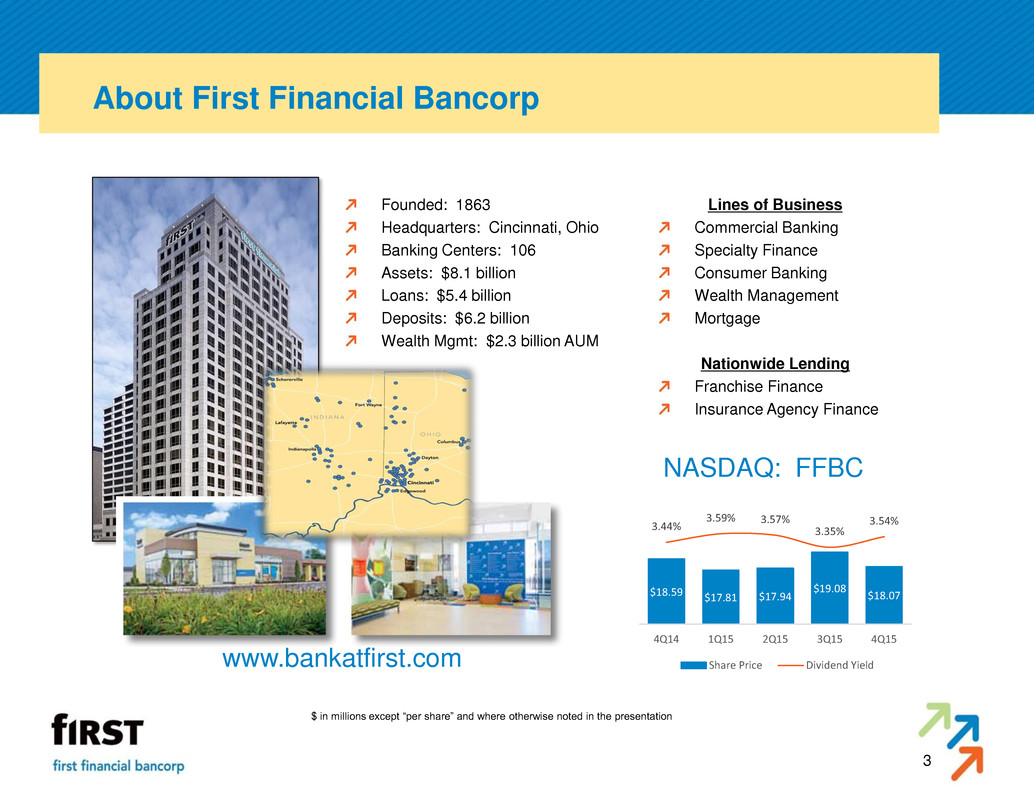
3 About First Financial Bancorp www.bankatfirst.com NASDAQ: FFBC Founded: 1863 Headquarters: Cincinnati, Ohio Banking Centers: 106 Assets: $8.1 billion Loans: $5.4 billion Deposits: $6.2 billion Wealth Mgmt: $2.3 billion AUM Lines of Business Commercial Banking Specialty Finance Consumer Banking Wealth Management Mortgage Nationwide Lending Franchise Finance Insurance Agency Finance $ in millions except “per share” and where otherwise noted in the presentation $18.07 $19.08 $17.94 $17.81 $18.59 3.54% 3.35% 3.57% 3.59% 3.44% 4Q153Q152Q151Q154Q14 Share Price Dividend Yield
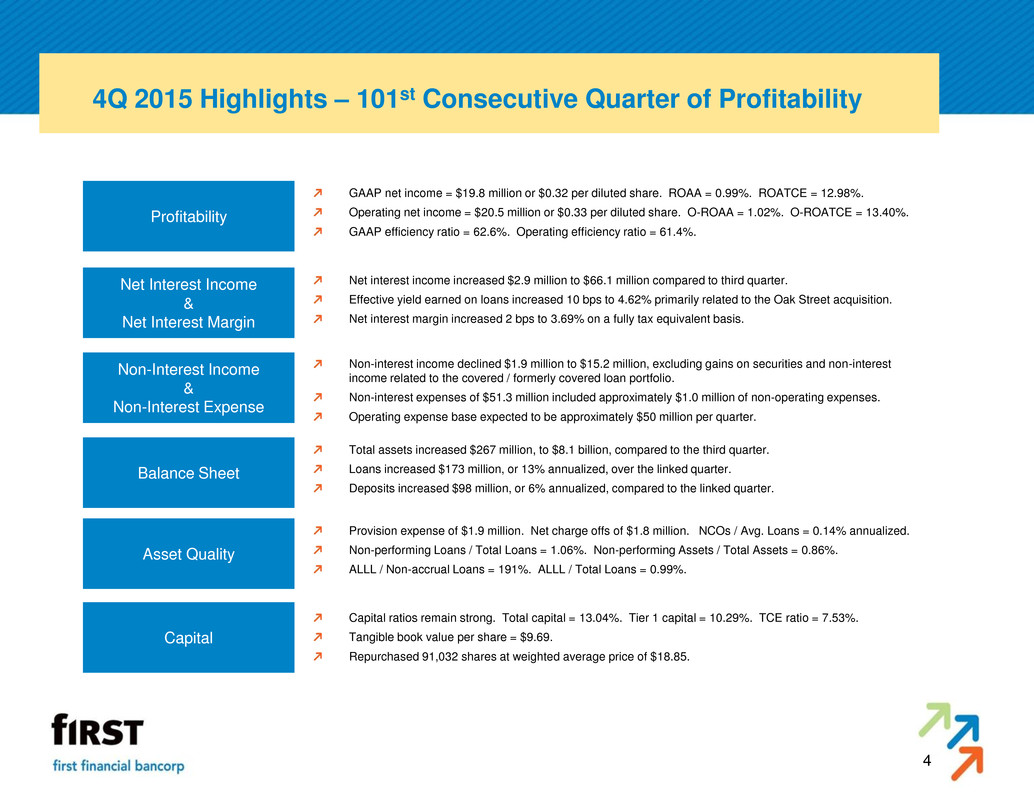
4 4Q 2015 Highlights – 101st Consecutive Quarter of Profitability Total assets increased $267 million, to $8.1 billion, compared to the third quarter. Loans increased $173 million, or 13% annualized, over the linked quarter. Deposits increased $98 million, or 6% annualized, compared to the linked quarter. Balance Sheet Profitability Asset Quality Net Interest Income & Net Interest Margin Non-Interest Income & Non-Interest Expense Capital Non-interest income declined $1.9 million to $15.2 million, excluding gains on securities and non-interest income related to the covered / formerly covered loan portfolio. Non-interest expenses of $51.3 million included approximately $1.0 million of non-operating expenses. Operating expense base expected to be approximately $50 million per quarter. Net interest income increased $2.9 million to $66.1 million compared to third quarter. Effective yield earned on loans increased 10 bps to 4.62% primarily related to the Oak Street acquisition. Net interest margin increased 2 bps to 3.69% on a fully tax equivalent basis. GAAP net income = $19.8 million or $0.32 per diluted share. ROAA = 0.99%. ROATCE = 12.98%. Operating net income = $20.5 million or $0.33 per diluted share. O-ROAA = 1.02%. O-ROATCE = 13.40%. GAAP efficiency ratio = 62.6%. Operating efficiency ratio = 61.4%. Provision expense of $1.9 million. Net charge offs of $1.8 million. NCOs / Avg. Loans = 0.14% annualized. Non-performing Loans / Total Loans = 1.06%. Non-performing Assets / Total Assets = 0.86%. ALLL / Non-accrual Loans = 191%. ALLL / Total Loans = 0.99%. Capital ratios remain strong. Total capital = 13.04%. Tier 1 capital = 10.29%. TCE ratio = 7.53%. Tangible book value per share = $9.69. Repurchased 91,032 shares at weighted average price of $18.85.
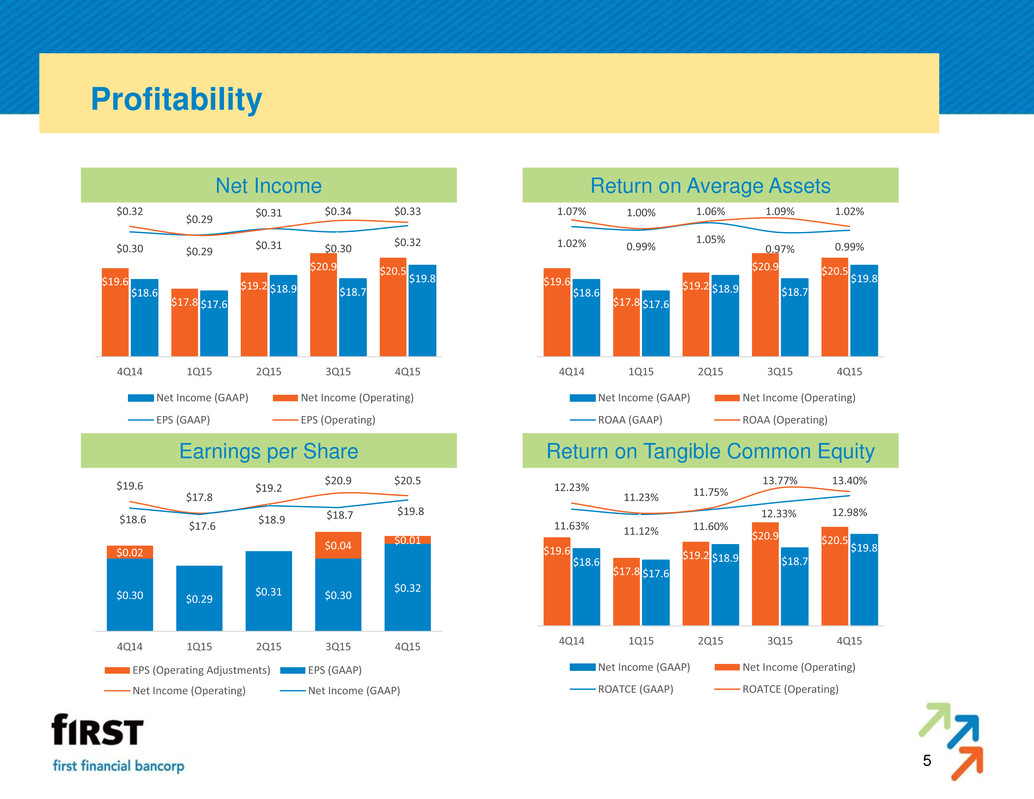
5 Profitability Net Income Return on Average Assets Earnings per Share Return on Tangible Common Equity $19.8 $18.7 $18.9 $17.6 $18.6 $20.5 $20.9 $19.2 $17.8 $19.6 $0.32 $0.30 $0.31 $0.29 $0.30 $0.33 $0.34 $0.31 $0.29 $0.32 4Q153Q152Q151Q154Q14 Net Income (GAAP) Net Income (Operating) EPS (GAAP) EPS (Operating) $19.8 $18.7 $18.9 $17.6 $18.6 $20.5 $20.9 $19.2 $17.8 $19.6 0.99% 0.97% 1.05% 0.99% 1.02% 1.02% 1.09% 1.06% 1.00% 1.07% 4Q153Q152Q151Q154Q14 Net Income (GAAP) Net Income (Operating) ROAA (GAAP) ROAA (Operating) $0.32 $0.30 $0.31 $0.29 $0.30 $0.01 $0.04 $0.02 $20.5 $20.9 $19.2 $17.8 $19.6 $19.8 $18.7 $18.9 $17.6 $18.6 4Q153Q152Q151Q154Q14 EPS (Operating Adjustments) EPS (GAAP) Net Income (Operating) Net Income (GAAP) $19.8 $18.7 $18.9 $17.6 $18.6 $20.5 $20.9 $19.2 $17.8 $19.6 12.98% 12.33% 11.60% 11.12% 11.63% 13.40% 13.77% 11.75% 11.23% 12.23% 4Q153Q152Q151Q154Q14 Net Income (GAAP) Net Income (Operating) ROATCE (GAAP) ROATCE (Operating)
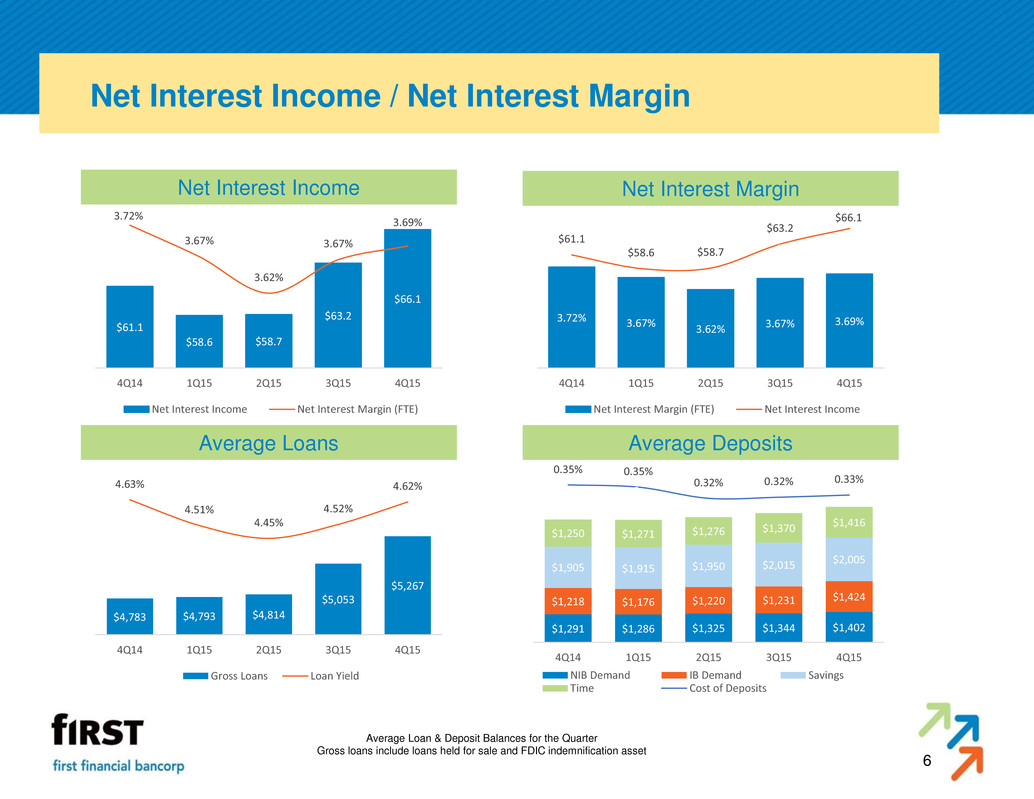
6 Net Interest Income / Net Interest Margin Average Loan & Deposit Balances for the Quarter Gross loans include loans held for sale and FDIC indemnification asset Net Interest Income Net Interest Margin Average Loans Average Deposits $66.1 $63.2 $58.7 $58.6 $61.1 3.69% 3.67% 3.62% 3.67% 3.72% 4Q153Q152Q151Q154Q14 Net Interest Income Net Interest Margin (FTE) 3.69% 3.67% 3.62% 3.67% 3.72% $66.1 $63.2 $58.7 $58.6 $61.1 4Q153Q152Q151Q154Q14 Net Interest Margin (FTE) Net Interest Income $5,267 $5,053 $4,814 $4,793 $4,783 4.62% 4.52% 4.45% 4.51% 4.63% 4Q153Q152Q151Q154Q14 Gross Loans Loan Yield $1,402 $1,344 $1,325 $1,286 $1,291 $1,424 $1,231 $1,220 $1,176 $1,218 $2,005 $2,015 $1,950 $1,915 $1,905 $1,416 $1,370 $1,276 $1,271 $1,250 0.33% 0.32% 0.32% 0.35% 0.35% 4Q153Q152Q151Q154Q14 NIB Demand IB Demand Savings Time Cost of Deposits
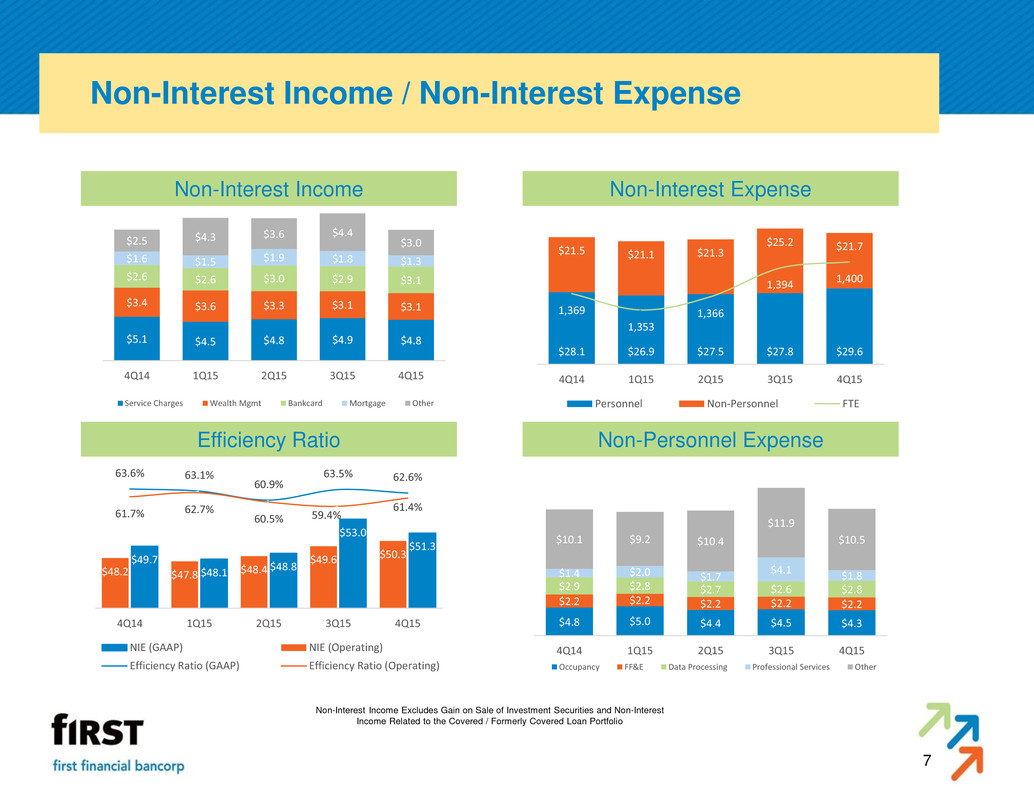
7 Non-Interest Income / Non-Interest Expense Non-Interest Income Non-Interest Expense Efficiency Ratio Non-Personnel Expense Non-Interest Income Excludes Gain on Sale of Investment Securities and Non-Interest Income Related to the Covered / Formerly Covered Loan Portfolio $4.8 $4.9 $4.8 $4.5 $5.1 $3.1 $3.1 $3.3 $3.6 $3.4 $3.1 $2.9 $3.0 $2.6 $2.6 $1.3 $1.8 $1.9 $1.5 $1.6 $3.0 $4.4 $3.6 $4.3 $2.5 4Q153Q152Q151Q154Q14 Service Charges Wealth Mgmt Bankcard Mortgage Other $29.6 $27.8 $27.5 $26.9 $28.1 $21.7 $25.2 $21.3 $21.1 $21.5 1,400 1,394 1,366 1,353 1,369 4Q153Q152Q151Q154Q14 Personnel Non-Personnel FTE $51.3 $53.0 $48.8 $48.1 $49.7 $50.3 $49.6 $48.4 $47.8 $48.2 62.6% 63.5% 60.9% 63.1% 63.6% 61.4% 59.4% 60.5% 62.7% 61.7% 4Q153Q152Q151Q154Q14 NIE (GAAP) NIE (Operating) Efficiency Ratio (GAAP) Efficiency Ratio (Operating) $4.3 $4.5 $4.4 $5.0 $4.8 $2.2 $2.2 $2.2 $2.2 $2.2 $2.8 $2.6 $2.7 $2.8 $2.9 $1.8 $4.1 $1.7 $2.0 $1.4 $10.5 $11.9 $10.4 $9.2 $10.1 4Q153Q152Q151Q154Q14 Occupancy FF&E Data Processing Professional Services Other
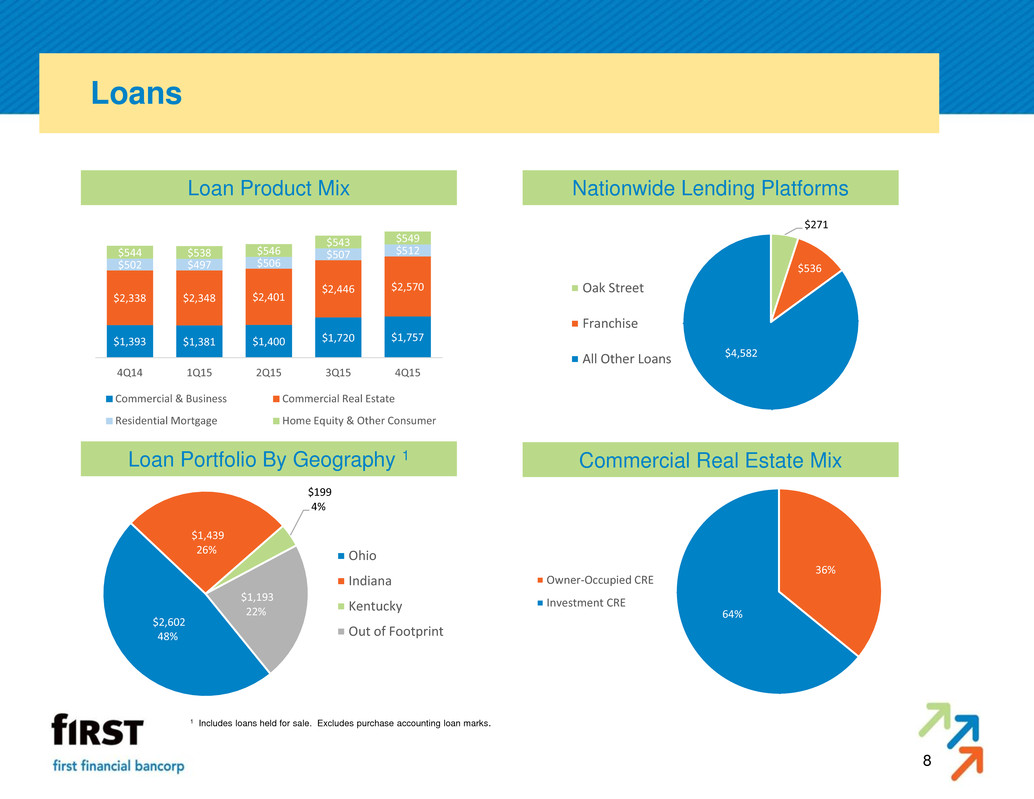
8 Loans Loan Product Mix Nationwide Lending Platforms Loan Portfolio By Geography 1 Commercial Real Estate Mix 1 Includes loans held for sale. Excludes purchase accounting loan marks. $1,757 $1,720 $1,400 $1,381 $1,393 $2,570 $2,446 $2,401 $2,348 $2,338 $512 $507 $506 $497 $502 $549 $543 $546 $538 $544 4Q153Q152Q151Q154Q14 Commercial & Business Commercial Real Estate Residential Mortgage Home Equity & Other Consumer $271 $536 $4,582 Oak Street Franchise All Other Loans $2,602 48% $1,439 26% $199 4% $1,193 22% Ohio Indiana Kentucky Out of Footprint 36% 64% Owner-Occupied CRE Investment CRE
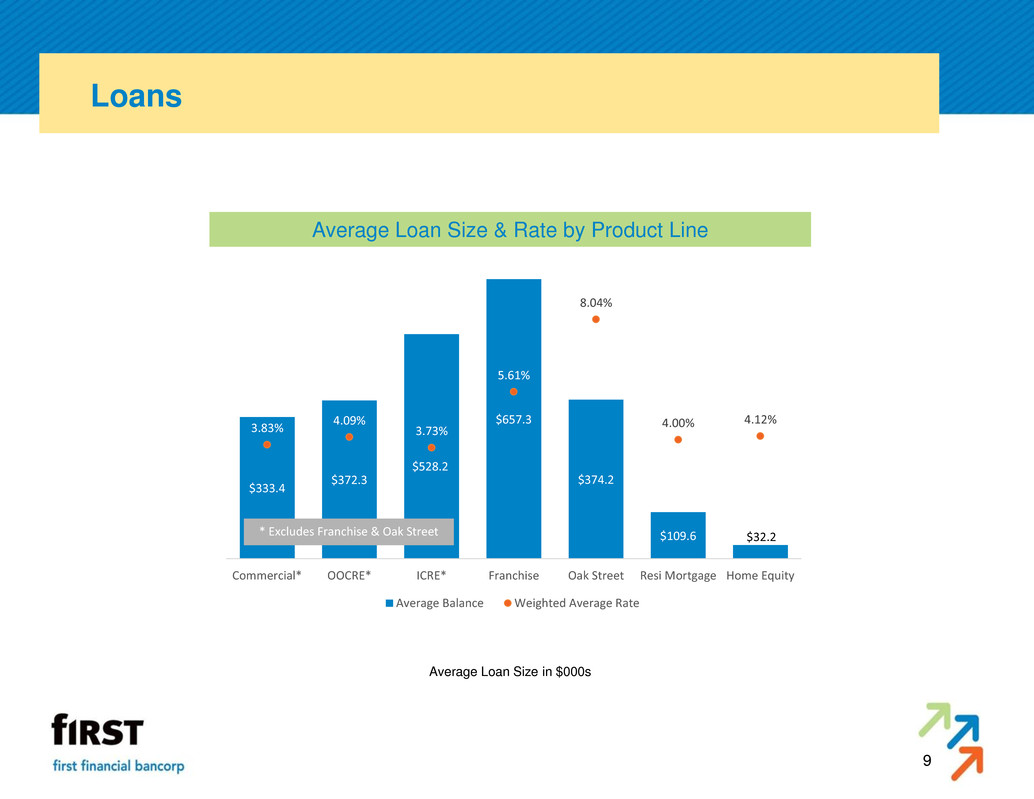
9 Loans Average Loan Size & Rate by Product Line Average Loan Size in $000s $333.4 $372.3 $528.2 $657.3 $374.2 $109.6 $32.2 3.83% 4.09% 3.73% 5.61% 8.04% 4.00% 4.12% Commercial* OOCRE* ICRE* Franchise Oak Street Resi Mortgage Home Equity Average Balance Weighted Average Rate * Excludes Franchise & Oak Street
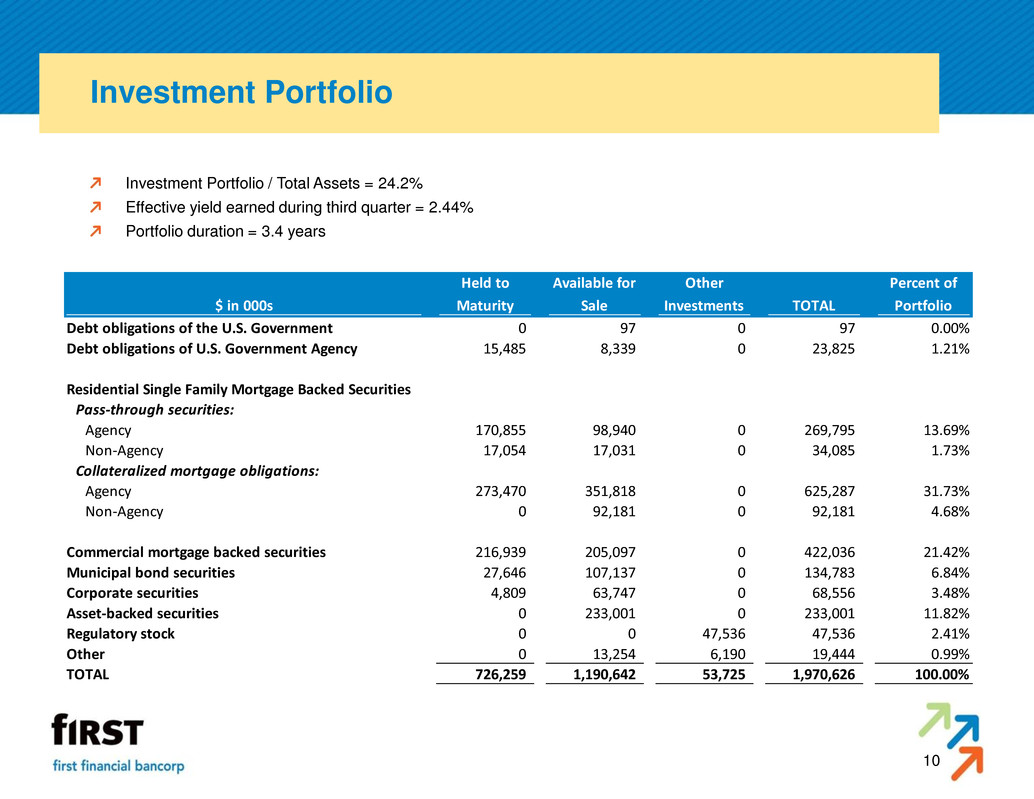
10 Investment Portfolio Investment Portfolio / Total Assets = 24.2% Effective yield earned during third quarter = 2.44% Portfolio duration = 3.4 years $ in 000s Held to Maturity Available for Sale Other Investments TOTAL Percent of Portfolio Debt obligations of the U.S. Government 0 97 0 97 0.00% Debt obligations of U.S. Government Agency 15,485 8,339 0 23,825 1.21% Residential Single Family Mortgage Backed Securities Pass-through securities: Agency 170,855 98,940 0 269,795 13.69% Non-Agency 17,054 17,031 0 34,085 1.73% Collateralized mortgage obligations: Agency 273,470 351,818 0 625,287 31.73% Non-Agency 0 92,181 0 92,181 4.68% Commercial mortgage backed securities 216,939 205,097 0 422,036 21.42% M icipal bond securities 27,646 107,137 0 134,783 6.84% Corporate securities 4,809 63,747 0 68,556 3.48% Asset-backed securities 0 233,001 0 233,001 11.82% Regulatory stock 0 0 47,536 47,536 2.41% Other 0 13,254 6,190 19,444 0.99% TOTAL 726,259 1,190,642 53,725 1,970,626 100.00%
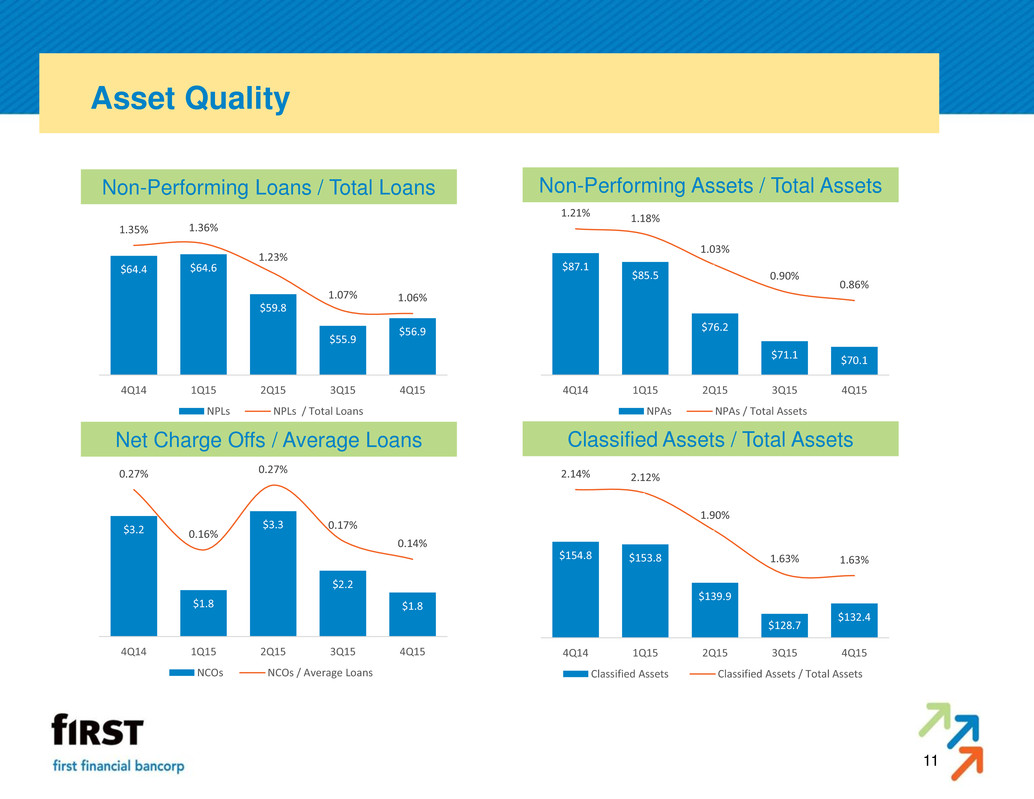
11 Asset Quality Non-Performing Loans / Total Loans Non-Performing Assets / Total Assets Net Charge Offs / Average Loans Classified Assets / Total Assets $56.9 $55.9 $59.8 $64.6 $64.4 1.06% 1.07% 1.23% 1.36% 1.35% 4Q153Q152Q151Q154Q14 NPLs NPLs / Total Loans $70.1 $71.1 $76.2 $85.5 $87.1 0.86% 0.90% 1.03% 1.18% 1.21% 4Q153Q152Q151Q154Q14 NPAs NPAs / Total Assets $1.8 $2.2 $3.3 $1.8 $3.2 0.14% 0.17% 0.27% 0.16% 0.27% 4Q153Q152Q151Q154Q14 NCOs NCOs / Average Loans $132.4 $128.7 $139.9 $153.8 $154.8 1.63% 1.63% 1.90% 2.12% 2.14% 4Q153Q152Q151Q154Q14 Classified Assets Classified Assets / Total Assets
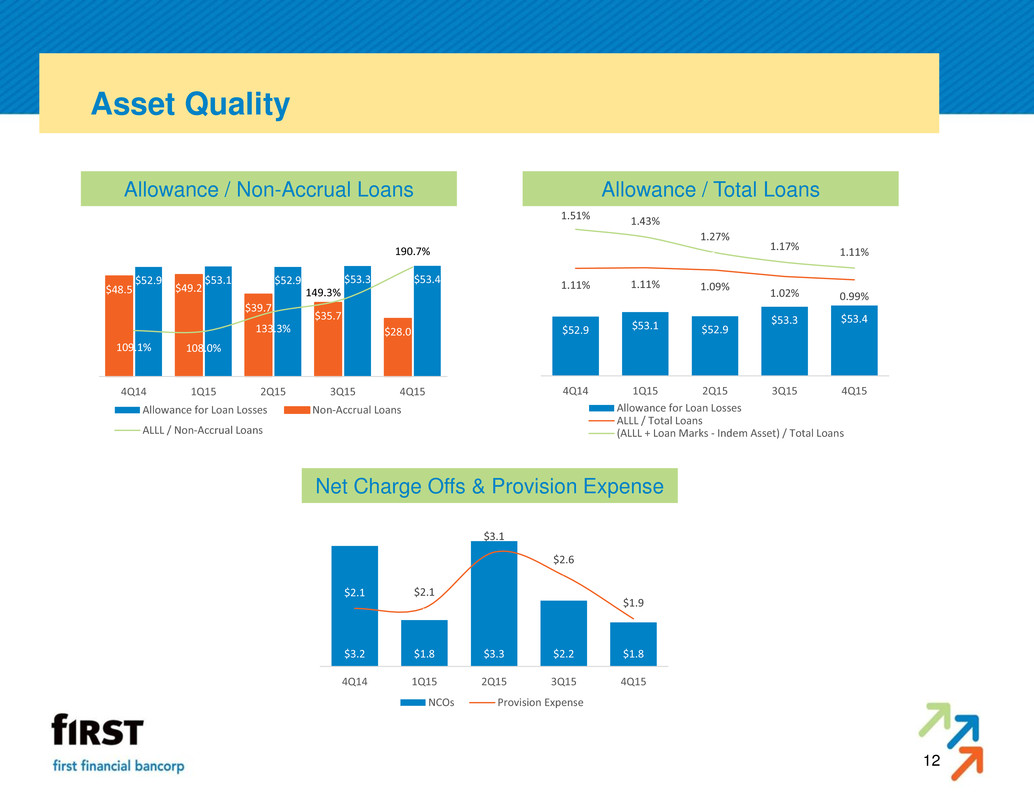
12 Asset Quality Allowance / Non-Accrual Loans Allowance / Total Loans Net Charge Offs & Provision Expense $53.4 $53.3 $52.9 $53.1 $52.9 0.99% 1.02% 1.09% 1.11% 1.11% 1.11% 1.17% 1.27% 1.43% 1.51% 4Q153Q152Q151Q154Q14 Allowance for Loan Losses ALLL / Total Loans (ALLL + Loan Marks - Indem Asset) / Total Loans $1.8 $2.2 $3.3 $1.8 $3.2 $1.9 $2.6 $3.1 $2.1 $2.1 4Q153Q152Q151Q154Q14 NCOs Provision Expense $53.4 $53.3 $52.9 $53.1 $52.9 $28.0 $35.7 $39.7 $49.2 $48.5 190.7% 149.3% 133.3% 108.0% 109.1% 4Q153Q152Q151Q154Q14 Allowance for Loan Losses Non-Accrual Loans ALLL / Non-Accrual Loans
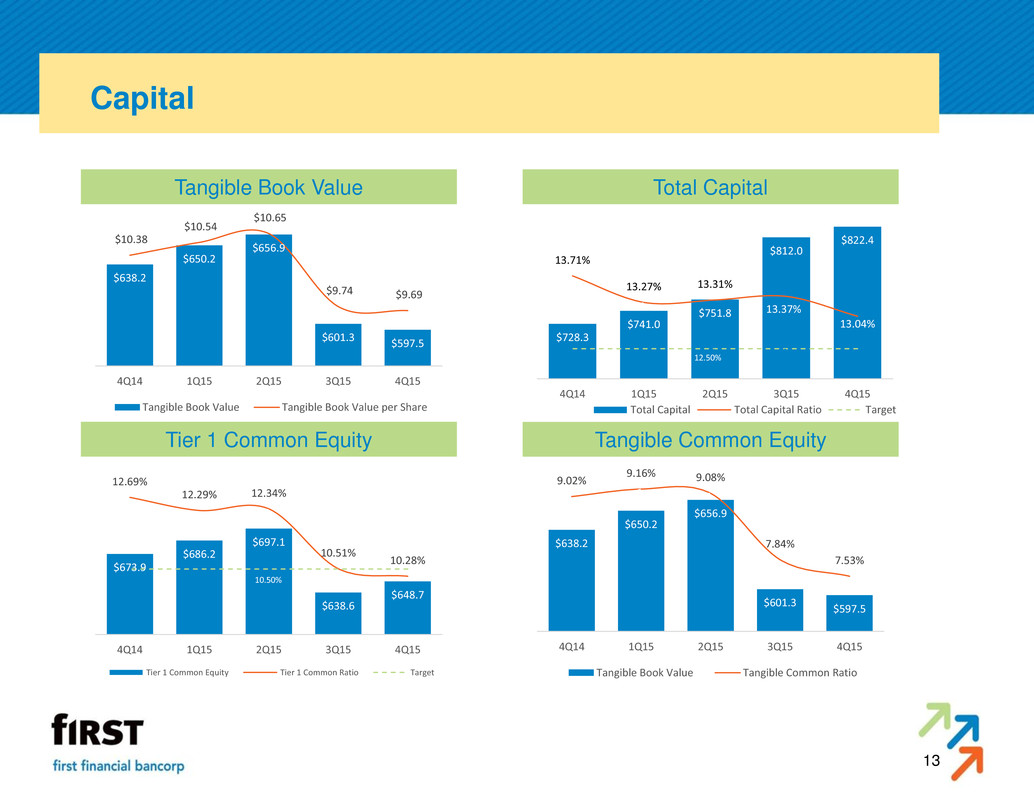
13 Capital Tier 1 Common Equity Tangible Book Value Total Capital Tangible Common Equity $597.5 $601.3 $656.9 $650.2 $638.2 $9.69 $9.74 $10.65 $10.54 $10.38 4Q153Q152Q151Q154Q14 Tangible Book Value Tangible Book Value per Share $822.4 $812.0 $751.8 $741.0 $728.3 13.04% 13.37% 13.31% 13.27% 13.71% 12.50% 4Q153Q152Q151Q154Q14 Total Capital Total Capital Ratio Target $648.7 $638.6 $697.1 $686.2 $673.9 10.28% 10.51% 12.34% 12.29% 12.69% 10.50% 4Q153Q152Q151Q154Q14 Tier 1 Common Equity Tier 1 Common Ratio Target $597.5 $601.3 $656.9 $650.2 $638.2 7.53% 7.84% 9.08% 9.16% 9.02% 4Q153Q152Q151Q154Q14 Tangible Book Value Tangible Common Ratio
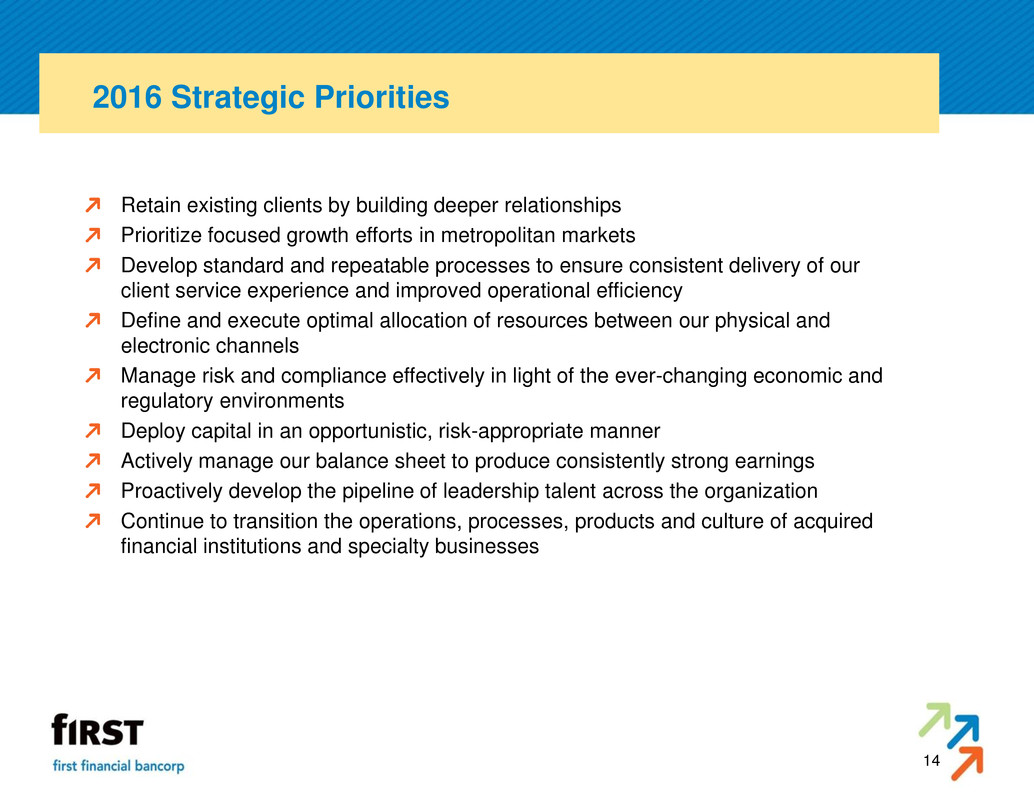
14 2016 Strategic Priorities Retain existing clients by building deeper relationships Prioritize focused growth efforts in metropolitan markets Develop standard and repeatable processes to ensure consistent delivery of our client service experience and improved operational efficiency Define and execute optimal allocation of resources between our physical and electronic channels Manage risk and compliance effectively in light of the ever-changing economic and regulatory environments Deploy capital in an opportunistic, risk-appropriate manner Actively manage our balance sheet to produce consistently strong earnings Proactively develop the pipeline of leadership talent across the organization Continue to transition the operations, processes, products and culture of acquired financial institutions and specialty businesses
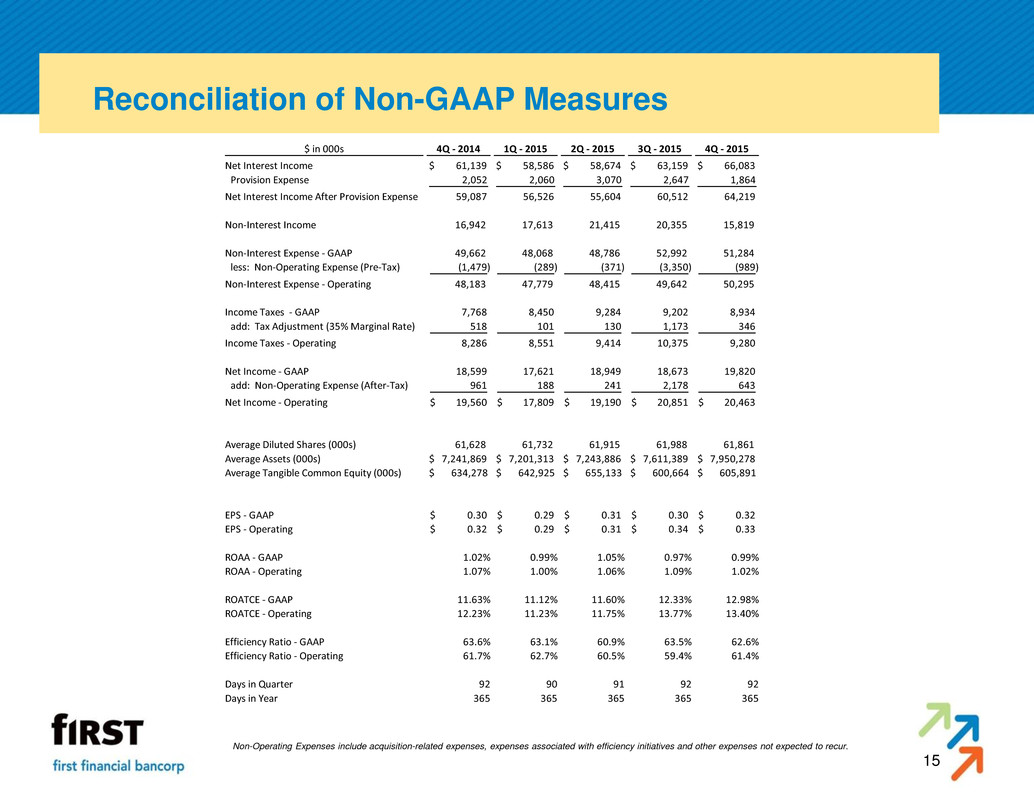
15 Reconciliation of Non-GAAP Measures Non-Operating Expenses include acquisition-related expenses, expenses associated with efficiency initiatives and other expenses not expected to recur. $ in 000s 4Q - 2014 1Q - 2015 2Q - 2015 3Q - 2015 4Q - 2015 Net Interest Income $ 61,139 $ 58,586 $ 58,674 $ 63,159 $ 66,083 Provision Expense 2,052 2,060 3,070 2,647 1,864 Net Interest Income After Provision Expense 59,087 56,526 55,604 60,512 64,219 Non-Interest Income 16,942 17,613 21,415 20,355 15,819 Non-Interest Expense - GAAP 49,662 48,068 48,786 52,992 51,284 less: Non-Operating Expense (Pre-Tax) (1,479) (289) (371) (3,350) (989) Non-Interest Expense - Operating 48,183 47,779 48,415 49,642 50,295 Income Taxes - GAAP 7,768 8,450 9,284 9,202 8,934 add: Tax Adjustment (35% Marginal Rate) 518 101 130 1,173 346 Income Taxes - Operating 8,286 8,551 9,414 10,375 9,280 Net Income - GAAP 18,599 17,621 18,949 18,673 19,820 add: Non-Operating Expense (After-Tax) 961 188 241 2,178 643 Net Income - Operating 19,560$ 17,809$ 19,190$ 20,851$ 20,463$ Average Diluted Shares (000s) 61,628 61,732 61,915 61,988 61,861 Average Assets (000s) $ 7,241,869 $ 7,201,313 $ 7,243,886 $ 7,611,389 $ 7,950,278 Average Tangible Common Equity (000s) $ 634,278 $ 642,925 $ 655,133 $ 600,664 $ 605,891 EPS - GAAP 0.30$ 0.29$ 0.31$ 0.30$ 0.32$ EPS - Operating 0.32$ 0.29$ 0.31$ 0.34$ 0.33$ ROAA - GAAP 1.02% 0.99% 1.05% 0.97% 0.99% ROAA - Operating 1.07% 1.00% 1.06% 1.09% 1.02% ROATCE - GAAP 11.63% 11.12% 11.60% 12.33% 12.98% ROATCE - Operating 12.23% 11.23% 11.75% 13.77% 13.40% Efficiency Ratio - GAAP 63.6% 63.1% 60.9% 63.5% 62.6% Efficiency Ratio - Operating 61.7% 62.7% 60.5% 59.4% 61.4% Days in Quarter 92 90 91 92 92 Days in Year 365 365 365 365 365

16
