Attached files
| file | filename |
|---|---|
| EX-32.1 - EXHIBIT 32.1 - NORFOLK SOUTHERN CORP | nsc10-kexhibit321.htm |
| EX-23 - EXHIBIT 23 - NORFOLK SOUTHERN CORP | nsc10-kexhibit231.htm |
| EX-21 - EXHIBIT 21 - NORFOLK SOUTHERN CORP | nsc10-kexhibit211.htm |
| EX-12 - EXHIBIT 12 - NORFOLK SOUTHERN CORP | nsc10-kexhibit121.htm |
| EX-99 - EXHIBIT 99 - NORFOLK SOUTHERN CORP | nsc10-kexhibit991.htm |
| EX-31.B - EXHIBIT 31.B - NORFOLK SOUTHERN CORP | nsc10-kexhibit31b1.htm |
| EX-31.A - EXHIBIT 31.A - NORFOLK SOUTHERN CORP | nsc10-kexhibit31a1.htm |
| EX-10.HH - EXHIBIT 10.HH - NORFOLK SOUTHERN CORP | nsc10-kexhibit10hh1.htm |
| EX-10.GGG - EXHIBIT 10.GGG - NORFOLK SOUTHERN CORP | nsc10-kexhibit10ggg1.htm |
| EX-10.JJJ - EXHIBIT 10.JJJ - NORFOLK SOUTHERN CORP | nsc10-kexhibit10jjj1.htm |
| EX-10.III - EXHIBIT 10.III - NORFOLK SOUTHERN CORP | nsc10-kexhibit10iii1.htm |
| EX-10.HHH - EXHIBIT 10.HHH - NORFOLK SOUTHERN CORP | nsc10-kexhibit10hhh1.htm |
| EX-10.OOO - EXHIBIT 10.OOO - NORFOLK SOUTHERN CORP | nsc10-kexhibit10ooo1.htm |
UNITED STATES SECURITIES AND EXCHANGE COMMISSION
Washington, DC 20549
FORM 10-K
(X) ANNUAL REPORT PURSUANT TO SECTION 13 OR 15(d) OF THE SECURITIES EXCHANGE ACT OF 1934
for the fiscal year ended DECEMBER 31, 2015
( ) TRANSITION REPORT PURSUANT TO SECTION 13 OR 15(d) OF THE SECURITIES EXCHANGE ACT OF 1934
for the transition period from ___________ to___________
Commission file number 1-8339
NORFOLK SOUTHERN CORPORATION
(Exact name of registrant as specified in its charter)
Virginia (State or other jurisdiction of incorporation) | 52-1188014 (IRS Employer Identification No.) | |
Three Commercial Place Norfolk, Virginia (Address of principal executive offices) | 23510-2191 Zip Code | |
Registrant’s telephone number, including area code: | (757) 629-2680 | |
Securities registered pursuant to Section 12(b) of the Act: | ||
Title of each Class | Name of each exchange on which registered | |
Norfolk Southern Corporation | ||
Common Stock (Par Value $1.00) | New York Stock Exchange | |
Securities registered pursuant to Section 12(g) of the Act: NONE
Indicate by check mark if the registrant is a well-known seasoned issuer, as defined in Rule 405 of the Securities Act. Yes (X) No ( )
Indicate by check mark if the registrant is not required to file reports pursuant to Section 13 or 15(d) of the Act. Yes ( ) No (X)
Indicate by check mark whether the registrant: (1) has filed all reports required to be filed by Section 13 or Section 15(d) of the Securities Exchange Act of 1934 during the preceding 12 months (or for such shorter period that the registrant was required to file such reports), and (2) has been subject to such filing requirements for the past 90 days. Yes (X) No ( )
Indicate by check mark whether the registrant has submitted electronically and posted on its corporate Web site, if any, every Interactive Data File required to be submitted and posted pursuant to Rule 405 of Regulations S-T during the preceding 12 months. Yes (X) No ( )
Indicate by check mark if disclosure of delinquent filers pursuant to Item 405 of Regulation S-K is not contained herein, and will not be contained, to the best of registrant's knowledge, in definitive proxy or information statements incorporated by reference in Part III of the Form 10-K or any amendment to this Form 10-K. (X)
Indicate by check mark whether the registrant is a large accelerated filer, an accelerated filer, or a non-accelerated filer or smaller reporting company. See definitions of “large accelerated filer,” “accelerated filer,” and “smaller reporting company” in Rule 12b-2 of the Exchange Act.
Large accelerated filer (X) Accelerated filer ( ) Non-accelerated filer ( ) Smaller reporting company ( )
Indicate by check mark whether the registrant is a shell company (as defined in Rule 12b-2 of the Exchange Act). Yes ( ) No (X)
The aggregate market value of the voting common equity held by non-affiliates at June 30, 2015, was $26,243,199,266 (based on the closing price as quoted on the New York Stock Exchange on that date).
The number of shares outstanding of each of the registrant’s classes of common stock, at January 31, 2016: 298,198,651 (excluding 20,320,777 shares held by the registrant's consolidated subsidiaries).
DOCUMENTS INCORPORATED BY REFERENCE:
Portions of the Registrant’s definitive proxy statements to be filed electronically pursuant to Regulation 14A not later than 120 days after the end of the fiscal year, are incorporated herein by reference in Part III.
TABLE OF CONTENTS
NORFOLK SOUTHERN CORPORATION AND SUBSIDIARIES
Page | |||
K 2
PART I
NORFOLK SOUTHERN CORPORATION AND SUBSIDIARIES
Item 1. Business and Item 2. Properties
GENERAL – Our company, Norfolk Southern Corporation, is a Norfolk, Virginia based company that owns a major freight railroad, Norfolk Southern Railway Company. We were incorporated on July 23, 1980, under the laws of the Commonwealth of Virginia. Our common stock (Common Stock) is listed on the New York Stock Exchange (NYSE) under the symbol “NSC.”
Unless indicated otherwise, Norfolk Southern Corporation and its subsidiaries, including Norfolk Southern Railway Company, are referred to collectively as NS, we, us, and our.
We are primarily engaged in the rail transportation of raw materials, intermediate products, and finished goods primarily in the Southeast, East, and Midwest and, via interchange with rail carriers, to and from the rest of the United States. We also transport overseas freight through several Atlantic and Gulf Coast ports. We provide comprehensive logistics services and offer the most extensive intermodal network in the eastern half of the United States.
We make available free of charge through our website, www.nscorp.com, our annual report on Form 10-K, quarterly reports on Form 10-Q, current reports on Form 8-K, and all amendments to those reports as soon as reasonably practicable after such material is electronically filed with or furnished to the U.S. Securities and Exchange Commission (SEC). In addition, the following documents are available on our website and in print to any shareholder who requests them:
• | Corporate Governance Guidelines |
• | Charters of the Committees of the Board of Directors |
• | The Thoroughbred Code of Ethics |
• | Code of Ethical Conduct for Senior Financial Officers |
• | Categorical Independence Standards for Directors |
• | Norfolk Southern Corporation Bylaws |
K 3
RAILROAD OPERATIONS – At December 31, 2015, our railroads operated approximately 20,000 miles of road in 22 states and the District of Columbia.
Our system reaches many manufacturing plants, electric generating facilities, mines (in western Virginia, eastern Kentucky, southern and northern West Virginia, western Pennsylvania, and southern Illinois and Indiana), distribution centers, transload facilities, and other businesses located in our service area.
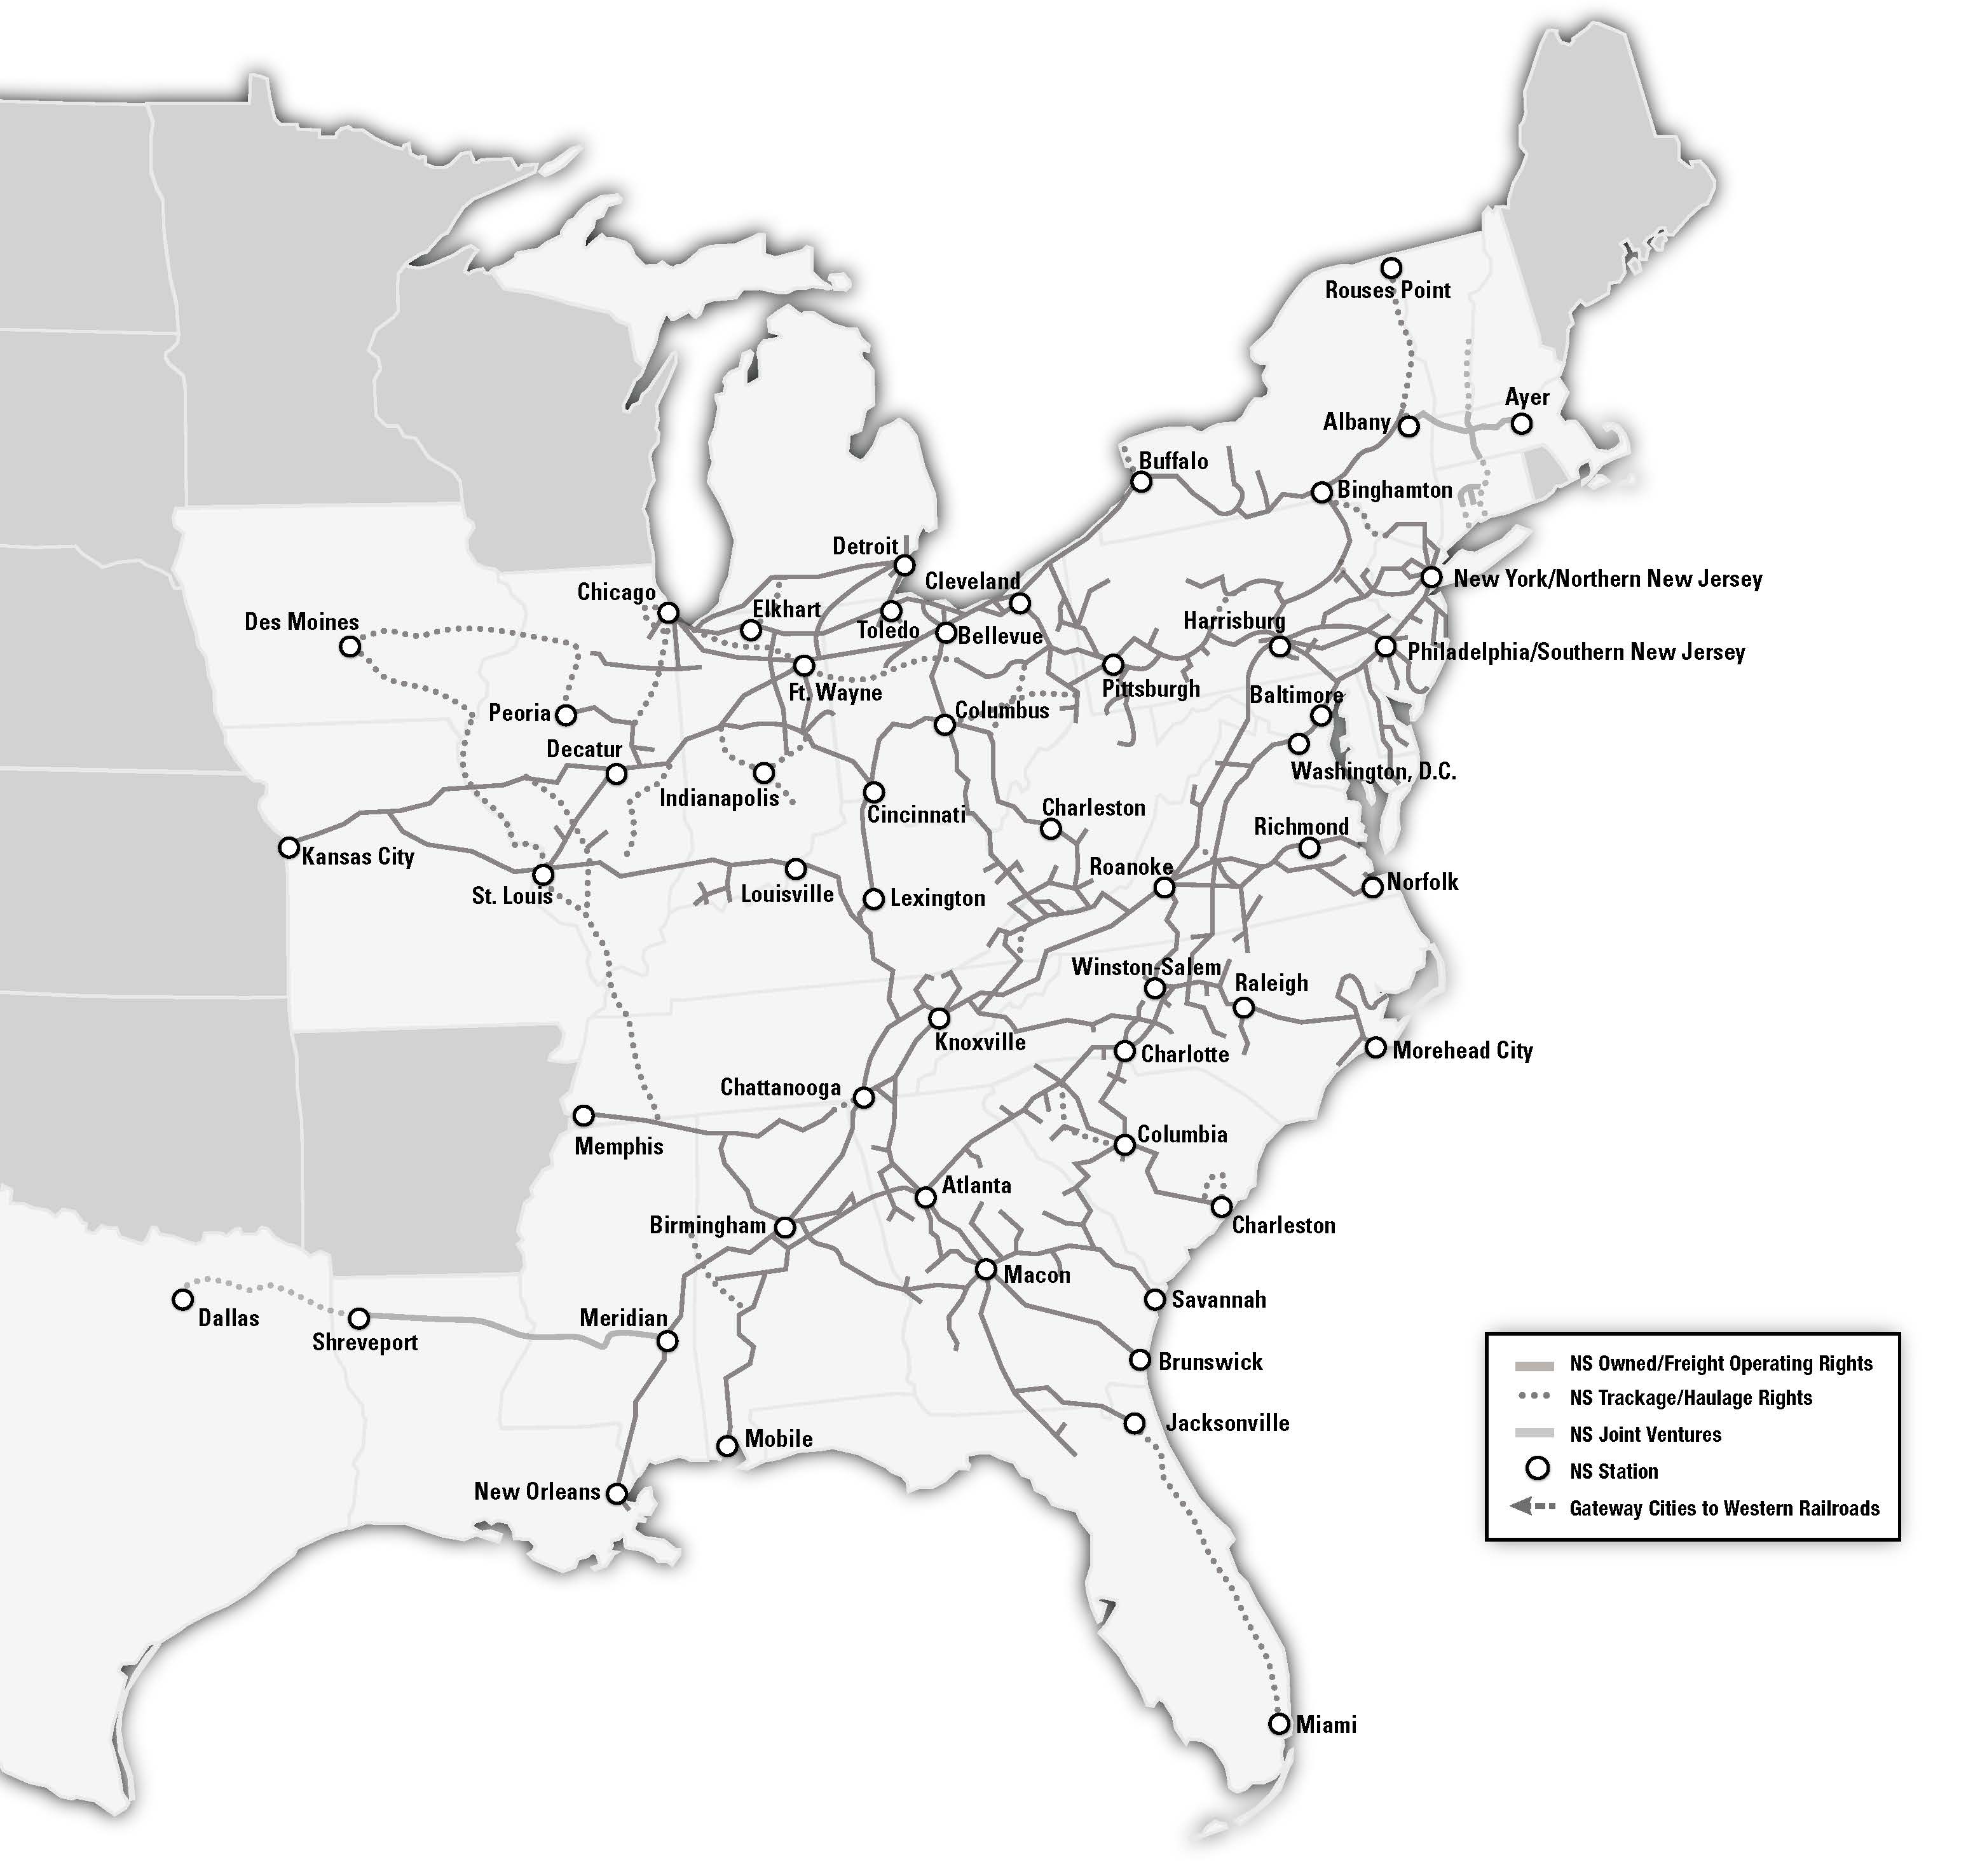
Corridors with heaviest freight volume:
• | New York City area to Chicago (via Allentown and Pittsburgh) |
• | Chicago to Macon (via Cincinnati, Chattanooga, and Atlanta) |
• | Appalachian coal fields of Virginia, West Virginia, and Kentucky to Norfolk, Virginia and Sandusky, Ohio |
• | Cleveland to Kansas City |
• | Birmingham to Meridian |
• | Memphis to Chattanooga |
K 4
The miles operated, which include major leased lines between Cincinnati, Ohio, and Chattanooga, Tennessee, and an exclusive operating agreement for trackage rights over property owned by North Carolina Railroad Company, were as follows:
Mileage Operated at December 31, 2015 | ||||||||||||||
Miles of Road | Second and Other Main Track | Passing Track, Crossovers and Turnouts | Way and Yard Switching | Total | ||||||||||
Owned | 15,194 | 2,754 | 1,976 | 8,381 | 28,305 | |||||||||
Operated under lease, contract or trackage | ||||||||||||||
rights | 4,768 | 1,916 | 398 | 834 | 7,916 | |||||||||
Total | 19,962 | 4,670 | 2,374 | 9,215 | 36,221 | |||||||||
The following table sets forth certain statistics relating to our railroads’ operations for the past 5 years:
Years ended December 31, | |||||||||||||||||||
2015 | 2014 | 2013 | 2012 | 2011 | |||||||||||||||
Revenue ton miles (billions) | 200 | 205 | 194 | 186 | 192 | ||||||||||||||
Revenue per ton mile | $ | 0.0526 | $ | 0.0567 | $ | 0.0581 | $ | 0.0595 | $ | 0.0582 | |||||||||
Revenue ton miles per employee-hour worked | 3,467 | 3,576 | 3,376 | 3,153 | 3,207 | ||||||||||||||
Ratio of railway operating expenses to railway operating | |||||||||||||||||||
revenues | 72.6% | 69.2% | 71.0% | 71.7% | 71.2% | ||||||||||||||
RAILWAY OPERATING REVENUES – Total railway operating revenues were $10.5 billion in 2015. Following is an overview of our three major market groups.
COAL – Revenues from coal accounted for about 17% of our total railway operating revenues in 2015. We handled 120 million tons, or 1.1 million carloads, in 2015, most of which originated on our lines from major eastern coal basins, with the balance from major western coal basins received via the Memphis and Chicago gateways. Our coal franchise supports the electric generation market, serving approximately 79 coal generation plants, as well as the export, metallurgical and industrial markets, primarily through direct rail and river, lake, and coastal facilities, including various terminals on the Ohio River, Lambert’s Point in Norfolk, Virginia, the Port of Baltimore, and Lake Erie.
See the discussion of coal revenues and tonnage, by type of coal, in Part II, Item 7, “Management’s Discussion and Analysis of Financial Condition and Results of Operations.”
GENERAL MERCHANDISE – Our general merchandise market group is composed of five major commodity groupings:
• | Chemicals includes sulfur and related chemicals, petroleum products (including crude oil), chlorine and bleaching compounds, plastics, rubber, industrial chemicals, and chemical wastes. |
• | Agriculture, consumer products, and government includes soybeans, wheat, corn, fertilizer, livestock and poultry feed, food oils, flour, beverages, canned goods, sweeteners, consumer products, ethanol, transportation equipment, and items for the U.S. military. |
K 5
• | Metals and construction includes steel, aluminum products, machinery, scrap metals, cement, aggregates, sand, and minerals. |
• | Automotive includes finished vehicles for BMW, Chrysler, Ford, General Motors, Honda, Hyundai, Mercedes-Benz, Mitsubishi, Subaru, Tesla, Toyota, and Volkswagen, and auto parts for BMW, Chrysler, Ford, General Motors, Honda, Hyundai, Mazda, Nissan, Subaru, Toyota, and Volkswagen. |
• | Paper, clay and forest products includes lumber and wood products, pulp board and paper products, wood fibers, wood pulp, scrap paper, and clay. |
In 2015, 124 million tons of general merchandise freight, or approximately 62% of total general merchandise tonnage we handled, originated on our lines. The balance of general merchandise freight was received from connecting carriers at interterritorial gateways. Our principal interchange points for received freight included Chicago, East St. Louis, New Orleans, Memphis, Detroit, Kansas City, Bellevue, Meridian, Buffalo and Toledo. General merchandise carloads handled in 2015 were 2.5 million, the revenues from which accounted for 60% of our total railway operating revenues.
See the discussion of general merchandise revenues by commodity group in Part II, Item 7, “Management’s Discussion and Analysis of Financial Condition and Results of Operations.”
INTERMODAL – Our intermodal market group consists of shipments moving in trailers, domestic and international containers, and RoadRailer® equipment. These shipments are handled on behalf of intermodal marketing companies, international steamship lines, truckers, and other shippers. Intermodal units handled in 2015 were 3.9 million, the revenues from which accounted for 23% of our total railway operating revenues.
See the discussion of intermodal revenues in Part II, Item 7, “Management’s Discussion and Analysis of Financial Condition and Results of Operations.”
FREIGHT RATES – Private contracts and exempt price quotes are our predominant pricing mechanisms. Thus, a major portion of our freight business is not economically regulated by the federal government. In general, market forces are the primary determinant of rail service prices.
In 2015, our railroads were found by the U.S. Surface Transportation Board (STB), the regulatory board that has broad jurisdiction over railroad practices, to be “revenue adequate” on an annual basis based on results for the year 2014. The STB has not made its revenue adequacy determination for the year 2015. A railroad is “revenue adequate” on an annual basis under the applicable law when its return on net investment exceeds the rail industry’s composite cost of capital. This determination is made pursuant to a statutory requirement.
PASSENGER OPERATIONS – Amtrak operates regularly scheduled passenger trains on our lines between the following locations:
• | Alexandria and Lynchburg, Virginia |
• | Alexandria, Virginia and New Orleans, Louisiana |
• | Alexandria and Orange, Virginia |
• | Petersburg and Norfolk, Virginia |
• | Raleigh and Charlotte, North Carolina |
• | Selma and Charlotte, North Carolina |
• | Chicago, Illinois, and Porter, Indiana |
• | Chicago, Illinois, and Cleveland, Ohio |
• | Chicago, Illinois, and Pittsburgh, Pennsylvania |
• | Pittsburgh and Harrisburg, Pennsylvania |
A consortium of two transportation commissions of the Commonwealth of Virginia operate commuter trains on our line between Manassas and Alexandria.
K 6
We lease the Chicago to Manhattan, Illinois, line to the Commuter Rail Division of the Regional Transportation Authority of Northeast Illinois (METRA).
We operate freight service over lines with significant ongoing Amtrak and commuter passenger operations, and conduct freight operations over trackage owned or leased by:
• | Amtrak |
• | New Jersey Transit |
• | Southeastern Pennsylvania Transportation Authority |
• | Metro-North Commuter Railroad Company |
• | Maryland Department of Transportation |
• | Michigan Department of Transportation |
Amtrak and various commuter agencies conduct passenger operations over trackage owned by Conrail in the Shared Assets Areas (Note 5 to the Consolidated Financial Statements).
NONCARRIER OPERATIONS – Our noncarrier subsidiaries engage principally in the acquisition, leasing, and management of coal, oil, gas and minerals; the development of commercial real estate; telecommunications; and the leasing or sale of rail property and equipment. In 2015, no such noncarrier subsidiary or industry segment grouping of noncarrier subsidiaries met the requirements for a reportable business segment under relevant authoritative accounting guidance.
RAILWAY PROPERTY
Our railroad system extends across 22 states and the District of Columbia. The railroad infrastructure makes us capital intensive with net property of approximately $29 billion on a historical cost basis.
Property Additions – Property additions for the past five years were as follows (including capitalized leases):
2015 | 2014 | 2013 | 2012 | 2011 | |||||||||||||||
($ in millions) | |||||||||||||||||||
Road and other property | $ | 1,514 | $ | 1,406 | $ | 1,421 | $ | 1,465 | $ | 1,222 | |||||||||
Equipment | 658 | 712 | 550 | 776 | 938 | ||||||||||||||
Delaware & Hudson acquisition | 213 | — | — | — | — | ||||||||||||||
Total | $ | 2,385 | $ | 2,118 | $ | 1,971 | $ | 2,241 | $ | 2,160 | |||||||||
Our capital spending and replacement programs are and have been designed to assure the ability to provide safe, efficient, and reliable rail transportation services. For 2016, we have budgeted $2.1 billion of property additions. See further discussion of our planned capital spending and replacement programs in Part II, Item 7, "Management's Discussion and Analysis of Financial Condition and Results of Operations," under the subheading "Financial Condition, Liquidity, and Capital Resources."
We have invested and will continue to invest in various projects and corridor initiatives to expand our rail network to increase capacity and improve transit times, while returning value to shareholders. Initiatives include the following:
• | The Crescent Corridor consists of a program of projects for infrastructure and other facility improvements geared toward creating seamless, high-capacity intermodal routes spanning 11 states from New Jersey to Louisiana and offering truck-competitive service along several major interstate highway corridors, including I-81, I-85, I-20, I-40, I-59, I-78, and I-75. |
• | The Heartland Corridor is a seamless, high-capacity intermodal route across Virginia and West Virginia to Midwest markets. |
K 7
• | Meridian Speedway LLC, a joint venture with Kansas City Southern, owns and operates a 320-mile rail line between Meridian, Mississippi and Shreveport, Louisiana designed to increase capacity and improve service. |
• | Pan Am Southern LLC, a joint venture with Pan Am Railways, Inc., designed to increase intermodal and automotive capacity, owns and operates a 155-mile main line track that runs between Mechanicville, New York and Ayer, Massachusetts, along with 281 miles of secondary and branch lines, including trackage rights in New York, Connecticut, Massachusetts, New Hampshire, and Vermont. |
• | The CREATE project is a public-private partnership to reduce rail and highway congestion and add freight and passenger capacity in the metropolitan Chicago area. We and other railroads have agreed to participate in CREATE. |
Equipment – At December 31, 2015, we owned or leased the following units of equipment:
Owned(1) | Leased(2) | Total | Capacity of Equipment | ||||||||
(Horsepower) | |||||||||||
Locomotives: | |||||||||||
Multiple purpose | 4,068 | 31 | 4,099 | 15,292,800 | |||||||
Auxiliary units | 155 | — | 155 | — | |||||||
Switching | 99 | — | 99 | 148,750 | |||||||
Total locomotives | 4,322 | 31 | 4,353 | 15,441,550 | |||||||
(Tons) | |||||||||||
Freight cars: | |||||||||||
Gondola | 30,392 | 3,017 | 33,409 | 3,643,031 | |||||||
Hopper | 12,516 | — | 12,516 | 1,402,161 | |||||||
Box | 10,811 | 1,363 | 12,174 | 1,022,107 | |||||||
Covered hopper | 10,267 | 85 | 10,352 | 1,144,496 | |||||||
Flat | 2,091 | 1,489 | 3,580 | 342,252 | |||||||
Other | 4,596 | 14 | 4,610 | 221,362 | |||||||
Total freight cars | 70,673 | 5,968 | 76,641 | 7,775,409 | |||||||
Other: | |||||||||||
Chassis | 24,493 | 4,245 | 28,738 | ||||||||
Containers | 21,019 | 1,939 | 22,958 | ||||||||
Work equipment | 4,666 | 318 | 4,984 | ||||||||
Vehicles | 3,828 | — | 3,828 | ||||||||
Miscellaneous | 7,295 | 27 | 7,322 | ||||||||
Total other | 61,301 | 6,529 | 67,830 | ||||||||
(1) | Includes equipment leased to outside parties and equipment subject to equipment trusts, conditional sale agreements, and capitalized leases. |
(2) | Includes short-term and long-term operating leases. |
K 8
The following table indicates the number and year built for locomotives and freight cars owned at December 31, 2015:
2015 | 2014 | 2013 | 2012 | 2011 | 2006- 2010 | 2001- 2005 | 2000 & Before | Total | ||||||||||||||||||
Locomotives: | ||||||||||||||||||||||||||
No. of units | 8 | 83 | 50 | 60 | 90 | 315 | 553 | 3,163 | 4,322 | |||||||||||||||||
% of fleet | 1 | % | 2 | % | 1 | % | 1 | % | 2 | % | 7 | % | 13 | % | 73 | % | 100 | % | ||||||||
Freight cars: | ||||||||||||||||||||||||||
No. of units | 2,033 | 900 | — | 2,017 | 3,820 | 4,695 | 165 | 57,043 | 70,673 | |||||||||||||||||
% of fleet | 3 | % | 1 | % | — | % | 3 | % | 5 | % | 6 | % | 1 | % | 81 | % | 100 | % | ||||||||
The following table shows the average age of our owned locomotive and freight car fleets at December 31, 2015, and information regarding 2015 retirements:
Locomotives | Freight Cars | ||
Average age – in service | 23.9 years | 29.6 years | |
Retirements | 13 units | 2,661 units | |
Average age – retired | 43.4 years | 45.8 years | |
Track Maintenance – Of the 36,200 total miles of track we operate, we are responsible for maintaining 29,000 miles, with the remainder being operated under trackage rights from other parties responsible for maintenance.
Over 82% of the main line trackage (including first, second, third, and branch main tracks, all excluding rail operated pursuant to trackage rights) has rail ranging from 131 to 155 pounds per yard with the standard installation currently at 136 pounds per yard. Approximately 43% of our lines, excluding rail operated pursuant to trackage rights, carried 20 million or more gross tons per track mile during 2015.
The following table summarizes several measurements regarding our track roadway additions and replacements during the past five years:
2015 | 2014 | 2013 | 2012 | 2011 | ||||||||||
Track miles of rail installed | 523 | 507 | 549 | 509 | 484 | |||||||||
Miles of track surfaced | 5,074 | 5,248 | 5,475 | 5,642 | 5,441 | |||||||||
New crossties installed (millions) | 2.4 | 2.7 | 2.5 | 2.6 | 2.7 | |||||||||
Traffic Control – Of the approximately 16,800 route miles we dispatch, about 11,300 miles are signalized, including 8,500 miles of centralized traffic control (CTC) and 2,800 miles of automatic block signals. Of the 8,500 miles of CTC, approximately 7,600 miles are controlled by data radio originating at 355 base station radio sites.
ENVIRONMENTAL MATTERS – Compliance with federal, state, and local laws and regulations relating to the protection of the environment is one our principal goals. To date, such compliance has not had a material effect on our financial position, results of operations, liquidity, or competitive position. See “Legal Proceedings,” Part I, Item 3; “Personal Injury, Environmental, and Legal Liabilities” in Part II, Item 7, “Management’s Discussion and Analysis of Financial Condition and Results of Operations,” and Note 16 to the Consolidated Financial Statements.
K 9
EMPLOYEES – The following table shows the average number of employees and the average cost per employee for wages and benefits:
2015 | 2014 | 2013 | 2012 | 2011 | |||||||||||||||
Average number of employees | 30,456 | 29,482 | 30,103 | 30,943 | 30,329 | ||||||||||||||
Average wage cost per employee | $ | 77,000 | $ | 76,000 | $ | 72,000 | $ | 69,000 | $ | 71,000 | |||||||||
Average benefit cost per employee | $ | 32,000 | $ | 35,000 | $ | 40,000 | $ | 38,000 | $ | 39,000 | |||||||||
More than 80% of our railroad employees are covered by collective bargaining agreements with various labor unions. See the discussion of “Labor Agreements” in Part II, Item 7, “Management’s Discussion and Analysis of Financial Condition and Results of Operations.”
GOVERNMENT REGULATION – In addition to environmental, safety, securities, and other regulations generally applicable to all business, our railroads are subject to regulation by the STB. The STB has jurisdiction over some rates, routes, fuel surcharges, conditions of service, and the extension or abandonment of rail lines. The STB also has jurisdiction over the consolidation, merger, or acquisition of control of and by rail common carriers. The Federal Railroad Administration (FRA) regulates certain track and mechanical equipment standards.
The relaxation of economic regulation of railroads, following the Staggers Rail Act of 1980, included exemption from STB regulation of the rates and most service terms for intermodal business (trailer-on-flat-car, container-on-flat-car), rail boxcar shipments, lumber, manufactured steel, automobiles, and certain bulk commodities such as sand, gravel, pulpwood, and wood chips for paper manufacturing. Further, all shipments that we have under contract are effectively removed from commercial regulation for the duration of the contract. About 90% of our revenues comes from either exempt shipments or shipments moving under transportation contracts; the remainder comes from shipments moving under public tariff rates.
Efforts have been made over the past several years to increase federal economic regulation of the rail industry, and such efforts are expected to continue in 2016. The Staggers Rail Act of 1980 substantially balanced the interests of shippers and rail carriers, and encouraged and enabled rail carriers to innovate, invest in their infrastructure, and compete for business, thereby contributing to the economic health of the nation and to the revitalization of the industry. Accordingly, we will continue to oppose efforts to reimpose increased economic regulation.
Government regulations concerning the safety and security of our railroads are discussed within the “Security of Operations” section contained herein.
COMPETITION – There is continuing strong competition among rail, water, and highway carriers. Price is usually only one factor of importance as shippers and receivers choose a transport mode and specific hauling company. Inventory carrying costs, service reliability, ease of handling, and the desire to avoid loss and damage during transit are also important considerations, especially for higher-valued finished goods, machinery, and consumer products. Even for raw materials, semi-finished goods, and work-in-progress, users are increasingly sensitive to transport arrangements that minimize problems at successive production stages.
Our primary rail competitor is CSX Corporation; both railroads operate throughout much of the same territory. Other railroads also operate in parts of the territory. We also compete with motor carriers, water carriers, and with shippers who have the additional options of handling their own goods in private carriage, sourcing products from different geographic areas, and using substitute products.
Certain marketing strategies to expand reach and shipping options among railroads and between railroads and motor carriers enable railroads to compete more effectively in specific markets.
SECURITY OF OPERATIONS - We continue to take measures to enhance the security of our rail system. Our comprehensive security plan is modeled on and was developed in conjunction with the security plan prepared by the
K 10
Association of American Railroads (AAR) post September 11, 2001. The AAR Security Plan defines four Alert Levels and details the actions and countermeasures that are being applied across the railroad industry as a terrorist threat increases or decreases. The Alert Level actions include countermeasures that will be applied in three general areas: (1) operations (including transportation, engineering, and mechanical); (2) information technology and communications; and, (3) railroad police. All of our Operations Division employees are advised by their supervisors or train dispatchers, as appropriate, of any change in Alert Level and any additional responsibilities they may incur due to such change.
Our plan also complies with U.S. Department of Transportation (DOT) security regulations pertaining to training and security plans with respect to the transportation of hazardous materials. As part of the plan, security awareness training is given to all railroad employees who directly affect hazardous material transportation safety, and is integrated into hazardous material training programs. Additionally, location-specific security plans are in place for certain metropolitan areas and each of the six port facilities we serve. With respect to the ports, each facility's security plan has been approved by the applicable Captain of the Port and remains subject to inspection by the U.S. Coast Guard.
Additionally, we continue to engage in close and regular coordination with numerous federal and state agencies, including the U.S. Department of Homeland Security (DHS), the TSA, the Federal Bureau of Investigation (FBI), the FRA, the U.S. Coast Guard, U.S. Customs and Border Protection, and various state Homeland Security offices.
Similarly, we follow guidance from DHS and DOT regarding rail corridors in High Threat Urban Areas (HTUA). Particular attention is aimed at reducing risk in HTUA by: (1) the establishment of secure storage areas for rail cars carrying toxic-by-inhalation (TIH) materials; (2) the expedited movement of trains transporting rail cars carrying TIH materials; (3) substantially reducing the number of unattended loaded tank cars carrying TIH materials; and (4) cooperation with federal, state, local, and tribal governments to identify those locations where security risks are the highest.
In 2015, through participation in the Transportation Community Awareness and Emergency Response (TRANSCAER) Program, we provided rail accident response training to approximately 4,792 emergency responders, such as local police and fire personnel. Our other training efforts throughout 2015 included participation in drills for local, state, and federal agencies. We also have ongoing programs to sponsor local emergency responders at the Security and Emergency Response Training Course conducted at the AAR Transportation Technology Center in Pueblo, Colorado.
Item 1A. Risk Factors
We are subject to significant governmental legislation and regulation over commercial, operating and environmental matters. Congress can enact laws that could increase economic regulation of the industry. Railroads presently are subject to commercial regulation by the Surface Transportation Board (STB), which has jurisdiction over some rates, routes, fuel surcharges, conditions of service, and the extension or abandonment of rail lines. The STB also has jurisdiction over the consolidation, merger, or acquisition of control of and by rail common carriers. Additional economic regulation of the rail industry by Congress or the STB, whether under new or existing laws, could have a significant negative impact on our ability to determine prices for rail services and on the efficiency of our operations, either of which could result in a material adverse effect in the future on our financial position, results of operations, or liquidity in a particular year or quarter. This potential material adverse effect could also result in reduced capital spending on our rail network or abandonment of lines.
Railroads are also subject to the enactment of laws by Congress and regulation by the U.S. Department of Transportation and the U.S. Department of Homeland Security (which regulate most aspects of our operations) related to safety and security. The Rail Safety Improvement Act of 2008 (RSIA), the Surface Transportation Extension Act of 2015, and the implementing regulations promulgated by the Federal Railroad Administration (FRA) require us and each other Class I railroad to implement an interoperable positive train control system (PTC) on certain of our respective lines by December 31, 2018.
K 11
Full implementation of PTC in compliance with RSIA will result in additional operating costs and capital expenditures, and PTC implementation may result in reduced operational efficiency and service levels, as well as increased compensation and benefits expenses, and increased claims and litigation costs.
Our operations are subject to extensive federal and state environmental laws and regulations concerning, among other things, emissions to the air; discharges to waterways or groundwater supplies; handling, storage, transportation, and disposal of waste and other materials; and the cleanup of hazardous material or petroleum releases. The risk of incurring environmental liability - for acts and omissions, past, present, and future - is inherent in the railroad business. This risk includes property owned by us, whether currently or in the past, that is or has been subject to a variety of uses, including our railroad operations and other industrial activity by past owners or our past and present tenants.
Environmental problems that are latent or undisclosed may exist on these properties, and we could incur environmental liabilities or costs, the amount and materiality of which cannot be estimated reliably at this time, with respect to one or more of these properties. Moreover, lawsuits and claims involving other unidentified environmental sites and matters are likely to arise from time to time, and the resulting liabilities could have a significant effect on our financial position, results of operations, or liquidity in a particular year or quarter.
As a common carrier by rail, we must offer to transport hazardous materials, regardless of risk. Transportation of certain hazardous materials could create catastrophic losses in terms of personal injury and property (including environmental) damage, and compromise critical parts of our rail network. A catastrophic rail accident involving hazardous materials could have a material adverse effect on our financial position, results of operations, or liquidity to the extent not covered by insurance. We have obtained insurance for potential losses for third-party liability and first-party property damages (see Note 16 to the Consolidated Financial Statements); however, insurance is available from a limited number of insurers and may not continue to be available or, if available, may not be obtainable on terms acceptable to us.
We may be affected by terrorism or war. Any terrorist attack, or other similar event, any government response thereto, and war or risk of war could cause significant business interruption and may adversely affect our financial position, results of operations, or liquidity in a particular year or quarter. Because we play a critical role in the nation’s transportation system, we could become the target of such an attack or have a significant role in the government’s preemptive approach or response to an attack or war.
Although we currently maintain insurance coverage for third-party liability arising out of war and acts of terrorism, we maintain only limited insurance coverage for first-party property damage and damage to property in our care, custody, or control caused by certain acts of terrorism. In addition, premiums for some or all of our current insurance programs covering these losses could increase dramatically, or insurance coverage for certain losses could be unavailable to us in the future.
We may be affected by general economic conditions. Prolonged negative changes in domestic and global economic conditions affecting the producers and consumers of the commodities we carry may have an adverse effect on our financial position, results of operations, or liquidity in a particular year or quarter. Economic conditions resulting in bankruptcies of one or more large customers could have a significant impact on our financial position, results of operations, or liquidity in a particular year or quarter.
We may be affected by energy prices. Volatility in energy prices could have an effect on a variety of items including, but not limited to: the economy; demand for transportation services; business related to the energy sector, including crude, natural gas, and coal; fuel prices; and fuel surcharges. Any of these items could have a significant impact on our financial position, results of operations, or liquidity in a particular year or quarter.
We may be affected by climate change legislation or regulation. Concern over climate change has led to significant federal, state, and international legislative and regulatory efforts to limit greenhouse gas (GHG) emissions. Moreover, even without such legislation or regulation, government incentives and adverse publicity
K 12
relating to GHGs could affect certain of our customers and the markets for certain of the commodities we carry. Restrictions, caps, taxes, or other controls on GHG emissions, including diesel exhaust, could significantly increase our operating costs, decrease the amount of traffic handled, and decrease the value of coal reserves we own, and thus could have an adverse effect on our financial position, results of operations, or liquidity in a particular year or quarter. Such restrictions could affect our customers that (1) use commodities that we carry to produce energy, including coal, (2) use significant amounts of energy in producing or delivering the commodities we carry, or (3) manufacture or produce goods that consume significant amounts of energy.
We face competition from other transportation providers. We are subject to competition from motor carriers, railroads and, to a lesser extent, ships, barges, and pipelines, on the basis of transit time, pricing, and quality and reliability of service. While we have used primarily internal resources to build or acquire and maintain our rail system, trucks and barges have been able to use public rights-of-way maintained by public entities. Any future improvements or expenditures materially increasing the quality or reducing the cost of alternative modes of transportation in the regions in which we operate, or legislation granting materially greater latitude for motor carriers with respect to size or weight limitations, could have a material adverse effect on our financial position, results of operations, or liquidity in a particular year or quarter.
The operations of carriers with which we interchange may adversely affect our operations. Our ability to provide rail service to customers in the U.S. and Canada depends in large part upon our ability to maintain cooperative relationships with connecting carriers with respect to, among other matters, freight rates, revenue division, car supply and locomotive availability, data exchange and communications, reciprocal switching, interchange, and trackage rights. Deterioration in the operations of or service provided by connecting carriers, or in our relationship with those connecting carriers, could result in our inability to meet our customers’ demands or require us to use alternate train routes, which could result in significant additional costs and network inefficiencies.
We rely on technology and technology improvements in our business operations. If we experience significant disruption or failure of one or more of our information technology systems, including computer hardware, software, and communications equipment, we could experience a service interruption, a security breach, or other operational difficulties. Additionally, if we do not have sufficient capital to acquire new technology or we are unable to implement new technology, we may suffer a competitive disadvantage within the rail industry and with companies providing other modes of transportation service. Any of these factors could have a material adverse effect on our financial position, results of operations, or liquidity in a particular year or quarter.
The vast majority of our employees belong to labor unions, and labor agreements, strikes, or work stoppages could adversely affect our operations. More than 80% of our railroad employees are covered by collective bargaining agreements with various labor unions. If unionized workers were to engage in a strike, work stoppage, or other slowdown, we could experience a significant disruption of our operations. Additionally, future national labor agreements, or renegotiation of labor agreements or provisions of labor agreements, could significantly increase our costs for healthcare, wages, and other benefits. Any of these factors could have a material adverse impact on our financial position, results of operations, or liquidity in a particular year or quarter.
We may be subject to various claims and lawsuits that could result in significant expenditures. The nature of our business exposes us to the potential for various claims and litigation related to labor and employment, personal injury, commercial disputes, freight loss and other property damage, and other matters. Job-related personal injury and occupational claims are subject to the Federal Employer’s Liability Act (FELA), which is applicable only to railroads. FELA’s fault-based tort system produces results that are unpredictable and inconsistent as compared with a no-fault worker’s compensation system. The variability inherent in this system could result in actual costs being very different from the liability recorded.
Any material changes to current litigation trends or a catastrophic rail accident involving any or all of freight loss property damage, personal injury, and environmental liability could have a material adverse effect on our financial position, results of operations, or liquidity to the extent not covered by insurance. We have obtained insurance for potential losses for third-party liability and first-party property damages (see Note 16 to the Consolidated Financial
K 13
Statements); however, insurance is available from a limited number of insurers and may not continue to be available or, if available, may not be obtainable on terms acceptable to us.
Severe weather could result in significant business interruptions and expenditures. Severe weather conditions and other natural phenomena, including hurricanes, floods, fires, and earthquakes, may cause significant business interruptions and result in increased costs, increased liabilities, and decreased revenues, which could have an adverse effect on our financial position, results of operations, or liquidity in a particular year or quarter.
Unpredictability of demand for rail services resulting in the unavailability of qualified personnel could adversely affect our operational efficiency and ability to meet demand. Workforce demographics, training requirements, and the availability of qualified personnel, particularly engineers and trainmen, could each have a negative impact on our ability to meet demand for rail service. Unpredictable increases in demand for rail services may exacerbate such risks, which could have a negative impact on our operational efficiency and otherwise have a material adverse effect on our financial position, results of operations, or liquidity in a particular year or quarter.
We may be affected by supply constraints resulting from disruptions in the fuel markets or the nature of some of our supplier markets. We consumed approximately 487 million gallons of diesel fuel in 2015. Fuel availability could be affected by any limitation in the fuel supply or by any imposition of mandatory allocation or rationing regulations. A severe fuel supply shortage arising from production curtailments, increased demand in existing or emerging foreign markets, disruption of oil imports, disruption of domestic refinery production, damage to refinery or pipeline infrastructure, political unrest, war or other factors, could have a material adverse effect on our financial position, results of operations, or liquidity in a particular year or quarter. Also, such an event could impact us as well as our customers and other transportation companies.
Due to the capital intensive nature, as well as the industry-specific requirements of the rail industry, high barriers of entry exist for potential new suppliers of core railroad items, such as locomotives and rolling stock equipment. Additionally, we compete with other industries for available capacity and raw materials used in the production of locomotives and certain track and rolling stock materials. Changes in the competitive landscapes of these limited-supplier markets could result in increased prices or significant shortages of materials that could have a material adverse effect on our financial position, results of operations, or liquidity in a particular year or quarter.
The state of capital markets could adversely affect our liquidity. From time-to-time we rely on the capital markets to provide some of our capital requirements, including the issuance of long-term debt instruments and commercial paper, as well as the sale of certain receivables. Significant instability or disruptions of the capital markets, including the credit markets, or deterioration of our financial condition due to internal or external factors could restrict or eliminate our access to, and/or significantly increase the cost of, various financing sources, including bank credit facilities and issuance of corporate bonds. Instability or disruptions of the capital markets and deterioration of our financial condition, alone or in combination, could also result in a reduction in our credit rating to below investment grade, which could prohibit or restrict us from accessing external sources of short- and long-term debt financing and/or significantly increase the associated costs.
Item 1B. Unresolved Staff Comments
None.
K 14
Item 3. Legal Proceedings
On November 6, 2007, various antitrust class actions filed against us and other Class I railroads in various Federal district courts regarding fuel surcharges were consolidated in the District of Columbia by the Judicial Panel on Multidistrict Litigation. On June 21, 2012, the court certified the case as a class action. The defendant railroads appealed this certification, and the Court of Appeals for the District of Columbia vacated the District Court’s decision and remanded the case for further consideration. We believe the allegations in the complaints are without merit and intend to vigorously defend the cases. We do not believe the outcome of these proceedings will have a material effect on our financial position, results of operations, or liquidity. A lawsuit containing similar allegations against us and four other major railroads that was filed on March 25, 2008, in the U.S. District Court for the District of Minnesota, was voluntarily dismissed by the plaintiff subject to a tolling agreement entered into in August 2008, and most recently extended in August 2013.
In 2012, we received a Notice of Violation (NOV) issued by the Tennessee Department of Environmental Conservation concerning soil runoff in connection with construction of the Memphis Regional Intermodal Facility in Rossville, Tennessee. Although we will contest liability and the imposition of any penalties - which could exceed $100,000 - this matter is described here consistent with SEC rules and requirements concerning governmental proceedings with respect to environmental laws and regulations. We do not believe that the outcome of this proceeding will have a material effect on our financial position, results of operations, or liquidity.
Item 4. Mine Safety Disclosures
Not applicable.
K 15
Executive Officers of the Registrant
Our executive officers generally are elected and designated annually by the Board of Directors at its first meeting held after the annual meeting of stockholders, and they hold office until their successors are elected. Executive officers also may be elected and designated throughout the year as the Board of Directors considers appropriate. There are no family relationships among our officers, nor any arrangement or understanding between any officer and any other person pursuant to which the officer was selected. The following table sets forth certain information, at February 1, 2016, relating to our officers.
Name, Age, Present Position | Business Experience During Past Five Years |
James A. Squires, 54, Chairman, President, and Chief Executive Officer | Present position since June 1, 2015. Served as President since June 1, 2013. Served as Executive Vice President – Administration from August 1, 2012 to June 1, 2013. Served as Executive Vice President – Finance and Chief Financial Officer from July 1, 2007 to August 1, 2012. |
Cindy C. Earhart, 54, Executive Vice President – Administration and Chief Information Officer | Present position since June 1, 2013. Served as Vice President Human Resources from March 1, 2007 to June 1, 2013. |
James A. Hixon, 62, Executive Vice President – Law and Corporate Relations | Present position since October 1, 2005. |
Alan H. Shaw, 48 Executive Vice President and Chief Marketing Officer | Present position since May 16, 2015. Served as Vice President Intermodal Operations from November 1, 2013 to May 15, 2015. Served as Group Vice President Industrial Products from November 16, 2009 to October 31, 2013. |
Marta R. Stewart, 58, Executive Vice President – Finance and Chief Financial Officer | Present position since November 1, 2013. Served as Vice President and Treasurer from April 1, 2009 to November 1, 2013. |
Michael J. Wheeler, 53, Executive Vice President and Chief Operating Officer | Present position since February 1, 2016. Served as Senior Vice President Operations October 1, 2015 to January 31, 2016. Served as Vice President Engineering November 1, 2012 to September 30, 2015. Served as Vice President Transportation February 1, 2009 to October 31, 2012. |
Thomas E. Hurlbut, 51, Vice President and Controller | Present position since November 1, 2013. Served as Vice President Audit and Compliance from February 1, 2010 to November 1, 2013. |
K 16
PART II
NORFOLK SOUTHERN CORPORATION AND SUBSIDIARIES
Item 5. Market for Registrant’s Common Equity, Related Stockholder Matters and Issuer Purchases of Equity Securities
STOCK PRICE AND DIVIDEND INFORMATION
Common Stock is owned by 28,443 stockholders of record as of December 31, 2015 and is traded on the New York Stock Exchange under the symbol “NSC.” The following table shows the high and low sales prices as reported by Bloomberg L.P. on its internet-based service and dividends per share, by quarter, for 2015 and 2014.
Quarter | |||||||||||||||
2015 | 1st | 2nd | 3rd | 4th | |||||||||||
Market Price | |||||||||||||||
High | $ | 111.63 | $ | 106.47 | $ | 88.03 | $ | 97.07 | |||||||
Low | 100.14 | 87.24 | 73.57 | 77.19 | |||||||||||
Dividends per share | 0.59 | 0.59 | 0.59 | 0.59 | |||||||||||
2014 | 1st | 2nd | 3rd | 4th | |||||||||||
Market Price | |||||||||||||||
High | $ | 97.58 | $ | 104.09 | $ | 112.34 | $ | 117.24 | |||||||
Low | 87.20 | 92.78 | 100.11 | 101.98 | |||||||||||
Dividends per share | 0.54 | 0.54 | 0.57 | 0.57 | |||||||||||
ISSUER PURCHASES OF EQUITY SECURITIES
Period | Total Number of Shares (or Units) Purchased(1) | Average Price Paid per Share (or Unit) | Total Number of Shares (or Units) Purchased as Part of Publicly Announced Plans or Programs(2) | Maximum Number (or Approximate Dollar Value) of Shares (or Units) that may yet be Purchased under the Plans or Programs(2) | |||||||||
October 1-31, 2015 | 749,906 | $ | 79.74 | 746,144 | 24,159,632 | ||||||||
November 1-30, 2015 | 241,117 | 80.10 | 241,117 | 23,918,515 | |||||||||
December 1-31, 2015 | — | — | — | 23,918,515 | |||||||||
Total | 991,023 | 987,261 | |||||||||||
(1) | Of this amount, 3,762 represents shares tendered by employees in connection with the exercise of stock options under the stockholder-approved Long-Term Incentive Plan. |
(2) | Our Board of Directors authorized a share repurchase program, pursuant to which up to 50 million shares of Common Stock through December 31, 2017. |
K 17
Item 6. Selected Financial Data
FIVE-YEAR FINANCIAL REVIEW
2015 | 2014 | 2013 | 2012 | 2011 | |||||||||||||||
($ in millions, except per share amounts) | |||||||||||||||||||
RESULTS OF OPERATIONS | |||||||||||||||||||
Railway operating revenues | $ | 10,511 | $ | 11,624 | $ | 11,245 | $ | 11,040 | $ | 11,172 | |||||||||
Railway operating expenses | 7,627 | 8,049 | 7,988 | 7,916 | 7,959 | ||||||||||||||
Income from railway operations | 2,884 | 3,575 | 3,257 | 3,124 | 3,213 | ||||||||||||||
Other income – net | 103 | 104 | 233 | 129 | 160 | ||||||||||||||
Interest expense on debt | 545 | 545 | 525 | 495 | 455 | ||||||||||||||
Income before income taxes | 2,442 | 3,134 | 2,965 | 2,758 | 2,918 | ||||||||||||||
Provision for income taxes | 886 | 1,134 | 1,055 | 1,009 | 1,002 | ||||||||||||||
Net income | $ | 1,556 | $ | 2,000 | $ | 1,910 | $ | 1,749 | $ | 1,916 | |||||||||
PER SHARE DATA | |||||||||||||||||||
Net income – basic | $ | 5.13 | $ | 6.44 | $ | 6.10 | $ | 5.42 | $ | 5.52 | |||||||||
– diluted | 5.10 | 6.39 | 6.04 | 5.37 | 5.45 | ||||||||||||||
Dividends | 2.36 | 2.22 | 2.04 | 1.94 | 1.66 | ||||||||||||||
Stockholders’ equity at year end | 40.93 | 40.25 | 36.55 | 31.08 | 30.00 | ||||||||||||||
FINANCIAL POSITION | |||||||||||||||||||
Total assets | $ | 34,260 | $ | 33,200 | $ | 32,439 | $ | 30,302 | $ | 28,505 | |||||||||
Total debt | 10,093 | 8,985 | 9,404 | 8,642 | 7,507 | ||||||||||||||
Stockholders’ equity | 12,188 | 12,408 | 11,289 | 9,760 | 9,911 | ||||||||||||||
OTHER | |||||||||||||||||||
Property additions | $ | 2,385 | $ | 2,118 | $ | 1,971 | $ | 2,241 | $ | 2,160 | |||||||||
Average number of shares outstanding (thousands) | 301,873 | 309,367 | 311,916 | 320,864 | 345,484 | ||||||||||||||
Number of stockholders at year end | 28,443 | 29,575 | 30,990 | 32,347 | 33,381 | ||||||||||||||
Average number of employees: | |||||||||||||||||||
Rail | 30,057 | 29,063 | 29,698 | 30,543 | 29,933 | ||||||||||||||
Nonrail | 399 | 419 | 405 | 400 | 396 | ||||||||||||||
Total | 30,456 | 29,482 | 30,103 | 30,943 | 30,329 | ||||||||||||||
See accompanying consolidated financial statements and notes thereto.
K 18
Item 7. Management’s Discussion and Analysis of Financial Condition and Results of Operations
Norfolk Southern Corporation and Subsidiaries
The following discussion and analysis should be read in conjunction with the Consolidated Financial Statements and Notes and the Selected Financial Data.
OVERVIEW
We are one of the nation’s premier transportation companies. Our Norfolk Southern Railway Company subsidiary operates approximately 20,000 miles of road in 22 states and the District of Columbia, serves every major container port in the eastern United States, and provides efficient connections to other rail carriers. We operate the most extensive intermodal network in the East and are a major transporter of coal, automotive and industrial products.
We faced significant headwinds during 2015 as operating revenues were negatively impacted by the steep decline in energy prices, which drove both reduced fuel surcharge revenue and volume decreases in coal and energy-related products. Despite these challenges we continued our focus on deploying resources to improve network velocity and service, while streamlining our corporate assets with the restructuring of our Triple Crown Services Company (TCS) subsidiary and the closure of our Roanoke, Virginia, corporate office. As a result of operational improvements, network fluidity improved throughout the year, as evidenced by a 21% decrease in terminal dwell from the beginning of the year and a 17% improvement in train speed over the same time period.
In 2016, we expect to see continued improvement in our service levels and the implementation of multiple cost-control initiatives, as we balance resources with the demand for our high-quality rail service. Through these initiatives, we expect to produce expense savings of $130 million in 2016 while increasing productivity and efficiency. We also expect to see modest growth in our intermodal and automotive markets, which should help temper weakness in our commodity-related markets. However, further declines in commodity prices or consumer activity could erode demand. Average revenue per unit is anticipated to benefit from pricing gains. Improving our rail service, generating higher returns on capital, and increasing the efficiency of our resources remain our focus and we believe we are well-positioned to meet continued headwinds in 2016.
SUMMARIZED RESULTS OF OPERATIONS
2015 Compared with 2014
Net income in 2015 was $1.6 billion, or $5.10 per diluted share, down $444 million, or 22%, compared with $2.0 billion, or $6.39 per diluted share, in 2014. The decrease in net income for the year reflected lower income from railway operations, down $691 million, or 19%, primarily due to a $1.1 billion, or 10%, decline in railway operating revenues as a result of lower average revenue per unit (driven primarily by reduced fuel surcharge revenues offset in part by price increases) and depressed coal volumes. This decline in revenues was partially offset by lower operating expenses (down $422 million, or 5%) resulting from the drop in oil prices, which significantly reduced fuel expense for the year, and by lower incentive compensation expense. These expense reductions were partially offset by $93 million of costs associated with the restructuring of our TCS subsidiary and the closure of our Roanoke, Virginia corporate office, which reduced net income by $58 million, or $0.19 per diluted share, and by higher wage rates.
2014 Compared with 2013
Net income in 2014 was $2.0 billion, or $6.39 per diluted share, up $90 million, or 5%, compared with
$1.9 billion, or $6.04 per diluted share, in 2013, as a 10% increase in income from railway operations was only partially offset by the absence of a gain from a land sale in Michigan, which benefited net income by $60 million and earnings per share by $0.19 in 2013. Railway operating revenues rose 3%, while operating expenses increased
K 19
only 1%, driven largely by higher volume-related expenses that were offset in part by lower compensation and benefits costs and fuel prices.
DETAILED RESULTS OF OPERATIONS
Railway Operating Revenues
Railway operating revenues were $10.5 billion in 2015, $11.6 billion in 2014, and $11.2 billion in 2013. The following table presents a three-year comparison of revenues, volumes, and average revenue per unit by market group.
Revenues | Units | Revenue per Unit | ||||||||||||||||||||||||||||||
2015 | 2014 | 2013 | 2015 | 2014 | 2013 | 2015 | 2014 | 2013 | ||||||||||||||||||||||||
($ in millions) | (in thousands) | ($ per unit) | ||||||||||||||||||||||||||||||
Coal | $ | 1,823 | $ | 2,382 | $ | 2,543 | 1,079.7 | 1,284.4 | 1,346.7 | $ | 1,688 | $ | 1,855 | $ | 1,888 | |||||||||||||||||
General merchandise: | ||||||||||||||||||||||||||||||||
Chemicals | 1,760 | 1,863 | 1,667 | 527.6 | 502.6 | 449.2 | 3,335 | 3,707 | 3,711 | |||||||||||||||||||||||
Agr./consumer/gov’t. | 1,516 | 1,498 | 1,467 | 609.0 | 603.8 | 594.3 | 2,489 | 2,481 | 2,468 | |||||||||||||||||||||||
Metals/construction | 1,263 | 1,521 | 1,405 | 672.4 | 725.6 | 666.9 | 1,879 | 2,096 | 2,106 | |||||||||||||||||||||||
Automotive | 969 | 1,004 | 984 | 429.3 | 410.1 | 402.1 | 2,258 | 2,447 | 2,448 | |||||||||||||||||||||||
Paper/clay/forest | 771 | 794 | 795 | 299.9 | 303.2 | 309.4 | 2,573 | 2,619 | 2,570 | |||||||||||||||||||||||
General merchandise | 6,279 | 6,680 | 6,318 | 2,538.2 | 2,545.3 | 2,421.9 | 2,474 | 2,624 | 2,609 | |||||||||||||||||||||||
Intermodal | 2,409 | 2,562 | 2,384 | 3,861.0 | 3,845.2 | 3,572.3 | 624 | 666 | 667 | |||||||||||||||||||||||
Total | $ | 10,511 | $ | 11,624 | $ | 11,245 | 7,478.9 | 7,674.9 | 7,340.9 | 1,405 | 1,515 | 1,532 | ||||||||||||||||||||
Revenues decreased $1.1 billion in 2015, and increased $379 million in 2014. As reflected in the table below, the decline in 2015 resulted from lower average revenue per unit (a result of reduced fuel surcharge revenues, which were down $852 million, or 64%) and decreased volumes (primarily driven by continued weakness in the coal markets). The increase in 2014 resulted from higher volumes, partially offset by lower average revenue per unit as the effects of lower rates and changes in the mix of business more than offset higher fuel surcharges.
Revenue Variance Analysis Increase (Decrease) | |||||||
2015 vs. 2014 | 2014 vs. 2013 | ||||||
($ in millions) | |||||||
Revenue per unit | $ | (816 | ) | $ | (133 | ) | |
Volume (units) | (297 | ) | 512 | ||||
Total | $ | (1,113 | ) | $ | 379 | ||
Over 85% of our revenue base is covered by negotiated fuel surcharges, and revenues associated with these surcharges totaled $477 million, $1,329 million, and $1,254 million in 2015, 2014 and 2013, respectively. Fuel surcharge revenues are typically tied to either West Texas Intermediate Crude Oil (WTI) or On-Highway Diesel (OHD). Although less than half of our revenue base subject to fuel surcharges is tied to OHD, because WTI price levels were below most of our surcharge trigger points during 2015, OHD accounted for about 85% of our fuel surcharge revenues. All of our WTI-related fuel surcharge revenue and about 20% of our OHD-related fuel
K 20
surcharge revenue is on a two-month lag. This two-month lag increased fuel surcharge revenues by $34 million and $84 million in 2015 and 2014, respectively, but decreased fuel surcharge revenue by approximately $29 million in 2013. Should the current fuel price environment persist in 2016, we expect fuel surcharge revenue to be lower than 2015.
Two of our customers, DuPont and Sunbelt Chlor Alkali Partnership (Sunbelt), filed rate reasonableness complaints before the Surface Transportation Board (STB) alleging that our tariff rates for transportation of regulated movements are unreasonable. Since June 1, 2009, in the case of DuPont, and April 1, 2011, in the case of Sunbelt, we have been billing and collecting amounts based on the challenged tariff rates. In 2014, the STB resolved both rate reasonableness complaints in our favor. The STB’s findings in the Sunbelt case remain subject to technical corrections and requests for reconsideration. Both cases remain open to possible appeal. We believe the estimate of any reasonably possible loss will not have a material effect on our financial position, results of operations, or liquidity. With regard to rate cases, we record adjustments to revenues in the periods if and when such adjustments are probable and estimable.
COAL revenues decreased $559 million, or 23%, compared with 2014, reflecting a 16% decline in carload volume. Average revenue per unit was down 9%, primarily due to reduced fuel surcharge revenues, which lowered average revenue per unit by $134.
In 2014, coal revenues decreased $161 million, or 6%, compared with 2013, reflecting a 5% decrease in carload volume. Average revenue per unit was down 2%, the result of lower pricing (mainly export coal) and the negative effect of changes in mix.
For 2016, coal revenues are expected to decrease primarily due to lower volumes associated with continued weak demand.
Coal represented 17% of our revenues in 2015, and 77% of shipments handled originated on our lines. As shown in the following table, tonnage decreased in all markets.
Coal Tonnage by Market | ||||||||
2015 | 2014 | 2013 | ||||||
(tons in thousands) | ||||||||
Utility | 81,137 | 93,884 | 97,146 | |||||
Export | 16,193 | 23,218 | 28,631 | |||||
Domestic metallurgical | 14,450 | 16,130 | 16,905 | |||||
Industrial | 8,201 | 8,599 | 7,388 | |||||
Total | 119,981 | 141,831 | 150,070 | |||||
Utility coal tonnage was down 14% in 2015, compared with 2014. The decrease primarily resulted from reduced coal burn due to significantly lower natural gas prices which caused utilities to shift from coal to natural gas generation as well as coal plant retirements (due to the Mercury and Air Toxics Standards implementation) and mild weather during the last half of 2015.
Utility coal tonnage was down 3% in 2014 as compared with 2013. Lower utility coal shipments to our northern region due to market share loss and competition from lower priced natural gas were offset in part by gains in our southern region, resulting from strong demand for electric generation and stockpile rebuilding after a harsh winter.
For 2016, we expect utility coal tonnage to decrease, as we expect lower demand resulting from high stockpiles due to mild weather and depressed natural gas prices.
K 21
Export coal tonnage decreased 30% in 2015, compared with 2014. Competition faced by U.S. coal suppliers continued to increase as excess coal supply, a strong U.S. dollar, and depressed coal prices significantly reduced demand for U.S. export coal. Volume through Norfolk was down 5.5 million tons, or 33%, and volume through Baltimore was down 1.5 million tons, or 23%.
In 2014, export coal tonnage decreased 19%, compared with 2013. Strong competition in the global metallurgical and thermal coal markets resulting from excess coal supply, weakening economies in the global market, and a strong Australian currency advantage significantly reduced demand for U.S. export coal. Volume through Norfolk was down 4.3 million tons, or 20%, and volume through Baltimore was down 0.5 million tons, or 8%. Other export volume decreased 0.6 million tons, or 85%.
For 2016, export coal tonnage is expected to decrease, as we expect continued pressure in the overseas coal markets due to oversupply, weak seaborne coal prices, and a strong U.S. dollar.
Domestic metallurgical coal tonnage was down 10% in 2015, compared with 2014, and down 5% in 2014 as compared to 2013. Both years reflect volume losses related to plant curtailments and sourcing shifts resulting from steel producers looking for opportunities to reduce costs that were offset in part by market share gains.
For 2016, domestic metallurgical coal tonnage is expected to remain relatively flat as customer-specific gains will be partially offset by volume decreases due to plant curtailments and sourcing shifts as we expect steel producers to continue to look for opportunities to reduce costs.
Industrial coal tonnage dropped 5% in 2015, compared with 2014, as a result of natural gas conversions and decreased coal burn.
In 2014, industrial coal tonnage increased 16% compared with 2013, as new business opportunities with existing customers was partially offset by declines in anthracite and petcoke shipments.
For 2016, industrial coal tonnage is expected to remain flat due to reduced demand resulting from conversions to natural gas offset by additional business with existing customers.
GENERAL MERCHANDISE revenues in 2015 decreased $401 million, or 6%, compared with 2014, reflecting a 6% decline in average revenue per unit, the result of lower fuel surcharge revenues, which reduced average revenue per unit by $185 and offset the effects of higher rates. Volume was relatively flat year over year.
In 2014, general merchandise revenues increased $362 million, or 6%, compared with 2013, reflecting 5% growth in carload volume and a 1% improvement in average revenue per unit that reflected favorable changes in fuel surcharge revenue and in mix.
For 2016, general merchandise revenues are expected to increase primarily due to pricing gains.
Chemicals revenues in 2015 decreased 6%, compared with 2014, reflecting a 10% decrease in revenue per unit, driven by reduced fuel surcharge revenues and negative mix resulting from increased shipments of lower rated liquefied petroleum gas, which more than offset the effect of higher rates. Volume grew 5%, largely driven by more shipments of liquefied petroleum gas and strong demand for shipments of polypropylene due to lower feedstock prices. These volume increases were partially offset by fewer shipments of crude oil from the Bakken oil fields.
In 2014, chemicals revenues increased 12%, compared with 2013, reflecting volume growth (up 12%) largely driven by more shipments of crude oil from the Bakken and Canadian oil fields and growth in shipments of liquefied petroleum gas in the Utica Shale region.
For 2016, chemicals revenues are anticipated to increase, as average revenue per unit is expected to be higher, largely the effect of increased volumes of higher rated plastics and pricing gains.
K 22
Agriculture, consumer products, and government revenues increased 1% in 2015, compared with 2014, the result of increased ethanol shipments due to higher gasoline consumption, offset in part by lower fuel surcharge revenues and fewer revenue shipments of empty rail cars as part of the conclusion of a hopper re-body program.
In 2014, agriculture, consumer products, and government revenues increased 2% compared with 2013, as a result of a 2% improvement in volume and a 1% improvement in average revenue per unit, due primarily to higher rates that were slightly offset by a negative change in mix. The volume increase was driven by higher corn shipments due to increased demand for ethanol production, partially offset by fewer shipments of fertilizer due to production curtailments.
For 2016, agriculture, consumer products, and government revenues are expected to increase, as we expect average revenue per unit to be higher due to pricing gains. We also expect modest volume growth, supported by increased shipments of ethanol, fertilizer, food products, and feed products.
Metals and construction revenues fell 17% in 2015, compared with 2014. The decline resulted from a 10% drop in average revenue per unit, largely the result of lower fuel surcharge revenues partially offset by pricing gains, and a 7% decrease in carloads. The decline in carloads was the result of lower demand for materials used in the construction of pipe for drilling activity due to a drop in energy prices, fewer shipments of fractionating sand and ceramic proppant used in natural gas drilling, and declines in scrap metal and coil shipments, resulting from a decline in steel production due to global over-supply. These decreases were offset in part by increased shipments of aggregates as a result of higher demand in the Southeast for project work and strong highway and construction related markets.
In 2014, metals and construction revenues grew 8% compared with 2013. The revenue improvement resulted from a 9% increase in carloads, as we moved more shipments of fractionating sand for natural gas drilling, in addition to higher coil shipments to support growing demand in the automotive and energy sectors, and increased shipments of iron and steel as a result of higher import activity.
For 2016, metals and construction revenues are expected to benefit from increased average revenue per unit due to pricing gains. We expect volumes to be relatively flat as construction-related gains are expected to be offset by declines in the steel market.
Automotive revenues fell 3% compared to 2014, reflecting an 8% drop in average revenue per unit, due primarily to lower fuel surcharge revenues, offset in part by rate increases. Volume grew 5% due to increased production of North American light vehicles and the return of shipments diverted in 2014 due to improved service in the second half of 2015.
In 2014, automotive revenues rose 2% compared to 2013, reflecting 2% growth in volume due to increased vehicle production at plants we serve that was offset in part by the diversion of shipments to other modes of transportation as a result of equipment shortages and network delays.
For 2016, automotive revenues are expected to increase as a result of volume gains due to continued increases in domestic production as well as higher average revenue per unit as a result of improved pricing.
Paper, clay and forest products revenues were down 3%, as average revenue per unit decreased 2%, and volumes fell 1%. The decline in average revenue per unit was driven primarily by lower fuel surcharge revenues and negative mix (fewer higher rated kaolin shipments) offset by pricing gains. Volume changes reflected lower waste, kaolin, woodchip, and graphic paper volumes as a result of customer sourcing changes, softened demand, and mill closures, offset by higher carloads of pulpboard, lumber, and pulp due to continued recovery of the housing market.
In 2014, paper, clay and forest products revenues were flat compared with 2013 as a 2% improvement in average revenue per unit (reflecting pricing gains and positive mix) was offset by a 2% decrease in volumes. Volume declines were driven by reduced shipments of municipal solid waste resulting from loss of business, lower
K 23
shipments of newsprint and paper due to mill and plant closures, and fewer pulp shipments due to production issues and reduced export demand. These declines were offset in part by higher lumber shipments resulting from the continued housing recovery and new business.
For 2016, paper, clay, and forest products revenues are anticipated to increase due to modest improvement in volumes and revenue per unit. Volume growth is expected to be driven by higher woodchip and lumber shipments, as we anticipate growth in demand for wood pellets and the continued recovery of the housing market, offset in part by lower municipal solid waste due to the loss of a customer, and lower kaolin and graphic paper shipments due to demand declines.
INTERMODAL revenues decreased $153 million, or 6%, compared with 2014, reflecting decreased revenue per unit of 6% (the result of lower fuel surcharge revenues, which decreased average revenue per unit by $51).
Domestic volume (including truckload and intermodal marketing companies, TCS, and Premium business) declined 3%, a result of the restructuring of the TCS subsidiary, ongoing service challenges during the first three quarters, an increase in available trucking capacity, and weaker overall demand, all partially offset by growth from continued highway-to-rail conversions. International volume grew 6% due to stronger demand from existing customers and new business.
In 2014, intermodal revenues increased $178 million, or 7%, compared with 2013, reflecting a 8% growth in volume. Domestic volume improved 6%, a result of growth in strategic corridors, continued highway-to-rail conversions, and higher demand for rail service from existing customers. International volume grew 10% due to increased demand from existing customers and expanded service opportunities.
For 2016, we anticipate higher intermodal revenues due to increased volumes as a result of continued highway conversions and growth associated with new and existing customers to be partially offset by declines due to the restructuring of the TCS subsidiary and an increase in available trucking capacity. Average revenue per unit is expected to be lower as pricing gains are offset by unfavorable changes in business mix, primarily a result of the TCS restructuring, and reduced fuel surcharge revenue.
In connection with the TCS restructuring discussed above, we are working with our customers and business partners to convert business handled by TCS into our current intermodal network. As this transition occurs, we expect some shipments previously handled by TCS to be absorbed by our domestic container line of business. While it is likely that not all of this TCS business will make this transition, we do not expect this restructuring to have a material effect on our railway operating revenues or income from railway operations.
Railway Operating Expenses
Railway operating expenses in 2015 were $7.6 billion, down $422 million, or 5%, compared to 2014. Expenses in 2014 were $8.0 billion, up $61 million, or 1%, compared to 2013. In 2015, decreases in fuel costs and incentive compensation were offset in part by costs associated with the TCS restructuring and closure of our Roanoke, Virginia corporate office, in addition to higher wage rates. In 2014, increases in volume-related costs were offset in part by lower postretirement and pension benefit costs as well as lower fuel prices.
K 24
The following table shows the changes in railway operating expenses summarized by major classifications.
Operating Expense Variances Increase (Decrease) | |||||||
2015 vs. 2014 | 2014 vs. 2013 | ||||||
($ in millions) | |||||||
Fuel | $ | (640 | ) | $ | (39 | ) | |
Compensation and benefits | 14 | (105 | ) | ||||
Materials and other | 36 | 112 | |||||
Purchased services and rents | 65 | 58 | |||||
Depreciation | 103 | 35 | |||||
Total | $ | (422 | ) | $ | 61 | ||
Fuel expense, which includes the cost of locomotive fuel as well as other fuel used in railway operations, decreased $640 million, or 41%, in 2015 and decreased $39 million, or 2%, in 2014. Both declines were principally the result of lower locomotive fuel prices (down 40% in 2015 and 6% in 2014). Locomotive fuel consumption decreased 1% in 2015, but increased 4% in 2014. We consumed approximately 487 million gallons of diesel fuel in 2015, compared with 494 million gallons in 2014 and 476 million gallons in 2013.
Looking forward to 2016, we expect lower fuel expenses as current prices for locomotive fuel are significantly below the average cost per gallon of $1.74 experienced in 2015. In addition, we anticipate the TCS restructuring and improved fuel productivity will benefit fuel expense in 2016.
Compensation and benefits, which represents 38% of total operating expenses, increased $14 million in 2015 reflecting changes in:
• | pay rates (up $83 million), |
• | payroll taxes (up $37 million), |
• | labor agreement payments ($24 million), |
• | employee levels, including overtime and increased trainees (up $21 million), and |
• | incentive compensation (down $151 million). |
In 2014, compensation and benefits decreased $105 million, or 3%, reflecting changes in:
• | postretirement and pension benefit costs (down $152 million), |
• | health and welfare benefit costs (down $25 million), |
• | pay rates (up $57 million), and |
• | payroll taxes (up $21 million). |
Our employment averaged 30,456 in 2015, compared with 29,482 in 2014, and 30,103 in 2013. Looking forward to 2016, we expect normalized levels of incentive compensation in addition to increased medical cost inflation and higher wages to be offset in part by lower employment levels driven from operational efficiencies and the TCS restructuring.
K 25
Materials and other expenses increased $36 million, or 4%, in 2015, and increased $112 million, or 14%, in 2014, as shown in the following table.
2015 | 2014 | 2013 | |||||||||
($ in millions) | |||||||||||
Materials | $ | 469 | $ | 470 | $ | 422 | |||||
Casualties and other claims | 137 | 135 | 90 | ||||||||
Other | 370 | 335 | 316 | ||||||||
Total | $ | 976 | $ | 940 | $ | 828 | |||||
The increase in other costs in 2015 reflected higher relocation costs driven by the Roanoke, Virginia corporate office closure, increased travel costs for train service employees and higher property taxes. Casualties and other claims expenses include the estimates of costs related to personal injury (PI), property damage, and environmental matters. The increase in 2015 was driven by less favorable PI reserve adjustments for prior years' claim amounts offset in part by reduced environmental remediation costs as a result of less unfavorable development for our environmental liability.
Volume growth in 2014 drove increases in locomotive and equipment maintenance and repair costs. Additionally, harsh winter weather experienced in the first quarter of 2014 resulted in increased maintenance activity, which negatively impacted the comparison to 2013. The increase in casualties and other claims expenses in 2014 reflected lower favorable PI reserve adjustments for prior years' claim amounts.
Purchased services and rents includes the costs of services purchased from outside contractors, including the net costs of operating joint (or leased) facilities with other railroads and the net cost of equipment rentals. This category of expenses increased $65 million, or 4%, in 2015, and increased $58 million, or 4%, in 2014.
2015 | 2014 | 2013 | |||||||||
($ in millions) | |||||||||||
Purchased services | $ | 1,433 | $ | 1,394 | $ | 1,353 | |||||
Equipment rents | 319 | 293 | 276 | ||||||||
Total | $ | 1,752 | $ | 1,687 | $ | 1,629 | |||||
The increase in 2015 for purchased services expense reflects higher costs associated with intermodal operations, information technology, maintenance and repair, and the Roanoke, Virginia corporate office closure. These increases were partially offset by TCS restructuring-related savings. The increase in 2014 for purchased services expense resulted from higher volumes and the effect reduced network velocity had on intermodal operations and joint facilities costs. Additionally, higher maintenance and repair costs were offset in part by reduced expenses associated with the Shared Asset Areas (including equity in the earnings of Conrail, see Note 5).
Equipment rents, which includes our cost of using equipment (mostly freight cars) owned by other railroads or private owners less the rent paid to us for the use of our equipment, increased in 2015 principally due to higher automotive and intermodal rates and volumes. The 2014 increase is a result of higher volumes and network congestion.
K 26
Looking forward to 2016, we expect decreases in our purchased services and equipment rents expenses principally due to lower TCS operational costs and improved network velocity. These decreases will be partially offset by higher intermodal operations costs associated with higher conventional volumes.
Depreciation expense increased by $103 million, or 11%, in 2015, and increased by $35 million, or 4%, in 2014. The increase in 2015 is due in part to the recognition of $63 million of accelerated depreciation on TCS assets as a result of our TCS restructuring. Both periods also reflect growth in our roadway and equipment capital base as we continue to invest in our infrastructure and rolling stock.
Other Income – Net
Other income – net was $103 million in 2015, $104 million in 2014, and $233 million in 2013 (Note 2). The decrease in 2015 reflects decreased returns from corporate-owned life insurance, declines in coal royalties and higher professional and consultant fees, offset in part from higher gains from sales of property (including income earned from joint ventures). The decrease in 2014 reflects the absence of the 2013 Michigan land sale ($97 million).
Income Taxes
Income tax expense in 2015 was $886 million, an effective rate of 36.3%, compared with 36.2% in 2014 and 35.6% in 2013. All three years benefited from favorable reductions in deferred tax expense for state law changes and certain business tax credits.
IRS examinations have been completed for all years prior to 2013. We are not currently under audit by the Internal Revenue Service.
FINANCIAL CONDITION, LIQUIDITY, AND CAPITAL RESOURCES
Cash provided by operating activities, our principal source of liquidity, was $2.9 billion in 2015 and 2014, and $3.1 billion in 2013. Lower cash from operations in 2015 compared with 2014 was offset by reduced tax payments. The decrease in 2014 reflected increased tax payments, offset in part by improved operating results. We had working capital of $402 million at December 31, 2015, compared with $998 million at December 31, 2014, primarily reflecting higher current maturities of long-term debt. Cash and cash equivalents totaled $1.1 billion and $973 million at December 31, 2015 and 2014, respectively, and were invested in accordance with our corporate investment policy as approved by the Board of Directors. The portfolio contains securities that are subject to market risk. There are no limits or restrictions on our access to these assets. We expect cash on hand combined with cash provided by operating activities will be sufficient to meet our ongoing obligations.
K 27
Contractual obligations at December 31, 2015, were comprised of interest on fixed-rate long-term debt and capital leases, long-term debt and capital leases (Note 8), operating leases (Note 9), agreements with Consolidated Rail Corporation (CRC) (Note 5), unconditional purchase obligations (Note 16), long-term advances from Conrail (Note 5), and unrecognized tax benefits (Note 3):
Total | 2016 | 2017 - 2018 | 2019 - 2020 | 2021 and Subsequent | Other | ||||||||||||||||||
($ in millions) | |||||||||||||||||||||||
Interest on fixed-rate long-term debt | |||||||||||||||||||||||
and capital lease principal | $ | 13,780 | $ | 543 | $ | 992 | $ | 851 | $ | 11,394 | $ | — | |||||||||||
Long-term debt and capital lease principal | 10,398 | 500 | 1,150 | 899 | 7,849 | — | |||||||||||||||||
Operating leases | 664 | 77 | 138 | 101 | 348 | — | |||||||||||||||||
Agreements with CRC | 304 | 36 | 72 | 72 | 124 | — | |||||||||||||||||
Unconditional purchase obligations | 909 | 552 | 347 | 10 | — | — | |||||||||||||||||
Long-term advances from Conrail | 280 | — | — | — | 280 | — | |||||||||||||||||
Unrecognized tax benefits* | 25 | — | — | — | — | 25 | |||||||||||||||||
Total | $ | 26,360 | $ | 1,708 | $ | 2,699 | $ | 1,933 | $ | 19,995 | $ | 25 | |||||||||||
* When the amount and timing of liabilities for unrecognized tax benefits can be reasonably estimated, the amount is shown in the table under the appropriate period. When the year of settlement cannot be reasonably estimated, the amount is shown in the Other column.
Off balance sheet arrangements consist of obligations related to operating leases, which are included in the table of contractual obligations above and disclosed in Note 9.
Cash used in investing activities was $2.1 billion in 2015, compared with $2.0 billion in 2014, and $1.9 billion in 2013. The increase in 2015 primarily reflected higher cash outflows for property additions, which were partially offset by higher proceeds from COLI activity. The increase in 2014 primarily reflected increased use of cash for property additions and COLI investments, which were partially offset by higher short-term investment maturities.
On September 18, 2015, we completed the acquisition of 282 miles of the Delaware and Hudson Railway Co. (D&H) line between Sunbury, Pennsylvania and Schenectady, New York, for $215 million. The transaction is included in Property additions on the Statement of Cash Flows. The acquisition comprises land ($49 million), roadway, including bridges, tunnels, grading, rail, cross ties and other track material ($162 million), and other property including supplies ($4 million). The acquired lines connect with our network at Sunbury, Pennsylvania, and Binghamton, New York, and provide us single-line routes from Chicago and the southeastern United States to Albany, New York, and our intermodal terminals in Scranton, Pennsylvania and Mechanicville, New York. We also gain an enhanced connection to our Pan Am Southern LLC joint venture, which serves New England markets. We previously provided service over the D&H lines via trackage rights and haulage agreements. In addition, we hired, trained and qualified 152 former D&H employees.
K 28
Property additions account for most of the recurring spending in this category. The following tables show capital spending (including capital leases) and track and equipment statistics for the past five years.
Property Additions | |||||||||||||||||||
2015 | 2014 | 2013 | 2012 | 2011 | |||||||||||||||
($ in millions) | |||||||||||||||||||
Road and other property | $ | 1,514 | $ | 1,406 | $ | 1,421 | $ | 1,465 | $ | 1,222 | |||||||||
Equipment | 658 | 712 | 550 | 776 | 938 | ||||||||||||||
Delaware & Hudson acquisition | 213 | — | — | — | — | ||||||||||||||
Total | $ | 2,385 | $ | 2,118 | $ | 1,971 | $ | 2,241 | $ | 2,160 | |||||||||
Track Structure Statistics (Capital and Maintenance) | ||||||||||||||
2015 | 2014 | 2013 | 2012 | 2011 | ||||||||||
Track miles of rail installed | 523 | 507 | 549 | 509 | 484 | |||||||||
Miles of track surfaced | 5,074 | 5,248 | 5,475 | 5,642 | 5,441 | |||||||||
New crossties installed (millions) | 2.4 | 2.7 | 2.5 | 2.6 | 2.7 | |||||||||
Average Age of Owned Railway Equipment | ||||||||||||||
2015 | 2014 | 2013 | 2012 | 2011 | ||||||||||
(years) | ||||||||||||||
Freight cars | 29.6 | 30.1 | 30.2 | 30.2 | 30.3 | |||||||||
Locomotives | 23.9 | 23.1 | 22.5 | 21.6 | 21.0 | |||||||||
Retired locomotives | 43.4 | 35.3 | 38.7 | 41.2 | 31.7 | |||||||||
For 2016, we have budgeted $2.1 billion for property additions. The anticipated spending includes $820 million for the normalized replacement of rail, ties, and ballast, and the improvement or replacement of bridges. Planned equipment spending of $490 million includes new and rebuilt locomotives, intermodal containers and chassis, mill gondolas, multilevel automobile racks, and covered hoppers. Investments in facilities and terminals are anticipated to be $220 million and include terminals and equipment to add capacity to our intermodal network, new or expanded bulk transfer facilities, improvements to vehicle distribution facilities, and upgrades and expansions of our mechanical service shops. For 2016, we have budgeted $250 million for the continued implementation of positive train control (PTC) and expect PTC-related property additions in 2017 and 2018 to total approximately $530 million. We also expect to spend $90 million on infrastructure improvements to increase mainline capacity, create operating savings, and to accommodate business growth. Technology investments of $80 million are planned for new or upgraded systems and computers.
Cash used in financing activities was $662 million in 2015, compared with $1.3 billion in 2014, and $394 million in 2013. The decrease in 2015 was driven primarily by higher proceeds from borrowing and lower debt repayments, partially offset by higher share repurchase activity (see Note 14). The increase in 2014 was driven primarily by higher debt repayments and lower debt proceeds, partially offset by reduced share repurchase activity.
K 29
Share repurchases totaled $1.1 billion in 2015, $318 million in 2014, and $627 million in 2013 for the purchase and retirement of 11.3 million, 3.1 million, and 8.3 million shares, respectively. On August 1, 2012, our Board of Directors authorized the repurchase of up to an additional 50 million shares of Common Stock through December 31, 2017, and 23.9 million shares remain under this authority as of December 31, 2015. The timing and volume of future share repurchases will be guided by our assessment of market conditions and other pertinent factors. Any near-term purchases under the program are expected to be made with internally generated cash, cash on hand, or proceeds from borrowings.
We further discuss our current securities issuance authority from our Board of Directors, our credit agreement, and our accounts receivable securitization program in Note 8 of our Notes to Consolidated Financial Statements, all of which provide for access to additional liquidity should the need arise. Our debt-to-total capitalization ratio was 45.3% at December 31, 2015, compared with 42.0% at December 31, 2014.
Upcoming annual debt maturities are relatively modest (Note 8). Overall, our goal is to maintain a capital structure with appropriate leverage to support our business strategy and provide flexibility through business cycles.
APPLICATION OF CRITICAL ACCOUNTING ESTIMATES
The preparation of financial statements in accordance with U.S. Generally Accepted Accounting Principles (GAAP) requires us to make estimates and assumptions that affect the reported amounts of assets and liabilities, the disclosure of contingent assets and liabilities at the date of the financial statements, and the reported amounts of revenue and expenses during the reporting period. These estimates and assumptions may require significant judgment about matters that are inherently uncertain, and future events are likely to occur that may require us to make changes to these estimates and assumptions. Accordingly, we regularly review these estimates and assumptions based on historical experience, changes in the business environment, and other factors we believe to be reasonable under the circumstances. We regularly discuss the development, selection, and disclosures concerning critical accounting estimates with the Audit Committee of the Board of Directors.
Pensions and Other Postretirement Benefits
Accounting for pensions and other postretirement benefit plans requires us to make several estimates and assumptions (Note 11). These include the expected rate of return from investment of the plans’ assets, projected increases in medical costs, and the expected retirement age of employees as well as their projected earnings and mortality. In addition, the amounts recorded are affected by changes in the interest rate environment because the associated liabilities are discounted to their present value. We make these estimates based on our historical experience and other information that we deem pertinent under the circumstances (for example, expectations of future stock market performance). We utilize an independent actuarial consulting firm’s studies to assist us in selecting appropriate actuarial assumptions and valuing related liabilities.
Net pension expense, which is included in “Compensation and benefits” in the Consolidated Statements of Income, was $34 million for 2015. In recording this amount, we assumed a long-term investment rate of return of 8.25%, which was supported by the long-term total rate of return on plan assets since inception, as well as our expectation of future returns. A one-percentage point change to this rate of return assumption would result in a $20 million change in pension expense. We review assumptions related to our defined benefit plans annually, and while changes are likely to occur in assumptions concerning retirement age, projected earnings, and mortality, they are not expected to have a material effect on our net pension expense or net pension liability in the future. The net pension liability is recorded at net present value using discount rates that are based on the current interest rate environment in light of the timing of expected benefit payments. We utilize analyses in which the projected annual cash flows from the pension and postretirement benefit plans are matched with yield curves based on an appropriate universe of high-quality corporate bonds. We use the results of the yield curve analyses to select the discount rates that match the payment streams of the benefits in these plans.
K 30
Net benefit for other postretirement benefits, which is also included in “Compensation and benefits,” was $15 million for 2015. Historically, medical inflation has been a significant component of the estimate for postretirement benefits, however, its effect has been reduced substantially due to the plan amendment made in 2014 (Note 11). Since there is a fixed benefit for Medicare-eligible retirees, there is no medical inflation assumed for this population. The medical inflation factor is still applicable for pre-Medicare-eligible retirees.
Properties and Depreciation
Most of our total assets are long-lived railway properties (Note 6). As disclosed in Note 1, properties are depreciated using group depreciation. The primary depreciation method for our asset base is group life. Units of production is the principal method of depreciation for rail in high density corridors and for depletion of natural resources. Remaining properties are depreciated generally using the straight-line method over the lesser of estimated service or lease lives. See Note 1 for a more detailed discussion of the assumptions and estimates in this area.
Depreciation expense for 2015 totaled $1,054 million. Our composite depreciation rates for 2015 are disclosed in Note 6; a one-tenth percentage point increase (or decrease) in these rates would have resulted in a $38 million increase (or decrease) to depreciation expense. For 2015, roadway depreciation rates ranged from 0.83% to 33.33% and equipment depreciation rates ranged from 1.55% to 33.33%.
Personal Injury, Environmental, and Legal Liabilities
Casualties and other claims expense, included in “Materials and other” in the Consolidated Statements of Income, consists primarily of our accrual for personal injury liabilities and environmental remediation costs.
To aid in valuing our personal injury liability and determining the amount to accrue during each period, we utilize studies prepared by an independent consulting actuarial firm. The actuarial firm studies our historical patterns of reserving for claims and subsequent settlements, taking into account relevant outside influences. We adjust the liability quarterly based upon our assessment and the results of the study. Our estimate is subject to inherent limitation given the difficulty of predicting future events and as such the ultimate loss sustained may vary from the estimated liability recorded.
We are subject to various jurisdictions’ environmental laws and regulations. We record a liability where such liability or loss is probable and its amount can be estimated reasonably. Environmental engineers regularly participate in ongoing evaluations of all known sites and in determining any necessary adjustments to liability estimates. Additionally, our Environmental Policy Council (composed of senior managers) oversees and interprets our environmental policy. Operating expenses, included in "Materials and other" and "Purchased services and rents," for environmental matters totaled $40 million in 2015, $45 million in 2014, and $57 million in 2013, and property additions for environmental matters were not significant.
We and/or certain subsidiaries are defendants in numerous lawsuits and other claims relating principally to railroad operations. When we conclude that it is probable that a liability has been incurred and the amount of the liability can be reasonably estimated, it is accrued through a charge to earnings.
For a more detailed discussion of the assumptions and estimates in accounting for personal injury and environmental matters see Note 16.
Income Taxes
Our net long-term deferred tax liability totaled $9.1 billion at December 31, 2015 (Note 3). This liability is estimated based on the expected future tax consequences of items recognized in the financial statements. After application of the federal statutory tax rate to book income, judgment is required with respect to the timing and deductibility of expenses in our income tax returns. For state income and other taxes, judgment is also required
K 31
with respect to the apportionment among the various jurisdictions. A valuation allowance is recorded if we expect that it is more likely than not that deferred tax assets will not be realized. We had a $35 million valuation allowance on $603 million of deferred tax assets as of December 31, 2015, reflecting the expectation that almost all of these assets will be realized.
In addition, we have a recorded liability for our estimate of uncertain tax positions taken or expected to be taken in a tax return. Judgment is required in evaluating the application of federal and state tax laws and assessing whether it is more likely than not that a tax position will be sustained on examination and, if so, judgment is also required as to the measurement of the amount of tax benefit that will be realized upon settlement with the taxing authority. We believe this liability for uncertain tax positions to be adequate. Income tax expense is adjusted in the period in which new information about a tax position becomes available or the final outcome differs from the amounts recorded. For every one half percent change in the 2015 effective tax rate, net income would have changed by $12 million.
OTHER MATTERS
Labor Agreements
More than 80% of our railroad employees are covered by collective bargaining agreements with various labor unions. Pursuant to the Railway Labor Act, these agreements remain in effect until new agreements are reached, or until the bargaining procedures mandated by the Act are completed. We largely bargain nationally in concert with other major railroads, represented by the National Carriers Conference Committee (NCCC). Moratorium provisions in the labor agreements govern when the railroads and unions may propose changes to the agreements.
On or after November 1, 2014, the NCCC and the various unions exchanged new proposals to begin this round of national negotiations. The unions have formed three separate bargaining coalitions and negotiations are ongoing with all three coalitions. In the case of the Transportation Communications Union led coalition, the negotiations are being assisted by mediators from the National Mediation Board. Separately, in January 2015 we reached an agreement covering wages and work rules through 2019 with the Brotherhood of Locomotive Engineers and Trainmen (BLET) which represents approximately 4,600 of our locomotive engineers. Changes to the BLET benefit plan will be bargained nationally through the NCCC.
Market Risks
We manage overall exposure to fluctuations in interest rates by issuing both fixed- and floating-rate debt instruments. At December 31, 2015, debt subject to interest rate fluctuations totaled $200 million. A one-percentage point increase in interest rates would increase total annual interest expense related to all variable debt by approximately $2 million. We consider it unlikely that interest rate fluctuations applicable to these instruments will result in a material adverse effect on our financial position, results of operations, or liquidity.
New Accounting Pronouncements
For a detailed discussion of new accounting pronouncements, see Note 1.
Inflation
In preparing financial statements, GAAP requires the use of historical cost that disregards the effects of inflation on the replacement cost of property. As a capital-intensive company, we have most of our capital invested in long-lived assets. The replacement cost of these assets, as well as the related depreciation expense, would be substantially greater than the amounts reported on the basis of historical cost.
K 32
FORWARD-LOOKING STATEMENTS
Certain statements in this Management’s Discussion and Analysis of Financial Condition and Results of Operations are “forward-looking statements” within the meaning of the “safe harbor” provisions of the Private Securities Litigation Reform Act of 1995, as amended. These statements relate to future events or the Company’s future financial performance and involve known and unknown risks, uncertainties, and other factors that may cause the actual results, levels of activity, performance, or achievements of the Company or its industry to be materially different from those expressed or implied by any forward-looking statements. In some cases, forward-looking statements can be identified by terminology such as “may,” “will,” “could,” “would,” “should,” “expect,” “plan,” “anticipate,” “intend,” “believe,” “estimate,” “project,” “consider,” “predict,” “potential,” or other comparable terminology. The Company has based these forward-looking statements on management’s current expectations, assumptions, estimates, beliefs, and projections. While the Company believes these expectations, assumptions, estimates, and projections are reasonable, such forward-looking statements are only predictions and involve known and unknown risks and uncertainties, many of which involve factors or circumstances that are beyond the Company’s control. These and other important factors, including those discussed in Part II, Item 1A “Risk Factors,” may cause actual results, performance, or achievements to differ materially from those expressed or implied by these forward-looking statements. The forward-looking statements herein are made only as of the date they were first issued, and unless otherwise required by applicable securities laws, the Company disclaims any intention or obligation to update or revise any forward-looking statements, whether as a result of new information, future events, or otherwise. Copies of Norfolk Southern Corporation’s press releases and additional information about the Company are available at www.norfolksouthern.com, or you can contact the Norfolk Southern Corporation Investor Relations Department by calling 757-629-2861.
Item 7A. Quantitative and Qualitative Disclosures about Market Risk
The information required by this item is included in Part II, Item 7, “Management’s Discussion and Analysis of Financial Condition and Results of Operations” under the heading “Market Risks.”
K 33
Item 8. Financial Statements and Supplementary Data
INDEX TO FINANCIAL STATEMENTS
Page | |
K 34
Report of Management
February 8, 2016
To the Stockholders
Norfolk Southern Corporation
Management is responsible for establishing and maintaining adequate internal control over financial reporting. In order to ensure that the Corporation’s internal control over financial reporting is effective, management regularly assesses such controls and did so most recently for its financial reporting as of December 31, 2015. This assessment was based on criteria for effective internal control over financial reporting described in Internal Control-Integrated Framework (2013) issued by the Committee of Sponsoring Organizations of the Treadway Commission. Based on this assessment, management has concluded that the Corporation maintained effective internal control over financial reporting as of December 31, 2015.
KPMG LLP, independent registered public accounting firm, has audited the Corporation’s financial statements and issued an attestation report on the Corporation’s internal control over financial reporting as of December 31, 2015.
/s/James A. Squires | /s/Marta R. Stewart | /s/Thomas E. Hurlbut | ||
James A. Squires | Marta R. Stewart | Thomas E. Hurlbut | ||
Chairman, President and | Executive Vice President Finance | Vice President and | ||
Chief Executive Officer | and Chief Financial Officer | Controller | ||
K 35
Report of Independent Registered Public Accounting Firm
The Board of Directors and Stockholders
Norfolk Southern Corporation:
We have audited Norfolk Southern Corporation’s internal control over financial reporting as of December 31, 2015, based on criteria established in Internal Control – Integrated Framework (2013) issued by the Committee of Sponsoring Organizations of the Treadway Commission (COSO). Norfolk Southern Corporation’s management is responsible for maintaining effective internal control over financial reporting and for its assessment of the effectiveness of internal control over financial reporting, included in the accompanying Report of Management. Our responsibility is to express an opinion on the Company’s internal control over financial reporting based on our audit.
We conducted our audit in accordance with the standards of the Public Company Accounting Oversight Board (United States). Those standards require that we plan and perform the audit to obtain reasonable assurance about whether effective internal control over financial reporting was maintained in all material respects. Our audit included obtaining an understanding of internal control over financial reporting, assessing the risk that a material weakness exists, and testing and evaluating the design and operating effectiveness of internal control based on the assessed risk. Our audit also included performing such other procedures as we considered necessary in the circumstances. We believe that our audit provides a reasonable basis for our opinion.
A company’s internal control over financial reporting is a process designed to provide reasonable assurance regarding the reliability of financial reporting and the preparation of financial statements for external purposes in accordance with generally accepted accounting principles. A company’s internal control over financial reporting includes those policies and procedures that (1) pertain to the maintenance of records that, in reasonable detail, accurately and fairly reflect the transactions and dispositions of the assets of the company; (2) provide reasonable assurance that transactions are recorded as necessary to permit preparation of financial statements in accordance with generally accepted accounting principles, and that receipts and expenditures of the company are being made only in accordance with authorizations of management and directors of the company; and (3) provide reasonable assurance regarding prevention or timely detection of unauthorized acquisition, use, or disposition of the company’s assets that could have a material effect on the financial statements.
Because of its inherent limitations, internal control over financial reporting may not prevent or detect misstatements. Also, projections of any evaluation of effectiveness to future periods are subject to the risk that controls may become inadequate because of changes in conditions, or that the degree of compliance with the policies or procedures may deteriorate.
In our opinion, Norfolk Southern Corporation maintained, in all material respects, effective internal control over financial reporting as of December 31, 2015, based on criteria established in Internal Control – Integrated Framework (2013) issued by the Committee of Sponsoring Organizations of the Treadway Commission.
We also have audited, in accordance with the standards of the Public Company Accounting Oversight Board (United States), the consolidated balance sheets of Norfolk Southern Corporation and subsidiaries as of December 31, 2015 and 2014, and the related consolidated statements of income, comprehensive income, changes in stockholders’ equity, and cash flows for each of the years in the three-year period ended December 31, 2015, and our report dated February 8, 2016 expressed an unqualified opinion on those consolidated financial statements.
/s/KPMG LLP
KPMG LLP
Norfolk, Virginia
February 8, 2016
K 36
Report of Independent Registered Public Accounting Firm
The Board of Directors and Stockholders
Norfolk Southern Corporation:
We have audited the accompanying consolidated balance sheets of Norfolk Southern Corporation and subsidiaries as of December 31, 2015 and 2014, and the related consolidated statements of income, comprehensive income, changes in stockholders’ equity, and cash flows for each of the years in the three-year period ended December 31, 2015. In connection with our audits of the consolidated financial statements, we also have audited the financial statement schedule as listed in Item 15(A)2. These consolidated financial statements and financial statement schedule are the responsibility of the Company’s management. Our responsibility is to express an opinion on these consolidated financial statements and financial statement schedule based on our audits.
We conducted our audits in accordance with the standards of the Public Company Accounting Oversight Board (United States). Those standards require that we plan and perform the audit to obtain reasonable assurance about whether the financial statements are free of material misstatement. An audit includes examining, on a test basis, evidence supporting the amounts and disclosures in the financial statements. An audit also includes assessing the accounting principles used and significant estimates made by management, as well as evaluating the overall financial statement presentation. We believe that our audits provide a reasonable basis for our opinion.
In our opinion, the consolidated financial statements referred to above present fairly, in all material respects, the financial position of Norfolk Southern Corporation and subsidiaries as of December 31, 2015 and 2014, and the results of their operations and their cash flows for each of the years in the three-year period ended December 31, 2015, in conformity with U.S. generally accepted accounting principles. Also in our opinion, the related financial statement schedule, when considered in relation to the basic consolidated financial statements taken as a whole, presents fairly, in all material respects, the information set forth therein.
We also have audited, in accordance with the standards of the Public Company Accounting Oversight Board (United States), Norfolk Southern Corporation’s internal control over financial reporting as of December 31, 2015, based on criteria established in Internal Control – Integrated Framework (2013) issued by the Committee of Sponsoring Organizations of the Treadway Commission (COSO), and our report dated February 8, 2016 expressed an unqualified opinion on the effectiveness of the Company’s internal control over financial reporting.
/s/KPMG LLP
KPMG LLP
Norfolk, Virginia
February 8, 2016
K 37
Norfolk Southern Corporation and Subsidiaries
Consolidated Statements of Income
Years ended December 31, | |||||||||||
2015 | 2014 | 2013 | |||||||||
($ in millions, except per share amounts) | |||||||||||
Railway operating revenues | $ | 10,511 | $ | 11,624 | $ | 11,245 | |||||
Railway operating expenses: | |||||||||||
Compensation and benefits | 2,911 | 2,897 | 3,002 | ||||||||
Purchased services and rents | 1,752 | 1,687 | 1,629 | ||||||||
Fuel | 934 | 1,574 | 1,613 | ||||||||
Depreciation | 1,054 | 951 | 916 | ||||||||
Materials and other | 976 | 940 | 828 | ||||||||
Total railway operating expenses | 7,627 | 8,049 | 7,988 | ||||||||
Income from railway operations | 2,884 | 3,575 | 3,257 | ||||||||
Other income – net | 103 | 104 | 233 | ||||||||
Interest expense on debt | 545 | 545 | 525 | ||||||||
Income before income taxes | 2,442 | 3,134 | 2,965 | ||||||||
Provision for income taxes | 886 | 1,134 | 1,055 | ||||||||
Net income | $ | 1,556 | $ | 2,000 | $ | 1,910 | |||||
Per share amounts: | |||||||||||
Net income | |||||||||||
Basic | $ | 5.13 | $ | 6.44 | $ | 6.10 | |||||
Diluted | 5.10 | 6.39 | 6.04 | ||||||||
See accompanying notes to consolidated financial statements.
K 38
Norfolk Southern Corporation and Subsidiaries
Consolidated Statements of Comprehensive Income
Years ended December 31, | |||||||||||
2015 | 2014 | 2013 | |||||||||
($ in millions) | |||||||||||
Net income | $ | 1,556 | $ | 2,000 | $ | 1,910 | |||||
Other comprehensive income (loss), before tax: | |||||||||||
Pension and other postretirement benefits | (76 | ) | (15 | ) | 1,122 | ||||||
Other comprehensive income (loss) of equity investees | — | (8 | ) | 42 | |||||||
Other comprehensive income (loss), before tax | (76 | ) | (23 | ) | 1,164 | ||||||
Income tax benefit (expense) related to items of | |||||||||||
other comprehensive income (loss) | 29 | 6 | (436 | ) | |||||||
Other comprehensive income (loss), net of tax | (47 | ) | (17 | ) | 728 | ||||||
Total comprehensive income | $ | 1,509 | $ | 1,983 | $ | 2,638 | |||||
See accompanying notes to consolidated financial statements.
K 39
Norfolk Southern Corporation and Subsidiaries
Consolidated Balance Sheets
At December 31, | |||||||
2015 | 2014 | ||||||
($ in millions) | |||||||
Assets | |||||||
Current assets: | |||||||
Cash and cash equivalents | $ | 1,101 | $ | 973 | |||
Accounts receivable – net | 946 | 1,055 | |||||
Materials and supplies | 271 | 236 | |||||
Deferred income taxes | 121 | 167 | |||||
Other current assets | 194 | 347 | |||||
Total current assets | 2,633 | 2,778 | |||||
Investments | 2,572 | 2,679 | |||||
Properties less accumulated depreciation of $11,478 and | |||||||
$10,814, respectively | 28,992 | 27,694 | |||||
Other assets | 63 | 49 | |||||
Total assets | $ | 34,260 | $ | 33,200 | |||
Liabilities and stockholdersʼ equity | |||||||
Current liabilities: | |||||||
Accounts payable | $ | 1,091 | $ | 1,233 | |||
Short-term debt | 200 | 100 | |||||
Income and other taxes | 203 | 217 | |||||
Other current liabilities | 237 | 228 | |||||
Current maturities of long-term debt | 500 | 2 | |||||
Total current liabilities | 2,231 | 1,780 | |||||
Long-term debt | 9,393 | 8,883 | |||||
Other liabilities | 1,385 | 1,312 | |||||
Deferred income taxes | 9,063 | 8,817 | |||||
Total liabilities | 22,072 | 20,792 | |||||
Stockholdersʼ equity: | |||||||
Common Stock $1.00 per share par value, 1,350,000,000 shares | |||||||
authorized; outstanding 297,795,016 and 308,240,130 shares, | |||||||
respectively, net of treasury shares | 299 | 310 | |||||
Additional paid-in capital | 2,143 | 2,148 | |||||
Accumulated other comprehensive loss | (445 | ) | (398 | ) | |||
Retained income | 10,191 | 10,348 | |||||
Total stockholdersʼ equity | 12,188 | 12,408 | |||||
Total liabilities and stockholdersʼ equity | $ | 34,260 | $ | 33,200 | |||
See accompanying notes to consolidated financial statements.
K 40
Norfolk Southern Corporation and Subsidiaries
Consolidated Statements of Cash Flows
Years ended December 31, | |||||||||||
2015 | 2014 | 2013 | |||||||||
($ in millions) | |||||||||||
Cash flows from operating activities: | |||||||||||
Net income | $ | 1,556 | $ | 2,000 | $ | 1,910 | |||||
Reconciliation of net income to net cash | |||||||||||
provided by operating activities: | |||||||||||
Depreciation | 1,059 | 956 | 922 | ||||||||
Deferred income taxes | 320 | 294 | 262 | ||||||||
Gains and losses on properties and investments | (30 | ) | (13 | ) | (104 | ) | |||||
Changes in assets and liabilities affecting operations: | |||||||||||
Accounts receivable | 109 | (31 | ) | 85 | |||||||
Materials and supplies | (35 | ) | (13 | ) | (7 | ) | |||||
Other current assets | 192 | (260 | ) | (5 | ) | ||||||
Current liabilities other than debt | (183 | ) | 53 | 5 | |||||||
Other – net | (111 | ) | (134 | ) | 10 | ||||||
Net cash provided by operating activities | 2,877 | 2,852 | 3,078 | ||||||||
Cash flows from investing activities: | |||||||||||
Property additions | (2,385 | ) | (2,118 | ) | (1,971 | ) | |||||
Property sales and other transactions | 63 | 114 | 144 | ||||||||
Investments, including short-term | (5 | ) | (104 | ) | (130 | ) | |||||
Investment sales and other transactions | 240 | 106 | 63 | ||||||||
Net cash used in investing activities | (2,087 | ) | (2,002 | ) | (1,894 | ) | |||||
Cash flows from financing activities: | |||||||||||
Dividends | (713 | ) | (687 | ) | (637 | ) | |||||
Common Stock issued | 43 | 130 | 131 | ||||||||
Purchase and retirement of Common Stock | (1,075 | ) | (318 | ) | (627 | ) | |||||
Proceeds from borrowings – net | 1,185 | 200 | 989 | ||||||||
Debt repayments | (102 | ) | (645 | ) | (250 | ) | |||||
Net cash used in financing activities | (662 | ) | (1,320 | ) | (394 | ) | |||||
Net increase (decrease) in cash and cash equivalents | 128 | (470 | ) | 790 | |||||||
Cash and cash equivalents: | |||||||||||
At beginning of year | 973 | 1,443 | 653 | ||||||||
At end of year | $ | 1,101 | $ | 973 | $ | 1,443 | |||||
Supplemental disclosures of cash flow information: | |||||||||||
Cash paid during the year for: | |||||||||||
Interest (net of amounts capitalized) | $ | 518 | $ | 522 | $ | 492 | |||||
Income taxes (net of refunds) | 386 | 1,102 | 735 | ||||||||
See accompanying notes to consolidated financial statements.
K 41
Norfolk Southern Corporation and Subsidiaries
Consolidated Statements of Changes in Stockholders’ Equity
Common Stock | Additional Paid-in Capital | Accum. Other Comprehensive Loss | Retained Income | Total | |||||||||||||||
($ in millions, except per share amounts) | |||||||||||||||||||
Balance at December 31, 2012 | $ | 315 | $ | 1,911 | $ | (1,109 | ) | $ | 8,643 | $ | 9,760 | ||||||||
Comprehensive income: | |||||||||||||||||||
Net income | 1,910 | 1,910 | |||||||||||||||||
Other comprehensive income | 728 | 728 | |||||||||||||||||
Total comprehensive income | 2,638 | ||||||||||||||||||
Dividends on Common Stock, | |||||||||||||||||||
$2.04 per share | (637 | ) | (637 | ) | |||||||||||||||
Share repurchases | (8 | ) | (49 | ) | (570 | ) | (627 | ) | |||||||||||
Stock-based compensation, | |||||||||||||||||||
including tax benefit of $38 | 3 | 159 | (7 | ) | 155 | ||||||||||||||
Balance at December 31, 2013 | 310 | 2,021 | (381 | ) | 9,339 | 11,289 | |||||||||||||
Comprehensive income: | |||||||||||||||||||
Net income | 2,000 | 2,000 | |||||||||||||||||
Other comprehensive loss | (17 | ) | (17 | ) | |||||||||||||||
Total comprehensive income | 1,983 | ||||||||||||||||||
Dividends on Common Stock, | |||||||||||||||||||
$2.22 per share | (687 | ) | (687 | ) | |||||||||||||||
Share repurchases | (3 | ) | (20 | ) | (295 | ) | (318 | ) | |||||||||||
Stock-based compensation, | |||||||||||||||||||
including tax benefit of $37 | 3 | 147 | (6 | ) | 144 | ||||||||||||||
Other | (3 | ) | (3 | ) | |||||||||||||||
Balance at December 31, 2014 | 310 | 2,148 | (398 | ) | 10,348 | 12,408 | |||||||||||||
Comprehensive income: | |||||||||||||||||||
Net income | 1,556 | 1,556 | |||||||||||||||||
Other comprehensive loss | (47 | ) | (47 | ) | |||||||||||||||
Total comprehensive income | 1,509 | ||||||||||||||||||
Dividends on Common Stock, | |||||||||||||||||||
$2.36 per share | (713 | ) | (713 | ) | |||||||||||||||
Share repurchases | (11 | ) | (75 | ) | (989 | ) | (1,075 | ) | |||||||||||
Stock-based compensation, | |||||||||||||||||||
including tax benefit of $14 | 70 | (8 | ) | 62 | |||||||||||||||
Other | (3 | ) | (3 | ) | |||||||||||||||
Balance at December 31, 2015 | $ | 299 | $ | 2,143 | $ | (445 | ) | $ | 10,191 | $ | 12,188 | ||||||||
See accompanying notes to consolidated financial statements.
K 42
Norfolk Southern Corporation and Subsidiaries
Notes to Consolidated Financial Statements
The following Notes are an integral part of the Consolidated Financial Statements.
1. Summary of Significant Accounting Policies
Description of Business
Norfolk Southern Corporation (Norfolk Southern) is a Virginia-based holding company engaged principally in the rail transportation business, operating approximately 20,000 miles of road primarily in the East and Midwest. These consolidated financial statements include Norfolk Southern and its majority-owned and controlled subsidiaries (collectively, NS, we, us, and our). Norfolk Southern’s major subsidiary is Norfolk Southern Railway Company (NSR). All significant intercompany balances and transactions have been eliminated in consolidation.
NSR and its railroad subsidiaries transport raw materials, intermediate products, and finished goods classified in the following commodity groups (percent of total railway operating revenues in 2015): intermodal (23%); coal (17%); chemicals (17%); agriculture/consumer products/government (15%); metals/construction (12%); automotive (9%); and, paper/clay/forest products (7%). Although most of our customers are domestic, ultimate points of origination or destination for some of the products transported (particularly coal bound for export and some intermodal containers) may be outside the U.S. More than 80% of our railroad employees are covered by collective bargaining agreements with various labor unions.
Use of Estimates
The preparation of financial statements in accordance with U.S. Generally Accepted Accounting Principles (GAAP) requires us to make estimates and assumptions that affect the reported amounts of assets and liabilities, the disclosure of contingent assets and liabilities at the date of the financial statements and the reported amounts of revenues and expenses during the reporting period. We periodically review our estimates, including those related to the recoverability and useful lives of assets, as well as liabilities for litigation, environmental remediation, casualty claims, income taxes and pension and other postretirement benefits. Changes in facts and circumstances may result in revised estimates.
Revenue Recognition
Transportation revenue is recognized proportionally as a shipment moves from origin to destination, and related expenses are recognized as incurred. Refunds (which are primarily volume-based incentives) are recorded as a reduction to revenues on the basis of management’s best estimate of projected liability, which is based on historical activity, current shipment counts and the expectation of future activity. We regularly monitor our contract refund liability and, historically, the estimates have not differed significantly from the amounts ultimately refunded. Switching, demurrage and other incidental service revenues are recognized when the services are performed.
Cash Equivalents
“Cash equivalents” are highly liquid investments purchased three months or less from maturity.
Allowance for Doubtful Accounts
Our allowance for doubtful accounts was $3 million at December 31, 2015 and $6 million at December 31, 2014. To determine our allowance for doubtful accounts, we evaluate historical loss experience (which has not been significant), the characteristics of current accounts, and general economic conditions and trends.
K 43
Materials and Supplies
“Materials and supplies,” consisting mainly of fuel oil and items for maintenance of property and equipment, are stated at the lower of average cost or market. The cost of materials and supplies expected to be used in property additions or improvements is included in “Properties.”
Investments
Investments where we have the ability to exercise significant influence over but do not control the entity are accounted for using the equity method, whereby the investment is carried at the cost of the acquisition plus our equity in undistributed earnings or losses since acquisition.
Properties
“Properties” are stated principally at cost and are depreciated using the group method whereby assets with similar characteristics, use, and expected lives are grouped together in asset classes and depreciated using a composite depreciation rate. This methodology treats each asset class as a pool of resources, not as singular items. We use approximately 70 depreciable asset classes. The primary depreciation method for our asset base is group life. Units of production is the principal method of depreciation for rail in high density corridors and for depletion of natural resources (Note 2). Remaining properties are depreciated generally using the straight-line method over the lesser of estimated service or lease lives. Depreciation in the Consolidated Statements of Cash Flows includes both depreciation and depletion.
Depreciation expense is based on our assumptions concerning expected service lives of our properties as well as the expected net salvage that will be received upon their retirement. In developing these assumptions, we utilize periodic depreciation studies that are performed by an independent outside firm of consulting engineers and approved by the Surface Transportation Board (STB). Our depreciation studies are conducted about every three years for equipment and every six years for track assets and other roadway property. The frequency of these studies is consistent with guidelines established by the STB. Key factors that are considered in developing average service life and salvage estimates include:
• | statistical analysis of historical retirement data and surviving asset records; |
• | review of historical salvage received and current market rates; |
• | review of our operations including expected changes in technology, customer demand, maintenance practices and asset management strategies; |
• | review of accounting policies and assumptions; and |
• | industry review and analysis. |
The units of production depreciation rate for rail in high density corridors is derived based on consideration of annual gross ton miles as compared to the total or ultimate capacity of rail in these corridors. Our experience has shown that traffic density is a leading factor in determination of the expected service life of rail in high density corridors. In developing the respective depreciation rate, consideration is also given to several rail characteristics including age, weight, condition (new or second hand) and type (curve or straight). As a result, a composite depreciation rate is developed which is applied to the depreciable base.
We adjust our rates based on the results of these studies and implement the changes prospectively. The studies may also indicate that the recorded amount of accumulated depreciation is deficient (or in excess) of the amount indicated by the study. Any such deficiency (or excess) is amortized as a component of depreciation expense over the remaining service lives of the affected class of property, as determined by the study. For 2015, roadway depreciation rates ranged from 0.83% to 33.33% and equipment depreciation rates ranged from 1.55% to 33.33%.
We capitalize interest on major projects during the period of their construction. Expenditures, including those on leased assets, that extend an asset’s useful life or increase its utility are capitalized. Expenditures capitalized
K 44
include those that are directly related to a capital project and may include materials, labor and equipment, in addition to an allocable portion of indirect costs that clearly relate to a particular project. Due to the capital intensive nature of the railroad industry, a significant portion of annual capital spending relates to the replacement of self-constructed assets. Because removal activities occur in conjunction with replacement, removal costs are estimated based on an average percentage of time employees replacing assets spend on removal functions. Costs related to repairs and maintenance activities that do not extend an asset’s useful life or increase its utility are expensed when such repairs are performed.
When properties other than land and nonrail assets are sold or retired in the ordinary course of business, the cost of the assets, net of sale proceeds or salvage, is charged to accumulated depreciation, and no gain or loss is recognized in earnings. Actual historical cost values are retired when available, such as with equipment assets. The use of estimates in recording the retirement of certain roadway assets is necessary based on the impracticality of tracking individual asset costs. When retiring rail, ties and ballast, we use statistical curves that indicate the relative distribution of the age of the assets retired. The historical cost of other roadway assets is estimated using a combination of inflation indices specific to the rail industry and those published by the U.S. Bureau of Labor Statistics. The indices are applied to the replacement value based on the age of the retired assets. These indices are used because they closely correlate with the costs of roadway assets. Gains and losses on disposal of land and nonrail assets are included in “Other income – net” (Note 2) since such income is not a product of our railroad operations.
A retirement is considered abnormal if it does not occur in the normal course of business, if it relates to disposition of a large segment of an asset class and if the retirement varies significantly from the retirement profile identified through our depreciation studies, which inherently consider the impact of normal retirements on expected service lives and depreciation rates. Gains or losses from abnormal retirements are recognized in earnings.
We review the carrying amount of properties whenever events or changes in circumstances indicate that such carrying amount may not be recoverable based on future undiscounted cash flows. Assets that are deemed impaired as a result of such review are recorded at the lower of carrying amount or fair value.
Required Accounting Changes
In April 2015, the Financial Accounting Standards Board (FASB) issued Accounting Standards Update (ASU) No. 2015-03, “Interest - Imputation of Interest (Subtopic 835-30): Simplifying the Presentation of Debt Issuance Costs.” This update requires that debt issuance costs be presented in the balance sheet as a reduction from the related debt liability rather than as an asset, consistent with debt discounts. The recognition and measurement guidance for debt issuance costs are not affected by the amendments in this update. We early adopted the provisions of this ASU during the second quarter of 2015 and applied it retrospectively. The adoption of ASU 2015-03 resulted in the presentation of $47 million of debt issuance costs as a reduction of “Long-term debt” at December 31, 2015. We retrospectively adjusted the December 31, 2014, 2013, 2012, and 2011 consolidated balance sheets and related disclosures to reflect the reclassification of $41 million, $44 million, $40 million, and $33 million of debt issuance costs, respectively, from “Other assets” to “Long-term debt.” There was no other impact on our consolidated financial statements from the adoption of ASU 2015-03.
In May 2014, the FASB issued ASU No. 2014-09, "Revenue from Contracts with Customers." This update will replace most existing revenue recognitionguidance in GAAP and requires an entity to recognize the amount of revenue to which it expects to be entitled for the transfer of promised goods or services to customers. In July 2015, the FASB approved a one-year deferral of the effective date of the new standard, making it effective for our annual and interim reporting periods beginning January 1, 2018. Early application is permitted, but not before the original effective date for public business entities (annual reporting periods beginning after December 15, 2016). The ASU permits the use of either the retrospective or cumulative effect transition method. We are evaluating the effect that ASU 2014-09 will have on our consolidated financial statements and related disclosures.
K 45
In November 2015, the FASB issued ASU No. 2015-17, “Income Taxes (Subtopic 740): Balance Sheet
Classification of Deferred Taxes.” This update, effective for annual and interim periods beginning after December 15, 2016, requires that deferred tax liabilities and assets be classified as noncurrent on the balance sheet rather than as separate current and noncurrent amounts on the balance sheet. Early application is permitted as of the beginning of an interim or annual reporting period, and may be applied either prospectively or retrospectively. This update, once adopted, will not have a material effect on our presentation of deferred tax liabilities and assets on our balance sheet.
2. Other Income – Net
2015 | 2014 | 2013 | |||||||||
($ in millions) | |||||||||||
Income from natural resources: | |||||||||||
Royalties from coal | $ | 19 | $ | 33 | $ | 50 | |||||
Nonoperating depletion and depreciation | (5 | ) | (5 | ) | (6 | ) | |||||
Subtotal | 14 | 28 | 44 | ||||||||
Rental income | 80 | 75 | 61 | ||||||||
Gains and losses from sale of properties (including joint venture sales) | 55 | 13 | 101 | ||||||||
Interest income | 8 | 9 | 8 | ||||||||
Equity in earnings of Conrail Inc. (Note 5) | — | — | 42 | ||||||||
Corporate-owned life insurance – net | (1 | ) | 24 | 25 | |||||||
Other interest expense – net | (4 | ) | (12 | ) | (12 | ) | |||||
Charitable contributions | (9 | ) | (9 | ) | (11 | ) | |||||
Taxes on nonoperating property | (10 | ) | (9 | ) | (10 | ) | |||||
Other | (30 | ) | (15 | ) | (15 | ) | |||||
Total | $ | 103 | $ | 104 | $ | 233 | |||||
“Other income – net” includes income and costs not part of rail operations and the income generated by the activities of our noncarrier subsidiaries as well as the costs incurred by those subsidiaries in their operations.
K 46
3. Income Taxes
Provisions for Income Taxes
2015 | 2014 | 2013 | |||||||||
($ in millions) | |||||||||||
Current: | |||||||||||
Federal | $ | 505 | $ | 729 | $ | 695 | |||||
State | 61 | 111 | 98 | ||||||||
Total current taxes | 566 | 840 | 793 | ||||||||
Deferred: | |||||||||||
Federal | 292 | 299 | 270 | ||||||||
State | 28 | (5 | ) | (8 | ) | ||||||
Total deferred taxes | 320 | 294 | 262 | ||||||||
Provision for income taxes | $ | 886 | $ | 1,134 | $ | 1,055 | |||||
Other current assets include prepaid income taxes of $51 million and $248 million, respectively, at December 31, 2015 and 2014.
Reconciliation of Statutory Rate to Effective Rate
The “Provision for income taxes” in the Consolidated Statements of Income differs from the amounts computed by applying the statutory federal corporate tax rate as follows:
2015 | 2014 | 2013 | ||||||||||||||||||
Amount | % | Amount | % | Amount | % | |||||||||||||||
($ in millions) | ||||||||||||||||||||
Federal income tax at statutory rate | $ | 855 | 35 | $ | 1,097 | 35 | $ | 1,038 | 35 | |||||||||||
State income taxes, net of federal tax effect | 72 | 3 | 88 | 3 | 69 | 2 | ||||||||||||||
State tax law changes, net of federal tax effect | (14 | ) | (1 | ) | (20 | ) | (1 | ) | (11 | ) | — | |||||||||
Other, net | (27 | ) | (1 | ) | (31 | ) | (1 | ) | (41 | ) | (1 | ) | ||||||||
Provision for income taxes | $ | 886 | 36 | $ | 1,134 | 36 | $ | 1,055 | 36 | |||||||||||
K 47
Deferred Tax Assets and Liabilities
Certain items are reported in different periods for financial reporting and income tax purposes. Deferred tax assets and liabilities are recorded in recognition of these differences. The tax effects of temporary differences that give rise to significant portions of the deferred tax assets and deferred tax liabilities are as follows:
December 31, | |||||||
2015 | 2014 | ||||||
($ in millions) | |||||||
Deferred tax assets: | |||||||
Compensation and benefits, including postretirement | $ | 430 | $ | 454 | |||
Accruals, including casualty and other claims | 108 | 107 | |||||
Other | 65 | 45 | |||||
Total gross deferred tax assets | 603 | 606 | |||||
Less valuation allowance | (35 | ) | (33 | ) | |||
Net deferred tax asset | 568 | 573 | |||||
Deferred tax liabilities: | |||||||
Property | (9,072 | ) | (8,768 | ) | |||
Other | (438 | ) | (455 | ) | |||
Total gross deferred tax liabilities | (9,510 | ) | (9,223 | ) | |||
Net deferred tax liability | (8,942 | ) | (8,650 | ) | |||
Net current deferred tax asset | 121 | 167 | |||||
Net long-term deferred tax liability | $ | (9,063 | ) | $ | (8,817 | ) | |
Except for amounts for which a valuation allowance has been provided, we believe that it is more likely than not that the results of future operations will generate sufficient taxable income to realize the deferred tax assets. The valuation allowance at the end of each year primarily relates to subsidiary state income tax net operating losses and state investment tax credits that may not be utilized prior to their expiration. The total valuation allowance increased by $2 million in 2015 and $1 million in 2014.
K 48
Uncertain Tax Positions
A reconciliation of the beginning and ending amount of unrecognized tax benefits is as follows:
December 31, | |||||||
2015 | 2014 | ||||||
($ in millions) | |||||||
Balance at beginning of year | $ | 61 | $ | 65 | |||
Additions based on tax positions related to the current year | 4 | 6 | |||||
Additions for tax positions of prior years | — | 1 | |||||
Reductions for tax positions of prior years | (34 | ) | (8 | ) | |||
Settlements with taxing authorities | (5 | ) | (1 | ) | |||
Lapse of statutes of limitations | (1 | ) | (2 | ) | |||
Balance at end of year | $ | 25 | $ | 61 | |||
Included in the balance of unrecognized tax benefits at December 31, 2015, are potential benefits of $17 million that would affect the effective tax rate if recognized. Unrecognized tax benefits are adjusted in the period in which new information about a tax position becomes available or the final outcome differs from the amount recorded.
IRS examinations have been completed for all years prior to 2013. We are not currently under audit by the IRS. State income tax returns generally are subject to examination for a period of three to four years after filing of the return. In addition, we are generally obligated to report changes in taxable income arising from federal income tax examinations to the states within a period of up to two years from the date the federal examination is final. We have various state income tax returns either under examination, administrative appeal, or litigation.
Interest related to unrecognized tax benefits, which is included in “Other income – net,” totaled $3 million of income in 2015 and $1 million of expense in both 2014 and 2013. There were no penalties related to tax matters in 2015, 2014, and 2013. We have recorded a liability of $2 million at December 31, 2015, and $6 million at December 31, 2014, for the payment of interest on unrecognized tax benefits. We have no liability recorded at December 31, 2015 and 2014, for the payment of penalties on unrecognized tax benefits.
K 49
4. Fair Value
Fair Value Measurements
ASC 820-10, “Fair Value Measurements,” established a framework for measuring fair value and a fair value hierarchy that prioritizes the inputs to valuation techniques used to measure fair value into three broad levels, as follows:
Level 1 | Inputs to the valuation methodology are unadjusted quoted prices for identical assets or liabilities in active markets that we have the ability to access. |
Level 2 | Inputs to the valuation methodology include: |
• quoted prices for similar assets or liabilities in active markets; • quoted prices for identical or similar assets or liabilities in inactive markets; • inputs other than quoted prices that are observable for the asset or liability; • inputs that are derived principally from or corroborated by observable market data by correlation or other means. | |
If the asset or liability has a specified (contractual) term, the Level 2 input must be observable for substantially the full term of the asset or liability. | |
Level 3 | Inputs to the valuation methodology are unobservable and significant to the fair value measurement. |
The asset’s or liability’s fair value measurement level within the hierarchy is based on the lowest level of any input that is significant to the fair value measurement. Other than those assets and liabilities described below that approximate fair value, there were no assets or liabilities measured at fair value on a recurring basis at December 31, 2015 or 2014.
Fair Values of Financial Instruments
We have evaluated the fair values of financial instruments and methods used to determine those fair values. The fair values of “Cash and cash equivalents,” “Accounts receivable,” “Accounts payable,” and “Short-term debt” approximate carrying values because of the short maturity of these financial instruments. The carrying value of corporate-owned life insurance is recorded at cash surrender value and, accordingly, approximates fair value. The carrying amounts and estimated fair values for the remaining financial instruments, excluding investments accounted for under the equity method, consisted of the following at December 31:
2015 | 2014 | ||||||||||||||
Carrying Amount | Fair Value | Carrying Amount | Fair Value | ||||||||||||
($ in millions) | |||||||||||||||
Long-term investments | $ | 162 | $ | 190 | $ | 162 | $ | 193 | |||||||
Long-term debt, including current maturities | (9,893 | ) | (11,124 | ) | (8,885 | ) | (10,962 | ) | |||||||
Underlying net assets were used to estimate the fair value of investments with the exception of notes receivable, which are based on future discounted cash flows. The fair values of long-term debt were estimated based on quoted market prices or discounted cash flows using current interest rates for debt with similar terms, company rating, and remaining maturity.
K 50
The following tables set forth the fair value of long-term investment and long-term debt balances disclosed above by valuation technique level, within the fair value hierarchy (there were no level 3 valued assets or liabilities).
December 31, 2015 | |||||||||||
Level 1 | Level 2 | Total | |||||||||
($ in millions) | |||||||||||
Long-term investments | $ | 49 | $ | 141 | $ | 190 | |||||
Long-term debt, including current maturities | (11,022 | ) | (102 | ) | (11,124 | ) | |||||
December 31, 2014 | |||||||||||
Level 1 | Level 2 | Total | |||||||||
($ in millions) | |||||||||||
Long-term investments | $ | 50 | $ | 143 | $ | 193 | |||||
Long-term debt, including current maturities | (10,754 | ) | (208 | ) | (10,962 | ) | |||||
5. Investments
December 31, | |||||||
2015 | 2014 | ||||||
($ in millions) | |||||||
Long-term investments: | |||||||
Equity method investments: | |||||||
Conrail Inc. | $ | 1,147 | $ | 1,102 | |||
TTX Company | 445 | 425 | |||||
Meridian Speedway LLC | 274 | 277 | |||||
Pan Am Southern LLC | 153 | 152 | |||||
Other | 83 | 91 | |||||
Total equity method investments | 2,102 | 2,047 | |||||
Company-owned life insurance at net cash surrender value | 308 | 470 | |||||
Other investments | 162 | 162 | |||||
Total long-term investments | $ | 2,572 | $ | 2,679 | |||
K 51
Investment in Conrail
Through a limited liability company, we and CSX Corporation (CSX) jointly own Conrail Inc. (Conrail), whose primary subsidiary is CRC. We have a 58% economic and 50% voting interest in the jointly owned entity, and CSX has the remainder of the economic and voting interests. We are amortizing the excess of the purchase price over Conrail’s net equity using the principles of purchase accounting, based primarily on the estimated useful lives of Conrail’s depreciable property and equipment, including the related deferred tax effect of the differences in book and tax accounting bases for such assets, as all of the purchase price at acquisition was allocable to Conrail’s tangible assets and liabilities.
At December 31, 2015, based on the funded status of Conrail’s pension plans, we increased our proportional investment in Conrail by $3 million. This resulted in income of $3 million recorded to “Other comprehensive loss” and a combined federal and state deferred tax liability of less than $1 million.
At December 31, 2014, based on the funded status of Conrail’s pension plans, we decreased our proportional investment in Conrail by $12 million. This resulted in expense of $11 million recorded to “Other comprehensive loss” and a combined federal and state deferred tax asset of $1 million.
At December 31, 2015, the difference between our investment in Conrail and our share of Conrail’s underlying net equity was $526 million. Our equity in the earnings of Conrail, net of amortization, included in “Purchased services and rents” was $42 million for 2015 and $39 million for 2014. For 2013, this amounted to $42 million and was included in “Other income – net.”
CRC owns and operates certain properties (the Shared Assets Areas) for the joint and exclusive benefit of NSR and CSX Transportation, Inc. (CSXT). The costs of operating the Shared Assets Areas are borne by NSR and CSXT based on usage. In addition, NSR and CSXT pay CRC a fee for access to the Shared Assets Areas. “Purchased services and rents” and “Fuel” include expenses for amounts due to CRC for operation of the Shared Assets Areas totaling $154 million in 2015, $144 million in 2014, and $146 million in 2013. Future minimum lease payments due to CRC under the Shared Assets Areas agreements are as follows: $36 million in each of 2016 through 2020 and $124 million thereafter. We provide certain general and administrative support functions to Conrail, the fees for which are billed in accordance with several service-provider arrangements and approximate $8 million annually.
“Accounts payable” includes $71 million at December 31, 2015, and $56 million at December 31, 2014, due to Conrail for the operation of the Shared Assets Areas. “Other liabilities” includes $280 million at both December 31, 2015 and 2014 for long-term advances from Conrail, maturing 2044, that bear interest at an average rate of 2.9%.
Investment in TTX
Along with eight other railroads, we jointly own TTX Company (formerly Trailer Train Company). We have a 19.65% interest in TTX, which is engaged in the business of leasing a fleet of standardized types of railroad flatcars to railroads in the United States.
We pay TTX a monthly fee for use of certain equipment, included in “Purchased services and rents.” For the years ended December 31, 2015, 2014 and 2013, this amounted to $219 million, $200 million, and $179 million of expense, respectively. Offsetting these amounts, our equity in the earnings of TTX, also included in “Purchased services and rents” totaled $21 million for 2015, $19 million for 2014, and $14 million for 2013.
K 52
6. Properties
Accumulated | Net Book | Depreciation | ||||||||||||
At December 31, 2015 | Cost | Depreciation | Value | Rate (1) | ||||||||||
($ in millions) | ||||||||||||||
Land | $ | 2,327 | $ | — | $ | 2,327 | — | |||||||
Roadway: | ||||||||||||||
Rail and other track material | 6,467 | (1,944 | ) | 4,523 | 2.46 | % | ||||||||
Ties | 4,846 | (1,229 | ) | 3,617 | 3.26 | % | ||||||||
Ballast | 2,468 | (539 | ) | 1,929 | 2.64 | % | ||||||||
Construction in process | 686 | — | 686 | — | ||||||||||
Other roadway | 12,662 | (3,225 | ) | 9,437 | 2.54 | % | ||||||||
Total roadway | 27,129 | (6,937 | ) | 20,192 | ||||||||||
Equipment: | ||||||||||||||
Locomotives | 5,291 | (2,126 | ) | 3,165 | 3.31 | % | ||||||||
Freight cars | 3,437 | (1,422 | ) | 2,015 | 2.87 | % | ||||||||
Computers and software | 500 | (296 | ) | 204 | 11.25 | % | ||||||||
Construction in process | 237 | — | 237 | — | ||||||||||
Other equipment | 1,074 | (421 | ) | 653 | 6.09 | % | ||||||||
Total equipment | 10,539 | (4,265 | ) | 6,274 | ||||||||||
Other property | 475 | (276 | ) | 199 | 0.95 | % | ||||||||
Total properties | $ | 40,470 | $ | (11,478 | ) | $ | 28,992 | |||||||
K 53
Accumulated | Net Book | Depreciation | ||||||||||||
At December 31, 2014 | Cost | Depreciation | Value | Rate (1) | ||||||||||
($ in millions) | ||||||||||||||
Land | $ | 2,260 | $ | — | $ | 2,260 | — | |||||||
Roadway: | ||||||||||||||
Rail and other track material | 6,173 | (1,848 | ) | 4,325 | 2.46 | % | ||||||||
Ties | 4,628 | (1,156 | ) | 3,472 | 3.25 | % | ||||||||
Ballast | 2,360 | (498 | ) | 1,862 | 2.63 | % | ||||||||
Construction in process | 500 | — | 500 | — | ||||||||||
Other roadway | 12,078 | (2,989 | ) | 9,089 | 2.55 | % | ||||||||
Total roadway | 25,739 | (6,491 | ) | 19,248 | ||||||||||
Equipment: | ||||||||||||||
Locomotives | 5,120 | (2,010 | ) | 3,110 | 3.27 | % | ||||||||
Freight cars | 3,276 | (1,411 | ) | 1,865 | 2.82 | % | ||||||||
Computers and software | 487 | (281 | ) | 206 | 11.60 | % | ||||||||
Construction in process | 199 | — | 199 | — | ||||||||||
Other equipment | 952 | (349 | ) | 603 | 6.09 | % | ||||||||
Total equipment | 10,034 | (4,051 | ) | 5,983 | ||||||||||
Other property | 475 | (272 | ) | 203 | 1.04 | % | ||||||||
Total properties | $ | 38,508 | $ | (10,814 | ) | $ | 27,694 | |||||||
(1) | Composite annual depreciation rate for the underlying assets, excluding the effects of the amortization of any deficiency (or excess) that resulted from our depreciation studies. |
Roadway and equipment property included $2 million at December 31, 2015 and $8 million at December 31, 2014, of assets recorded pursuant to capital leases with accumulated amortization of less than $1 million at December 31, 2015 and $3 million at December 31, 2014. Other property includes the costs of obtaining rights to natural resources of $336 million at both December 31, 2015 and December 31, 2014, with accumulated depletion of $198 million and $196 million, respectively.
Capitalized Interest
Total interest cost incurred on debt was $566 million in 2015, $564 million in 2014, and $543 million in 2013, of which $21 million, $19 million, and $18 million, respectively, was capitalized.
K 54
7. Current Liabilities
December 31, | |||||||
2015 | 2014 | ||||||
($ in millions) | |||||||
Accounts payable: | |||||||
Accounts and wages payable | $ | 602 | $ | 748 | |||
Casualty and other claims (Note 16) | 174 | 187 | |||||
Vacation liability | 135 | 132 | |||||
Due to Conrail (Note 5) | 71 | 56 | |||||
Other | 109 | 110 | |||||
Total | $ | 1,091 | $ | 1,233 | |||
Other current liabilities: | |||||||
Interest payable | $ | 123 | $ | 118 | |||
Pension benefit obligations (Note 11) | 16 | 14 | |||||
Other | 98 | 96 | |||||
Total | $ | 237 | $ | 228 | |||
8. Debt
Debt with weighted average interest rates and maturities is presented below:
December 31, | |||||||
2015 | 2014 | ||||||
($ in millions) | |||||||
Notes and debentures: | |||||||
6.78% maturing to 2020 | $ | 2,464 | $ | 2,464 | |||
3.37% maturing 2021 to 2023 | 1,783 | 1,783 | |||||
5.71% maturing 2024 to 2027 | 1,019 | 1,019 | |||||
6.83% maturing 2029 to 2037 | 783 | 783 | |||||
4.71% maturing 2041 to 2046 | 2,934 | 1,833 | |||||
6.39% maturing 2097 to 2111 | 1,328 | 1,328 | |||||
Securitization borrowings, 1.48% | 200 | 200 | |||||
Other debt, 8.21% maturing to 2024 | 87 | 90 | |||||
Discounts and premiums, net | (458 | ) | (474 | ) | |||
Debt issuance costs (reclassified, see Note 1) | (47 | ) | (41 | ) | |||
Total debt | 10,093 | 8,985 | |||||
Less current maturities and short-term debt | (700 | ) | (102 | ) | |||
Long-term debt excluding current maturities and short-term debt | $ | 9,393 | $ | 8,883 | |||
K 55
Long-term debt maturities subsequent to 2016 are as follows: | |||
2017 | $ | 550 | |
2018 | 600 | ||
2019 | 585 | ||
2020 | 314 | ||
2021 and subsequent years | 7,344 | ||
Total | $ | 9,393 | |
During 2015, we issued $600 million of 4.65% senior notes due 2046 in the fourth quarter and $500 million of 4.45% senior notes due 2045 in the second quarter.
We have in place a $350 million receivables securitization facility under which NSR sells substantially all of its eligible third-party receivables to a subsidiary, which in turn may transfer beneficial interests in the receivables to various commercial paper vehicles. Amounts received under the facility are accounted for as borrowings. Under this facility, we received $100 million and repaid $100 million in 2015. In 2014, we received $200 million and repaid $200 million under this facility.
At December 31, 2015, the amount outstanding under the receivables securitization facility was $200 million (at an average variable interest rate of 1.48%) included in “Short-term debt” in the Consolidated Balance Sheets. At December 31, 2014, the amount outstanding was $200 million (at an average variable interest rate of 1.28%) which included $100 million in “Short-term debt” with the remaining $100 million included in “Long-term debt” on the Consolidated Balance Sheets. The facility has a two year term which was renewed and amended in October 2014 to run until October 2016. At December 31, 2015 and 2014, the receivables included in “Accounts receivable – net” serving as collateral for these borrowings totaled $653 million and $782 million, respectively.
Issuance of Debt or Equity Securities
We have authority from our Board of Directors to issue an additional $600 million of debt or equity securities through public or private sale.
Credit Agreement, Debt Covenants, and Commercial Paper
We have in place and available a $750 million, five-year credit agreement expiring in December 2016, which provides for borrowings at prevailing rates and includes covenants. We had no amounts outstanding under this facility at December 31, 2015 and 2014, and we are in compliance with all of its covenants.
K 56
9. Lease Commitments
We are committed under long-term lease agreements, which expire on various dates through 2067, for equipment, lines of road and other property. The following amounts do not include payments to CRC under the Shared Assets Areas agreements (Note 5). Future minimum lease payments and operating lease expense are as follows:
Future Minimum Lease Payments
Operating Leases | |||
($ in millions) | |||
2016 | $ | 77 | |
2017 | 73 | ||
2018 | 65 | ||
2019 | 51 | ||
2020 | 50 | ||
2021 and subsequent years | 348 | ||
Total | $ | 664 | |
Our aggregate future minimum capital lease payments, less imputed interest at an average rate of 6.3%, totaled $2 million as of December 31, 2015, with payments extending to 2024.
Operating Lease Expense
2015 | 2014 | 2013 | |||||||||
($ in millions) | |||||||||||
Minimum rents | $ | 111 | $ | 109 | $ | 121 | |||||
Contingent rents | 84 | 92 | 82 | ||||||||
Total | $ | 195 | $ | 201 | $ | 203 | |||||
Contingent rents are primarily comprised of usage-based rent paid to other railroads for joint facility operations.
K 57
10. Other Liabilities
December 31, | |||||||
2015 | 2014 | ||||||
($ in millions) | |||||||
Net retiree other postretirement benefit obligations (Note 11) | $ | 347 | $ | 309 | |||
Net pension benefit obligations (Note 11) | 318 | 260 | |||||
Long-term advances from Conrail (Note 5) | 280 | 280 | |||||
Casualty and other claims (Note 16) | 191 | 199 | |||||
Deferred compensation | 117 | 116 | |||||
Other | 132 | 148 | |||||
Total | $ | 1,385 | $ | 1,312 | |||
11. Pensions and Other Postretirement Benefits
We have both funded and unfunded defined benefit pension plans covering principally salaried employees. We also provide specified health care and life insurance benefits to eligible retired employees; these plans can be amended or terminated at our option. Under our self-insured retiree health care plan, for those participants who are not Medicare-eligible, a defined percentage of health care expenses is covered for retired employees and their dependents, reduced by any deductibles, coinsurance, and, in some cases, coverage provided under other group insurance policies. Those participants who are Medicare-eligible are not covered under the self-insured retiree health care plan, but instead are provided with an employer-funded health reimbursement account which can be used for reimbursement of health insurance premiums or eligible out-of-pocket medical expenses.
K 58
Pension and Other Postretirement Benefit Obligations and Plan Assets
Pension Benefits | Other Postretirement Benefits | ||||||||||||||
2015 | 2014 | 2015 | 2014 | ||||||||||||
($ in millions) | |||||||||||||||
Change in benefit obligations: | |||||||||||||||
Benefit obligation at beginning of year | $ | 2,429 | $ | 2,091 | $ | 571 | $ | 855 | |||||||
Service cost | 41 | 34 | 7 | 7 | |||||||||||
Interest cost | 93 | 93 | 21 | 24 | |||||||||||
Actuarial losses (gains) | (64 | ) | 335 | (7 | ) | 102 | |||||||||
Plan amendments | — | — | (8 | ) | (367 | ) | |||||||||
Benefits paid | (127 | ) | (124 | ) | (48 | ) | (50 | ) | |||||||
Benefit obligation at end of year | 2,372 | 2,429 | 536 | 571 | |||||||||||
Change in plan assets: | |||||||||||||||
Fair value of plan assets at beginning of year | 2,167 | 2,115 | 262 | 239 | |||||||||||
Actual return on plan assets | (14 | ) | 163 | 2 | 26 | ||||||||||
Employer contribution (reimbursement)1 | 14 | 13 | (27 | ) | 47 | ||||||||||
Benefits paid | (127 | ) | (124 | ) | (48 | ) | (50 | ) | |||||||
Fair value of plan assets at end of year | 2,040 | 2,167 | 189 | 262 | |||||||||||
Funded status at end of year | $ | (332 | ) | $ | (262 | ) | $ | (347 | ) | $ | (309 | ) | |||
Amounts recognized in the Consolidated | |||||||||||||||
Balance Sheets: | |||||||||||||||
Noncurrent assets | $ | 2 | $ | 12 | $ | — | $ | — | |||||||
Current liabilities | (16 | ) | (14 | ) | — | — | |||||||||
Noncurrent liabilities | (318 | ) | (260 | ) | (347 | ) | (309 | ) | |||||||
Net amount recognized | $ | (332 | ) | $ | (262 | ) | $ | (347 | ) | $ | (309 | ) | |||
Amounts included in accumulated other comprehensive | |||||||||||||||
loss (before tax): | |||||||||||||||
Net loss | $ | 904 | $ | 854 | $ | 16 | $ | 6 | |||||||
Prior service cost (benefit) | 3 | 3 | (331 | ) | (347 | ) | |||||||||
1Norfolk Southern is eligible to receive reimbursement from the Norfolk Southern Corporation Post-Retirement Benefits Trust (Trust), and the Trust had an outstanding liability to Norfolk Southern of $30 million as of December 31, 2015.
Our accumulated benefit obligation for our defined benefit pension plans is $2.2 billion at both December 31, 2015 and 2014. Our unfunded pension plans, included above, which in all cases have no assets and therefore have an accumulated benefit obligation in excess of plan assets, had projected benefit obligations of $274 million at both December 31, 2015 and December 31, 2014, and had accumulated benefit obligations of $252 million at December 31, 2015, and $244 million at December 31, 2014.
K 59
Pension and Other Postretirement Benefit Cost Components
2015 | 2014 | 2013 | |||||||||
($ in millions) | |||||||||||
Pension benefits: | |||||||||||
Service cost | $ | 41 | $ | 34 | $ | 41 | |||||
Interest cost | 93 | 93 | 81 | ||||||||
Expected return on plan assets | (165 | ) | (151 | ) | (142 | ) | |||||
Amortization of net losses | 65 | 54 | 89 | ||||||||
Amortization of prior service cost | — | 1 | — | ||||||||
Net cost | $ | 34 | $ | 31 | $ | 69 | |||||
Other postretirement benefits: | |||||||||||
Service cost | $ | 7 | $ | 7 | $ | 16 | |||||
Interest cost | 21 | 24 | 50 | ||||||||
Expected return on plan assets | (19 | ) | (18 | ) | (16 | ) | |||||
Amortization of net losses | — | — | 58 | ||||||||
Amortization of prior service benefit | (24 | ) | (20 | ) | — | ||||||
Net cost (benefit) | $ | (15 | ) | $ | (7 | ) | $ | 108 | |||
Other Changes in Plan Assets and Benefit Obligations Recognized in Other Comprehensive Loss
2015 | |||||||
Pension Benefits | Other Postretirement Benefits | ||||||
($ in millions) | |||||||
Net loss arising during the year | $ | 115 | $ | 10 | |||
Prior service effect of plan amendment | — | (8 | ) | ||||
Amortization of net losses | (65 | ) | — | ||||
Amortization of prior service benefit | — | 24 | |||||
Total recognized in other comprehensive loss | $ | 50 | $ | 26 | |||
Total recognized in net periodic cost | |||||||
and other comprehensive loss | $ | 84 | $ | 11 | |||
Net actuarial losses arising during the year to our pension and other postretirement benefits were due primarily to a lower than expected return on plan assets partially offset by an increase in our discount rate and a change in our mortality assumption.
The estimated net losses for the pension benefit plans that will be amortized from accumulated other comprehensive loss into net periodic cost over the next year are $50 million. The estimated prior service benefit for the other
K 60
postretirement benefit plans that will be amortized from accumulated other comprehensive loss into net periodic benefit over the next year is $24 million.
Pension and Other Postretirement Benefits Assumptions
Costs for pension and other postretirement benefits are determined based on actuarial valuations that reflect appropriate assumptions as of the measurement date, ordinarily the beginning of each year. The funded status of the plans is determined using appropriate assumptions as of each year end. A summary of the major assumptions follows:
2015 | 2014 | 2013 | ||||||
Pension funded status: | ||||||||
Discount rate | 4.30 | % | 3.95 | % | 4.60 | % | ||
Future salary increases | 4.50 | % | 4.50 | % | 4.50 | % | ||
Other postretirement benefits funded status: | ||||||||
Discount rate | 4.02 | % | 3.70 | % | 4.65 | % | ||
Pension cost: | ||||||||
Discount rate | 3.95 | % | 4.60 | % | 3.65 | % | ||
Return on assets in plans | 8.25 | % | 8.25 | % | 8.25 | % | ||
Future salary increases | 4.50 | % | 4.50 | % | 4.50 | % | ||
Other postretirement benefits cost: | ||||||||
Discount rate1 | 3.70 | % | 3.90 | % | 3.80 | % | ||
Return on assets in plans | 8.00 | % | 8.00 | % | 8.00 | % | ||
Health care trend rate | 6.56 | % | 6.94 | % | 7.33 | % | ||
1 2014 other postretirement benefits cost was based on a discount rate of 4.65% prior to our retiree medical plan amendment in the first quarter of 2014, and 3.90% after the plan amendment.
To determine the discount rates, we utilize analyses in which the projected annual cash flows from the pension and other postretirement benefit plans were matched with yield curves based on an appropriate universe of high-quality corporate bonds. We use the results of the yield curve analyses to select the discount rates that match the payment streams of the benefits in these plans.
Health Care Cost Trend Assumptions
For measurement purposes at December 31, 2015, increases in the per capita cost of pre-Medicare covered health care benefits were assumed to be 6.30% for 2016. It is assumed the rate will decrease gradually to an ultimate rate of 5.0% for 2021 and remain at that level thereafter.
K 61
Assumed health care cost trend rates affect the amounts reported in the consolidated financial statements. To illustrate, a one-percentage point change in the assumed health care cost trend would have the following effects:
One-percentage point | |||||||
Increase | Decrease | ||||||
($ in millions) | |||||||
Increase (decrease) in: | |||||||
Total service and interest cost components | $ | 1 | $ | (1 | ) | ||
Postretirement benefit obligation | 11 | (10 | ) | ||||
Asset Management
Ten investment firms manage our defined benefit pension plans’ assets under investment guidelines approved by our Benefits Investment Committee that is comprised of members of our management. Investments are restricted to domestic and international equity securities, domestic and international fixed income securities, and unleveraged exchange-traded options and financial futures. Limitations restrict investment concentration and use of certain derivative investments. The target asset allocation for equity is 75% of the pension plans’ assets. The fixed income portfolio is invested in the Barclays Government/Credit Bond Index Fund, except that the Canadian earmarked portion of the portfolio is maintained in U.S. Treasury Bonds. Equity investments must be in liquid securities listed on national exchanges. No investment is permitted in our securities (except through commingled pension trust funds). Investment managers’ returns are expected to meet or exceed selected market indices by prescribed margins.
Our pension plans’ weighted-average asset allocations, by asset category, were as follows:
Percentage of plan assets at December 31, | |||||
2015 | 2014 | ||||
Domestic equity securities | 50 | % | 50 | % | |
Debt securities | 25 | % | 25 | % | |
International equity securities | 23 | % | 23 | % | |
Cash and cash equivalents | 2 | % | 2 | % | |
Total | 100 | % | 100 | % | |
The other postretirement benefit plan assets consist primarily of trust-owned variable life insurance policies with an asset allocation at December 31, 2015, of 67% in equity securities and 33% in debt securities compared with 66% in equity securities and 34% in debt securities at December 31, 2014. The target asset allocation for equity is between 50% and 75% of the plan’s assets.
The plans’ assumed future returns are based principally on the asset allocations and historic returns for the plans’ asset classes determined from both actual plan returns and, over longer time periods, expected market returns for those asset classes. The expected long-term rate of return on plan assets is applied to a calculated value of plan assets that recognizes changes in fair value over a three-year period. We assumed a rate of return on pension plan assets of 8.25% for each 2015, 2014 and 2013. A one-percentage point change to the rate of return assumption would result in a $20 million change to the net pension cost and, as a result, an equal change in “Compensation and benefits” expense. For 2016, we assume an 8.25% return on pension plan assets.
K 62
Fair Value of Plan Assets
Following is a description of the valuation methodologies used for pension plan assets measured at fair value.
Common stock: Shares held by the plan at year end are valued at the official closing price as defined by the exchange or at the most recent trade price of a security at the close of the active market.
Common collective trusts: Valued at the net asset value (NAV) of shares held by the plan at year end, based on the quoted market prices of the underlying assets of the trusts. The investments are valued using NAV as a practical expedient for fair value. The common collective trusts hold equity securities, fixed income securities and cash and cash equivalents.
Commingled funds: Valued at the NAV of shares held by the plan at year end, based on the quoted market prices of the underlying assets of the funds. The investments are valued using NAV as a practical expedient for fair value. The commingled funds hold equity securities.
Interest bearing cash: Short-term bills or notes are valued at an estimated price at which a dealer would pay for the security at year end using observable market-based inputs; money market funds are valued at the closing price reported on the active market on which the funds are traded.
United States Government and agencies securities: Valued at an estimated price at which a dealer would pay for a security at year end using observable market-based inputs. Inflation adjusted instruments utilize the appropriate index factor.
Preferred stock: Shares held by the plan at year end are valued at the most recent trade price of a security at the close of the active market or at an estimated price at which a dealer would pay for a similar security at year end using observable market-based inputs.
K 63
The following table sets forth the pension plans’ assets by valuation technique level, within the fair value hierarchy (there were no level 3 valued assets).
December 31, 2015 | |||||||||||
Level 1 | Level 2 | Total | |||||||||
($ in millions) | |||||||||||
Common stock | $ | 1,119 | $ | — | $ | 1,119 | |||||
Common collective trusts: | |||||||||||
Debt securities | — | 505 | 505 | ||||||||
International equity securities | — | 301 | 301 | ||||||||
Commingled funds | — | 77 | 77 | ||||||||
Interest bearing cash | 34 | — | 34 | ||||||||
U.S. government and agencies securities | — | 4 | 4 | ||||||||
Total investments | $ | 1,153 | $ | 887 | $ | 2,040 | |||||
December 31, 2014 | |||||||||||
Level 1 | Level 2 | Total | |||||||||
($ in millions) | |||||||||||
Common stock | $ | 1,180 | $ | — | $ | 1,180 | |||||
Common collective trusts: | |||||||||||
Debt securities | — | 532 | 532 | ||||||||
International equity securities | — | 327 | 327 | ||||||||
Commingled funds | — | 81 | 81 | ||||||||
Interest bearing cash | 41 | — | 41 | ||||||||
U.S. government and agencies securities | — | 4 | 4 | ||||||||
Preferred stock | — | 2 | 2 | ||||||||
Total investments | $ | 1,221 | $ | 946 | $ | 2,167 | |||||
Following is a description of the valuation methodologies used for other postretirement benefit plan assets measured at fair value.
Trust-owned life insurance: Valued at our share of the net assets of trust-owned life insurance issued by a major insurance company. The underlying investments of that trust consist of a U.S. stock account and a U.S. bond account, and a loan asset account, but may retain cash at times as well. The U.S. stock account and U.S. bond account are valued based upon the aggregate market values of the underlying investments, and the loan asset account is valued at cash surrender value at the time of the loan, plus accrued interest.
The other postretirement benefit plan assets consisted of trust-owned life insurance with fair values of $189 million and $262 million at December 31, 2015 and 2014 respectively, and are valued under level 2 of the fair value hierarchy. There were no level 1 or level 3 related assets.
The methods used to value pension and other postretirement benefit plan assets may produce a fair value calculation that may not be indicative of net realizable value or reflective of future fair values. Furthermore, while we believe our valuation methods are appropriate and consistent with other market participants, the use of different
K 64
methodologies or assumptions to determine the fair value of certain financial instruments could result in a different fair value measurement at the reporting date.
Contributions and Estimated Future Benefit Payments
In 2016, we expect to contribute approximately $16 million to our unfunded pension plans for payments to pensioners and approximately $20 million to our other postretirement benefit plans for retiree health and death benefits. We do not expect to contribute to our funded pension plan in 2016.
Benefit payments, which reflect expected future service, as appropriate, are expected to be paid as follows:
Pension Benefits | Other Postretirement Benefits | ||||||
($ in millions) | |||||||
2016 | $ | 135 | $ | 44 | |||
2017 | 137 | 43 | |||||
2018 | 140 | 42 | |||||
2019 | 142 | 42 | |||||
2020 | 143 | 41 | |||||
Years 2021 – 2025 | 731 | 185 | |||||
Other Postretirement Coverage
Under collective bargaining agreements, Norfolk Southern and certain subsidiaries participate in a multi-employer benefit plan, which provides certain postretirement health care and life insurance benefits to eligible union employees. Premiums under this plan are expensed as incurred and totaled $32 million in 2015, $36 million in 2014, and $41 million in 2013.
Section 401(k) Plans
Norfolk Southern and certain subsidiaries provide Section 401(k) savings plans for employees. Under the plans, we match a portion of employee contributions, subject to applicable limitations. Our matching contributions, recorded as an expense, under these plans were $21 million in 2015, $20 million in 2014, and $19 million in 2013.
12. Stock-Based Compensation
Under the stockholder-approved Long-Term Incentive Plan (LTIP), the Compensation Committee (Committee), which is made up of nonemployee members of the Board of Directors, or the Chief Executive Officer (if delegated such authority by the Committee) may grant stock options, stock appreciation rights (SARs), restricted stock units (RSUs), restricted shares, performance share units (PSUs), and performance shares, up to a maximum of 104,125,000 shares of our common stock (Common Stock).
The number of shares remaining for issuance under LTIP is reduced (i) by 1 for each award granted as a stock option or stock-settled SAR, or (ii) by 1.61 for an award made in the form other than a stock option or stock-settled SAR. Under the Board-approved Thoroughbred Stock Option Plan (TSOP), the Committee may grant stock options up to a maximum of 6,000,000 shares of Common Stock. As a broad-based stock option plan, stockholder approval of TSOP was not required. We use newly issued shares to satisfy any exercises and awards under LTIP and TSOP. Shares available for future grants are shown in the table on page K69.
K 65
LTIP also permits the payment – on a current or a deferred basis and in cash or in stock – of dividend equivalents on shares of Common Stock covered by stock options, RSUs, or PSUs in an amount commensurate with regular quarterly dividends paid on Common Stock. With respect to stock options, if employment of the participant is terminated for any reason, including retirement, disability, or death, we have no further obligation to make any dividend equivalent payments. Regarding RSUs, if employment of the participant is terminated for any reason other than retirement, disability, or death, we have no further obligation to make any dividend equivalent payments. Should an employee terminate employment, they are not required to forfeit dividend equivalent payments already received. Outstanding PSUs do not currently receive dividend equivalent payments.
During the first and second quarters of 2015, the Committee granted stock options, RSUs and PSUs pursuant to LTIP and granted stock options pursuant to TSOP. Receipt of an award under LTIP was made contingent upon the awardee’s execution of a non-compete agreement, and all awards under LTIP were made subject to forfeiture in the event the awardee “engages in competing employment” for a period of time following retirement.
Accounting Method
We account for our grants of stock options, RSUs, PSUs, and dividend equivalent payments in accordance with ASC 718, “Compensation-Stock Compensation.” Accordingly, all awards result in charges to net income while dividend equivalent payments, which are all related to equity classified awards, are charged to retained income. Related compensation costs were $42 million in 2015, $44 million in 2014, and $54 million in 2013. The total tax effects recognized in income in relation to stock-based compensation were benefits of $13 million in 2015, $14 million in 2014, and $18 million in 2013.
“Common stock issued” in the Consolidated Statements of Cash Flows for the years ended December 31, 2015, 2014, and 2013 includes tax benefits generated from tax deductions in excess of compensation costs recognized for share-based awards of $14 million, $37 million, and $38 million, respectively.
Stock Options
Option exercise prices may not be less than the average of the high and low prices at which Common Stock is traded on the grant date and, effective for LTIP options granted after May 13, 2010, will be at least the higher of (i) the average of the high and low prices at which Common Stock is traded on the grant date, or (ii) the closing price of Common Stock on the grant date. All options are subject to a vesting period of at least one year, and the term of the option will not exceed ten years. Holders of the options granted under LTIP who remain actively employed receive cash dividend equivalent payments for four years in an amount equal to the regular quarterly dividends paid on Common Stock. Dividend equivalent payments are not made on TSOP options.
In the first quarter of 2015, 511,010 options were granted under LTIP and 181,320 options were granted under TSOP. In the second quarter of 2015, 132,880 options were granted under LTIP. The grant prices were $104.23 and $92.76 for the options granted in the first and second quarters of 2015, respectively. In the first quarter of 2014, 515,240 options were granted under LTIP and 181,070 options were granted under TSOP, each with a grant price of $94.17. In the first quarter of 2013, 748,200 options were granted under LTIP and 268,500 options were granted under TSOP, each with a grant price of $69.83. For all years, options granted under LTIP and TSOP may not be exercised prior to the fourth and third anniversaries of the date of grant, respectively, or if the optionee retires or dies before that anniversary date, may not be exercised before the later of one year after the grant date or the date of the optionee’s retirement or death.
The fair value of each option awarded in 2015, 2014, and 2013 was measured on the date of grant using a lattice-based option valuation model. Expected volatilities are based on implied volatilities from traded options on, and historical volatility of, Common Stock. Historical data is used to estimate option exercises and employee terminations within the valuation model. The average expected option life is derived from the output of the valuation model and represents the period of time that all options granted are expected to be outstanding, including the branches of the model that result in options expiring unexercised. The average risk-free interest rate is based on
K 66
the U.S. Treasury yield curve in effect at the time of grant. A dividend yield of zero was used for LTIP options during the vesting period. For 2015, 2014, and 2013, a dividend yield of 2.27%, 2.29%, and 2.86%, respectively, was used for all vested LTIP options and all TSOP options.
The assumptions for the LTIP and TSOP grants for the last three years are shown in the following table:
2015 | 2014 | 2013 | |||||||||
Expected volatility range | 19% – 27% | 23% – 27% | 24% – 30% | ||||||||
Average expected volatility | 25% | 25% | 26% | ||||||||
Average risk-free interest rate | 1.83% | 2.79% | 1.88% | ||||||||
Average expected option term LTIP | 9.3 years | 8.9 years | 9.0 years | ||||||||
Per-share grant-date fair value LTIP | $ | 30.35 | $ | 29.87 | $ | 20.40 | |||||
Average expected option term TSOP | 9.1 years | 8.8 years | 8.9 years | ||||||||
Per-share grant-date fair value TSOP | $ | 24.71 | $ | 24.38 | $ | 15.84 | |||||
Options granted (LTIP and TSOP) | 825,210 | 696,310 | 1,016,700 | ||||||||
A summary of the status of changes in stock options is presented below:
Stock Options | Weighted Avg. Exercise Price | |||||
Outstanding at December 31, 2014 | 5,831,317 | $ | 61.57 | |||
Granted | 825,210 | 102.38 | ||||
Exercised | (589,081 | ) | 52.99 | |||
Forfeited | (18,710 | ) | 86.70 | |||
Outstanding at December 31, 2015 | 6,048,736 | 67.90 | ||||
The aggregate intrinsic value of options outstanding at December 31, 2015, was $122 million with a weighted average remaining contractual term of 5.4 years. Of these options outstanding, 3,420,586 were exercisable and had an aggregate intrinsic value of $106 million with a weighted average exercise price of $53.69 and a weighted average remaining contractual term of 3.8 years.
The following table provides information related to options exercised for the last three years:
2015 | 2014 | 2013 | |||||||||
($ in millions) | |||||||||||
Options exercised | 589,081 | 2,009,461 | 2,570,088 | ||||||||
Total intrinsic value | $ | 27 | $ | 106 | $ | 106 | |||||
Cash received upon exercise | 29 | 93 | 93 | ||||||||
Related tax benefits realized | 7 | 26 | 31 | ||||||||
At December 31, 2015, total unrecognized compensation related to options granted under LTIP and TSOP was $12 million, and is expected to be recognized over a weighted-average period of approximately 2.4 years.
K 67
Restricted Stock Units
RSU grants and grant-date fair values were 101,470 and $104.23 in 2015; 113,505 and $94.17 in 2014; and 162,000 and $69.83 in 2013. RSUs granted in all three years have a five-year restriction period and will be settled through the issuance of shares of Common Stock. The RSU grants include cash dividend equivalent payments during the restriction period in an amount equal to regular quarterly dividends paid on Common Stock. During 2015, 166,750 of the RSUs granted in 2010 vested, with 99,337 shares of Common Stock issued net of withholding taxes. A summary of the status of and changes in RSUs is presented below:
RSUs | Weighted- Average Grant-Date Fair Value | |||||
Nonvested at December 31, 2014 | 756,505 | $ | 67.94 | |||
Granted | 101,470 | 104.23 | ||||
Vested | (166,750 | ) | 47.76 | |||
Forfeited | (2,500 | ) | 78.07 | |||
Nonvested at December 31, 2015 | 688,725 | 78.14 | ||||
At December 31, 2015, total unrecognized compensation related to RSUs granted under LTIP was $8 million, and is expected to be recognized over a weighted-average period of approximately 3.1 years. The total related tax benefits realized in 2015, 2014, and 2013 were $4 million, $6 million, and $2 million, respectively.
Performance Share Units
PSUs provide for awards based on achievement of certain predetermined corporate performance goals at the end of a three-year cycle and are settled through the issuance of shares of Common Stock. PSU grants were 413,770 in 2015 and grant-date fair values relating to performance and market conditions were $97.24 and $46.08, respectively, with the market condition fair value measured on the date of grant using a Monte Carlo simulation model. PSU grants were 399,530 and 550,800 in 2014 and 2013, respectively; grant-date fair values relating to performance and market conditions were $94.17 and $50.31, respectively, in 2014, and grant-date fair values relating to performance and market conditions were $69.83 and $36.01, respectively, in 2013. During 2015, 236,601 of the PSUs granted in 2012 were earned, with 141,386 shares of Common Stock issued net of withholding taxes. A summary of the status of and changes in PSUs is presented below:
PSUs | Weighted- Average Grant-Date Fair Value | |||||
Balance at December 31, 2014 | 1,414,780 | $ | 72.26 | |||
Granted | 413,770 | 71.66 | ||||
Earned | (236,601 | ) | 75.14 | |||
Unearned | (229,149 | ) | 75.14 | |||
Forfeited | (1,750 | ) | 70.98 | |||
Balance at December 31, 2015 | 1,361,050 | 71.09 | ||||
K 68
At December 31, 2015, total unrecognized compensation related to PSUs granted under LTIP was $5 million, and is expected to be recognized over a weighted-average period of approximately 1.6 years. The total related tax benefits realized were $3 million in 2015, and $5 million in both 2014 and 2013.
Shares Available and Issued
Shares of Common Stock available for future grants and issued in connection with all features of LTIP and TSOP at December 31, were as follows:
2015 | 2014 | 2013 | ||||||
Available for future grants: | ||||||||
LTIP | 11,769,796 | 4,899,428 | 5,945,033 | |||||
TSOP | 832,676 | 998,896 | 1,172,256 | |||||
Issued: | ||||||||
LTIP | 708,059 | 2,168,641 | 2,765,986 | |||||
TSOP | 121,745 | 252,042 | 331,282 | |||||
K 69
13. Stockholders’ Equity
Common Stock
Common Stock is reported net of shares held by our consolidated subsidiaries (Treasury Shares). Treasury Shares at December 31, 2015 and 2014 amounted to 20,320,777, with a cost of $19 million at both dates.
Accumulated Other Comprehensive Loss
The components of "Other comprehensive income (loss)" reported in the Consolidated Statements of Comprehensive Income and changes in the cumulative balances of “Accumulated other comprehensive loss” reported in the Consolidated Balance Sheets consisted of the following:
Balance at Beginning of Year | Net Loss | Reclassification Adjustments | Balance at End of Year | ||||||||||||
($ in millions) | |||||||||||||||
Year ended December 31, 2015 | |||||||||||||||
Pensions and other postretirement | |||||||||||||||
liabilities | $ | (320 | ) | $ | (72 | ) | $ | 25 | (1) | $ | (367 | ) | |||
Other comprehensive loss | |||||||||||||||
of equity investees | (78 | ) | — | — | (78 | ) | |||||||||
Accumulated other comprehensive loss | $ | (398 | ) | $ | (72 | ) | $ | 25 | $ | (445 | ) | ||||
Year ended December 31, 2014 | |||||||||||||||
Pensions and other postretirement | |||||||||||||||
liabilities | $ | (310 | ) | $ | (31 | ) | $ | 21 | (1) | $ | (320 | ) | |||
Other comprehensive loss | |||||||||||||||
of equity investees | (71 | ) | (7 | ) | — | (78 | ) | ||||||||
Accumulated other comprehensive loss | $ | (381 | ) | $ | (38 | ) | $ | 21 | $ | (398 | ) | ||||
(1) | These items are included in the computation of net periodic pension and postretirement benefit costs. See Note 11, “Pensions and Other Postretirement Benefits,” for additional information. |
K 70
Other Comprehensive Income (Loss)
“Other comprehensive income (loss)” reported in the Consolidated Statements of Comprehensive Income consisted of the following:
Pretax Amount | Tax (Expense) Benefit | Net-of-Tax Amount | |||||||||
($ in millions) | |||||||||||
Year ended December 31, 2015 | |||||||||||
Net gain (loss) arising during the year: | |||||||||||
Pensions and other postretirement benefits | $ | (117 | ) | $ | 45 | $ | (72 | ) | |||
Reclassification adjustments for costs | |||||||||||
included in net income | 41 | (16 | ) | 25 | |||||||
Other comprehensive loss | $ | (76 | ) | $ | 29 | $ | (47 | ) | |||
Year ended December 31, 2014 | |||||||||||
Net gain (loss) arising during the year: | |||||||||||
Pensions and other postretirement benefits | $ | (50 | ) | $ | 19 | $ | (31 | ) | |||
Reclassification adjustments for costs | |||||||||||
included in net income | 35 | (14 | ) | 21 | |||||||
Subtotal | (15 | ) | 5 | (10 | ) | ||||||
Other comprehensive loss of equity investees | (8 | ) | 1 | (7 | ) | ||||||
Other comprehensive loss | $ | (23 | ) | $ | 6 | $ | (17 | ) | |||
Year ended December 31, 2013 | |||||||||||
Net gain (loss) arising during the year: | |||||||||||
Pensions and other postretirement benefits | $ | 975 | $ | (375 | ) | $ | 600 | ||||
Reclassification adjustments for costs | |||||||||||
included in net income | 147 | (58 | ) | 89 | |||||||
Subtotal | 1,122 | (433 | ) | 689 | |||||||
Other comprehensive income of equity investees | 42 | (3 | ) | 39 | |||||||
Other comprehensive income | $ | 1,164 | $ | (436 | ) | $ | 728 | ||||
K 71
14. Stock Repurchase Program
We repurchased and retired 11.3 million, 3.1 million, and 8.3 million shares of Common Stock under our stock repurchase program in 2015, 2014, and 2013, respectively, at a cost of $1.1 billion, $318 million, and $627 million. On August 1, 2012, our Board of Directors authorized the repurchase of up to an additional 50 million shares of Common Stock through December 31, 2017. The timing and volume of purchases is guided by our assessment of market conditions and other pertinent factors. Any near-term share repurchases are expected to be made with internally generated cash, cash on hand, or proceeds from borrowings. Since the beginning of 2006, we have repurchased and retired 151.1 million shares at a total cost of $9.5 billion.
15. Earnings Per Share
The following table sets forth the calculation of basic and diluted earnings per share:
Basic | Diluted | ||||||||||||||||||||||
2015 | 2014 | 2013 | 2015 | 2014 | 2013 | ||||||||||||||||||
($ in millions except per share amounts, shares in millions) | |||||||||||||||||||||||
Net income | $ | 1,556 | $ | 2,000 | $ | 1,910 | $ | 1,556 | $ | 2,000 | $ | 1,910 | |||||||||||
Dividend equivalent payments | (6 | ) | (6 | ) | (7 | ) | (5 | ) | (4 | ) | (4 | ) | |||||||||||
Income available to common stockholders | $ | 1,550 | $ | 1,994 | $ | 1,903 | $ | 1,551 | $ | 1,996 | $ | 1,906 | |||||||||||
Weighted-average shares outstanding | 301.9 | 309.4 | 311.9 | 301.9 | 309.4 | 311.9 | |||||||||||||||||
Dilutive effect of outstanding options | |||||||||||||||||||||||
and share-settled awards | 2.5 | 3.1 | 3.6 | ||||||||||||||||||||
Adjusted weighted-average shares outstanding | 304.4 | 312.5 | 315.5 | ||||||||||||||||||||
Earnings per share | $ | 5.13 | $ | 6.44 | $ | 6.10 | $ | 5.10 | $ | 6.39 | $ | 6.04 | |||||||||||
In each year, dividend equivalent payments were made to holders of stock options and RSUs. For purposes of computing basic earnings per share, dividend equivalent payments made to holders of stock options and RSUs were deducted from net income to determine income available to common stockholders. For purposes of computing diluted earnings per share, we evaluate on a grant-by-grant basis those stock options and RSUs receiving dividend equivalent payments under the two-class and treasury stock methods to determine which method is the more dilutive for each grant. For those grants for which the two-class method was more dilutive, net income was reduced by dividend equivalent payments to determine income available to common stockholders. The dilution calculations exclude options having exercise prices exceeding the average market price of Common Stock as follows:
Period | 2015 | 2014 | 2013 | |||||||
(in millions) | ||||||||||
1st Quarter | — | 0.7 | 0.8 | |||||||
2nd Quarter | 0.7 | — | — | |||||||
3rd Quarter | 1.5 | — | 0.8 | |||||||
4th Quarter | 1.5 | — | — | |||||||
K 72
16. Commitments and Contingencies
Lawsuits
We and/or certain subsidiaries are defendants in numerous lawsuits and other claims relating principally to railroad operations. When we conclude that it is probable that a liability has been incurred and the amount of the liability can be reasonably estimated, it is accrued through a charge to earnings. While the ultimate amount of liability incurred in any of these lawsuits and claims is dependent on future developments, in our opinion, the recorded liability is adequate to cover the future payment of such liability and claims. However, the final outcome of any of these lawsuits and claims cannot be predicted with certainty, and unfavorable or unexpected outcomes could result in additional accruals that could be significant to results of operations in a particular year or quarter. Any adjustments to the recorded liability will be reflected in earnings in the periods in which such adjustments become known.
Two of our customers, DuPont and Sunbelt Chlor Alkali Partnership (Sunbelt), filed rate reasonableness complaints before the Surface Transportation Board (STB) alleging that our tariff rates for transportation of regulated movements are unreasonable. Since June 1, 2009, in the case of DuPont, and April 1, 2011, in the case of Sunbelt, we have been billing and collecting amounts based on the challenged tariff rates. In 2014, the STB resolved both rate reasonableness complaints in our favor. The STB’s findings in the Sunbelt case remain subject to technical corrections and requests for reconsideration. Both cases remain open to possible appeal. We believe the estimate of any reasonably possible loss will not have a material effect on our financial position, results of operations, or liquidity. With regard to rate cases, we record adjustments to revenues in the periods if and when such adjustments are probable and estimable.
On November 6, 2007, various antitrust class actions filed against us and other Class I railroads in various Federal district courts regarding fuel surcharges were consolidated in the District of Columbia by the Judicial Panel on Multidistrict Litigation. On June 21, 2012, the court certified the case as a class action. The defendant railroads appealed this certification, and the Court of Appeals for the District of Columbia vacated the District Court’s decision and remanded the case for further consideration. We believe the allegations in the complaints are without merit and intend to vigorously defend the cases. We do not believe the outcome of these proceedings will have a material effect on our financial position, results of operations, or liquidity. A lawsuit containing similar allegations against us and four other major railroads that was filed on March 25, 2008, in the U.S. District Court for the District of Minnesota, was voluntarily dismissed by the plaintiff subject to a tolling agreement entered into in August 2008, and most recently extended in August 2013.
Casualty Claims
Casualty claims include employee personal injury and occupational claims as well as third-party claims, all exclusive of legal costs. To aid in valuing our personal injury liability and determining the amount to accrue with respect to such claims during the year, we utilize studies prepared by an independent consulting actuarial firm. Job-related accidental injury and occupational claims are subject to the Federal Employers’ Liability Act (FELA), which is applicable only to railroads. FELA’s fault-based system produces results that are unpredictable and inconsistent as compared with a no-fault workers’ compensation system. The variability inherent in this system could result in actual costs being different from the liability recorded. While the ultimate amount of claims incurred is dependent on future developments, in our opinion, the recorded liability is adequate to cover the future payments of claims and is supported by the most recent actuarial study. In all cases, we record a liability when the expected loss for the claim is both probable and estimable.
Employee personal injury claims – The largest component of casualties and other claims expense is employee personal injury costs. The independent actuarial firm engaged by us provides quarterly studies to aid in valuing our employee personal injury liability and estimating personal injury expense. The actuarial firm studies our historical patterns of reserving for claims and subsequent settlements, taking into account relevant outside influences. The actuarial firm uses the results of these analyses to estimate the ultimate amount of liability, which includes amounts for incurred but unasserted claims. We adjust the liability quarterly based upon our assessment and the results of the
K 73
study. Our estimate of loss liabilities is subject to inherent limitation given the difficulty of predicting future events such as jury decisions, court interpretations, or legislative changes and as such the actual loss may vary from the estimated liability recorded.
Occupational claims – Occupational claims (including asbestosis and other respiratory diseases, as well as conditions allegedly related to repetitive motion) are often not caused by a specific accident or event but rather allegedly result from a claimed exposure over time. Many such claims are being asserted by former or retired employees, some of whom have not been employed in the rail industry for decades. The independent actuarial firm provides an estimate of the occupational claims liability based upon our history of claim filings, severity, payments, and other pertinent facts. The liability is dependent upon judgments we make as to the specific case reserves as well as judgments of the actuarial firm in the quarterly studies. The actuarial firm’s estimate of ultimate loss includes a provision for those claims that have been incurred but not reported. This provision is derived by analyzing industry data and projecting our experience into the future as far as can be reasonably determined. We adjust the liability quarterly based upon our assessment and the results of the study. However, it is possible that the recorded liability may not be adequate to cover the future payment of claims. Adjustments to the recorded liability are reflected in operating expenses in the periods in which such adjustments become known.
Third-party claims – We record a liability for third-party claims including those for highway crossing accidents, trespasser and other injuries, automobile liability, property damage, and lading damage. The actuarial firm assists us with the calculation of potential liability for third-party claims, except lading damage, based upon our experience including the number and timing of incidents, amount of payments, settlement rates, number of open claims, and legal defenses. The actuarial estimate includes a provision for claims that have been incurred but not reported. We adjust the liability quarterly based upon our assessment and the results of the study. Given the inherent uncertainty in regard to the ultimate outcome of third-party claims, it is possible that the actual loss may differ from the estimated liability recorded.
Environmental Matters
We are subject to various jurisdictions’ environmental laws and regulations. We record a liability where such liability or loss is probable and its amount can be estimated reasonably. Claims, if any, against third parties, for recovery of cleanup costs we have incurred are reflected as receivables (when collection is probable) in the Consolidated Balance Sheets and are not netted against the associated liability. Environmental engineers regularly participate in ongoing evaluations of all known sites and in determining any necessary adjustments to liability estimates. We have an Environmental Policy Council, composed of senior managers, to oversee and interpret our environmental policy.
Our Consolidated Balance Sheets include liabilities for environmental exposures of $69 million at December 31, 2015, and $66 million at December 31, 2014 (of which $15 million is classified as a current liability at the end of both 2015 and 2014, respectively). At December 31, 2015, the liability represents our estimates of the probable cleanup, investigation, and remediation costs based on available information at 145 known locations and projects compared with 146 locations and projects at December 31, 2014. At December 31, 2015, 14 sites accounted for $42 million of the liability, and no individual site was considered to be material. We anticipate that much of this liability will be paid out over five years; however, some costs will be paid out over a longer period.
At 12 locations, one or more of our subsidiaries in conjunction with a number of other parties have been identified as potentially responsible parties under the Comprehensive Environmental Response, Compensation and Liability Act of 1980 or comparable state statutes that impose joint and several liability for cleanup costs. We calculate our estimated liability for these sites based on facts and legal defenses applicable to each site and not solely on the basis of the potential for joint liability.
With respect to known environmental sites (whether identified by us or by the Environmental Protection Agency or comparable state authorities), estimates of our ultimate potential financial exposure for a given site or in the aggregate for all such sites can change over time because of the widely varying costs of currently available cleanup
K 74
techniques, unpredictable contaminant recovery and reduction rates associated with available cleanup technologies, the likely development of new cleanup technologies, the difficulty of determining in advance the nature and full extent of contamination and each potential participant’s share of any estimated loss (and that participant’s ability to bear it), and evolving statutory and regulatory standards governing liability.
The risk of incurring environmental liability – for acts and omissions, past, present, and future – is inherent in the railroad business. Some of the commodities we transport, particularly those classified as hazardous materials, pose special risks that we work diligently to reduce. In addition, several of our subsidiaries own, or have owned, land used as operating property, or which is leased and operated by others, or held for sale. Because environmental problems that are latent or undisclosed may exist on these properties, there can be no assurance that we will not incur environmental liabilities or costs with respect to one or more of them, the amount and materiality of which cannot be estimated reliably at this time. Moreover, lawsuits and claims involving these and potentially other unidentified environmental sites and matters are likely to arise from time to time. The resulting liabilities could have a significant effect on financial position, results of operations, or liquidity in a particular year or quarter.
Based on our assessment of the facts and circumstances now known, we believe we have recorded the probable and reasonably estimable costs for dealing with those environmental matters of which we are aware. Further, we believe that it is unlikely that any known matters, either individually or in the aggregate, will have a material adverse effect on our financial position, results of operations, or liquidity.
Insurance
We obtain on behalf of ourself and our subsidiaries insurance for potential losses for third-party liability and first-party property damages. We are currently self-insured up to $50 million and above $1.1 billion per occurrence and/or policy year for bodily injury and property damage to third parties and up to $25 million and above $200 million per occurrence and/or policy year for property owned by us or in our care, custody, or control.
Purchase Commitments
At December 31, 2015, we had outstanding purchase commitments totaling approximately $909 million for locomotives, freight cars and containers, track material, and track and yard expansion projects in connection with our capital programs as well as long-term service contracts through 2020.
Change-In-Control Arrangements
We have compensation agreements with certain officers and key employees that become operative only upon a change in control of Norfolk Southern, as defined in those agreements. The agreements provide generally for payments based on compensation at the time of a covered individual’s involuntary or other specified termination and for certain other benefits.
Guarantees
In a number of instances, we have agreed to indemnify lenders for additional costs they may bear as a result of certain changes in laws or regulations applicable to their loans. Such changes may include impositions or modifications with respect to taxes, duties, reserves, liquidity, capital adequacy, special deposits, and similar requirements relating to extensions of credit by, deposits with, or the assets or liabilities of such lenders. The nature and timing of changes in laws or regulations applicable to our financings are inherently unpredictable, and therefore our exposure in connection with the foregoing indemnifications cannot be quantified. No liability has been recorded related to these indemnifications.
We have agreed to indemnify parties in a number of transactions for U.S. income tax withholding imposed as a result of changes in U.S. tax law. In all cases, we have the right to unwind the related transaction if the withholding cannot be avoided in the future. Because these indemnities would be triggered and are dependent upon a change in
K 75
the tax law, the maximum exposure is not quantifiable. We do not believe it is likely that we will be required to make any payments under these indemnities.
At December 31, 2015 certain Norfolk Southern subsidiaries are contingently liable as guarantors with respect to $7 million of indebtedness, due in 2019, of an entity in which they have an ownership interest, the Terminal Railroad Association of St. Louis. Four other railroads are also jointly and severally liable as guarantors for this indebtedness. No liability has been recorded related to this guaranty.
K 76
NORFOLK SOUTHERN CORPORATION AND SUBSIDIARIES
QUARTERLY FINANCIAL DATA
(Unaudited)
Three Months Ended | |||||||||||||||
March 31 | June 30 | September 30 | December 31 | ||||||||||||
($ in millions, except per share amounts) | |||||||||||||||
2015 | |||||||||||||||
Railway operating revenues | $ | 2,567 | $ | 2,713 | $ | 2,713 | $ | 2,518 | |||||||
Income from railway operations | 606 | 814 | 822 | 642 | |||||||||||
Net income | 310 | 433 | 452 | 361 | |||||||||||
Earnings per share: | |||||||||||||||
Basic | 1.01 | 1.43 | 1.50 | 1.21 | |||||||||||
Diluted | 1.00 | 1.41 | 1.49 | 1.20 | |||||||||||
2014 | |||||||||||||||
Railway operating revenues | $ | 2,689 | $ | 3,042 | $ | 3,023 | $ | 2,870 | |||||||
Income from railway operations | 667 | 1,019 | 998 | 891 | |||||||||||
Net income | 368 | 562 | 559 | 511 | |||||||||||
Earnings per share: | |||||||||||||||
Basic | 1.18 | 1.81 | 1.80 | 1.65 | |||||||||||
Diluted | 1.17 | 1.79 | 1.79 | 1.64 | |||||||||||
K 77
Item 9. Changes in and Disagreements with Accountants on Accounting and Financial Disclosure
None.
Item 9A. Controls and Procedures
Evaluation of Disclosure Controls and Procedures
Our Chief Executive Officer and Chief Financial Officer, with the assistance of management, evaluated the effectiveness of our disclosure controls and procedures (as such term is defined in Rules 13a-15(e) and 15d-15(e) under the Securities Exchange Act of 1934, as amended (Exchange Act)) at December 31, 2015. Based on such evaluation, our officers have concluded that, at December 31, 2015, our disclosure controls and procedures were effective to ensure that information required to be disclosed in our reports under the Exchange Act is recorded, processed, summarized, and reported, within the time period specified in the SEC’s rules and forms, and that such information is accumulated and communicated to management, including the Chief Executive Officer and the Chief Financial Officer, as appropriate, to allow timely decisions regarding required disclosure.
Internal Control Over Financial Reporting
We are responsible for establishing and maintaining adequate internal control over financial reporting. Our internal control over financial reporting includes those policies and procedures that pertain to our ability to record, process, summarize, and report reliable financial data. We recognize that there are inherent limitations in the effectiveness of any internal control over financial reporting, including the possibility of human error and the circumvention or overriding of internal control. Accordingly, even effective internal control over financial reporting can provide only reasonable assurance with respect to financial statement preparation. Further, because of changes in conditions, the effectiveness of internal control over financial reporting may vary over time.
In order to ensure that our internal control over financial reporting is effective, we regularly assess such controls and did so most recently for our financial reporting at December 31, 2015. This assessment was based on criteria for effective internal control over financial reporting set forth by the Committee of Sponsoring Organizations of the Treadway Commission (COSO) in Internal Control-Integrated Framework (2013). Based on our assessment, we have concluded that we maintained effective internal control over financial reporting at December 31, 2015.
Our Board of Directors, acting through its Audit Committee, is responsible for the oversight of our accounting policies, financial reporting, and internal control. The Audit Committee of our Board of Directors is comprised entirely of outside directors who are independent of management. The independent registered public accounting firm and our internal auditors have full and unlimited access to the Audit Committee, with or without management, to discuss the adequacy of internal control over financial reporting, and any other matters which they believe should be brought to the attention of the Audit Committee.
We have issued a report of our assessment of internal control over financial reporting, and our independent registered public accounting firm has issued an attestation report on our internal control over financial reporting at December 31, 2015. These reports appear in Part II, Item 8 of this report on Form 10-K.
During the fourth quarter of 2015, we have not identified any changes in internal control over financial reporting that have materially affected, or are reasonably likely to materially effect, our internal control over financial reporting.
Item 9B. Other Information
None.
K 78
PART III
NORFOLK SOUTHERN CORPORATION AND SUBSIDIARIES
Item 10. Directors, Executive Officers, and Corporate Governance
In accordance with General Instruction G(3), information called for by Part III, Item 10, is incorporated herein by reference from the information appearing under the caption “Election of Directors,” under the caption “Section 16(a) Beneficial Ownership Reporting Compliance,” under the caption “Corporate Governance and the Board,” under the caption “Committees of the Board,” under the caption “Shareholder Recommendations and Nominations,” and under the caption “The Thoroughbred Code of Ethics” in our definitive Proxy Statement for our 2016 Annual Meeting of Stockholders, which definitive Proxy Statement will be filed electronically with the SEC pursuant to Regulation 14A. The information regarding executive officers called for by Item 401 of Regulation S-K is included in Part I hereof beginning under “Executive Officers of the Registrant.”
Item 11. Executive Compensation
In accordance with General Instruction G(3), information called for by Part III, Item 11, is incorporated herein by reference from the information:
• | under the caption “Corporate Governance and the Board”, including “Compensation of Directors” and “Non-Employee Director Compensation;” |
• | appearing under the caption “Executive Compensation” for executives, including the “Compensation Discussion and Analysis,” the information appearing in the “Summary Compensation Table” and the “2015 Grants of Plan-Based Awards” table, including the narrative to such tables, the “Outstanding Equity Awards at Fiscal Year-End 2015” and “Option Exercises and Stock Vested in 2015” tables, and the tabular and narrative information appearing under the subcaptions “Retirement Benefits,” “Deferred Compensation,” and “Potential Payments Upon a Change in Control or Other Termination of Employment;” and |
• | appearing under the captions “Compensation Committee Interlocks and Insider Participation,” “Compensation Policy Risk Assessment,” and “Compensation Committee Report,” |
in each case included in our definitive Proxy Statement for our 2016 Annual Meeting of Stockholders, which definitive Proxy Statement will be filed electronically with the SEC pursuant to Regulation 14A.
K 79
Item 12. Security Ownership of Certain Beneficial Owners and Management and Related Stockholder Matters
In accordance with General Instruction G(3), information on security ownership of certain beneficial owners and management called for by Item 403 of Regulation S-K, Part III, Item 12, is incorporated herein by reference from the information appearing under the caption “Beneficial Ownership of Stock” in our definitive Proxy Statement for our 2016 Annual Meeting of Stockholders, which definitive Proxy Statement will be filed electronically with the SEC pursuant to Regulation 14A.
Equity Compensation Plan Information (at December 31, 2015)
Plan Category | Number of securities to be issued upon exercise of outstanding options, warrants and rights | Weighted- average exercise price of outstanding options, warrants and rights | Number of securities remaining available for future issuance under equity compensation plans (1) | ||||||||
(a) | (b) | (c) | |||||||||
Equity compensation plans | |||||||||||
approved by securities holders(2) | 7,291,016 | (4) | $ | 66.63 | (5) | 11,769,796 | |||||
Equity compensation plans | |||||||||||
not approved by securities holders(3) | 1,129,379 | 73.46 | 841,676 | (6) | |||||||
Total | 8,420,395 | 12,611,472 | |||||||||
(1) | Excludes securities reflected in column (a). |
(2) | LTIP. |
(3) | TSOP and the Director's Restricted Stock Plan. |
(4) | Includes options, RSUs and PSUs granted under LTIP that will be settled in shares of stock. |
(5) | Calculated without regard to 2,372,159 outstanding RSUs and PSUs at December 31, 2015. |
(6) | Of the shares remaining available for grant under plans not approved by stockholders, 9,000 are available for grant as restricted stock under the Directors’ Restricted Stock Plan. |
K 80
Norfolk Southern Corporation Long-Term Incentive Plan (LTIP)
Established on June 28, 1983, and approved by our stockholders at their Annual Meeting held on May 10, 1984, LTIP was adopted to promote the success of our company by providing an opportunity for non-employee Directors, officers, and other key employees to acquire a proprietary interest in the Corporation. The Board of Directors amended LTIP on January 23, 2015, which amendment was approved by shareholders on May 14, 2015, to include the reservation for issuance of an additional 8,000,000 shares of authorized but unissued Common Stock.
The amended LTIP adopted a fungible share reserve ratio so that, for awards granted after May 13, 2010, the number of shares remaining for issuance under the amended LTIP will be reduced (i) by 1 for each award granted as an option or stock-settled stock appreciation right, or (ii) by 1.61 for an award made in the form other than an option or stock-settled stock appreciation right. Any shares of Common Stock subject to options, PSUs, restricted shares, or RSUs which are not issued as Common Stock will again be available for award under LTIP after the expiration or forfeiture of an award.
Non-employee Directors, officers, and other key employees residing in the United States or Canada are eligible for selection to receive LTIP awards. Under LTIP, the Compensation Committee (Committee), or the Corporation’s chief executive officer to the extent the Committee delegates award-making authority pursuant to LTIP, may grant incentive stock options, nonqualified stock options, stock appreciation rights, RSUs, restricted shares, PSUs, and performance shares. In addition, dividend equivalent payments may be awarded for options, RSUs, and PSUs. Awards under LTIP may be made subject to forfeiture under certain circumstances and may establish such other terms and conditions for the awards as provided in LTIP.
For options granted after May 13, 2010, the option price will be at least the higher of (i) the average of the high and low prices at which Common Stock is traded on the date of grant, or (ii) the closing price of Common Stock on the date of the grant. All options are subject to a vesting period of at least one year, and the term of the option will not exceed ten years. LTIP specifically prohibits option repricing without stockholder approval, except that adjustments may be made in the event of changes in our capital structure or Common Stock.
PSUs entitle a recipient to receive performance-based compensation at the end of a three-year cycle based on our performance during that period. For the 2015 PSU awards, corporate performance will be measured using two equally weighted standards established by the Committee: (1) three-year average return on average capital invested and (2) total return to stockholders measured at the end of the three-year period. For the 2015 PSU awards, PSUs will be settled in shares of Common Stock.
RSUs are payable in cash or in shares of Common Stock at the end of a restriction period of not less than 36 months and not more than 60 months. During the restriction period, the holder of the RSUs has no beneficial ownership interest in the Common Stock represented by the RSUs and has no right to vote the shares represented by the units or to receive dividends (except for dividend equivalent payment rights that may be awarded with respect to the RSUs). The Committee at its discretion may waive the restriction period, but settlement of any RSUs will occur on the same settlement date as would have applied absent a waiver of restrictions, if no performance goals were imposed.
K 81
Norfolk Southern Corporation Thoroughbred Stock Option Plan (TSOP)
Our Board of Directors adopted TSOP on January 26, 1999, to promote the success of our company by providing an opportunity for nonagreement employees to acquire a proprietary interest in our company and thereby to provide an additional incentive to nonagreement employees to devote their maximum efforts and skills to the advancement, betterment, and prosperity of our company and our stockholders. Under TSOP there were 6,000,000 shares of authorized but unissued Common Stock reserved for issuance. TSOP has not been and is not required to have been approved by our stockholders.
Active full-time nonagreement employees residing in the United States or Canada are eligible for selection to receive TSOP awards. Under TSOP, the Committee, or the Corporation’s chief executive officer to the extent the Committee delegates award-making authority pursuant to TSOP, may grant nonqualified stock options subject to such terms and conditions as provided in TSOP.
The option price may not be less than the average of the high and low prices at which Common Stock is traded on the date of the grant. All options are subject to a vesting period of at least one year, and the term of the option will not exceed ten years. TSOP specifically prohibits repricing without stockholder approval, except for capital adjustments.
Norfolk Southern Corporation Directors’ Restricted Stock Plan (Plan)
The Plan was adopted on January 1, 1994, and is designed to increase ownership of Common Stock by our non-employee Directors so as to further align their ownership interest in our company with that of our stockholders. The Plan has not been and is not required to have been approved by our stockholders. A maximum of 66,000 shares of Common Stock may be granted under the Plan. To make grants eligible to Directors, we purchase, through one or more subsidiary companies, the number of shares required in open-market transactions at prevailing market prices, or make such grants from Common Stock already owned by one or more of our subsidiary companies.
Effective January 23, 2015, the Board amended the Plan to provide that no additional awards will be made under the Plan after the effective date. Prior to that amendment, only non-employee Directors who are not and never have been employees of our company were eligible to participate in the Plan. Upon becoming a Director, each eligible Director received a one-time grant of 3,000 restricted shares of Common Stock. No individual member of the Board exercised discretion concerning the eligibility of any Director or the number of shares granted.
The restriction period applicable to restricted shares granted under the Plan begins on the date of the grant and ends on the earlier of the recipient’s death or the day after the recipient ceases to be a Director by reason of disability or retirement. During the restriction period, shares may not be sold, pledged, or otherwise encumbered. Directors forfeit the restricted shares if they cease to serve as a Director of our company for reasons other than their disability, retirement, or death.
K 82
Item 13. Certain Relationships and Related Transactions, and Director Independence
In accordance with General Instruction G(3), information called for by Part III, Item 13, is incorporated herein by reference from the information appearing under the caption “Related Persons Transactions” and under the caption “Director Independence” in our definitive Proxy Statement for our 2016 Annual Meeting of Stockholders, which definitive Proxy Statement will be filed electronically with the SEC pursuant to Regulation 14A.
Item 14. Principal Accountant Fees and Services
In accordance with General Instruction G(3), information called for by Part III, Item 14, is incorporated herein by reference from the information appearing under the caption “Ratification of Appointment of Independent Registered Public Accounting Firm” in our definitive Proxy Statement for our 2016 Annual Meeting of Stockholders, which definitive Proxy Statement will be filed electronically with the SEC pursuant to Regulation 14A.
K 83
PART IV
NORFOLK SOUTHERN CORPORATION AND SUBSIDIARIES
Item 15. Exhibits and Financial Statement Schedules
Page | |||
(A) | The following documents are filed as part of this report: | ||
1. | |||
2. | Financial Statement Schedule: | ||
The following consolidated financial statement schedule should be read in connection with the consolidated financial statements: | |||
Index to Consolidated Financial Statement Schedule | |||
Schedules other than the one listed above are omitted either because they are not required or are inapplicable, or because the information is included in the consolidated financial statements or related notes. | |||
3. | Exhibits | ||
Exhibit Number | Description | ||
3 | Articles of Incorporation and Bylaws – | ||
3(i) | The Restated Articles of Incorporation of Norfolk Southern Corporation are incorporated by reference to Exhibit 3(i) to Norfolk Southern Corporation’s 10-K filed on March 5, 2001. | ||
3(ii) | An amendment to the Articles of Incorporation of Norfolk Southern Corporation is incorporated by reference to Exhibit 3(i) to Norfolk Southern Corporation’s Form 8-K filed on May 18, 2010. | ||
3(iii) | The Bylaws of Norfolk Southern Corporation, as amended January 21, 2014, are incorporated by reference to Exhibit 3(ii) to Norfolk Southern Corporation’s Form 8-K filed on January 21, 2014. | ||
3(iv) | The Bylaws of Norfolk Southern Corporation, as amended September 22, 2015, are incorporated by reference to Exhibit 3(iii) to Norfolk Southern Corporation’s Form 8-K filed on September 22, 2015. | ||
K 84
4 | Instruments Defining the Rights of Security Holders, Including Indentures: |
(a) | Indenture, dated as of January 15, 1991, from Norfolk Southern Corporation to First Trust of New York, National Association, as Trustee, is incorporated by reference to Exhibit 4.1 to Norfolk Southern Corporation’s Registration Statement on Form S-3 (No. 33-38595). | |
(b) | First Supplemental Indenture, dated May 19, 1997, between Norfolk Southern Corporation and First Trust of New York, National Association, as Trustee, related to the issuance of notes in the principal amount of $4.3 billion, is incorporated by reference to Exhibit 1.1(d) to Norfolk Southern Corporation’s Form 8-K filed on May 21, 1997. | |
(c) | Second Supplemental Indenture, dated April 26, 1999, between Norfolk Southern Corporation and U.S. Bank Trust National Association, as Trustee, is incorporated by reference to Exhibit 1.1(c) to Norfolk Southern Corporation’s Form 8-K filed on April 30, 1999. | |
(d) | Fourth Supplemental Indenture, dated as of February 6, 2001, between Norfolk Southern Corporation and U.S. Bank Trust National Association, as Trustee, related to the issuance of notes in the principal amount of $1 billion, is incorporated by reference to Exhibit 4.1 to Norfolk Southern Corporation’s Form 8-K filed on February 7, 2001. | |
(e) | Indenture, dated August 27, 2004, among PRR Newco, Inc., as Issuer, and Norfolk Southern Railway Company, as Guarantor, and The Bank of New York, as Trustee, is incorporated by reference to Exhibit 4(1) to Norfolk Southern Corporation’s Form 10-Q filed on October 28, 2004. | |
(f) | First Supplemental Indenture, dated August 27, 2004, among PRR Newco, Inc., as Issuer, and Norfolk Southern Railway Company, as Guarantor, and The Bank of New York, as Trustee, related to the issuance of notes in the principal amount of approximately $451.8 million, is incorporated by reference to Exhibit 4(m) to Norfolk Southern Corporation’s Form 10-Q filed on October 28, 2004. | |
(g) | Ninth Supplemental Indenture, dated as of March 11, 2005, between Norfolk Southern Corporation and U.S. Bank Trust National Association, as Trustee, related to the issuance of notes in the principal amount of $300 million, is incorporated by reference to Exhibit 4.1 to Norfolk Southern Corporation’s Form 8-K filed on March 15, 2005. | |
(h) | Tenth Supplemental Indenture, dated as of May 17, 2005, between Norfolk Southern Corporation and U.S. Bank Trust National Association, as Trustee, related to the issuance of notes in the principal amount of $366.6 million, is incorporated by reference to Exhibit 99.1 to Norfolk Southern Corporation's Form 8-K filed on May 18, 2005. | |
(i) | Eleventh Supplemental Indenture, dated as of May 17, 2005, between Norfolk Southern Corporation and U.S. Bank Trust National Association, as Trustee, related to the issuance of notes in the principal amount of $350 million, is incorporated by reference to Exhibit 99.2 to Norfolk Southern Corporation’s Form 8-K filed on May 18, 2005. | |
(j) | Twelfth Supplemental Indenture, dated as of August 26, 2010, between Norfolk Southern Corporation and U.S. Bank Trust National Association, as Trustee, related to the issuance of notes in the principal amount of $250 million, is incorporated by reference to Exhibit 4.2 to Norfolk Southern Corporation’s Form 8-K filed on August 26, 2010. | |
K 85
(k) | Indenture, dated as of April 4, 2008, between Norfolk Southern Corporation and U.S. Bank Trust National Association, as Trustee, related to the issuance of notes in the principal amount of $600 million, is incorporated by reference to Exhibit 4.1 to Norfolk Southern Corporation’sForm 8-K filed on April 9, 2008. | |
(l) | Indenture, dated as of January 15, 2009, between Norfolk Southern Corporation and U.S. Bank Trust National Association, as Trustee, related to the issuance of notes in the principal amount of$500 million, is incorporated by reference to Exhibit 4.1 to Norfolk Southern Corporation’sForm 8-K filed on January 20, 2009. | |
(m) | Indenture, dated as of June 1, 2009, between Norfolk Southern Corporation and U.S. Bank Trust National Association, as Trustee, is incorporated by reference to Exhibit 4.1 to Norfolk Southern Corporation’s Form 8-K filed on June 1, 2009. | |
(n) | First Supplemental Indenture, dated as of June 1, 2009, between Norfolk Southern Corporation and U.S. Bank Trust National Association, as Trustee, related to the issuance of notes in the principal amount of $500 million, is incorporated by reference to Exhibit 4.2 to Norfolk Southern Corporation’s Form 8-K filed on June 1, 2009. | |
(o) | Second Supplemental Indenture, dated as of May 23, 2011, between the Registrant and U.S. Bank Trust National Association, as Trustee, related to the issuance of notes in the principal amount of $400 million, is incorporated by reference to Exhibit 4.1 to Norfolk Southern Corporation’s Form 8-K filed on May 23, 2011. | |
(p) | Indenture, dated as of September 14, 2011, between the Registrant and U.S. Bank Trust National Association, as Trustee, related to the issuance of notes in the principal amount of $595,504,000, is incorporated by reference to Exhibit 4.1 to Norfolk Southern Corporation’s Form 8-K filed on September 15, 2011. | |
(q) | Third Supplemental Indenture, dated as of September 14, 2011, between the Registrant and U.S. Bank Trust National Association, as Trustee, related to the issuance of notes in the principal amount of $4,492,000, is incorporated by reference to Exhibit 4.2 to Norfolk Southern Corporation’s Form 8-K filed on September 15, 2011. | |
(r) | Fourth Supplemental Indenture, dated as of November 17, 2011, between the Registrant and U.S. Bank Trust National Association, as Trustee, related to the issuance of two series of notes, one in the principal amount of $500 million and one in the principal amount of $100 million, is incorporated by reference to Exhibit 4.1 to Norfolk Southern Corporation’s Form 8-K filed on November 17, 2011. | |
(s) | Indenture, dated as of March 15, 2012, between the Registrant and U.S. Bank Trust National Association, as Trustee, is incorporated by reference to Exhibit 4.1 to Norfolk Southern Corporation’s Form 8-K filed on March 15, 2012. | |
(t) | First Supplemental Indenture, dated as of March 15, 2012, between the Registrant and U.S. Bank Trust National Association, as Trustee, is incorporated by reference to Exhibit 4.2 to Norfolk Southern Corporation’s Form 8-K filed on March 15, 2012. | |
(u) | Indenture, dated as of August 20, 2012, between the Registrant and U.S. Bank Trust National Association, as Trustee, is incorporated by reference to Exhibit 4.1 to the Registrant’s Form 8-K filed on August 21, 2012. | |
(v) | Second Supplemental Indenture, dated as of September 7, 2012, between the Registrant and U.S. Bank Trust National Association, as Trustee, is incorporated by reference to Exhibit 4.1 to Norfolk Southern Corporation’s Form 8-K filed on September 7, 2012. | |
K 86
(w) | Third Supplemental Indenture, dated as of August 13, 2013, between the Registrant and U.S. Bank Trust National Association, as Trustee, related to the issuance of notes in the principal amount of $500,000,000, is incorporated by reference to Exhibit 4.1 to Norfolk Southern Corporation’s Form 8-K filed on August 13, 2013. | |
(x) | Fourth Supplemental Indenture, dated as of November 21, 2013, between the Registrant and U.S. Bank Trust National Association, as Trustee, related to the issuance of notes in the principal amount of $400,000,000, is incorporated by reference to Exhibit 4.1 to Norfolk Southern Corporation’s Form 8-K filed on November 21, 2013. | |
(y) | Indenture dated as of June 2, 2015, between Registrant and U.S. Bank Trust National Association, as Trustee, is incorporated by reference to Exhibit 4.1 to Norfolk Southern Corporation’s Form 8-K filed on June 2, 2015. | |
(z) | First Supplemental Indenture, dated as of June 2, 2015, between the Registrant and U.S. Bank Trust National Association, as Trustee, is incorporated by reference to Exhibit 4.2 to Norfolk Southern Corporation’s Form 8-K filed on June 2, 2015. | |
(aa) | Second Supplemental Indenture, dated as of November 3, 2015, between the Registrant and U.S. Bank Trust National Association, as Trustee, is incorporated by reference to Exhibit 4.1 to Norfolk Southern Corporation’s Form 8-K filed on November 3, 2015. | |
In accordance with Item 601(b)(4)(iii) of Regulation S-K, copies of other instruments of Norfolk Southern Corporation and its subsidiaries with respect to the rights of holders of long-term debt are not filed herewith, or incorporated by reference, but will be furnished to the Commission upon request. | ||
10 | Material Contracts - | |
(a) | The Transaction Agreement, dated as of June 10, 1997, by and among CSX and CSX Transportation, Inc., Registrant, Norfolk Southern Railway Company, Conrail Inc., Consolidated Rail Corporation, and CRR Holdings LLC, with certain schedules thereto, previously filed, is incorporated by reference to Exhibit 10(a) to Norfolk Southern Corporation’s Form 10-K filed on February 24, 2003. | |
(b) | Amendment No. 1 dated as of August 22, 1998, to the Transaction Agreement, dated as of June 10, 1997, by and among CSX Corporation, CSX Transportation, Inc., Norfolk Southern Corporation, Norfolk Southern Railway Company, Conrail, Inc., Consolidated Rail Corporation, and CRR Holdings LLC, is incorporated by reference from Exhibit 10.1 to Norfolk Southern Corporation’s Form 10-Q filed on August 11, 1999. | |
(c) | Amendment No. 2 dated as of June 1, 1999, to the Transaction Agreement, dated June 10, 1997, by and among CSX Corporation, CSX Transportation, Inc., Norfolk Southern Corporation, Norfolk Southern Railway Company, Conrail, Inc., Consolidated Rail Corporation, and CRR Holdings LLC, is incorporated by reference from Exhibit 10.2 to Norfolk Southern Corporation’s Form 10-Q filed on August 11, 1999. | |
(d) | Amendment No. 3 dated as of June 1, 1999, and executed in April 2004, to the Transaction Agreement, dated June 10, 1997, by and among CSX Corporation, CSX Transportation, Inc., Norfolk Southern Corporation, Norfolk Southern Railway Company, Conrail, Inc., Consolidated Rail Corporation, and CRR Holdings LLC, is incorporated by reference from Exhibit 10(dd) to Norfolk Southern Corporation’s Form 10-Q filed on July 30, 2004. | |
K 87
(e) | Amendment No. 5 to the Transaction Agreement, dated as of August 27, 2004, by and among CSX Corporation, CSX Transportation, Inc., Norfolk Southern Corporation, Norfolk Southern Railway Company, Conrail, Inc., Consolidated Rail Corporation, and CRR Holdings LLC, is incorporated by reference to Exhibit 10.1 to Norfolk Southern Corporation’s Form 8-K filed on September 2, 2004. | |
(f) | Amendment No. 6 dated as of April 1, 2007, to the Transaction Agreement, dated June 10, 1997, by and among CSX Corporation, CSX Transportation, Inc., Norfolk Southern Railway Company, Conrail, Inc., Consolidated Rail Corporation, and CRR Holdings LLC, is incorporated by reference to Exhibit 10.5 to Norfolk Southern Corporation’s Form 10-Q filed on July 27, 2007. | |
(g) | Shared Assets Area Operating Agreement for North Jersey, dated as of June 1, 1999, by and among Consolidated Rail Corporation, CSX Transportation, Inc., and Norfolk Southern Railway Company, with exhibit thereto, is incorporated by reference from Exhibit 10.4 to Norfolk Southern Corporation’s Form 10-Q filed on August 11, 1999. | |
(h) | Shared Assets Area Operating Agreement for Detroit, dated as of June 1, 1999, by and among Consolidated Rail Corporation, CSX Transportation, Inc., and Norfolk Southern Railway Company, with exhibit thereto, is incorporated by reference from Exhibit 10.6 to Norfolk Southern Corporation’s Form 10-Q filed on August 11, 1999. | |
(i) | Shared Assets Area Operating Agreement for South Jersey/Philadelphia, dated as of June 1, 1999, by and among Consolidated Rail Corporation, CSX Transportation, Inc., and Norfolk Southern Railway Company, with exhibit thereto, is incorporated by reference from Exhibit 10.5 to Norfolk Southern Corporation’s Form 10-Q filed on August 11, 1999. | |
(j) | Amendment No. 1, dated as of June 1, 2000, to the Shared Assets Area Operating Agreements for North Jersey, South Jersey/Philadelphia, and Detroit, dated as of June 1, 1999, by and among Consolidated Rail Corporation, CSX Transportation, Inc., and Norfolk Southern Railway Company, with exhibits thereto, is incorporated by reference to Exhibit 10(h) to Norfolk Southern Corporation’s Form 10-K filed on March 5, 2001. | |
(k) | Amendment No. 2, dated as of January 1, 2001, to the Shared Assets Area Operating Agreements for North Jersey, South Jersey/Philadelphia, and Detroit, dated as of June 1, 1999, by and among Consolidated Rail Corporation, CSX Transportation, Inc., and Norfolk Southern Railway Company, with exhibits thereto, is incorporated by reference to Exhibit 10(j) to Norfolk Southern Corporation’s Form 10-K filed on February 21, 2002. | |
(l) | Amendment No. 3, dated as of June 1, 2001, and executed in May of 2002, to the Shared Assets Area Operating Agreements for North Jersey, South Jersey/Philadelphia, and Detroit, dated as of June 1, 1999, by and among Consolidated Rail Corporation, CSX Transportation, Inc., and Norfolk Southern Railway Company, with exhibits thereto, is incorporated by reference to Exhibit 10(k) to Norfolk Southern Corporation’s Form 10-K filed on February 24, 2003. | |
(m) | Amendment No. 4, dated as of June 1, 2005, and executed in late June 2005, to the Shared Assets Area Operating Agreements for North Jersey, South Jersey/Philadelphia, and Detroit, dated as of June 1, 1999, by and among Consolidated Rail Corporation, CSX Transportation, Inc., and Norfolk Southern Railway Company, with exhibits thereto, is incorporated by reference to Exhibit 99 to Norfolk Southern Corporation’s Form 8-K filed on July 1, 2005. | |
(n) | Monongahela Usage Agreement, dated as of June 1, 1999, by and among CSX Transportation, Inc., Norfolk Southern Railway Company, Pennsylvania Lines LLC, and New York Central Lines LLC, with exhibit thereto, is incorporated by reference from -Exhibit 10.7 to Norfolk Southern Corporation’s Form 10-Q filed on August 11, 1999. | |
K 88
(o) | The Agreement, entered into as of July 27, 1999, between North Carolina Railroad Company and Norfolk Southern Railway Company, is incorporated by reference from Exhibit 10(i) to Norfolk Southern Corporation’s Form 10-K filed on March 6, 2000. | |
(p) | First Amendment, dated March 19, 2007, to the Master Agreement dated July 27, 1999, by and between North Carolina Railroad Company and Norfolk Southern Railway Company, is incorporated by reference to Exhibit 10.3 to Norfolk Southern Corporation’s Form 10-Q filed on July 27, 2007. | |
(q) | Second Amendment, dated December 28, 2009, to the Master Agreement dated July 27, 1999, by and between North Carolina Railroad Company and Norfolk Southern Railway Company, is incorporated by reference to Exhibit 10(q) to Norfolk Southern Corporation’s Form 10-K filed on February 17, 2010 (Exhibits, annexes and schedules omitted. The Registrant will furnish supplementary copies of such materials to the SEC upon request). | |
(r) | The Supplementary Agreement, entered into as of January 1, 1987, between the Trustees of the Cincinnati Southern Railway and The Cincinnati, New Orleans and Texas Pacific Railway Company (the latter a wholly owned subsidiary of Norfolk Southern Railway Company) – extending and amending a Lease, dated as of October 11, 1881 – is incorporated by reference to Exhibit 10(k) to Norfolk Southern Corporation’s Form 10-K filed on March 5, 2001. | |
(s)* | Norfolk Southern Corporation Executive Management Incentive Plan, as approved by shareholders May 14, 2015, is incorporated by reference to Exhibit 10-A to Norfolk Southern Corporation’s Form 10-Q filed on July 27, 2015. | |
(t)* | The Norfolk Southern Corporation Officers’ Deferred Compensation Plan, as amended effective September 26, 2000, is incorporated by reference to Exhibit 10(n) to Norfolk Southern Corporation’s Form 10-K filed on March 5, 2001. | |
(u)* | The Norfolk Southern Corporation Directors’ Restricted Stock Plan, adopted January 1, 1994, and amended and restated effective as of January 23, 2014. | |
(v)* | Supplemental Benefit Plan of Norfolk Southern Corporation and Participating Subsidiary Companies, adopted June 1, 1982, and as amended and restated effective as of September 30, 2014. | |
(w)* | The Norfolk Southern Corporation Directors’ Charitable Award Program, as amended effective July 2007, is incorporated by reference to Exhibit 10.6 to Norfolk Southern Corporation’s Form 10-Q filed on July 27, 2007. | |
(x) | The Norfolk Southern Corporation Thoroughbred Stock Option Plan, as amended effective July 22, 2013, is incorporated by reference to Exhibit 10.2 to Norfolk Southern Corporation’s Form 10-Q filed on July 24, 2013. | |
(y)* | The Norfolk Southern Corporation Executive Life Insurance Plan, as amended and restated effective November 1, 2009, is incorporated by reference to Exhibit 10(cc) to Norfolk Southern Corporation’s Form 10-K filed on February 17, 2010. | |
(z) | Distribution Agreement, dated as of July 26, 2004, by and among CSX Corporation, CSX Transportation, Inc., CSX Rail Holding Corporation, CSX Northeast Holdings Corporation, Norfolk Southern Corporation, Norfolk Southern Railway Company, CRR Holdings LLC, Green Acquisition Corp., Conrail Inc., Consolidated Rail Corporation, New York Central Lines LLC, Pennsylvania Lines LLC, NYC Newco, Inc., and PRR Newco, Inc., is incorporated by reference to Exhibit 2.1 to Norfolk Southern Corporation’s Form 8-K filed on September 2, 2004. | |
(aa) | Tax Agreement, dated as of August 27, 2004, by and among Green Acquisition Corp., Conrail Inc., Consolidated Rail Corporation, New York Central Lines LLC, and Pennsylvania Lines LLC, is incorporated by reference to Exhibit 10.2 to Norfolk Southern Corporation’s Form 8-K filed on September 2, 2004. | |
K 89
(bb)* | The description of Norfolk Southern Corporation’s executive physical reimbursement for non-employee directors and certain executives is incorporated by reference to Norfolk Southern Corporation’s Form 8-K filed on July 28, 2005. | |
(cc)* | The Norfolk Southern Corporation Long-Term Incentive Plan, as approved by shareholders effective May 14, 2015, is incorporated by reference to Exhibit 10-B to Norfolk Southern’s Form 10-Q filed on July 27, 2015. | |
(dd) | The Transaction Agreement, dated as of December 1, 2005, by and among Norfolk Southern Corporation, The Alabama Great Southern Railroad Company, Kansas City Southern, and The Kansas City Southern Railway Company, is incorporated by reference to Exhibit 10(II) to Norfolk Southern Corporation’s Form 10-K filed on February 23, 2006 (Exhibits, annexes, and schedules omitted. The Registrant will furnish supplementary copies of such materials to the SEC upon request). | |
(ee) | Amendment No. 1, dated as of January 17, 2006, by and among Norfolk Southern Corporation, The Alabama Great Southern Railroad Company, Kansas City Southern, and The Kansas City Southern Railroad , is incorporated by reference to Exhibit 10(mm) to Norfolk Southern Corporation’s Form 10-K filed on February 23, 2006. | |
(ff) | Amendment No. 2, dated as of May 1, 2006, to the Transaction Agreement, dated as of December 1, 2005, by and among Norfolk Southern Corporation, The Alabama Great Southern Railroad Company, Kansas City Southern, and The Kansas City Southern Railway Company is incorporated by reference to Exhibit 10.1 to Norfolk Southern Corporation’s Form 8-K filed on May 4, 2006. | |
(gg) | Limited Liability Agreement of Meridian Speedway, LLC, dated as of May 1, 2006, by and among the Alabama Great Southern Railroad Company and Kansas City Southern, is incorporated by reference to Exhibit 10.2 to Norfolk Southern Corporation’s Form 8-K filed on May 4, 2006. | |
(hh)*,** | Retirement Plan of Norfolk Southern Corporation and Participating Subsidiary Companies effective June 1, 1982, as amended and restated effective November 1, 2015. | |
(ii) | Transfer and Administration Agreement dated as of November 8, 2007, is incorporated by reference to Exhibit 99 to Norfolk Southern Corporation’s Form 8-K filed on November 14, 2007. | |
(jj) | Amendment No. 2, dated as of May 19, 2009, to Transfer and Administration Agreement dated as of November 8, 2007, is incorporated by reference to Exhibit 10.1 to Norfolk Southern Corporation’s Form 10-Q filed on July 31, 2009. | |
(kk) | Amendment No. 3, dated as of August 21, 2009, to Transfer and Administration Agreement dated as of November 8, 2007, is incorporated by reference to Exhibit 10.1 to Norfolk Southern Corporation’s Form 10-Q filed on October 30, 2009. | |
(ll) | Amendment No. 4, dated as of October 22, 2009, to Transfer and Administration Agreement dated as of November 8, 2007, is incorporated by reference to Exhibit 99 to Norfolk Southern Corporation’s Form 8-K filed on October 22, 2009. | |
(mm) | Amendment No. 5, dated as of December 23, 2009, to Transfer and Administration Agreement dated as of November 8, 2007, is incorporated by reference to Exhibit 10(xx) to Norfolk Southern Corporation’s Form 10-K filed on February 17, 2010. | |
(nn) | Amendment No. 6, dated as of August 30, 2010, to Transfer and Administration Agreement dated as of November 8, 2007, is incorporated by reference to Exhibit 10.1 to Norfolk Southern Corporation’s Form 10-Q filed on October 29, 2010. | |
K 90
(oo) | Amendment No. 7, dated as of October 21, 2010, to Transfer and Administration Agreement dated as of November 8, 2007, is incorporated by reference to Exhibit 99 to Norfolk Southern Corporation’s Form 8-K filed on October 22, 2010. | |
(pp) | Amendment No. 8, dated as of October 20, 2011, to Transfer and Administration Agreement dated as of November 8, 2007, is incorporated by reference to Exhibit 99 to Norfolk Southern Corporation’s Form 8-K filed on October 20, 2011. | |
(qq) | Amendment No. 9, dated as of October 18, 2012, to Transfer and Administration Agreement dated as of November 8, 2007, is incorporated by reference to Exhibit 99 to Norfolk Southern Corporation’s Form 8-K filed on October 22, 2012. | |
(rr) | Amendment No. 10, dated as of October 17, 2013, to Transfer and Administration Agreement dated as of November 8, 2007, is incorporated by reference to Exhibit 10.1 to Norfolk Southern Corporation’s Form 8-K filed on October 18, 2013. | |
(ss) | Dealer Agreement dated as of January 23, 2008, between the Registrant and J. P. Morgan Securities Inc. is incorporated by reference to Exhibit 10.1 to Norfolk Southern Corporation’s Form 8-K filed on January 25, 2008. | |
(tt) | Dealer Agreement dated as of January 23, 2008, between the Registrant and Goldman, Sachs & Co. is incorporated by reference to Exhibit 10.2 to Norfolk Southern Corporation’s Form 8-K filed on January 25, 2008. | |
(uu) | Omnibus Amendment, dated as of March 18, 2008, to the Transfer and Administration Agreement dated as of November 8, 2007, is incorporated by reference to Exhibit 10.1 to Norfolk Southern Corporation’s Form 10-Q filed on April 23, 2008. | |
(vv) | Transaction Agreement (Pan Am Transaction Agreement), dated May 15, 2008, by and among Norfolk Southern Railway Company, Pan Am Railways, Inc., Boston and Maine Corporation, and Springfield Terminal Railway Company, is incorporated by reference to Exhibit 10.1 to Norfolk Southern Corporation’s Form 10-Q filed on July 24, 2008 (Exhibits, annexes and schedules omitted. The Registrant will furnish supplementary copies of such materials to the SEC upon request). | |
(ww) | Letter Agreement, dated October 21, 2008, by and among Norfolk Southern Railway Company, Pan Am Railways, Inc., Boston and Maine Corporation, and Springfield Terminal Railway Company amending certain terms of the Pan Am Transaction Agreement, is incorporated by reference to Exhibit 10(rrr) to Norfolk Southern Corporation’s Form 10-K filed on February 18, 2009. | |
(xx)* | Directors’ Deferred Fee Plan of Norfolk Southern Corporation, adopted June 1, 1982 and as amended and restated effective October 3, 2014, is incorporated by reference to Exhibit 10 to Norfolk Southern Corporation’s Form 10-Q filed on October 22, 2014. | |
(yy)* | Norfolk Southern Corporation Executives’ Deferred Compensation Plan, as amended effective June 26, 2013, is incorporated by reference to Exhibit 10.1 to Norfolk Southern Corporation’s Form 10-Q filed on July 24, 2013. | |
(zz)* | Amendment to Norfolk Southern Corporation Officers’ Deferred Compensation Plan, effective January 1, 2008, is incorporated by reference to Exhibit 10.03 to Norfolk Southern Corporation’s Form 8-K filed on July 24, 2008. | |
(aaa)* | Norfolk Southern Corporation Restricted Stock Unit Plan, as amended effective January 1, 2009, is incorporated by reference to Exhibit 10.05 to Norfolk Southern Corporation’s Form 8-K filed on July 24, 2008. | |
K 91
(bbb) | Amendment No. 1 to Transfer and Administration Agreement dated as of October 22, 2008, and effective as of October 23, 2008, is incorporated by reference to Exhibit 99 to Norfolk Southern Corporation’s Form 8-K filed on October 23, 2006. | |
(ccc)* | Stock Unit Plan of Norfolk Southern Corporation dated as of July 24, 2001, as amended on August 21, 2008, with an effective date of January 1, 2009, is incorporated by reference to Exhibit 10.1 to Norfolk Southern Corporation’s Form 10-Q filed on October 24, 2008. | |
(ddd)* | Form of Amended and Restated Change in Control Agreement between Norfolk Southern Corporation and certain executive officers (including those defined as “named executive officers” and identified in the Corporation’s Proxy Statement for the 2016 annual Meeting of Stockholders), is incorporated by reference to Exhibit 10(aaaa) to Norfolk Southern Corporation’s Form 10-K filed on February 18, 2009. | |
(eee) | Limited Liability Company Agreement of Pan Am Southern LLC, dated as of April 9, 2009, is incorporated by reference to Exhibit 10.1 to Norfolk Southern Corporation’s Form 8-K filed on April 9, 2009 (exhibits, annexes, and schedules omitted – the Registrant will furnish supplementary copies of such materials to the SEC upon request). | |
(fff) | Credit Agreement dated as of December 14, 2011, is incorporated by reference to Exhibit 99 to Norfolk Southern Corporation’s Form 8-K filed on December 15, 2011. | |
(ggg)*,** | Form of Norfolk Southern Corporation Long-Term Incentive Plan, Award Agreement for Outside Directors as approved by the Compensation Committee on November 30, 2015. | |
(hhh)*,** | Form of Norfolk Southern Corporation Long-Term Incentive Plan, Award Agreement for performance share units approved by the Compensation Committee on November 30, 2015. | |
(iii)*,** | Form of Norfolk Southern Corporation Long-Term Incentive Plan, Award Agreement for non-qualified stock options approved by the Compensation Committee on November 30, 2015. | |
(jjj)*,** | Form of Norfolk Southern Corporation Long-Term Incentive Plan, Award Agreement for restricted stock units approved by the Compensation Committee on November 30, 2015. | |
(kkk)* | Form of Norfolk Southern Corporation Long-Term Incentive Plan, Non-Compete Agreement Associated with Award Agreement, approved by the Compensation Committee on January 22, 2015. | |
(lll) | Performance Criteria for bonuses payable in 2017 for the 2016 incentive year. On November 30, 2015, the Compensation Committee of the Norfolk Southern Corporation Board of Directors adopted the following performance criteria for determining bonuses payable in 2017 for the 2016 incentive year under the Norfolk Southern Corporation Executive Management Incentive Plan: 50% based on operating income; 35% based on operating ratio; and 15% based on a composite of three transportation service measures, consisting of adherence to operating plan, connection performance, and train performance. | |
(mmm) | Omnibus Amendment, dated as of January 17, 2011, to Pan Am Transaction Agreement dated as of May 15, 2008, and Limited Liability Company Agreement of Pan Am Southern LLC dated as of April 9, 2009, is incorporated by reference to Exhibit 10.1 to Norfolk Southern Corporation’s Form 10-Q filed on April 27, 2012. | |
K 92
(nnn)* | Form of Amendment to Amended and Restated Change in Control Agreements between Norfolk Southern Corporation and the Corporation’s Chairman, President and Chief Executive Officer, and each of the Corporation’s Executive Vice Presidents, to eliminate the excise tax gross-up provision in the Agreements, is incorporated by reference to Exhibit 10.1 to Norfolk Southern Corporation’s Form 8-K filed on January 23, 2013. | |
(ooo)*,** | Form of Change in Control Agreement between Norfolk Southern Corporation and executive officers who did not enter into a change in control agreement before 2016. | |
12** | Statement re: Computation of Ratio of Earnings to Fixed Charges. | |
21** | Subsidiaries of the Registrant. | |
23** | Consent of Independent Registered Public Accounting Firm. | |
31-A** | Rule 13a-14(a)/15d-014(a) CEO Certification. | |
31-B** | Rule 13a-14(a)/15d-014(a) CFO Certification. | |
32** | Section 1350 Certifications. | |
99** | Annual CEO Certification pursuant to NYSE Rule 303A.12(a). | |
101** | The following financial information from Norfolk Southern Corporation’s Annual Report on Form 10-K for the year ended December 31, 2015, formatted in Extensible Business Reporting Language (XBRL) includes: (i) the Consolidated Statements of Income of each of the years ended December 31, 2015, 2014, and 2013; (ii) the Consolidated Statements of Comprehensive Income for each of the years ended December 31, 2015, 2014, and 2013; (iii) the Consolidated Balance Sheets at December 31, 2015 and 2014; (iv) the Consolidated Statements of Cash Flows for the years ended December 31, 2015, 2014, and 2013; (v) the Consolidated Statements of Changes in Stockholders’ Equity for each of the three years ended December 31, 2015, 2014, and 2013; and (vi) the Notes to Consolidated Financial Statements. |
* Management contract or compensatory arrangement. | |
** Filed herewith. | |
(B) | Exhibits. |
The Exhibits required by Item 601 of Regulation S-K as listed in Item 15(A)3 are filed herewith or incorporated by reference. | |
(C) | Financial Statement Schedules. |
Financial statement schedules and separate financial statements specified by this Item are included in Item 15(A)2 or are otherwise not required or are not applicable. | |
Exhibits 23, 31, 32, and 99 are included in copies assembled for public dissemination. All exhibits are included in the 2015 Form 10-K posted on our website at www.nscorp.com under “Investors” and “SEC Filings” or you may request copies by writing to: | |
Office of Corporate Secretary Norfolk Southern Corporation Three Commercial Place Norfolk, Virginia 23510-9219 | |
K 93
POWER OF ATTORNEY
Each person whose signature appears on the next page under SIGNATURES hereby authorizes James A. Hixon and Marta R. Stewart, or any one of them, to execute in the name of each such person, and to file, any amendments to this report, and hereby appoints James A. Hixon and Marta R. Stewart, or any one of them, as attorneys-in-fact to sign on his or her behalf, individually and in each capacity stated below, and to file, any and all amendments to this report.
SIGNATURES
Pursuant to the requirements of Section 13 or 15(d) of the Securities Exchange Act of 1934, Norfolk Southern Corporation has duly caused this report to be signed on its behalf by the undersigned, thereunto duly authorized, on this 8th day of February, 2016.
/s/James A. Squires | |
By: | James A Squires |
(Chairman, President and Chief Executive Officer) | |
K 94
Pursuant to the requirements of the Securities Exchange Act of 1934, this report has been signed below on this 8th day of February, 2016, by the following persons on behalf of Norfolk Southern Corporation and in the capacities indicated.
Signature | Title |
/s/James A. Squires (James A. Squires) | Chairman, President and Chief Executive Officer and Director (Principal Executive Officer) |
/s/Marta R. Stewart (Marta R. Stewart) | Executive Vice President Finance and Chief Financial Officer (Principal Financial Officer) |
/s/Thomas E. Hurlbut (Thomas E. Hurlbut) | Vice President and Controller (Principal Accounting Officer) |
/s/Thomas D. Bell, Jr. (Thomas D. Bell, Jr.) | Director |
/s/Erskine B. Bowles (Erskine B. Bowles) | Director |
/s/Robert A. Bradway (Robert A. Bradway) | Director |
/s/Wesley G. Bush (Wesley G. Bush) | Director |
/s/Daniel A. Carp (Daniel A. Carp) | Director |
/s/Karen N. Horn (Karen N. Horn) | Director |
/s/Steven F. Leer (Steven F. Leer) | Director |
/s/Michael D. Lockhart (Michael D. Lockhart) | Director |
/s/Amy E. Miles (Amy E. Miles) | Director |
/s/Martin H. Nesbitt (Martin H. Nesbitt) | Director |
/s/John R. Thompson (John R. Thompson) | Director |
K 95
Schedule II
Norfolk Southern Corporation and Subsidiaries
Valuation and Qualifying Accounts
Years ended December 31, 2013, 2014, and 2015
($ in millions)
Additions charged to: | |||||||||||||||||||
Beginning Balance | Expenses | Other Accounts | Deductions | Ending Balance | |||||||||||||||
Year ended December 31, 2013 | |||||||||||||||||||
Valuation allowance (included net in | |||||||||||||||||||
deferred tax liability) for deferred | |||||||||||||||||||
tax assets | $ | 19 | $ | 13 | $ | — | $ | — | $ | 32 | |||||||||
Casualty and other claims | |||||||||||||||||||
included in other liabilities | 258 | 33 | (1) | — | 77 | (3) | 214 | ||||||||||||
Current portion of casualty and | |||||||||||||||||||
other claims included in | |||||||||||||||||||
accounts payable | 183 | 15 | 101 | (2) | 133 | (4) | 166 | ||||||||||||
Year ended December 31, 2014 | |||||||||||||||||||
Valuation allowance (included net in | |||||||||||||||||||
deferred tax liability) for deferred | |||||||||||||||||||
tax assets | $ | 32 | $ | 1 | $ | — | $ | — | $ | 33 | |||||||||
Casualty and other claims | |||||||||||||||||||
included in other liabilities | 214 | 71 | (1) | — | 86 | (3) | 199 | ||||||||||||
Current portion of casualty and | |||||||||||||||||||
other claims included in | |||||||||||||||||||
accounts payable | 166 | 19 | 132 | (2) | 130 | (4) | 187 | ||||||||||||
Year ended December 31, 2015 | |||||||||||||||||||
Valuation allowance (included net in | |||||||||||||||||||
deferred tax liability) for deferred | |||||||||||||||||||
tax assets | $ | 33 | $ | 2 | $ | — | $ | — | $ | 35 | |||||||||
Casualty and other claims | |||||||||||||||||||
included in other liabilities | 199 | 66 | (1) | — | 74 | (3) | 191 | ||||||||||||
Current portion of casualty and | |||||||||||||||||||
other claims included in | |||||||||||||||||||
accounts payable | 187 | 19 | 119 | (2) | 151 | (4) | 174 | ||||||||||||
(1) | Includes adjustments for changes in estimates for prior years’ claims. |
(2) | Includes revenue refunds and overcharges provided through deductions from operating revenues and transfers |
from other accounts.
(3) | Payments and reclassifications to/from accounts payable. |
(4) | Payments and reclassifications to/from other liabilities. |
K 96