Attached files
| file | filename |
|---|---|
| 8-K - 8-K - LendingClub Corp | d123622d8k.htm |
Exhibit 99.1
Credit Performance Update
Summary: Credit performance of our standard program is coming in within expectations.
Background: Last week we posted an analysis on our Website that included a chart that was subsequently misinterpreted. The purpose of this blog post is to clarify what the chart means and provide the correct interpretation.
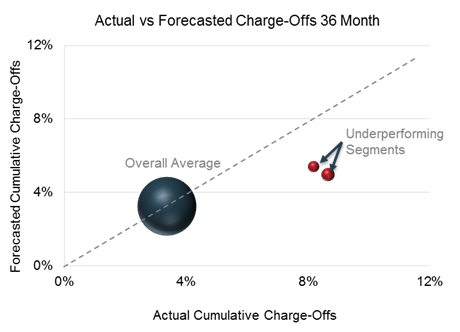
The chart, reproduced below, was designed to highlight the routine process by which we identify credit segments that perform either above or below expectations and inform next steps in terms of either adjusting credit policy or pricing. In this example, we highlighted two segments that were performing worse than expected and took the necessary steps to bring these segments back within expectations.1 The key clarifications with respect to this chart are:
| • | The larger dark blue sphere represents the overall, average performance of all standard 36-month loans, which includes the underperforming segments captured by the two red spheres; |
| • | The position of the larger dark blue sphere on the chart shows that the average loan performance falls within expectations (just under 4% both forecasted and actual); |
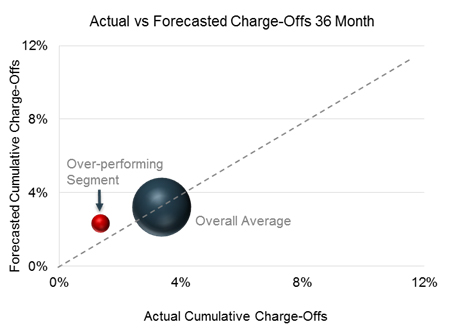
While the overall average is represented as a monolithic dark blue sphere, that average is comprised of many segments that can each be graphically isolated using the same visualization technique. Most segments come in as expected along the dotted line while others come in above or below. See below an example of the same dataset that isolates an over-performing segment instead2:
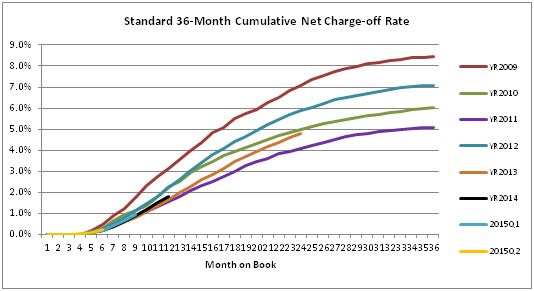
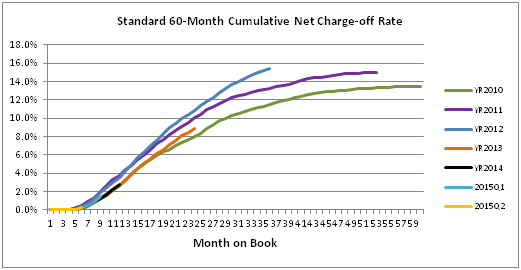
To help provide additional transparency to credit performance overall, please see below the latest actual loss curves that we make available in our quarterly filings. These curves show cumulative net charge-offs for the entire life of the loans (36 or 60 months) by vintage of origination. The shorter lines show the most recent vintages.
We invite investors to join our Q4 and full year 2015 earnings call this Thursday. Details here: http://ir.lendingclub.com/file.aspx?IID=4213397&FID=32624942.
| 1 | The 2 segments in question represented 8.3% of the 36-month loan volume over the observed period and featured the following characteristics: |
| • | Segment 1: This segment represented 3.4% of the 36 month originations. Defined as Debt to Income Ratio>20% and G3 Statistical Model score>0.149. G3 Statistical Model is a proprietary Lending Club model. |
| • | Segment 2: This segment represents 4.9% of the 36 month originations. Defined as borrowers who obtained more than 1 installment loan from a bank or other lender in the last 12 months and have a G3 Statistical Model score >0.08. |
Similar data and results were presented with respect to 60-month loans.
| 2 | This segment represents 9.3% of the 36-month loan volume over the observed period and features the following characteristics: Debt-to-income ratio <= 15.335%, B Grade and G3 Statistical Model score <= 0.08. |