Attached files
| file | filename |
|---|---|
| 8-K - FORM 8-K - SEACOAST BANKING CORP OF FLORIDA | v430364_8k.htm |
| EX-99.2 - EXHIBIT 99.2 - SEACOAST BANKING CORP OF FLORIDA | v430364_ex99-2.htm |
| EX-99.1 - EXHIBIT 99.1 - SEACOAST BANKING CORP OF FLORIDA | v430364_ex99-1.htm |
Exhibit 99.3

Fourth Quarter 2015 Fourth Quarter 2015 January 29, 2016 Contact : (email) Steve.Fowle@SeacoastBank.com (phone) 772.463.8977 (web) www.Sea coa stBanking.com

Fourth Quarter 2015 This presentation contains “forward - looking statements” within the meaning of Section 27 A of the Securities Act of 1933 and Section 21 E of the Securities Exchange Act of 1934 , including, without limitation, statements about future financial and operating results, ability to realized deferred tax assets, cost savings, enhanced revenues, economic and seasonal conditions in our markets, and improvements to reported earnings that may be realized from cost controls and for integration of banks that we have acquired, as well as statements with respect to Seacoast’s objectives, expectations and intentions and other statements that are not historical facts . Actual results may differ from those set forth in the forward - looking statements . Forward - looking statements include statements with respect to our beliefs, plans, objectives, goals, expectations, anticipations, estimates and intentions, and involve known and unknown risks, uncertainties and other factors, which may be beyond our control, and which may cause the actual results, performance or achievements of Seacoast to be materially different from future results, performance or achievements expressed or implied by such forward - looking statements . You should not expect us to update any forward - looking statements . You can identify these forward - looking statements through our use of words such as “may,” “will,” “anticipate,” “assume,” “should,” “support”, “indicate,” “would,” “believe,” “contemplate,” “expect,” “estimate,” “continue,” “further”, “point to,” “project,” “could,” “intend” or other similar words and expressions of the future . These forward - looking statements may not be realized due to a variety of factors, including, without limitation : the effects of future economic and market conditions, including seasonality ; governmental monetary and fiscal policies, as well as legislative, tax and regulatory changes ; changes in accounting policies, rules and practices ; the risks of changes in interest rates on the level and composition of deposits, loan demand, liquidity and the values of loan collateral, securities, and interest sensitive assets and liabilities ; interest rate risks, sensitivities and the shape of the yield curve ; the effects of competition from other commercial banks, thrifts, mortgage banking firms, consumer finance companies, credit unions, securities brokerage firms, insurance companies, money market and other mutual funds and other financial institutions operating in our market areas and elsewhere, including institutions operating regionally, nationally and internationally, together with such competitors offering banking products and services by mail, telephone, computer and the Internet ; and the failure of assumptions underlying the establishment of reserves for possible loan losses . The risks of mergers and acquisitions, include, without limitation : unexpected transaction costs, including the costs of integrating operations ; the risks that the businesses will not be integrated successfully or that such integration may be more difficult, time - consuming or costly than expected ; the potential failure to fully or timely realize expected revenues and revenue synergies, including as the result of revenues following the merger being lower than expected ; the risk of deposit and customer attrition ; any changes in deposit mix ; unexpected operating and other costs, which may differ or change from expectations ; the risks of customer and employee loss and business disruption, including, without limitation, as the result of difficulties in maintaining relationships with employees ; increased competitive pressures and solicitations of customers by competitors ; as well as the difficulties and risks inherent with entering new markets . All written or oral forward - looking statements attributable to us are expressly qualified in their entirety by this cautionary notice, including, without limitation, those risks and uncertainties described in our annual report on Form 10 - K for the year ended December 31 , 2014 under “Special Cautionary Notice Regarding Forward - Looking Statements” and “Risk Factors”, and otherwise in our SEC reports and filings . Such reports are available upon request from the Company, or from the Securities and Exchange Commission, including through the SEC’s Internet website at http : //www . sec . gov . 2 Fourth Quarter 2015 Cautionary Notice Regarding Forward - Looking Statements
Fourth Quarter 2015 On January 22 , 2016 , Seacoast filed a definitive Proxy Statement/Prospectus with the SEC regarding the proposed merger with Floridian . This Proxy Statement/Prospectus has been mailed to Floridian shareholders . INVESTORS ARE URGED TO READ THE PROXY STATEMENT/PROSPECTUS REGARDING THE PROPOSED MERGER AND ANY OTHER RELEVANT DOCUMENTS FILED BY SEACOAST WITH THE SEC, AS WELL AS ANY AMENDMENTS OR SUPPLEMENTS TO THOSE DOCUMENTS, BECAUSE THEY DO OR WILL CONTAIN IMPORTANT INFORMATION . Investors can obtain a free copy of the Proxy Statement/Prospectus, as well as other filings containing information about Seacoast and Floridian, at the SEC’s website ( http : //www . sec . gov ), with respect to information about Seacoast, and Floridian’s website ( www . floridianbank . com ), with respect to information about Floridian . Investors can also obtain these documents, free of charge, at http : //www . seacoastbanking . com under the tab “Investor Relations” and then under the tab “Financials/Regulatory Filings . ” Copies of the Proxy Statement/Prospectus and any other filing by Seacoast with the SEC can also be obtained, free of charge, by directing a request to Investor Relations, 815 Colorado Avenue, P . O . Box 9012 , Stuart, FL 34994 , ( 772 ) 288 - 6085 . Seacoast, Floridian, their respective directors and executive officers and other members of management and employees may be considered participants in the solicitation of proxies in connection with the proposed transaction . Information about the directors and executive officers of Seacoast is set forth in its proxy statement for its 2015 annual meeting of shareholders, which was filed with the SEC on April 7 , 2015 and its Current Reports on Form 8 - K . Other information regarding the participants in the proxy solicitation and a description of their direct and indirect interests, by security holdings or otherwise, is contained in the Proxy Statement/Prospectus . You may obtain free copies of these documents as described in the preceding paragraph . 3 Fourth Quarter 2015 Legal Information
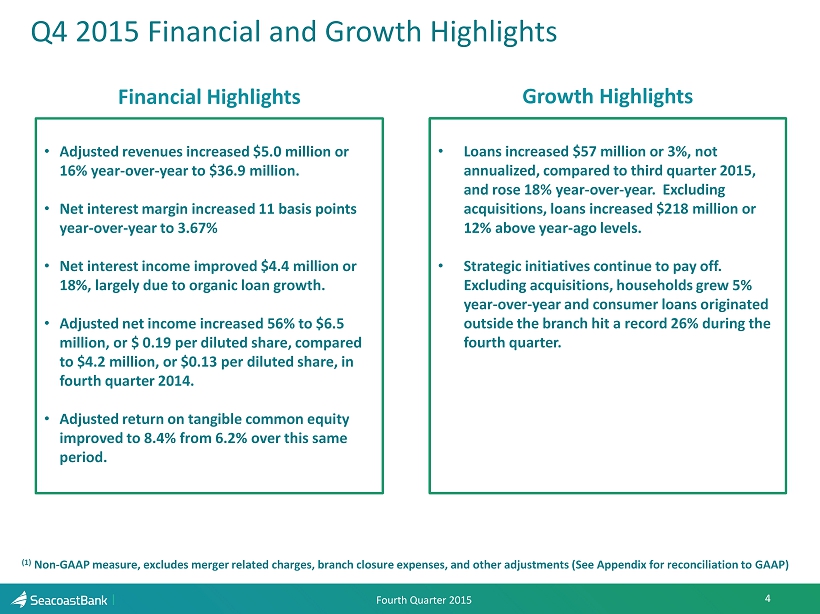
Fourth Quarter 2015 4 Financial Highlights Growth Highlights Q4 2015 Financial and Growth Highlights • Loans increased $57 million or 3%, not annualized, compared to third quarter 2015, and rose 18% year - over - year. Excluding acquisitions, loans increased $218 million or 12% above year - ago levels . • Strategic initiatives continue to pay off. Excluding acquisitions, households grew 5% year - over - year and consumer loans originated outside the branch hit a record 26% during the fourth quarter. • Adjusted revenues increased $5.0 million or 16% year - over - year to $36.9 million . • Net interest margin increased 11 basis points year - over - year to 3.67 % • Net interest income improved $4.4 million or 18%, largely due to organic loan growth . • Adjusted net income increased 56% to $6.5 million, or $ 0.19 per diluted share, compared to $4.2 million, or $0.13 per diluted share, in fourth quarter 2014. • Adjusted return on tangible common equity improved to 8.4% from 6.2% over this same period . (1) Non - GAAP measure, excludes merger related charges, branch closure expenses, and other adjustments (See Appendix for reconciliation to GAA P)

Fourth Quarter 2015 5 Agenda • About Seacoast • Earnings Highlights • Balance Sheet Trends • Income Statement Highlights • Earnings Goal – 2016 • Florida Economic Updates • Appendix

Fourth Quarter 2015 Agenda • $3.5B bank in the nation’s third most - populous state • Strong and growing presence in Orlando and Palm Beach County, two of Florida’s most attractive MSAs • Third - generation CEO; strong, engaged and independent board • Investing in innovative commercial banking platform and digital customer acquisition and cross - sell • Growth - oriented culture • Market Cap: $480 million (1/26/16) Seacoast Bank [NASDAQ: SBCF] Attractive Geography; Deep Local Roots; Benefiting from Balanced Strategy of Organic Growth Investments in Commercial Loan Platform and Digital Marketing as well as Accretive Acquisitions 6 Orlando MSA West Palm Beach MSA Retail Location Commercial Banking Location

Fourth Quarter 2015 Agenda Investment Thesis Successfully Executing a New Model for Community Bankin g 7 • Reaping benefits from strategic investments in organic growth • Successful commercial banking platform – Accelerate • Leader in using digital technology to drive customer acquisition, enable cross - sell, eliminate costs • Consistent growth in fee - generating businesses • Track record of completing value - creating acquisitions • Opportunistic deals that expand our footprint and strengthen our franchise • Proven integration capabilities • Opportunity to acquire un - optimized customer sets • Ready supply of potential targets • Robust risk management and controls yielding consistent results • Action - oriented management team, engaged and experienced board that is aligned with shareholders • Well - positioned to benefit from resurgent Florida economy

Fourth Quarter 2015 Seacoast Bank – Evidence of Success 8 (1) Non - GAAP measure, excludes merger related charges, branch closure expenses, and other adjustments (See Appendix for reconciliati on to GAAP) 280% 64% 26% 18% Pre Tax & Provision Revenue Revenue Expenses Total Growth 1 Compound Annual Growth FY ‘12 – FY ‘15 Annualized 56% 8 %
Fourth Quarter 2015 9 Agenda • About Seacoast • Earnings Highlights • Balance Sheet Trends • Income Statement Highlights • Earnings Goal – 2016 • Florida Economic Updates • Appendix

Fourth Quarter 2015 Earnings Improvement Trend 10 (1) Non - GAAP measure, excludes merger related charges, branch closure expenses, and other adjustments (See Appendix for reconciliati on to GAAP) • Net Income increased to $6.0 million, compared to a $1.5 million net loss from Q4 2014 • Adjusted net income (1) of $6.5 million was up $2.3 million or 56% from the prior year (Dollars in thousands) Fourth Quarter 2015 Third Quarter 2015 Second Quarter 2015 First Quarter 2015 Fourth Quarter 2014 GAAP Net Income $6,036 $4,441 $5,805 $5,859 ($1,517) GAAP Earnings per diluted share $0.18 $0.13 $ 0.18 $0.18 ($0.05) Adjusted Net Income (1) $6,520 $6,433 $ 6,172 $6,177 $4,179 Adjusted Pretax, pre - provision income (1) $10,913 $11,328 $ 10,815 $10,342 $7,464 Adjusted Earnings per diluted share (1) $0.19 $0.19 $0.19 $ 0.19 $0.13 Average shares outstanding (000) 34,395 34,194 33,234 33,136 33,124

Fourth Quarter 2015 11 Agenda • About Seacoast • Earnings Highlights • Balance Sheet Trends • Income Statement Highlights • Earnings Goal – 2016 • Florida Economic Updates • Appendix

Fourth Quarter 2015 Loan Growth Momentum Continues 12 $1,822 $1,854 $1,937 $2,099 $2,156 $1,000 $1,200 $1,400 $1,600 $1,800 $2,000 $2,200 Q4-14 Q1-15 Q2-15 Q3-15 Q4-15 Total Loans Outstanding (in millions) Total loans were $ 2.2 billion at December 31, 2015, up $334 million or 18% from the prior year.

Fourth Quarter 2015 Deposit Balances Extend Growth Trends 13 Total deposits increased 18% to $2.84 billion at December 31, 2015 from year - ago levels. Cost of deposits at a low 12 basis points. $728 $754 $796 $849 $879 $1,307 $1,416 $1,499 $1,545 $1,624 $327 $318 $304 $308 $299 $0 $500 $1,000 $1,500 $2,000 $2,500 $3,000 Q4-14 Q1-15 Q2-15 Q3-15 Q4-15 Non Interest Bearing Low Cost Deposits Time Deposits Average Deposit Balances (in millions) $2,362 $2,488 $2,599 $2,702 89% $2,802

Fourth Quarter 2015 14 Agenda • About Seacoast • Earnings Highlights • Balance Sheet Trends • Income Statement Highlights • Earnings Goal – 2016 • Florida Economic Updates • Appendix
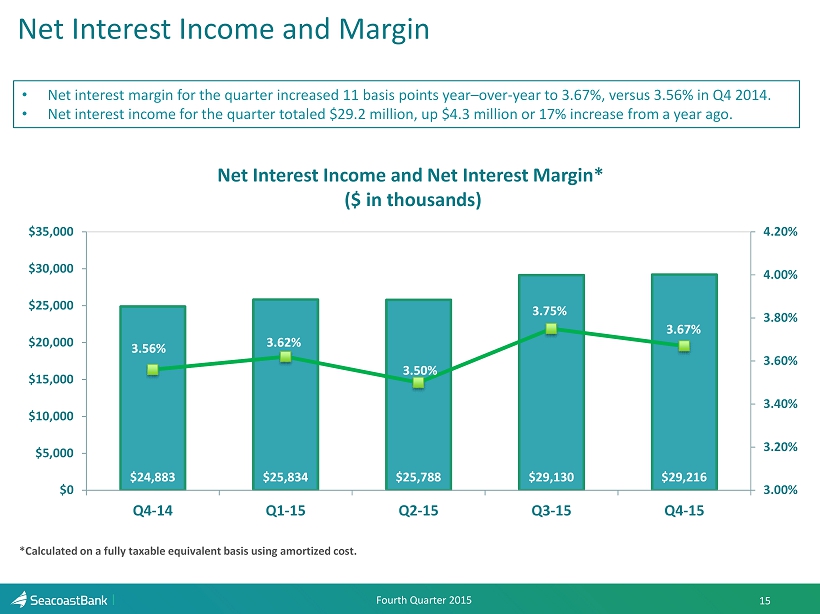
Fourth Quarter 2015 Net Interest Income and Margin 15 $24,883 $25,834 $25,788 $29,130 $29,216 3.56% 3.62% 3.50% 3.75% 3.67% 3.00% 3.20% 3.40% 3.60% 3.80% 4.00% 4.20% $0 $5,000 $10,000 $15,000 $20,000 $25,000 $30,000 $35,000 Q4-14 Q1-15 Q2-15 Q3-15 Q4-15 Net Interest Income and Net Interest Margin* ($ in thousands) • Net interest margin for the quarter increased 11 basis points year – over - year to 3.67%, versus 3.56% in Q4 2014. • Net interest income for the quarter totaled $29.2 million, up $4.3 million or 17% increase from a year ago. *Calculated on a fully taxable equivalent basis using amortized cost.

Fourth Quarter 2015 Non Interest Income 16 $2,208 $2,002 $2,115 $2,217 $2,229 $1,603 $1,737 $2,033 $1,925 $1,989 $1,212 $1,242 $1,335 $1,385 $1,302 $716 $1,088 $1,032 $1,177 $955 $1,150 $909 $1,272 $1,012 $911 $330 $334 $366 $396 $0 $1,000 $2,000 $3,000 $4,000 $5,000 $6,000 $7,000 $8,000 $9,000 $10,000 Q4-14 Q1-15 Q2-15 Q3-15 Q4-15 BOLI Other Income Mortgage Banking Fees Wealth Management Fees Interchange Income Service Charges Non Interest Income (in thousands)* $7,308 $8,121 $7,141 *Non interest income before: securities gains and bargain purchase gain, net ** Q2 - 15 excludes $725,000 gain on participation loans and Q4 - 15 excludes $416,000 gain on bargain purchase. • Noninterest income excluding security gains and the bargain purchase gain, totaled $7.8 million for the fourth quarter , an increase of $0.6 million or 9% from a year ago $8,082 $7,782

Fourth Quarter 2015 Non Interest Expense 17 $12,459 $11,192 $11,814 $13,236 $13,124 $1,925 $2,184 $2,235 $2,279 $2,457 $3,426 $3,251 $3,272 $3,604 $3,678 $6,598 $6,048 $6,376 $6,645 $6,706 $0 $5,000 $10,000 $15,000 $20,000 $25,000 $30,000 Q4-14 Q1-15 Q2-15 Q3-15 Q4-15 Other Occupancy / Telephone Data Processing Cost Salaries and Benefits Non Interest Expense (1) (in thousands) $22,675 $23,697 $24,408 • Noninterest expenses decreased $2.0 million from the third quarter, 2015 • Excluding merger related charges and other one - time items , adjusted noninterest expense (1) grew $0.2 million, less than 1%. $25,764 $25,965 (1) Non - GAAP measure, excludes merger related charges, branch closure expenses, and other adjustments (See Appendix for reconciliation to GAA P)

Fourth Quarter 2015 18 Transforming Our Business Still in the early innings of our transformation, but already seeing results which position us as unique to other community banks. x Alternative Sales x Alternative Service x Online Fulfillment x Analytics x Marketing Automation x Cross Sell x Training x Digital Marketing Outside of Branch Dec 2015 Q4 2015 Q3 2015 Q4 2014 % of Checks Deposited 28.5% 27.74% 25.5% 20.9% % of Deposit Accounts Opened 10.40% 10.26% 8.31% 0.60% % of Consumer Loans Opened 24.42% 22.21% 17.07% 6.30%

Fourth Quarter 2015 19 Agenda • About Seacoast • Earnings Highlights • Balance Sheet Trends • Income Statement Highlights • Earnings Goal – 2016 • Florida Economic Updates • Appendix

Fourth Quarter 2015 Agenda Seacoast Earnings Goal - 2016 We now have line of site on achieving $1.00 EPS in the near term 20 $0.00 $0.20 $0.40 $0.60 $0.80 $1.00 $1.20 Q4 '15 Run Rate Annualized EPS Run Rate Forward Rate Curve M&A Oppty Organic Growth/Operating Leverage FY '16 EPS Target $0.19 $0.76 $ 0.04 to $ 0.06 $ 0.12 to $ 0.14 $ 0.06 $1.00 Earnings Per Share

Fourth Quarter 2015 21 Agenda • About Seacoast • Earnings Highlights • Balance Sheet Trends • Income Statement Highlights • Earnings Goal – 2016 • Florida Economic Updates • Appendix

Fourth Quarter 2015 22 Florida’s Unemployment Rate

Fourth Quarter 2015 23 Florida’s Economic Improvement • Employment overall grew 2.9% YOY in Florida vs 1.9% for the nation. • Unemployment in December was down to 5.0%, a drop of 0.7% from a year ago. • Strongest sectors were education and health services, leisure & hospitality, education & health, trade, transportation and utilities, construction, financial and manufacturing.

Fourth Quarter 2015 24 Agenda • About Seacoast • Earnings Highlights • Balance Sheet Trends • Income Statement Highlights • Earnings Goal – 2016 • Florida Economic Updates • Appendix

Fourth Quarter 2015 Explanation of Certain Unaudited Non - GAAP Financial M easures This presentation contains financial information determined by methods other than Generally Accepted Accounting Principles (“GAAP”) . The financial highlights provide reconciliations between GAAP net income and adjusted net income, GAAP income and adjusted pretax, preprovision income . Management uses these non - GAAP financial measures in its analysis of the Company’s performance and believes these presentations provide useful supplemental information, and a clearer understanding of the Company’s performance . The Company believes the non - GAAP measures enhance investors’ understanding of the Company’s business and performance . These measures are also useful in understanding performance trends and facilitate comparisons with the performance of other financial institutions . The limitations associated with operating measures are the risk that persons might disagree as to the appropriateness of items comprising these measures and that different companies might calculate these measures differently . The Company provides reconciliations between GAAP and these non - GAAP measures . These disclosures should not be considered an alternative to GAAP . 25
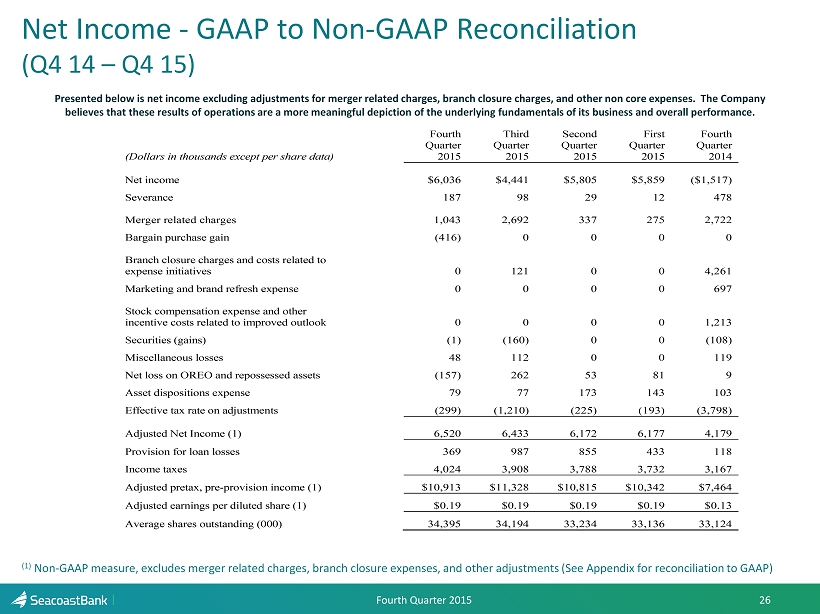
Fourth Quarter 2015 Net Income - GAAP to Non - GAAP Reconciliation (Q4 14 – Q4 15) Presented below is net income excluding adjustments for merger related charges, branch closure charges, and other non core expenses. The Company believes that these results of operations are a more meaningful depiction of the underlying fundamentals of its business and ove rall performance. (1) Non - GAAP measure, excludes merger related charges, branch closure expenses, and other adjustments (See Appendix for reconciliation to GAA P) 26 (Dollars in thousands except per share data) Fourth Quarter 2015 Third Quarter 2015 Second Quarter 2015 First Quarter 2015 Fourth Quarter 2014 Net income $6,036 $4,441 $5,805 $5,859 ($1,517) Severance 187 98 29 12 478 Merger related charges 1,043 2,692 337 275 2,722 Bargain purchase gain (416) 0 0 0 0 Branch closure charges and costs related to expense initiatives 0 121 0 0 4,261 Marketing and brand refresh expense 0 0 0 0 697 Stock compensation expense and other incentive costs related to improved outlook 0 0 0 0 1,213 Securities (gains) (1) (160) 0 0 (108) Miscellaneous losses 48 112 0 0 119 Net loss on OREO and repossessed assets (157) 262 53 81 9 Asset dispositions expense 79 77 173 143 103 Effective tax rate on adjustments (299) (1,210) (225) (193) (3,798) Adjusted Net Income (1) 6,520 6,433 6,172 6,177 4,179 Provision for loan losses 369 987 855 433 118 Income taxes 4,024 3,908 3,788 3,732 3,167 Adjusted pretax, pre-provision income (1) $10,913 $11,328 $10,815 $10,342 $7,464 Adjusted earnings per diluted share (1) $0.19 $0.19 $0.19 $0.19 $0.13 Average shares outstanding (000) 34,395 34,194 33,234 33,136 33,124

Fourth Quarter 2015 Net Income - GAAP to Non - GAAP Reconciliation (Q4 14 – Q4 15) Presented below is net income excluding adjustments for merger related charges, branch closure charges, and other non core expenses. The Company believes that these results of operations are a more meaningful depiction of the underlying fundamentals of its business and ove rall performance. (1) Non - GAAP measure, excludes merger related charges, branch closure expenses, and other adjustments (See Appendix for reconciliation to GAA P) 27 Fourth Third Second First Fourth (Dollars in thousands) Quarter Quarter Quarter Quarter Quarter 2015 2015 2015 2015 2014 Noninterest Expense: Salaries and wages $ 10,948 $ 10,806 $ 9,273 $ 8,777 $ 9,998 Employee benefits 2,178 2,430 2,541 2,415 2,461 Outsourced data processing costs 2,457 2,279 2,235 2,184 1,925 Telephone / data lines 412 446 443 496 419 Occupancy expense 2,314 2,275 2,010 2,023 2,325 Furniture and equipment expense 952 883 819 732 683 Marketing expense 1,128 1,063 1,225 975 1,072 Legal and professional fees 1,568 1,651 1,255 1,388 1,741 FDIC assessments 551 552 520 589 476 Amortization of intangibles 397 397 315 315 446 Other 3,064 2,982 3,061 2,781 2,862 Total Core Operating Expense 25,969 25,763 23,697 22,675 24,408 Severance and organizational changes 187 98 29 12 478 Legal and professional fees for acquisition and expense initiatives 1043 2692 337 275 2722 Branch Closure 0 121 0 0 4261 Brand refresh expenses 0 0 0 0 697 Additional incentives for quarter and year performance 0 0 0 0 1213 Miscellaneous losses 48 112 0 0 119 Recovery of prior legal fees 0 0 0 0 0 Net loss on OREO and repossessed assets (157) 262 53 81 9 Asset disposition expense 79 77 173 143 103 Total $ 27,169 $ 29,126 $ 24,288 $ 23,186 $ 34,011