Attached files
| file | filename |
|---|---|
| 8-K - 8-K - METLIFE INC | d105315d8k.htm |
| EX-99.1 - EX-99.1 - METLIFE INC | d105315dex991.htm |
| EX-99.2 - EX-99.2 - METLIFE INC | d105315dex992.htm |
Exhibit 99.3
Description of Video Fourth Quarter and Full Year 2015 Financial Update
From Chief Financial Officer John Hele
This exhibit (video transcript and slides) contains forward-looking statements. Forward-looking statements give expectations or forecasts of future events and use words such as “anticipate,” “estimate,” “expect,” “project” and other terms of similar meaning, or that are tied to future periods. Any or all forward-looking statements may turn out to be wrong, and actual results could differ materially from those expressed or implied in the forward-looking statements. Predictions of future performance are inherently difficult and are subject to numerous risks and uncertainties, including those identified in the “Risk Factors” section of MetLife, Inc.’s filings with the U.S. Securities and Exchange Commission. The company is not required to publicly correct or update any forward-looking statement if it later becomes aware that such statement is not likely to be achieved.
This exhibit (video transcript and slides) also contains measures that are not calculated based on accounting principles generally accepted in the United States of America, also known as GAAP. Information regarding those non-GAAP financial measures and the reconciliations of the non-GAAP financial measures to the most directly comparable GAAP measures is provided in the company’s fourth quarter 2015 Financial Supplement, and/or the company’s earnings news release dated February 3, 2016 for the three months and full year ended December 31, 2015. Each of the Financial Supplement, the news release, and this exhibit (video transcript and slides) accompany one another as they are each exhibits to the company’s Current Report on Form 8-K, dated February 3, 2016.
Video Transcript and Description:
[Shows slide 1 below]
[MetLife Executive Vice President & CFO John Hele speaks from a studio at MetLife’s corporate headquarters in New York City]
Hello, I’m John Hele and I’m joining you from MetLife’s global headquarters in New York City.
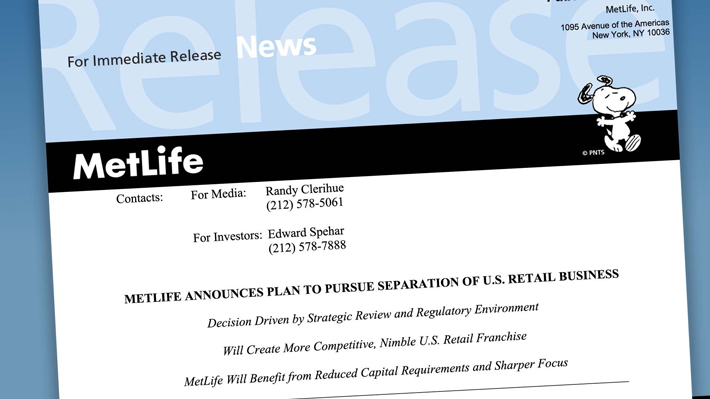
Before I discuss our fourth quarter and full year 2015 results, I want to take a moment to talk about our recently announced plan to pursue the separation of a substantial portion of our U.S. Retail segment.
MetLife is currently evaluating structural alternatives for this separation, including a public offering of shares in an independent, publicly traded company, a spin-off, or a sale. [Shows slide 2 below]
There were two main reasons why we decided to take this action now.
The first is an outcome from our Accelerating Value strategic initiative that we started last year. This effort involves a detailed analysis of the cash and capital characteristics of our businesses, including the economic and regulatory environment in each of our markets.
Through our Accelerating Value analysis of U.S. Retail, we determined that a separation could bring significant benefits to MetLife. [Shows footage of MetLife’s offices at 200 Park Avenue in New York City from exterior]
For the remaining businesses in the U.S., this allows us to focus more intently on our group business, where we have been a market leader for years. Globally, we will continue to do business in a mix of mature and emerging markets to drive growth and generate attractive returns. [Shows footage of MetLife’s offices at 200 Park Avenue in New York City from exterior]
The second reason is, as part of a Systemically Important Financial Institution, or SIFI, U.S. Retail risks higher capital requirements that could put it at a significant competitive disadvantage. Even though we are appealing our SIFI designation in court, and do not believe that any part of the company is systemic, this risk of increased capital requirements was a key factor in our decision.
U.S. Retail is a strong franchise that has long been a core part of MetLife, but will benefit from greater focus, more flexibility in products and operations, and a reduced capital and compliance burden as an independent company. This will enable it to compete more effectively.
We anticipate this effort will lead to improvement in our free cash flow, which we believe is the key to sustainable shareholder value.
It is still very early in the process, but we will provide more information as the transaction unfolds.
Now turning to our results…
MetLife had a difficult fourth quarter, when compared to a strong fourth quarter in 2014.
Operating earnings for the quarter were 1.4 billion dollars. On a per share basis, operating earnings were 1 dollar and 23 cents versus 1 dollar and 38 cents in the fourth quarter of 2014. The difference is explained by lower variable investment income and a strong U.S. dollar. Net income for the quarter was 785 million dollars.
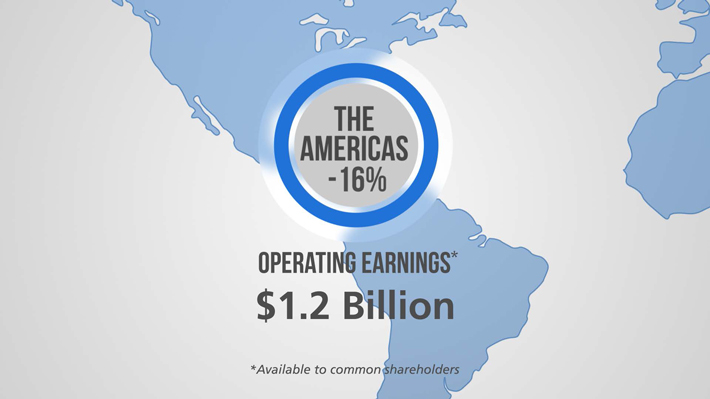
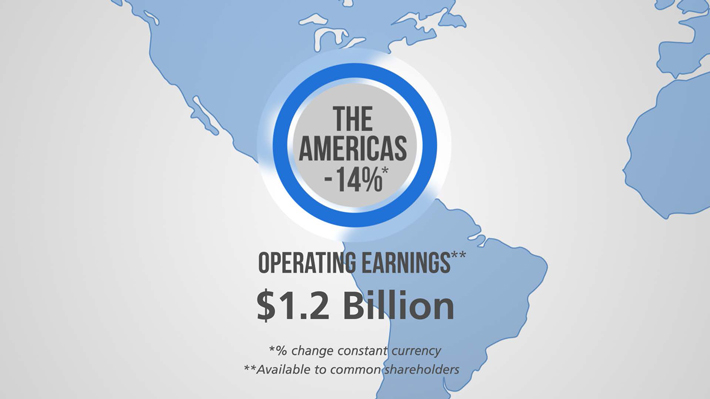
In the Americas, fourth quarter operating earnings were 1.2 billion dollars, down 16 percent on a reported basis and 14 percent on a constant currency basis due to lower investment and underwriting margins. [Shows slide 3 and 4 below]
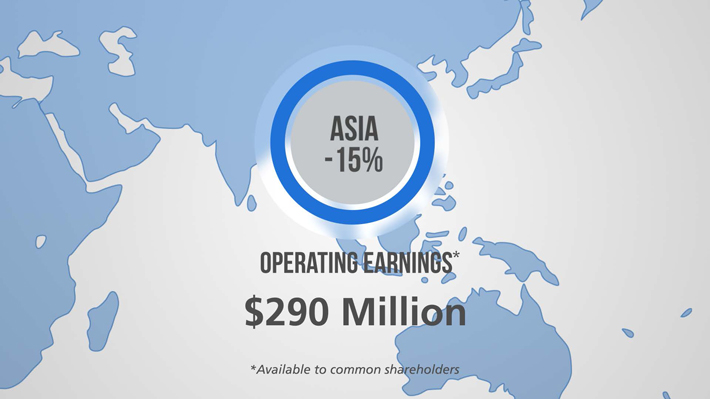
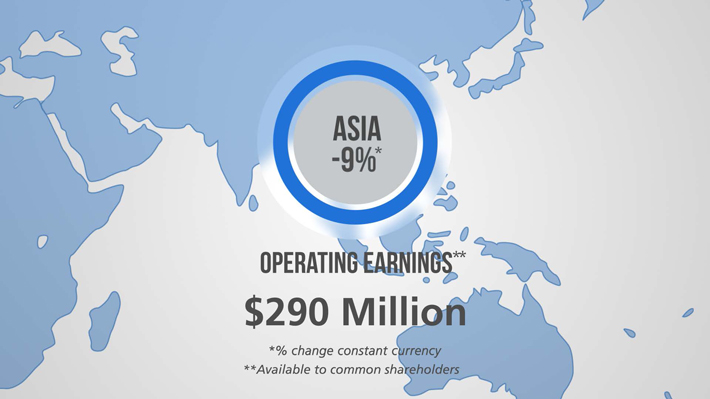
In Asia, fourth quarter operating earnings were 290 million dollars, down 15 percent on a reported basis and 9 percent on a constant currency basis. [Shows slide 5 and 6 below]
This was largely due to lower variable investment income in the quarter and a prior year one-time benefit from actuarial items. Accounting for these items in both periods, operating earnings increased 6 percent on a constant currency basis.
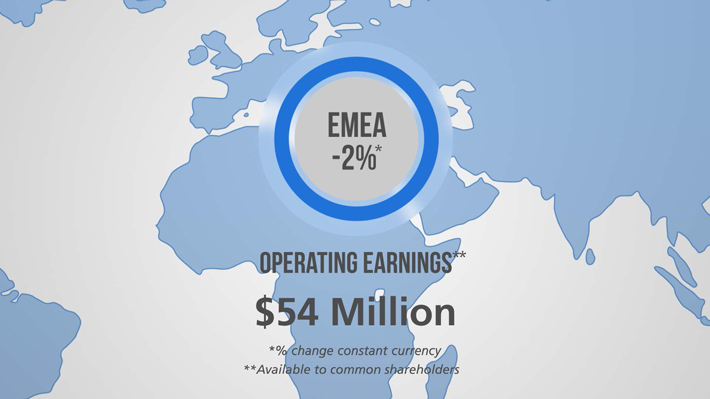
And in EMEA, operating earnings were 54 million dollars, down 16 percent on a reported basis and 2 percent on a constant currency basis. [Shows slide 7 and 8 below]
Excluding the impact of a one-time tax benefit in the fourth quarter of 2014, operating earnings were up 32 percent on a constant currency basis.
For the full year 2015, MetLife delivered operating earnings of 5.5 billion dollars, down 16 percent over 2014, and 12 percent on a constant currency basis. This decrease reflects a previously announced third quarter non-cash charge of 792 million dollars, a strong U.S. dollar, and lower variable investment income. On a per share basis, 2015 operating earnings were 4 dollars and 86 cents, down 15 percent over 2014.
Full year 2015 net income was 5.2 billion dollars, or 4 dollars and 57 cents per share.
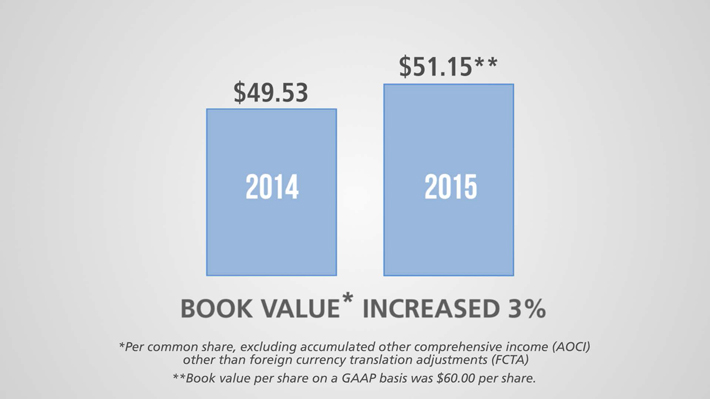
Book value per common share was up 3 percent from year-end 2014 to 51 dollars and 15 cents at year end. [Shows slide 9 below]
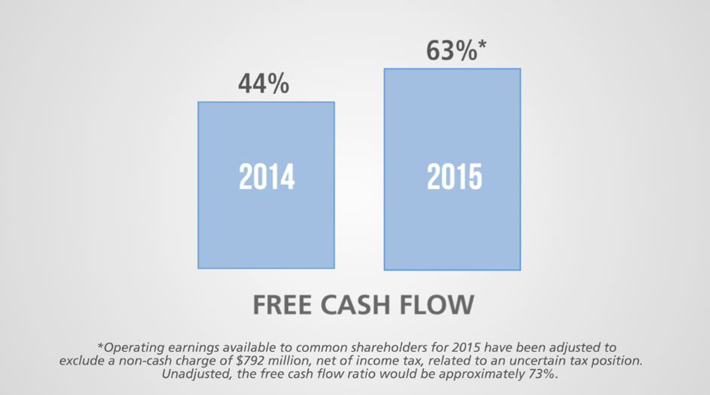
The ratio of free cash flow to adjusted operating earnings increased to 63 percent in 2015 from 44 percent in 2014. [Shows slide 10 below]
So far in 2016, markets are unsettled and we are faced with continuing economic challenges. However, we remain intently focused on growth opportunities, delivering a world-class customer experience, and increasing value to our shareholders.
Thank you for watching. [Shows slide 11 below]
Slide 1
Slide 2
Slide 3
Slide 4
Slide 5
Slide 6
Slide 7

Slide 8
Slide 9
Slide 10
Slide 11