Attached files
| file | filename |
|---|---|
| EX-21 - EXHIBIT 21 - FULLER H B CO | ex21.htm |
| EX-24 - EXHIBIT 24 - FULLER H B CO | ex24.htm |
| EX-23 - EXHIBIT 23 - FULLER H B CO | ex23.htm |
| EX-31.2 - EXHIBIT 31.2 - FULLER H B CO | ex31-2.htm |
| EX-32.2 - EXHIBIT 32.2 - FULLER H B CO | ex32-2.htm |
| EX-32.1 - EXHIBIT 32.1 - FULLER H B CO | ex32-1.htm |
| EX-31.1 - EXHIBIT 31.1 - FULLER H B CO | ex31-1.htm |
UNITED STATES
SECURITIES AND EXCHANGE COMMISSION
Washington, D.C. 20549
FORM 10-K
(Mark One)
[X] ANNUAL REPORT PURSUANT TO SECTION 13 OR 15(d) OF THE
SECURITIES EXCHANGE ACT OF 1934
For the fiscal year ended November 28, 2015
OR
[ ] TRANSITION REPORT PURSUANT TO SECTION 13 OR 15(d) OF THE
SECURITIES EXCHANGE ACT OF 1934
For the transition period from _____________ to _____________
Commission file number: 001-09225
H.B. FULLER COMPANY
(Exact name of registrant as specified in its charter)
|
Minnesota (State or other jurisdiction of incorporation or organization) |
41-0268370 (I.R.S. Employer Identification No.) |
|
1200 Willow Lake Boulevard, St. Paul, Minnesota (Address of principal executive offices) |
55110-5101 (Zip Code) |
| Registrant’s telephone number, including area code: (651) 236-5900
Securities registered pursuant to Section 12(b) of the Act: |
|
|
Title of each class |
Name of each exchange on which registered |
|
Common Stock, par value $1.00 per share |
New York Stock Exchange |
|
Preferred Stock Purchase Rights |
New York Stock Exchange |
Securities registered pursuant to Section 12(g) of the Act: none
Indicate by check mark if the registrant is a well-known seasoned issuer, as defined in Rule 405 of the Securities Act. [X] Yes [ ] No
Indicate by check mark if the registrant is not required to file reports pursuant to Section 13 or Section 15(d) of the Act. [ ] Yes [X] No
Indicate by check mark whether the registrant (1) has filed all reports required to be filed by Section 13 or 15(d) of the Securities Exchange Act of 1934 during the preceding 12 months (or for such shorter period that the registrant was required to file such reports), and (2) has been subject to such filing requirements for the past 90 days. [X] Yes [ ] No
Indicate by check mark whether the registrant has submitted electronically and posted on its corporate Web site, if any, every Interactive Data File required to be submitted and posted pursuant to Rule 405 of Regulation S-T during the preceding 12 months (or for such shorter period that the registrant was required to submit and post such files). [X] Yes [ ] No
Indicate by check mark if disclosure of delinquent filers pursuant to Item 405 of Regulation S-K is not contained herein, and will not be contained, to the best of registrant’s knowledge, in definitive proxy or information statements incorporated by reference in Part III of this Form 10-K or any amendment to the Form 10-K. [ ]
Indicate by check mark whether the registrant is a large accelerated filer, an accelerated filer, a non-accelerated filer, or a smaller reporting company. See the definitions of “large accelerated filer”, “accelerated filer” and “smaller reporting company” in Rule 12b-2 of the Exchange Act. (Check one):
|
Large accelerated filer [X] |
Accelerated filer [ ] |
|
Non-accelerated filer [ ] (Do not check if a smaller reporting company) |
Smaller reporting company [ ] |
Indicate by check mark whether the registrant is a shell company (as defined in Rule 12b-2 of the Act). [ ] Yes [X] No
The aggregate market value of the Common Stock, par value $1.00 per share, held by non-affiliates of the registrant as of May 30, 2015 was approximately $2,108,178,575 (based on the closing price of such stock as quoted on the New York Stock Exchange of $42.11 on such date).
The number of shares outstanding of the Registrant’s Common Stock, par value $1.00 per share, was 50,075,532 as of January 21, 2016.
DOCUMENTS INCORPORATED BY REFERENCE
Part III incorporates information by reference to portions of the registrant’s Proxy Statement for the Annual Meeting of Shareholders to be held on April 7, 2016.
H.B. FULLER COMPANY
2015 Annual Report on Form 10-K
Table of Contents
|
PART I |
||
|
Item 1. |
Business |
3 |
|
Item 1A. |
Risk Factors |
7 |
|
Item 1B. |
Unresolved Staff Comments |
10 |
|
Item 2. |
Properties |
10 |
|
Item 3. |
Legal Proceedings |
11 |
|
Item 4. |
Mine Safety Disclosures |
12 |
|
| ||
|
PART II |
| |
|
Item 5. |
Market for Registrant’s Common Equity, Related Stockholder Matters and Issuer Purchases of Equity Securities |
12 |
|
Item 6. |
Selected Financial Data | 14 |
|
Item 7. |
Management’s Discussion and Analysis of Financial Condition and Results of Operations |
15 |
|
Item 7A. |
Quantitative and Qualitative Disclosures About Market Risk |
33 |
|
Item 8. |
Financial Statements and Supplementary Data |
35 |
|
Item 9. |
Changes in and Disagreements with Accountants on Accounting and Financial Disclosure |
77 |
|
Item 9A. |
Controls and Procedures |
77 |
|
Item 9B. |
Other Information |
78 |
|
| ||
|
PART III |
| |
|
Item 10. |
Directors, Executive Officers and Corporate Governance |
78 |
|
Item 11. |
Executive Compensation |
78 |
|
Item 12. |
Security Ownership of Certain Beneficial Owners and Management and Related Stockholder Matters |
78 |
|
Item 13. |
Certain Relationships and Related Transactions and Director Independence |
78 |
|
Item 14. |
Principal Accountant Fees and Services |
78 |
|
| ||
|
PART IV |
| |
|
Item 15. |
Exhibits and Financial Statement Schedules |
79 |
|
Signatures |
82 |
PART I
Item 1. Business
H.B. Fuller Company was founded in 1887 and incorporated as a Minnesota corporation in 1915. Our stock is traded on the New York Stock Exchange (NYSE) under the ticker symbol FUL. As used herein, “H.B. Fuller”, “we”, “us”, “our”, “management” or “company” includes H.B. Fuller and its subsidiaries unless otherwise indicated. Where we refer to 2015, 2014 and 2013 herein, the reference is to our fiscal years ended November 28, 2015, November 29, 2014 and November 30, 2013, respectively.
We are a leading worldwide formulator, manufacturer and marketer of adhesives, sealants and other specialty chemical products. Sales operations span 36 countries in North America, Europe, Latin America, the Asia Pacific region, India, the Middle East and Africa. Industrial adhesives represent our core product offering. Customers use our adhesives products in manufacturing common consumer and industrial goods, including food and beverage containers, disposable diapers, windows, doors, flooring, appliances, sportswear, footwear, multi-wall bags, water filtration products, insulation, textiles and electronics. Our adhesives help improve the performance of our customers’ products or improve their manufacturing processes. We also provide our customers with technical support and unique solutions designed to address their specific needs. We have established a variety of product offerings for residential construction markets, such as tile-setting adhesives, grout, sealants and related products, which are sold primarily in our Construction Products operating segment.
Recent Acquisitions
On February 3, 2015 we acquired Continental Products Limited, a provider of industrial adhesives, based in Nairobi, Kenya for $1.6 million. The acquisition supports our growth strategy for emerging markets and delivers specialty adhesive products to key customers in East and Central Africa.
On February 2, 2015 we acquired 95 percent of Tonsan Adhesive, Inc., an independent engineering adhesives provider based in Beijing, China for $215.9 million. The acquisition strengthens our customer relationships in the engineering adhesives markets. Concurrent with the acquisition, we entered into an agreement to acquire the remaining 5 percent of Tonsan’s equity beginning February 1, 2019 for 82 million Chinese renminbi or approximately $13.0 million. In addition, the agreement requires us to pay up to 418 million Chinese renminbi, or approximately $66.8 million, in contingent consideration based upon a formula related to Tonsan’s gross profit in fiscal 2018. The fair values of the agreement to purchase the remaining equity and the contingent consideration based upon a discounted cash flow model as of the date of acquisition were $11.8 million and $7.7 million, respectively.
Operating Segment Information
Our business is reported in four operating segments - Americas Adhesives, EIMEA (Europe, India, Middle East and Africa), Asia Pacific and Construction Products. In 2015, as a percentage of total net revenue by operating segment, Americas Adhesives was 42 percent, EIMEA 29 percent, Asia Pacific 18 percent and Construction Products 11 percent.
Our Americas Adhesives, EIMEA and Asia Pacific operating segments produce and supply industrial adhesives products for applications in various markets, including durable assembly (appliances, filters, construction, automotive, electronics, windows, doors, wood flooring, textile such as footwear, sportswear), packaging (food and beverage containers, flexible packaging, consumer goods, package integrity and re-enforcement, durable and non-durable goods), converting (corrugation, folding carton, tape and label, paper converting, envelopes, books, multi-wall bags, sacks, tissue and towel) and nonwoven and hygiene (disposable diapers, feminine care and medical garments). Our Construction Products operating segment includes products used for tile setting (adhesives, grouts, mortars, sealers, levelers), flooring, and heating, ventilation and air conditioning and insulation applications (duct sealants, weather barriers and fungicidal coatings, block fillers).
The Americas Adhesives operating segment includes a full range of specialty adhesives such as thermoplastic, thermoset, reactive, water-based and solvent-based products. Sales are made primarily through a direct sales force with a smaller portion of sales through distributors.
The EIMEA operating segment is comprised of an adhesives component with the same range of products as the Americas Adhesives operating segment. EIMEA adhesives sales are made through both a direct sales force and distributors.
The Asia Pacific operating segment is similar to that of the Americas Adhesives operating segment, with one exception. The Asia Pacific operating segment also includes caulks and sealants for the consumer market and professional trade, sold through retailers, primarily in Australia. Other adhesives sales are made through a direct sales force and distributors.
The Construction Products operating segment provides floor preparation, grouts and mortars for tile setting as well as sealants and related products for heating, ventilation and air conditioning installations. Construction Products sales are made primarily through distributors, wholesalers, big box retailers and a direct sales force.
Financial information with respect to our operating segments and geographic areas is set forth in Note 14 to the Consolidated Financial Statements.
Non-U.S. Operations
The principal markets, products and methods of distribution outside the United States vary with each of our regional operations generally maintaining integrated business units that contain dedicated supplier networks, manufacturing, logistics and sales organizations. The vast majority of the products sold within any region are produced within the region, and the respective regions do not import significant amounts of product from other regions. At the end of 2015, we had sales offices and manufacturing plants in 20 countries outside the United States and satellite sales offices in another 15 countries.
We have detailed Code of Conduct policies that we apply across all of our operations around the world. This set of policies represents a set of common values that apply to all employees and all of our business dealings. We have adopted policies and processes, and conduct employee training, all of which are intended to ensure compliance with various economic sanctions and export controls, including the regulations of the U.S. Treasury Department’s Office of Foreign Assets Control (OFAC). We do not conduct any business in countries that are subject to U.S. economic sanctions such as Cuba, Iran, North Korea, Sudan and Syria.
Competition
Many of our markets are highly competitive. However, we compete effectively due to the quality and breadth of our adhesives, sealants and specialty chemical portfolio and the experience and expertise of our commercial organizations. Within the adhesives and other specialty chemical markets, we believe few suppliers have comparable global reach and corresponding ability to deliver quality and consistency to multinational customers. Our competition is made up generally of two types of companies: (1) similar multinational suppliers and (2) regional or specialty suppliers that typically compete in only one region or within a narrow geographic area within a region. The multinational competitors typically maintain a broad product offering and range of technology, while regional or specialty companies tend to have limited or more focused product ranges and technology.
Principal competitive factors in the sale of adhesives and other specialty chemicals are product performance, supply assurance, technical service, quality, price and customer service.
Customers
We have cultivated strong, integrated relationships with a diverse set of customers worldwide. Our customers are among the technology and market leaders in consumer goods, construction, and industrial markets. We pride ourselves on long-term, collaborative customer relationships and a diverse portfolio of customers in which no single customer accounted for more than 10 percent of consolidated net revenue.
Our leading customers include manufacturers of food and beverages, hygiene products, clothing, major appliances, electronics, automobiles, filters, construction materials, wood flooring, furniture, cabinetry, windows, doors, tissue and towel, corrugation, tube winding, packaging, labels and tapes.
Our products are delivered directly to customers primarily from our manufacturing plants, with additional deliveries made through distributors and retailers.
Backlog
No significant backlog of unfilled orders existed at November 28, 2015 or November 29, 2014.
Raw Materials
We use several principal raw materials in our manufacturing processes, including tackifying resins, polymers, synthetic rubbers, vinyl acetate monomer and plasticizers. We generally avoid sole source supplier arrangements for raw materials.
The majority of our raw materials are petroleum/natural gas based derivatives. Under normal conditions, raw materials are available on the open market. Prices and availability are subject to supply and demand market mechanisms. Raw material costs are primarily determined by the balance of supply against the aggregate demand from the adhesives industry and other industries that use the same raw material streams. The cost of crude oil and natural gas, the primary feedstocks for our raw materials, can also impact the cost of our raw materials.
Patents, Trademarks and Licenses
Much of the technology we use in our products and manufacturing processes is available in the public domain. For technology not available in the public domain, we rely on trade secrets and patents when appropriate to protect our competitive position. We also license some patented technology from other sources. Our business is not materially dependent upon licenses or similar rights or on any single patent or group of related patents.
We enter into agreements with many employees to protect rights to technology and intellectual property. Confidentiality commitments also are routinely obtained from customers, suppliers and others to safeguard proprietary information.
We own numerous trademarks and service marks in various countries. Trademarks, such as H.B. Fuller®, Swift®, Advantra®, Clarity®, Sesame®, TEC®, Plasticola®, Foster®, Rakoll®, Rapidex®, Full-CareTM, Liquamelt®, Thermonex®, Tile-Perfect® and TONSAN® are important in marketing products. Many of our trademarks and service marks are registered. U.S. trademark registrations are for a term of ten years and are renewable every ten years as long as the trademarks are used in the regular course of trade.
Research and Development
Our investment in research and development creates new and innovative adhesive technology platforms, enhances product performance, ensures a competitive cost structure and leverages available raw materials. New product development is a key research and development outcome, providing higher-value solutions to existing customers or meeting new customers’ needs. Projects are developed in local laboratories in each region, where we understand our customer base the best. Platform developments are coordinated globally through our network of laboratories.
Through designing and developing new polymers and new formulations, we expect to continue to grow in our current markets. We also develop new applications for existing products and technologies, and improve manufacturing processes to enhance productivity and product quality. Research and development efforts are closely aligned to customer needs, but we do not engage in customer sponsored activities. We foster open innovation, seek supplier-driven new technology and use relationships with academic and other institutions to enhance our capabilities.
Research and development expenses were $26.2 million, $21.2 million and $24.6 million in 2015, 2014 and 2013, respectively. Research and development costs are included in selling, general and administrative expenses.
Environmental, Health and Safety
We comply with applicable regulations relating to environmental protection and workers' safety. This includes regular review of and upgrades to environmental, health and safety policies, practices and procedures as well as improved production methods to minimize our facilities’ outgoing waste, based on evolving societal standards and increased environmental understanding.
Environmental expenditures to comply with environmental regulations over the next two years are estimated to be approximately $9.9 million, including approximately $1.9 million of capital expenditures. See additional disclosure under Item 3. Legal Proceedings.
Seasonality
Our Americas Adhesives, EIMEA and Construction Products operating segments have historically had lower net revenue in winter months, which is primarily our first fiscal quarter, partially due to the seasonal decline in construction activities. There also are many international holidays in our first quarter, reducing available shipping days.
Employees
We employed approximately 4,400 individuals on November 28, 2015, of which approximately 1,500 were located in the United States.
Executive Officers of the Registrant
The following table shows the name, age and business experience for the past five years of the executive officers as of January 15, 2016. Unless otherwise noted, the positions described are positions with the company or its subsidiaries.
|
Name |
Age |
Positions |
Period Served |
|
James J. Owens |
51 |
President and Chief Executive Officer Senior Vice President, Americas Senior Vice President, North America |
November 2010 - Present January 2010 - November 2010 September 2008 - January 2010 |
|
Heather A. Campe |
42 |
Vice President, Asia Pacific Vice President and General Manager, Asia Director, Business Nonwoven Director, Business Envelope, Graphic Arts & Tobacco |
June 2014 - Present January 2013 - May 2014 November 2010 - January 2013 March 2009 - October 2010 |
|
Elin E. Gabriel |
52 |
Vice President, Global Operations Chief Operating Officer, Alvogen (a multinational pharmaceuticals company) |
June 2014 - Present 2010 - 2013
|
|
James R. Giertz |
58 |
Executive Vice President, Chief Financial Officer Senior Vice President, Chief Financial Officer |
October 2013 - Present March 2008 - October 2013 |
|
Traci L. Jensen |
49 |
Senior Vice President, Americas Adhesives Vice President, Americas Adhesives Vice President, North America |
January 2013 - Present November 2011 - January 2013 2010 - 2011 |
|
Timothy J. Keenan |
58 |
Vice President, General Counsel and Corporate Secretary |
December 2006 - Present |
|
Steven Kenny |
54 |
Senior Vice President, Emerging Markets Senior Vice President, Europe, India, Middle East and Africa (EIMEA) |
June 2015 - Present October 2009 - June 2015 |
|
Patrick M. Kivits |
48 |
Senior Vice President, EIMEA Corporate Vice President and General Manager , Henkel Corporation (global manufacturer of adhesives, sealants and surface treatments) Vice President, Henkel AG & Co. KGaA |
September 2015 - Present 2013 - September 2015
2011 - 2013 |
|
Ann B. Parriott |
57 |
Vice President, Human Resources |
January 2006 - Present |
|
Hassan H. Rmaile |
38 |
Vice President, Chief Technology and Innovation Officer Chief Technology and Innovation Officer Global Vice President, Growth Platforms, Ashland Inc. (global manufacturer of specialty chemical products) |
July 2015 - Present October 2012 - July 2015 2011 – October 2012 |
|
Patrick J. Trippel |
56 |
Senior Vice President, Market Development Senior Vice President, Construction Materials Senior Vice President and General Manager, Global General Industries, Henkel Corporation (global manufacturer of adhesives, sealants and surface treatments) |
April 2013 - Present April 2011 - April 2013 2009 - 2011
|
The Board of Directors elects the executive officers annually.
Available Information
For more information about us, visit our website at: www.hbfuller.com.
We file annual, quarterly and current reports, proxy statements and other information with the Securities and Exchange Commission (SEC) via EDGAR. Our SEC filings are available free of charge to the public at our website as soon as reasonably practicable after they have been filed with or furnished to the SEC.
Item 1A. Risk Factors
As a global manufacturer of adhesives, sealants and other specialty chemical products, we operate in a business environment that is subject to various risks and uncertainties. Below are the most significant factors that could adversely affect our business, financial condition and results of operations.
Adverse conditions in the global economy could negatively impact our customers and therefore our financial results.
An economic downturn in the businesses or geographic areas in which we sell our products could reduce demand for these products and result in a decrease in sales volume that could have a negative impact on our results of operations. Product demand often depends on end-use markets. Economic conditions that reduce consumer confidence or discretionary spending may reduce product demand. Challenging economic conditions may also impair the ability of customers to pay for products they have purchased, and as a result, our reserves for doubtful accounts and write-offs of accounts receivable may increase.
Increases in prices and declines in the availability of raw materials could negatively impact our financial results.
In 2015, raw material costs made up over 75 percent of our cost of sales. Accordingly, changes in the cost of raw materials can significantly impact our earnings. Raw materials needed to manufacture products are obtained from a number of suppliers and many of the raw materials are petroleum and natural gas based derivatives. Under normal market conditions, these raw materials are generally available on the open market from a variety of producers. While alternate supplies of most key raw materials are available, supplier production outages may lead to strained supply-demand situations for certain raw materials. The substitution of key raw materials requires us to identify new supply sources, reformulate, retest and may require seeking re-approval from our customers using those products. From time to time, the prices and availability of these raw materials may fluctuate, which could impair our ability to procure necessary materials, or increase the cost of manufacturing products. If the prices of raw materials increase in a short period of time, we may be unable to pass these increases on to our customers in a timely manner and could experience reductions to our profit margins. Based on 2015 financial results, a hypothetical one percent change in our raw material costs would have resulted in a change in net income of approximately $7.3 million or $0.14 per diluted share.
Uncertainties in foreign social, political and economic conditions and fluctuations in foreign currency may adversely affect our results.
Approximately 57 percent, or $1.2 billion, of our net revenue was generated outside the United States in 2015. International operations could be adversely affected by changes in social, political and economic conditions, especially in the Middle East, Russia, China and other developing or emerging markets where we do business. The Tonsan aquisition significantly increased our net revenue in China, thus increasing our potential exposure to changes in its social, political and economic conditions. In addition, trade protection measures, anti-bribery and anti-corruption regulations, restrictions on repatriation of earnings, differing intellectual property rights and changes in legal and regulatory requirements that restrict the sales of products or increase costs could adversely affect our results of operations.
Fluctuations in exchange rates between the U.S. dollar and other currencies could potentially result in increases or decreases in net revenue, cost of raw materials and earnings and may adversely affect the value of our assets outside the United States. In 2015 the change in foreign currencies negatively impacted our net revenue by approximately $126.0 million. In 2015 we spent approximately $1.2 billion for raw materials worldwide of which approximately $638.8 million was purchased outside the United States. Based on 2015 financial results, a hypothetical one percent change in our cost of sales due to foreign currency rate changes would have resulted in a change in net income of approximately $5.2 million or $0.10 per diluted share. Although we utilize risk management tools, including hedging, as appropriate, to mitigate market fluctuations in foreign currencies, any changes in strategy in regard to risk management tools can also affect sales revenue, expenses and results of operations and there can be no assurance that such measures will result in cost savings or that all market fluctuation exposure will be eliminated.
We experience substantial competition in each of the operating segments and geographic areas in which we operate.
Our wide variety of products are sold in numerous markets, each of which is highly competitive. Our competitive position in markets is, in part, subject to external factors. For example, supply and demand for certain of our products is driven by end-use markets and worldwide capacities which, in turn, impact demand for and pricing of our products. Many of our direct competitors are part of large multinational companies and may have more resources than we do. Any increase in competition may result in lost market share or reduced prices, which could result in reduced profit margins. This may impair the ability to grow or even to maintain current levels of revenues and earnings. While we have an extensive customer base, loss of certain top customers could adversely affect our financial condition and results of operations until such business is replaced, and no assurances can be made that we would be able to regain or replace any lost customers.
Failure to develop new products and protect our intellectual property could negatively impact our future performance and growth.
Ongoing innovation and product development are important factors in our competitiveness. Failure to create new products and generate new ideas could negatively impact our ability to grow and deliver strong financial results. We continually apply for and obtain U.S. and foreign patents to protect the results of our research for use in our operations and licensing. We are party to a substantial number of patent licenses and other technology agreements. We rely on patents, confidentiality agreements and internal security measures to protect our intellectual property. Failure to protect this intellectual property could negatively affect our future performance and growth.
We may be required to record impairment charges on our long-lived assets.
Weak demand may cause underutilization of our manufacturing capacity or elimination of product lines; contract terminations or customer shutdowns may force sale or abandonment of facilities and equipment; or other events associated with weak economic conditions or specific product or customer events may require us to record an impairment on tangible assets, such as facilities and equipment, as well as intangible assets, such as intellectual property or goodwill, which would have a negative impact on our financial results.
We have lawsuits and claims against us with uncertain outcomes.
Our operations from time to time are parties to or targets of lawsuits, claims, investigations and proceedings, including product liability, personal injury, asbestos, patent and intellectual property, commercial, contract, environmental, antitrust, health and safety, and employment matters, which are handled and defended in the ordinary course of business. The results of any future litigation or settlement of such lawsuits and claims are inherently unpredictable, but such outcomes could be adverse and material in amount. See Item 3. Legal Proceedings for a discussion of current litigation.
Costs and expenses resulting from compliance with environmental laws and regulations may negatively impact our operations and financial results.
We are subject to numerous environmental laws and regulations that impose various environmental controls on us or otherwise relate to environmental protection, the sale and export of certain chemicals or hazardous materials, and various health and safety matters. The costs of complying with these laws and regulations can be significant and may increase as applicable requirements and their enforcement become more stringent and new rules are implemented. Adverse developments and/or periodic settlements could negatively impact our results of operations and cash flows. See Item 3. Legal Proceedings for a discussion of current environmental matters.
Additional income tax expense or exposure to additional income tax liabilities could have a negative impact on our financial results.
We are subject to income tax laws and regulations in the United States and various foreign jurisdictions. Significant judgment is required in evaluating and estimating our provision and accruals for these taxes. Our income tax liabilities are dependent upon the location of earnings among these different jurisdictions. Our income tax provision and income tax liabilities could be adversely affected by the jurisdictional mix of earnings, changes in valuation of deferred tax assets and liabilities and changes in tax laws and regulations. In the ordinary course of our business, we are also subject to continuous examinations of our income tax returns by tax authorities. Although we believe our tax estimates are reasonable, the final results of any tax examination or related litigation could be materially different from our related historical income tax provisions and accruals. Adverse developments in an audit, examination, litigation related to previously filed tax returns, or in the relevant jurisdiction’s tax laws, regulations, administrative practices, principles and interpretations could have a material effect on our results of operations and cash flows in the period or periods for which that development occurs, as well as for prior and subsequent periods.
Distressed financial markets may result in dramatic deflation of asset valuations and a general disruption in capital markets.
Adverse equity market conditions and volatility in the credit markets could have a negative impact on the value of our pension trust assets and our future estimated pension liabilities, and other postretirement benefit plans. In addition, we could be required to provide increased pension plan funding. As a result, our financial results could be negatively impacted. Reduced access to capital markets may affect our ability to invest in strategic growth initiatives such as acquisitions. In addition, the reduced credit availability could limit our customers’ ability to invest in their businesses, refinance maturing debt obligations, or meet their ongoing working capital needs. If these customers do not have sufficient access to the financial markets, demand for our products may decline.
Catastrophic events could disrupt our operations or the operations of our suppliers or customers, having a negative impact on our financial results.
Unexpected events, including natural disasters and severe weather events, fires or explosions at our facilities or those of our suppliers, acts of war or terrorism, supply disruptions or breaches of security of our information technology systems could increase the cost of doing business or otherwise harm our operations, our customers and our suppliers. Such events could reduce demand for our products or make it difficult or impossible for us to receive raw materials from suppliers and deliver products to our customers.
A failure in our information technology systems could negatively impact our business.
We rely on information technology to record and process transactions, manage our business and maintain the financial accuracy of our records. Our computer systems are subject to damage or interruption from various sources, including power outages, computer and telecommunications failures, computer viruses, security breaches, vandalism, catastrophic events and human error. Interruptions of our computer systems could disrupt our business and could result in the loss of business and cause us to incur additional expense.
Information technology security threats are increasing in frequency and sophistication. Our information technology systems could be breached by unauthorized outside parties or misused by employees or other insiders intent on extracting sensitive information, corrupting information or disrupting business processes. Such unauthorized access could compromise confidential information, disrupt our business, harm our reputation, result in the loss of assets, customer confidence and business and have a negative impact on our financial results.
We are in the process of implementing a global Enterprise Resource Planning (ERP) system, which we refer to as Project ONE, that will upgrade and standardize our information system. The implementation is expected to occur in phases over the next several years. The North America adhesives business went live in 2014, and the implementation process proved to be more difficult than we originally anticipated resulting in disruptions in our manufacturing network, lower productivity and deteriorated customer service levels. By the end of 2014, most of the problems associated with the software implementation had been remediated and the business was stable and running at capacity with productivity levels approaching the levels experienced prior to the new software implementation.
In late 2014, we suspended any further implementation projects in other geographic regions until we complete the optimization of the current platform in North America. We are preparing a revised implementation plan that leverages the experiences of our first go-live event and reduces the risk of significant business interruption. We expect to start subsequent implementations in the second half of 2016 with completion of the second phase expected in early 2017.
Any delays or other failure to achieve our implementation goals may adversely impact our financial results. In addition, the failure to either deliver the application on time or anticipate the necessary readiness and training needs could lead to business disruption and loss of business. Failure or abandonment of any part of the ERP system could result in a write-off of part or all of the costs that have been capitalized on the project.
The inability to attract and retain qualified personnel could adversely impact our business.
Sustaining and growing our business depends on the recruitment, development and retention of qualified employees. The inability to recruit and retain key personnel or the unexpected loss of key personnel may adversely affect our operations.
The inability to make or effectively integrate future acquisitions may affect our results.
As part of our growth strategy, we intend to pursue additional acquisitions of complementary businesses or products and joint ventures. The ability to grow through acquisitions or joint ventures depends upon our ability to identify, negotiate, complete and integrate suitable acquisitions or joint venture arrangements. If we fail to successfully integrate acquisitions into our existing business, our results of operations and our cash flows could be adversely affected.
Item 1B. Unresolved Staff Comments
None.
Item 2. Properties
Principal executive offices and central research facilities are located in the St. Paul, Minnesota area. These facilities are company-owned and contain 247,630 square feet. Manufacturing operations are carried out at 21 plants located throughout the United States and at 24 plants located in 19 other countries. In addition, numerous sales and service offices are located throughout the world. We believe that the properties owned or leased are suitable and adequate for our business. Operating capacity varies by product line, but additional production capacity is available for most product lines by increasing the number of shifts worked. The following is a list of our manufacturing plants as of November 28, 2015 (each of the listed properties are owned by us, unless otherwise specified):
|
Region |
Manufacturing Sq Ft |
Region |
Manufacturing Sq Ft | |||
|
Americas Adhesives |
Asia Pacific |
|||||
|
California - Roseville |
82,202 |
Australia - Dandenong South, VIC |
71,280 | |||
|
Georgia - Covington |
73,500 |
Republic of China - Beijing |
78,120 | |||
|
- Norcross1 |
21,755 |
- Beijing1 |
5,597 | |||
|
- Tucker |
69,000 |
- Guangzhou |
36,055 | |||
|
Illinois - Seneca |
24,621 |
- Nanjing |
55,224 | |||
|
Kentucky - Paducah |
252,500 |
- Suzhou |
73,622 | |||
|
Michigan - Grand Rapids |
65,689 |
- Yantai |
23,890 | |||
|
Minnesota - Fridley |
15,850 |
Malaysia - Selongor |
21,900 | |||
|
- Vadnais Heights |
53,145 |
Philippines - Manila |
9,295 | |||
|
Ohio - Blue Ash |
102,000 |
Asia Pacific Total |
374,983 | |||
|
Texas - Mesquite |
25,000 |
|||||
|
Washington - Vancouver |
35,768 |
EIMEA |
||||
|
Argentina - Buenos Aires |
10,367 |
Austria - Wels1, 2 |
66,500 | |||
|
Brazil - Sorocaba, SP2 |
7,535 |
Egypt - 6th of October City |
8,525 | |||
|
- Curitiba1 |
9,896 |
Finland - Espoo |
5,575 | |||
|
Chile - Maipu, Santiago |
64,099 |
France - Blois |
48,438 | |||
|
Colombia - Rionegro |
17,072 |
- Surbourg |
21,743 | |||
|
Americas Adhesives Total |
929,999 |
Germany - Lueneburg |
64,249 | |||
|
- Nienburg |
139,248 | |||||
|
Construction Products |
- Pirmasens2 |
48,438 | ||||
|
California - La Mirada |
15,206 |
Greece - Lamia |
11,560 | |||
|
Florida - Gainesville |
6,800 |
India - Pune |
38,782 | |||
|
Georgia - Dalton |
72,000 |
Italy - Borgolavezzaro2 |
24,219 | |||
|
Illinois - Aurora |
149,000 |
- Pianezze |
36,500 | |||
|
- Palatine |
55,000 |
Portugal - Mindelo |
90,193 | |||
|
New Jersey - Edison |
9,780 |
Spain - Vigo² |
19,375 | |||
|
Pennsylvania - Fairless Hills |
19,229 |
United Kingdom - Dukinfield |
17,465 | |||
|
Texas - Eagle Lake |
26,000 |
EIMEA Total |
640,810 | |||
|
- Houston |
11,000 |
|||||
|
Construction Products Total |
364,015 |
|
1 Leased Property |
||||||
|
2 Idle Property |
Item 3. Legal Proceedings
Environmental Matters. From time to time, we become aware of compliance matters relating to, or receive notices from, federal, state or local entities regarding possible or alleged violations of environmental, health or safety laws and regulations. We review the circumstances of each individual site, considering the number of parties involved, the level of potential liability or our contribution relative to the other parties, the nature and magnitude of the hazardous substances involved, the method and extent of remediation, the estimated legal and consulting expense with respect to each site and the time period over which any costs would likely be incurred. Also, from time to time, we are identified as a potentially responsible party (PRP) under the Comprehensive Environmental Response, Compensation and Liability Act (CERCLA) and/or similar state laws that impose liability for costs relating to the clean up of contamination resulting from past spills, disposal or other release of hazardous substances. We are also subject to similar laws in some of the countries where current and former facilities are located. Our environmental, health and safety department monitors compliance with applicable laws on a global basis. To the extent we can reasonably estimate the amount of our probable liabilities for environmental matters, we establish a financial provision.
Currently we are involved in various environmental investigations, clean up activities and administrative proceedings and lawsuits. In particular, we are currently deemed a PRP in conjunction with numerous other parties, in a number of government enforcement actions associated with landfills and/or hazardous waste sites. As a PRP, we may be required to pay a share of the costs of investigation and clean up of these sites. In addition, we are engaged in environmental remediation and monitoring efforts at a number of current and former operating facilities. While uncertainties exist with respect to the amounts and timing of the ultimate environmental liabilities, based on currently available information, we have concluded that these matters, individually or in the aggregate, will not have a material adverse effect on our results of operations, financial condition or cash flow. However, adverse developments and/or periodic settlements could negatively impact the results of operations or cash flows in one or more future periods.
Other Legal Proceedings. From time to time and in the ordinary course of business, we are a party to, or a target of, lawsuits, claims, investigations and proceedings, including product liability, personal injury, contract, patent and intellectual property, environmental, health and safety, tax and employment matters. While we are unable to predict the outcome of these matters, we have concluded, based upon currently available information, that the ultimate resolution of any pending matter, individually or in the aggregate, including the asbestos litigation described in the following paragraphs, will not have a material adverse effect on our results of operations, financial condition or cash flow.
We have been named as a defendant in lawsuits in which plaintiffs have alleged injury due to products containing asbestos manufactured more than 30 years ago. The plaintiffs generally bring these lawsuits against multiple defendants and seek damages (both actual and punitive) in very large amounts. In many cases, plaintiffs are unable to demonstrate that they have suffered any compensable injuries or that the injuries suffered were the result of exposure to products manufactured by us. We are typically dismissed as a defendant in such cases without payment. If the plaintiff presents evidence indicating that compensable injury occurred as a result of exposure to our products, the case is generally settled for an amount that reflects the seriousness of the injury, the length, intensity and character of exposure to products containing asbestos, the number and solvency of other defendants in the case, and the jurisdiction in which the case has been brought.
A significant portion of the defense costs and settlements in asbestos-related litigation is paid by third parties, including indemnification pursuant to the provisions of a 1976 agreement under which we acquired a business from a third party. Currently, this third party is defending and paying settlement amounts, under a reservation of rights, in most of the asbestos cases tendered to the third party.
In addition to the indemnification arrangements with third parties, we have insurance policies that generally provide coverage for asbestos liabilities (including defense costs). Historically, insurers have paid a significant portion of our defense costs and settlements in asbestos-related litigation. However, certain of our insurers are insolvent. We have entered into cost-sharing agreements with our insurers that provide for the allocation of defense costs and settlements and judgments in asbestos-related lawsuits. These agreements require, among other things, that we fund a share of settlements and judgments allocable to years in which the responsible insurer is insolvent.
A summary of the number of and settlement amounts for asbestos-related lawsuits and claims is as follows:
|
Year Ended |
Year Ended |
Year Ended |
||||||||||
|
November 28, |
November 29, |
November 30, |
||||||||||
|
($ in millions) |
2015 |
2014 |
2013 |
|||||||||
|
Lawsuits and claims settled |
10 | 9 | 6 | |||||||||
|
Settlement amounts |
$ | 0.9 | $ | 0.8 | $ | 0.4 | ||||||
|
Insurance payments received or expected to be received |
$ | 0.7 | $ | 0.7 | $ | 0.3 | ||||||
We do not believe that it would be meaningful to disclose the aggregate number of asbestos-related lawsuits filed against us because relatively few of these lawsuits are known to involve exposure to asbestos-containing products that we manufactured. Rather, we believe it is more meaningful to disclose the number of lawsuits that are settled and result in a payment to the plaintiff. To the extent we can reasonably estimate the amount of our probable liabilities for pending asbestos-related claims, we establish a financial provision and a corresponding receivable for insurance recoveries.
Based on currently available information, we have concluded that the resolution of any pending matter, including asbestos-related litigation, individually or in the aggregate, will not have a material adverse effect on our results of operations, financial condition or cash flow. However, adverse developments and/or periodic settlements could negatively impact the results of operations or cash flows in one or more future periods.
Item 4. Mine Safety Disclosures
Not applicable.
Part II.
Item 5. Market for Registrant's Common Equity, Related Stockholder Matters and Issuer Purchases of Equity Securities
Our common stock is traded on the New York Stock Exchange under the symbol FUL. As of January 21, 2016, there were 1,805 common shareholders of record for our common stock. The following table shows the high and low sales price per share of our stock and the dividends declared for the fiscal quarters.
|
High and Low Sales Price |
||||||||||||||||||||||||
|
2015 |
2014 |
Dividends (Per Share) |
||||||||||||||||||||||
|
High |
Low |
High |
Low |
2015 |
2014 |
|||||||||||||||||||
|
First quarter |
$ | 45.99 | $ | 38.16 | $ | 53.31 | $ | 44.55 | $ | 0.120 | $ | 0.100 | ||||||||||||
|
Second quarter |
45.54 | 40.53 | 49.82 | 44.51 | 0.130 | 0.120 | ||||||||||||||||||
|
Third quarter |
48.32 | 34.57 | 51.27 | 43.75 | 0.130 | 0.120 | ||||||||||||||||||
|
Fourth quarter |
40.35 | 30.72 | 48.00 | 36.92 | 0.130 | 0.120 | ||||||||||||||||||
There are no significant contractual restrictions on our ability to declare or pay dividends. We currently expect that comparable dividends on our common stock will continue to be paid in the future.
Issuer Purchases of Equity Securities
Information on our purchases of equity securities during the fourth quarter of 2015 follows:
|
Period |
(a) Total Number of Shares Purchased1 |
(b) Average Price Paid per Share |
(c) Total Number of Shares Purchased as Part of a Publicly Announced Plan or Program |
(d) Maximum Approximate Dollar Value of Shares that may yet be Purchased Under the Plan or Program (thousands) |
||||||||||||
|
August 30, 2015 - October 3, 2015 |
180,064 | $ | 33.11 | 180,000 | $ | 56,004 | ||||||||||
|
October 4, 2015 - October 31, 2015 |
320,000 | $ | 34.71 | 320,000 | $ | 44,897 | ||||||||||
|
November 1, 2015 - November 28, 2015 |
194 | $ | 39.77 | - | $ | 44,897 | ||||||||||
1 The number of shares purchased relates to 258 shares withheld to satisfy employees’ withholding taxes upon vesting of restricted stock and 500,000 shares purchased under the 2010 share repurchase plan. See Note 9 to the Consolidated Financial Statements for more information.
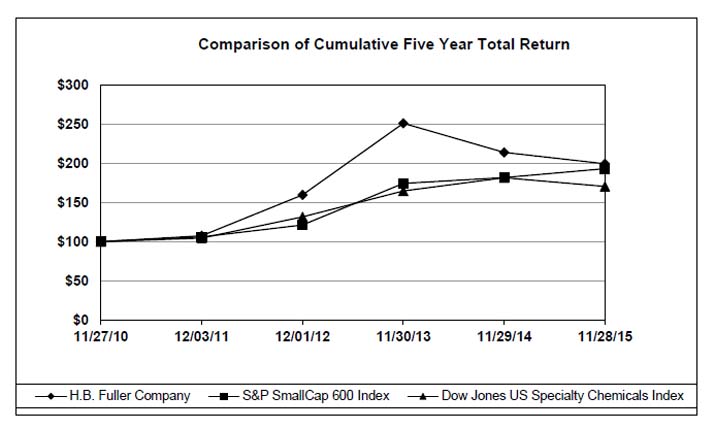
Total Shareholder Return Graph
The line graph below compares the cumulative total shareholder return on our common stock for the last five fiscal years with cumulative total return on the S&P SmallCap 600 Index and Dow Jones U.S. Specialty Chemicals Index. This graph assumes a $100 investment in each of H.B. Fuller, the S&P SmallCap 600 Index and the Dow Jones U.S. Specialty Chemicals Index at the close of trading on November 27, 2010, and also assumes the reinvestment of all dividends.
|
|
Item 6. Selected Financial Data
The following selected financial data has been derived from our audited Consolidated Financial Statements and should be read in conjunction with Management’s Discussion and Analysis of Financial Condition and Results of Operations and the Consolidated Financial Statements and related notes included elsewhere in the Form 10-K.
|
(Dollars in thousands, except per share amounts) |
Fiscal Years3 |
|||||||||||||||||||
|
2015 |
2014 |
2013 |
2012 |
2011 | ||||||||||||||||
|
Net revenue |
$ | 2,083,660 | $ | 2,104,454 | $ | 2,046,968 | $ | 1,886,239 | $ | 1,444,085 | ||||||||||
|
Income from continuing operations1 |
$ | 88,397 | $ | 50,151 | $ | 95,975 | $ | 68,287 | $ | 80,215 | ||||||||||
|
Percent of net revenue |
4.2 | 2.4 | 4.7 | 3.6 | 5.6 | |||||||||||||||
|
Total assets |
$ | 2,042,252 | $ | 1,869,006 | $ | 1,873,028 | $ | 1,786,320 | $ | 1,227,709 | ||||||||||
|
Long-term debt, excluding current maturities |
$ | 669,606 | $ | 547,735 | $ | 472,315 | $ | 475,112 | $ | 179,611 | ||||||||||
|
Total H.B. Fuller stockholders' equity |
$ | 872,920 | $ | 890,047 | $ | 930,065 | $ | 778,273 | $ | 705,204 | ||||||||||
|
Per Common Share: |
||||||||||||||||||||
|
Income from continuing operations: |
||||||||||||||||||||
|
Basic |
$ | 1.75 | $ | 1.00 | $ | 1.92 | $ | 1.37 | $ | 1.64 | ||||||||||
|
Diluted |
$ | 1.71 | $ | 0.97 | $ | 1.87 | $ | 1.34 | $ | 1.61 | ||||||||||
|
Dividends declared and paid |
$ | 0.510 | $ | 0.460 | $ | 0.385 | $ | 0.330 | $ | 0.295 | ||||||||||
|
Book value4 |
$ | 17.43 | $ | 17.69 | $ | 18.52 | $ | 15.60 | $ | 14.26 | ||||||||||
|
Number of employees |
4,425 | 3,650 | 3,676 | 3,727 | 2,754 | |||||||||||||||
|
1 2015, 2014, 2013, 2012 and 2011 include after-tax charges of $4.7 million, $45.2 million, $35.3 million, $35.4 million and $5.8 million, respectively, related to special charges, net. | ||||||||||
|
2 2011 contained 53 weeks | ||||||||||
|
3 All amounts have been adjusted for discontinued operations. | ||||||||||
|
4 Book value is calculated by dividing total H.B. Fuller stockholders' equity by the number of common stock shares outstanding as of our fiscal year end. |
Item 7. Management's Discussion and Analysis of Financial Condition and Results of Operations
Overview
H.B. Fuller Company is a global formulator, manufacturer and marketer of adhesives and other specialty chemical products. We manage our business through four operating segments - Americas Adhesives, EIMEA (Europe, India, Middle East and Africa), Asia Pacific and Construction Products.
The Americas Adhesives, EIMEA and Asia Pacific operating segments manufacture and supply adhesives products in the assembly, packaging, converting, nonwoven and hygiene, performance wood, flooring, textile, flexible packaging, graphic arts, envelope, automotive and electronics markets. The Construction Products operating segment provides floor preparation, grouts and mortars for tile setting as well as sealants and related products for heating, ventilation and air conditioning installations.
The integration of the industrial adhesives business we acquired in March 2012 involved a significant amount of restructuring and capital investment to optimize the new combined entity. In addition to this acquisition, we announced our intentions to take a series of actions in our existing EIMEA operating segment to improve the profitability and future growth prospects of this operating segment. We combined these two initiatives into a single project which we refer to as the Business Integration Project.
Total Company: When reviewing our financial statements, it is important to understand how certain external factors impact us. These factors include:
|
● |
Changes in the prices of our raw materials that are primarily derived from refining crude oil and natural gas |
|
● |
Global supply of and demand for raw materials |
|
● |
Economic growth rates, and |
|
● |
Currency exchange rates compared to the U.S. dollar |
We purchase thousands of raw materials, the majority of which are petroleum/natural gas derivatives. The price of these derivatives impact the cost of our raw materials. However, the supply of and demand for key raw materials has a greater impact on our costs. As demand increases in high-growth areas, the supply of key raw materials may tighten, resulting in certain materials being put on allocation. Natural disasters, such as hurricanes, also can have an impact as key raw material producers are shut down for extended periods of time. We continually monitor capacity utilization figures, market supply and demand conditions, feedstock costs and inventory levels, as well as derivative and intermediate prices, which affect our raw materials. With over 75 percent of our cost of sales accounted for by raw materials, our financial results are extremely sensitive to changing costs in this area.
In 2015, we generated 43 percent of our net revenue in the United States and 29 percent in EIMEA. The pace of economic growth in these areas directly impacts certain industries to which we supply products. For example, adhesives-related revenues from durable goods customers in areas such as appliances, furniture and other woodworking applications tend to fluctuate with the overall economic activity. In business components such as Construction Products and insulating glass, revenues tend to move with more specific economic indicators such as housing starts and other construction-related activity.
The movement of foreign currency exchange rates as compared to the U.S. dollar impacts the translation of the foreign entities’ financial statements into U.S. dollars. As foreign currencies weaken against the dollar, our revenues and costs decrease as the foreign currency-denominated financial statements translate into fewer dollars. The fluctuations of the Euro against the U.S. dollar have the largest impact on our financial results as compared to all other currencies. In 2015, the currency fluctuations had a negative impact on net revenue of approximately $126.0 million as compared to 2014.
Key financial results and transactions for 2015 included the following:
|
● |
Net revenue decreased 1.0 percent from 2014 primarily driven by a 6.0 percent decrease in currency offset by a 4.5 percent increase in sales volume and a 0.5 percent increase in product pricing. |
|
● |
Gross profit margin increased to 27.3 percent from 25.3 percent in 2014. |
|
● |
Cash flow generated by operating activities from continuing operations was $210.5 million in 2015 as compared to $29.7 million in 2014 and $132.7 million in 2013. |
|
|
● |
We acquired 95 percent of the equity of Tonsan Adhesive, Inc. on February 2, 2015 for $215.9 million. |
The global economic conditions were mixed in 2015. We experienced generally favorable end market conditions in Asian markets, particularly in China, and in the Construction Products related markets in North America. The end market conditions in China deteriorated in the second half of 2015 due to a reduced rate of growth. End market demand for our core adhesives products in the Americas and EIMEA were generally flat to slightly positive, with some end market segments up and others declining. Our total year constant currency sales growth, which we define as the combined variances from product pricing, sales volume and small acquisitions, increased 5.0 percent for 2015 compared to 2014.
In 2015 our diluted earnings per share from continuing operations was $1.71 per share compared to $0.97 per share in 2014 and $1.87 per share in 2013. The higher earnings per share from continuing operations in 2015 compared to 2014 resulted from lower special charges, lower business integration costs that were not classified as special charges, lower raw material costs and lower production inefficiencies related to the Business Integration Project and ERP system implementation costs in North America.
Special charges, net in 2015 were $4.7 million for costs related to the Business Integration Project. On an after-tax basis, the special charges, net resulted in a $4.7 million negative impact on net income and a negative $0.09 effect on diluted earnings per share. Special charges, net in 2014 were $51.5 million for costs related to the Business Integration Project. On an after-tax basis, the special charges, net resulted in a $45.2 million negative impact on net income and a negative $0.88 effect on diluted earnings per share. In 2013 we had special charges, net of $45.1 million for costs related to the Business Integration Project. On an after-tax basis, the special charges, net resulted in a $35.3 million negative impact on net income and a negative $0.69 effect on diluted earnings per share. See Note 5 to the Consolidated Financial Statements for more information.
Project ONE: In December of 2012 our Board of Directors approved a multi-year project to replace and enhance our existing core information technology platforms. The scope for this project includes most of the basic transaction processing for the company including customer orders, procurement, manufacturing, and financial reporting. The project envisions harmonized business processes for all of our operating segments supported with one standard software configuration. The execution of this project, which we refer to as Project ONE, is being supported by internal resources and consulting services.
During 2013 a project team was formed and the global blueprint for the software configuration was designed and built. In the latter half of 2013 and in the early months of 2014, the global blueprint was applied to the specific requirements of our North America adhesives business, the software was tested and the user groups were trained. On April 6, 2014, our North America adhesives business went live. The implementation process proved to be more difficult than we originally anticipated resulting in disruptions in our manufacturing network, lower productivity and deteriorated customer service levels. By the end of 2014, most of the problems associated with the software implementation had been remediated and the business was stable and running at capacity with productivity levels approaching the levels experienced prior to the new software implementation.
In late 2014 we suspended any further implementation projects in other geographic regions until we complete the optimization of the current platform in North America. We are preparing a revised implementation plan that leverages the experiences of our first go-live event and reduces the risk of significant business interruption. We expect to start subsequent implementations in 2016.
The original capital expenditure plan for Project ONE was approximately $60.0 million. In the fourth quarter of 2015, we received a cash settlement of $12.8 million as a result of an arbitration proceeding related to our initial implementation of Project ONE. Of this amount, $12.0 million was related to capital expenditures, which allowed us to reduce our total project-to-date capital expenditures to $31.3 million. Given the complexity of the initial implementation, we anticipate that the total investment to complete the project will exceed our original estimate. We will have a revised estimate of the total project costs and the expected completion timetable later in 2016 when the revised implementation plan is complete.
Our current plan is to proceed with the second phase implementation in our Latin America region with the project commencing in the second half of 2016 and completion expected in early 2017. Subsequent phases of the global implementation will be evaluated following the completion of this second implementation.
2016 Outlook: Our key long term financial metrics remain unchanged: constant currency revenue growth, Earnings Before Interest, Taxes, Depreciation and Amortization (EBITDA) margin, growth in earnings per share and Return on Invested Capital (ROIC). EBITDA is a non-GAAP financial measure defined on a consolidated basis as gross profit, less Selling, General and Administrative (SG&A) expense, plus depreciation expense, plus amortization expense. EBITDA excludes special charges, net. EBITDA margin is a non-GAAP financial measure defined as EBITDA divided by net revenue. ROIC is a non-GAAP financial measure defined as (gross profit less SG&A expense, less taxes at the effective tax rate plus income from equity method investments, calculated using trailing 12 month information) divided by (the sum of notes payable, current maturities of long-term debt, long-term debt, redeemable non-controlling interest and total equity).
In 2016 we expect modest constant currency revenue growth of about 4 percent, mainly supported by continued growth in our Asia Pacific and Construction Products segments. Our Asia Pacific segment will benefit from a full year of the acquired Tonsan business as well as continued end market expansion, though at a slower rate. We anticipate slightly positive constant currency revenue growth in the Americas Adhesives and EIMEA operating segments. We expect that the strengthening of the US dollar relative to various currencies will dampen our revenue growth rate in 2016 relative to 2015 by up to 3 percentage points. Our gross profit margin is expected to increase in 2016, primarily driven by continuous productivity improvement in our manufacturing network, especially in Europe, plus the carry over benefit of lower raw material costs that were realized in the second half of 2015. SG&A expenses should increase at a rate in line with the increase in net revenue. Overall, we expect our EBITDA margin to be approximately 14 percent for the full year.
We expect total 2016 capital expenditures to be approximately $60.0 million, slightly above our long term expectations of ongoing capital requirements of about 2 to 2.5 percent of net revenue.
Critical Accounting Policies and Significant Estimates: Management’s discussion and analysis of our results of operations and financial condition are based upon the Consolidated Financial Statements, which have been prepared in accordance with accounting principles generally accepted in the United States of America (U.S. GAAP). The preparation of these financial statements requires us to make estimates and judgments that affect the reported amounts of assets, liabilities, revenues and expenses and related disclosure of contingent assets and liabilities. We believe the critical accounting policies and areas that require the most significant judgments and estimates to be used in the preparation of the Consolidated Financial Statements are pension and other postretirement plan assumptions; goodwill impairment assessment; long-lived assets recoverability; product, environmental and other litigation liabilities; and income tax accounting.
Pension and Other Postretirement Plan Assumptions: We sponsor defined-benefit pension plans in both the U.S. and non-U.S. entities. Also in the U.S., we sponsor other postretirement plans for health care and life insurance benefits. Expenses and liabilities for the pension plans and other postretirement plans are actuarially calculated. These calculations are based on our assumptions related to the discount rate, expected return on assets, projected salary increases and health care cost trend rates. Note 10 to the Consolidated Financial Statements includes disclosure of assumptions employed in these measurements for both the non-U.S. and U.S. plans.
The discount rate assumption is determined using an actuarial yield curve approach, which results in a discount rate that reflects the characteristics of the plan. The approach identifies a broad population of corporate bonds that meet the quality and size criteria for the particular plan. We use this approach rather than a specific index that has a certain set of bonds that may or may not be representative of the characteristics of our particular plan. A higher discount rate reduces the present value of the pension obligations. The discount rate for the U.S. pension plan was 4.30 percent at November 28, 2015, as compared to 4.10 percent at November 29, 2014 and 4.77 percent at November 30, 2013. Net periodic pension cost for a given fiscal year is based on assumptions developed at the end of the previous fiscal year. A discount rate reduction of 0.5 percentage points at November 28, 2015 would increase U.S. pension and other postretirement plan expense approximately $0.3 million (pre-tax) in fiscal 2016. Discount rates for non-U.S. plans are determined in a manner consistent with the U.S. plan.
The expected long-term rate of return on plan assets assumption for the U.S. pension plan was 7.75 percent in 2015, 2014 and 2013. Our expected long-term rate of return on U.S. plan assets was based on our target asset allocation assumption of 60 percent equities and 40 percent fixed-income. Management, in conjunction with our external financial advisors, determines the expected long-term rate of return on plan assets by considering the expected future returns and volatility levels for each asset class that are based on historical returns and forward looking observations. For 2015 the expected long-term rate of return on the target equities allocation was 8.5 percent and the expected long-term rate of return on the target fixed-income allocation was 5.0 percent. The total plan rate of return assumption included an estimate of the effect of diversification and the plan expense. For 2016, the expected long-term rate of return on assets will continue to be 7.75 percent with an expected long-term rate of return on the target equities allocation of 8.5 percent and an expected long-term rate of return on target fixed-income allocation of 5.0 percent. A change of 0.5 percentage points for the expected return on assets assumption would impact U.S. net pension and other postretirement plan expense by approximately $2.0 million (pre-tax).
Management, in conjunction with our external financial advisors, uses the actual historical rates of return of the asset categories to assess the reasonableness of the expected long-term rate of return on plan assets. The most recent 10-year and 20-year historical equity returns are shown in the table below. Our expected rate of return on our total portfolio is consistent with the historical patterns observed over longer time frames.
|
U.S. Pension Plan Historical actual rates of return |
Total Portfolio |
Equities |
Fixed Income |
|||||||||
|
10-year period |
6.0 | % | 5.4 | % | 8.0 | % | ||||||
|
20-year period |
8.6 | % | 8.3 | % | (*)8.0 | % | ||||||
(*) Beginning in 2006, our target allocation migrated from 100 percent equities to our current allocation of 60 percent equities and 40 percent fixed-income. The historical actual rate of return for the fixed income of 8.0 percent is since inception (9 years, 11 months).
The expected long-term rate of return on plan assets assumption for non-U.S. pension plans was a weighted-average of 6.22 percent in 2015 compared to 6.17 percent in 2014 and 5.96 percent in 2013. The expected long-term rate of return on plan assets assumption used in each non-U.S. plan is determined on a plan-by-plan basis for each local jurisdiction and is based on expected future returns for the investment mix of assets currently in the portfolio for that plan. Management, in conjunction with our external financial advisors, develops expected rates of return for each plan, considers expected long-term returns for each asset category in the plan, reviews expectations for inflation for each local jurisdiction, and estimates the effect of active management of the plan’s assets. Our largest non-U.S. pension plans are in the United Kingdom and Germany. The expected long-term rate of return on plan assets for the United Kingdom was 6.75 percent and the expected long-term rate of return on plan assets for Germany was 5.75 percent. Management, in conjunction with our external financial advisors, uses actual historical returns of the asset portfolio to assess the reasonableness of the expected rate of return for each plan.
The projected salary increase assumption is based on historic trends and comparisons to the external market. Higher rates of increase result in higher pension expenses. As this rate is also a long-term expected rate, it is less likely to change on an annual basis. In the U.S., we have used the rate of 4.50 percent for 2015, 2014 and 2013. Benefits under the U.S. Pension Plan were locked-in as of May 31, 2011 and no longer include compensation increases. The 4.50 percent rate is for the supplemental executive retirement plan only.
Goodwill: Goodwill is the excess of cost of an acquired entity over the amounts assigned to assets acquired and liabilities assumed in a purchase business combination. Goodwill is assigned to reporting units at the date the goodwill is initially recorded. Once goodwill has been assigned to a reporting unit, it no longer retains its association with a particular acquisition, and all the activities within a reporting unit are available to support the value of goodwill. Accounting standards require us to test goodwill for impairment annually or more often if circumstances or events indicate a change in the estimated fair value may have occurred.
The goodwill impairment analysis is a two-step process. The first step used to identify potential impairment involves comparing each reporting unit’s estimated fair value to its carrying value, including goodwill. We use a discounted cash flow approach to estimate the fair value of our reporting units. Our judgment is required in developing the assumptions for the discounted cash flow model. These assumptions include revenue growth rates, profit margin percentages, discount rates, perpetuity growth rates, future capital expenditures and working capital requirements. If the estimated fair value of a reporting unit exceeds its carrying value, goodwill is considered to not be impaired. If the carrying value exceeds estimated fair value, there is an indication of potential impairment and the second step is performed to measure the amount of impairment.
The second step of the process, if required, involves the calculation of an implied fair value of goodwill for each reporting unit for which step one indicated impairment. The implied fair value of goodwill is determined in a manner similar to how goodwill is calculated in a business combination, by measuring the excess of the estimated fair value of the reporting unit as calculated in step one, over the estimated fair values of the individual assets, liabilities and identifiable intangibles as if the reporting unit was being acquired in a business combination. If the implied fair value of goodwill exceeds the carrying value of goodwill assigned to the reporting unit, there is no impairment. If the carrying value of goodwill assigned to a reporting unit exceeds the implied fair value of the goodwill, an impairment charge is recorded for the excess. An impairment loss cannot exceed the carrying value of goodwill assigned to a reporting unit, and the loss establishes a new basis in the goodwill. Subsequent reversal of goodwill impairment losses is not permitted.
In the fourth quarter of 2015, we conducted the required annual test of goodwill for impairment. We performed the goodwill impairment analysis on our reporting units by using a discount rate determined by management to result in the most representative fair value of the business as a whole. There were no indications of impairment in any of our reporting units. We also performed a sensitivity analysis by using a discount rate at the high end of our range to confirm the reasonableness of our goodwill impairment analysis. No indications of impairment in any of our reporting units were indicated by the sensitivity analysis.
Of the goodwill balance of $354.2 million as of November 28, 2015, $67.1 million is allocated to the Americas Adhesives reporting unit, $122.6 million is allocated to the EIMEA reporting unit, $143.7 million is allocated to the Asia Pacific reporting unit and $20.8 million is allocated to the Construction Products reporting unit. In all four of these reporting units, the calculated fair value substantially exceeded the carrying value of the net assets.
If the economy or business environment falter and we are unable to achieve our assumed revenue growth rates or profit margin percentages, our projections used would need to be remeasured, which could impact the carrying value of our goodwill in one or more of our reporting units. See Note 6 to the Consolidated Financial Statements.
Recoverability of Long-Lived Assets: The assessment of the recoverability of long-lived assets reflects our assumptions and estimates. Factors that we must estimate when performing impairment tests include sales volume, prices, inflation, currency exchange rates, tax rates and capital spending. Significant judgment is involved in estimating these factors, and they include inherent uncertainties. The measurement of the recoverability of these assets is dependent upon the accuracy of the assumptions used in making these estimates and how the estimates compare to the eventual future operating performance of the specific businesses to which the assets are attributed.
Judgments made by us include the expected useful lives of long-lived assets. The ability to realize undiscounted cash flows in excess of the carrying amounts of such assets is affected by factors such as the ongoing maintenance and improvement of the assets, changes in economic conditions and changes in operating performance.
Product, Environmental and Other Litigation Liabilities: As disclosed in Item 3. Legal Proceedings and in Note 1 and Note 12 to the Consolidated Financial Statements, we are subject to various claims, lawsuits and other legal proceedings. Reserves for loss contingencies associated with these matters are established when it is determined that a liability is probable and the amount can be reasonably estimated. The assessment of the probable liabilities is based on the facts and circumstances known at the time that the financial statements are being prepared. For cases in which it is determined that a liability is probable but only a range for the potential loss exists, the minimum amount of the range is recorded and subsequently adjusted as better information becomes available.
For cases in which insurance coverage is available, the gross amount of the estimated liabilities is accrued, and a receivable is recorded for any probable estimated insurance recoveries. A discussion of environmental, product and other litigation liabilities is disclosed in Item 3. Legal Proceedings and Note 12 to the Consolidated Financial Statements.
Based upon currently available facts, we do not believe that the ultimate resolution of any pending legal proceeding, individually or in the aggregate, will have a material adverse effect on our long-term financial condition. However, adverse developments and/or periodic settlements could negatively affect our results of operations or cash flows in one or more future quarters.
Income Tax Accounting: As part of the process of preparing the Consolidated Financial Statements, we are required to estimate income taxes in each of the jurisdictions in which we operate. The process involves estimating actual current tax expense along with assessing temporary differences resulting from differing treatment of items for book and tax purposes. These temporary differences result in deferred tax assets and liabilities, which are included in the Consolidated Balance Sheets. We record a valuation allowance to reduce our deferred tax assets to the amount that is more-likely-than-not to be realized. We have considered future taxable income and ongoing tax planning strategies in assessing the need for the valuation allowance. Increases in the valuation allowance result in additional expense to be reflected within the tax provision in the Consolidated Statements of Income. As of November 28, 2015, the valuation allowance to reduce deferred tax assets totaled $14.4 million.
We recognize tax benefits for tax positions for which it is more-likely-than-not that the tax position will be sustained by the applicable tax authority at the largest amount of tax benefit that is greater than fifty percent likely of being realized upon ultimate settlement. We do not recognize a financial statement benefit for a tax position that does not meet the more-likely-than-not threshold. We believe that our liabilities for income taxes reflect the most likely outcome. It is difficult to predict the final outcome or the timing of the resolution of any particular tax position. Future changes in judgment related to the resolution of tax positions will impact earnings in the quarter of such change. We adjust our income tax liabilities related to tax positions in light of changing facts and circumstances. Settlement with respect to a tax position would usually require cash. Based upon our analysis of tax positions taken on prior year returns and expected tax positions to be taken for the current year tax returns, we have identified gross uncertain tax positions of $4.9 million as of November 28, 2015.
We have not recorded U.S. deferred income taxes for certain of our non-U.S. subsidiaries undistributed earnings as such amounts are intended to be indefinitely reinvested outside of the U.S. Should we change our business strategies related to these non-U.S. subsidiaries, additional U.S. tax liabilities could be incurred. It is not practical to estimate the amount of these additional tax liabilities. See Note 8 to the Consolidated Financial Statements for further information on income tax accounting.
Acquisition Accounting: As we enter into business combinations we perform acquisition accounting requirements including the following:
|
|
● |
Identifying the acquirer, |
|
|
● |
Determining the acquisition date, |
|
|
● |
Recognizing and measuring the identifiable assets acquired and the liabilities assumed, and |
|
|
● |
Recognizing and measuring goodwill or a gain from a bargain purchase |
We complete valuation procedures, and record the resulting fair value of the acquired assets and assumed liabilities based upon the valuation of the business enterprise and the tangible and intangible assets acquired. Enterprise value allocation methodology requires management to make assumptions and apply judgment to estimate the fair value of assets acquired and liabilities assumed. If estimates or assumptions used to complete the enterprise valuation and estimates of the fair value of the acquired assets and assumed liabilities significantly differed from assumptions made, the resulting difference could materially affect the fair value of net assets.
The calculation of the fair value of the tangible assets, including property, plant and equipment utilizes the cost approach, which computes the cost to replace the asset, less accrued depreciation resulting from physical deterioration, functional obsolescence and external obsolescence. The calculation of the fair value of the identified intangible assets are determined using cash flow models following the income approach or a discounted market-based methodology approach. Significant inputs include estimated revenue growth rates, gross margins, operating expenses, estimated attrition rate, and a discount rate. Goodwill is recorded as the difference in the fair value of the acquired assets and assumed liabilities and the purchase price.
|
Results of Operations |
||||||||||||||||||||
|
Net revenue |
||||||||||||||||||||
|
($ in millions) |
2015 |
2014 |
2013 |
2015 vs 2014 |
2014 vs 2013 |
|||||||||||||||
|
Net revenue |
$ | 2,083.7 | $ | 2,104.5 | $ | 2,047.0 | (1.0% | ) | 2.8 | % | ||||||||||
Net revenue in 2015 decreased 1.0 percent from 2014. The 2014 net revenue was 2.8 percent higher than the net revenue in 2013. We review variances in net revenue in terms of changes related to product pricing, sales volume, changes in foreign currency exchange rates and major acquisitions. The pricing/sales volume variance and small acquisitions including Tonsan Adhesive, Inc., Continental Products Limited and ProSpec construction products are viewed as constant currency growth. The following table shows the net revenue variance analysis for the past two years:
|
2015 vs 2014 |
2014 vs 2013 |
|||||||
|
Product pricing |
0.5 | % | (0.4 | )% | ||||
|
Sales volume |
4.5 | % | 3.5 | % | ||||
|
Currency |
(6.0 | )% | (0.3 | )% | ||||
| (1.0 | )% | 2.8 | % | |||||
Constant currency growth was 5.0 percent in 2015 compared to 2014. The 5.0 percent constant currency growth in 2015 was driven by 39.8 percent growth in Asia Pacific, 23.8 percent growth in Construction Products offset by a 3.9 percent decrease in Americas Adhesives and 1.9 percent decrease in EIMEA. The majority of the negative currency impact was driven by the weakening of the Euro, Turkish lira, Canadian dollar and Australian dollar against the U.S. dollar.
Constant currency growth was 3.1 percent in 2014 compared to 2013. The 3.1 percent constant currency growth in 2014 was driven by 18.7 percent growth in Construction Products, 11.2 percent growth in Asia Pacific and 2.4 percent growth in Americas Adhesives. The majority of the negative currency impact was driven by the devaluation of the Australian dollar and the Canadian dollar compared to the U.S. dollar.
|
Cost of sales |
||||||||||||||||||||
|
($ in millions) |
2015 |
2014 |
2013 |
2015 vs 2014 |
2014 vs 2013 |
|||||||||||||||
|
Raw materials |
$ | 1,161.3 | $ | 1,213.5 | $ | 1,161.6 | (4.3 | )% | 4.5 | % | ||||||||||
|
Other manufacturing costs |
354.3 | 357.7 | 315.2 | (1.0 | )% | 13.5 | % | |||||||||||||
|
Cost of sales |
$ | 1,515.6 | $ | 1,571.2 | $ | 1,476.8 | (3.5 | )% | 6.4 | % | ||||||||||
|
Percent of net revenue |
72.7 | % | 74.7 | % | 72.1 | % | ||||||||||||||
Raw material costs as a percentage of net revenue decreased 200 basis points in 2015 compared to 2014, reflecting decreases in raw materials costs as well as changes in product pricing and sales mix. Other manufacturing costs as a percentage of revenue remained flat compared to last year. As a result, cost of sales as a percentage of net revenue decreased 200 basis points compared to 2014.
Raw material costs as a percentage of net revenue increased 100 basis points in 2014 relative to 2013, reflecting increases in raw materials costs as well as changes in product pricing and sales mix. Other manufacturing costs as a percentage of revenue increased 160 basis points in 2014 compared to 2013 mainly driven by cost associated with the implementation of our ERP system as well as business integration costs that are not classified as special charges. As a result, cost of sales as a percentage of net revenue increased 260 basis points in 2014 compared to 2013.
|
Gross profit |
||||||||||||||||||||
|
($ in millions) |
2015 |
2014 |
2013 |
2015 vs 2014 |
2014 vs 2013 |
|||||||||||||||
|
Gross profit |
$ | 568.0 | $ | 533.3 | $ | 570.2 | 6.5 | % | (6.5 | )% | ||||||||||
|
Percent of net revenue |
27.3 | % | 25.3 | % | 27.9 | % | ||||||||||||||
Gross profit in 2015 increased $34.7 million compared to 2014 and gross profit margin increased 200 basis points. The decrease in the cost of raw materials was the main factor for the increase in gross profit.
Gross profit in 2014 decreased $36.9 million compared to 2013 and gross profit margin declined 260 basis points. The increases in raw materials in addition to the cost associated with the implementation of our ERP system as well as business integration costs that were not classified as special charges were the main factors to the gross profit reduction.
Selling, general and administrative (SG&A) expenses
|
($ in millions) |
2015 |
2014 |
2013 |
2015 vs 2014 |
2014 vs 2013 |
|||||||||||||||
|
SG&A |
$ | 397.6 | $ | 383.4 | $ | 374.7 | 3.7 | % | 2.3 | % | ||||||||||
|
Percent of net revenue |
19.1 | % | 18.2 | % | 18.3 | % | ||||||||||||||
SG&A expenses for 2015 increased $14.2 million or 3.7 percent compared to 2014. The added expense from the Tonsan acquisition partially offset by foreign currency exchange rates were the main drivers for the increase.
SG&A expenses for 2014 increased $8.7 million or 2.3 percent compared to 2013. As a percentage of net revenue, SG&A expenses decreased 10 basis points in 2014 due to ongoing cost control efforts offsetting higher spending for Project ONE.
We make SG&A expense plans at the beginning of each fiscal year and barring significant changes in business conditions or our outlook for the future, we maintain these spending plans for the entire year. Management routinely monitors our SG&A spending relative to these fiscal year plans for each operating segment and for the company overall. We feel it is important to maintain a consistent spending program in this area as many of the activities within the SG&A category such as the sales force, technology development, and customer service are critical elements of our business strategy.
|
Special Charges, net |
||||||||||||
|
($ in millions) |
2015 |
2014 |
2013 |
|||||||||
|
Special Charges, net |
$ | 4.7 | $ | 51.5 | $ | 45.1 | ||||||
The following table provides detail of special charges, net:
|
($ in millions) |
2015 |
2014 |
2013 |
|||||||||
|
Acquisition and transformation related costs |
$ | 0.7 | $ | 7.9 | $ | 8.7 | ||||||
|
Workforce reduction costs |
- | 3.2 | 9.8 | |||||||||
|
Facility exit costs |
3.7 | 32.1 | 17.9 | |||||||||
|
Other related costs |
0.3 | 8.3 | 8.7 | |||||||||
|
Special charges, net |
$ | 4.7 | $ | 51.5 | $ | 45.1 | ||||||
The integration of the industrial adhesives business we acquired in March 2012 involved a significant amount of restructuring and capital investment to optimize the new combined entity. In addition to this acquisition, we announced our intentions to take a series of actions in our existing EIMEA operating segment to improve the profitability and future growth prospects of this operating segment. We combined these two initiatives into a single project which we refer to as the Business Integration Project. During the years ended November 28, 2015, November 29, 2014 and November 30, 2013, we incurred special charges, net of $4.7 million, $51.5 million and $45.1 million, respectively, for costs related to the Business Integration Project.
Acquisition and transformation related costs of 0.7 million for the year ended November 28, 2015, $7.9 million for the year ended November 29, 2014 and $8.7 million for the year ended November 30, 2013 include costs related to organization consulting, financial advisory and legal services necessary to integrate the acquired business into our existing operating segments.
During the year ended November 28, 2015, we incurred cash facility exit costs of $2.2 million, non-cash facility exit costs of $1.5 million and other incremental transformation related costs of $0.3 million including the cost of personnel directly working on the integration. During the year ended November 29, 2014, we incurred workforce reduction costs of $3.2 million, cash facility exit costs of $25.2 million, non-cash facility exit costs of $6.9 million and other incremental transformation related costs of $8.3 million including the cost of personnel directly working on the integration. During the year ended November 30, 2013, we incurred workforce reduction costs of $9.8 million, cash facility exit costs of $11.8 million, non-cash facility exit costs of $6.1 million and other incremental transformation related costs of $8.7 million including the cost of personnel directly working on the integration.
We present operating segment information consistent with how we organize our business internally, assess performance and make decisions regarding the allocation of resources. Segment operating income is defined as gross profit less selling, general and administrative expenses. Because this definition excludes special charges, we have not allocated special charges to the operating segments or included them in Management’s Discussion & Analysis of operating segment results. For informational purposes only, the following table provides the special charges, net attributable to each operating segment for the periods presented:
|
($ in millions) |
2015 |
2014 |
2013 |
|||||||||
|
Americas Adhesives |
$ | (1.4 | ) | $ | 3.1 | $ | 7.9 | |||||
|
EIMEA |
5.7 | 44.2 | 36.2 | |||||||||
|
Asia Pacific |
0.1 | 2.4 | 0.6 | |||||||||
|
Company-wide |
0.3 | 1.8 | 0.4 | |||||||||
|
Special Charges, net |
$ | 4.7 | $ | 51.5 | $ | 45.1 | ||||||
We expect total project costs will be approximately $164.0 million. The following table provides detail of costs incurred inception-to-date as of November 28, 2015 for the Business Integration Project:
|
Costs Incurred Inception-to-Date |
||||
|
($ in millions) |
As of November 28, 2015 |
|||
|
Acquisition and transformation related costs |
$ | 43.0 | ||
|
Work force reduction costs |
41.1 | |||
|
Cash facility exit costs |
40.2 | |||
|
Non-cash facility exit costs |
17.7 | |||
|
Other related costs |
19.3 |
|||
|
Business Integration Project |
$ | 161.3 | ||
Non-cash costs are primarily related to accelerated depreciation of long-lived assets.
|
Other income (expense), net |
||||||||||||
|
($ in millions) |
2015 |
2014 |
2013 |
|||||||||
|
Other income (expense), net |
$ | (2.5 | ) | $ | 0.7 | $ | (3.8 | ) | ||||
Currency transaction and remeasurement losses were $3.5 million, $2.5 million and $4.1 million in 2015, 2014 and 2013, respectively. Interest income was $0.5 million in 2015 compared to $0.4 million in 2014 and $0.7 million in 2013. Gains on disposal of fixed assets were $0.3 million, $2.8 million and $0.3 million in 2015, 2014 and 2013, respectively.
|
Interest expense |
||||||||||||
|
($ in millions) |
2015 |
2014 |
2013 |
|||||||||
|
Interest expense |
$ | 25.0 | $ | 19.7 | $ | 19.1 | ||||||
Interest expense was $25.0 million in 2015 compared to $19.7 million in 2014 and $19.1 million in 2013. The higher interest expense in 2015 compared to 2014 was due to higher average debt balances resulting from the Tonsan acquisition and lower capitalized interest on capital projects, offset by lower average interest rates. The higher interest expense in 2014 compared to 2013 was due to higher average debt balances, partially offset by higher capitalized interest on capital projects. We capitalized interest of $0.1 million, $2.7 million and $1.9 million in 2015, 2014 and 2013, respectively.
|
Income taxes |
||||||||||||
|
($ in millions) |
2015 |
2014 |
2013 |
|||||||||
|
Income taxes |
$ | 55.9 | $ | 34.3 | $ | 39.9 | ||||||
|
Effective tax rate |
40.4 | % | 43.3 | % | 31.3 | % | ||||||
Income tax expense in 2015 of $55.9 million includes $0.2 million of discrete tax expense in both the U.S. and foreign jurisdictions. Income tax expense in 2014 of $34.3 million included $1.4 million of discrete tax benefits in both the U.S. and foreign jurisdictions. Excluding discrete items, the overall effective tax rate decreased by 4.9 percentage points in 2015 as compared to 2014. The decrease in the tax rate is principally due to a change in the geographic mix of pre-tax earnings and the reduction in special charges.
|
Income from equity method investments |
||||||||||||
|
($ in millions) |
2015 |
2014 |
2013 |
|||||||||
|
Income from equity method investments |
$ | 5.9 | $ | 5.2 | $ | 8.4 | ||||||
The income from equity method investments relates to our 50 percent ownership of the Sekisui-Fuller joint venture in Japan. Sekisui-Fuller’s net income measured in Japanese yen was higher in 2015 compared to 2014 and 2013, but the weakening of the yen in 2015 and 2014 negatively impacted the net income in U.S. dollars. Income from equity method investments was negatively impacted in 2014 by a correction of an error in the carrying value of our investment in Sekisui-Fuller in the amount of $1.6 million.
|
Income (loss) from discontinued operations, net of tax |
||||||||||||
|
($ in millions) |
2015 |
2014 |
2013 |
|||||||||
|
Income (loss) from discontinued operations, net of tax |
$ | (1.3 | ) | $ | - | $ | 1.2 | |||||
The income (loss) from discontinued operations, net of tax, relates to our Central America Paints business, which we sold in 2012. In 2015, in conjunction with the final settlement agreement, we increased our contingent consideration liability by $2.1 million and adjusted the related deferred income tax. In 2013, in conjunction with filing the 2012 tax return, we reduced our income tax expense $1.2 million, related to the sale of the Central America Paints business. See Note 2 to the Consolidated Financial Statements.
|
Net income attributable to non-controlling interests |
||||||||||||
|
($ in millions) |
2015 |
2014 |
2013 |
|||||||||
|
Net income attributable to non-controlling interests |
$ | (0.4 | ) | $ | (0.4 | ) | $ | (0.4 | ) | |||
The net income attributable to non-controlling interests relates to the redeemable non-controlling interest in H.B. Fuller Kimya Sanayi Ticaret A.S. (HBF Kimya).
|
Net income attributable to H.B. Fuller |
||||||||||||||||||||
|
($ in millions) |
2015 |
2014 |
2013 |
2015 vs 2014 |
2014 vs 2013 |
|||||||||||||||
|
Net income atAtributable to H.B. Fuller |
$ | 86.7 | $ | 49.8 | $ | 96.8 | 74.2 | % | (48.6 | )% | ||||||||||
|
Percent of net revenue |
4.2 | % | 2.4 | % | 4.7 | % | ||||||||||||||
Net income attributable to H.B. Fuller was $86.7 million in 2015 compared to $49.8 million in 2014 and $96.8 million in 2013. Fiscal year 2015 included $4.7 million of special charges, net ($4.7 million after-tax and a negative $0.09 effect on diluted earnings per share) for costs related to the Business Integration Project compared to $51.5 million ($45.2 million after-tax) in 2014 and $45.1 million ($35.3 million after-tax) in 2013. Diluted earnings per share, from continuing operations, was $1.71 per share in 2015, $0.97 per share for 2014 and $1.87 per share for 2013.
Operating Segment Results
We are required to report segment information in the same way that we internally organize our business for assessing performance and making decisions regarding allocation of resources. For segment evaluation by the chief operating decision maker, segment operating income is defined as gross profit less SG&A expenses. Segment operating income excludes special charges, net. Inter-segment revenues are recorded at cost plus a markup for administrative costs. Corporate expenses are fully allocated to each operating segment. Our operations are managed through four reportable segments: Americas Adhesives, EIMEA, Asia Pacific and Construction Products.
The tables below provide certain information regarding the net revenue and segment operating income of each of our operating segments.
|
Net Revenue by Segment |
||||||||||||||||||||||||
|
2015 |
2014 |
2013 |
||||||||||||||||||||||
|
Net |
% of |
Net |
% of |
Net |
% of |
|||||||||||||||||||
|
($ in millions) |
Revenue |
Total |
Revenue |
Total |
Revenue |
Total |
||||||||||||||||||
|
Americas Adhesives |
$ | 876.8 | 42 | % | $ | 920.7 | 44 | % | $ | 902.6 | 44 | % | ||||||||||||
|
EIMEA |
605.1 | 29 | % | 719.8 | 34 | % | 733.2 | 36 | % | |||||||||||||||
|
Asia Pacific |
368.7 | 18 | % | 275.8 | 13 | % | 252.6 | 12 | % | |||||||||||||||
|
Construction Products |
233.1 | 11 | % | 188.2 | 9 | % | 158.6 | 8 | % | |||||||||||||||
|
Total |
$ | 2,083.7 | 100 | % | $ | 2,104.5 | 100 | % | $ | 2,047.0 | 100 | % | ||||||||||||
Segment Operating Income
|
2015 |
2014 |
2013 |
||||||||||||||||||||||
|
Operating |
% of |
Operating |
% of |
Operating |
% of |
|||||||||||||||||||
|
($ in millions) |
Income |
Total |
Income |
Total |
Income |
Total |
||||||||||||||||||
|
Americas Adhesives |
$ | 126.3 | 74 | % | $ | 103.3 | 69 | % | $ | 123.3 | 63 | % | ||||||||||||
|
EIMEA |
11.9 | 7 | % | 30.5 | 20 | % | 51.5 | 26 | % | |||||||||||||||
|
Asia Pacific |
17.1 | 10 | % | 9.3 | 6 | % | 9.8 | 5 | % | |||||||||||||||
|
Construction Products |
15.2 | 9 | % | 6.7 | 5 | % | 10.9 | 6 | % | |||||||||||||||
|
Total |
$ | 170.5 | 100 | % | $ | 149.8 | 100 | % | $ | 195.5 | 100 | % | ||||||||||||
The following table provides a reconciliation of segment operating income to income from continuing operations before income taxes and income from equity method investments, as reported on the Consolidated Statements of Income.
|
($ in millions) |
2015 |
2014 |
2013 |
|||||||||
|
Segment operating income |
$ | 170.5 | $ | 149.8 | $ | 195.5 | ||||||
|
Special charges, net |
(4.7 | ) | (51.5 | ) | (45.1 | ) | ||||||
|
Other income (expense), net |
(2.5 | ) | 0.7 | (3.8 | ) | |||||||
|
Interest expense |
(25.0 | ) | (19.7 | ) | (19.1 | ) | ||||||
|
Income from continuing operations before income taxes and income from equity method investments |
$ | 138.3 | $ | 79.3 | $ | 127.5 | ||||||
Americas Adhesives
|
($ in millions) |
2015 |
2014 |
2013 |
2015 vs 2014 |
2014 vs 2013 |
|||||||||||||||
|
Net revenue |
$ | 876.8 | $ | 920.7 | $ | 902.6 | (4.8 | )% | 2.0 | % | ||||||||||
|
Segment operating income |
$ | 126.3 | $ | 103.3 | $ | 123.3 | 22.2 | % | (16.2 | )% | ||||||||||
|
Segment profit margin % |
14.4 | % | 11.2 | % | 13.7 | % | ||||||||||||||
The following tables provide details of Americas Adhesives net revenue variances:
|
2015 vs 2014 |
2014 vs 2013 |
|||||||
|
Constant currency growth |
(3.9 | )% | 2.4 | % | ||||
|
Currency |
(0.9 | )% | (0.4 | )% | ||||
|
Total |
(4.8 | )% | 2.0 | % | ||||
Net revenue decreased 4.8 percent in 2015 compared to 2014. The 3.9 percent decrease in constant currency growth was attributable to a 4.3 percent decrease in sales volume offset by a 0.4 percent increase in pricing. The sales volume decrease was driven by lower volume in several market segments and lost market share related to our ERP system implementation. Raw material costs as a percentage of net revenue decreased 280 basis points as a result of decreases in raw material costs following the drop in the global price of oil and natural gas. Other manufacturing costs as a percentage of net revenue decreased 50 basis points compared to 2014. Operating expenses were 3.0 percent lower compared to 2014. As a result, segment operating income increased 22.2 percent compared to 2014 and segment profit margin increased 320 basis points.
Net revenue increased 2.0 percent in 2014 compared to 2013. The 2.4 percent increase in constant currency growth was attributable to a 3.3 percent increase in sales volume offset by a 0.9 percent decrease in pricing. The sales volume increase was driven by volume growth in several market segments and generally in line with end market conditions. Raw material cost as a percentage of net revenue increased 100 basis points as a result of increases in raw materials combined with price reductions. Manufacturing costs as a percentage of net revenue increased 150 basis points compared to 2013. The main driver for this increase is cost associated with the implementation of our ERP system. Operating expenses as a percentage of net revenue were flat. As a result, segment operating income decreased 16.2 percent compared to 2013 and segment profit margin decreased 250 basis points.
EIMEA
|
($ in millions) |
2015 |
2014 |
2013 |
2015 vs 2014 |
2014 vs 2013 |
|||||||||||||||
|
Net revenue |
$ | 605.1 | $ | 719.8 | $ | 733.2 | (15.9 | )% | (1.8 | )% | ||||||||||
|
Segment operating income |
$ | 11.9 | $ | 30.5 | $ | 51.5 | (61.1 | )% | (40.8 | )% | ||||||||||
|
Segment profit margin % |
2.0 | % | 4.2 | % | 7.0 | % | ||||||||||||||
The following table provides details of the EIMEA net revenue variances:
|
2015 vs 2014 |
2014 vs 2013 |
|||||||
|
Constant currency growth |
(1.9 | )% | (2.1 | )% | ||||
|
Currency |
(14.0 | )% | 0.3 | % | ||||
|
Total |
(15.9 | )% | (1.8 | )% | ||||
Net revenue decreased 15.9 percent in 2015 compared to 2014. Pricing increased 0.4 percent offset by a 2.3 percent decrease in sales volume. The negative currency effect of 14.0 percent was primarily the result of a weaker Euro, Turkish lira and Egyptian pound compared to the U.S. dollar. Sales volume was down in core Europe reflecting the generally soft end market conditions across most of the region and volume losses due to longer lead times caused by production inefficiencies related to the Business Integration Project. Sales volume growth was generated in the emerging markets, mainly in India, Middle East and Turkey. Raw material costs as a percentage of net revenue decreased 30 basis points in 2015 compared to 2014. Other manufacturing costs as a percentage of net revenue were 150 basis points higher than last year mainly due to lower sales. Operating expenses were 10.8 percent lower than 2014. In 2015, segment operating income decreased 61.1 percent and segment profit margin decreased 220 basis points compared to 2014.
Net revenue decreased 1.8 percent in 2014 compared to 2013. Pricing increased 0.4 percent offset by a 2.5 percent decrease in sales volume. The stronger Euro partially offset by weaker Turkish lira, Indian rupee and Egyptian pound compared to the U.S. dollar resulted in a 0.3 percent increase in net revenue. Sales volume was down in core Europe reflecting the generally soft end market conditions across most of the region and the negative impact of deteriorated customer service levels due to the Business Integration Project. Sales volume growth was generated in the emerging markets, mainly in India and Turkey. Raw material costs as a percentage of net revenue increased 90 basis points in 2014 compared to 2013 primarily due to an increase in vinyl acetate monomer (VAM) costs in the second half of 2014. All other manufacturing costs as a percentage of net revenue were 190 basis points higher than last year mainly due to business integration costs that are not classified as special charges. Operating expenses as a percentage of net revenue were flat. In 2014, segment operating income decreased 40.8 percent and segment profit margin decreased 280 basis points compared to 2013.
|
Asia Pacific |
||||||||||||||||||||
|
($ in millions) |
2015 |
2014 |
2013 |
2015 vs 2014 |
2014 vs 2013 |
|||||||||||||||
|
Net revenue |
$ | 368.7 | $ | 275.8 | $ | 252.6 | 33.7 | % | 9.2 | % | ||||||||||
|
Segment operating income |
$ | 17.1 | $ | 9.3 | $ | 9.8 | 84.3 | % | (4.6 | )% | ||||||||||
|
Segment profit margin % |
4.7 | % | 3.4 | % | 3.9 | % | ||||||||||||||
The following table provides details of Asia Pacific net revenue variances:
|
2015 vs 2014 |
2014 vs 2013 |
|||||||
|
Constant currency growth |
39.8 | % | 11.2 | % | ||||
|
Currency |
(6.1 | )% | (2.0 | )% | ||||
|
Total |
33.7 | % | 9.2 | % | ||||
Net revenue for 2015 increased 33.7 percent compared to 2014. Constant currency growth was 39.8 percent driven by 40.3 percent increase in sales volume offset by a decrease in pricing of 0.5 percent. The increase in sales volume occurred in all Asia sub-regions and included the addition of the Tonsan business acquired in the first quarter of 2015. The negative currency effect of 6.1 percent was primarily the result of a weaker Australian dollar compared to the U.S. dollar. Raw material costs as a percentage of net revenue decreased 370 basis points in 2015 compared to 2014 primarily due to lower raw material costs following the drop in the global price of oil and natural gas and a change in sales mix. Other manufacturing costs as a percentage of net revenue were 40 basis points lower in 2015 compared to 2014. SG&A expenses as a percentage of net revenue increased 330 basis points compared to 2014 primarily from the added expense from the Tonsan acquisition. Segment operating income increased 84.3 percent and segment profit margin increased 130 basis points in 2015 compared to 2014.
Net revenue for 2014 increased 9.2 percent compared to 2013. Constant currency growth was 11.2 percent driven mainly by volume growth while pricing was flat. Volume growth occurred in all Asia sub-regions as market conditions improved. Raw material costs as a percentage of net revenue increased 80 basis points in 2014 relative to the prior year. Manufacturing costs as a percentage of net revenue were flat in 2014 compared to 2013. SG&A expenses as a percentage of net revenue decreased 30 basis points compared to 2013. Segment operating income decreased 4.6% and segment profit margin decreased 50 basis points in 2014 compared to 2013.
Construction Products
|
($ in millions) |
2015 |
2014 |
2013 |
2015 vs 2014 |
2014 vs 2013 |
|||||||||||||||
|
Net revenue |
$ | 233.1 | $ | 188.2 | $ | 158.6 | 23.8 | % | 18.7 | % | ||||||||||
|
Segment operating income |
$ | 15.2 | $ | 6.7 | $ | 10.9 | 127.5 | % | (39.1 | )% | ||||||||||
|
Segment profit margin % |
6.5 | % | 3.5 | % | 6.9 | % | ||||||||||||||
The following tables provide details of Construction Products net revenue variances:
|
2015 vs 2014 |
2014 vs 2013 |
|||||||
|
Constant currency growth |
23.8 | % | 18.7 | % | ||||
Net revenue increased 23.8 percent in 2015 driven by 20.9 percent increase in sales volume and a 2.9 percent increase in pricing compared to 2014. The increase in sales volume was primarily attributed to continued market share gains with several key retail partners and the ProSpec acquisition in the fourth quarter of 2014. Raw material costs as a percentage of net revenue decreased 50 basis points in 2015 compared to 2014 primarily due to lower raw material costs and changes in sales mix. Other manufacturing costs as a percentage of net revenue decreased by 30 basis points. Operating expenses as a percentage of net revenue decreased 220 basis points compared to 2014 primarily due to increased sales volume. Segment operating income increased by $8.5 million, or 127.5 percent and segment profit margin increased 300 basis points compared to 2014.
Net revenue increased 18.7 percent in 2014 driven by 20.4 percent increase in sales volume offset by a 1.7 percent decrease in pricing compared to 2013. The increase in sales volume was primarily attributed to continued market share gains with several key retail partners. Raw material costs as a percentage of net revenue increased by 190 basis points in 2014 relative to 2013 primarily due to changes in sales mix. Other manufacturing costs as a percentage of net revenue increased by 240 basis points mainly due to lower productivity rates as new business was ramped up. Operating expenses as a percentage of net revenue decreased 90 basis points compared to 2013. Segment operating income decreased 39.1 percent and segment profit margin decreased 340 basis points compared to 2013.
Financial Condition, Liquidity and Capital Resources
Total cash and cash equivalents as of November 28, 2015 were $119.2 million compared to $77.6 million as of November 29, 2014. Total long and short-term debt was $722.9 million as of November 28, 2015 and $574.8 million as of November 29, 2014.
We believe that cash flows from operating activities will be adequate to meet our ongoing liquidity and capital expenditure needs. In addition, we believe we have the ability to obtain both short-term and long-term debt to meet our financing needs for the foreseeable future. Cash available in the United States has historically been sufficient and we expect it will continue to be sufficient to fund U.S. operations and U.S. capital spending and U.S. pension and other postretirement benefit contributions in addition to funding U.S. acquisitions, dividend payments, debt service and share repurchases as needed. For those international earnings considered to be reinvested indefinitely, we currently have no intention to, and plans do not indicate a need to, repatriate these funds for U.S. operations.
Our credit agreements and note purchase agreements include restrictive covenants that, if not met, could lead to a renegotiation of our credit lines and a significant increase in our cost of financing. At November 28, 2015, we were in compliance with all covenants of our contractual obligations as shown in the following table:
|
Covenant |
Debt Instrument |
Measurement |
Result as of November 28, 2015 |
|
TTM EBITDA / TTM Interest Expense |
All Debt Instruments |
Not less than 2.5 |
10.0 |
|
Total Indebtedness / TTM EBITDA |
All Debt Instruments |
Not greater than 3.5 |
2.8 |
|
● |
TTM = trailing 12 months |
|
● |
EBITDA for covenant purposes is defined as consolidated net income, plus (i) interest expense, (ii) taxes, (iii) depreciation and amortization, (iv) non-cash impairment losses, (v) extraordinary non-cash losses incurred other than in the ordinary course of business, (vi) nonrecurring extraordinary non-cash restructuring charges, (vii) [reserved] , (viii) cash expenses incurred during fiscal years 2013 through 2015 in connection with facilities consolidation, restructuring and integration, discontinuance of operations, work force reduction, sale or abandonment of assets other than inventory, and professional and other fees incurred in connection with the acquired business or the restructuring of the company’s Europe, India, Middle East and Africa operations, not to exceed (x) $39.8 million for the period beginning with the fiscal quarter ending November 30, 2013 through and including the fiscal quarter ending May 31, 2014 and (y) $20.0 million for the period beginning with the fiscal quarter ending August 30, 2014 through and including the fiscal quarter ending November 28, 2015, (ix) cash expenses related to the Tonsan acquisition for advisory services and for arranging financing for the acquired business (including the non-cash write-off of deferred financing costs and any loss or expense on foreign exchange transactions intended to hedge the purchase price for the acquired business) with cash expenses not to exceed $10.0 million, minus extraordinary non-cash gains incurred other than in the ordinary course of business. For the Total Indebtedness / TTM EBITDA ratio, TTM EBITDA is adjusted for the pro forma results from Material Acquisitions and Material Divestitures as if the acquisition or divestiture occurred at the beginning of the calculation period. Additional detail is provided in the Form 8-K dated October 31, 2014. |
|
● |
Pursuant to the Credit Agreement dated October 31, 2014, the company elected to increase the Total Indebtedness / TTM EBITDA ratio to a maximum of 3.75 to 1.00 for four quarters beginning with the first fiscal quarter ending February 28, 2015. The maximum ratio will return to 3.50 to 1.00 in the first fiscal quarter ending February 27, 2016. |
We believe we have the ability to meet all of our contractual obligations and commitments in fiscal 2016.
Net Financial Assets
|
($ in millions) |
2015 |
2014 |
||||||
|
Financial Assets: |
||||||||
|
Cash and cash equivalents |
$ | 119.2 | $ | 77.6 | ||||
|
Debt: |
||||||||
|
Notes payable |
30.8 | 27.1 | ||||||
|
Long-term debt |
692.1 | 547.7 | ||||||
|
Total debt |
722.9 | 574.8 | ||||||
|
Net financial debt |
$ | 603.7 | $ | 497.2 | ||||
Of the $119.2 million in cash and cash equivalents as of November 28, 2015, $83.1 million was held outside the U.S. Of the $83.1 million of cash held outside the U.S., earnings on $74.7 million are indefinitely reinvested outside of the U.S. It is not practical for us to determine the U.S. tax implications of the repatriation of these funds.
There are no contractual or regulatory restrictions on the ability of consolidated and unconsolidated subsidiaries to transfer funds in the form of cash dividends, loans or advances to us, except for: 1) a credit facility limitation restricting investments, loans, advances or capital contributions from the U.S. parent corporation, the Irish financing subsidiary, and the Construction Products subsidiary in excess of $100.0 million, 2) a credit facility limitation that provides total investments, loans, advances or guarantees not otherwise permitted in the credit agreement for all subsidiaries shall not exceed $125.0 million in the aggregate and 3) typical statutory restrictions, which prohibit distributions in excess of net capital or similar tests. The 2012 Forbo acquisition, the 2015 Tonsan acquisition and any investments, loans, and advances established to consummate the Forbo and Tonsan acquisitions are excluded from the credit facility limitations described above. Additionally, we have taken the income tax position that the majority of our cash in non-U.S. locations is indefinitely reinvested.
We rely on operating cash flow, short-term borrowings and long-term debt to provide for the working capital needs of our operations. We believe that we have the ability to obtain both short-term and long-term debt to meet our financing needs for the foreseeable future.
Debt Outstanding and Debt Capacity
Notes Payable: Notes payable were $30.8 million at November 28, 2015 and $27.1 million at November 29, 2014. These amounts mainly represented various foreign subsidiaries’ short-term borrowings that were not part of committed lines. The weighted-average interest rates on these short-term borrowings were 8.1 percent in 2015 and 11.3 percent in 2014.
Long-Term Debt: Long-term debt consisted of senior notes and term loans. The Series A and Series B senior notes bear a fixed interest rate of 5.13 percent and mature in fiscal year 2017. The Series C and Series D senior notes bear a fixed interest rate of 5.61 percent and mature in fiscal year 2020. The Series E senior notes bear a fixed interest rate of 4.12 percent and mature in fiscal year 2022. We are subject to prepayment penalties on our senior notes. As of November 28, 2015, make-whole premiums were estimated to be, if the entire debt were paid off, $42.6 million. We currently have no intention to prepay any senior notes.
We executed interest rate swap agreements for the purpose of obtaining a floating rate of interest on $75.0 million of the $150.0 million senior notes. We have designated the $75.0 million of senior note debt as the hedged item in a fair value hedge. As required by applicable accounting standards, we recorded an asset for the fair value of the interest rate swaps (hedging instruments) totaling $3.4 million and recognized a liability of $3.4 million for the change in the fair value of the senior notes attributable to the change in the risk being hedged. This calculation resulted in $153.4 million being recorded in long-term debt related to these senior notes as of November 28, 2015. For further information related to long-term debt see Note 7 to the Consolidated Financial Statements.
On October 31, 2014, we entered into a credit agreement with a consortium of financial institutions under which we established a $300.0 million term loan that we can use to repay existing indebtedness, finance working capital needs, finance acquisitions, and for general corporate purposes. At November 28, 2015, there was a balance of $288.8 million drawn on the term loan. The interest rate on the term loan bears a floating interest rate at the London Interbank Offered Rate (LIBOR) plus 125 basis points and matures in 2019. There is no prepayment penalty on the term loan. See the discussion below regarding our lines of credit.
On October 31, 2014 we amended various provisions of the Note Purchase Agreements Series A through E, including the covenant definition of Consolidated EBITDA. As part of these amendments, the interest rate on the debt may increase based on a ratings grid. Additional details on the Note Purchase Agreement amendments can be found in the 8-K dated October 31, 2014.
Lines of Credit: We have a revolving credit agreement with a consortium of financial institutions at November 28, 2015. This credit agreement creates an unsecured multi-currency revolving credit facility that we can draw upon for general corporate purposes up to a maximum of $300.0 million. Interest is payable at LIBOR plus 1.075 percent. A facility fee of 0.175 percent is payable quarterly. The interest rate and the facility fee are based on a rating grid. The credit facility expires on October 31, 2019. As of November 28, 2015, our lines of credit were undrawn.
Goodwill and Other Intangible Assets
As of November 28, 2015, goodwill totaled $354.2 million (17 percent of total assets) and other intangible assets, net of accumulated amortization, totaled $213.0 million (10 percent of total assets).
The components of goodwill and other identifiable intangible assets, net of amortization, by segment at November 28, 2015 are as follows:
|
Americas |
Asia |
Construction |
||||||||||||||||||
|
($ in millions) |
Adhesives |
EIMEA |
Pacific |
Products |
Total |
|||||||||||||||
|
Goodwill |
$ | 67.1 | $ | 122.6 | $ | 143.7 | $ | 20.8 | $ | 354.2 | ||||||||||
|
Purchased technology & patents |
14.7 | 7.6 | 28.7 | 1.1 | 52.1 | |||||||||||||||
|
Customer relationships |
15.9 | 21.6 | 27.0 | 71.1 | 135.6 | |||||||||||||||
|
Other finite-lived intangible assets1 |
4.4 | 13.8 | 1.5 | 5.1 | 24.8 | |||||||||||||||
|
Indefinite-lived intangible assets2 |
- | 0.5 | - | - | 0.5 | |||||||||||||||
1 Other finite-lived intangible assets are related to operating segment trademarks.
2 Indefinite-lived intangible assets are related to EIMEA operating segment trademarks.
Selected Metrics of Liquidity and Capital Resources
Key metrics we monitor are net working capital as a percent of annualized net revenue, trade account receivable days sales outstanding (DSO), inventory days on hand, free cash flow and debt capitalization ratio.
|
November 28, |
November 29, |
|||||||
|
2015 |
2014 |
|||||||
|
Net working capital as a percentage of annualized net revenue1 |
19.9% | 19.1% | ||||||
|
Accounts receivable DSO2 |
60 Days | 56 Days | ||||||
|
Inventory days on hand3 |
60 Days | 58 Days | ||||||
|
Free cash flow4 |
$126.2 million | $(133.1) million | ||||||
|
Debt capitalization ratio5 |
45.3% | 39.2% | ||||||
1 Current quarter net working capital (trade receivables, net of allowance for doubtful accounts plus inventory minus trade payables) divided by annualized net revenue.
2 Trade receivables net of allowance for doubtful accounts multiplied by 56 (8 weeks) and divided by the net revenue for the last 2 months of the quarter.
3 Total inventory multiplied by 56 and divided by cost of sales (excluding delivery costs) for the last 2 months of the quarter.
4 Net cash provided by operations less purchased property, plant and equipment and dividends paid.
5 Total debt divided by (total debt plus total stockholders’ equity).
Another key metric we measure is the return on invested capital, or ROIC. The calculation is represented by total return divided by total invested capital.
|
● |
Total return is defined as: gross profit less SG&A expenses, less taxes at the effective tax rate plus income from equity method investments. Total return is calculated using trailing 12 month information. |
|
● |
Total invested capital is defined as the sum of notes payable, current maturities of long-term debt, long-term debt, redeemable non-controlling interest and total equity. |
We believe ROIC provides a true measure of return on capital invested and is focused on the long term. The following table shows the ROIC calculation as of November 28, 2015 and November 29, 2014 based on the definition above:
|
Trailing 12 months |
Trailing 12 months |
|||||||
|
($ in millions) |
as of November 28, 2015 |
as of November 29, 2014 |
||||||
|
Gross profit |
$ | 568.0 | $ | 533.3 | ||||
|
Selling, general and administrative expenses |
(397.6 | ) | (383.4 | ) | ||||
|
Income taxes at effective rate |
(66.3 | ) | (46.7 | ) | ||||
|
Income from equity method investments |
5.9 | 5.2 | ||||||
|
Total return |
$ | 110.2 | $ | 108.4 | ||||
|
Total invested capital |
1,600.4 | 1,470.0 | ||||||
|
Return on invested capital |
6.9 | % | 7.4 | % | ||||
Summary of Cash Flows
Cash Flows from Operating Activities from Continuing Operations
|
($ in millions) |
2015 |
2014 |
2013 |
|||||||||
|
Net cash provided by operating activities |
$ | 210.5 | $ | 29.7 | $ | 132.7 | ||||||
Net income including non-controlling interest was $87.1 million in 2015, $50.2 million in 2014 and $97.2 million in 2013. Depreciation and amortization expense totaled $75.3 million in 2015 compared to $70.5 million in 2014 and $61.7 million in 2013. The higher depreciation and amortization expense in 2015 was directly related to the significant increase in capital expenditures in 2014 and 2013.
Changes in net working capital (trade receivables, inventory and trade payables) accounted for a use of cash of $10.8 million, $69.6 million and $2.8 million in 2015, 2014 and 2013, respectively. Following is an assessment of each of the net working capital components:
|
● |
Trade Receivables, net – Changes in trade receivables resulted in a $12.0 use of cash in 2015 compared to $18.9 million use of cash in 2014 and a $7.3 million use of cash in 2013. The smaller use of cash in 2015 was partially related to lower net revenue compared to 2014. The DSO was 60 days at November 28, 2015, 56 days at November 29, 2014 and 55 days at November 30, 2013. |
|
● |
Inventory – Changes in inventory resulted in a $4.6 million use of cash in 2015 compared to a use of cash of $36.2 million in 2014 and a use of cash of $11.8 million in 2013. Inventory days on hand were 60 days at the end of 2015 compared to 58 days at the end of 2014 and 53 days at the end of 2013. In 2015 inventory levels returned to a more normal level. In 2014, inventory levels increased to support the manufacturing transition as part of the Business Integration Project and the implementation of our ERP system in North America. |
|
● |
Trade Payables – Changes in trade payables resulted in a source of cash of $5.8 million in 2015 compared to a use of cash of $14.5 million in 2014 and a source of cash of $16.3 million in 2013. The source of cash in 2015 compared to the use of cash in 2014 was primarily related to the timing of payments. |
Contributions to our pension and other postretirement benefit plans were $4.6 million, $12.6 million and $6.8 million in 2015, 2014 and 2013, respectively. Changes in deferred income taxes resulted in a source of cash of $6.6 million in 2015 compared to a source of cash of $4.2 million in 2014 and a source of cash of $9.6 million in 2013. Income taxes payable resulted in a use of cash of $1.4 million, $0.1 million and $17.9 million in 2015, 2014 and 2013, respectively. Other assets was a source of cash of $12.0 million, a use of cash of $41.7 million and a use of cash of $13.8 million in 2015, 2014 and 2013, respectively. The source of cash in 2015 was primarily related to the decrease in prepaid taxes other than income taxes. Accrued compensation was a source of cash of $6.0 million in 2015, a use of cash of $28.1 million in 2014 and a source of cash of $3.8 million in 2013. The source of cash in 2015 relates to lower payouts for our employee incentive plans and higher accruals. The use of cash in 2014 relates to the payments of severance related costs as part of our Business Integration Project. Other operating activity was a source of cash of $22.6 million in 2015, a source of cash of $33.3 million in 2014 and a use of cash of $11.1 million in 2013. The source of cash in 2015 and 2014 were primarily related to the impact of a stronger U.S. dollar on certain foreign transactions. Income (loss) from discontinued operations, net of tax were $1.3 million loss in 2015 and income of $1.2 million in 2013.
Cash Flows from Investing Activities from Continuing Operations
|
($ in millions) |
2015 |
2014 |
2013 |
|||||||||
|
Net cash used in investing activities |
$ | (258.8 | ) | $ | (160.0 | ) | $ | (133.2 | ) | |||
Purchases of property plant and equipment were $58.6 million in 2015 compared to $139.8 million in 2014 and $124.3 million in 2013. The decrease in 2015 was primarily related to reduced capital expenditures for the Business Integration Project and Project ONE ERP system compared to 2014 and 2013. In 2015 we received a cash settlement of $12.8 million as a result of an arbitration proceeding related to our initial implementation of Project ONE, of which $12.0 was recorded as a reduction of the ERP system asset.
In 2015 we acquired Tonsan Adhesive, Inc. for $215.9 million and Continental Products Limited for $1.6 million. In 2014 we purchased the ProSpec construction products business for $26.2 million and adjusted the purchase price of Plexbond Quimica for $0.2 million. We acquired Plexbond Quimica, S.A. for $10.2 million in 2013 and reduced the purchase price for the 2012 industrial adhesives business acquisition by $1.6 million. See Note 2 to the Consolidated Financial Statements for further information on acquisitions.
Cash Flows from Financing Activities from Continuing Operations
|
($ in millions) |
2015 |
2014 |
2013 |
|||||||||
|
Net cash provided by (used in) financing activities |
$ | 104.2 | $ | 55.0 | $ | (48.7 | ) | |||||
Proceeds from long-term debt in 2015 were $357.0 million. Included in the $357.0 million of proceeds is $300.0 million from our October 31, 2014 term loan which was drawn in conjunction with the acquisition of Tonsan Adhesive, Inc. Repayment of long-term debt in 2015 was $211.3 million. In 2014 proceeds from long-term debt were $560.0 million and repayment of long-term debt was 483.3 million. Proceeds from long-term debt and repayment of long-term debt in 2013 was $107.0 million and $129.5 million, respectively.
Cash paid for dividends were $25.7 million, $23.1 million and $19.3 million in 2015, 2014 and 2013, respectively. Cash generated from the exercise of stock options were $4.6 million in 2015, $6.9 million in 2014 and $8.9 million in 2013. Repurchases of common stock were $19.3 million in 2015 compared to $15.5 million in 2014 and $17.6 million in 2013, including $17.1 million in 2015, $12.3 million in 2014 and $15.3 million in 2013 from our 2010 share repurchase program.
|
Cash Flows from Discontinued Operations |
||||||||||||
|
($ in millions) |
2015 |
2014 |
2013 |
|||||||||
|
Net cash provided by (used in) discontinued operations |
$ | (5.3 | ) | $ | - | $ | 1.1 | |||||
Cash flows from discontinued operations includes the 2015 settlement payment of the contingent consideration of the Central America Paints business, that was sold in 2012, less the related deferred income taxes. In 2013, in conjunction with filing the 2012 tax return, we reduced our income tax liability related to the sale of the Central America Paints business. See Note 2 to the Consolidated Financial Statements for further information.
Contractual Obligations
Due dates and amounts of contractual obligations follow:
|
Payments Due by Period |
||||||||||||||||||||
|
($ in millions) |
Total |
Less than 1 year |
1-3 years |
3-5 years |
More than 5 years |
|||||||||||||||
|
Long-term debt |
$ | 692.1 | $ | 22.5 | $ | 118.9 | $ | 300.7 | $ | 250.0 | ||||||||||
|
Interest payable on long-term debt1 |
121.8 | 23.6 | 46.8 | 35.5 | 15.9 | |||||||||||||||
|
Notes Payable |
30.8 | 30.8 | - | - | - | |||||||||||||||
|
Operating leases |
17.4 | 7.4 | 7.0 | 2.3 | 0.7 | |||||||||||||||
|
Pension contributions2 |
3.5 | 3.5 | - | - | - | |||||||||||||||
|
Total contractual obligations |
$ | 865.6 | $ | 87.8 | $ | 172.7 | $ | 338.5 | $ | 266.6 | ||||||||||
1 Some of our interest obligations on long-term debt are variable based on LIBOR. Interest payable for the variable portion is estimated based on a forward LIBOR curve.
2 Pension contributions are only included for fiscal 2016. We have not determined our pension funding obligations beyond 2016 and thus, any potential future contributions have been excluded from the table.
We expect to make cash outlays in the future related to uncertain tax positions. However, due to the uncertainty of the timing of future cash flows, we are unable to make reasonably reliable estimates of the period of cash settlement, if any, with the respective taxing authorities. Accordingly, gross unrecognized tax benefits of $4.9 million as of November 28, 2015 have been excluded from the contractual obligations table above. For further information related to unrecognized tax benefits see Note 8 to the Consolidated Financial Statements.
We expect 2016 capital expenditures to be approximately $60.0 million.
Off-Balance Sheet Arrangements
There are no relationships with any unconsolidated, special-purpose entities or financial partnerships established for the purpose of facilitating off-balance sheet financial arrangements.
Recently Issued Accounting Pronouncements
See Note 1 to the Consolidated Financial Statements for information concerning new accounting standards and the impact of the implementation of these standards on our financial statements.
Forward-Looking Statements and Risk Factors
The Private Securities Litigation Reform Act of 1995 provides a safe harbor for forward-looking statements. This Annual Report on Form 10-K contains forward-looking statements within the meaning of the Private Securities Litigation Reform Act of 1995. These statements may be identified by the use of words like "plan," "expect," "aim," "believe," "project," "anticipate," "intend," "estimate," "will," "should," "could" (including the negative or variations thereof) and other expressions that indicate future events and trends. These plans and expectations are based upon certain underlying assumptions, including those mentioned with the specific statements. Such assumptions are in turn based upon internal estimates and analyses of current market conditions and trends, our plans and strategies, economic conditions and other factors. These plans and expectations and the assumptions underlying them are necessarily subject to risks and uncertainties inherent in projecting future conditions and results. Actual results could differ materially from expectations expressed in the forward-looking statements if one or more of the underlying assumptions and expectations proves to be inaccurate or is unrealized. In addition to the factors described in this report, Item 1A. Risk Factors identifies some of the important factors that could cause our actual results to differ materially from those in any such forward-looking statements. In order to comply with the terms of the safe harbor, we have identified these important factors which could affect our financial performance and could cause our actual results for future periods to differ materially from the anticipated results or other expectations expressed in the forward-looking statements. These factors should be considered, together with any similar risk factors or other cautionary language that may be made elsewhere in this Annual Report on Form 10-K.
The list of important factors in Item 1A. Risk Factors does not necessarily present the risk factors in order of importance. This disclosure, including that under Forward-Looking Statements and Risk Factors, and other forward-looking statements and related disclosures made by us in this report and elsewhere from time to time, represents our best judgment as of the date the information is given. We do not undertake responsibility for updating any of such information, whether as a result of new information, future events, or otherwise, except as required by law. Investors are advised, however, to consult any further public company disclosures (such as in filings with the SEC or in our press releases) on related subjects.
Item 7A. Quantitative and Qualitative Disclosures about Market Risk
Market Risk: We are exposed to various market risks, including changes in interest rates, foreign currency rates and prices of raw materials. Market risk is the potential loss arising from adverse changes in market rates and prices, such as interest rates and foreign currency exchange rates.
Our financial performance has been, and may continue to be, negatively affected by unfavorable economic conditions. Continued or further recessionary economic conditions may have an adverse impact on our sales volumes, pricing levels and profitability. As domestic and international economic conditions change, trends in discretionary consumer spending also become unpredictable and subject to reductions due to uncertainties about the future. A general reduction in consumer discretionary spending due to a recession in the domestic and international economies, or uncertainties regarding future economic prospects, could have a material adverse effect on our results of operations.
Interest Rate Risk: Exposure to changes in interest rates results primarily from borrowing activities used to fund operations. Committed floating rate credit facilities are used to fund a portion of operations. We believe that probable near-term changes in interest rates would not materially affect financial condition, results of operations or cash flows. The annual impact on interest expense of a one-percentage point interest rate change on the outstanding balance of our variable rate debt as of November 28, 2015 would have resulted in a change in net income of approximately $2.5 million or $0.05 per diluted share.
Foreign Exchange Risk: As a result of being a global enterprise, there is exposure to market risks from changes in foreign currency exchange rates, which may adversely affect operating results and financial condition. Approximately 57 percent of net revenue was generated outside of the United States in 2015. Principal foreign currency exposures relate to the Euro, British pound sterling, Canadian dollar, Chinese renminbi, Japanese yen, Australian dollar, Argentine peso, Brazilian real, Colombian peso, Mexican peso, Turkish lira, Egyptian pound, Indian rupee, and Malaysian ringgit.
Our objective is to balance, where possible, non-functional currency denominated assets to non-functional currency denominated liabilities to have a natural hedge and minimize foreign exchange impacts. We enter into cross border transactions through importing and exporting goods to and from different countries and locations. These transactions generate foreign exchange risk as they create assets, liabilities and cash flows in currencies other than their functional currency. This also applies to services provided and other cross border agreements among subsidiaries. Based on 2015 financial results, a hypothetical one percent change in our cost of sales due to foreign currency rate changes would have resulted in a change in net income attributable to H.B. Fuller of approximately $5.2 million or $0.10 per diluted share.
We take steps to minimize risks from foreign currency exchange rate fluctuations through normal operating and financing activities and, when deemed appropriate, through the use of derivative instruments. We do not enter into any speculative positions with regard to derivative instruments.
Based on 2015 financial results and foreign currency balance sheet positions as of November 28, 2015, a hypothetical overall 10 percent change in the U.S. dollar would have resulted in a change in net income of approximately $4.8 million or $0.09 per diluted share.
Raw Materials: The principal raw materials used to manufacture products include resins, polymers, synthetic rubbers, vinyl acetate monomer and plasticizers. We generally avoid sole source supplier arrangements for raw materials. While alternate supplies of most key raw materials are available, unplanned supplier production outages may lead to strained supply-demand situations for several key raw materials such as ethylene and propylene, several polymers and other petroleum derivatives such as waxes.
The purchase of raw materials is our largest expenditure. Our objective is to purchase raw materials that meet both our quality standards and production needs at the lowest total cost. Most raw materials are purchased on the open market or under contracts that limit the frequency but not the magnitude of price increases. In some cases, however, the risk of raw material price changes is managed by strategic sourcing agreements which limit price increases to increases in supplier feedstock costs, while requiring decreases as feedstock costs decline. The leverage of having substitute raw materials approved for use wherever possible is used to minimize the impact of possible price increases. Based on 2015 financial results, a hypothetical one percent change in our raw material costs would have resulted in a change in net income of approximately $7.3 million or $0.14 per diluted share.
Item 8. Financial Statements and Supplementary Data
Report of Independent Registered Public Accounting Firm
The Board of Directors and Stockholders
H.B. Fuller Company:
We have audited the accompanying consolidated balance sheets of H.B. Fuller Company and subsidiaries (Company) as of November 28, 2015 and November 29, 2014, and the related consolidated statements of income, comprehensive income (loss), total equity, and cash flows for each of the years in the three-year period ended November 28, 2015. These consolidated financial statements are the responsibility of the Company’s management. Our responsibility is to express an opinion on these consolidated financial statements based on our audits.
We conducted our audits in accordance with the standards of the Public Company Accounting Oversight Board (United States). Those standards require that we plan and perform the audit to obtain reasonable assurance about whether the financial statements are free of material misstatement. An audit includes examining, on a test basis, evidence supporting the amounts and disclosures in the financial statements. An audit also includes assessing the accounting principles used and significant estimates made by management, as well as evaluating the overall financial statement presentation. We believe that our audits provide a reasonable basis for our opinion.
In our opinion, the consolidated financial statements referred to above present fairly, in all material respects, the financial position of H.B. Fuller Company and subsidiaries as of November 28, 2015 and November 29, 2014, and the results of its operations and its cash flows for each of the years in the three-year period ended November 28, 2015, in conformity with U.S. generally accepted accounting principles.
We also have audited, in accordance with the standards of the Public Company Accounting Oversight Board (United States), the Company’s internal control over financial reporting as of November 28, 2015, based on criteria established in Internal Control – Integrated Framework (2013) issued by the Committee of Sponsoring Organizations of the Treadway Commission (COSO), and our report dated January 27, 2016 expressed an adverse opinion on the effectiveness of the Company’s internal control over financial reporting.
Our report dated January 27, 2016 on internal control over financial reporting as of November 28, 2015, contains an explanatory paragraph that states management excluded from its assessment of the effectiveness of internal control over financial reporting as of November 28, 2015, the February 2015 acquisitions of Tonsan Adhesive, Inc. and Continental Products Limited’s internal control over financial reporting associated with assets of approximately 16 percent of H.B. Fuller Company’s total assets and revenues of approximately 5 percent of H.B. Fuller Company’s total revenues, included in the consolidated financial statements of H.B. Fuller Company and subsidiaries as of and for the year ended November 28, 2015. Our audit of internal control over financial reporting of H.B. Fuller Company also excluded an evaluation of the internal control over financial reporting of Tonsan Adhesive, Inc. and Continental Products Limited.
/s/ KPMG LLP
Minneapolis, Minnesota
January 27, 2016
Report of Independent Registered Public Accounting Firm
The Board of Directors and Stockholders
H.B. Fuller Company:
We have audited H.B. Fuller Company’s (Company) internal control over financial reporting as of November 28, 2015, based on criteria established in Internal Control – Integrated Framework (2013) issued by the Committee of Sponsoring Organizations of the Treadway Commission (COSO). The Company’s management is responsible for maintaining effective internal control over financial reporting and for its assessment of the effectiveness of internal control over financial reporting, included in the accompanying Management’s Report on Internal Control over Financial Reporting. Our responsibility is to express an opinion on the Company’s internal control over financial reporting based on our audit.
We conducted our audit in accordance with the standards of the Public Company Accounting Oversight Board (United States). Those standards require that we plan and perform the audit to obtain reasonable assurance about whether effective internal control over financial reporting was maintained in all material respects. Our audit included obtaining an understanding of internal control over financial reporting, assessing the risk that a material weakness exists, and testing and evaluating the design and operating effectiveness of internal control based on the assessed risk. Our audit also included performing such other procedures as we considered necessary in the circumstances. We believe that our audit provides a reasonable basis for our opinion.
A company’s internal control over financial reporting is a process designed to provide reasonable assurance regarding the reliability of financial reporting and the preparation of financial statements for external purposes in accordance with generally accepted accounting principles. A company’s internal control over financial reporting includes those policies and procedures that (1) pertain to the maintenance of records that, in reasonable detail, accurately and fairly reflect the transactions and dispositions of the assets of the company; (2) provide reasonable assurance that transactions are recorded as necessary to permit preparation of financial statements in accordance with generally accepted accounting principles, and that receipts and expenditures of the company are being made only in accordance with authorizations of management and directors of the company; and (3) provide reasonable assurance regarding prevention or timely detection of unauthorized acquisition, use, or disposition of the company’s assets that could have a material effect on the financial statements.
Because of its inherent limitations, internal control over financial reporting may not prevent or detect misstatements. Also, projections of any evaluation of effectiveness to future periods are subject to the risk that controls may become inadequate because of changes in conditions, or that the degree of compliance with the policies or procedures may deteriorate.
A material weakness is a deficiency, or a combination of deficiencies, in internal control over financial reporting, such that there is a reasonable possibility that a material misstatement of the company’s annual or interim financial statements will not be prevented or detected on a timely basis. A material weakness related to the inadequate design and operating effectiveness of controls over the accounting for the acquisition of Tonsan Adhesive, Inc. has been identified and included in management’s assessment.
We also have audited, in accordance with the standards of the Public Company Accounting Oversight Board (United States), the consolidated balance sheets of H.B. Fuller Company and subsidiaries as of November 28, 2015 and November 29, 2014, and the related consolidated statements of income, comprehensive income (loss), total equity, and cash flows for each of the years in the three-year period ended November 28, 2015. This material weakness was considered in determining the nature, timing, and extent of audit tests applied in our audit of the November 28, 2015 consolidated financial statements, and this report does not affect our report dated January 27, 2016, which expressed an unqualified opinion on those consolidated financial statements.
In our opinion, because of the effect of the aforementioned material weakness on the achievement of the objectives of the control criteria, H.B. Fuller Company has not maintained effective internal control over financial reporting as of November 28, 2015, based on criteria established in Internal Control – Integrated Framework (2013) issued by the Committee of Sponsoring Organizations of the Treadway Commission (COSO).
H.B. Fuller Company acquired Tonsan Adhesive, Inc. and Continental Products Limited in February 2015, and management excluded from its assessment of the effectiveness of internal control over financial reporting as of November 28, 2015, Tonsan Adhesive, Inc. and Continental Products Limited’s internal control over financial reporting associated with assets of approximately 16 percent of H.B. Fuller Company’s total assets and revenues of approximately 5 percent of H.B. Fuller Company’s total revenues included in the consolidated financial statements of H.B. Fuller Company and subsidiaries as of and for the year ended November 28, 2015. Our audit of internal control over financial reporting of H.B. Fuller Company also excluded an evaluation of the internal control over financial reporting of Tonsan Adhesive, Inc. and Continental Products Limited.
/s/ KPMG LLP
Minneapolis, Minnesota
January 27, 2016
CONSOLIDATED STATEMENTS OF INCOME
H.B. Fuller Company and Subsidiaries
(In thousands, except per share amounts)
|
Fiscal Years |
||||||||||||
|
November 28, |
November 29, |
November 30, |
||||||||||
|
2015 |
2014 |
2013 |
||||||||||
|
Net revenue |
$ | 2,083,660 | $ | 2,104,454 | $ | 2,046,968 | ||||||
|
Cost of sales |
(1,515,617 | ) | (1,571,164 | ) | (1,476,797 | ) | ||||||
|
Gross profit |
568,043 | 533,290 | 570,171 | |||||||||
|
Selling, general and administrative expenses |
(397,558 | ) | (383,449 | ) | (374,669 | ) | ||||||
|
Special charges, net |
(4,654 | ) | (51,501 | ) | (45,087 | ) | ||||||
|
Other (expense) income, net |
(2,465 | ) | 716 | (3,751 | ) | |||||||
|
Interest expense |
(25,021 | ) | (19,744 | ) | (19,120 | ) | ||||||
|
Income from continuing operations before income taxes and income from equity method investments |
138,345 | 79,312 | 127,544 | |||||||||
|
Income taxes |
(55,855 | ) | (34,348 | ) | (39,949 | ) | ||||||
|
Income from equity method investments |
5,907 | 5,187 | 8,380 | |||||||||
|
Income from continuing operations |
88,397 | 50,151 | 95,975 | |||||||||
|
Income (loss) from discontinued operations, net of tax |
(1,300 | ) | - | 1,211 | ||||||||
|
Net income including non-controlling interests |
87,097 | 50,151 | 97,186 | |||||||||
|
Net income attributable to non-controlling interests |
(417 | ) | (378 | ) | (425 | ) | ||||||
|
Net income attributable to H.B. Fuller |
$ | 86,680 | $ | 49,773 | $ | 96,761 | ||||||
|
Earnings per share attributable to H.B. Fuller common stockholders: |
||||||||||||
|
Basic |
||||||||||||
|
Income from continuing operations |
$ | 1.75 | $ | 1.00 | $ | 1.92 | ||||||
|
Income (loss) from discontinued operations |
$ | (0.03 | ) | $ | - | $ | 0.02 | |||||
|
Basic earnings per share |
$ | 1.72 | $ | 1.00 | $ | 1.94 | ||||||
|
Diluted |
||||||||||||
|
Income from continuing operations |
$ | 1.71 | $ | 0.97 | $ | 1.87 | ||||||
|
Income (loss) from discontinued operations |
$ | (0.03 | ) | $ | - | $ | 0.02 | |||||
|
Diluted earnings per share |
$ | 1.69 | $ | 0.97 | $ | 1.89 | ||||||
|
Weighted-average common shares outstanding: |
||||||||||||
|
Basic |
50,274 | 50,006 | 49,893 | |||||||||
|
Diluted |
51,393 | 51,255 | 51,136 | |||||||||
|
Dividends declared per common share |
$ | 0.510 | $ | 0.460 | $ | 0.385 | ||||||
See accompanying Notes to Consolidated Financial Statements.
CONSOLIDATED STATEMENTS OF COMPREHENSIVE INCOME (LOSS)
H.B. Fuller Company and Subsidiaries
(In thousands)
|
Fiscal Years |
||||||||||||
|
November 28, |
November 29, |
November 30, |
||||||||||
|
2015 |
2014 |
2013 |
||||||||||
|
Net income including non-controlling interests |
$ | 87,097 | $ | 50,151 | $ | 97,186 | ||||||
|
Other comprehensive income (loss) |
||||||||||||
|
Foreign currency translation |
(62,776 | ) | (38,687 | ) | (931 | ) | ||||||
|
Defined benefit pension plans adjustment, net of tax |
(15,871 | ) | (36,874 | ) | 68,196 | |||||||
|
Interest rate swaps, net of tax |
40 | 41 | 41 | |||||||||
|
Cash-flow hedges, net of tax |
(1,342 | ) | 116 | 303 | ||||||||
|
Other comprehensive income (loss) |
(79,949 | ) | (75,404 | ) | 67,609 | |||||||
|
Comprehensive income (loss) |
7,148 | (25,253 | ) | 164,795 | ||||||||
|
Less: Comprehensive income attributable to non-controlling interests |
400 | 364 | 370 | |||||||||
|
Comprehensive income (loss) attributable to H.B. Fuller |
$ | 6,748 | $ | (25,617 | ) | $ | 164,425 | |||||
See accompanying Notes to Consolidated Financial Statements.
CONSOLIDATED BALANCE SHEETS
H.B. Fuller Company and Subsidiaries
(In thousands, except share and per share amounts)
|
November 28, |
November 29, |
|||||||
|
2015 |
2014 |
|||||||
|
Assets |
||||||||
|
Current assets: |
||||||||
|
Cash and cash equivalents |
$ | 119,168 | $ | 77,569 | ||||
|
Trade receivables, net |
364,704 | 341,307 | ||||||
|
Inventories |
248,504 | 251,290 | ||||||
|
Other current assets |
68,675 | 93,105 | ||||||
|
Current assets of discontinued operations |
- | 1,865 | ||||||
|
Total current assets |
801,051 | 765,136 | ||||||
|
Property, plant and equipment, net |
512,860 | 502,634 | ||||||
|
Goodwill |
354,204 | 255,972 | ||||||
|
Other intangibles, net |
212,993 | 195,938 | ||||||
|
Other assets |
161,144 | 149,326 | ||||||
|
Total assets |
$ | 2,042,252 | $ | 1,869,006 | ||||
|
Liabilities, redeemable non-controlling interest and total equity |
||||||||
|
Current liabilities: |
||||||||
|
Notes payable |
$ | 30,757 | $ | 27,149 | ||||
|
Current maturities of long-term debt |
22,500 | - | ||||||
|
Trade payables |
177,864 | 174,494 | ||||||
|
Accrued compensation |
52,079 | 45,746 | ||||||
|
Income taxes payable |
8,970 | 13,761 | ||||||
|
Other accrued expenses |
57,355 | 51,049 | ||||||
|
Current liabilities of discontinued operations |
- | 5,000 | ||||||
|
Total current liabilities |
349,525 | 317,199 | ||||||
|
Long-term debt |
669,606 | 547,735 | ||||||
|
Accrued pension liabilities |
76,324 | 67,193 | ||||||
|
Other liabilities |
69,272 | 41,775 | ||||||
|
Total liabilities |
1,164,727 | 973,902 | ||||||
|
Commitments and contingencies |
||||||||
|
Redeemable non-controlling interest |
4,199 | 4,654 | ||||||
|
Equity: |
||||||||
|
H.B. Fuller stockholders' equity: |
||||||||
|
Preferred stock (no shares outstanding) Shares authorized – 10,045,900 |
- | - | ||||||
|
Common stock, par value $1.00 per share, Shares authorized – 160,000,000, Shares outstanding – 50,074,310 and 50,310,803, for 2015 and 2014, respectively |
50,074 | 50,311 | ||||||
|
Additional paid-in capital |
55,522 | 53,269 | ||||||
|
Retained earnings |
994,608 | 933,819 | ||||||
|
Accumulated other comprehensive income (loss) |
(227,284 | ) | (147,352 | ) | ||||
|
Total H.B. Fuller stockholders' equity |
872,920 | 890,047 | ||||||
|
Non-controlling interests |
406 | 403 | ||||||
|
Total equity |
873,326 | 890,450 | ||||||
|
Total liabilities, redeemable non-controlling interest and total equity |
$ | 2,042,252 | $ | 1,869,006 | ||||
See accompanying Notes to Consolidated Financial Statements.
CONSOLIDATED STATEMENTS OF TOTAL EQUITY
H.B. Fuller Company and Subsidiaries
(In thousands)
|
H.B. Fuller Company Shareholders |
||||||||||||||||||||||||
|
Common Stock |
Additional Paid-in Capital |
Retained Earnings |
Accumulated Other Comprehensive Income (Loss) |
Non-Controlling Interests |
Total |
|||||||||||||||||||
|
Balance at December 1, 2012 |
$ | 49,903 | $ | 37,965 | $ | 830,031 | $ | (139,626 | ) | $ | 425 | $ | 778,698 | |||||||||||
|
Comprehensive income (loss) |
- | - | 96,761 | 67,664 | 370 | 164,795 | ||||||||||||||||||
|
Dividends |
- | - | (19,484 | ) | - | - | (19,484 | ) | ||||||||||||||||
|
Stock option exercises |
462 | 8,429 | - | - | - | 8,891 | ||||||||||||||||||
|
Share-based compensation plans other, net |
301 | 12,621 | - | - | - | 12,922 | ||||||||||||||||||
|
Tax benefit on share-based compensation plans |
- | 2,676 | - | - | - | 2,676 | ||||||||||||||||||
|
Repurchases of common stock |
(437 | ) | (17,201 | ) | - | - | - | (17,638 | ) | |||||||||||||||
|
Redeemable non-controlling interest |
- | - | - | - | (399 | ) | (399 | ) | ||||||||||||||||
|
Balance at November 30, 2013 |
50,229 | 44,490 | 907,308 | (71,962 | ) | 396 | 930,461 | |||||||||||||||||
|
Comprehensive income (loss) |
- | - | 49,773 | (75,390 | ) | 364 | (25,253 | ) | ||||||||||||||||
|
Dividends |
- | - | (23,262 | ) | - | - | (23,262 | ) | ||||||||||||||||
|
Stock option exercises |
330 | 6,522 | - | - | - | 6,852 | ||||||||||||||||||
|
Share-based compensation plans other, net |
70 | 14,092 | - | - | - | 14,162 | ||||||||||||||||||
|
Tax benefit on share-based compensation plans |
- | 3,357 | - | - | - | 3,357 | ||||||||||||||||||
|
Repurchases of common stock |
(318 | ) | (15,192 | ) | - | - | - | (15,510 | ) | |||||||||||||||
|
Redeemable non-controlling interest |
- | - | - | - | (357 | ) | (357 | ) | ||||||||||||||||
|
Balance at November 29, 2014 |
50,311 | 53,269 | 933,819 | (147,352 | ) | 403 | 890,450 | |||||||||||||||||
|
Comprehensive income (loss) |
- | - | 86,680 | (79,932 | ) | 400 | 7,148 | |||||||||||||||||
|
Dividends |
- | - | (25,891 | ) | - | - | (25,891 | ) | ||||||||||||||||
|
Stock option exercises |
234 | 4,397 | - | - | - | 4,631 | ||||||||||||||||||
|
Share-based compensation plans other, net |
83 | 15,159 | - | - | - | 15,242 | ||||||||||||||||||
|
Tax benefit on share-based compensation plans |
- | 1,433 | - | - | - | 1,433 | ||||||||||||||||||
|
Repurchases of common stock |
(554 | ) | (18,736 | ) | - | - | - | (19,290 | ) | |||||||||||||||
|
Non-controlling interest assumed |
- | - | - | - | 14,197 | 14,197 | ||||||||||||||||||
|
Recognition of non-controlling interest redemption liability |
- | - | - | - | (11,773 | ) | (11,773 | ) | ||||||||||||||||
|
Purchase of non-controlling interest |
- | - | - | - | (2,424 | ) | (2,424 | ) | ||||||||||||||||
|
Non-controlling interest |
- | - | - | - | (76 | ) | (76 | ) | ||||||||||||||||
|
Redeemable non-controlling interest |
- | - | - | - | (321 | ) | (321 | ) | ||||||||||||||||
|
Balance at November 28, 2015 |
$ | 50,074 | $ | 55,522 | $ | 994,608 | $ | (227,284 | ) | $ | 406 | $ | 873,326 | |||||||||||
See accompanying Notes to Consolidated Financial Statements.
CONSOLIDATED STATEMENTS of CASH FLOWS
H.B. Fuller Company and Subsidiaries
(In thousands)
|
Fiscal Years |
||||||||||||
|
November 28, |
November 29, |
November 30, |
||||||||||
|
2015 |
2014 |
2013 |
||||||||||
|
Cash flows from operating activities from continuing operations: |
||||||||||||
|
Net income including non-controlling interests |
$ | 87,097 | $ | 50,151 | $ | 97,186 | ||||||
|
(Income) loss from discontinued operations, net of tax |
1,300 | - | (1,211 | ) | ||||||||
|
Adjustments to reconcile net income including non-controlling interests to net cash provided by operating activities: |
||||||||||||
|
Depreciation |
48,305 | 47,254 | 39,149 | |||||||||
|
Amortization |
26,984 | 23,240 | 22,508 | |||||||||
|
Deferred income taxes |
6,645 | 4,154 | 9,648 | |||||||||
|
(Income) from equity method investments, net of dividends received |
(3,042 | ) | (2,857 | ) | 4,559 | |||||||
|
Share-based compensation |
14,156 | 13,376 | 12,317 | |||||||||
|
Pension and other postretirement benefit plan contributions |
(4,645 | ) | (12,575 | ) | (6,811 | ) | ||||||
|
Pension and other postretirement benefit plan income (expense) |
(3,572 | ) | 20,399 | (1,777 | ) | |||||||
|
Excess tax benefit from share-based compensation |
(1,433 | ) | (3,357 | ) | (2,676 | ) | ||||||
|
Non-cash charge for the sale of inventories revalued at the date of acquisition |
2,416 | 138 | 189 | |||||||||
|
Change in assets and liabilities, net of effects of acquisitions: |
||||||||||||
|
Trade receivables, net |
(12,038 | ) | (18,893 | ) | (7,281 | ) | ||||||
|
Inventories |
(4,588 | ) | (36,227 | ) | (11,797 | ) | ||||||
|
Other assets |
11,991 | (41,711 | ) | (13,848 | ) | |||||||
|
Trade payables |
5,794 | (14,544 | ) | 16,258 | ||||||||
|
Accrued compensation |
5,982 | (28,103 | ) | 3,786 | ||||||||
|
Other accrued expenses |
9,691 | 6,006 | 4,793 | |||||||||
|
Income taxes payable |
(1,369 | ) | (112 | ) | (17,933 | ) | ||||||
|
Other liabilities |
(1,778 | ) | (9,941 | ) | (3,263 | ) | ||||||
|
Other |
22,633 | 33,336 | (11,103 | ) | ||||||||
|
Net cash provided by operating activities from continuing operations |
210,529 | 29,734 | 132,693 | |||||||||
|
Cash flows from investing activities from continuing operations: |
||||||||||||
|
Purchased property, plant and equipment |
(58,624 | ) | (139,794 | ) | (124,288 | ) | ||||||
|
Purchased businesses, net of cash acquired |
(217,572 | ) | (26,334 | ) | (8,614 | ) | ||||||
|
Purchased technology |
- | - | (2,387 | ) | ||||||||
|
Proceeds from litigation award |
12,049 | - | - | |||||||||
|
Proceeds from sale of property, plant and equipment |
5,326 | 6,111 | 2,135 | |||||||||
|
Net cash used in investing activities from continuing operations |
(258,821 | ) | (160,017 | ) | (133,154 | ) | ||||||
|
Cash flows from financing activities from continuing operations: |
||||||||||||
|
Proceeds from long-term debt |
357,000 | 560,000 | 107,034 | |||||||||
|
Repayment of long-term debt |
(211,250 | ) | (483,250 | ) | (129,502 | ) | ||||||
|
Net proceeds from (payments on) notes payable |
(2,623 | ) | 6,602 | (545 | ) | |||||||
|
Dividends paid |
(25,683 | ) | (23,087 | ) | (19,334 | ) | ||||||
|
Distribution to redeemable non-controlling interest |
- | - | (244 | ) | ||||||||
|
Proceeds from stock options exercised |
4,631 | 6,852 | 8,891 | |||||||||
|
Excess tax benefit from share-based compensation |
1,433 | 3,357 | 2,676 | |||||||||
|
Repurchases of common stock |
(19,290 | ) | (15,510 | ) | (17,638 | ) | ||||||
|
Net cash provided by (used in) financing activities from continuing operations |
104,218 | 54,964 | (48,662 | ) | ||||||||
|
Effect of exchange rate changes on cash and cash equivalents |
(9,033 | ) | (2,233 | ) | 2,671 | |||||||
|
Net change in cash and cash equivalents from continuing operations |
46,893 | (77,552 | ) | (46,452 | ) | |||||||
|
Cash provided by (used in) operating activities of discontinued operations |
(5,294 | ) | - | 1,137 | ||||||||
|
Net change in cash and cash equivalents |
41,599 | (77,552 | ) | (45,315 | ) | |||||||
|
Cash and cash equivalents at beginning of year |
77,569 | 155,121 | 200,436 | |||||||||
|
Cash and cash equivalents at end of year |
$ | 119,168 | $ | 77,569 | $ | 155,121 | ||||||
|
Supplemental disclosure of cash flow information: |
||||||||||||
|
Dividends paid with company stock |
$ | 208 | $ | 175 | $ | 150 | ||||||
|
Cash paid for interest, net of amount capitalized of $136, $2,725 and $1,921 for the years ended November 28, 2015, November 29, 2014 and November 30, 2013, respectively |
$ | 27,156 | $ | 24,758 | $ | 23,574 | ||||||
|
Cash paid for income taxes, net of refunds |
$ | 33,076 | $ | 16,599 | $ | 41,920 | ||||||
See accompanying Notes to Consolidated Financial Statements.
NOTES TO CONSOLIDATED FINANCIAL STATEMENTS
H.B. Fuller Company and Subsidiaries
(In thousands, except share and per share amounts)
Note 1: Nature of Business and Summary of Significant Accounting Policies
Nature of Business: H.B. Fuller Company and its subsidiaries formulate, manufacture and market adhesives, sealants and other specialty chemical products globally, with sales operations in 36 countries in North America, Europe, Latin America, the Asia Pacific region, India, the Middle East and Africa.
Our business is reported in four operating segments: Americas Adhesives, EIMEA (Europe, India, Middle East and Africa), Asia Pacific and Construction Products. Of the 2015 net revenue, Americas Adhesives operating segment accounted for 42 percent, EIMEA 29 percent, Asia Pacific 18 percent and Construction Products 11 percent.
The Americas Adhesives, EIMEA and Asia Pacific operating segments produce and supply industrial adhesives products for applications in various markets including assembly (appliances, filters, construction, automotive, electronics, solar, etc.), packaging (food and beverage containers, flexible packaging, consumer goods, package integrity and re-enforcement, durable and non-durable goods, etc.), converting (corrugation, tape and label, paper converting, envelopes, books, multi-wall bags, sacks, tissue and towel), nonwoven and hygiene (disposable diapers, feminine care and medical garments), performance wood (windows, doors, wood flooring) and textile (footwear, sportswear, etc.).
The Construction Products operating segment includes products used for tile setting (adhesives, grouts, mortars, sealers, levelers, etc.) and heating, ventilation and air conditioning and insulation applications (duct sealants, weather barriers and fungicidal coatings, block fillers, etc.).
Principles of Consolidation: The Consolidated Financial Statements include the accounts of H.B. Fuller Company and its wholly-owned and majority-owned subsidiaries. All significant intercompany transactions and accounts have been eliminated. Investments in affiliated companies in which we exercise significant influence, but which we do not control, are accounted for in the Consolidated Financial Statements under the equity method of accounting. As such, consolidated net income includes our equity portion in current earnings of such companies, after elimination of intercompany profits. Investments in which we do not exercise significant influence (generally less than a 20 percent ownership interest) are accounted for under the cost method.
Our 50 percent ownership in Sekisui-Fuller Company, Ltd., our Japan joint venture, is accounted for under the equity method of accounting as we do not exercise control over the company. For fiscal years 2015 and 2014, this equity method investment exceeded the 10 percent threshold but not the 20 percent threshold test for a significant subsidiary as defined in Rule 1-02(w) of Regulation S-X under the Securities Exchange Act of 1934. As such, summarized financial information as of November 28, 2015 and November 29, 2014 for Sekisui-Fuller Company, Ltd. is as follows:
|
As of November 28, 2015 |
As of November 29, 2014 |
|||||||
|
Current assets |
$ | 86,937 | $ | 82,195 | ||||
|
Non-current assets |
22,607 | 21,257 | ||||||
|
Current liabilities |
38,280 | 37,021 | ||||||
|
Non-current liabilities |
2,041 | 1,787 | ||||||
|
For the year ended November 28, 2015 |
For the year ended November 29, 2014 |
|||||||
|
Net revenue |
$ | 159,518 | $ | 181,999 | ||||
|
Gross profit |
40,982 | 47,955 | ||||||
|
Net income |
12,365 | 14,024 | ||||||
Our fiscal year ends on the Saturday closest to November 30. Fiscal year-end dates were November 28, 2015, November 29, 2014 and November 30, 2013 for 2015, 2014 and 2013, respectively.
Use of Estimates: Preparation of the Consolidated Financial Statements in conformity with U.S. generally accepted accounting principles (U.S. GAAP) requires us to make estimates and assumptions that affect the amounts reported in the financial statements and accompanying notes. Actual results could differ from those estimates.
Revenue Recognition: For shipments made to customers, title generally passes to the customer when all requirements of the sales arrangement have been completed, which is generally at the time of delivery. Revenue from product sales is recorded when title to the product transfers, no remaining performance obligations exist, the terms of the sale are fixed and collection is probable. Shipping terms include title transfer at either shipping point or destination. Stated terms in sale agreements also include payment terms and freight terms. Net revenues include shipping revenues as appropriate.
Provisions for sales returns are estimated based on historical experience, and are adjusted for known returns, if material. Customer incentive programs (primarily volume purchase rebates) and arrangements such as cooperative advertising, slotting fees and buy-downs are recorded as a reduction of net revenue in accordance with Financial Accounting Standards Board (FASB) Accounting Standard Codification (ASC) 605-50, Customer Payments and Incentives. Customer rebates recorded in the Consolidated Statements of Income as a reduction of net revenue, were $13,951, $12,428 and $11,552 in 2015, 2014 and 2013, respectively.
For certain products, consigned inventory is maintained at customer locations. For these products, revenue is recognized in the period that the inventory is consumed. Sales to distributors also require a distribution agreement or purchase order. As a normal practice, distributors do not have a right of return.
Cost of Sales: Cost of sales includes raw materials, container costs, direct labor, manufacturing overhead, shipping and receiving costs, freight costs, depreciation of manufacturing equipment and other less significant indirect costs related to the production of our products.
Selling, General and Administrative (SG&A) Expenses: SG&A expenses include sales and marketing, research and development, technical and customer service, finance, legal, human resources, general management and similar expenses.
Income Taxes: The income tax provision is computed based on the pre-tax income included in the Consolidated Statements of Income before income from equity method investments. The asset and liability approach is used to recognize deferred tax assets and liabilities for the expected future tax consequences of temporary differences between the carrying amounts and the tax bases of assets and liabilities. Enacted statutory tax rates applicable to future years are applied to differences between the financial statement carrying amounts and the tax basis of existing assets and liabilities. The effect on deferred taxes of a change in tax rates is recognized in income in the period that includes the enactment date. Valuation allowances reduce deferred tax assets when it is not more-likely-than-not that a tax benefit will be realized. See Note 8 for further information.
Acquisition Accounting: As we enter into business combinations we perform acquisition accounting requirements including the following:
|
|
● |
Identifying the acquirer, |
|
|
● |
Determining the acquisition date, |
|
|
● |
Recognizing and measuring the identifiable assets acquired and the liabilities assumed, and |
|
|
● |
Recognizing and measuring goodwill or a gain from a bargain purchase |
We complete valuation procedures, and record the resulting fair value of the acquired assets and assumed liabilities based upon the valuation of the business enterprise and the tangible and intangible assets acquired. Enterprise value allocation methodology requires management to make assumptions and apply judgment to estimate the fair value of assets acquired and liabilities assumed. If estimates or assumptions used to complete the enterprise valuation and estimates of the fair value of the acquired assets and assumed liabilities significantly differed from assumptions made, the resulting difference could materially affect the fair value of net assets.
The calculation of the fair value of the tangible assets, including property, plant and equipment utilizes the cost approach, which computes the cost to replace the asset, less accrued depreciation resulting from physical deterioration, functional obsolescence and external obsolescence. The calculation of the fair value of the identified intangible assets are determined using cash flow models following the income approach or a discounted market-based methodology approach. Significant inputs include estimated revenue growth rates, gross margins, operating expenses, estimated attrition rate, and a discount rate. Goodwill is recorded as the difference in the fair value of the acquired assets and assumed liabilities and the purchase price.
Cash Equivalents: Cash equivalents are highly liquid instruments with an original maturity of three months or less. We review cash and cash equivalent balances on a bank by bank basis to identify book overdrafts. Book overdrafts occur when the amount of outstanding checks exceed the cash deposited at a given bank. Book overdrafts, if any, are included in trade payables in our Consolidated Balance Sheets and in operating activities from continuing operations in our Consolidated Statements of Cash Flows.
Restrictions on Cash: There were no restrictions on cash as of November 28, 2015. There are no contractual or regulatory restrictions on the ability of consolidated and unconsolidated subsidiaries to transfer funds to us, except for typical statutory restrictions which prohibit distributions in excess of net capital or similar tests. The majority of our cash in non-U.S. locations is considered indefinitely reinvested.
Trade Receivable and Allowances: Trade receivables are recorded at the invoiced amount and do not bear interest. Allowances are maintained for doubtful accounts, credits related to pricing or quantities shipped and early payment discounts. The allowance for doubtful accounts includes an estimate of future uncollectible receivables based on the aging of the receivable balance and our collection experience. The allowance also includes specific customer accounts when it is probable that the full amount of the receivable will not be collected. Invoices are written off against the allowance when the invoice is 18 months past terms. See Note 4 for further information.
Inventories: Inventories recorded at cost (not in excess of market value) as determined by the last-in, first-out method (LIFO) represent approximately 39 percent of consolidated inventories. During 2015, 2014 and 2013 there were no significant liquidations of LIFO inventory layers or significant LIFO liquidation gains or losses. The remaining inventories, which include all non-U.S. operations, are valued at the lower of cost (mainly weighted-average actual cost) or market value.
Investments: Investments with a value of $5,915 and $7,196 represent the cash surrender value of life insurance contracts as of November 28, 2015 and November 29, 2014, respectively. These assets are held to primarily support supplemental pension plans and are recorded in other assets in the Consolidated Balance Sheets. The corresponding gain or loss associated with these contracts is reported in earnings each period as a component of other income (expense), net.
Cost Method Investments: Investments in an entity where we own less than 20% of the voting stock of the entity and do not exercise significant influence over operating and financial policies of the entity are accounted for using the cost method. We have a policy in place to review our investments at least annually, to evaluate the accounting method and carrying value of our investments in unconsolidated investees. Our cost method investments are evaluated, on at least a quarterly basis, for potential other-than-temporary impairment, or when an event or change in circumstances has occurred that may have a significant adverse effect on the fair value of the investments. If we believe that the carrying value of an investment is in excess of its estimated fair value, it is our policy to record an impairment charge to adjust the carrying value to the estimated fair value, if the impairment is considered other-than-temporary. We did not have any impairment of our cost method investments for the years ended November 28, 2015, November 29, 2014 and November 30, 2013. The book value of the cost method investments was $1,666 as of November 28, 2015 and $1,671 as of November 29, 2014.
Property, Plant and Equipment: Property, plant and equipment are carried at cost and depreciated over the useful lives of the assets using the straight-line method. Estimated useful lives range from 20 to 40 years for buildings and improvements, 3 to 20 years for machinery and equipment, and the shorter of the lease or expected life for leasehold improvements. Fully depreciated assets are retained in property and accumulated depreciation accounts until removed from service. Upon disposal, assets and related accumulated depreciation are removed. Upon sale of an asset, the difference between the proceeds and remaining net book value is charged or credited to other income (expense), net on the Consolidated Statements of Income. Expenditures that add value or extend the life of the respective assets are capitalized, while expenditures that are typical recurring repairs and maintenance are expensed as incurred. Interest costs associated with construction and implementation of property, plant and equipment of $136, $2,725 and $1,921 were capitalized in 2015, 2014 and 2013, respectively.
Goodwill: We test goodwill for impairment annually during the fourth quarter and whenever events occur or changes in circumstances indicate that impairment may have occurred. Impairment testing is performed for each of our reporting units by comparing the reporting unit’s estimated fair value to its carrying amount, including goodwill. We use a discounted cash flow approach to estimate the fair value of our reporting units. Our judgment is required in developing the assumptions for the discounted cash flow model. These assumptions include revenue growth rates, profit margin percentages, discount rates, perpetuity growth rates, future capital expenditures and working capital requirements. If the estimated fair value of a reporting unit exceeds its carrying value, goodwill is considered to not be impaired. If the carrying value exceeds estimated fair value, there is an indication of potential impairment, and we calculate an implied fair value of goodwill. The implied fair value is calculated as the difference between the fair value of the reporting unit and the fair value of the individual assets and liabilities of the reporting unit, excluding goodwill. An impairment charge is recorded for any excess of the carrying value over the implied fair value. Based on our 2015 annual assessment, we determined that none of our goodwill was impaired.
Intangible Assets: Intangible assets include patents and other intangible assets acquired from independent parties and are amortized on a straight-line basis with estimated useful lives ranging from 3 to 20 years. The straight-line method of amortization of these assets reflects an appropriate allocation of the costs of the intangible assets to earnings in proportion to the amount of economic benefits obtained in each reporting period.
Impairment of Long-Lived Assets: Our long-lived assets are tested for impairment whenever events or circumstances indicate that a carrying amount of an asset (asset group) may not be recoverable. An impairment loss would be measured and recognized when the carrying amount of an asset (asset group) exceeds the estimated undiscounted future cash flows expected to result from the use of the asset (asset group) and its eventual disposition. The impairment loss to be recorded would be the excess of the asset's carrying value over its fair value. Fair value is generally determined using a discounted cash flow analysis or other valuation technique. Costs related to internally developed intangible assets are expensed as incurred.
Foreign Currency Translation: Assets and liabilities of non-U.S. functional currency entities are translated to U.S. dollars at period-end exchange rates, and the resulting gains and losses arising from the translation of those net assets are recorded as a cumulative translation adjustment, a component of accumulated other comprehensive income (loss) in stockholders' equity. Revenues and expenses are translated using average exchange rates during the year. Foreign currency transaction gains and losses are included in other income (expense), net in the Consolidated Statements of Income.
We consider a subsidiary’s sales price drivers, currency denomination of sales transactions and inventory purchases to be the primary indicators in determining a foreign subsidiary’s functional currency. Our subsidiaries in Latin America and certain European countries have a functional currency different than their local currency. All other foreign subsidiaries, which are located in North America, Europe and Asia, have the same local and functional currency.
Pension and Other Postretirement Benefits: We sponsor defined-benefit pension plans in both the U.S. and non-U.S. entities. Also in the U.S., we sponsor other postretirement plans for health care and life insurance benefits. Expenses and liabilities for the pension plans and other postretirement plans are actuarially calculated. These calculations are based on our assumptions related to the discount rate, expected return on assets, projected salary increases and health care cost trend rates. The discount rate assumption is determined using an actuarial yield curve approach, which results in a discount rate that reflects the characteristics of the plan. The approach identifies a broad population of corporate bonds that meet the quality and size criteria for the particular plan. We use this approach rather than a specific index that has a certain set of bonds that may or may not be representative of the characteristics of our particular plan. Our expected long-term rate of return on U.S. plan assets was based on our target asset allocation assumption of 60 percent equities and 40 percent fixed-income. Management, in conjunction with our external financial advisors, determines the expected long-term rate of return on plan assets by considering the expected future returns and volatility levels for each asset class that are based on historical returns and forward-looking observations. The expected long-term rate of return on plan assets assumption used in each non-U.S. plan is determined on a plan-by-plan basis for each local jurisdiction and is based on expected future returns for the investment mix of assets currently in the portfolio for that plan. Management, in conjunction with our external financial advisors, develops expected rates of return for each plan, considers expected long-term returns for each asset category in the plan, reviews expectations for inflation for each local jurisdiction, and estimates the impact of active management of the plan’s assets. Note 10 includes disclosure of assumptions employed in these measurements for both the non-U.S. and U.S. plans.
Asset Retirement Obligations: We recognize asset retirement obligations (AROs) in the period in which we have an existing legal obligation associated with the retirement of a tangible long-lived asset, and the amount can be reasonably estimated. The ARO is recognized at fair value when the liability is incurred. Upon initial recognition of a liability, that cost is capitalized as part of the related long-lived asset and depreciated on a straight-line basis over the remaining estimated useful life of the related asset. We have recognized a liability related to special handling of asbestos related materials in certain facilities for which we have plans or expectation of plans to undertake a major renovation or demolition project that would require the removal of asbestos or have plans or expectation of plans to exit a facility. In addition, we have determined that we have facilities with some level of asbestos that will require abatement action in the future. Once the probability and timeframe of an action are determined, we apply certain assumptions to determine the related liability and asset. These assumptions include the use of inflation rates, the use of credit adjusted risk-free discount rates and the estimation of costs to handle asbestos related materials. The recorded liability is required to be adjusted for changes resulting from the passage of time and/or revisions to the timing or the amount of the original estimate. The asset retirement obligation liability was $2,274 and $2,515 at November 28, 2015 and November 29, 2014, respectively.
Environmental Costs: Environmental expenditures that relate to current operations are expensed or capitalized as appropriate. Expenditures that relate to an existing condition caused by past operations, and which do not contribute to current or future revenue generation, are expensed. Liabilities are recorded when environmental assessments are made, or remedial efforts are probable, and the costs can be reasonably estimated. The timing of these accruals is generally no later than the completion of feasibility studies.
Share-based Compensation: We have various share-based compensation programs, which provide for equity awards, including stock options and restricted stock. We use the straight-line method to recognize compensation expense associated with share-based awards based on the fair value on the date of grant, net of the estimated forfeiture rate. Expense is recognized over the requisite service period related to each award, which is the period between the grant date and the earlier of the award’s stated vesting term or the date the employee is eligible for early retirement based on the terms of the plan. The fair value of stock options is estimated using the Black-Scholes option pricing model. All of our stock compensation expense is recorded in SG&A expenses in the Consolidated Statements of Income. See Note 3 for additional information.
Earnings Per Share: Basic earnings per share is calculated by dividing net income attributable to H.B. Fuller by the weighted-average number of common shares outstanding during the applicable period. Diluted earnings per share is based upon the weighted-average number of common and common equivalent shares outstanding during the applicable period. The difference between basic and diluted earnings per share is attributable to share-based compensation awards. We use the treasury stock method to calculate the effect of outstanding awards, which computes total employee proceeds as the sum of (a) the amount the employee must pay upon exercise of the award, (b) the amount of unearned share-based compensation costs attributed to future services and (c) the amount of tax benefits, if any, that would be credited to additional paid-in capital assuming exercise of the award. Share-based compensation awards for which total employee proceeds exceed the average market price over the applicable period have an antidilutive effect on earnings per share, and accordingly, are excluded from the calculation of diluted earnings per share. The computations for basic and diluted earnings per share are as follows:
|
(shares in thousands) |
2015 |
2014 |
2013 |
|||||||||
|
Net income attributable to H.B. Fuller |
$ | 86,680 | $ | 49,773 | $ | 96,761 | ||||||
|
Weighted-average common shares – basic |
50,274 | 50,006 | 49,893 | |||||||||
|
Equivalent shares from share-based compensation plans |
1,119 | 1,249 | 1,243 | |||||||||
|
Weighted-average common and common equivalent shares – diluted |
51,393 | 51,255 | 51,136 | |||||||||
|
Basic earnings per share |
$ | 1.72 | $ | 1.00 | $ | 1.94 | ||||||
|
Diluted earnings per share |
$ | 1.69 | $ | 0.97 | $ | 1.89 | ||||||
Share-based compensation awards for 887,672, 421,810 and 112,367 shares for 2015, 2014 and 2013, respectively, were excluded from the diluted earnings per share calculation because they were antidilutive.
Financial Instruments and Derivatives: As a part of our ongoing operations, we are exposed to market risks such as changes in foreign currency exchange rates and interest rates. To manage these risks, we may enter into derivative transactions pursuant to our established policies.
Our objective is to balance, where possible, local currency denominated assets to local currency denominated liabilities to have a natural hedge and minimize foreign exchange impacts. We minimize risks from foreign currency exchange rate fluctuations through normal operating and financing activities and, when deemed appropriate, through the use of derivative instruments. Derivatives consisted primarily of forward currency contracts used to manage foreign currency denominated assets and liabilities. For derivative instruments outstanding that were not designated as hedges for accounting purposes, the gains and losses related to mark-to-market adjustments were recognized as other income or expense in the income statement during the periods the derivative instruments were outstanding. To manage exposure to currency rate movements on expected cash flows, the company may enter into cross-currency swap agreements.
The company manages interest expense using a mix of fixed and floating rate debt. To manage exposure to interest rate movements and to reduce borrowing costs, the company may enter into interest rate swap agreements.
Changes in the fair values of derivatives are recorded in net earnings or other comprehensive income, based on the type of derivative, and whether the instrument is designated and effective as a hedge transaction. Gains or losses on derivative instruments reported in accumulated other comprehensive income (loss) are reclassified to earnings in the period the hedged item affects earnings. Any ineffectiveness is recognized in earnings in the current period. We maintain master netting arrangements that allow us to net settle contracts with the same counterparties; we do not elect to offset amounts in our Consolidated Balance Sheet. These arrangements generally do not call for collateral. We do not enter into any speculative positions with regard to derivative instruments. See Note 11 for further information regarding our financial instruments.
Purchase of Company Common Stock: Under the Minnesota Business Corporation Act, repurchased stock is included in authorized shares, but is not included in shares outstanding. The excess of the repurchase cost over par value is charged to additional paid-in capital. When additional paid-in capital is exhausted, the excess reduces retained earnings. We repurchased 54,454, 67,593 and 62,124 shares of common stock in 2015, 2014 and 2013, respectively, in connection with the statutory minimum for the tax withholdings related to vesting of restricted shares.
On September 30, 2010, the Board of Directors authorized a share repurchase program of up to $100,000 of our outstanding common shares. During 2015, we repurchased 500,000 shares for $17,066 under this program. During 2014 we repurchased 250,000 shares for $12,254 and during 2013 we repurchased 375,000 shares for $15,292 under this program. See Note 9 for further information.
New Accounting Pronouncements: In January 2016, the FASB issued Accounting Standards Update (ASU) No. 2016-01, Financial Instruments - Overall (Subtopic 825-10): Recognition and Measurement of Financial Assets and Financial Liabilities, which addresses certain aspects of recognition, measurement, presentation, and disclosure of financial instruments. This guidance will be effective for us in the first quarter of our fiscal year 2019, and early adoption is not permitted. We are currently evaluating the impact that this guidance will have on our consolidated financial statements.
In November 2015, the FASB issued ASU No. 2015-17, Income Taxes (Topic 740): Balance Sheet Classification of Deferred Taxes, which amends the guidance requiring companies to separate deferred income tax liabilities and assets into current and non-current amounts in a classified statement of financial position. This accounting guidance simplifies the presentation of deferred income taxes, such that deferred tax liabilities and assets be classified as non-current in a classified statement of financial position. This accounting guidance is effective for us beginning in the first quarter of 2018, but we have elected to adopt this guidance prospectively as of November 28, 2015. As a result, we have classified all deferred tax liabilities and assets as non-current in the Consolidated Balance Sheet at November 28, 2015.
In September 2015, the FASB issued ASU No. 2015-16, Business Combinations (Topic 805), which requires that an acquirer recognizes adjustments to provisional amounts that are identified during the measurement period in the reporting period in which the adjustment amounts are determined. This guidance requires that the acquirer record, in the same period’s financial statements, the effect on earnings of changes in depreciation, amortization, or other income effects, if any, as a result of the change in provisional amounts, calculated as if the accounting had been completed at the acquisition date. This guidance requires an entity to present separately on the face of the income statement or disclose in the notes the portion of the amount recorded in current-period earnings by line item that would have been recorded in previous reporting periods if the adjustment to the provisional amounts had been recognized as of the acquisition date. Our effective date for adoption of this guidance is our fiscal year beginning December 3, 2017. We have evaluated the effect that this guidance will have on our Consolidated Financial Statements and related disclosures and determined it will not have a material impact.
In July 2015, the FASB issued ASU No. 2015-11, Inventory (Topic 330): Simplifying the Measurement of Inventory, which requires a company to measure inventory within the scope of this guidance (inventory measured using first-in, first-out (FIFO) or average cost) at the lower of cost and net realizable value methods. Subsequent measurement is unchanged for inventory measured using the last-in, first-out (LIFO) or retail inventory method. Our effective date for adoption of this guidance is our fiscal year beginning December 3, 2017. We have evaluated the effect that this guidance will have on our Consolidated Financial Statements and related disclosures and determined it will not have a material impact.
In May 2015, the FASB issued ASU No. 2015-07, Fair Value Measurement (Subtopic 820): Disclosures for Investments in Certain Entities That Calculate Net Asset Value per Share (or its Equivalent). The amendments in this guidance remove the requirement to categorize within the fair value hierarchy all investments for which fair value is measured using the net asset value per share practical expedient thus eliminating the diversity that currently exists in the disclosure of these assets. Our effective date for adoption of this guidance is our fiscal year beginning November 29, 2015. We have evaluated the effect that this guidance will have on our Consolidated Financial Statements and related disclosures and determined it will not have a material impact.
In April 2015, the FASB issued ASU No. 2015-04, Compensation–Retirement Benefits (Topic 715) Practical Expedient for the Measurement Date of an Employer’s Defined Benefit Obligation and Plan Assets. This guidance permits an entity to measure defined benefit plan assets and obligations using the month-end that is closest to the entity’s fiscal year-end for an entity with a fiscal year-end that does not coincide with a month-end. We adopted this guidance for our fiscal year ended November 28, 2015, which did not have a material impact on our consolidated financial statements.
In April 2015, the FASB issued ASU No. 2015-03, Interest-Imputation of Interest (Subtopic 835-30): Simplifying the Presentation of Debt Issue Costs. This guidance requires debt issue costs to be presented as a direct deduction from the carrying amount of debt, consistent with debt discounts. This is a change from the current presentation of classifying debt issue costs as a deferred charge. Our effective date for adoption is our fiscal year beginning December 3, 2017. We have evaluated the effect that this guidance will have on our Consolidated Financial Statements and related disclosures and determined it will not have a material impact.
In May 2014, the FASB issued ASU No. 2014-09, Revenue from Contracts with Customers (Topic 606), which requires an entity to recognize the amount of revenue to which it expects to be entitled for the transfer of promised goods or services to customers. This guidance will replace most existing revenue recognition guidance in U.S. GAAP when it becomes effective. The new standard is effective for fiscal years and interim periods beginning after December 15, 2017 (as stated in ASU No. 2015-14 which defers the effective date and was issued in August 2015) and is now effective for our fiscal year beginning December 2, 2018. Early application as of the original effective date is permitted under ASU 2015-14. The standard permits the use of either the retrospective or cumulative effect transition method. We are evaluating the effect that this guidance will have on our Consolidated Financial Statements and related disclosures. We have not yet selected a transition method nor have we determined the effect of the standard on our ongoing financial reporting.
In April 2014, the FASB issued ASU 2014-08, Reporting Discontinued Operations and Disclosures of Components of an Entity, which amends the definition of a discontinued operation and requires new disclosures of both discontinued operations and certain other disposals that do not meet the definition of a discontinued operation. This guidance is effective prospectively beginning in the first quarter of fiscal 2016. We do not expect adoption of this guidance to have a material impact on our Consolidated Financial Statements.
Note 2: Acquisitions and Divestitures
Acquisitions
Continental Products Limited: On February 3, 2015 we acquired the equity of Continental Products Limited, a provider of industrial adhesives, based in Nairobi, Kenya. The acquisition supports our growth strategy for emerging markets and delivers specialty adhesive products to key customers in East and Central Africa. The purchase price of €1,459, or approximately $1,647, net of cash acquired of €329 or $371, was funded through existing cash and was recorded in our EIMEA operating segment. We incurred acquisition related costs of approximately $16, which were recorded as SG&A expenses in the Consolidated Statements of Income.
The following table summarizes the final fair value measurement of the assets acquired and liabilities assumed as of the date of acquisition:
| Amount | ||||
|
Current assets |
$ | 1,357 | ||
|
Property, plant and equipment |
143 | |||
|
Goodwill |
462 | |||
|
Other intangibles |
||||
|
Customer relationships |
416 | |||
|
Noncompetition agreements |
30 | |||
|
Other assets |
7 | |||
|
Current liabilities |
(591 | ) | ||
|
Other liabilities |
(177 | ) | ||
|
Total purchase price |
$ | 1,647 |
The expected lives of the acquired intangible assets are 13 years for customer relationships and 3 years for noncompetition agreements.
Tonsan Adhesive, Inc. On February 2, 2015 we acquired 95 percent of the equity of Tonsan Adhesive, Inc., an independent engineering adhesives provider based in Beijing, China. The acquisition strengthens our customer relationships in the high-value, fast growing engineering adhesives markets. The purchase price was 1.4 billion Chinese renminbi, or approximately $215,925, net of cash acquired of $7,754, which was financed with proceeds from our October 31, 2014 term loan, drawn in conjunction with the acquisition. The acquisition was recorded in our Asia Pacific operating segment. We incurred acquisition related costs of approximately $373, which were recorded as SG&A expenses in the Consolidated Statements of Income.
Concurrent with the acquisition, we entered into an agreement to acquire the remaining 5 percent of Tonsan’s equity beginning February 1, 2019 for 82 million Chinese renminbi or approximately $13,038. In addition, the agreement requires us to pay up to 418 million Chinese renminbi, or approximately $66,848, in contingent consideration based upon a formula related to Tonsan’s gross profit in fiscal 2018. The fair values of the agreement to purchase the remaining equity and the contingent consideration based upon a discounted cash flow model as of the date of acquisition were $11,773 and $7,714, respectively. See Note 13 for further discussion of the fair value of the contingent consideration.
The fair value measurement was preliminary at November 28, 2015, subject to the completion of management's assessment of certain contingent liabilities. We expect the fair value measurement process to be completed in the first quarter of 2016.
The following table summarizes the preliminary fair value measurement of the assets acquired and liabilities assumed:
|
Valuation February 28, 2015 |
Fair Value Adjustments |
Valuation November 28, 2015 |
||||||||||
|
Current assets |
$ | 50,922 | $ | (1,083 | ) | $ | 49,839 | |||||
|
Property, plant and equipment |
58,549 | 593 | 59,142 | |||||||||
|
Goodwill 1 |
155,232 | (30,142 | ) | 125,090 | ||||||||
|
Other intangibles |
||||||||||||
|
Developed technology |
18,500 | 100 | 18,600 | |||||||||
|
Customer relationships |
12,400 | 13,300 | 25,700 | |||||||||
|
Trademarks/trade names |
10,900 | 100 | 11,000 | |||||||||
|
Other assets |
139 | 13,401 | 13,540 | |||||||||
|
Current liabilities |
(30,590 | ) | (7,478 | ) | (38,068 | ) | ||||||
|
Other liabilities 1 |
(49,497 | ) | 12,352 | (37,145 | ) | |||||||
|
Redeemable non-controlling interests |
(10,630 | ) | (1,143 | ) | (11,773 | ) | ||||||
|
Total purchase price |
$ | 215,925 | $ | - | $ | 215,925 | ||||||
|
1 |
Included in the fair value adjustments is the correction of an error related to the valuation of the contingent consideration and goodwill of $9,572 as of February 28, 2015. |
The expected lives of the acquired intangible assets are 7 years for developed technology, 11 years for customer relationships and 14 years for trademarks/trade names. See Note 13 for further discussion of the fair value of the acquired tangible and intangible assets.
Based on the fair value measurement of the assets acquired and liabilities assumed, we allocated $125,090 to goodwill for the expected synergies from combining Tonsan with our existing business. Such goodwill is not expected to be deductible for tax purposes. The goodwill was assigned to our Asia Pacific operating segment.
We have analyzed Tonsan’s results of operations and concluded that it does not represent a material business combination. Therefore, we have not prepared unaudited pro forma consolidated results of operations, as if the acquisition of Tonsan had occurred at the beginning of fiscal 2015.
ProSpec® Construction Products: On September 3, 2014 we acquired the ProSpec construction products business, a provider of tile and stone installation products. The purchase price of $26,183 was funded through existing cash and was recorded in our Construction Products operating segment.
The following table summarizes the final fair value measurement of the assets acquired and liabilities assumed as of the date of acquisition:
| Amount | ||||
|
Current assets |
$ | 6,502 | ||
|
Property, plant and equipment |
7,976 | |||
|
Goodwill |
7,443 | |||
|
Other intangibles |
||||
|
Customer relationships |
4,300 | |||
|
Technology |
1,500 | |||
|
Trademarks/trade names |
200 | |||
|
Current liabilities |
(1,738 | ) | ||
|
Total purchase price |
$ | 26,183 |
Plexbond Quimica, S.A.: On June 6, 2013 we acquired Plexbond Quimica, S.A., a provider of chemical urethane adhesives and polyurethane resins based in Curitiba, Brazil. The purchase price of $10,390 was funded through existing cash and was recorded in our Americas Adhesives operating segment.
Divestitures
Central America Paints: On August 6, 2012 we completed the sale of our Central America Paints business. In accordance with ASC 205-20, Discontinued Operations, we have classified the results of this business as discontinued operations. The operational results of this business are presented in income (loss) from discontinued operations, net of tax and the assets and liabilities of this business are presented on the Consolidated Balance Sheets as assets and liabilities of discontinued operations. A portion of the cash proceeds was determined to be contingent consideration, pending resolution of purchase agreement contingencies. The contingent consideration was valued at fair value based on level 3 inputs. The original contingent consideration in the amount of $5,000 was included in current liabilities of discontinued operations in the Consolidated Balance Sheets at November 29, 2014. On June 15, 2015, we entered into an agreement to settle various matters related to the divestiture of the Paints business, including the settlement of the contingent consideration for $8,000. As a result of this agreement, we recorded a loss from discontinued operations, net of tax of $1,300. We paid $8,000 related to this agreement in the third quarter of 2015.
Note 3: Accounting for Share-Based Compensation
Overview: We have various share-based compensation programs, which provide for equity awards including non-qualified stock options, incentive stock options, restricted stock shares, restricted stock units and deferred compensation. These equity awards fall under several plans and are described below. Starting in 2014 we no longer grant restricted stock shares.
Share-based Compensation Plans: We currently grant stock options and restricted stock units under equity compensation and deferred compensation plans.
Stock options are granted to officers and key employees at prices not less than fair market value at the date of grant. Non-qualified stock options are generally exercisable beginning one year from the date of grant in cumulative yearly amounts of 33.3 percent. Incentive stock options are based on certain performance based criteria and are generally exercisable at a stated date when the performance criteria is measured. Stock options generally have a contractual term of 10 years. Options exercised represent newly issued shares.
Restricted stock awards are nonvested stock-based awards that may include grants of restricted stock shares or restricted stock units. Restricted stock awards are independent of option grants and are subject to forfeiture if employment terminates prior to the release of the restrictions. Such awards generally vest beginning one year from the date of grant or 33.3 percent per year for three years, depending on the grant. During the vesting period, ownership of the shares cannot be transferred.
Restricted stock shares granted represent newly issued shares and have the same cash dividend and voting rights as other common stock and are considered to be currently issued and outstanding. The cash dividends on restricted stock shares are forfeitable.
Restricted stock units have dividend equivalent rights equal to the cash dividend paid on restricted stock shares. However, restricted stock units do not have voting rights of common stock and are not considered issued and outstanding upon grant. Restricted stock units become newly issued shares when vested. The dividend equivalent rights for restricted stock units are forfeitable.
We expense the cost, which is the grant date fair market value, of both the restricted stock shares and the restricted stock units ratably over the period during which the restrictions lapse. The grant date fair value is our closing stock price on the date of grant.
We are required to recognize compensation expense when an employee is eligible to retire. We consider employees eligible to retire at age 55 and after 10 years of service. Accordingly, the related compensation expense is recognized immediately for awards granted to retirement eligible employees or over the period from the grant date to the date retirement eligibility is achieved, if less than the stated vesting period.
Year 2013 Master Incentive Plan: This plan allows for granting of awards to employees. The plan permits granting of (a) stock options; (b) stock appreciation rights; (c) restricted stock awards; (d) performance awards; (e) dividend equivalents; and (f) other awards based on our common stock, including shares for amounts employees deferred under the Key Employee Deferred Compensation Plan.
2009 Directors’ Stock Incentive Plan: This plan permits granting of (a) shares for amounts non-employee directors defer under the Directors’ Deferred Compensation Plan and (b) discretionary grants of restricted stock, stock options, stock appreciation rights, performance awards and other stock awards.
Directors' Deferred Compensation Plan: This plan allows non-employee directors to defer all or a portion of their retainer and meeting fees in a number of investment choices, including units representing shares of our common stock. We provide a 10 percent match on deferred compensation invested in these units. These units are required to be paid out in our common stock.
Key Employee Deferred Compensation Plan: This plan allows key employees to defer a portion of their eligible compensation in a number of investment choices, including units representing shares of company common stock. We provide a 10 percent match on deferred compensation invested in these units.
Grant-Date Fair Value: We use the Black-Scholes option-pricing model to calculate the grant-date fair value of stock option awards. The fair value of options granted during 2015, 2014 and 2013 were calculated using the following assumptions:
|
2015 |
2014 |
2013 |
||||||||||||||||
|
Expected life (in years) |
4.62 | 4.75 | 4.75 | |||||||||||||||
|
Weighted-average expected volatility |
30.81 | % | 33.83 | % | 47.28 | % | ||||||||||||
|
Expected volatility range |
25.50% | - | 31.67 | % | 31.61% | - | 37.06 | % | 39.25% | - | 48.02 | % | ||||||
|
Risk-free interest rate |
1.27 | % | 1.52 | % | 0.77 | % | ||||||||||||
|
Expected dividend yield |
1.12 | % | 0.85 | % | 0.87 | % | ||||||||||||
|
Weighted-average fair value of grants |
$ | 10.05 | $ | 13.82 | $ | 15.05 | ||||||||||||
Expected life – We use historical employee exercise and option expiration data to estimate the expected life assumption for the Black-Scholes grant-date valuation. We believe that this historical data is currently the best estimate of the expected term of a new option. We use a weighted-average expected life for all awards.
Expected volatility – Volatility is calculated using our stock’s historical volatility for the same period of time as the expected life. We have no reason to believe that its future volatility will differ from the past.
Risk-free interest rate – The rate is based on the U.S. Treasury yield curve in effect at the time of the grant for the same period of time as the expected life.
Expected dividend yield – The calculation is based on the total expected annual dividend payout divided by the average stock price.
Expense
We use the straight-line attribution method to recognize expense for all option awards and restricted stock awards with graded and cliff vesting. Expense is recognized over the requisite service period, which for us is the period between the grant date and the earlier of the award’s stated vesting term or the date the employee is eligible for early vesting based on the terms of the plans.
Total share-based compensation expense was $14,156, $13,376 and $12,317 for 2015, 2014 and 2013, respectively. All share-based compensation was recorded as SG&A expense.
The benefits of tax deductions in excess of recognized compensation costs (excess tax benefits) are recorded as a financing cash inflow rather than a deduction of taxes paid. For 2015, 2014 and 2013, there was $1,433, $3,357 and $2,676 of excess tax benefit recognized resulting from share-based compensation cost, respectively. Our additional paid in capital pool (APIC Pool) of excess tax benefits available to absorb tax deficiencies was $20,180 at November 28, 2015 due to exercises of stock options, vesting of restricted stock and deferred compensation payouts in the year.
As of November 28, 2015, $7,232 of unrecognized compensation costs related to unvested stock option awards is expected to be recognized over a weighted-average period of 1.1 years. Unrecognized compensation costs related to unvested restricted stock shares was $840 which is expected to be recognized over a weighted-average period of 0.5 years and unvested restricted stock units was $5,609 which is expected to be recognized over a weighted-average period of 0.9 years.
Stock Option Activity
The stock option activity for the years ended November 28, 2015 and November 29, 2014 is summarized below:
|
Weighted- |
||||||||
|
Average |
||||||||
|
Options |
Exercise Price |
|||||||
|
Outstanding at November 30, 2013 |
2,429,961 | $ | 25.74 | |||||
|
Granted |
477,606 | 48.06 | ||||||
|
Exercised |
(330,179 | ) | 20.75 | |||||
|
Forfeited or cancelled |
(42,915 | ) | 38.59 | |||||
|
Outstanding at November 29, 2014 |
2,534,473 | $ | 30.39 | |||||
|
Granted |
759,167 | 40.69 | ||||||
|
Exercised |
(275,035 | ) | 22.67 | |||||
|
Forfeited or cancelled |
(106,532 | ) | 42.42 | |||||
|
Outstanding at November 28, 2015 |
2,912,073 | $ | 33.37 | |||||
The fair value of options granted during 2015, 2014 and 2013 was $7,632, $6,599 and $7,425, respectively. Total intrinsic value of options exercised during 2015, 2014 and 2013 was $5,327, $8,915 and $9,842, respectively. Intrinsic value is the difference between our closing stock price on the respective trading day and the exercise price, multiplied by the number of options exercised. Proceeds received from option exercises during the year ended November 28, 2015, November 29, 2014 and November 30, 2013 were $4,631, $6,852 and $8,891, respectively.
The nonvested restricted stock activity for the years ended November 28, 2015 and November 29, 2014, is summarized below:
|
Units |
Shares |
Total |
Weighted- Average Grant Date Fair Value |
Weighted- Average Remaining Contractual Life (in Years) |
||||||||||||||||
|
Nonvested at November 30, 2013 |
135,231 | 312,445 | 447,676 | $ | 33.76 | 1.2 | ||||||||||||||
|
Granted |
126,536 | - | 126,536 | 48.84 | 1.2 | |||||||||||||||
|
Vested |
(68,293 | ) | (114,044 | ) | (182,337 | ) | 48.16 | - | ||||||||||||
|
Forfeited |
(4,813 | ) | (9,779 | ) | (14,592 | ) | 37.80 | 1.1 | ||||||||||||
|
Nonvested at November 29, 2014 |
188,661 | 188,622 | 377,283 | $ | 40.70 | 1.0 | ||||||||||||||
|
Granted |
144,100 | - | 144,100 | 40.92 | 1.2 | |||||||||||||||
|
Vested |
(82,495 | ) | (69,152 | ) | (151,647 | ) | 37.47 | - | ||||||||||||
|
Forfeited |
(13,253 | ) | (9,310 | ) | (22,563 | ) | 40.66 | 0.8 | ||||||||||||
|
Nonvested at November 28, 2015 |
237,013 | 110,160 | 347,173 | $ | 42.17 | 0.8 | ||||||||||||||
Total fair value of restricted stock vested during 2015, 2014, and 2013 was $6,192, $8,782 and $6,807, respectively. The total fair value of nonvested restricted stock at November 28, 2015 was $14,639.
We repurchased 54,454, 67,593 and 62,124 restricted stock shares during 2015, 2014 and 2013, respectively, in conjunction with restricted stock share vestings. The repurchases relate to statutory minimum tax withholding.
Deferred compensation units are fully vested at the date of contribution. The deferred compensation units outstanding for the years ended November 28, 2015 and November 29, 2014 is summarized below:
|
Non-employee Directors |
Employees |
Total |
||||||||||
|
Units outstanding November 30, 2013 |
312,680 | 61,288 | 373,968 | |||||||||
|
Participant contributions |
14,347 | 4,429 | 18,776 | |||||||||
|
Company match contributions1 |
16,613 | 492 | 17,105 | |||||||||
|
Payouts |
(1,093 | ) | (13,906 | ) | (14,999 | ) | ||||||
|
Units outstanding November 29, 2014 |
342,547 | 52,303 | 394,850 | |||||||||
|
Participant contributions |
16,312 | 4,705 | 21,017 | |||||||||
|
Company match contributions1 |
21,636 | 470 | 22,106 | |||||||||
|
Payouts |
(325 | ) | (11,572 | ) | (11,897 | ) | ||||||
|
Units outstanding November 28, 2015 |
380,170 | 45,906 | 426,076 | |||||||||
1 The non-employee directors’ company match includes 20,005 and 15,019 deferred compensation units paid as discretionary awards to all non-employee directors in 2015 and 2014, respectively.
The fair value of non-employee directors’ company matches for 2015, 2014 and 2013 was $122, $130 and $49, respectively. The fair value of the non-employee directors’ discretionary award was $800 for 2015, $720 for 2014 and $480 for 2013. The fair value of employee company matches was $17 for 2015 and $19 for 2014 and $8 for 2013.
Note 4: Supplemental Financial Statement Information
Statement of Income Information
Additional details of income statement amounts for 2015, 2014 and 2013 follow.
|
2015 |
2014 |
2013 |
||||||||||
|
Foreign currency transaction losses, net |
$ | (3,549 | ) | $ | (2,546 | ) | $ | (4,106 | ) | |||
|
Interest income |
510 | 344 | 737 | |||||||||
|
Gain on disposal of fixed assets |
330 | 2,769 | 323 | |||||||||
|
Other, net |
244 | 149 | (705 | ) | ||||||||
|
Total other income (expense), net |
$ | (2,465 | ) | $ | 716 | $ | (3,751 | ) | ||||
|
Research and development expenses (included in SG&A expenses) |
$ | 26,170 | $ | 21,245 | $ | 24,570 | ||||||
Balance Sheet Information
Additional details of balance sheet amounts as of November 28, 2015 and November 29, 2014 follow.
|
2015 |
2014 |
|||||||
| Inventories | ||||||||
|
Raw materials |
$ | 121,545 | $ | 133,476 | ||||
|
Finished goods |
142,195 | 140,014 | ||||||
|
LIFO reserve |
(15,236 | ) | (22,200 | ) | ||||
|
Total inventories |
$ | 248,504 | $ | 251,290 | ||||
|
Other current assets |
||||||||
|
Other receivables |
$ | 31,051 | $ | 15,059 | ||||
|
Prepaid income taxes |
3,790 | 9,505 | ||||||
|
Prepaid taxes other than income taxes |
18,464 | 30,797 | ||||||
|
Deferred income taxes |
- | 20,924 | ||||||
|
Prepaid expenses |
12,232 | 12,547 | ||||||
|
Assets held for sale |
3,138 | 4,273 | ||||||
|
Total other current assets |
$ | 68,675 | $ | 93,105 | ||||
|
Property, plant and equipment |
||||||||
|
Land |
$ | 68,008 | $ | 65,367 | ||||
|
Buildings and improvements |
315,659 | 293,440 | ||||||
|
Machinery and equipment |
683,988 | 710,180 | ||||||
|
Construction in progress |
44,332 | 37,364 | ||||||
|
Total, at cost |
1,111,987 | 1,106,351 | ||||||
|
Accumulated depreciation |
(599,127 | ) | (603,717 | ) | ||||
|
Net property, plant and equipment |
$ | 512,860 | $ | 502,634 | ||||
|
Other assets |
||||||||
|
Investments and company owned life insurance |
$ | 9,641 | $ | 10,950 | ||||
|
Equity method investments |
39,533 | 37,487 | ||||||
|
Cost method investments |
1,666 | 1,671 | ||||||
|
Long-term deferred income taxes |
55,663 | 40,142 | ||||||
|
Prepaid pension costs |
4,273 | 7,588 | ||||||
|
Prepaid postretirement other than pension |
15,755 | 12,054 | ||||||
|
Other long-term assets |
34,613 | 39,434 | ||||||
|
Total other assets |
$ | 161,144 | $ | 149,326 | ||||
|
Income taxes payable |
||||||||
|
Current income taxes payable |
$ | 8,970 | $ | 10,961 | ||||
|
Current deferred income taxes |
- | 2,800 | ||||||
|
Total income taxes payable |
$ | 8,970 | $ | 13,761 | ||||
|
Other accrued expenses |
||||||||
|
Taxes other than income taxes |
$ | 16,909 | $ | 19,427 | ||||
|
Interest |
5,027 | 4,548 | ||||||
|
Product liability |
2,765 | 1,691 | ||||||
|
Accrued expenses |
32,654 | 25,383 | ||||||
|
Total other accrued expenses |
$ | 57,355 | $ | 51,049 | ||||
|
Other liabilities |
||||||||
|
Asset retirement obligations |
$ | 2,274 | $ | 2,515 | ||||
|
Long-term deferred income taxes |
24,477 | 16,718 | ||||||
|
Long-term deferred compensation |
5,675 | 5,635 | ||||||
|
Postretirement other than pension |
2,902 | 3,146 | ||||||
|
Contingent consideration liabilities, continuing operations |
10,854 | 196 | ||||||
|
Other long-term liabilities |
23,090 | 13,565 | ||||||
|
Total other liabilities |
$ | 69,272 | $ | 41,775 | ||||
Additional details on the trade receivables allowance for doubtful accounts, credits related to pricing or quantities shipped and early payment discounts for 2015, 2014 and 2013 are as follows:
|
2015 |
2014 |
2013 |
||||||||||
|
Balance at beginning of year |
$ | 10,246 | $ | 8,538 | $ | 7,513 | ||||||
|
Charged to expenses |
4,703 | 3,998 | 3,267 | |||||||||
|
Write-offs |
(2,339 | ) | (1,866 | ) | (2,369 | ) | ||||||
|
Foreign currency translation effect |
(717 | ) | (424 | ) | 127 | |||||||
|
Balance at end of year |
$ | 11,893 | $ | 10,246 | $ | 8,538 | ||||||
Statement of Comprehensive Income (Loss) Information
The following tables provides details of total comprehensive income (loss):
|
November 28, 2015 |
||||||||||||||||
|
H.B. Fuller Stockholders |
Non-controlling Interests |
|||||||||||||||
|
Pretax |
Tax |
Net |
Net |
|||||||||||||
|
Net income including non-controlling interests |
- | - | $ | 86,680 | $ | 417 | ||||||||||
|
Other comprehensive income (loss) |
||||||||||||||||
|
Foreign currency translation adjustment¹ |
$ | (62,759 | ) | - | (62,759 | ) | (17 | ) | ||||||||
|
Reclassification to earnings: |
||||||||||||||||
|
Defined benefit pension plans adjustment² |
(24,279 | ) | 8,408 | (15,871 | ) | - | ||||||||||
|
Interest rate swap³ |
56 | (16 | ) | 40 | - | |||||||||||
|
Cash-flow hedges³ |
(2,168 | ) | 826 | (1,342 | ) | - | ||||||||||
|
Other comprehensive income (loss) |
$ | (89,150 | ) | $ | 9,218 | (79,932 | ) | (17 | ) | |||||||
|
Comprehensive income (loss) |
$ | 6,748 | $ | 400 | ||||||||||||
|
November 29, 2014 |
||||||||||||||||
|
H.B. Fuller Stockholders |
Non-controlling Interests |
|||||||||||||||
|
Pretax |
Tax |
Net |
Net |
|||||||||||||
|
Net income including non-controlling interests |
- | - | $ | 49,773 | $ | 378 | ||||||||||
|
Other comprehensive income (loss) |
||||||||||||||||
|
Foreign currency translation adjustment¹ |
$ | (38,673 | ) | - | (38,673 | ) | (14 | ) | ||||||||
|
Reclassification to earnings: |
||||||||||||||||
|
Defined benefit pension plans adjustment² |
(56,268 | ) | 19,394 | (36,874 | ) | - | ||||||||||
|
Interest rate swap³ |
56 | (15 | ) | 41 | - | |||||||||||
|
Cash-flow hedges³ |
158 | (42 | ) | 116 | - | |||||||||||
|
Other comprehensive income (loss) |
$ | (94,727 | ) | $ | 19,337 | (75,390 | ) | (14 | ) | |||||||
|
Comprehensive income (loss) |
$ | (25,617 | ) | $ | 364 | |||||||||||
|
November 30, 2013 |
||||||||||||||||
|
H.B. Fuller Stockholders |
Non-controlling Interests |
|||||||||||||||
|
Pretax |
Tax |
Net |
Net |
|||||||||||||
|
Net income including non-controlling interests |
- | - | $ | 96,761 | $ | 425 | ||||||||||
|
Other comprehensive income (loss) |
||||||||||||||||
|
Foreign currency translation adjustment¹ |
$ | (876 | ) | - | (876 | ) | (55 | ) | ||||||||
|
Reclassification to earnings: |
||||||||||||||||
|
Defined benefit pension plans adjustment² |
106,647 | (38,451 | ) | 68,196 | - | |||||||||||
|
Interest rate swap³ |
57 | (16 | ) | 41 | - | |||||||||||
|
Cash-flow hedges³ |
494 | (191 | ) | 303 | - | |||||||||||
|
Other comprehensive income (loss) |
$ | 106,322 | $ | (38,658 | ) | 67,664 | (55 | ) | ||||||||
|
Comprehensive income (loss) |
$ | 164,425 | $ | 370 | ||||||||||||
|
¹ Income taxes are not provided for foreign currency translation relating to indefinite investments in international subsidiaries. |
|
² Loss reclassified from accumulated other comprehensive income (loss) into earnings as part of net periodic cost related to pension and other postretirement benefit plans is reported in cost of sales, SG&A and special charges. |
|
³ Loss reclassified from accumulated other comprehensive income (loss) into earnings is reported in other income (expense), net. |
Statement of Total Equity Information
Components of accumulated other comprehensive income (loss) follow.
|
November 28, 2015 |
||||||||||||
|
Total |
H.B. Fuller Stockholders |
Non-controlling Interests |
||||||||||
|
Foreign currency translation adjustment |
$ | (51,592 | ) | $ | (51,554 | ) | $ | (38 | ) | |||
|
Interest rate swap, net of taxes of $5 |
(13 | ) | (13 | ) | - | |||||||
|
Cash-flow hedges, net of taxes of $811 |
(1,317 | ) | (1,317 | ) | - | |||||||
|
Defined benefit pension plans adjustment, net of taxes of $93,012 |
(174,400 | ) | (174,400 | ) | - | |||||||
|
Total accumulated other comprehensive income (loss) |
$ | (227,322 | ) | $ | (227,284 | ) | $ | (38 | ) | |||
|
November 29, 2014 |
||||||||||||
|
Total |
H.B. Fuller Stockholders |
Non-controlling Interests |
||||||||||
|
Foreign currency translation adjustment |
$ | 11,184 | $ | 11,205 | $ | (21 | ) | |||||
|
Interest rate swap, net of taxes of $21 |
(53 | ) | (53 | ) | - | |||||||
|
Cash-flow hedges, net of taxes of $15 |
25 | 25 | - | |||||||||
|
Defined benefit pension plans adjustment, net of taxes of $84,604 |
(158,529 | ) | (158,529 | ) | - | |||||||
|
Total accumulated other comprehensive income (loss) |
$ | (147,373 | ) | $ | (147,352 | ) | $ | (21 | ) | |||
|
November 30, 2013 |
||||||||||||
|
Total |
H.B. Fuller Stockholders |
Non-controlling Interests |
||||||||||
|
Foreign currency translation adjustment |
$ | 49,871 | $ | 49,878 | $ | (7 | ) | |||||
|
Interest rate swap, net of taxes of $36 |
(94 | ) | (94 | ) | - | |||||||
|
Cash-flow hedges, net of taxes of $57 |
(91 | ) | (91 | ) | - | |||||||
|
Defined benefit pension plans adjustment net of taxes of $65,210 |
(121,655 | ) | (121,655 | ) | - | |||||||
|
Total accumulated other comprehensive income (loss) |
$ | (71,969 | ) | $ | (71,962 | ) | $ | (7 | ) | |||
Note 5: Special Charges, net
The integration of the industrial adhesives business we acquired in March 2012 involved a significant amount of restructuring and capital investment to optimize the new combined entity. In addition, we have taken a series of actions in our existing EIMEA operating segment to improve the profitability and future growth prospects of this operating segment. We combined these two initiatives into a single project which we refer to as the Business Integration Project. During 2015, 2014 and 2013 we incurred special charges, net of $4,654, $51,501 and $45,087, respectively, for costs related to the Business Integration Project.
The following table provides detail of special charges, net:
|
Fiscal Years |
||||||||||||
|
2015 |
2014 |
2013 |
||||||||||
|
Acquisition and transformation related costs |
$ | 715 | $ | 7,946 | $ | 8,698 | ||||||
|
Workforce reduction costs |
(37 | ) | 3,233 | 9,784 | ||||||||
|
Facility exit costs |
3,664 | 32,050 | 17,869 | |||||||||
|
Other related costs |
312 | 8,272 | 8,736 | |||||||||
|
Special charges, net |
$ | 4,654 | $ | 51,501 | $ | 45,087 | ||||||
Professional services of $715, $7,946 and $8,698 for 2015, 2014 and 2013, respectively, include costs related to organization consulting, investment advisory, financial advisory, legal and valuation services necessary to acquire and integrate the acquired industrial adhesives business into our existing operating segments.
During 2015, we recorded net reversal of workforce reduction costs of $37 and we incurred cash facility exit costs of $2,190, non-cash facility exit costs of $1,474 and other incremental transformation related costs of $312, including the cost of personnel directly working on the integration. During 2014, we incurred workforce reduction costs of $3,233, cash facility exit costs of $25,187, non-cash facility exit costs of $6,863 and other incremental transformation related costs of $8,272, including the cost of personnel directly working on the integration. During 2013, we incurred workforce reduction costs of $9,784, cash facility exit costs of $11,804, non-cash facility exit costs of $6,065 and other incremental transformation related costs of $8,736, including the cost of personnel directly working on the integration.
Note 6: Goodwill and Other Intangible Assets
Goodwill balances by reporting unit as of November 28, 2015 and November 29, 2014 consisted of the following:
|
2015 |
2014 |
|||||||
|
Americas Adhesives |
$ | 67,123 | $ | 71,325 | ||||
|
EIMEA |
122,641 | 139,666 | ||||||
|
Asia Pacific |
143,660 | 24,201 | ||||||
|
Construction Products |
20,780 | 20,780 | ||||||
|
Total |
$ | 354,204 | $ | 255,972 | ||||
| Additional details related to goodwill for 2015 and 2014 are as follows: |
|
2015 |
2014 |
|||||||
|
Balance at beginning of year |
$ | 255,972 | $ | 263,103 | ||||
|
Continental Products Limited acquisition |
462 | - | ||||||
|
Tonsan Adhesive, Inc. acquisition |
125,090 | - | ||||||
|
ProSpec acquisition |
- | 7,443 | ||||||
|
Plexbond Quimica, S.A. acquisition |
- | 151 | ||||||
|
Foreign currency translation effect |
(27,320 | ) | (14,725 | ) | ||||
|
Balance at end of year |
$ | 354,204 | $ | 255,972 | ||||
Changes in the goodwill balances relate to changes in foreign currency exchange rates and activity from acquisitions. See Note 2 for more information on acquisitions.
In accordance with accounting standards, we test each of our reporting units for goodwill impairment annually and whenever events or changes in circumstances indicate that impairment may have occurred. In the fourth quarter of 2015, we conducted the required annual test of goodwill for impairment. We performed the goodwill impairment analysis on our reporting units by using a discount rate determined by management to result in the most representative fair value of the business as a whole. There were no indications of impairment in any of our reporting units. We also performed a sensitivity analysis by using a discount rate at the high end of our range to confirm the reasonableness of our goodwill impairment analysis. No indications of impairment in any of our reporting units were indicated by the sensitivity analysis. See Note 1 for further information on our impairment analysis.
Balances of amortizable identifiable intangible assets, excluding goodwill and other non-amortizable intangible assets, are as follows:
|
Amortizable Intangible Assets |
Purchased Technology & Patents |
Customer Relationships |
All Other |
Total |
||||||||||||
|
As of November 28, 2015 |
||||||||||||||||
|
Original cost |
$ | 69,792 | $ | 234,995 | $ | 49,563 | $ | 354,350 | ||||||||
|
Accumulated amortization |
(17,613 | ) | (99,405 | ) | (24,801 | ) | (141,819 | ) | ||||||||
|
Net identifiable intangibles |
$ | 52,179 | $ | 135,590 | $ | 24,762 | $ | 212,531 | ||||||||
|
Weighted-average useful lives (in years) |
10 | 17 | 13 | 15 | ||||||||||||
|
As of November 29, 2014 |
||||||||||||||||
|
Original cost |
$ | 43,915 | $ | 219,517 | $ | 52,529 | $ | 315,961 | ||||||||
|
Accumulated amortization |
(11,944 | ) | (88,164 | ) | (20,458 | ) | (120,566 | ) | ||||||||
|
Net identifiable intangibles |
$ | 31,971 | $ | 131,353 | $ | 32,071 | $ | 195,395 | ||||||||
|
Weighted-average useful lives (in years) |
11 | 18 | 12 | 16 | ||||||||||||
Amortization expense with respect to amortizable intangible assets was $26,984, $23,240 and $22,508 in 2015, 2014 and 2013, respectively.
Estimated aggregate amortization expense based on the current carrying value of amortizable intangible assets for the next five fiscal years are as follows:
|
Fiscal Year |
2016 |
2017 |
2018 |
2019 |
2020 |
Thereafter |
||||||||||||||||||
|
Amortization Expense |
$ | 25,419 | $ | 25,057 | $ | 24,664 | $ | 22,740 | $ | 21,769 | $ | 92,882 | ||||||||||||
The above amortization expense forecast is an estimate. Actual amounts may change from such estimated amounts due to fluctuations in foreign currency exchange rates, additional intangible asset acquisitions, potential impairment, accelerated amortization, or other events.
Non-amortizable intangible assets at November 28, 2015 and November 29, 2014 totaling $462 and $543, respectively, relate to trademarks and trade names. The change in non-amortizable assets in 2015 compared to 2014 was due to changes in currency exchange rates.
Note 7: Notes Payable, Long-Term Debt and Lines of Credit
Notes Payable: Notes payable were $30,757 and $27,149 at November 28, 2015 and November 29, 2014, respectively. This amount mainly represents various foreign subsidiaries’ other short-term borrowings that were not part of committed lines. The weighted-average interest rates on short-term borrowings were 8.1 percent, 11.3 percent and 8.9 percent in 2015, 2014 and 2013, respectively. Fair values of these short-term obligations approximate their carrying values due to their short maturity. There were no funds drawn from the short-term committed lines at November 28, 2015.
Long-Term Debt
|
Weighted-Average |
||||||||||||||||
|
Interest Rate at |
Fiscal Year |
|||||||||||||||
|
Long-Term Debt |
November 28, 2015 |
Maturity Date |
2015 |
2014 |
||||||||||||
|
Revolving credit line |
1.33% | 2019 | $ | - | $ | 143,000 | ||||||||||
|
Term Loan |
1.44% | 2019 | 288,750 | - | ||||||||||||
|
Senior Notes, Series A1 |
2.24% | 2017 | 17,419 | 17,805 | ||||||||||||
|
Senior Notes, Series B2 |
2.12% | 2017 | 33,982 | 34,738 | ||||||||||||
|
Senior Notes, Series C3 |
3.34% | 2020 | 36,955 | 37,192 | ||||||||||||
|
Senior Notes, Series D4 |
5.61% | 2020 | 65,000 | 65,000 | ||||||||||||
|
Senior Notes, Series E5 |
4.12% | 2022 | 250,000 | 250,000 | ||||||||||||
|
Total debt |
$ | 692,106 | $ | 547,735 | ||||||||||||
|
Less: current maturities |
(22,500 | ) | - | |||||||||||||
|
Total long-term debt, excluding current maturities |
$ | 669,606 | $ | 547,735 | ||||||||||||
On December 16, 2009, we entered into a note purchase agreement under which we agreed to issue $150,000 in aggregate principal amount of senior unsecured notes to a group of private investors. The $150,000 was split into four non-amortizing tranches, Series A-D. On March 5, 2012, we entered into a note purchase agreement under which we agreed to issue $250,000 in aggregate principal amount of senior unsecured notes to a group of private investors. The $250,000 is a non-amortizing tranche, Series E.
1 Senior Notes, Series A, due December 16, 2016, $17,000 5.13 percent fixed, swapped to a variable rate of 6- month LIBOR (in arrears) plus 1.59 percent
2 Senior Notes, Series B, due February 24, 2017, $33,000 5.13 percent fixed, swapped to a variable rate of 6-month LIBOR (in arrears) plus 1.47 percent
3 Senior Notes, Series C, due December 16, 2019, $35,000 5.61 percent fixed, $25,000 swapped to a variable rate of 6-month LIBOR (in arrears) plus 1.78 percent
4 Senior Notes, Series D, due February 24, 2020, $65,000 5.61 percent fixed
5 Senior Notes, Series E, due March 5, 2022, $250,000 4.12 percent fixed
On October 31, 2014, we entered into a credit agreement with a consortium of financial institutions under which we established a $300,000 multi-currency revolving credit facility and a $300,000 term loan that we can use to repay existing indebtedness, finance working capital needs, finance acquisitions, and for general corporate purposes. At November 28, 2015 there were no borrowings on the revolving credit facility. At November 28, 2015 a balance of $288,750 was drawn on the term loan. Interest on the revolving credit facility is payable at the LIBOR plus 1.075 percent. A facility fee of 0.175 percent is payable quarterly. The interest rate on the term loan is payable at the LIBOR rate plus 1.25 percent. The interest rates and the facility fee are based on a rating grid. The credit agreement replaced the previous revolving credit facilities entered into on March 5, 2012. The October 31, 2014 credit agreement expires on October 31, 2019.
On October 31, 2014 we amended various provisions of the Note Purchase Agreements Series A through E, including the covenant definition of Consolidated EBITDA. As part of these amendments, the interest rate on the debt may increase based on changes to the rating of our senior, unsecured long-term debt.
Long-term debt had an estimated fair value of $716,213 and $606,194 as of November 28, 2015 and November 29, 2014, respectively. The fair value of long-term debt is based on quoted market prices for the same or similar issues or on the current rates offered for debt of similar maturities. The estimated fair value of these long-term obligations is not necessarily indicative of the amount that would be realized in a current market exchange.
Lines of Credit
As of November 28, 2015, lines of credit were as follows:
|
Term |
Committed |
Drawn |
Unused |
|||||||||
|
Long-term lines of credit |
$ | 300,000 | $ | - | $ | 300,000 | ||||||
A revolving credit agreement with a consortium of financial institutions accounted for the entire committed lines of credit. The credit agreement creates an unsecured multi-currency revolving credit facility that can be drawn upon for general corporate purposes up to a maximum of $300,000. The credit agreement expires on October 31, 2019.
The most restrictive debt covenants place limitations on secured and unsecured borrowings, operating leases, and contain minimum interest coverage and maximum debt to trailing twelve months EBITDA requirements. In addition, we cannot be a member of any consolidated group as defined for income tax purposes other than with our subsidiaries. At November 28, 2015 all financial covenants were met.
Maturities of long-term debt for the next five fiscal years follow:
|
Fiscal Year |
2016 |
2017 |
2018 |
2019 |
2020 |
Thereafter |
||||||||||||||||||
|
Long-term debt obligations |
$ | 22,500 | $ | 81,401 | $ | 37,500 | $ | 198,750 | $ | 101,955 | $ | 250,000 | ||||||||||||
Note 8: Income Taxes
|
Income from continuing operations before income taxes and income from equity method investments |
2015 |
2014 |
2013 |
|||||||||
|
United States |
$ | 97,094 | $ | 55,567 | $ | 81,788 | ||||||
|
Non-U.S. |
41,251 | 23,745 | 45,756 | |||||||||
|
Total |
$ | 138,345 | $ | 79,312 | $ | 127,544 | ||||||
|
Components of the provision for income tax expense (benefit) |
2015 |
2014 |
2013 |
|||||||||
|
Current: |
||||||||||||
|
U.S. federal |
$ | 24,180 | $ | 8,771 | $ | 16,999 | ||||||
|
State |
2,955 | 1,290 | 1,372 | |||||||||
|
Non-U.S. |
22,075 | 20,133 | 11,930 | |||||||||
| 49,210 | 30,194 | 30,301 | ||||||||||
|
Deferred: |
||||||||||||
|
U.S. federal |
8,096 | 8,106 | 8,101 | |||||||||
|
State |
1,269 | 1,069 | 2,244 | |||||||||
|
Non-U.S. |
(2,720 | ) | (5,021 | ) | (697 | ) | ||||||
| 6,645 | 4,154 | 9,648 | ||||||||||
|
Total |
$ | 55,855 | $ | 34,348 | $ | 39,949 | ||||||
|
Reconciliation of effective income tax |
2015 |
2014 |
2013 |
||||||||||
|
Statutory U.S. federal income tax rate |
$ | 48,421 | $ | 27,759 | $ | 44,641 | |||||||
|
State income taxes, net of federal benefit |
3,281 | 1,534 | 2,351 | ||||||||||
|
Foreign dividend repatriation |
388 | 760 | 467 | ||||||||||
|
Foreign operations |
1,547 | (8,287 | ) | (12,598 | ) | ||||||||
|
Impact of option valuation |
1,211 | - | - | ||||||||||
|
Interest income not taxable in the U.S. |
(1,243 | ) | (1,649 | ) | (1,789 | ) | |||||||
|
Change in valuation allowance |
480 | 3,317 | 1,819 | ||||||||||
|
Tax impact of special charges, net |
1,678 | 11,773 | 5,998 | ||||||||||
|
Other |
92 | (859 | ) | (940 | ) | ||||||||
|
Total |
$ | 55,855 | $ | 34,348 | $ | 39,949 | |||||||
|
Deferred income tax balances at each year-end related to: |
2015 |
2014 |
||||||
|
Depreciation and amortization |
$ | (61,992 | ) | $ | (47,152 | ) | ||
|
Employee benefit costs |
50,679 | 45,920 | ||||||
|
Foreign tax credit carryforward |
11,621 | 12,355 | ||||||
|
Tax loss carryforwards |
21,090 | 21,851 | ||||||
|
Other |
24,373 | 24,234 | ||||||
| 45,771 | 57,208 | |||||||
|
Valuation allowance |
(14,393 | ) | (16,364 | ) | ||||
|
Net deferred tax assets |
$ | 31,378 | $ | 40,844 | ||||
The difference between the change in the deferred tax assets in the balance sheet and the deferred tax provision is primarily due to the defined benefit pension plan adjustment recorded in accumulated other comprehensive income (loss).
In November 2015, the FASB issued ASU No. 2015-17, Income Taxes (Topic 740): Balance Sheet Classification of Deferred Taxes, which amends the guidance requiring companies to separate deferred income tax liabilities and assets into current and non-current amounts in a classified statement of financial position. This accounting guidance simplifies the presentation of deferred income taxes, such that deferred tax liabilities and assets be classified as non-current in a classified statement of financial position. This accounting guidance is effective for us beginning in the first quarter of 2018, but we have elected to adopt this guidance prospectively as of November 28, 2015. As a result we have classified all deferred tax liabilities and assets as non-current in the Consolidated Balance Sheet at November 28, 2015.
Valuation allowances principally relate to foreign net operating loss carryforwards where the future potential benefits do not meet the more-likely-than-not realization test. The decrease in the valuation allowance of $1,971 during 2015 is primarily due to foreign currency changes which impact the value of the deferred tax assets upon which the valuation allowance is recorded.
Deferred tax assets and liabilities are measured using the currently enacted tax rates that apply to taxable income in effect for the years in which those deferred tax assets and liabilities are expected to be realized or settled. We record a valuation allowance to reduce deferred tax assets to the amount that is believed more-likely-than-not to be realized. We believe it is more-likely-than-not that carryback potential, reversal of deferred tax liabilities and forecasted income, will be sufficient to fully recover the net deferred tax assets not already offset by a valuation allowance. In the event that all or part of the gross deferred tax assets are determined not to be realizable in the future, an adjustment to the valuation allowance would be charged to earnings in the period such determination is made.
U.S. income taxes have not been provided on approximately $403,573 undistributed earnings of non-U.S. subsidiaries. We intend to indefinitely reinvest these undistributed earnings. Cash available in the United States has historically been sufficient and we expect it will continue to be sufficient to fund U.S. Cash flow requirements. In the event these earnings are later distributed to the U.S., such distributions would likely result in additional U.S. tax that may be offset, at least in part by associated foreign tax credits.
While non-U.S. operations have been profitable overall, there are cumulative tax losses of $95,473 in various countries. These tax losses can be carried forward to offset the income tax liabilities on future income in these countries. Cumulative tax losses of $48,864 can be carried forward indefinitely, while the remaining $46,609 of tax losses must be utilized during 2016 to 2025.
The U.S. has a foreign tax credit carryforward of $11,621 which will expire in 2022 and 2023. Projected foreign source income in future years is sufficient to utilize these credits in the carryforward period.
The table below sets forth the changes to our gross unrecognized tax benefit as a result of uncertain tax positions, excluding accrued interest, for the fiscal years ended November 28, 2015 and November 29, 2014. We do not anticipate that the total unrecognized tax benefits will change significantly within the next twelve months.
|
2015 |
2014 |
|||||||
|
Balance at beginning of year |
$ | 4,787 | $ | 5,151 | ||||
|
Tax positions related to the current year: |
||||||||
|
Additions |
877 | 600 | ||||||
|
Tax positions related to prior years: |
||||||||
|
Additions |
439 | 178 | ||||||
|
Reductions |
(557 | ) | (177 | ) | ||||
|
Settlements |
- | (13 | ) | |||||
|
Lapses in applicable statutes of limitation |
(676 | ) | (952 | ) | ||||
|
Balance at end of year |
$ | 4,870 | $ | 4,787 | ||||
Included in the balance of unrecognized tax benefits as of November 28, 2015, are potential benefits of $4,388 that, if recognized, would affect the effective tax rate.
We report accrued interest and penalties related to unrecognized tax benefits in income tax expense. For the year ended November 28, 2015, we recognized a net benefit for interest and penalties of $179 relating to unrecognized tax benefits and had net accumulated accrued interest and penalties of $631 as of November 28, 2015. For the year ended November 29, 2014, we recognized a net benefit for interest and penalties of $139 relating to unrecognized tax benefits and had net accumulated accrued interest and penalties of $452 as of November 29, 2014.
We are subject to U.S. federal income tax as well as income tax in numerous state and foreign jurisdictions. We are no longer subject to U.S. federal tax examination for years prior to 2011 or Swiss income tax examination for years prior to 2009. During 2015, the U.S. tax authorities opened an audit for the years ended December 1, 2012 and November 30, 2013. During the first quarter of 2015, the Swiss tax authorities opened an audit for the years ended December 3, 2011 and December 1, 2012. The Swiss audit was closed in the second quarter of 2015 with no assessment. We are in various stages of examination and appeal in several states and other foreign jurisdictions. Although the final outcomes of these examinations cannot currently be determined, we believe that we have recorded adequate liabilities with respect to these examinations.
Note 9: Stockholders' Equity
Preferred Stock: The Board of Directors is authorized to issue up to 10,045,900 shares of preferred stock that may be issued in one or more series and with such stated value and terms as the Board of Directors may determine.
Common Stock: There were 160,000,000 shares of common stock with a par value of $1.00 authorized and 50,074,310 and 50,310,803 shares issued and outstanding at November 28, 2015 and November 29, 2014, respectively.
On September 30, 2010, the Board of Directors authorized a share repurchase program of up to $100,000 of our outstanding common shares. Under the program, we are authorized to repurchase shares for cash on the open market, from time to time, in privately negotiated transactions or block transactions, or through an accelerated repurchase agreement. The timing of such repurchases is dependent on price, market conditions and applicable regulatory requirements. Upon repurchase of the shares, we reduce our common stock for the par value of the shares with the excess being applied against additional paid-in capital. During 2015, we repurchased 500,000 shares for $17,066 and during 2014, we repurchased 250,000 shares for $12,254 under this program. Up to $44,897 of our outstanding common shares may still be repurchased under the share repurchase program.
|
Common Shares Outstanding |
2015 |
2014 |
2013 |
|||||||||
|
Beginning balance |
50,310,803 | 50,228,543 | 49,903,266 | |||||||||
|
Stock options exercised |
275,035 | 330,179 | 462,427 | |||||||||
|
Shares swapped for stock option exercises |
(39,883 | ) | - | - | ||||||||
|
Deferred compensation paid |
8,852 | 9,957 | 51,521 | |||||||||
|
Restricted units vested |
83,494 | 69,624 | 67,828 | |||||||||
|
Restricted shares granted |
- | - | 186,352 | |||||||||
|
Shares withheld for taxes |
(54,454 | ) | (67,593 | ) | (62,124 | ) | ||||||
|
Restricted shares forfeited |
(9,537 | ) | (9,907 | ) | (5,727 | ) | ||||||
|
Shares repurchased under repurchase program |
(500,000 | ) | (250,000 | ) | (375,000 | ) | ||||||
|
Ending balance |
50,074,310 | 50,310,803 | 50,228,543 | |||||||||
Shareholder Rights Plan: The shareholder rights plan provides each holder of a share of common stock a right to purchase one one-hundredth of a share of preferred stock for $95, subject to adjustment. No fraction of a preferred share (other than fractions in integral multiples of one one-hundredth of a share) will be issued. Preferred shares purchased upon exercise of the rights will not be redeemable. Each preferred share will be entitled to a preferential quarterly dividend payment, a preferential liquidation payment, voting rights, and participation in any merger, consolidation or other transaction in which common shares are exchanged. These rights are not currently exercisable. In the event any person becomes an Acquiring Person (as defined in the rights plan), each holder of a right will thereafter have a right to receive, upon exercise thereof at the then current aggregate exercise price, in lieu of preferred shares, such number of common shares of ours having a current aggregate market price equal to twice the current aggregate exercise price. In the event that at any time after there is an Acquiring Person we are acquired in certain mergers or other business combination transactions or 50 percent or more of the assets or earning power of us and our subsidiaries (taken as a whole) are sold, holders of the rights will thereafter have the right to receive, upon exercise thereof at the then current aggregate exercise price, such number of common shares of the acquiring company (or, in certain cases, one of its affiliates) having a current aggregate market price equal to twice the current aggregate exercise price. Rights held by an acquiring person are void. We may redeem or exchange the rights in certain instances. Unless extended or redeemed, the rights expire on July 31, 2016.
Note 10: Pension and Postretirement Benefits
Defined Contribution Plan
All U.S. employees have the option of contributing up to 75 percent of their pre-tax earnings to a 401(k) plan, subject to IRS limitations. We match up to the first 4 percent of each employee's pre-tax earnings, based on the employee’s contributions. All U.S. employees are eligible for a separate annual retirement contribution to the 401(k) plan of 3 percent of pay, that is invested based on the election of the individual participant. The 3 percent contribution is in addition to our 4 percent matching contribution described above and is in lieu of participation in our defined benefit pension plan. The total contribution to the 401(k) plan for 2015 was $9,375 which included the cost of the 4 percent company match of $4,502 and the additional 3 percent contribution of $4,873. The total contributions to the 401(k) plan were $9,414 and $8,022 in 2014 and 2013, respectively.
The defined contribution plan liability recorded in the Consolidated Balance Sheets was $6,062 and $5,989 in 2015 and 2014, respectively for the U.S. Plan and several statutorily required non-U.S. Plans.
Defined Benefit Plans
Noncontributory defined benefit pension plans cover all U.S. employees employed prior to January 1, 2007. Benefits for these plans are based primarily on each employee’s years of service and average compensation. During 2011, we made significant changes to our U.S. Pension Plan (the Plan). The changes included: benefits under the Plan were locked-in using service and salary as of May 31, 2011, participants no longer earn benefits for future service and salary as they had in the past, affected participants receive a three percent increase to the locked-in benefit for every year they continue to work for us and we are making a retirement contribution of three percent of eligible compensation to the 401(k) Plan for those participants. The funding policy is consistent with the funding requirements of federal law and regulations. Plan assets consist principally of listed equity securities and bonds. During 2015, we amended the plan to add a program for eligible employees to take a lump sum distribution. A total of $15,493 was paid during 2015 as lump sum distributions under this program. Other U.S. postretirement benefits are funded through a Voluntary Employees' Beneficiaries Association Trust.
Health care and life insurance benefits are provided for eligible retired employees and their eligible dependents. These benefits are provided through various insurance companies and health care providers. Costs are accrued during the years the employee renders the necessary service.
Certain non-U.S. subsidiaries provide pension benefits for their employees consistent with local practices and regulations. These plans are primarily defined benefit plans covering substantially all employees upon completion of a specified period of service. Benefits for these plans are generally based on years of service and annual compensation.
Following is a reconciliation of the beginning and ending balances of the benefit obligation and fair value of plan assets as of November 28, 2015 and November 29, 2014:
|
Pension Benefits |
Other Postretirement |
|||||||||||||||||||||||
|
U.S. Plans |
Non-U.S. Plans |
Benefits |
||||||||||||||||||||||
|
2015 |
2014 |
2015 |
2014 |
2015 |
2014 |
|||||||||||||||||||
|
Change in projected benefit obligation |
||||||||||||||||||||||||
|
Benefit obligation at beginning of year |
$ | 408,595 | $ | 347,668 | $ | 220,216 | $ | 206,407 | $ | 54,370 | $ | 50,811 | ||||||||||||
|
Service cost |
107 | 93 | 1,924 | 1,699 | 449 | 434 | ||||||||||||||||||
|
Interest cost |
16,322 | 16,086 | 5,986 | 7,626 | 2,042 | 2,143 | ||||||||||||||||||
|
Participant contributions |
- | - | - | - | 328 | 350 | ||||||||||||||||||
|
Actuarial (gain)/loss1 |
(15,317 | ) | 62,014 | 3,780 | 30,312 | (3,988 | ) | 3,948 | ||||||||||||||||
|
Curtailments |
- | - | - | (100 | ) | - | - | |||||||||||||||||
|
Settlement payments |
(15,493 | ) | - | - | (1,638 | ) | - | - | ||||||||||||||||
|
Benefits paid |
(18,116 | ) | (17,266 | ) | (7,726 | ) | (8,377 | ) | (3,278 | ) | (3,316 | ) | ||||||||||||
|
Foreign currency translation effect |
- | - | (23,008 | ) | (15,713 | ) | - | - | ||||||||||||||||
|
Benefit obligation at end of year |
376,098 | 408,595 | 201,172 | 220,216 | 49,923 | 54,370 | ||||||||||||||||||
|
Change in plan assets |
||||||||||||||||||||||||
|
Fair value of plan assets at beginning of year |
384,335 | 358,233 | 188,210 | 182,152 | 63,076 | 54,196 | ||||||||||||||||||
|
Actual return on plan assets |
(15,799 | ) | 41,874 | 7,408 | 20,657 | 1,249 | 8,621 | |||||||||||||||||
|
Employer contributions |
1,534 | 1,494 | 1,901 | 7,856 | 1,210 | 3,225 | ||||||||||||||||||
|
Participant contributions |
- | - | - | - | 328 | 350 | ||||||||||||||||||
|
Settlement payments |
(15,493 | ) | - | - | - | - | - | |||||||||||||||||
|
Benefits paid2 |
(18,116 | ) | (17,266 | ) | (7,726 | ) | (8,377 | ) | (3,278 | ) | (3,316 | ) | ||||||||||||
|
Foreign currency translation effect |
- | - | (17,552 | ) | (14,078 | ) | - | - | ||||||||||||||||
|
Fair value of plan assets at end of year |
336,461 | 384,335 | 172,241 | 188,210 | 62,585 | 63,076 | ||||||||||||||||||
|
Plan assets (less than) in excess of benefit obligation as of year end |
$ | (39,637 | ) | $ | (24,260 | ) | $ | (28,931 | ) | $ | (32,006 | ) | $ | 12,662 | $ | 8,706 | ||||||||
|
1 Actuarial gain for the U.S. Plans includes $11,455 due to assumption changes and $3,862 due to plan experience. |
|
2 Amount excludes benefit payments made from sources other than plan assets. |
For the U.S. Pension Plan, we adopted the new RP-2014 mortality tables projected generationally using scale MP-2015.
|
Amounts in accumulated other comprehensive income (loss) that have not |
Pension Benefits |
Other Postretirement |
||||||||||||||||||||||
| been recognized as components of net |
U.S. Plans |
Non-U.S. Plans |
Benefits |
|||||||||||||||||||||
| periodic benefit cost |
2015 |
2014 |
2015 |
2014 |
2015 |
2014 |
||||||||||||||||||
|
Unrecognized actuarial loss |
$ | 160,544 | $ | 140,009 | $ | 75,157 | $ | 82,598 | $ | 21,189 | $ | 23,348 | ||||||||||||
|
Unrecognized prior service cost (benefit) |
90 | 119 | (11 | ) | (17 | ) | (41 | ) | (2,546 | ) | ||||||||||||||
|
Ending balance |
$ | 160,634 | $ | 140,128 | $ | 75,146 | $ | 82,581 | $ | 21,148 | $ | 20,802 | ||||||||||||
|
Pension Benefits |
Other Postretirement |
|||||||||||||||||||||||
|
U.S. Plans |
Non-U.S. Plans |
Benefits |
||||||||||||||||||||||
|
2015 |
2014 |
2015 |
2014 |
2015 |
2014 |
|||||||||||||||||||
|
Statement of financial position as of fiscal year-end |
||||||||||||||||||||||||
|
Non-current assets |
$ | - | $ | - | $ | 4,282 | $ | 7,592 | $ | 15,755 | $ | 12,054 | ||||||||||||
|
Accrued benefit cost |
||||||||||||||||||||||||
|
Current liabilities |
(1,490 | ) | (1,510 | ) | (1,100 | ) | (1,248 | ) | (191 | ) | (201 | ) | ||||||||||||
|
Non-current liabilities |
(38,147 | ) | (22,750 | ) | (32,113 | ) | (38,350 | ) | (2,902 | ) | (3,146 | ) | ||||||||||||
|
Ending balance |
$ | (39,637 | ) | $ | (24,260 | ) | $ | (28,931 | ) | $ | (32,006 | ) | $ | 12,662 | $ | 8,707 | ||||||||
The accumulated benefit obligation of the U.S. pension and other postretirement plans was $407,011 at November 28, 2015 and $445,701 at November 29, 2014. The accumulated benefit obligation of the non-U.S. pension plans was $193,565 at November 28, 2015 and $211,488 at November 29, 2014.
The following amounts relate to pension plans with accumulated benefit obligations in excess of plan assets as of November 28, 2015 and November 29, 2014:
|
Pension Benefits and Other Postretirement Benefits |
||||||||||||||||
|
U.S. Plans |
Non-U.S. Plans |
|||||||||||||||
|
2015 |
2014 |
2015 |
2014 |
|||||||||||||
|
Accumulated benefit obligation |
$ | 355,988 | $ | 20,568 | $ | 99,010 | $ | 122,860 | ||||||||
|
Fair value of plan assets |
336,461 | - | 73,389 | 91,990 | ||||||||||||
The following amounts relate to pension plans with projected benefit obligations in excess of plan assets as of November 28, 2015 and November 29, 2014:
|
Pension Benefits and Other Postretirement Benefits |
||||||||||||||||
|
U.S. Plans |
Non-U.S. Plans |
|||||||||||||||
|
2015 |
2014 |
2015 |
2014 |
|||||||||||||
|
Projected benefit obligation |
$ | 376,098 | $ | 408,595 | $ | 113,633 | $ | 131,588 | ||||||||
|
Fair value of plan assets |
336,461 | 384,335 | 80,421 | 91,990 | ||||||||||||
Information about the expected cash flows follows:
|
Pension Benefits |
Other |
|||||||||||
|
U.S. Plans |
Non-U.S. Plans |
Postretirement Benefits |
||||||||||
|
Employer contributions |
||||||||||||
|
2016 |
$ | - | $ | 503 | $ | 3,000 | ||||||
|
Expected benefit payments |
||||||||||||
|
2016 |
$ | 26,801 | $ | 7,190 | $ | 3,338 | ||||||
|
2017 |
18,913 | 7,359 | 3,371 | |||||||||
|
2018 |
19,456 | 7,539 | 3,401 | |||||||||
|
2019 |
19,972 | 7,955 | 3,425 | |||||||||
|
2020 |
20,478 | 7,807 | 3,437 | |||||||||
|
2021-2025 |
108,454 | 42,559 | 16,940 | |||||||||
Components of net periodic benefit cost and other supplemental information for the years ended November 28, 2015, November 29, 2014 and November 30, 2013 follow:
|
Pension Benefits |
Other |
|||||||||||||||||||||||||||||||||||
|
U.S. Plans |
Non-U.S. Plans |
Postretirement Benefits |
||||||||||||||||||||||||||||||||||
|
Net periodic cost (benefit) |
2015 |
2014 |
2013 |
2015 |
2014 |
2013 |
2015 |
2014 |
2013 |
|||||||||||||||||||||||||||
|
Service cost |
$ | 107 | $ | 93 | $ | 106 | $ | 1,924 | $ | 1,699 | $ | 1,799 | $ | 449 | $ | 434 | $ | 623 | ||||||||||||||||||
|
Interest cost |
16,322 | 16,086 | 14,719 | 5,986 | 7,626 | 7,486 | 2,042 | 2,143 | 2,133 | |||||||||||||||||||||||||||
|
Expected return on assets |
(25,682 | ) | (23,865 | ) | (22,720 | ) | (10,422 | ) | (10,749 | ) | (9,390 | ) | (5,510 | ) | (4,742 | ) | (3,725 | ) | ||||||||||||||||||
|
Amortization: |
||||||||||||||||||||||||||||||||||||
|
Prior service cost |
29 | 29 | 49 | (4 | ) | (4 | ) | (4 | ) | (2,505 | ) | (3,771 | ) | (4,134 | ) | |||||||||||||||||||||
|
Actuarial loss (gain) |
5,628 | 4,575 | 6,742 | 3,173 | 3,056 | 3,778 | 2,431 | 2,709 | 5,717 | |||||||||||||||||||||||||||
|
Curtailment loss (gain) |
- | - | 102 | - | - | 53 | - | - | - | |||||||||||||||||||||||||||
|
Settlement charge (credit) |
- | - | - | - | 246 | 153 | - | - | - | |||||||||||||||||||||||||||
|
Net periodic benefit (benefit) cost |
$ | (3,596 | ) | $ | (3,082 | ) | $ | (1,002 | ) | $ | 657 | $ | 1,874 | $ | 3,875 | $ | (3,093 | ) | $ | (3,227 | ) | $ | 614 | |||||||||||||
|
Pension Benefits |
||||||||||||
|
U.S. Plans |
Non-U.S. Plans |
Postretirement benefits |
||||||||||
|
Amounts expected to be amortized from accumulated other comprehensive income into net periodic benefit costs over next fiscal year as of November 28, 2015 |
||||||||||||
|
Amortization of prior service cost (benefit) |
$ | 29 | $ | (4 | ) | $ | (41 | ) | ||||
|
Amortization of net actuarial (gain) loss |
5,270 | 3,220 | 2,169 | |||||||||
| $ | 5,299 | $ | 3,216 | $ | 2,128 | |||||||
|
Pension Benefits |
|
|||||||||||||||||||||||||||||||||||
|
Weighted-average assumptions used to |
U.S. Plans |
Non-U.S. Plans |
Other Postretirement Benefits |
|||||||||||||||||||||||||||||||||
|
Determine benefit obligations |
2015 |
2014 |
2013 |
2015 |
2014 |
2013 |
2015 |
2014 |
2013 |
|||||||||||||||||||||||||||
|
Discount rate |
4.28 | % | 4.08 | % | 4.74 | % | 2.82 | % | 2.90 | % | 3.74 | % | 4.02 | % | 3.84 | % | 4.34 | % | ||||||||||||||||||
|
Rate of compensation increase1 |
4.50 | % | 4.50 | % | 4.50 | % | 1.58 | % | 1.67 | % | 1.84 | % | N/A | N/A | N/A | |||||||||||||||||||||
| Weighted-average assumptions used to | ||||||||||||||||||||||||||||||||||||
|
Determine net costs for years ended |
2015 |
2014 |
2013 |
2015 |
2014 |
2013 |
2015 |
2014 |
2013 |
|||||||||||||||||||||||||||
|
Discount rate |
4.08 | % | 4.74 | % | 3.81 | % | 2.95 | % | 3.77 | % | 3.74 | % | 3.84 | % | 4.33 | % | 3.46 | % | ||||||||||||||||||
|
Expected return on plan assets |
7.75 | % | 7.75 | % | 7.75 | % | 6.22 | % | 6.17 | % | 5.96 | % | 8.75 | % | 8.75 | % | 8.75 | % | ||||||||||||||||||
|
Rate of compensation increase |
4.50 | % | 4.50 | % | 4.50 | % | 1.58 | % | 1.67 | % | 1.84 | % | N/A | N/A | N/A | |||||||||||||||||||||
1 Benefits under the U.S. Pension Plan were locked-in as of May 31, 2011 and no longer include compensation increases. The 4.50 percent rate for 2015, 2014 and 2013 are for the supplemental executive retirement plan only.
The discount rate assumption is determined using an actuarial yield curve approach, which results in a discount rate that reflects the characteristics of the plan. The approach identifies a broad population of corporate bonds that meet the quality and size criteria for the particular plan. We use this approach rather than a specific index that has a certain set of bonds that may or may not be representative of the characteristics of our particular plan. A higher discount rate decreases the present value of the pension obligations. The discount rate for the U.S. pension plan was 4.30 percent at November 28, 2015, compared to 4.10 percent at November 29, 2014 and 4.77 percent at November 30, 2013. Net periodic pension cost for a given fiscal year is based on assumptions developed at the end of the previous fiscal year. A discount rate reduction of 0.5 percentage points at November 28, 2015 would increase pension and other postretirement plan expense approximately $307 (pre-tax) in fiscal 2016. Discount rates for non-U.S. plans are determined in a manner consistent with the U.S. plan.
The expected long-term rate of return on plan assets assumption for the U.S. pension plan was 7.75 percent in 2015, 2014 and 2013. Our expected long-term rate of return on U.S. plan assets was based on our target asset allocation assumption of 60 percent equities and 40 percent fixed-income. Management, in conjunction with our external financial advisors, determines the expected long-term rate of return on plan assets by considering the expected future returns and volatility levels for each asset class that are based on historical returns and forward-looking observations. For 2015 the expected long-term rate of return on the target equities allocation was 8.75 percent and the expected long-term rate of return on the target fixed-income allocation was 5.0 percent. The total plan rate of return assumption included an estimate of the effect of diversification and the plan expense. A change of 0.5 percentage points for the expected return on assets assumption would impact U.S. net pension and other postretirement plan expense by approximately $1,995 (pre-tax).
Management, in conjunction with our external financial advisors, uses the actual historical rates of return of the asset categories to assess the reasonableness of the expected long-term rate of return on plan assets.
The expected long-term rate of return on plan assets assumption for non-U.S. pension plans was a weighted-average of 6.22 percent in 2015 compared to 6.17 percent in 2014 and 5.96 percent in 2013. The expected long-term rate of return on plan assets assumption used in each non-U.S. plan is determined on a plan-by-plan basis for each local jurisdiction and is based on expected future returns for the investment mix of assets currently in the portfolio for that plan. Management, in conjunction with our external financial advisors, develops expected rates of return for each plan, considers expected long-term returns for each asset category in the plan, reviews expectations for inflation for each local jurisdiction, and estimates the effect of active management of the plan’s assets. Our largest non-U.S. pension plans are in the United Kingdom and Germany, respectively. The expected long-term rate of return on plan assets for the United Kingdom was 6.75 percent and the expected long-term rate of return on plan assets for Germany was 5.75 percent. Management, in conjunction with our external financial advisors, uses actual historical returns of the asset portfolio to assess the reasonableness of the expected rate of return for each plan.
|
Assumed health care trend rates |
2015 |
2014 |
2013 |
|||||||||
|
Health care cost trend rate assumed for next year |
7.00 | % | 6.50 | % | 7.25 | % | ||||||
|
Rate to which the cost trend rate is assumed to decline (the ultimate trend rate) |
5.00 | % | 5.00 | % | 5.00 | % | ||||||
|
Fiscal year that the rate reaches the ultimate trend rate |
2024 |
2018 |
2019 |
|||||||||
Sensitivity Information: A one-percentage point change in the health care cost trend rate would have the following effects on the November 28, 2015 service and interest cost and the accumulated postretirement benefit obligation at November 28, 2015:
|
One-Percentage Point |
||||||||
|
Increase |
Decrease |
|||||||
|
Effect on service and interest cost components – annual |
$ | 1 | $ | (101 | ) | |||
|
Effect on accumulated postretirement benefit obligation |
$ | (193 | ) | $ | (2,387 | ) | ||
The asset allocation for the company’s U.S. and non-U.S. pension plans at the end of 2015 and 2014 follows.
|
U.S. Pension Plans |
Non-U.S. Pension Plans |
Other Postretirement Plans |
||||||||||||||||||||||||||||||||||
|
Target |
Percentage of Plan Assets at Year-End |
Target |
Percentage of Plan Assets at Year-End |
Target |
Percentage of Plan Assets at Year-End |
|||||||||||||||||||||||||||||||
|
Asset Category |
2015 |
2015 |
2014 |
2015 |
2015 |
2014 |
2015 |
2015 |
2014 |
|||||||||||||||||||||||||||
|
Equities |
60.0 | % | 57.7 | % | 60.2 | % | 49.5 | % | 50.3 | % | 49.8 | % | 0.0 | % | 0.0 | % | 0.0 | % | ||||||||||||||||||
|
Fixed income |
40.0 | % | 38.8 | % | 38.9 | % | 50.5 | % | 49.1 | % | 46.7 | % | 0.0 | % | 0.0 | % | 0.0 | % | ||||||||||||||||||
|
Real Estate |
0.0 | % | 0.0 | % | 0.0 | % | 0.0 | % | 0.0 | % | 1.1 | % | 0.0 | % | 0.0 | % | 0.0 | % | ||||||||||||||||||
|
Insurance |
0.0 | % | 0.0 | % | 0.0 | % | 0.0 | % | 0.0 | % | 0.0 | % | 100.0 | % | 99.5 | % | 98.3 | % | ||||||||||||||||||
|
Cash |
0.0 | % | 3.5 | % | 0.9 | % | 0.0 | % | 0.6 | % | 2.4 | % | 0.0 | % | 0.5 | % | 1.7 | % | ||||||||||||||||||
|
Total |
100 | % | 100 | % | 100 | % | 100 | % | 100 | % | 100 | % | 100 | % | 100 | % | 100 | % | ||||||||||||||||||
Plan Asset Management
Plan assets are held in trust and invested in mutual funds, separately managed accounts and other commingled investment vehicles holding U.S. and non-U.S. equity securities, fixed income securities and other investment classes. We employ a total return approach whereby a mix of equities and fixed income investments are used to maximize the long-term return of plan assets for a prudent level of risk. Futures and options may also be used to enhance risk-adjusted long-term returns while improving portfolio diversification and duration. Risk management is accomplished through diversification across asset classes, utilization of multiple investment managers and general plan-specific investment policies. Risk tolerance is established through careful consideration of the plan liabilities, plan funded status and our assessment of our overall liquidity position. This asset allocation policy mix is reviewed annually and actual versus target allocations are monitored regularly and rebalanced on an as-needed basis. Plan assets are invested using a combination of active and passive investment strategies. Passive, or “indexed” strategies, attempt to mimic rather than exceed the investment performance of a market benchmark. The plans’ active investment strategies employ multiple investment management firms which in aggregate cover a range of investment styles and approaches. Performance is monitored and compared to relevant benchmarks on a regular basis.
The U.S. pension plans consist of two plans: a pension plan and a supplemental executive retirement plan (SERP). There were no assets in the SERP in 2015 and 2014. Consequently, all of the data disclosed in the asset allocation table for the U.S. pension plans pertain to our U.S. pension plan.
During 2015 we maintained our assets within the allowed ranges of the target asset allocation mix of 60 percent equities and 40 percent fixed income plus or minus 5 percent and continued our focus to reduce volatility of plan assets in future periods and to more closely match the duration of the assets with the duration of the liabilities of the plan. We plan to maintain the portfolio at this target allocation in 2016.
The non-U.S. pension plans consist of all the pension plans administered by us outside the U.S., principally consisting of plans in Germany, the United Kingdom, France and Canada. During 2015 we maintained our assets for the non-U.S. pension plans at the specific target asset allocation mix determined for each plan plus or minus the allowed rate and continued our focus to reduce volatility of plan assets in future periods and to more closely match the duration of the assets with the duration of the liabilities of the individual plans. We plan to maintain the portfolios at their respective target asset allocations in 2016.
Other postretirement benefits plans consist of two U.S. plans: a retiree medical health care plan and a group term life insurance plan. There were no assets in the group term life insurance plan for 2015 and 2014. Consequently, all of the data disclosed in the asset allocation table for other postretirement plans pertain to our retiree medical health care plan. Our investment strategy for other postretirement benefit plans is to own insurance policies that maintain an asset allocation nearly completely in equities. These equities are invested in a passive portfolio indexed to the S&P 500. Our large weighting to equities in these plans is driven by the investment options available and the relative underfunded status of the plans.
Fair Value of Plan Assets
The following table presents plan assets categorized within a three-level fair value hierarchy as described in Note 13.
|
November 28, 2015 |
||||||||||||||||
|
U.S. Pension Plans |
Level 1 |
Level 2 |
Level 3 |
Total Assets |
||||||||||||
|
Equities |
$ | 123,816 | $ | 70,325 | $ | - | $ | 194,141 | ||||||||
|
Fixed income |
29,948 | 100,086 | 352 | 130,386 | ||||||||||||
|
Cash |
11,934 | - | - | 11,934 | ||||||||||||
|
Total |
$ | 165,698 | $ | 170,411 | $ | 352 | $ | 336,461 | ||||||||
|
Non-U.S. Pension Plans |
Level 1 |
Level 2 |
Level 3 |
Total Assets |
||||||||||||
|
Equities |
$ | 31,253 | $ | 55,430 | $ | - | $ | 86,683 | ||||||||
|
Fixed income |
41,572 | 42,595 | 530 | 84,697 | ||||||||||||
|
Cash |
861 | - | - | 861 | ||||||||||||
|
Total |
$ | 73,686 | $ | 98,025 | $ | 530 | $ | 172,241 | ||||||||
|
Other Postretirement Benefits |
Level 1 |
Level 2 |
Level 3 |
Total Assets |
||||||||||||
|
Insurance |
$ | - | $ | - | $ | 62,299 | $ | 62,299 | ||||||||
|
Cash |
286 | - | - | 286 | ||||||||||||
|
Total |
$ | 286 | $ | - | $ | 62,299 | $ | 62,585 | ||||||||
|
November 29, 2014 |
||||||||||||||||
|
U.S. Pension Plans |
Level 1 |
Level 2 |
Level 3 |
Total Assets |
||||||||||||
|
Equities |
$ | 138,308 | $ | 93,056 | $ | - | $ | 231,364 | ||||||||
|
Fixed income |
27,782 | 121,450 | 407 | 149,639 | ||||||||||||
|
Cash |
3,332 | - | - | 3,332 | ||||||||||||
|
Total |
$ | 169,422 | $ | 214,506 | $ | 407 | $ | 384,335 | ||||||||
|
Non-U.S. Pension Plans |
Level 1 |
Level 2 |
Level 3 |
Total Assets |
||||||||||||
|
Equities |
$ | 34,362 | $ | 59,504 | $ | - | $ | 93,866 | ||||||||
|
Fixed income |
48,346 | 39,006 | 582 | 87,934 | ||||||||||||
|
Real Estate |
- | - | 2,160 | 2,160 | ||||||||||||
|
Cash |
4,464 | - | - | 4,464 | ||||||||||||
|
Total |
$ | 87,172 | $ | 98,510 | $ | 2,742 | $ | 188,424 | ||||||||
|
Other Postretirement Benefits |
Level 1 |
Level 2 |
Level 3 |
Total Assets |
||||||||||||
|
Insurance |
$ | - | $ | - | $ | 61,980 | $ | 61,980 | ||||||||
|
Cash |
1,096 | - | - | 1,096 | ||||||||||||
|
Total |
$ | 1,096 | $ | - | $ | 61,980 | $ | 63,076 | ||||||||
The definitions of fair values of our pension and other postretirement benefit plan assets at November 28, 2015 and November 29, 2014 by asset category are as follows:
Equities—Primarily publicly traded common stock for purposes of total return and to maintain equity exposure consistent with policy allocations. Investments include: (i) U.S. and non-U.S. equity securities and mutual funds valued at closing prices from national exchanges; and (ii) commingled funds valued at unit values or net asset values provided by the investment managers, which are based on the fair value of the underlying investments. Funds valued at net asset value have various investment strategies including seeking maximum total returns consistent with prudent investment management, seeking current income consistent with preservation of capital and daily liquidity and seeking to approximate the risk and return characterized by a specific index fund. There are no restrictions for redeeming holdings out of these funds and the funds have no unfunded commitments.
Fixed income—Primarily corporate and government debt securities for purposes of total return and managing fixed income exposure to policy allocations. Investments include (i) mutual funds valued at closing prices from national exchanges, (ii) corporate and government debt securities valued at closing prices from national exchanges, (iii) commingled funds valued at unit values or net asset value provided by the investment managers, which are based on the fair value of the underlying investments, and (iv) an annuity contract, the value of which is determined by the provider and represents the amount the plan would receive if the contract were cashed out at year-end.
Real Estate—Property fund for purposes of total return. Investment is a comingled property fund valued at unit value provided by the investment manager, which is based on a valuation performed by a third party provider retained by the investment manager.
Insurance—Insurance contracts for purposes of funding postretirement medical benefits. Fair values are the cash surrender values as determined by the providers which are the amounts the plans would receive if the contracts were cashed out at year end.
Cash–Cash balances on hand, accrued income and pending settlements of transactions for purposes of handling plan payments. Fair values are the cash balances as reported by the Trustees of the plans.
The following is a roll forward of the Level 3 investments of our pension and postretirement benefit plan assets during the year ended November 28, 2015:
|
U.S. Pension Plans |
Fixed Income |
|||
|
Level 3 balance at beginning of year |
$ | 407 | ||
|
Purchases, sales, issuances and settlements, net |
(55 | ) | ||
|
Level 3 balance at end of year |
$ | 352 | ||
|
Non-U.S. Pension Plans |
Fixed Income |
Real Estate |
Total |
|||||||||
|
Level 3 balance at beginning of year |
$ | 582 | $ | 2,160 | $ | 2,742 | ||||||
|
Net transfers into / (out of) level 3 |
28 | (12 | ) | 16 | ||||||||
|
Purchases, sales, issuances and settlements, net |
- | (2,388 | ) | (2,388 | ) | |||||||
|
Net gains |
9 | 282 | 291 | |||||||||
|
Currency change effect |
(89 | ) | (42 | ) | (131 | ) | ||||||
|
Level 3 balance at end of year |
$ | 530 | $ | - | $ | 530 | ||||||
|
Other Postretirement Benefits |
Insurance |
|||
|
Level 3 balance at beginning of year |
$ | 61,980 | ||
|
Net transfers into / (out of) level 3 |
(701 | ) | ||
|
Purchases, sales, issuances and settlements, net |
(462 | ) | ||
|
Net gains |
1,482 | |||
|
Level 3 balance at end of year |
$ | 62,299 | ||
Note 11: Financial Instruments
Foreign Currency Derivative Instruments
As a result of being a global enterprise, our earnings, cash flows and financial position are exposed to foreign currency risk from foreign currency denominated receivables and payables. These items are denominated in various foreign currencies, including the Euro, British pound sterling, Canadian dollar, Chinese renminbi, Japanese yen, Australian dollar, Argentine peso, Brazilian real, Colombian peso, Mexican peso, Turkish lira, Egyptian pound, Indian rupee, and Malaysian ringgit.
Our objective is to balance, where possible, local currency denominated assets to local currency denominated liabilities to have a natural hedge and minimize foreign exchange impacts. We take steps to minimize risks from foreign currency exchange rate fluctuations through normal operating and financing activities and, when deemed appropriate, through the use of derivative instruments. We do not enter into any speculative positions with regard to derivative instruments.
We enter into derivative contracts with a group of investment grade multinational commercial banks. We evaluate the credit quality of each of these banks on a periodic basis as warranted.
Effective October 7, 2015, we entered into three cross-currency swap agreements to convert a notional amount of $134,736 of foreign currency denominated intercompany loans into US dollars. The first swap matures in 2017, the second swap matures in 2018 and the third swap matures in 2019. As of November 28, 2015, the combined fair value of the swaps was an asset of $5,384 and was included in other assets in the Consolidated Balance Sheets. The swaps were designated as cash-flow hedges for accounting treatment. The lesser amount between the cumulative change in the fair value of the actual swaps and the cumulative change in the fair value of hypothetical swaps is recorded in accumulated other comprehensive income (loss) in the Consolidated Balance Sheets. The difference between the cumulative change in the fair value of the actual swaps and the cumulative change in the fair value of hypothetical swaps are recorded as other income (expense), net in the Consolidated Statements of Income. In a perfectly effective hedge relationship, the two fair value calculations would exactly offset each other. Any difference in the calculation represents hedge ineffectiveness. The ineffectiveness calculations as of November 28, 2015 resulted in additional pre-tax loss of $53 year-to-date as the change in fair value of the cross-currency swaps was less than the change in the fair value of the hypothetical swaps. The amount in accumulated other comprehensive income (loss) related to cross-currency swaps was a loss of $1,317 as of November 28, 2015. The estimated net amount of the existing loss that is reported in accumulated other comprehensive income (loss) as of November 28, 2015 that is expected to be reclassified into earnings within the next twelve months is $785. As of November 28, 2015, we do not believe any gains or losses will be reclassified into earnings as a result of the discontinuance of these cash flow hedges because the original forecasted transaction will not occur.
The following table summarizes the cross-currency swaps outstanding as of November 28, 2015:
|
Fiscal Year of Expiration |
Interest Rate |
Notional Value |
Fair Value |
||||||||||
|
Pay EUR |
2017 |
3.05% | $ | 44,912 | $ | 2,055 | |||||||
|
Receive USD |
3.9145% | ||||||||||||
|
Pay EUR |
2018 |
3.45% | 44,912 | 1,772 | |||||||||
|
Receive USD |
4.5374% | ||||||||||||
|
Pay EUR |
2019 |
3.80% | 44,912 | 1,557 | |||||||||
|
Receive USD |
5.0530% | ||||||||||||
|
Total |
$ | 134,736 | $ | 5,384 | |||||||||
Except for the cross-currency swap agreements listed above, foreign currency derivative instruments outstanding are not designated as hedges for accounting purposes. The gains and losses related to mark-to-market adjustments are recognized as other income or expense in the Consolidated Statements of Income during the periods in which the derivative instruments are outstanding. See Note 13 for fair value amounts of these derivative instruments.
As of November 28, 2015, we had forward foreign currency contracts maturing between December 15, 2015 and October 7, 2016. The mark-to-market effect associated with these contracts, on a net basis, at each year end was a gain of $10,442, a gain of $574 and a loss of $856 in 2015, 2014 and 2013, respectively. These gains and losses were largely offset by the underlying transaction gains and losses resulting from the foreign currency exposures for which these contracts relate.
Interest Rate Swaps
We have interest rate swap agreements to convert $75,000 of our Senior Notes to variable interest rates. See Note 7 for additional information. The change in fair value of the Senior Notes, attributable to the change in the risk being hedged, was a liability of $3,356 at November 28, 2015 and $4,735 at November 29, 2014 and were included in long-term debt in the Consolidated Balance Sheets. The fair value of the swaps in total was an asset of $3,395 at November 28, 2015 and $4,726 at November 29, 2014 and were included in other assets in the Consolidated Balance Sheets. The swaps were designated for hedge accounting treatment as fair value hedges.
The changes in the fair value of the swap and the fair value of the Senior Notes attributable to the change in the risk being hedged are recorded as other income (expense), net in the Consolidated Statements of Income. In a perfectly effective hedge relationship, the two fair value calculations would exactly offset each other. Any difference in the calculation represents hedge ineffectiveness. The calculation as of November 28, 2015, resulted in additional year-to-date pre-tax gain of $48 as the fair value of the interest rate swaps decreased by less than the change in the fair value of the Senior Notes attributable to the change in the risk being hedged. The calculations as of November 29, 2014 and November 30, 2013 resulted in an additional year-to-date pre-tax gain of $126 and pre-tax loss of $746, respectively.
Concentrations of credit risk with respect to trade accounts receivable are limited due to the large number of entities in the customer base and their dispersion across many different industries and countries. As of November 28, 2015, there were no significant concentrations of credit risk.
Note 12: Commitments and Contingencies
Leases: The minimum lease payments, related to buildings, equipment and vehicles, that are expected to be made in each of the years indicated based on operating leases in effect at November 28, 2015 are:
|
Fiscal Year |
2016 |
2017 |
2018 |
2019 |
2020 |
Remainder |
Total Minimum Lease Payments |
|||||||||||||||||||||
|
Operating Leases |
$ | 7,354 | $ | 4,423 | $ | 2,591 | $ | 1,423 | $ | 923 | $ | 717 | $ | 17,431 | ||||||||||||||
Rent expense for all operating leases, which includes minimum lease payments and other charges such as common area maintenance fees, was $12,684, $14,481 and $12,716 in 2015, 2014 and 2013, respectively.
Environmental Matters: From time to time, we become aware of compliance matters relating to, or receive notices from, federal, state or local entities regarding possible or alleged violations of environmental, health or safety laws and regulations. We review the circumstances of each individual site, considering the number of parties involved, the level of potential liability or our contribution relative to the other parties, the nature and magnitude of the hazardous substances involved, the method and extent of remediation, the estimated legal and consulting expense with respect to each site and the time period over which any costs would likely be incurred. Also, from time to time, we are identified as a potentially responsible party (PRP) under the Comprehensive Environmental Response, Compensation and Liability Act (CERCLA) and/or similar state laws that impose liability for costs relating to the clean up of contamination resulting from past spills, disposal or other release of hazardous substances. We are also subject to similar laws in some of the countries where current and former facilities are located. Our environmental, health and safety department monitors compliance with applicable laws on a global basis. To the extent we can reasonably estimate the amount of our probable liabilities for environmental matters, we establish a financial provision.
Currently we are involved in various environmental investigations, clean up activities and administrative proceedings and lawsuits. In particular, we are currently deemed a PRP in conjunction with numerous other parties, in a number of government enforcement actions associated with landfills and/or hazardous waste sites. As a PRP, we may be required to pay a share of the costs of investigation and clean up of these sites. In addition, we are engaged in environmental remediation and monitoring efforts at a number of current and former operating facilities. While uncertainties exist with respect to the amounts and timing of the ultimate environmental liabilities, based on currently available information, we have concluded that these matters, individually or in the aggregate, will not have a material adverse effect on our results of operations, financial condition or cash flow.
Other Legal Proceedings: From time to time and in the ordinary course of business, we are a party to, or a target of, lawsuits, claims, investigations and proceedings, including product liability, personal injury, contract, patent and intellectual property, environmental, health and safety, tax and employment matters. While we are unable to predict the outcome of these matters, we have concluded, based upon currently available information, that the ultimate resolution of any pending matter, individually or in the aggregate, including the asbestos litigation described in the following paragraphs, will not have a material adverse effect on our results of operations, financial condition or cash flow.
We have been named as a defendant in lawsuits in which plaintiffs have alleged injury due to products containing asbestos manufactured more than 30 years ago. The plaintiffs generally bring these lawsuits against multiple defendants and seek damages (both actual and punitive) in very large amounts. In many cases, plaintiffs are unable to demonstrate that they have suffered any compensable injuries or that the injuries suffered were the result of exposure to products manufactured by us. We are typically dismissed as a defendant in such cases without payment. If the plaintiff presents evidence indicating that compensable injury occurred as a result of exposure to our products, the case is generally settled for an amount that reflects the seriousness of the injury, the length, intensity and character of exposure to products containing asbestos, the number and solvency of other defendants in the case, and the jurisdiction in which the case has been brought.
A significant portion of the defense costs and settlements in asbestos-related litigation is paid by third parties, including indemnification pursuant to the provisions of a 1976 agreement under which we acquired a business from a third party. Currently, this third party is defending and paying settlement amounts, under a reservation of rights, in most of the asbestos cases tendered to the third party.
In addition to the indemnification arrangements with third parties, we have insurance policies that generally provide coverage for asbestos liabilities, including defense costs. Historically, insurers have paid a significant portion of our defense costs and settlements in asbestos-related litigation. However, certain of our insurers are insolvent. We have entered into cost-sharing agreements with our insurers that provide for the allocation of defense costs and settlements and judgments in asbestos-related lawsuits. These agreements require, among other things, that we fund a share of settlements and judgments allocable to years in which the responsible insurer is insolvent
A summary of the number of and settlement amounts for asbestos-related lawsuits and claims is as follows:
|
Year Ended |
Year Ended |
Year Ended |
||||||||||
|
November 28, |
November 29, |
November 30, |
||||||||||
|
2015 |
2014 |
2013 |
||||||||||
|
Lawsuits and claims settled |
10 | 9 | 6 | |||||||||
|
Settlement amounts |
$ | 858 | $ | 843 | $ | 371 | ||||||
|
Insurance payments received or expected to be received |
$ | 682 | $ | 687 | $ | 279 | ||||||
We do not believe that it would be meaningful to disclose the aggregate number of asbestos-related lawsuits filed against us because relatively few of these lawsuits are known to involve exposure to asbestos-containing products that we manufactured. Rather, we believe it is more meaningful to disclose the number of lawsuits that are settled and result in a payment to the plaintiff. To the extent we can reasonably estimate the amount of our probable liabilities for pending asbestos-related claims, we establish a financial provision and a corresponding receivable for insurance recoveries.
Based on currently available information, we have concluded that the resolution of any pending matter, including asbestos-related litigation, individually or in the aggregate, will not have a material adverse effect on our results of operations, financial condition or cash flow.
Note 13: Fair Value Measurements
Overview
Estimates of fair value for financial assets and liabilities are based on the framework established in the accounting guidance for fair value measurements. The framework defines fair value, provides guidance for measuring fair value and requires certain disclosures. The framework discusses valuation techniques, such as the market approach (comparable market prices), the income approach (present value of future income or cash flow) and the cost approach (cost to replace the service capacity of an asset or replacement cost). The framework utilizes a fair value hierarchy that prioritizes the inputs to valuation techniques used to measure fair value into three broad levels. The following is a brief description of those three levels:
|
|
● |
Level 1: Observable inputs such as quoted prices (unadjusted) in active markets for identical assets or liabilities. |
|
|
● |
Level 2: Inputs other than quoted prices that are observable for the asset or liability, either directly or indirectly. These include quoted prices for similar assets or liabilities in active markets and quoted prices for identical or similar assets or liabilities in markets that are not active. |
|
|
● |
Level 3: Unobservable inputs that reflect management’s assumptions, and include situations where there is little, if any, market activity for the asset or liability. |
Balances Measured at Fair Value on a Recurring Basis
The following table presents information about our financial assets and liabilities that are measured at fair value on a recurring basis as of November 28, 2015 and November 29, 2014, and indicates the fair value hierarchy of the valuation techniques utilized to determine such fair value.
|
Fair Value Measurements Using: |
||||||||||||||||
|
November 28, |
||||||||||||||||
|
Description |
2015 |
Level 1 |
Level 2 |
Level 3 |
||||||||||||
|
Assets: |
||||||||||||||||
|
Marketable securities |
$ | 1,698 | $ | 1,698 | $ | - | $ | - | ||||||||
|
Derivative assets |
15,185 | - | 15,185 | - | ||||||||||||
|
Interest rate swaps |
3,395 | - | 3,395 | - | ||||||||||||
|
Cash-flow hedges |
5,384 | - | 5,384 | - | ||||||||||||
|
Liabilities: |
||||||||||||||||
|
Derivative liabilities |
$ | 4,744 | $ | - | $ | 4,744 | $ | - | ||||||||
|
Contingent consideration liabilities, continuing operations |
10,854 | - | - | 10,854 | ||||||||||||
|
Fair Value Measurements Using: |
||||||||||||||||
|
November 29, |
||||||||||||||||
|
Description |
2014 |
Level 1 |
Level 2 |
Level 3 |
||||||||||||
|
Assets: |
||||||||||||||||
|
Marketable securities |
$ | 748 | $ | 748 | $ | - | $ | - | ||||||||
|
Derivative assets |
1,007 | - | 1,007 | - | ||||||||||||
|
Interest rate swaps |
4,726 | - | 4,726 | - | ||||||||||||
|
Cash-flow hedges |
5,408 | - | 5,408 | - | ||||||||||||
|
Liabilities: |
||||||||||||||||
|
Derivative liabilities |
$ | 433 | $ | - | $ | 433 | $ | - | ||||||||
|
Contingent consideration liabilities, continuing operations |
196 | - | - | 196 | ||||||||||||
|
Contingent consideration liabilities, discontinued operations |
5,000 | - | - | 5,000 | ||||||||||||
We use the income approach in calculating the fair value of our contingent consideration liabilities using a discounted cash flow model and Level 3 inputs. The expected cash flows are affected by various significant judgments and assumptions, including revenue growth rates, profit margin percentages and discount rate, which are sensitive to change. Estimates of fair value are inherently uncertain and represent only management’s reasonable expectation regarding future developments. These estimates and the judgments and assumptions upon which the estimates are based will, in all likelihood, differ in some respects from actual future results. The valuation of our contingent consideration related to the acquisition of Tonsan Adhesive, Inc. as of November 28, 2015 resulted in a fair value of $10,704 and a $3,191 adjustment recorded to SG&A in the Statement of Income as of November 28, 2015.
|
Contingent consideration liabilities, continuing operations |
||||
|
Level 3 balance at beginning of year |
$ | 196 | ||
|
Initial valuation of Tonsan contingent consideration |
7,714 | |||
|
Mark to market adjustment |
3,145 | |||
|
Foreign currency translation adjustment |
(201 | ) | ||
|
Level 3 balance at end of year |
$ | 10,854 |
Balances Measured at Fair Value on a Nonrecurring Basis
We measure certain assets and liabilities at fair value on a nonrecurring basis. These assets include tangible and intangible assets acquired and liabilities assumed in an acquisition, and cost basis investments that are written down to fair value when they are determined to be impaired.
Property, plant and equipment related to acquisitions – Property, plant and equipment acquired in connection with our acquisitions during 2015 were measured using unobservable (Level 3) inputs, using the cost approach. The cost approach computes the cost to replace the asset, less accrued depreciation resulting from physical deterioration, functional obsolescence and external obsolescence.
Intangible assets related to acquisitions – The identified intangible assets acquired in connection with our acquisitions during 2015 were measured using unobservable (Level 3) inputs. The fair value of the intangible assets was calculated using either the income approach or a discounted market-based methodology approach. Significant inputs include estimated revenue growth rates, gross margins, operating expenses, estimated attrition rate, and a discount rate.
See Note 2 for further discussion regarding our acquisitions.
Note 14: Operating Segments
We are required to report segment information in the same way that we internally organize our business for assessing performance and making decisions regarding allocation of resources. We report our business in four reportable segments: Americas Adhesives, EIMEA, Asia Pacific and Construction Products.
For segment evaluation by the chief operating decision maker, segment operating income is defined as gross profit less SG&A expenses. Segment operating income excludes special charges, net. Corporate expenses are fully allocated to each operating segment. Corporate assets are not allocated to the operating segments. Inter-segment revenues are recorded at cost plus a markup for administrative costs. Operating results of each of these segments are regularly reviewed by our chief operating decision maker to make decisions about resources to be allocated to the segments and assess their performance.
The business components within each operating segment are managed to maximize the results of the overall operating segment rather than the results of any individual business component of the operating segment. Results of individual components of each operating segment are subject to numerous allocations of segment-wide costs that may or may not have been focused on that particular component for a particular reporting period. The costs for these allocated resources are not tracked on a “where-used” basis as financial performance is assessed at the total operating segment level.
Reportable operating segment financial information for all periods presented is as follows:
|
2015 |
2014 |
2013 |
||||||||||
|
Net revenue |
||||||||||||
|
Americas Adhesives |
$ | 876,810 | $ | 920,679 | $ | 902,573 | ||||||
|
EIMEA |
605,064 | 719,787 | 733,211 | |||||||||
|
Asia Pacific |
368,736 | 275,809 | 252,608 | |||||||||
|
Construction Products |
233,050 | 188,179 | 158,576 | |||||||||
|
Total |
$ | 2,083,660 | $ | 2,104,454 | $ | 2,046,968 | ||||||
|
Inter-segment sales |
||||||||||||
|
Americas Adhesives |
$ | 23,569 | $ | 22,120 | $ | 26,096 | ||||||
|
EIMEA |
19,089 | 13,918 | 9,228 | |||||||||
|
Asia Pacific |
14,402 | 13,034 | 14,818 | |||||||||
|
Construction Products |
1,474 | 800 | 462 | |||||||||
|
Segment operating income |
||||||||||||
|
Americas Adhesives |
$ | 126,272 | $ | 103,339 | $ | 123,265 | ||||||
|
EIMEA |
11,881 | 30,521 | 51,526 | |||||||||
|
Asia Pacific |
17,174 | 9,317 | 9,771 | |||||||||
|
Construction Products |
15,158 | 6,664 | 10,940 | |||||||||
|
Total |
$ | 170,485 | $ | 149,841 | $ | 195,502 | ||||||
|
Depreciation and amortization |
||||||||||||
|
Americas Adhesives |
$ | 22,172 | $ | 22,180 | $ | 20,832 | ||||||
|
EIMEA |
23,518 | 24,363 | 20,420 | |||||||||
|
Asia Pacific |
15,966 | 7,230 | 6,522 | |||||||||
|
Construction Products |
13,234 | 11,751 | 11,021 | |||||||||
|
Total |
$ | 74,890 | $ | 65,524 | $ | 58,795 | ||||||
|
Total assets1 |
||||||||||||
|
Americas Adhesives |
$ | 458,385 | $ | 474,691 | $ | 471,520 | ||||||
|
EIMEA |
669,883 | 787,194 | 759,757 | |||||||||
|
Asia Pacific |
551,410 | 238,627 | 218,471 | |||||||||
|
Construction Products |
204,758 | 198,276 | 175,489 | |||||||||
|
Corporate |
157,816 | 168,353 | 245,926 | |||||||||
|
Discontinued Operations |
- | 1,865 | 1,865 | |||||||||
|
Total |
$ | 2,042,252 | $ | 1,869,006 | $ | 1,873,028 | ||||||
|
Capital expenditures |
||||||||||||
|
Americas Adhesives |
$ | 9,775 | $ | 18,045 | $ | 26,225 | ||||||
|
EIMEA |
16,864 | 71,926 | 63,512 | |||||||||
|
Asia Pacific |
13,338 | 22,377 | 10,150 | |||||||||
|
Construction Products |
13,925 | 2,073 | 1,737 | |||||||||
|
Corporate |
4,722 | 25,373 | 22,664 | |||||||||
|
Total |
$ | 58,624 | $ | 139,794 | $ | 124,288 | ||||||
1Segment assets include primarily inventory, accounts receivable, property, plant and equipment and other miscellaneous assets. Corporate assets include primarily corporate property, plant and equipment, deferred tax assets, certain investments and other assets.
Reconciliation of segment operating income to income from continuing operations before income taxes and income from equity method investments
|
2015 |
2014 |
2013 |
||||||||||||
|
Segment operating income |
$ | 170,485 | $ | 149,841 | $ | 195,502 | ||||||||
|
Special charges, net |
(4,654 | ) | (51,501 | ) | (45,087 | ) | ||||||||
|
Other income (expense), net |
(2,465 | ) | 716 | (3,751 | ) | |||||||||
|
Interest expense |
(25,021 | ) | (19,744 | ) | (19,120 | ) | ||||||||
|
Income from continuing operations before income taxes and income from equity method investments |
$ | 138,345 | $ | 79,312 | $ | 127,544 | ||||||||
Financial information about geographic areas
|
Net Revenue |
||||||||||||
|
2015 |
2014 |
2013 |
||||||||||
|
United States |
$ | 891,436 | $ | 878,058 | $ | 855,053 | ||||||
|
All other countries with less than 10 percent of total |
1,192,224 | 1,226,396 | 1,191,915 | |||||||||
|
Total |
$ | 2,083,660 | $ | 2,104,454 | $ | 2,046,968 | ||||||
|
Property, Plant and Equipment, net |
||||||||||||
|
2015 |
2014 |
2013 |
||||||||||
|
United States |
$ | 193,819 | $ | 205,412 | $ | 185,260 | ||||||
|
Germany |
101,013 | 116,301 | 86,335 | |||||||||
|
China |
94,763 | 40,748 | 29,202 | |||||||||
|
All other countries with less than 10 percent of total |
123,265 | 140,173 | 133,590 | |||||||||
|
Total |
$ | 512,860 | $ | 502,634 | $ | 434,387 | ||||||
Note 15: Redeemable Non-Controlling Interest
We account for the non-controlling interest in H.B. Fuller Kimya Sanayi Ticaret A.S. (HBF Kimya) as a redeemable non-controlling interest because both the non-controlling shareholder and H.B. Fuller have an option, exercisable beginning August 1, 2018, to require the redemption of the shares owned by the non-controlling shareholder at a price determined by a formula based on 24 months trailing EBITDA. Since the option makes the redemption of the non-controlling ownership shares of HBF Kimya outside of our control, these shares are classified as a redeemable non-controlling interest in temporary equity in the Consolidated Balance Sheets. The non-controlling shareholder is entitled to increase his ownership by 1 percent per year for 5 years up to a maximum of 13 percent ownership based on the achievement of profitability targets in each year. The option is subject to a minimum price of €3,500. The redemption value of the option, if it were currently redeemable, is estimated to be €3,500.
The results of operations for the HBF Kimya’s non-controlling interest are consolidated in our financial statements. Both the non-controlling interest and the accretion adjustment to redemption value are included in net income or loss attributable to non-controlling interests in the Consolidated Statements of Income and in the carrying value of the redeemable non-controlling interest on the Consolidated Balance Sheets. HBF Kimya’s functional currency is the Turkish lira and changes in exchange rates will affect the reported amount of the redeemable non-controlling interest.
The acquisition of 95 percent of the equity of Tonsan Adhesives, Inc. and the concurrent agreement to acquire the remaining 5 percent in the future, resulted in the assumption of a non-controlling interest for the remaining equity. Based on requirements to redeem this non-controlling interest beginning February 1, 2019, the non-controlling interest was immediately recognized as a liability and reclassified to other liabilities. The fair value of the non-controlling interest as of the date of acquisition was $11,773.
As of November 28, 2015 and November 29, 2014 the redeemable non-controlling interests were:
|
2015 |
2014 |
|||||||
|
Balance at beginning of year |
$ | 4,654 | $ | 4,717 | ||||
|
Non-controlling interest assumed |
11,773 | - | ||||||
|
Recognition of non-controlling interest redemption liability |
(11,773 | ) | - | |||||
|
Net income attributed to redeemable non-controlling interest |
320 | 357 | ||||||
|
Foreign currency translation adjustment |
(775 | ) | (420 | ) | ||||
|
Balance at end of year |
$ | 4,199 | $ | 4,654 | ||||
Note 16: Quarterly Data (unaudited)
|
2015 |
||||||||||||||||
|
(In thousands, except per share amounts) |
Q1 |
Q2 |
Q3 |
Q4 |
||||||||||||
|
Net revenue |
$ | 470,661 | $ | 540,762 | $ | 524,133 | $ | 548,104 | ||||||||
|
Gross profit |
116,206 | 148,937 | 146,840 | 156,060 | ||||||||||||
|
Selling, general and administrative expenses |
(94,833 | ) | (100,582 | ) | (98,297 | ) | (103,846 | ) | ||||||||
|
Special charges, net |
(2,361 | ) | (934 | ) | (1,297 | ) | (62 | ) | ||||||||
|
Income from continuing operations |
$ | 9,795 | $ | 26,616 | $ | 26,886 | $ | 25,100 | ||||||||
|
Basic Income per share |
$ | 0.19 | $ | 0.53 | $ | 0.53 | $ | 0.50 | ||||||||
|
Diluted Income per share |
$ | 0.19 | $ | 0.51 | $ | 0.52 | $ | 0.49 | ||||||||
|
Weighted-average common shares outstanding |
||||||||||||||||
|
Basic |
50,188 | 50,345 | 50,421 | 50,143 | ||||||||||||
|
Diluted |
51,379 | 51,471 | 51,530 | 51,194 | ||||||||||||
|
2014 |
||||||||||||||||
|
(In thousands, except per share amounts) |
Q1 |
Q2 |
Q3 |
Q41 |
||||||||||||
|
Net revenue |
$ | 485,981 | $ | 544,034 | $ | 526,765 | $ | 547,674 | ||||||||
|
Gross profit |
133,045 | 142,655 | 125,154 | 132,436 | ||||||||||||
|
Selling, general and administrative expenses |
(96,799 | ) | (96,372 | ) | (96,779 | ) | (93,499 | ) | ||||||||
|
Special charges, net |
(11,734 | ) | (13,538 | ) | (12,343 | ) | (13,886 | ) | ||||||||
|
Income from continuing operations |
$ | 14,649 | $ | 20,626 | $ | 4,084 | $ | 10,792 | ||||||||
|
Basic Income per share |
$ | 0.29 | $ | 0.41 | $ | 0.08 | $ | 0.22 | ||||||||
|
Diluted Income per share |
$ | 0.28 | $ | 0.40 | $ | 0.08 | $ | 0.21 | ||||||||
|
Weighted-average common shares outstanding |
||||||||||||||||
|
Basic |
49,910 | 49,956 | 50,053 | 50,107 | ||||||||||||
|
Diluted |
51,255 | 51,175 | 51,297 | 51,296 | ||||||||||||
|
1 |
Includes a correction of an error in our Sekisui-Fuller joint venture of $1,643. |
Item 9. Changes in and Disagreements with Accountants on Accounting and Financial Disclosure
None.
Item 9A. Disclosure Controls and Procedures
Controls and Procedures
As of the end of the period covered by this report, management conducted an evaluation, under the supervision and with the participation of our President and Chief Executive Officer and Executive Vice President, Chief Financial Officer, of our disclosure controls and procedures (as defined in Rules 13a-15(e) and 15d-15(e) under the Securities Exchange Act of 1934 (Exchange Act)). Based on its evaluation, our management concluded that, as of November 28, 2015, our disclosure controls and procedures were not effective as a result of a material weakness in the Company’s internal control over financial reporting related to the ineffective design and operation of internal controls related to the accounting for the acquisition of Tonsan Adhesive, Inc. as described in Management’s Report on Internal Controls over Financial Reporting.
Notwithstanding this material weakness in accounting for the acquisition of Tonsan Adhesive, Inc., management has concluded that the Consolidated Financial Statements included in the Form 10-K present fairly, in all material respects, the financial position of the Company at November 28, 2015 and November 29, 2014 and the consolidated results of operations and cash flows for each of the three fiscal years in the period ended November 28, 2015 in conformity with U.S. generally accepted accounting principles.
Management's Report on Internal Control over Financial Reporting
Our management is responsible for establishing and maintaining adequate internal control over financial reporting. Our internal control over financial reporting is a process designed to provide reasonable assurance regarding the reliability of financial reporting and the preparation of financial statements for external purposes in accordance with accounting principles generally accepted in the United States. Because of its inherent limitations, internal control over financial reporting may not prevent or detect misstatements. Therefore, even those systems determined to be effective can provide only reasonable assurance of achieving their control objectives.
Our management assessed the effectiveness of our internal control over financial reporting as of November 28, 2015. In making this assessment, we used the criteria set forth by the Committee of Sponsoring Organizations of the Treadway Commission (COSO) in Internal Control – Integrated Framework (2013 Framework). As discussed in Note 2, Acquisitions and Divestitures, of the Notes to the Consolidated Financial Statements in Item 8 of the Form 10-K, we acquired Tonsan Adhesive, Inc. and Continental Products Limited in February 2015. We have excluded from our assessment of the effectiveness of our internal control over financial reporting as of November 28, 2015, Tonsan Adhesive, Inc. and Continental Products Limited’s internal control over financial reporting associated with 16% of the total assets and 5% of total revenue included in our consolidated financial statements as of and for the fiscal year ended November 28, 2015.
Based on its assessment, management concluded that, as of November 28, 2015, the Company’s internal control over financial reporting was not effective because of the existence of the material weakness described below.
A material weakness is a deficiency, or combination of deficiencies, in internal control over financial reporting such that there is a reasonable possibility that a material misstatement of our annual or interim consolidated financial statements will not be prevented or detected on a timely basis.
The material weakness in internal control over financial reporting resulted from the inadequate design and operation of internal controls related to the accounting for the acquisition of Tonsan Adhesive, Inc., specifically the review of the completeness and accuracy of key assumptions and financial data used to measure the fair value of the acquired assets and liabilities, the review of the measurement of contingent consideration, the involvement of specialists and the documentation of internal control procedures.
As a result, an immaterial misstatement in goodwill and the contingent consideration liability was identified during the fourth quarter of 2015 related to earlier interim financial information. The misstatement in the preliminary consolidated financial statements was corrected prior to the issuance of the Company’s consolidated financial statements as of and for the fiscal year ended November 28, 2015. The control deficiency creates a reasonable possibility that a material misstatement to the consolidated financial statements will not be prevented or detected on a timely basis, and therefore we concluded that the deficiencies represent material weaknesses in the Company’s internal control over financial reporting and our internal control over financial reporting was not effective as of November 28, 2015.
Our internal control over financial reporting as of November 28, 2015, has been audited by KPMG LLP, an independent registered public company accounting firm, as stated in its report which contains an adverse opinion on the effectiveness of our internal control over financial reporting. This report appears on page 36.
Remedial Measures
The Company is in the process of improving its policies and procedures relating to the recognition and measurement of business acquisitions and designing more effective controls to remediate the material weakness described above. Management plans to enhance its controls related to business combinations by a) supplementing its resources, b) enhancing the design and documentation of management review controls, and c) improving the documentation of internal control procedures.
The Company believes these measures will strengthen our internal controls over financial reporting and will prevent a reoccurrence of the material weakness described above.
Changes in Internal Control over Financial Reporting
There were no changes in our internal control over financial reporting (as defined in Rule 13a-15(f) under the Exchange Act) during our most recently completed fiscal quarter that have materially affected or are reasonably likely to materially affect our internal control over financial reporting, other than the identification of the material weakness discussed above.
Item 9B. Other Information
None.
PART III
Item 10. Directors, Executive Officers and Corporate Governance
The information under the headings Proposal 1 - Election of Directors, Section 16(a) Beneficial Ownership Reporting Compliance, and Corporate Governance - Audit Committee contained in the company's Proxy Statement for the Annual Meeting of Shareholders to be held on April 7, 2016 (the 2016 Proxy Statement) is incorporated herein by reference.
The information contained at the end of Item 1. hereof under the heading Executive Officers of the Registrant is incorporated herein by reference.
Since the date of our 2015 Proxy Statement, there have been no material changes to the procedures by which shareholders may recommend nominees to our Board of Directors.
The company has a code of business conduct applicable to all of its directors and employees, including its principal executive officer, principal financial officer, principal accounting officer, controller and other employees performing similar functions. A copy of the code of business conduct is available under the Investor Relations section of the company’s website at www.hbfuller.com. The company intends to disclose on its website information with respect to any amendment to or waiver from a provision of its code of business conduct that applies to its principal executive officer, principal financial officer, principal accounting officer, controller and other employees performing similar functions within four business days following the date of such amendment or waiver.
Item 11. Executive Compensation
The information under the headings Executive Compensation, and Director Compensation contained in the 2016 Proxy Statement is incorporated herein by reference.
Item 12. Security Ownership of Certain Beneficial Owners and Management and Related Stockholder Matters
The information under the headings Security Ownership of Certain Beneficial Owners and Management and Equity Compensation Plan Information contained in the 2016 Proxy Statement is incorporated herein by reference.
Item 13. Certain Relationships and Related Transactions and Director Independence
The information under the headings Certain Relationships and Related Transactions and Corporate Governance - Director Independence contained in the 2016 Proxy Statement is incorporated herein by reference.
Item 14. Principal Accountant Fees and Services
The information under the heading Fees Paid to Independent Registered Public Accounting Firm contained in the 2016 Proxy Statement is incorporated herein by reference.
PART IV
Item 15. Exhibits and Financial Statement Schedules
(a) Documents filed as part of this report:
1. Consolidated Financial Statements
Consolidated Statements of Income for the fiscal years ended November 28, 2015, November 29, 2014 and November 30, 2013.
Consolidated Statements of Comprehensive Income (Loss) for the fiscal years ended November 28, 2015, November 29, 2014 and November 30, 2013.
Consolidated Balance Sheets as of November 28, 2015 and November 29, 2014.
Consolidated Statements of Total Equity for the fiscal years ended November 28, 2015, November 29, 2014 and November 30, 2013.
Consolidated Statements of Cash Flows for the fiscal years ended November 28, 2015, November 29, 2014 and November 30, 2013.
Notes to Consolidated Financial Statements
Report of Independent Registered Public Accounting Firm
2. Financial Statement Schedules
All financial statement schedules are omitted as the required information is inapplicable or the information is presented in the consolidated financial statements or related notes.
3. Exhibits
|
Item |
Incorporation by Reference | ||
|
2.1 |
Equity Purchase Agreement, dated as of June 24, 2014, by and among H.B. Fuller Singapore, Pte, Ltd., ZHAI Haichao, individually and as Sellers’ Representative, WANG Bing, LIN Xinsong, LI Yimbai and Beijing Gongchuang Mingtian Investment Advisory Co. |
Exhibit 2.1 to the Current Report on Form 8-K dated June 24, 2014. | |
|
3.1 |
Restated Articles of Incorporation of H.B. Fuller Company, as amended |
Exhibit 3.1 to the Quarterly Report on Form 10-Q for the quarter ended September 2, 2006. | |
|
3.2 |
By-Laws of H.B. Fuller Company |
Exhibit 3.1 to the Current Report on Form 8-K dated December 2, 2015. | |
|
4.1 |
Form of Certificate for common stock, par value $1.00 per share |
Exhibit 4.1 to the Annual Report on Form 10-K, as amended, for the year ended November 28, 2009. | |
|
4.2 |
Rights Agreement, dated as of July 13, 2006, between H.B. Fuller Company and Wells Fargo Bank Minnesota, National Association, as Rights Agent |
Exhibit 4.1 to the Current Report on Form 8-K dated July 13, 2006. | |
|
4.3 |
Note Purchase Agreement, dated December 16, 2009, among H.B. Fuller Company, as borrower, and various financial institutions, as amended. |
Exhibit 4.1 to the Current Report on Form 8-K dated December 16, 2009, and Exhibit 1.2 to the Current Report on Form 8-K dated March 5, 2012 and Exhibit 1.3 to the Current Report on Form 8-K dated October 31, 2014. | |
|
4.4 |
Note Purchase Agreement, dated March 5, 2012, by and among H.B. Fuller Company and the purchasers party thereto, as amended. |
Exhibit 1.1 to the Current Report on Form 8-K dated March 5, 2012 and Exhibit 1.2 to the Current Report on Form 8-K dated October 31, 2014 |
|
10.1 |
Credit Agreement, dated October 31, 2014, by and among JP Morgan Chase Bank, N.A., as administrative agent, U.S. Bank National Association, Citibank, N.A. and Morgan Stanley MUFG Loan Partners, LLC, as co-syndication agents, and various financial institutions |
Exhibit 1.1 to the Current Report on Form 8-K dated October 31, 2014. | |
|
*10.2 |
Amended and Restated H.B. Fuller Company Year 2000 Stock Incentive Plan |
Exhibit 10.1 to the Current Report on Form 8-K dated April 5, 2006. |
|
*10.3 |
H.B. Fuller Company Supplemental Executive Retirement Plan II – 2008, as amended |
Exhibit 10.2 to the Current Report on Form 8-K dated December 19, 2007 Exhibit 10.5 to the Annual Report on Form 10-K for the year ended November 29, 2008 and Exhibit 10.1 to the Quarterly Report on Form 10-Q for the quarter ended May 28, 2011. | |
|
*10.4 |
H.B. Fuller Company Executive Benefit Trust dated October 25, 1993 between H.B. Fuller Company and U.S. Bank, National Association, as Trustee, as amended, relating to the H.B. Fuller Company Supplemental Executive Retirement Plan |
Exhibit 10(k) to the Annual Report on Form 10-K for the year ended November 29, 1997, Exhibit 10(k) to the Annual Report on Form 10-K405 for the year ended November 28, 1998, Exhibit 10.3 to the Current Report on Form 8-K dated December 19, 2007 and Exhibit 10.1 to the Quarterly Report on Form 10-Q for the quarter ended May 30, 2009. | |
|
*10.5 |
H.B. Fuller Company Key Employee Deferred Compensation Plan (2005 Amendment and Restatement), as amended |
Exhibit 10.1 to the Current Report on Form 8-K dated October 23, 2006, Exhibit 10.11 to the Annual Report on Form 10-K for the year ended December 1, 2007 and Exhibit 10.8 to the Annual Report on Form 10-K for the year ended November 29, 2008. | |
|
*10.6 |
Amended and Restated H.B. Fuller Company Annual and Long-Term Incentive Plan |
Exhibit 10.1 to the Current Report on Form 8-K dated April 3, 2008. | |
|
*10.7 |
Form of Change in Control Agreement between H.B. Fuller Company and each of its executive officers |
Exhibit 10.11 to the Annual Report on Form 10-K for the year ended November 29, 2008. | |
|
*10.8 |
Form of Severance Agreement between H.B. Fuller Company and each of its executive officers |
Exhibit 10.2 to the Quarterly Report on Form 10-Q for the quarter ended May 31, 2008. | |
|
*10.9 |
Form of Non-Qualified Stock Option Agreement under the Amended and Restated H.B. Fuller Company Year 2000 Stock Incentive Plan for awards made between December 4, 2008 and December 2, 2009 |
Exhibit 10.4 to the Current Report on Form 8-K dated December 4, 2008. | |
|
*10.10 |
Form of Non-Qualified Stock Option Agreement under the Amended and Restated H.B. Fuller Company Year 2000 Stock Incentive Plan for awards made on or after December 3, 2009 |
Exhibit 10.1 to the Current Report on Form 8-K dated December 3, 2009. | |
|
*10.11 |
Form of Non-Qualified Stock Option Agreement under the Amended and Restated H.B. Fuller Company Year 2000 Stock Incentive Plan for awards made on or after January 20, 2011 |
Exhibit 10.1 to the Current Report on Form 8-K dated January 20, 2011. | |
|
*10.12 |
Form of Non-Qualified Stock Option Agreement under the Amended and Restated H.B. Fuller Company Year 2000 Stock Incentive Plan for awards made on or after January 26, 2012 |
Exhibit 10.1 to the Current Report on Form 8-K dated January 26, 2012 | |
|
*10.13 |
Form of Restricted Stock Award Agreement under the H.B. Fuller Company 2009 Director Stock Incentive Plan for awards made to our non-employee directors on or after September 25, 2012 |
Exhibit 10.1 to the Current Report on Form 8-K dated September 24, 2012 | |
|
*10.14 |
Form of Non-Qualified Stock Option Agreement under the Amended and Restated H.B. Fuller Company Year 2000 Stock Incentive Plan for awards made on or after January 24, 2013 |
Exhibit 10.1 to the Current Report on Form 8-K dated January 24, 2013. | |
|
*10.15 |
Form of Restricted Stock Award Agreement under the Amended and Restated H.B. Fuller Company Year 2000 Stock Incentive Plan for awards made on or after January 24, 2013. |
Exhibit 10.2 to the Current Report on Form 8-K dated January 24, 2013. | |
|
*10.16 |
Form of Restricted Stock Unit Award Agreement under the Amended and Restated H.B. Fuller Company Year 2000 Stock Incentive Plan for awards made on or after January 24, 2013 |
Exhibit 10.3 to the Current Report on Form 8-K dated January 24, 2013. | |
|
*10.17 |
Form of Restricted Stock Unit Award Agreement for Retirement Eligible Participants under the Amended and Restated H.B. Fuller Company Year 2000 Stock Incentive Plan for awards made on or after January 24, 2013 |
Exhibit 10.4 to the Current Report on Form 8-K dated January 24, 2013. | |
|
*10.18 |
Form of Restricted Stock Award Agreement for the Chief Executive Officer under the Amended and Restated H.B. Fuller Company Year 2000 Stock Incentive Plan for awards made on or after January 24, 2013 |
Exhibit 10.5 to the Current Report on Form 8-K dated January 24, 2013. | |
|
*10.19 |
Form of Restricted Stock Award Agreement for the Chief Executive Officer under the Amended and Restated H.B. Fuller Company Year 2000 Stock Incentive Plan (or any successor plan) for awards made on or after January 24, 2013 |
Exhibit 10.1 to the Quarterly Report on Form 10-Q for the quarter ended March 2, 2013. |
|
*10.20 |
Form of Non-Qualified Stock Option Agreement under the H.B. Fuller Company 2013 Master Incentive Plan for awards made on or after January 23, 2014 |
Exhibit 10.2 to the Current Report on Form 8-K dated January 23, 2014. | |
|
*10.21 |
Form of Restricted Stock Unit Award Agreement under the H.B. Fuller Company 2013 Master Incentive Plan for awards made on or after January 23, 2014 |
Exhibit 10.3 to the Current Report on Form 8-K dated January 23, 2014. | |
|
*10.22 |
Form of Restricted Stock Unit Award Agreement for Retirement Eligible Participants under the H.B. Fuller Company 2013 Master Incentive Plan for awards made on or after January 23, 2014 |
Exhibit 10.4 to the Current Report on Form 8-K dated January 23, 2014. | |
|
*10.23 |
Form of Restricted Stock Unit Award Agreement for the Chief Executive Officer under the H.B. Fuller Company 2013 Master Incentive Plan for awards made on or after January 23, 2014 |
Exhibit 10.5 to the Current Report on Form 8-K dated January 23, 2014.
| |
|
*10.24 |
H.B. Fuller Company Defined Contribution Restoration Plan (As Amended and Restated Effective January 1, 2008), as amended |
Exhibit 10.4 to the Current Report on Form 8-K dated December 19, 2007 and Exhibit 10.1 to the Quarterly Report on Form 10-Q for the quarter ended May 31, 2008. | |
|
*10.25 |
H.B. Fuller Company Directors’ Deferred Compensation Plan (2008 Amendment and Restatement), as amended |
Exhibit 10.22 to the Annual Report on Form 10-K for the year ended November 29, 2008 and Exhibit 10.23 to the Annual Report on Form 10-K for the year ended November 29, 2008. | |
|
*10.26 |
H.B. Fuller Company 2009 Director Stock Incentive Plan |
Exhibit 10.2 to the Quarterly Report on Form 10-Q for the quarter ended May 30, 2009. | |
|
*10.27 |
H.B. Fuller Company Management Short-Term Incentive Plan for fiscal year 2012 and thereafter |
Exhibit 10.5 to the Current Report on Form 8-K dated September 29, 2011. | |
|
*10.28 |
H.B. Fuller Company Management Short-Term Incentive Plan for fiscal year 2014 and thereafter |
Exhibit 10.1 to the Current Report on Form 8-K dated January 23, 2014. | |
|
*10.29 |
H.B. Fuller Company Bonus Multiplier Program |
Exhibit 10.1 to the Current Report on Form 8-K dated January 22, 2015. |
|
*10.30 |
H.B. Fuller Company Special 2015 Performance Acceleration Bonus for fiscal year 2015 only |
Exhibit 10.2 to the Current Report on Form 8-K dated January 22, 2015 | |
|
*10.31 |
H.B. Fuller Management Short-Term Incentive – Executive Officers for fiscal year 2015 only |
Exhibit 10.1 to the Current Report on Form 8-K dated July 9, 2015 | |
|
*10.32 |
H.B. Fuller Company 2013 Master Incentive Plan |
Annex B to the H.B. Fuller Company Proxy Statement on Schedule 14A filed with the Securities and Exchange Commission on February 27, 2013 | |
|
21 |
List of Subsidiaries |
||
|
23 |
Consent of KPMG LLP |
||
|
24 |
Power of Attorney |
||
|
31.1 |
302 Certification – James J. Owens |
||
|
31.2 |
302 Certification – James R. Giertz |
|
32.1 |
906 Certification – James J. Owens |
|||
|
32.2 |
906 Certification - James R. Giertz |
|||
|
101 |
The following materials from the H.B. Fuller Company Annual Report on Form 10-K for the fiscal year ended November 29, 2014 formatted in Extensible Business Reporting Language (XBRL): (i) the Consolidated Statements of Income, (ii) the Consolidated Statements of Comprehensive Income, (iii) the Consolidated Balance Sheets, (iv) the Consolidated Statements of Total Equity, (v) the Consolidated Statements of Cash Flows and (vi) the Notes to Consolidated Financial Statements. |
|||
|
*Asterisked items are management contracts or compensatory plans or arrangements required to be filed. | ||||
|
(b) |
See Exhibit Index and Exhibits attached to this Form 10-K. |
SIGNATURES
Pursuant to the requirements of Section 13 or 15(d) of the Securities Exchange Act of 1934, the registrant has duly caused this report to be signed on its behalf by the undersigned, thereunto duly authorized.
H.B. FULLER COMPANY
|
By /s/ James J. Owens | |
|
JAMES J. OWENS |
Dated: January 27, 2016 President and Chief Executive Officer
Pursuant to the requirements of the Securities Exchange Act of 1934, this report has been signed below by the following persons on behalf of the registrant and in the capacities and on the dates indicated:
|
Signature |
Title | |
|
/s/ James J. Owens |
President and Chief Executive Officer and Director | |
|
JAMES J. OWENS |
(Principal Executive Officer) | |
|
/s/ James R. Giertz |
Executive Vice President, Chief Financial Officer | |
|
JAMES R. GIERTZ |
(Principal Financial Officer) | |
|
/s/ Robert J. Martsching |
Vice President, Controller | |
|
ROBERT J. MARTSCHING |
(Principal Accounting Officer) |
|
* |
Director | |||
|
LEE R. MITAU |
||||
|
* |
Director | |||
|
THOMAS W. HANDLEY |
| |||
|
* |
Director | |||
|
MARIA TERESA HILADO |
| |||
|
* |
Director | |||
|
J. MICHAEL LOSH |
| |||
|
* |
Director | |||
|
DANTE C. PARRINI |
||||
|
* |
Director | |||
|
ANN W.H. SIMONDS |
||||
|
* |
Director | |||
|
JOHN C. VAN RODEN, JR. |
| |||
|
* |
Director | |||
| R. WILLIAM VAN SANT. | ||||
| * by /s/ Timothy J. Keenan | ||||
| TIMOTHY J. KEENAN, Attorney in Fact | ||||
Dated: January 27, 2016
Exhibit Index
|
Item |
Incorporation by Reference | |||
|
2.1 |
Equity Purchase Agreement, dated as of June 24, 2014, by and among H.B. Fuller Singapore, Pte, Ltd., ZHAI Haichao, individually and as Sellers’ Representative, WANG Bing, LIN Xinsong, LI Yimbai and Beijing Gongchuang Mingtian Investment Advisory Co. |
Exhibit 2.1 to the Current Report on Form 8-K dated June 24, 2014. | ||
|
3.1 |
Restated Articles of Incorporation of H.B. Fuller Company, as amended |
Exhibit 3.1 to the Quarterly Report on Form 10-Q for the quarter ended September 2, 2006. | ||
|
3.2 |
By-Laws of H.B. Fuller Company |
Exhibit 3.1 to the Current Report on Form 8-K dated December 2, 2015. | ||
|
4.1 |
Form of Certificate for common stock, par value $1.00 per share |
Exhibit 4.1 to the Annual Report on Form 10-K, as amended, for the year ended November 28, 2009. | ||
|
4.2 |
Rights Agreement, dated as of July 13, 2006, between H.B. Fuller Company and Wells Fargo Bank Minnesota, National Association, as Rights Agent |
Exhibit 4.1 to the Current Report on Form 8-K dated July 13, 2006. | ||
|
4.3 |
Note Purchase Agreement, dated December 16, 2009, among H.B. Fuller Company, as borrower, and various financial institutions, as amended. |
Exhibit 4.1 to the Current Report on Form 8-K dated December 16, 2009, and Exhibit 1.2 to the Current Report on Form 8-K dated March 5, 2012 and Exhibit 1.3 to the Current Report on Form 8-K dated October 31, 2014. | ||
|
4.4 |
Note Purchase Agreement, dated March 5, 2012, by and among H.B. Fuller Company and the purchasers party thereto, as amended. |
Exhibit 1.1 to the Current Report on Form 8-K dated March 5, 2012 and Exhibit 1.2 to the Current Report on Form 8-K dated October 31, 2014 | ||
|
10.1 |
Credit Agreement, dated October 31, 2014, by and among JP Morgan Chase Bank, N.A., as administrative agent, U.S. Bank National Association, Citibank, N.A. and Morgan Stanley MUFG Loan Partners, LLC, as co-syndication agents, and various financial institutions |
Exhibit 1.1 to the Current Report on Form 8-K dated October 31, 2014. | ||
|
*10.2 |
Amended and Restated H.B. Fuller Company Year 2000 Stock Incentive Plan |
Exhibit 10.1 to the Current Report on Form 8-K dated April 5, 2006. | ||
|
*10.3 |
H.B. Fuller Company Supplemental Executive Retirement Plan II – 2008, as amended |
Exhibit 10.2 to the Current Report on Form 8-K dated December 19, 2007 Exhibit 10.5 to the Annual Report on Form 10-K for the year ended November 29, 2008 and Exhibit 10.1 to the Quarterly Report on Form 10-Q for the quarter ended May 28, 2011. | ||
|
*10.4 |
H.B. Fuller Company Executive Benefit Trust dated October 25, 1993 between H.B. Fuller Company and U.S. Bank, National Association, as Trustee, as amended, relating to the H.B. Fuller Company Supplemental Executive Retirement Plan |
Exhibit 10(k) to the Annual Report on Form 10-K for the year ended November 29, 1997, Exhibit 10(k) to the Annual Report on Form 10-K405 for the year ended November 28, 1998, Exhibit 10.3 to the Current Report on Form 8-K dated December 19, 2007 and Exhibit 10.1 to the Quarterly Report on Form 10-Q for the quarter ended May 30, 2009. | ||
|
*10.5 |
H.B. Fuller Company Key Employee Deferred Compensation Plan (2005 Amendment and Restatement), as amended |
Exhibit 10.1 to the Current Report on Form 8-K dated October 23, 2006, Exhibit 10.11 to the Annual Report on Form 10-K for the year ended December 1, 2007 and Exhibit 10.8 to the Annual Report on Form 10-K for the year ended November 29, 2008. | ||
|
*10.6 |
Amended and Restated H.B. Fuller Company Annual and Long-Term Incentive Plan |
Exhibit 10.1 to the Current Report on Form 8-K dated April 3, 2008. | ||
|
*10.7 |
Form of Change in Control Agreement between H.B. Fuller Company and each of its executive officers |
Exhibit 10.11 to the Annual Report on Form 10-K for the year ended November 29, 2008. | ||
|
*10.8 |
Form of Severance Agreement between H.B. Fuller Company and each of its executive officers |
Exhibit 10.2 to the Quarterly Report on Form 10-Q for the quarter ended May 31, 2008. | ||
|
*10.9 |
Form of Non-Qualified Stock Option Agreement under the Amended and Restated H.B. Fuller Company Year 2000 Stock Incentive Plan for awards made between December 4, 2008 and December 2, 2009 |
Exhibit 10.4 to the Current Report on Form 8-K dated December 4, 2008. |
|
*10.10 |
Form of Non-Qualified Stock Option Agreement under the Amended and Restated H.B. Fuller Company Year 2000 Stock Incentive Plan for awards made on or after December 3, 2009 |
Exhibit 10.1 to the Current Report on Form 8-K dated December 3, 2009. |
|
*10.11 |
Form of Non-Qualified Stock Option Agreement under the Amended and Restated H.B. Fuller Company Year 2000 Stock Incentive Plan for awards made on or after January 20, 2011 |
Exhibit 10.1 to the Current Report on Form 8-K dated January 20, 2011. | ||
|
*10.12 |
Form of Non-Qualified Stock Option Agreement under the Amended and Restated H.B. Fuller Company Year 2000 Stock Incentive Plan for awards made on or after January 26, 2012 |
Exhibit 10.1 to the Current Report on Form 8-K dated January 26, 2012 | ||
|
*10.13 |
Form of Restricted Stock Award Agreement under the H.B. Fuller Company 2009 Director Stock Incentive Plan for awards made to our non-employee directors on or after September 25, 2012 |
Exhibit 10.1 to the Current Report on Form 8-K dated September 24, 2012 | ||
|
*10.14 |
Form of Non-Qualified Stock Option Agreement under the Amended and Restated H.B. Fuller Company Year 2000 Stock Incentive Plan for awards made on or after January 24, 2013 |
Exhibit 10.1 to the Current Report on Form 8-K dated January 24, 2013. | ||
|
*10.15 |
Form of Restricted Stock Award Agreement under the Amended and Restated H.B. Fuller Company Year 2000 Stock Incentive Plan for awards made on or after January 24, 2013. |
Exhibit 10.2 to the Current Report on Form 8-K dated January 24, 2013. | ||
|
*10.16 |
Form of Restricted Stock Unit Award Agreement under the Amended and Restated H.B. Fuller Company Year 2000 Stock Incentive Plan for awards made on or after January 24, 2013 |
Exhibit 10.3 to the Current Report on Form 8-K dated January 24, 2013. | ||
|
*10.17 |
Form of Restricted Stock Unit Award Agreement for Retirement Eligible Participants under the Amended and Restated H.B. Fuller Company Year 2000 Stock Incentive Plan for awards made on or after January 24, 2013 |
Exhibit 10.4 to the Current Report on Form 8-K dated January 24, 2013. | ||
|
*10.18 |
Form of Restricted Stock Award Agreement for the Chief Executive Officer under the Amended and Restated H.B. Fuller Company Year 2000 Stock Incentive Plan for awards made on or after January 24, 2013 |
Exhibit 10.5 to the Current Report on Form 8-K dated January 24, 2013. | ||
|
*10.19 |
Form of Restricted Stock Award Agreement for the Chief Executive Officer under the Amended and Restated H.B. Fuller Company Year 2000 Stock Incentive Plan (or any successor plan) for awards made on or after January 24, 2013 |
Exhibit 10.1 to the Quarterly Report on Form 10-Q for the quarter ended March 2, 2013. | ||
|
*10.20 |
Form of Non-Qualified Stock Option Agreement under the H.B. Fuller Company 2013 Master Incentive Plan for awards made on or after January 23, 2014 |
Exhibit 10.2 to the Current Report on Form 8-K dated January 23, 2014. | ||
|
*10.21 |
Form of Restricted Stock Unit Award Agreement under the H.B. Fuller Company 2013 Master Incentive Plan for awards made on or after January 23, 2014 |
Exhibit 10.3 to the Current Report on Form 8-K dated January 23, 2014. | ||
|
*10.22 |
Form of Restricted Stock Unit Award Agreement for Retirement Eligible Participants under the H.B. Fuller Company 2013 Master Incentive Plan for awards made on or after January 23, 2014 |
Exhibit 10.4 to the Current Report on Form 8-K dated January 23, 2014. | ||
|
*10.23 |
Form of Restricted Stock Unit Award Agreement for the Chief Executive Officer under the H.B. Fuller Company 2013 Master Incentive Plan for awards made on or after January 23, 2014 |
Exhibit 10.5 to the Current Report on Form 8-K dated January 23, 2014.
| ||
|
*10.24 |
H.B. Fuller Company Defined Contribution Restoration Plan (As Amended and Restated Effective January 1, 2008), as amended |
Exhibit 10.4 to the Current Report on Form 8-K dated December 19, 2007 and Exhibit 10.1 to the Quarterly Report on Form 10-Q for the quarter ended May 31, 2008. | ||
|
*10.25 |
H.B. Fuller Company Directors’ Deferred Compensation Plan (2008 Amendment and Restatement), as amended |
Exhibit 10.22 to the Annual Report on Form 10-K for the year ended November 29, 2008 and Exhibit 10.23 to the Annual Report on Form 10-K for the year ended November 29, 2008. |
|
*10.26 |
H.B. Fuller Company 2009 Director Stock Incentive Plan |
Exhibit 10.2 to the Quarterly Report on Form 10-Q for the quarter ended May 30, 2009. | ||
|
*10.27 |
H.B. Fuller Company Management Short-Term Incentive Plan for fiscal year 2012 and thereafter |
Exhibit 10.5 to the Current Report on Form 8-K dated September 29, 2011. | ||
|
*10.28 |
H.B. Fuller Company Management Short-Term Incentive Plan for fiscal year 2014 and thereafter |
Exhibit 10.1 to the Current Report on Form 8-K dated January 23, 2014. | ||
|
*10.29 |
H.B. Fuller Company Bonus Multiplier Program |
Exhibit 10.1 to the Current Report on Form 8-K dated January 22, 2015. |
|
*10.30 |
H.B. Fuller Company Special 2015 Performance Acceleration Bonus for fiscal year 2015 only |
Exhibit 10.2 to the Current Report on Form 8-K dated January 22, 2015 | ||
|
*10.31 |
H.B. Fuller Management Short-Term Incentive – Executive Officers for fiscal year 2015 only |
Exhibit 10.1 to the Current Report on Form 8-K dated July 9, 2015 | ||
|
*10.32 |
H.B. Fuller Company 2013 Master Incentive Plan |
Annex B to the H.B. Fuller Company Proxy Statement on Schedule 14A filed with the Securities and Exchange Commission on February 27, 2013 |
|
21 |
List of Subsidiaries |
|||
|
23 |
Consent of KPMG LLP |
|||
|
24 |
Power of Attorney |
|||
|
31.1 |
302 Certification – James J. Owens |
|||
|
31.2 |
302 Certification – James R. Giertz |
|
32.1 |
906 Certification – James J. Owens |
|||
|
32.2 |
906 Certification - James R. Giertz |
|||
|
101 |
The following materials from the H.B. Fuller Company Annual Report on Form 10-K for the fiscal year ended November 29, 2014 formatted in Extensible Business Reporting Language (XBRL): (i) the Consolidated Statements of Income, (ii) the Consolidated Statements of Comprehensive Income, (iii) the Consolidated Balance Sheets, (iv) the Consolidated Statements of Total Equity, (v) the Consolidated Statements of Cash Flows and (vi) the Notes to Consolidated Financial Statements. |
|||
|
*Asterisked items are management contracts or compensatory plans or arrangements required to be filed. | ||||
See Exhibit Index and Exhibits attached to this Form 10-K.
85