Attached files
| file | filename |
|---|---|
| 8-K - 8-K - Engility Holdings, Inc. | egl8-k2016guidance.htm |
| EX-99.1 - EXHIBIT 99.1 - Engility Holdings, Inc. | ex9912016guidance.htm |

Fiscal Year 2016 Guidance Conference Call January 21, 2016

Forward Looking Statements 2 This presentation contains forward-looking statements within the meaning of the Private Securities Litigation Reform Act of 1995, including statements regarding Engility’s future prospects, projected financial results, estimated integration costs and acquisition related amortization expenses, business plans, as well as the TASC transaction and its expected benefits. Words such as “may,” “will,” “should,” “likely,” “anticipates,” “expects,” “intends,” “plans,” “projects,” “believes,” “estimates” and similar expressions are also used to identify these forward-looking statements. These statements are based on the current beliefs and expectations of Engility’s management and are subject to significant risks and uncertainties. Actual results may differ from those set forth in the forward-looking statements. Factors that could cause Engility’s actual results to differ materially from those described in the forward-looking statements can be found under the heading “Risk Factors” included in our Annual Report on Form 10-K for the year ended December 31, 2014, and more recent documents that have been filed with the Securities and Exchange Commission (SEC) and are available on the investor relations section of Engility’s website (http://www.engilitycorp.com) and on the SEC’s website (www.sec.gov). Forward-looking statements are made only as of the date hereof, and we undertake no obligation to update or revise the forward-looking statements, whether as a result of new information, future events or otherwise, except as required by law. In addition, historical information should not be considered as an indicator of future performance.
Overview • 2015 was a successful year on many fronts – Successfully acquired and integrated TASC, transforming the Company by adding high-end capabilities in non-DoD markets – Significantly lowered DSOs while completing major integration – Delivered revenue, adjusted EPS and adjusted EBITDA results within guidance ranges • Taking a measured approach to 2016 guidance – Confident in our ability to achieve guidance ranges • The market and our business are stabilizing • Reaffirming our focus on organic growth and debt repayment 3

Operating Environment 4 • Stabilizing market coupled with the completion of the TASC integration, positions us favorably to make incremental investments to drive long- term growth • Expect to leverage the addition of Intelligence and other non-DoD capabilities to our portfolio, enhance our internal business development processes and to continue to pursue larger contract opportunities • Revenue headwinds from in-theater activities and run-off from legacy contracts diminishing • No better time than now to invest in our business
Investing in our Business 5 • Increasing the portion of our indirect spend that relates to growth by 20 percent (derived from synergy savings) • Hiring additional capture and strategic pricing resources • Pursuing larger bids that are aligned with our competitive advantages • Investing in employee development and retention • Deploying human capital to growth areas
Positioning for Growth • Significant internal investments, more competitive bid rates, newly diversified portfolio, and improving industry conditions will fuel our organic growth in 2017 and beyond • We have transformed our Company and now have an even more attractive business mix in a larger addressable market • Ended the year with $3.3 billion worth of submitted proposals awaiting adjudication • We will primarily utilize our substantial free cash flow to reduce outstanding debt 6
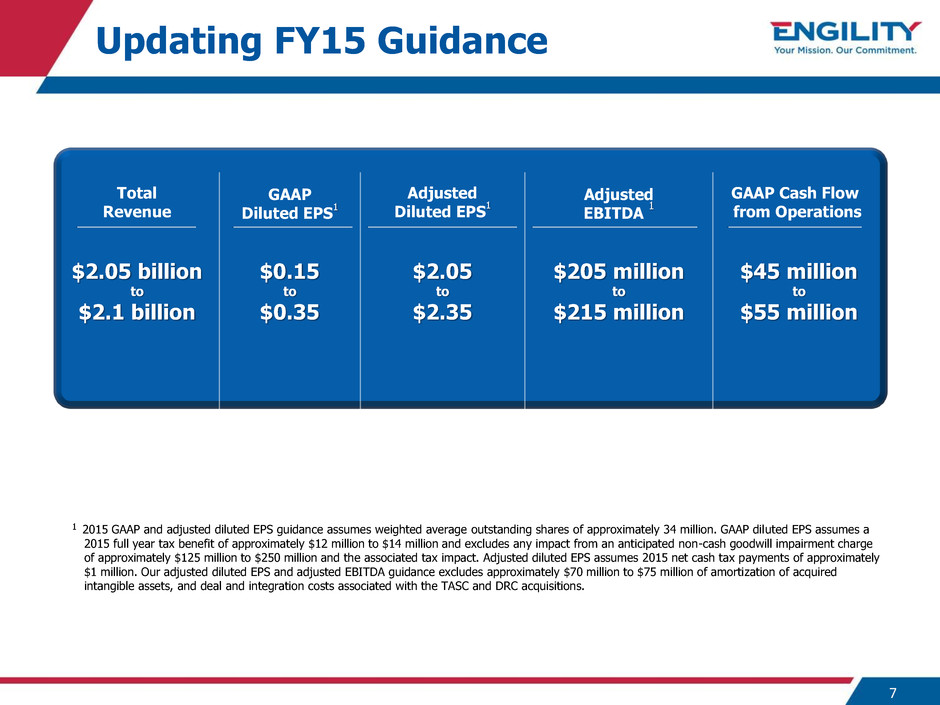
Updating FY15 Guidance 7 1 2015 GAAP and adjusted diluted EPS guidance assumes weighted average outstanding shares of approximately 34 million. GAAP diluted EPS assumes a 2015 full year tax benefit of approximately $12 million to $14 million and excludes any impact from an anticipated non-cash goodwill impairment charge of approximately $125 million to $250 million and the associated tax impact. Adjusted diluted EPS assumes 2015 net cash tax payments of approximately $1 million. Our adjusted diluted EPS and adjusted EBITDA guidance excludes approximately $70 million to $75 million of amortization of acquired intangible assets, and deal and integration costs associated with the TASC and DRC acquisitions. Adjusted Diluted EPS 1 GAAP Cash Flow from Operations GAAP Diluted EPS 1 Total Revenue $2.05 billion to $2.1 billion $45 million to $55 million Adjusted EBITDA 1 $205 million to $215 million $2.05 to $2.35 $0.15 to $0.35
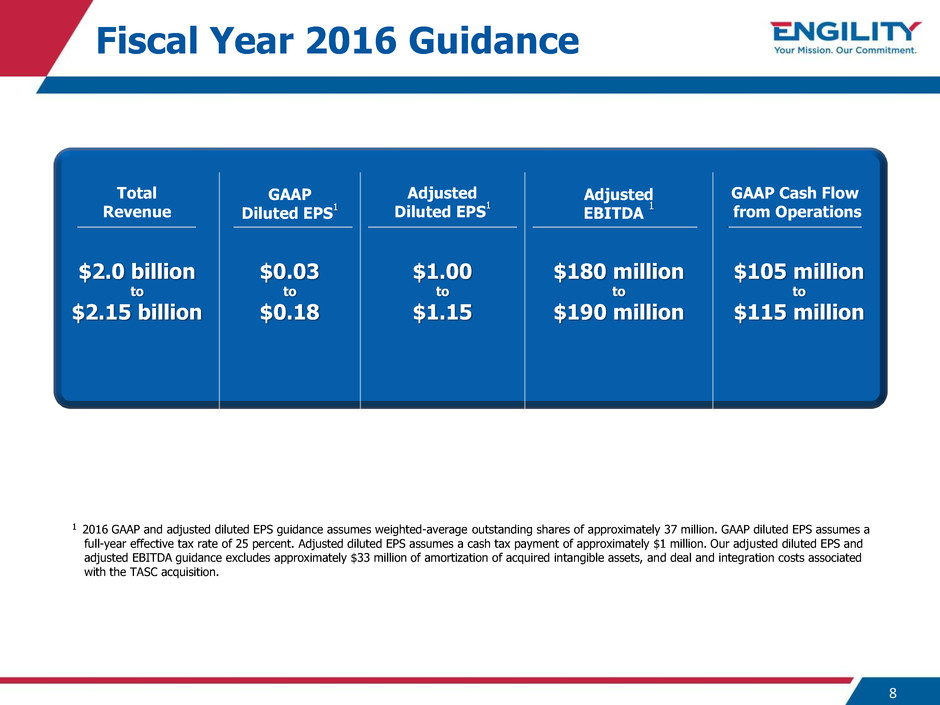
Adjusted Diluted EPS 1 GAAP Cash Flow from Operations GAAP Diluted EPS 1 Total Revenue $2.0 billion to $2.15 billion Fiscal Year 2016 Guidance 8 1 2016 GAAP and adjusted diluted EPS guidance assumes weighted-average outstanding shares of approximately 37 million. GAAP diluted EPS assumes a full-year effective tax rate of 25 percent. Adjusted diluted EPS assumes a cash tax payment of approximately $1 million. Our adjusted diluted EPS and adjusted EBITDA guidance excludes approximately $33 million of amortization of acquired intangible assets, and deal and integration costs associated with the TASC acquisition. $105 million to $115 million Adjusted EBITDA 1 $180 million to $190 million $1.00 to $1.15 $0.03 to $0.18

Fiscal Year 2016 Guidance Details 9 • Expect to generate approximately 6% of revenue from new business, 15% from recompete awards and 79% from existing business • Pro forma organic revenue expected to decrease 7% at the mid-point of our FY16 and FY15 guidance ranges – Decrease driven by continued impact from legacy contracts that are ending and reduced in-theater work, offset by growth in new and existing business – Compares favorably to pro forma organic revenue declines of 17% in 2014 and approximately 10% in 2015 at the mid-point of guidance ranges • 2016 quarterly trajectory: slight sequential increases in both revenue and profitability results throughout the year – Q1 2016 revenue similar to Q4 2015 at the mid-point of the 2015 guidance range – For 2016 profitability: Q1 expected to be a little less than 20% of annualized results Q2 and Q3 expected to be in the low-to-mid 20% range of annualized results Q4 expected to consist of the remaining portion of annualized results • Expect to make $70 to $80 million of voluntary debt prepayments

2015 to 2016 Revenue Bridge $2,075 $2,075 $163 $146 $123 $397 $35 $0 $250 $500 $750 $1,000 $1,250 $1,500 $1,750 $2,000 $2,250 2015 GAAP Revenue (Mid-Point) 2016 Programs Ending and Scope Reductions 2016 Impacts From In-theater and Rate Reductions TASC Stub Period Organic Growth Including Annualized Wins in 2015 2016 New Business 2016 GAAP Revenue (Mid-Point) ($ in m il li ons ) 10
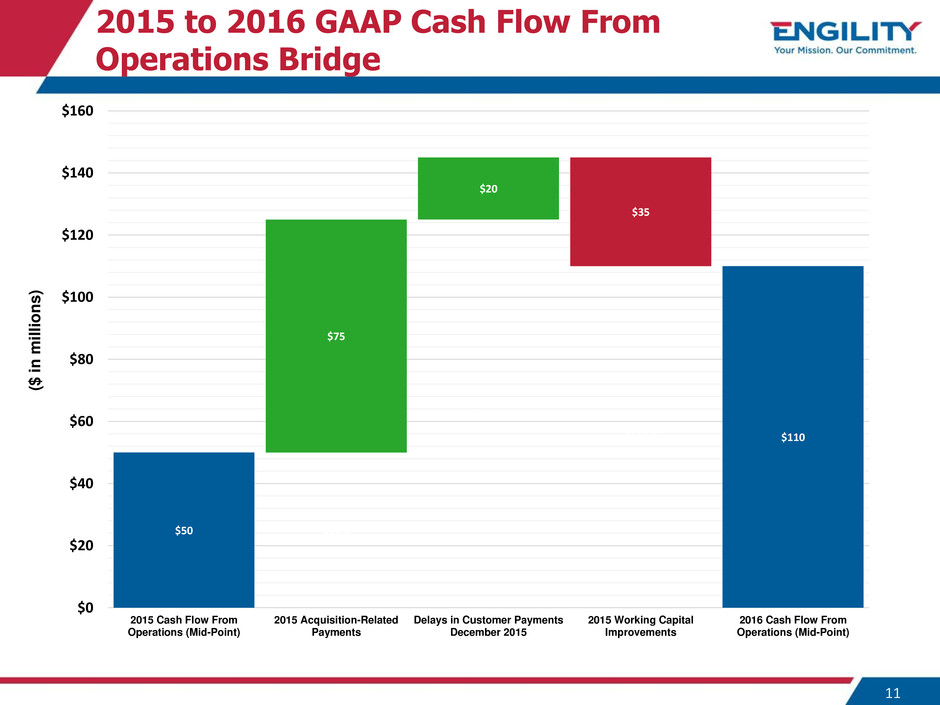
$50 $110 $50.0 $125.0 $110.0 $75 $20 $35 $0 $20 $40 $60 $80 $100 $120 $140 $160 2015 Cash Flow From Operations (Mid-Point) 2015 Acquisition-Related Payments Delays in Customer Payments December 2015 2015 Working Capital Improvements 2016 Cash Flow From Operations (Mid-Point) ($ in m il li ons ) 2015 to 2016 GAAP Cash Flow From Operations Bridge 11

2015 to 2016 Adjusted EBITDA Bridge $210 $185 $171.0 $161.0 $151.0 $151.0 $165.0 $39 $10 $10 $14 $20 $0 $50 $100 $150 $200 2015 Adjusted EBITDA (Mid-Point) 2016 Programs Ending and Scope Reductions 2016 Discretionary Investments for Growth 2015 One-Time Benefits TASC Stub Period 2016 Organic and New Business Growth 2016 Adjusted EBITDA (Mid-Point) ($ in m il li ons ) 12

$75 $40 $25 $4 $4 $2 $0 $10 $20 $30 $40 $50 $60 $70 $80 2015 Adjusted Net Income (Mid-Point) 2015/2016 Adjusted EBITDA Impacts 2016 Additional Interest Expense 2015 Refinancing Fees TASC Stub Period 2016 Adjusted Net Income (Mid-Point) ($ in m il li ons ) 2015 to 2016 Adjusted Net Income Bridge 13
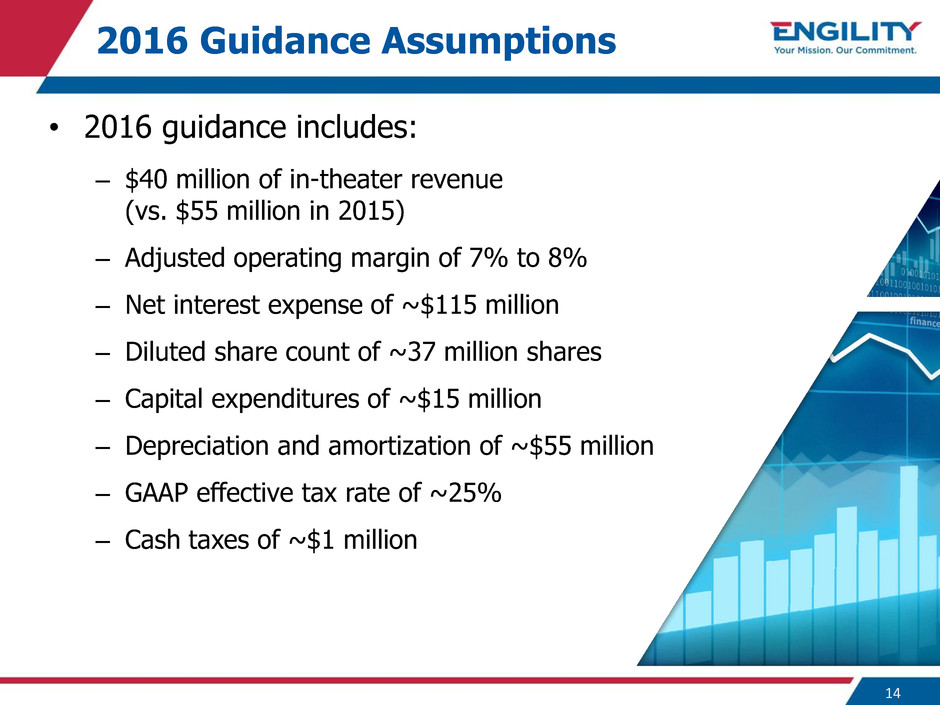
2016 Guidance Assumptions • 2016 guidance includes: – $40 million of in-theater revenue (vs. $55 million in 2015) – Adjusted operating margin of 7% to 8% – Net interest expense of ~$115 million – Diluted share count of ~37 million shares – Capital expenditures of ~$15 million – Depreciation and amortization of ~$55 million – GAAP effective tax rate of ~25% – Cash taxes of ~$1 million 14

Fiscal Year 2016 Guidance Conference Call 15
