Attached files
| file | filename |
|---|---|
| 8-K - FORM 8-K - Global Eagle Entertainment Inc. | v428909_8k.htm |
Exhibit 99.1

INVESTOR PRESENTATION 4 Q 2015
We make forward - looking statements in this presentation within the meaning of the Securities Litigation Reform Act of 1995 . These forward - looking statements relate to expectations or forecasts for future events, including without limitation our earnings, revenues, expenses or other future financial or business performance or strategies, or the impact of legal or regulatory matters on our business, results of operations or financial condition . These statements may be preceded by, followed by or include the words “may,” “might,” “will,” “will likely result,” “should,” “estimate,” “plan,” “project,” “forecast,” “intend,” “expect,” “anticipate,” “believe,” “seek,” “continue,” “target” or similar expressions . These forward - looking statements are based on information available to us as of the date they were made, and should not be relied upon as representing our views as of any subsequent date . These forward - looking statements are subject to a number of risks and uncertainties, including without limitation those risks and uncertainties described in our most recent annual report on Form 10 - K and subsequently filed reports on Form 10 - Q . As a result, our actual results or performance may be materially different from those expressed or implied by these forward - looking statements . We do not undertake any obligation to update forward - looking statements to reflect events or circumstances after the date they were made, whether as a result of new information, future events or otherwise, except as may be required under applicable securities laws . SAFE HARBOR STATEMENT 2

• * See Appendix A and Appendix B for the definition of Adjusted EBITDA and a reconciliation to Net Income • ** Financial guidance is as of November 6, 2015. The financial guidance by management was based on the economic environment as o f such date. Actual results may differ materially. No reference (oral or written) to such guidance should be construed as an update, revi sio n, confirmation or clarification of same. The leading global, full - service platform providing IFE&C products/services to ~ 200 airlines and Connectivity to 692+ aircraft (1) GEE has ~1,000 employees with headquarters in Los Angeles and offices worldwide Targeting the connected aircraft with integrated product suite - Content Services - Connectivity Systems - Digital Media Solutions - Operations Solutions 2015 Revenue Guidance**: $415 - 435 MM 2015 Adjusted EBITDA* Guidance**: $45 - 55 MM Cash: $218 MM (2) GEE: WORLD LEADER IN INFLIGHT CONTENT, CONNECTIVITY, DIGITAL MEDIA AND OPERATIONS DATA SOLUTIONS 3 Content Connectivity Digital Media (1) As of Dec 31, 2015 (2) As of Sept 30, 2015 Operations Solutions

4 MARKET LEADERSHIP DRIVING VALUE CREATION Business Model • Integrated product offering to optimize the passenger experience • Scalability and critical mass • Leading technology and strong industry partnerships • Expanding into adjacent markets Opportunity • $10+ Billion market • 13,000 aircraft growing at 1,500 per year, increasing penetration of onboard IFE, higher capacity systems • Increasing investment in passenger experience • Creating new revenue streams Market Position • No. 1 Provider: Inflight Satellite Connectivity (Ku - band) • No. 1 Provider: Inflight Entertainment • No. 1 Provider: Inflight Digital Advertising/Sponsorship • Fully integrated across all 4 lines of business Value Creation • Growing customer relationships with new products and services • Entering new markets • Organic • M&A • Expanding margins • Rapidly growing EBITDA * See Appendix A and Appendix B for the definition of Adjusted EBITDA and a reconciliation to Net Income

5 GEE’S FOUR AREAS OF FOCUS Operations Solutions Capturing, processing and delivering aircraft operational, administrative and crew - related data and analytics Curation, delivery and monetization of content, connectivity and transaction services on mobile devices Creation, acquisition, processing and delivery of video, audio and interactive entertainment to embedded inflight entertainment systems Design, operation and support of the platforms and networks that provide connectivity for aircraft Content Services Connectivity Systems Digital Media Solutions
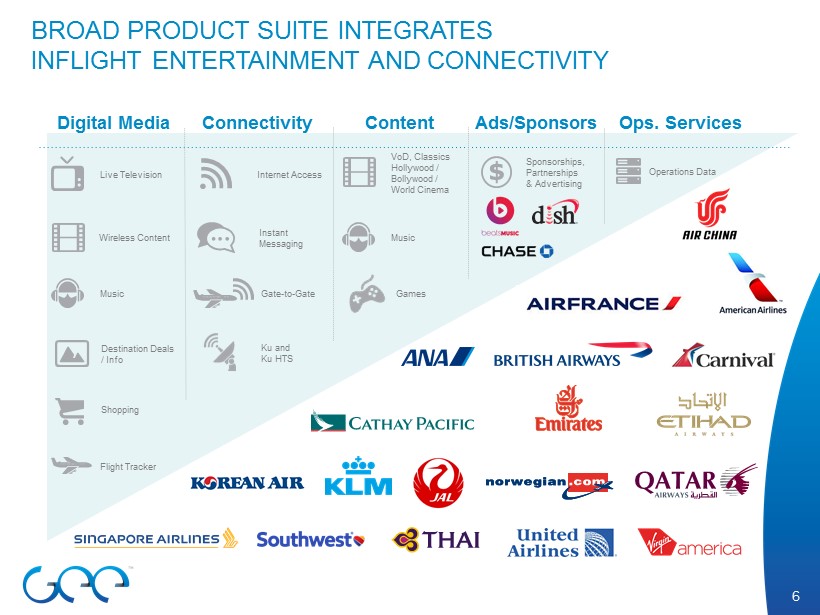
Content Connectivity Ops. Services Digital Media Ads/Sponsors Sponsorships , Partnerships & Advertising Operations Data Internet Access Instant Messaging Gate - to - Gate Live Television Wireless Content Music Games Destination Deals / Info Shopping Flight Tracker BROAD PRODUCT SUITE INTEGRATES INFLIGHT ENTERTAINMENT AND CONNECTIVITY 6 VoD, Classics Hollywood / Bollywood / World Cinema Ku and Ku HTS Music

GLOBAL PRESENCE IN KEY MARKETS 7 India Canada Los Angeles, CA Corporate Headquarters Chicago, IL United Kingdom China Hong Kong Singapore Dubai

Large Addressable Market Source: Boeing, IMDC and IATA Active Commercial Aircraft 25,515 Exclude props Aircraft >16 years old 20,057 – 79% Exclude connected (narrowband, broadband) 15,986 – 63% Exclude Backlog Aircraft with Connectivity as % of Total Addressable Market Connectivity Market: Huge Revenue Opportunity ( Unit: Number of Aircraft ) OUR IMMEDIATE PRIORITES 8 ~13,000 Aircraft 53.0% 7.0% North America ROW Approximately 1,500 new aircraft are added to the global fleet each year • Using our existing global sales force to win connectivity customers • Build an audience for digital media • Capture greater share in the connectivity market – especially internationally • Deliver rich media experience, adding value for the carrier and potential sponsors

9 CONTENT SERVICES & DIGITAL MEDIA SOLUTIONS

• Delivering product in 47 languages across 150 countries • ~ 60% share of IFE content market (1) • Distributor of Hollywood, Asian , Bollywood, European & Middle Eastern content to aviation, maritime & other non - theatrical markets • Exclusive airline distributor of: • Lionsgate / Summit f ilms • Select independent movie products & international content • Exclusive technical lab for Lionsgate , Warner Bros, Disney & Paramount LEADING PROVIDER OF CONTENT SERVICES TO GLOBAL IFE&C MARKET 10 (1) Source : IMDC

FULLY INTEGRATED CONTENT SUPPLIER 11 • Global capabilities in acquisition, technical services and distribution • Advanced state - of - the - art technical facilities • Investment in emerging technologies • MPAA - certified throughout technical operations • Highest ranking on performance and quality in OEM reports STUDIOS CONTENT ACQUISITION LAB OPS OEM AVIONICS AIRLINES

12 DIGITAL MEDIA SOLUTIONS – CURRENT , CURATED, CUSTOMIZED PARTNERSHIPS • GEE connects airlines and advertisers in a meaningful way to drive brand value, product awareness, create engaging compelling user scenarios, new business models and revenue streams PERSONAL EXPERIENCES • The proliferation of BYOD enables delivery of timely, curated, content and personalized experiences that inform the passenger journey from the cabin and beyond the terminal DIGITAL MEDIA SOLUTIONS • GEE integrates content and connectivity to deliver rich, dynamic digital media solutions including IPTV, streaming music, ecommerce, advertising and sponsorships
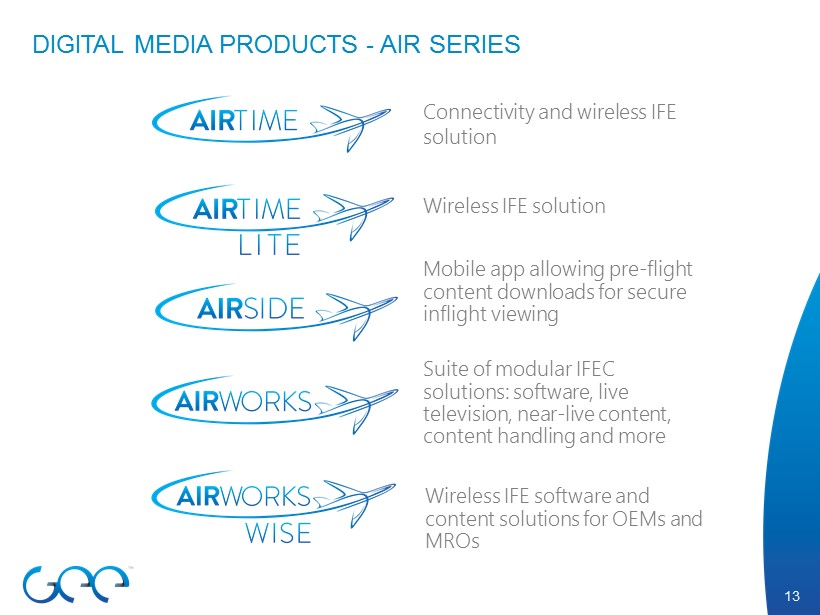
13 DIGITAL MEDIA PRODUCTS - AIR SERIES Connectivity and wireless IFE solution Wireless IFE solution Mobile app allowing pre - flight content downloads for secure inflight viewing Suite of modular IFEC solutions: software, live television, near - live content, content handling and more Wireless IFE software and content solutions for OEMs and MROs

DELIVERING IPTV TO AIRLINES 14 • GEE was the first to deliver IPTV to airlines • GEE licenses all the content, acquires the signal, processes the media to deliver live IPTV to each aircraft Ku SATELLITE GEE CONNECTIVITY EQUIPPED AIRCRAFT TCPIP , UDP & LIVE TV TCP IP, UDP & Live TV IPoS LINK Video Downlink TELEPORT/ MEDIA PROCESSING

ADS & SPONSORSHIPS DRIVING NEW REVENUE OPPORTUNITIES 15 • Advertisers and sponsors are growing sources of revenue • Live television • Music • Shopping / Retail • eBooks • Messaging • Portal experience enables various types of advertising: digital ads, video ads and “virtual live channels ”
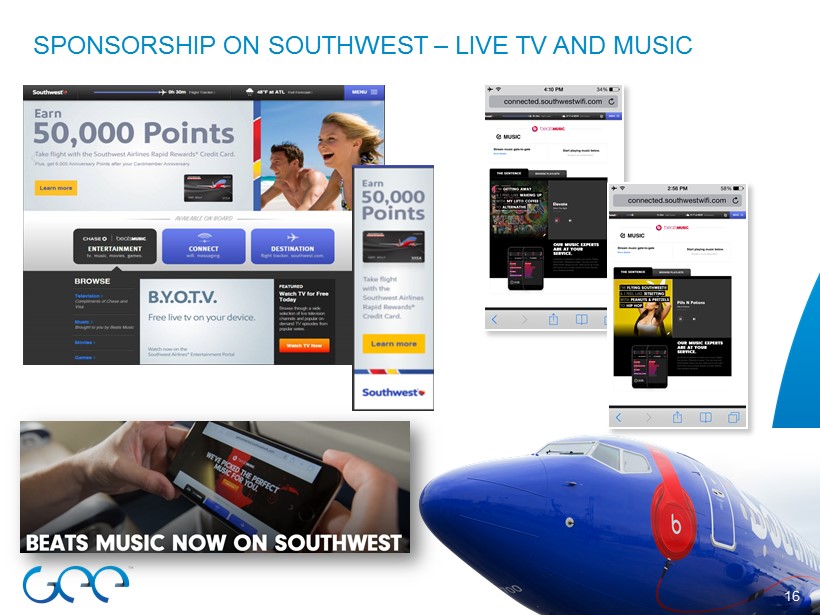
16 SPONSORSHIP ON SOUTHWEST – LIVE TV AND MUSIC

CONNECTIVITY 17

• 692 aircraft installed with GEE connectivity solution as of 12/31/2015 • First global deployed fleet with Ku - band in - flight connectivity • Global partnership with SES provides worldwide Ku - band coverage • Ku High Throughput Satellite (HTS) compatibility, when available • New global Ku antenna under development provides highly efficient operability at all latitudes, including equatorial • Partnered with Hughes to deploy JUPITER™ System HT Aero Modem which is capable of >200 Mbps World - class network operations center (NOC) • B2B business model with airlines, providing them with greater control over the in - flight passenger experience IN - FLIGHT CONNECTIVITY SYSTEMS 18

SUPERIOR CONNECTIVITY PRODUCT AND TECHNOLOGY PLATFORM Global partnership with SES for worldwide connectivity Ku - band technology provides high speed broadband internet via flexible and scalable satellite platform A leading provider of in - flight Internet connectivity that can cover both land and sea 19 EQUIPPED AIRCRAFT TCP IP & UDP IPoS LINK TCP IP & UDP IPoS LINK Ku SATELLITE INTERNET GROUND STATIONS Customer Service Aircraft Maintenance/ IFE Management Billing System Network Management Center - Chicago, Il

NEW GLOBAL ANTENNA VS. FLAT PANEL DESIGNS 20 - New Global Antenna - • Benefits in high latitude and equatorial regions Good Poor Z ero Elevation degrees) • Issues with high latitudes, banking and at equator 0 5 10 15 20 25 30 35 40 45 50 55 60 65 70 75 80 85 90 0 5 10 15 20 25 30 35 40 45 50 55 60 65 70 75 80 85 90 EQUATORIAL CONUS CENTRAL AMERICA Skew (degrees) Aircraft banking - Competitive Antennas - 0 5 10 15 20 25 30 35 40 45 50 55 60 65 70 75 80 85 90 0 5 10 15 20 25 30 35 40 45 50 55 60 65 70 75 80 85 90 EQUATORIAL CONUS CENTRAL AMERICA Skew (degrees)

Single Aisle Driving Growth Source: Boeing and Company Estimates Growth in Aircraft Shipments Connectivity Market: Huge Revenue Opportunity RAPID MARKET GROWTH OPPORTUNITY 21 79% 76% 73% 0% 10% 20% 30% 40% 50% 60% 70% 80% 90% 100% 2010-2013 Deliveries Order Backlog since 2010 Future Demand • Market focus on B737 and A320 • GEE has most 737’s deployed with broadband satellite connectivity system • Estimated total deliveries from 2014 - 2033 of 37,000 aircraft • Estimated 26,000 single aisle deliveries from 2014 - 2033 0 10,000 20,000 30,000 40,000 50,000 2014 2033 Annual revenue per aircraft could grow from low $100,000’s to over $300,000

IN - FLIGHT CONNECTIVITY LEADER 22 • 3 years running “Best in I n - flight Connectivity & Communications ”* • First to deliver live television to passengers’ mobile devices • First to deliver connectivity services to passengers’ mobile devices gate - to - gate • First to deliver portal updates and content to the aircraft over satellite • First to develop major commercial sponsorship models for airlines to deliver services free of charge • State of the art and innovative network management systems * APEX Award with Norwegian Air Shuttle At any given moment, a GEE - equipped aircraft is in flight somewhere in the world 24 / 7 / 365
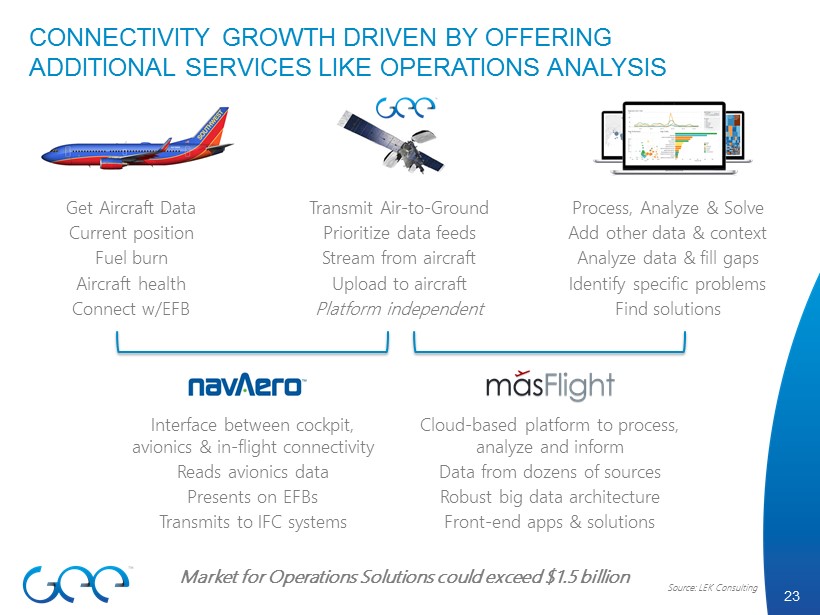
23 CONNECTIVITY GROWTH DRIVEN BY OFFERING ADDITIONAL SERVICES LIKE OPERATIONS ANALYSIS Get Aircraft Data Current position Fuel burn Aircraft health Connect w/EFB Transmit Air - to - Ground Prioritize data feeds Stream from aircraft Upload to aircraft Platform independent Process, Analyze & Solve Add other data & context Analyze data & fill gaps Identify specific problems Find solutions Interface between cockpit, avionics & in - flight connectivity Reads avionics data Presents on EFBs Transmits to IFC systems Cloud - based platform to process, analyze and inform Data from dozens of sources Robust big data architecture Front - end apps & solutions Market for Operations Solutions could exceed $1.5 billion Source: LEK Consulting

FINANCIAL OVERVIEW 24

Licensing • Seatback IFE: Sale or license of media content, video and music programming, applications and video games • N/M Services • Technical services such as encoding and editing of media content • Connectivity : Internet Access/ WiFi • Digital Media Products : IPTV , “Air” Series of products: VoD , Music, eBooks and Messaging • Digital Media Commercial : Advertising, sponsorship , shopping and travel - related revenue • Operations Data Equipment • N/M • Sale of satellite - based connectivity equipment CONTENT AND CONNECTIVITY BUSINESS SEGMENTS CONTENT SOURCE $ CONNECTIVITY 25

STRONG REVENUE GROWTH AND EXPANDING MARGINS 26 * See Appendix A and Appendix B for the definition of Adjusted EBITDA and a reconciliation to Net Income $260 $388 $415 $ 435 $200 $250 $300 $350 $400 $450 2013 2014 2015 $ in MM $12 $31 $45 $ 55 $0 $15 $30 $45 $60 2013 2014 2015 REVENUE ADJUSTED EBITDA* $ in MM

$3 $11 $51 $75 $0 $15 $30 $45 $60 $75 2011 2012 2013 2014 RAPID CONNECTIVITY SERVICE REVENUE GROWTH 27 $ in MM
APPENDICES
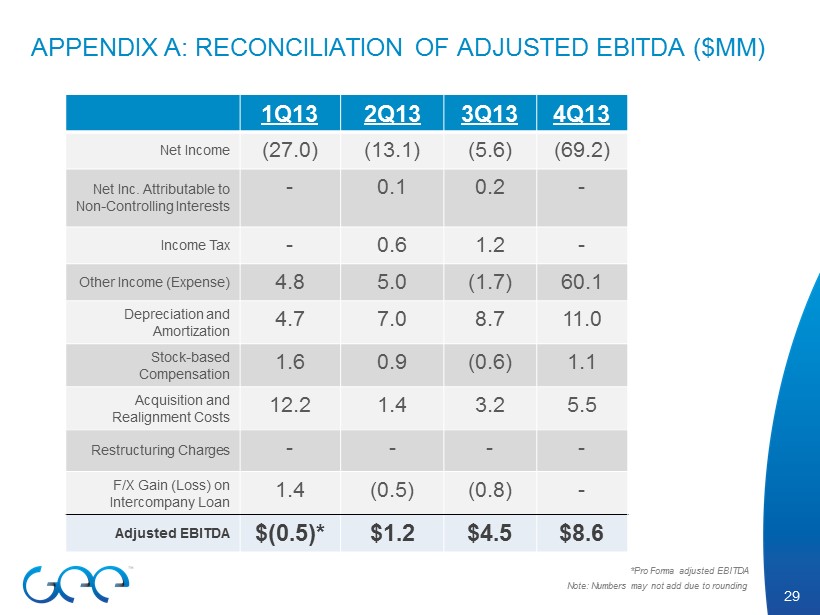
APPENDIX A: RECONCILIATION OF ADJUSTED EBITDA ($MM ) 29 1Q13 2Q13 3Q13 4Q13 Net Income (27.0) (13.1) (5.6) (69.2) Net Inc. Attributable to Non - Controlling Interests - 0.1 0.2 - Income Tax - 0.6 1.2 - Other Income (Expense) 4.8 5.0 (1.7) 60.1 Depreciation and Amortization 4.7 7.0 8.7 11.0 Stock - based Compensation 1.6 0.9 (0.6) 1.1 Acquisition and Realignment Costs 12.2 1.4 3.2 5.5 Restructuring Charges - - - - F/X Gain (Loss) on Intercompany Loan 1.4 (0.5) (0.8) - Adjusted EBITDA $(0.5)* $1.2 $4.5 $8.6 Note: Numbers may not add due to rounding *Pro Forma adjusted EBITDA

APPENDIX A: RECONCILIATION OF ADJUSTED EBITDA ($MM ) (CONT’D) 30 1Q14 2Q14 3Q14 4Q14 1Q15 2Q15 3Q15 Net Income (26.3) 12.0 (15.5) (25.0) (3.4) 13.0 (6.9) Net Inc. Attributable to Non - Controlling Interests 0.2 - - - - - - Income Tax 1.3 0.8 1.5 4.6 (0.7) 1.3 0.2 Other Income (Expense) 15.9 (20.3) 7.1 11.2 0.1 (13.8) 3.2 Depreciation and Amortization 9.4 8.3 8.3 8.4 8.2 8.2 9.5 Stock - based Compensation 2.6 2.0 1.9 1.6 2.6 1.6 2.1 Acquisition and Realignment Costs 2.1 3.6 3.0 8.0 1.2 2.0 5.8 Restructuring Charges - - 2.6 1.6 0.3 - 0.1 F/X Gain (Loss) on Intercompany Loan - - - - - - - Adjusted EBITDA $5.1 $6.5 $8.8 $10.4 $8.2 $12.2 $14.1 Note: Numbers may not add due to rounding

To supplement our consolidated financial statements, which are prepared and presented in accordance with GAAP, we present Adjusted EBITDA, which is a non - GAAP financial measure, as a measure of our performance. The presentation of Adjusted EBITDA is not intended to be considered in isolation or as a substitute for, or superior to, net income (loss), operating loss befor e i ncome taxes or any other performance measures derived in accordance with GAAP or as an alternative to net cash provided by operatin g activities or any other measures of our cash flow or liquidity. For more information on this non - GAAP financial measure, please see the reconciliation table and notes on the previous pages. Adjusted EBITDA is the primary measure used by our management and board of directors to understand and evaluate our financial performance and operating trends, including period to period comparisons, to prepare and approve our annual budget and to develop short and long term operational plans. Additionally, Adjusted EBITDA is the primary measure used by the compensation committee of our board of directors to establish the funding targets for and fund the annual bonus pool for our employees and executives. We believe our presentation of Adjusted EBITDA is useful to investors both because it allows for greater transpar enc y with respect to key metrics used by management in its financial and operational decision - making and our management frequently uses it in discussions with investors, commercial bankers, securities analysts and other users of our financial statements . We define Adjusted EBITDA as operating loss before income taxes before, when applicable, other income(expense ), interest expense (income), depreciation and amortization, as further adjusted to eliminate their impact of, when applicable, stock - based compensation, acquisition and realignment costs, restructuring charges , F/X gain (loss) on intercompany loans and any gains or losses on certain asset sales or dispositions. Other income (expense), acquisition and realignment costs and restructuring charges include such items, when applicable, as (a) non - cash GAAP purchase accounting adjustments for certain deferred revenue and costs, (b) legal, accounting and other professional fees directly attributable to acquisition activity , (c) employee severance payments and third party professional fees directly attributable to acquisition or corporate realignment activities, (d) certain non - recurring expenses associated with our expansion into China that did not generate associated revenue in 2014, (e) legal settlements or reserves for legal settlements in the period that pertain to historical matters that existed at acquired companies prior to their purchase date, (f) impairment of a portion of certain receivables directly attributable to a customer undergoing economic hardships from recent trade sanctions imposed by the European Union and the United States on Russia, (g) changes in the fair value of our derivative financial instruments and (h ) any restructuring charges in the period pursuant to our integration plan announced on September 23, 2014 . Management does not consider these costs to be indicative of our core operating results. APPENDIX B: DEFINITION OF ADJUSTED EBITDA 31