Attached files
| file | filename |
|---|---|
| EX-32.1 - EXHIBIT 32.1 - ARKANOVA ENERGY CORP. | exhibit32-1.htm |
| EX-23.1 - EXHIBIT 23.1 - ARKANOVA ENERGY CORP. | exhibit23-1.htm |
| EX-31.2 - EXHIBIT 31.2 - ARKANOVA ENERGY CORP. | exhibit31-2.htm |
| EX-31.1 - EXHIBIT 31.1 - ARKANOVA ENERGY CORP. | exhibit31-1.htm |
| 10-K - FORM 10-K - ARKANOVA ENERGY CORP. | form10k.htm |
![]()
December 11, 2015
Mr. Pierre Mulacek
Provident Energy of Montana, LLC
305
Camp Craft Road, Suite 525
Austin, TX 78746
|
Subject: |
Reserve Estimate and Financial Forecast as to Provident Energy of Montana, LLC’s Interests in the Two Medicine Cut Bank Sand Unit, Cut Bank Field, Glacier and Pondera Counties, Montana |
Dear Mr. Mulacek:
As per your request, Gustavson Associates, LLC., has conducted an independent reserve evaluation and estimated the future net revenue attributable as to Provident Energy of Montana, LLC’s interests in the Two Medicine Cut Bank Sand Unit (TMCBSU), Cut Bank Field, Glacier and Pondera Counties, Montana. It is our understanding that Provident Energy of Montana, LLC plans to include this report as part of a filing with the United States Securities and Exchange Commission (SEC). Therefore, this report is focused on Proved reserves and cash flow projections deriving there from. Estimates and projections have been made as of September 30, 2015. Reserves have been estimated in accordance with the US Securities and Exchange Commission’s (SEC) definitions and guidelines.
Proved Developed Producing (PDP) reserves have been assigned to 18 of the 36 currently producing wells in the Cut Bank Field. The remainder were found to be uneconomic under current operating conditions.
The operator has indicated that they have no further plans for workovers or drilling; therefore, no Proved Undeveloped reserves have been assigned. Waterflood was re-started in the unit in October 2014, and initial response has been seen, although difficult to project on a PDP basis. Proved Developed Non-Producing reserves have been assigned to the waterflood as described below. This Consultant’s estimates of net reserves and future net revenues for the total of the wells in which Provident Energy of Montana, LLC currently holds an interest described herein, as of September 30, 2015, are shown in Table 1 below. Reserve estimates and production rate projections were based on the extrapolation of established performance trends.
The lease operating cost used in this analysis was $838 per well per month based on the average cost reported by the client. Oil prices were based on the average price paid to the client from the first day of each month in the previous twelve months. This was found to be $46.14, which is $31.55 less than the price forecast utilized in the 2014 Reserve Report Update. Costs and prices were held flat.
5757 Central Ave. Suite D Boulder, Co. 80301 USA 1-303-443-2209 FAX 1-303-443-3156 http://www.gustavson.com
Mr. Pierre Mulacek
December 11, 2015
Page 2
Table 1 Reserves and Cash Flow Summary
| Reserve Category | Estimated Net
Reserves |
Estimated Future Net
Revenue* |
|
Oil (BBL) |
Undiscounted
($) |
Discounted at 10% ($) | |
| Proved Developed Producing | 31,235 | 605,440 | 488,343 |
| Proved Developed Non-Producing | 179,862 | 5,609,992 | 3,330,652 |
| Total Proved | 211,097 | 6,215,432 | 3,818,995 |
*Before deduction of Federal Income Tax
Estimated future net revenue reflects the deductions of severance and ad valorem taxes and operating costs. Since all 18 stripper wells were found to have a production rate of less than 10 barrels of oil per day, the severance tax rate of 5.5% was utilized (compared with 9.0% for wells with over 10 Bbl of daily oil production). Federal income taxes and other indirect costs have not been deducted. A per well abandonment cost of $5,405 was applied at the end of economic life for each well. These costs were all charged against the Proved Developed Producing (PDP) reserves. Note the remaining 18 wells will still have abandonment costs totaling $97,290. These costs have not been applied to the above table as it is unclear when they will be incurred. A detailed assessment of potential environmental liabilities has not been performed; thus, these estimated costs could vary. It is our understanding that Provident Energy of Montana, LLC’s interest in the property is 55 % working interest and 44.55 % net revenue interest.
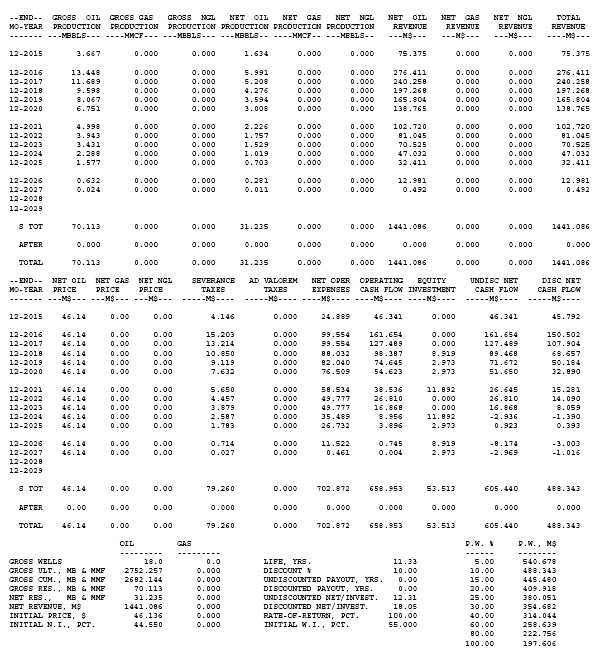
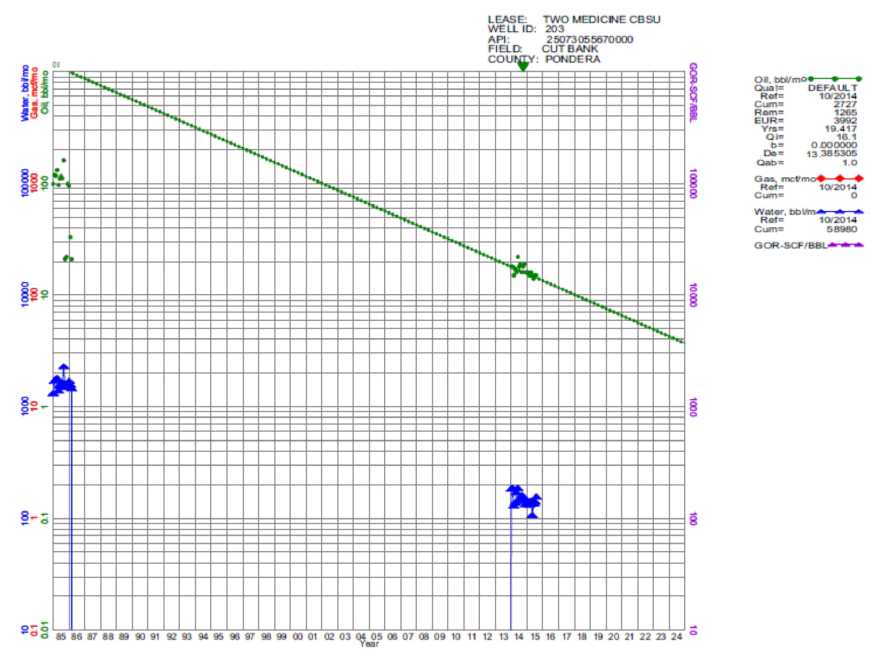
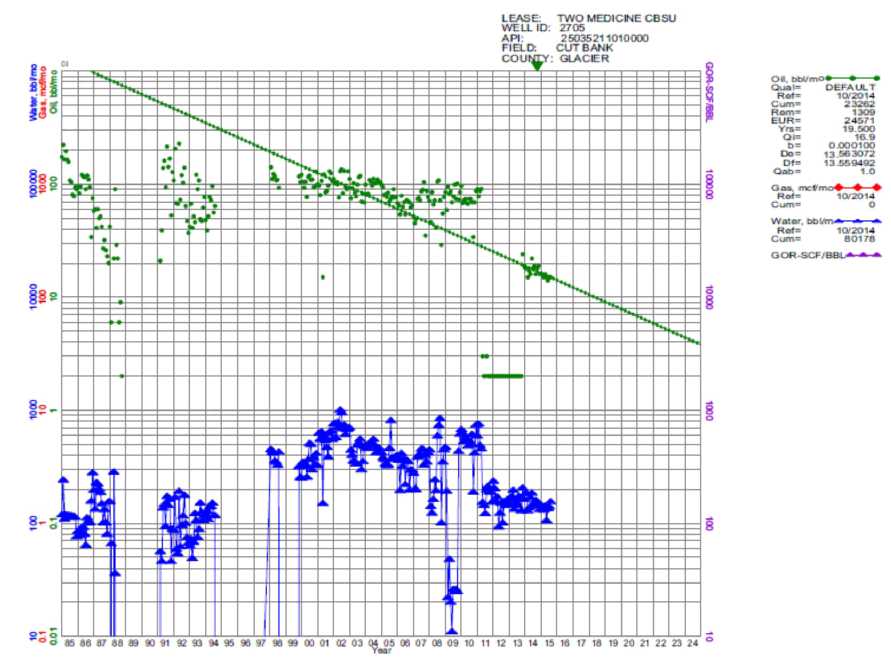
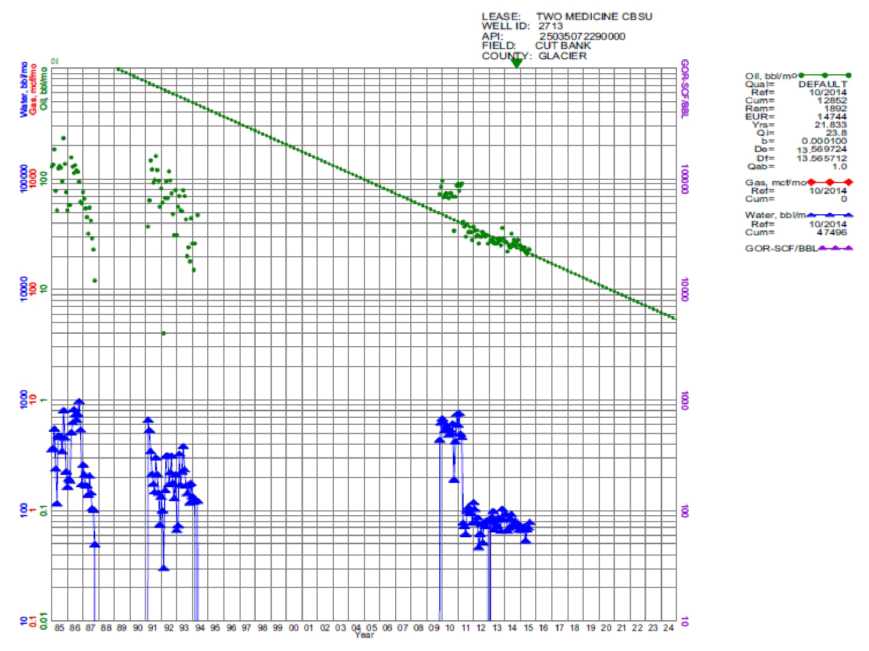
The summary cash flow forecasts by category are included as Table 2 and Table 3. Note that due to the economic parameters, 18 producing wells were found to be uneconomic under current conditions. Appendix A illustrates the decline curve forecasts and cash flows for the 18 economic PDP wells and the waterflood PDNP reserves. The decline curves for the 18 uneconomic wells are shown in Appendix B.
Waterflood Analysis
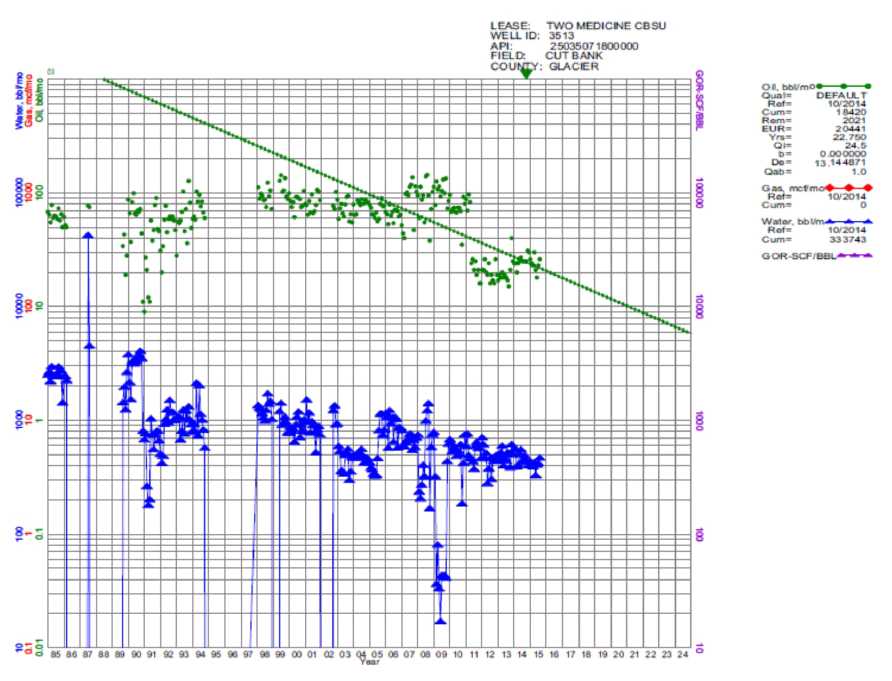
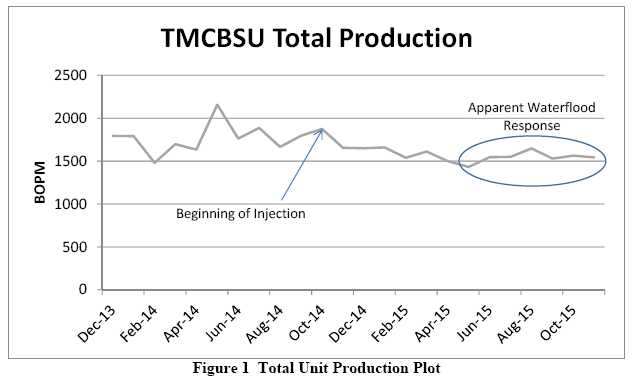
Provident completed the Tribal Max 1-2817 horizontal well as an injection well in October 2014. In June 2015, approval was received for an area wide water injection permit. Three more injectors were brought on-line in August 2015, with another in November and another in December, for a total of six. Current injection rate is about 2,400 bpd, with 2,900 anticipated mid-December. Review of numerous engineering studies on this unit plus analogous units under long-term waterflood in the remainder of the Cut Bank Field, combined with indications of initial production response to waterflood in the TMCBU (Figure 1), enable the assignment of Proved Developed Non-Producing waterflood reserves at this time.
Mr. Pierre Mulacek
December 11, 2015
Page 3
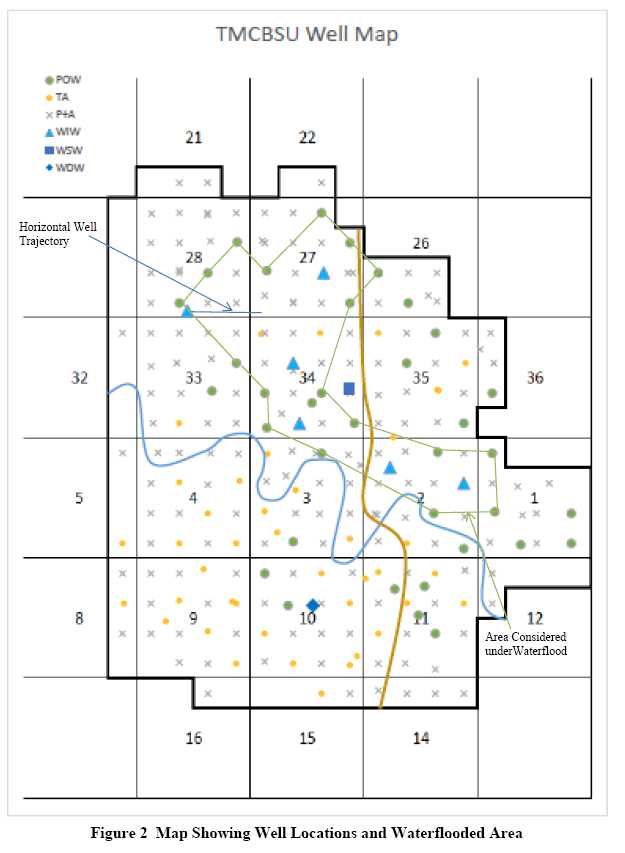
Waterflood reserves were evaluated based on review of other studies done on the TMDBU and other waterflooded units in the Cut Bank Field. A waterflooded area was identified based on the locations of currently active producers and injectors (Figure 2). Oil originally in place was calculated at 20.8 million barrels for the waterflooded area based on estimated area and average reservoir properties from other studies. Potential primary plus secondary reserves were estimated based on rock and fluid properties, analogous reservoirs’ performance, and adjustment for the lack of a regular 40-acre waterflood pattern as was conducted in the analogs. Recovery factors for the analogous floods ranged from 30-33%. Recovery factor for the waterflooded area in TMCBSU was conservatively estimated at 22.3%, yielding ultimate primary plus secondary reserves of 4.6 million barrels.
Next, cumulative recovery for the area was estimated based on a combination of the cumulative production data by well since 1983, allocated to the waterflooded area based on geometric factors, the total cumulative production for the unit prior to 1983, and the assumption that the ratio of production from the waterflooded area to the total unit was the same before and after 1983. Additionally, in order to meet the certainty level required in the definitions of Proved reserves, it was assumed that an additional 10% of oil “production” was likely to have been drained from the TMCBSU prior to its development due to earlier development in offset units. The resulting estimate cumulative recovery plus drainage from the waterflooded area is 3.52 MMBbl. After deduction of the remaining 27.3 Mbbl of primary recovery, the remaining waterflood target in the currently waterflooded area is 1.09 MMBbl.
Mr. Pierre Mulacek
December 11, 2015
Page 4
Mr. Pierre Mulacek
December 11, 2015
Page 5
Based on prior studies which indicated a possible time to peak waterflood response of 24 months after initial response, it was assumed that peak waterflood response would be reached 24 months after the effective date of this report. The peak rate was selected based on review of prior primary rates (Figure 3), and the decline after peak was based on previous decline rates. Incremental operating costs were assigned to the PDNP reserves based on how many of the currently producing wells were uneconomic under primary forecast at any given point in time, and the average per well operating cost established over the past year. The resulting economics yielded a gross reserves estimate of 403.7 MBbl, for an ultimate recovery of 19% from the waterflooded area. This is considered a conservative forecast which meets the requirement of 90% certainty for estimation of Proved Reserves.

Mr. Pierre Mulacek
December 11, 2015
Page 6
Limiting Conditions and Disclaimers
Reserve estimates presented in this report were based on data and records obtained from Provident Energy of Montana, LLC, Big Bear, IHS Energy, and the Montana Oil and Gas Conservation Division.
The Client has informed us that a waterflood is planned on this lease next year; however, Gustavson has not yet studied this potential upside and it is not included in this Report.
Gustavson Associates, LLC, holds neither direct nor indirect financial interest in the subject properties, in Provident Energy of Montana, LLC, or in any other affiliated companies.
The accuracy of any reserve estimate is a function of available data and of geological and engineering interpretation and judgment. While the reserve estimate presented herein is believed to be reasonable, it should be viewed with the understanding that subsequent reservoir performance, changes in pricing structure or market demand may justify its revision.
All data utilized in the preparation of this report are available for examination in our offices. Please contact us if we can be of assistance. We appreciate the opportunity to be of service and look forward to further serving Provident Energy of Montana, LLC.
Very truly yours,
GUSTAVSON ASSOCIATES, LLC.

Mr. Pierre Mulacek
December 11, 2015
Page 7
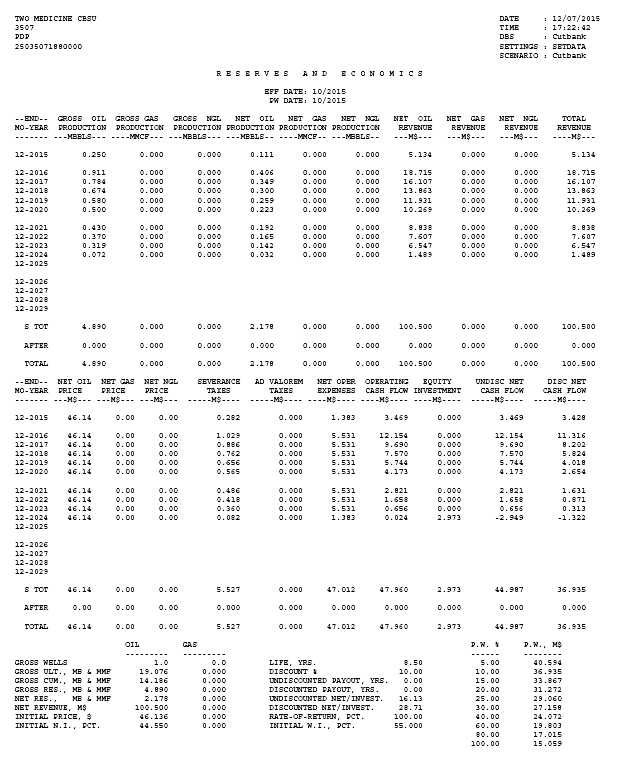
Table 2 Cash Flow Forecast, Total Proved Developed Producing
| TOTAL PROVED DEVELOPED PRODUCING | DATE : 12/07/2015 |
| CUTBANK FIELD | TIME : 17:22:42 |
| PONDERA AND GLACIER COUNTIES, MO | DBS : Cutbank |
| TO THE INTERESTS OF PROVIDENT ENERGY OF MONTANA | SETTINGS : SETDATA |
| SCENARIO : Cutbank |
R E S E R V E S A N D E C O N O M I C S
EFF DATE: 10/2015
PW DATE:
10/2015
Mr. Pierre Mulacek
December 11, 2015
Page 8
Table 3 Cash Flow Forecast, Total Proved Developed Non-Producing

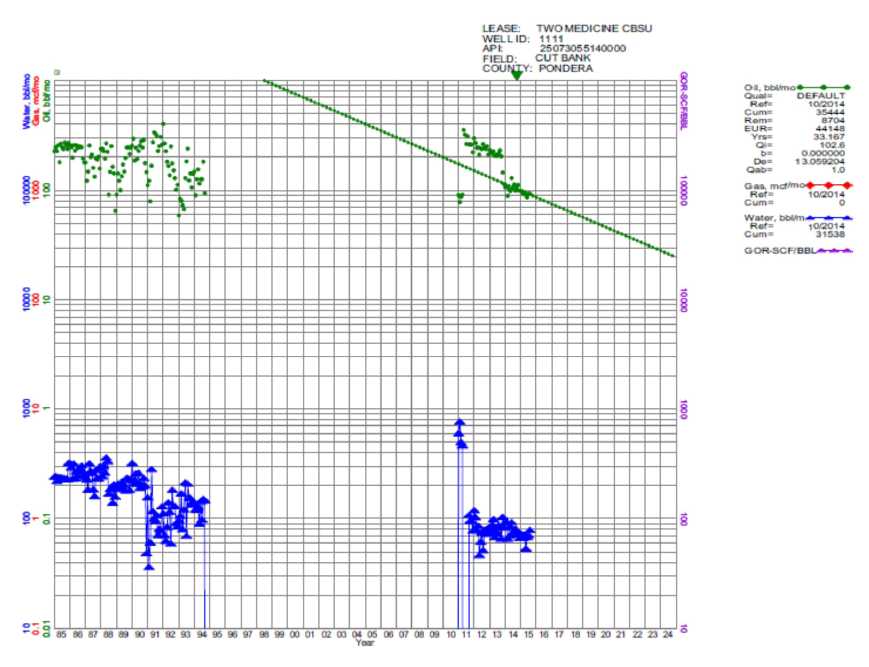
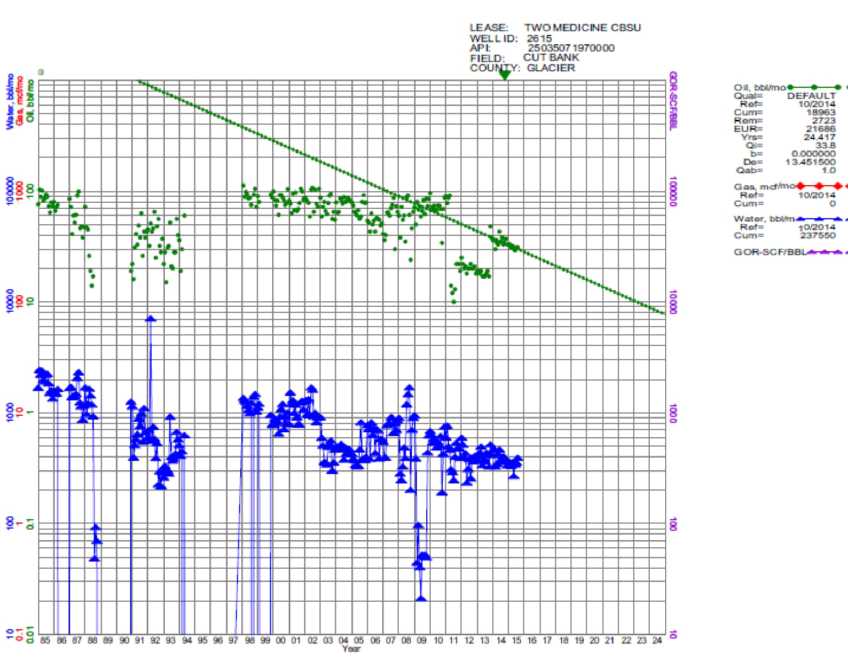
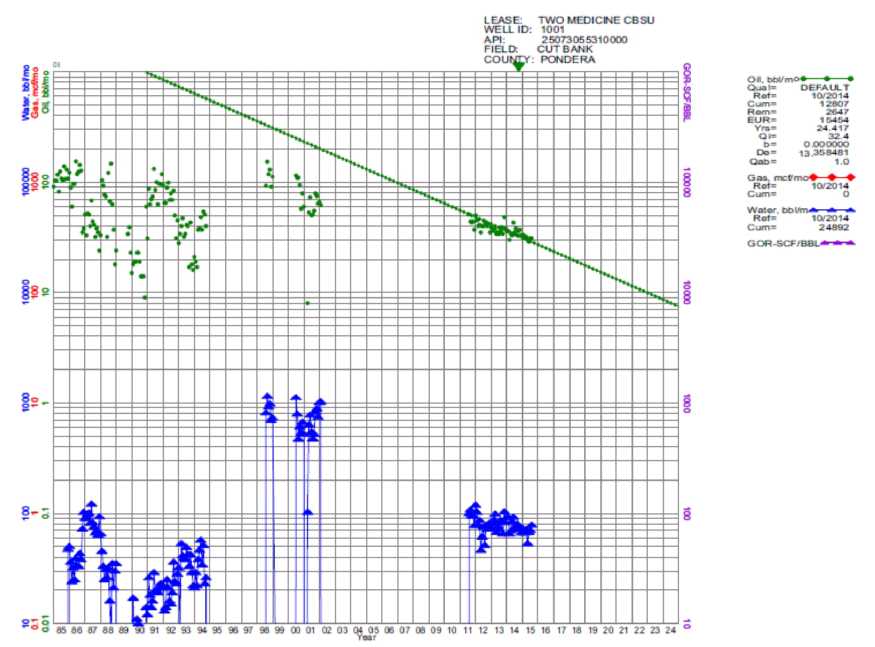
APPENDIX A
DECLINE CURVE FORECASTS
&
WELL CASH FLOWS

![]()


![]()


![]()


![]()


APPENDIX B
DECLINE CURVE FORECASTS
OF UNECONOMIC WELLS


![]()


![]()