Attached files
| file | filename |
|---|---|
| 8-K - 8-K INVESTOR PRESENTATION - ADVANCED ENERGY INDUSTRIES INC | form8-kanalystconference.htm |

Investor Relations Presentation Needham 18th Annual Growth Conference January 2016
2 Safe Harbor The company’s guidance with respect to anticipated financial results for the fourth quarter and year ending December 31, 2015, estimates of future costs after the wind down of the Solar Inverter business, estimated future market and growth opportunities, expectations regarding future market trends and the company’s future performance within specific markets, aspirational goals and other statements that are not historical information are forward-looking statements within the meaning of Section 27A of the Securities Act of 1933 and Section 21E of the Securities Exchange Act of 1934. Forward-looking statements are subject to known and unknown risks and uncertainties that could cause actual results to differ materially from those expressed or implied by such statements. Such risks and uncertainties include, but are not limited to: (a) the effects of global macroeconomic conditions upon demand for our products; (b) the volatility and cyclicality of the industries the company serves, particularly the semiconductor industry; (c) delays in capital spending by end-users in our served markets; (d) expected decreases in customer orders and sales and potential disruptions in operations, supplier relationships and employee relations given the wind down the Solar Inverter business; (e) the company's ability to identify and execute upon a sale of any remaining assets or license of intellectual property (if any) of the inverter business; (f) the resources and costs related to fulfill the remaining Solar Inverter product warranty and post warranty obligations; (g) the company's ability to realize on its plan to avoid additional costs after the wind down the Solar Inverter business; (h) the accuracy of the company's estimates and assumptions on which its financial statement projections are based, including estimates and assumptions related to the wind down of the Solar Inverter business; (i) the impact of price changes resulting from a variety of factors; (j) the timing of orders received from customers; (k) the company’s ability to realize benefits from cost improvement efforts including avoided costs, restructuring plans and inorganic growth; (l) the company’s ability to obtain materials and manufacture products; and (m) unanticipated changes to management's estimates, reserves or allowances. These and other risks are described in Advanced Energy's Form 10-K, Forms 10-Q and other reports and statements filed with the Securities and Exchange Commission (the “SEC”). These reports and statements are available on the SEC's website at www.sec.gov. Copies may also be obtained from Advanced Energy's investor relations page at http://ir.advanced-energy.com or by contacting Advanced Energy's investor relations at 970-407-6555. Forward-looking statements are made and based on information in the November 2, 2015 press release. Aspirational goals and targets discussed on the conference call or in the presentation materials should not be interpreted in any respect as guidance. The company assumes no obligation to update the information in the November 2, 2015 press release and this investor presentation is not intended to provide such an update.
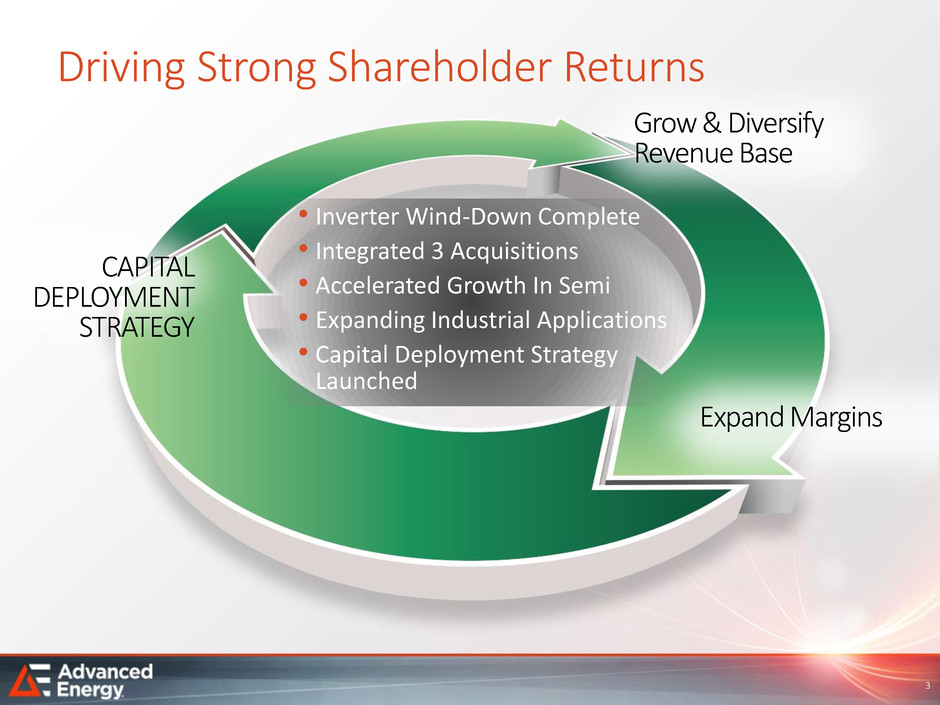
• Inverter Wind-Down Complete • Integrated 3 Acquisitions • Accelerated Growth In Semi • Expanding Industrial Applications • Capital Deployment Strategy Launched Driving Strong Shareholder Returns Grow & Diversify Revenue Base CAPITAL DEPLOYMENT STRATEGY Expand Margins 3
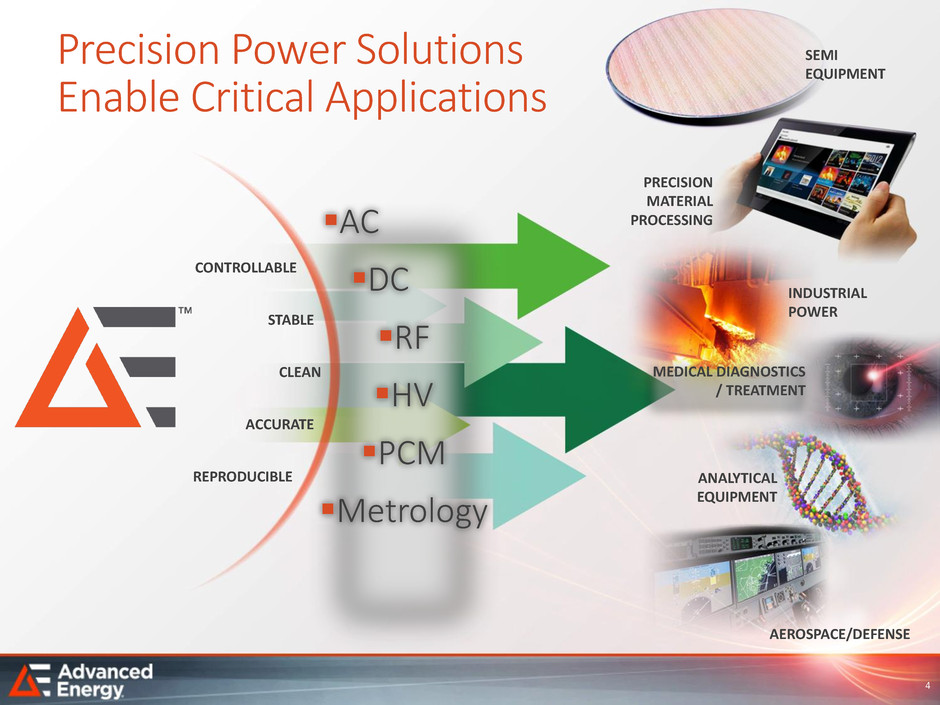
CONTROLLABLE REPRODUCIBLE Precision Power Solutions Enable Critical Applications AC DC RF HV PCM Metrology STABLE CLEAN ACCURATE PRECISION MATERIAL PROCESSING INDUSTRIAL POWER MEDICAL DIAGNOSTICS / TREATMENT AEROSPACE/DEFENSE ANALYTICAL EQUIPMENT SEMI EQUIPMENT 4
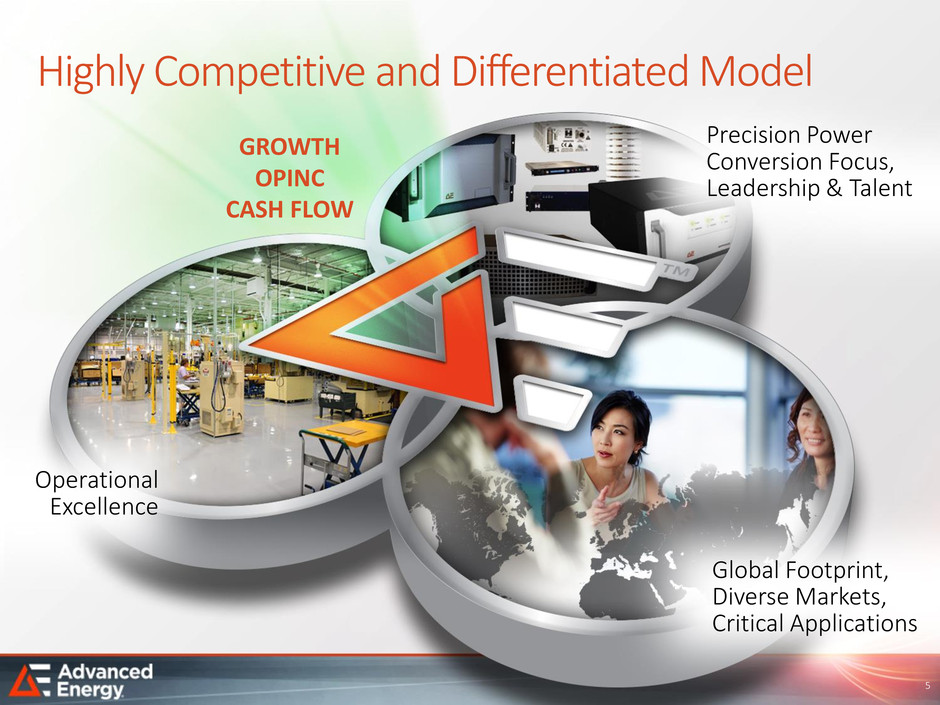
Highly Competitive and Differentiated Model Global Footprint, Diverse Markets, Critical Applications Operational Excellence Precision Power Conversion Focus, Leadership & Talent GROWTH OPINC CASH FLOW 5

Precision Power Solutions Enabling Mobile Technology EMI Coatings Camera Optics Coating HBLED Light Logic: Processor Memory: NAND & DRAM AMOLED or TFT Display Glass Coating Capacitive Touchscreen Thin Film Battery MEMS Sensors 6
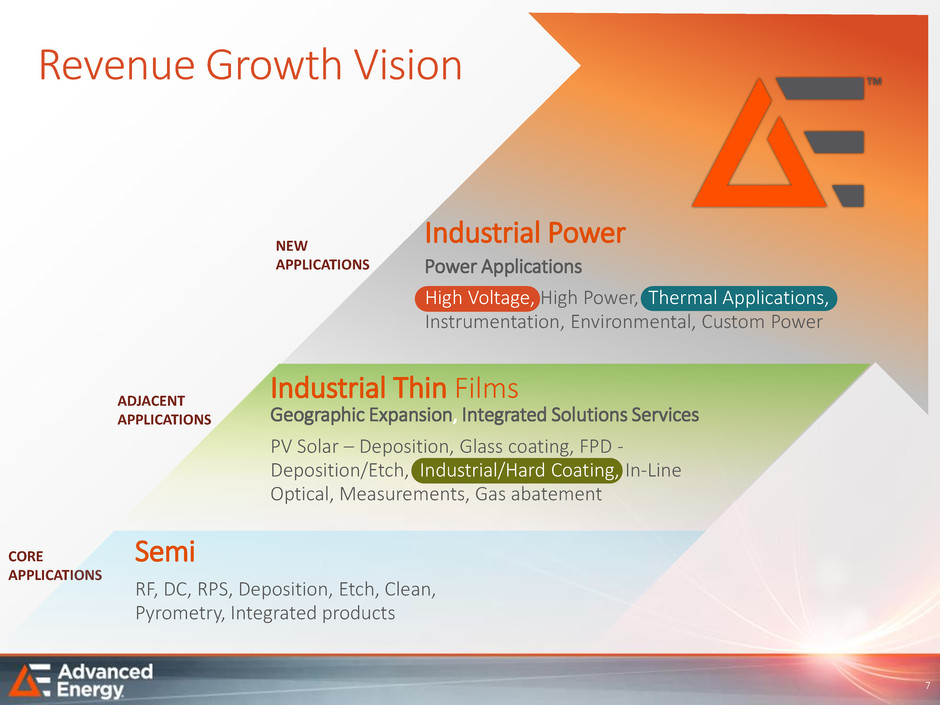
Revenue Growth Vision CORE APPLICATIONS ADJACENT APPLICATIONS NEW APPLICATIONS Industrial Power Power Applications High Voltage, High Power, Thermal Applications, Instrumentation, Environmental, Custom Power Semi RF, DC, RPS, Deposition, Etch, Clean, Pyrometry, Integrated products Industrial Thin Films Geographic Expansion, Integrated Solutions Services PV Solar – Deposition, Glass coating, FPD - Deposition/Etch, Industrial/Hard Coating, In-Line Optical, Measurements, Gas abatement 7
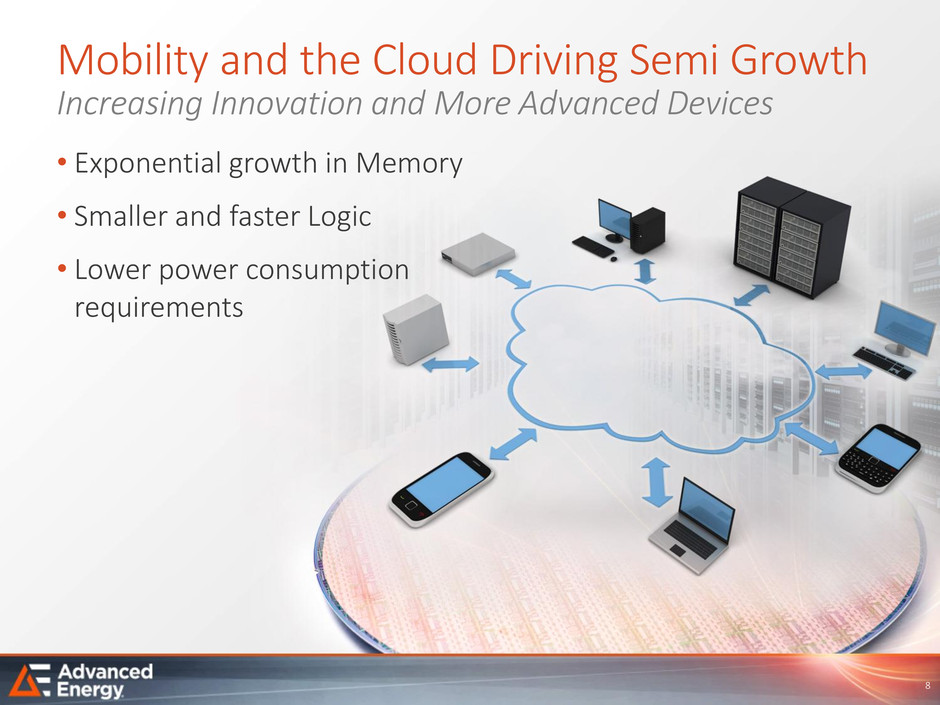
8 Mobility and the Cloud Driving Semi Growth Increasing Innovation and More Advanced Devices • Exponential growth in Memory • Smaller and faster Logic • Lower power consumption requirements
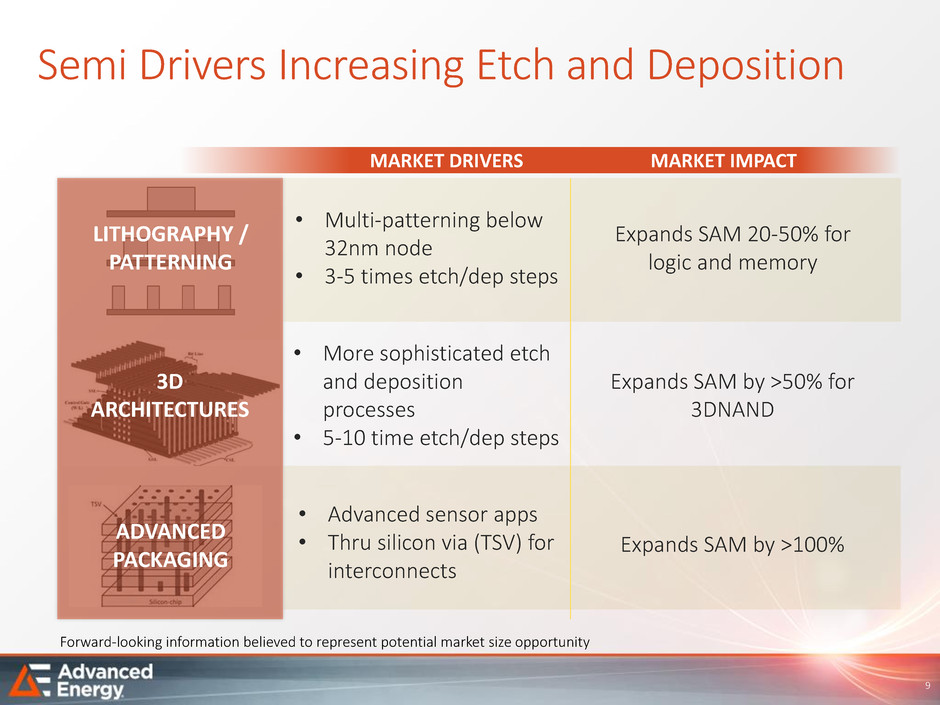
• Multi-patterning below 32nm node • 3-5 times etch/dep steps • More sophisticated etch and deposition processes • 5-10 time etch/dep steps Expands SAM 20-50% for logic and memory MARKET DRIVERS MARKET IMPACT LITHOGRAPHY / PATTERNING 3D ARCHITECTURES ADVANCED PACKAGING Expands SAM by >50% for 3DNAND Expands SAM by >100% • Advanced sensor apps • Thru silicon via (TSV) for interconnects Semi Drivers Increasing Etch and Deposition Forward-looking information believed to represent potential market size opportunity 9
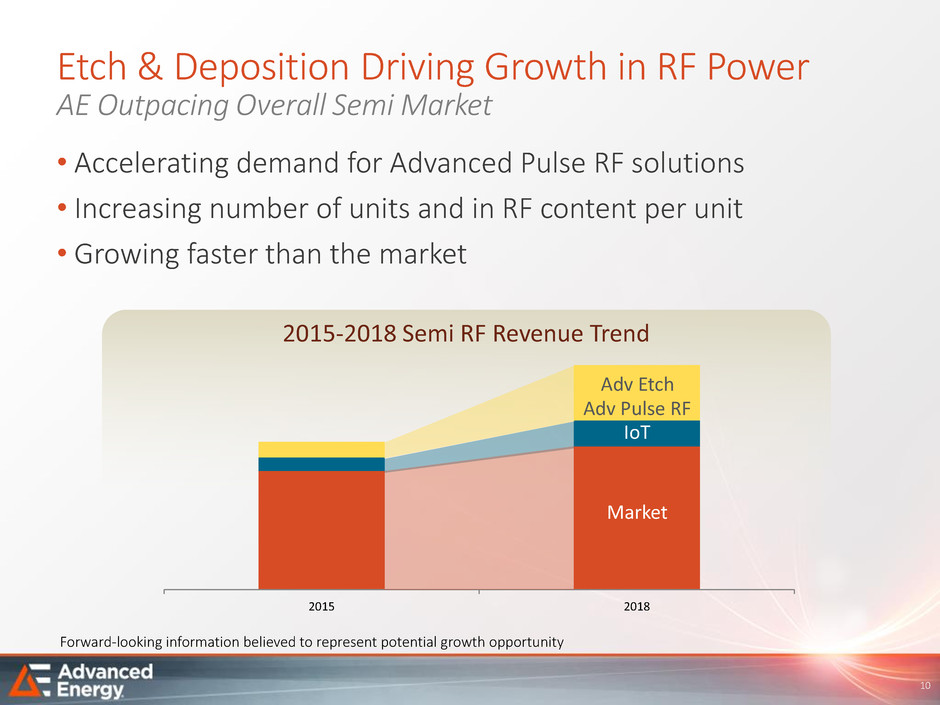
10 2015-2018 Semi RF Revenue Trend 2015 2018 Adv Etch Adv Pulse RF IoT Market • Accelerating demand for Advanced Pulse RF solutions • Increasing number of units and in RF content per unit • Growing faster than the market Etch & Deposition Driving Growth in RF Power AE Outpacing Overall Semi Market Forward-looking information believed to represent potential growth opportunity
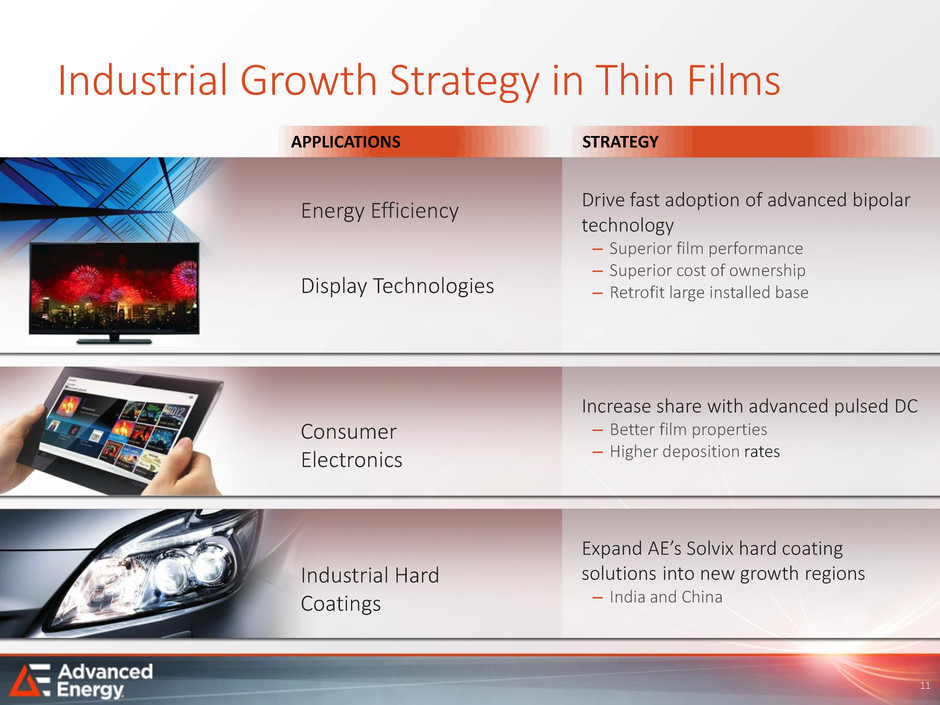
Energy Efficiency Display Technologies Consumer Electronics Industrial Hard Coatings Drive fast adoption of advanced bipolar technology – Superior film performance – Superior cost of ownership – Retrofit large installed base Expand AE’s Solvix hard coating solutions into new growth regions – India and China Increase share with advanced pulsed DC – Better film properties – Higher deposition rates Industrial Growth Strategy in Thin Films 11 APPLICATIONS STRATEGY
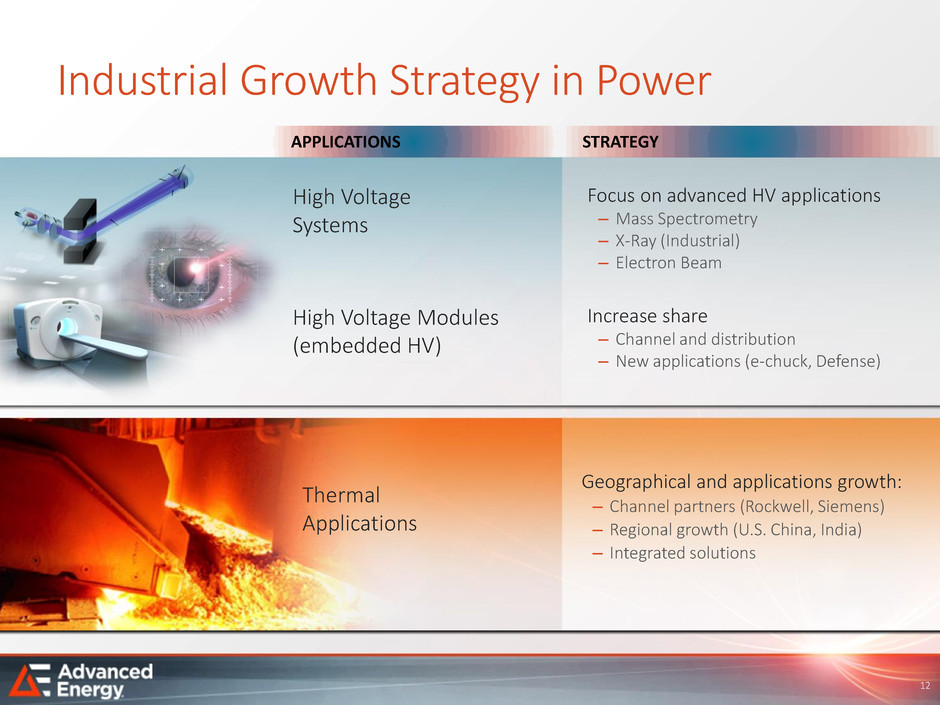
Industrial Growth Strategy in Power 12 High Voltage Systems High Voltage Modules (embedded HV) Thermal Applications Focus on advanced HV applications – Mass Spectrometry – X-Ray (Industrial) – Electron Beam Geographical and applications growth: – Channel partners (Rockwell, Siemens) – Regional growth (U.S. China, India) – Integrated solutions Increase share – Channel and distribution – New applications (e-chuck, Defense) APPLICATIONS STRATEGY
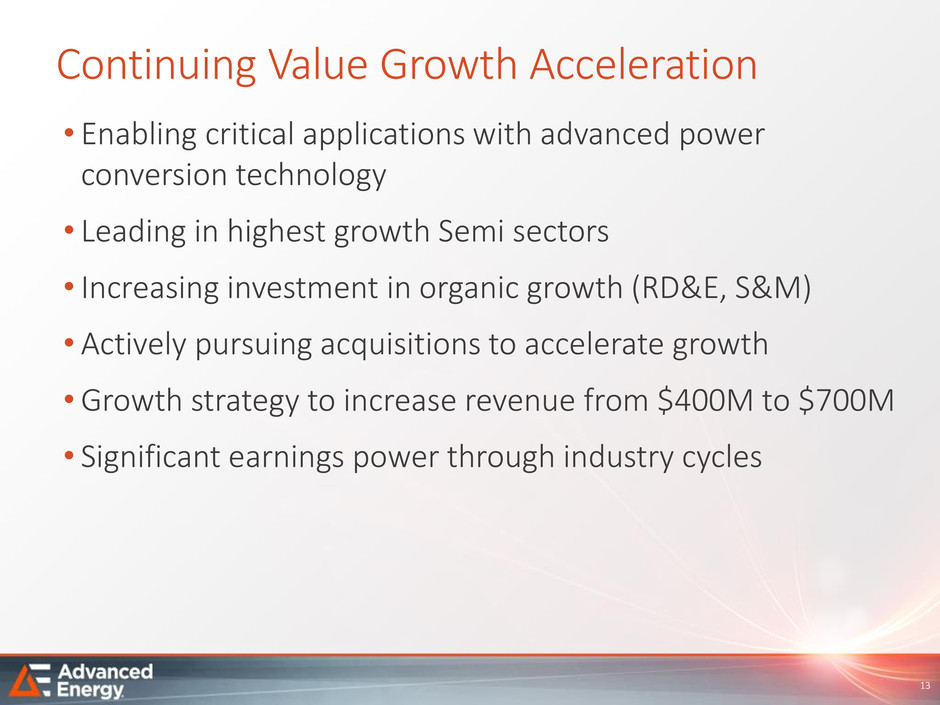
13 Continuing Value Growth Acceleration • Enabling critical applications with advanced power conversion technology • Leading in highest growth Semi sectors • Increasing investment in organic growth (RD&E, S&M) • Actively pursuing acquisitions to accelerate growth •Growth strategy to increase revenue from $400M to $700M • Significant earnings power through industry cycles

14 FINANCIALS
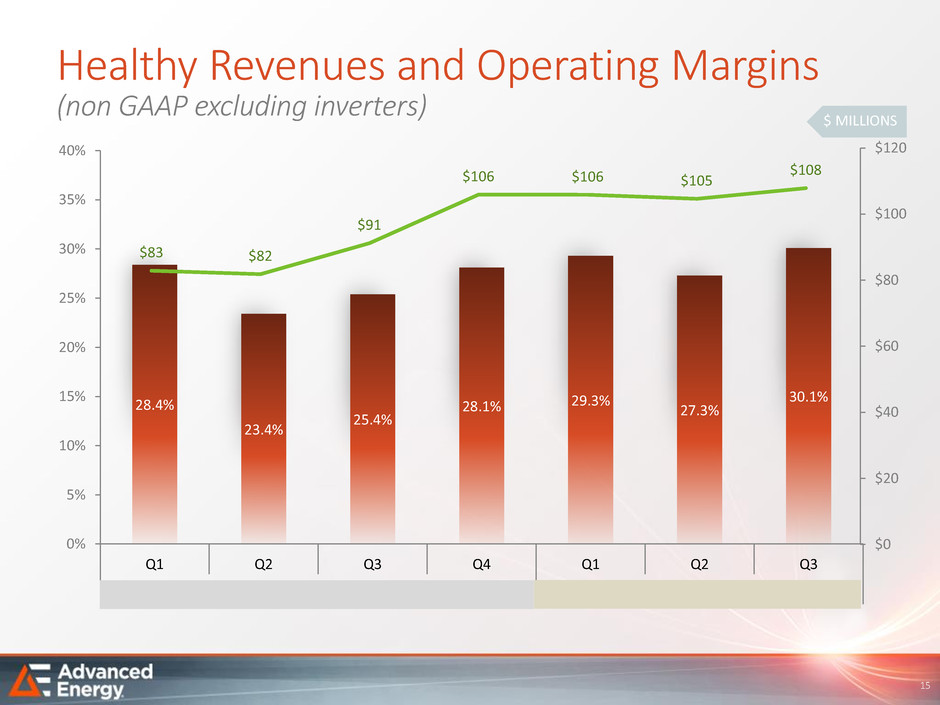
28.4% 23.4% 25.4% 28.1% 29.3% 27.3% 30.1% 0% 5% 10% 15% 20% 25% 30% 35% 40% Q1 Q2 Q3 Q4 Q1 Q2 Q3 2014 2015 $83 $82 $91 $106 $106 $105 $108 $0 $20 $40 $60 $80 $100 $120 15 Healthy Revenues and Operating Margins (non GAAP excluding inverters) $ MILLIONS
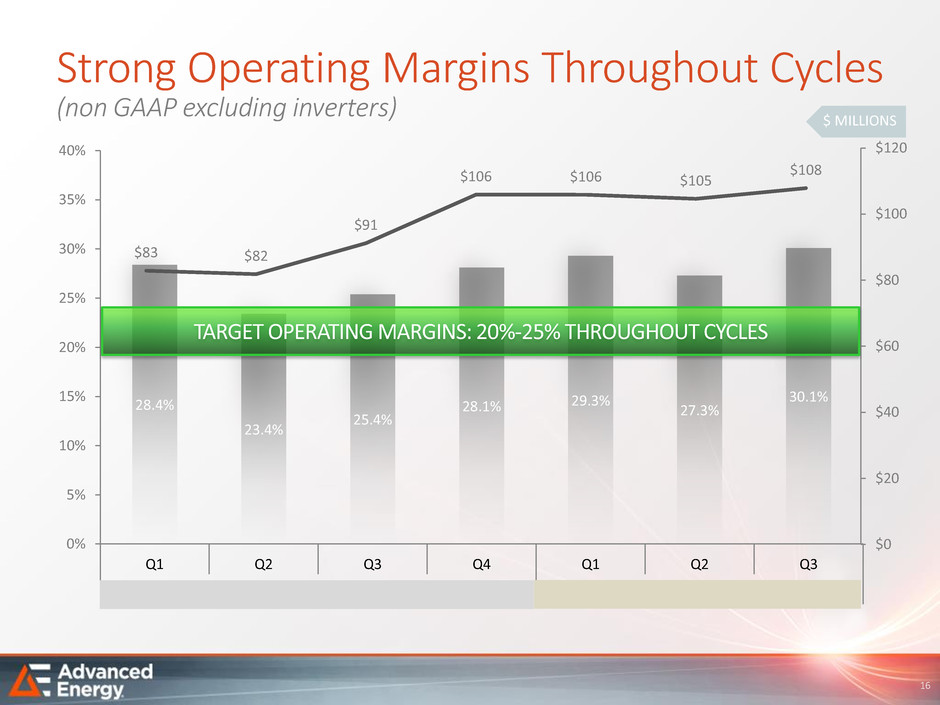
$83 $82 $91 $106 $106 $105 $108 $0 $20 $40 $60 $80 $100 $120 28.4% 23.4% 25.4% 28.1% 29.3% 27.3% 30.1% 0% 5% 10% 15% 20% 25% 30% 35% 40% Q1 Q2 Q3 Q4 Q1 Q2 Q3 2014 2015 16 Strong Operating Margins Throughout Cycles (non GAAP excluding inverters) $ MILLIONS TARGET OPERATING MARGINS: 20%-25% THROUGHOUT CYCLES
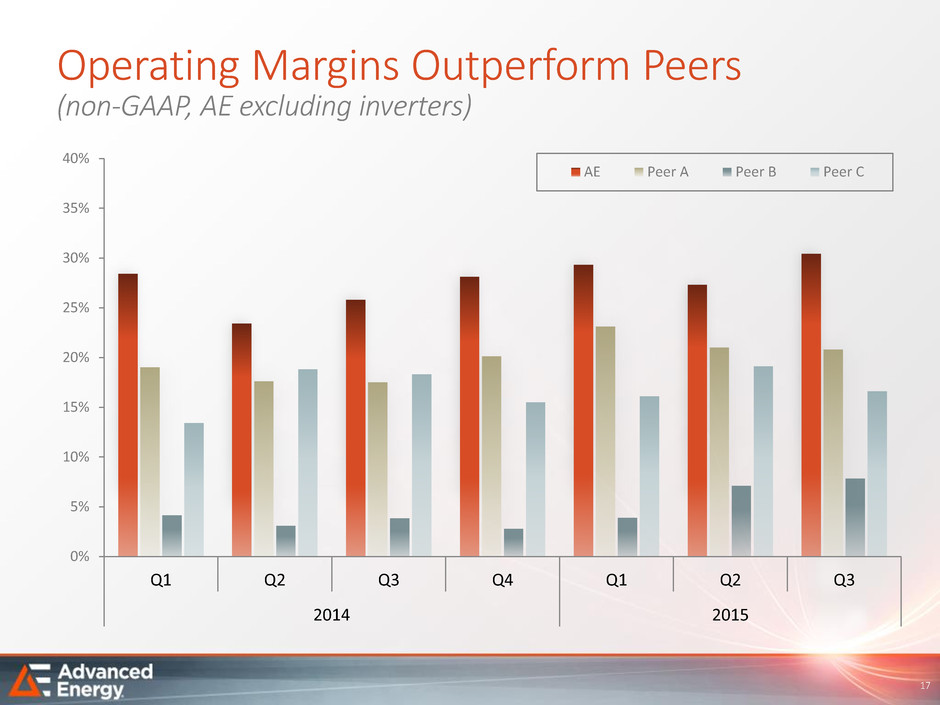
17 Operating Margins Outperform Peers (non-GAAP, AE excluding inverters) 0% 5% 10% 15% 20% 25% 30% 35% 40% Q1 Q2 Q3 Q4 Q1 Q2 Q3 2014 2015 AE Peer A Peer B Peer C
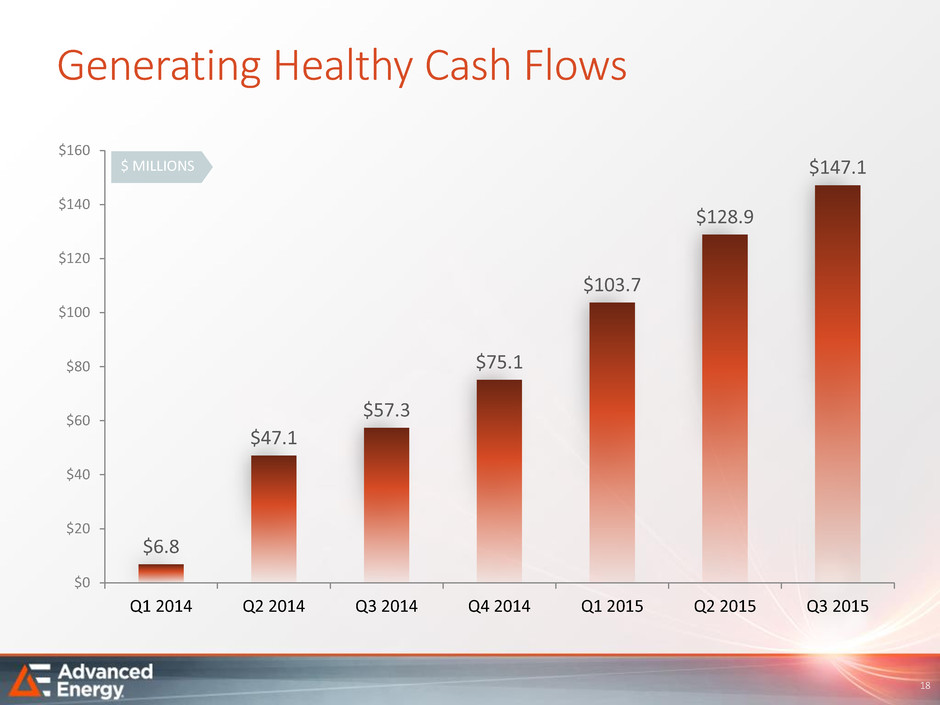
18 Generating Healthy Cash Flows $6.8 $47.1 $57.3 $75.1 $103.7 $128.9 $147.1 $0 $20 $40 $60 $80 $100 $120 $140 $160 Q1 2014 Q2 2014 Q3 2014 Q4 2014 Q1 2015 Q2 2015 Q3 2015 $ MILLIONS
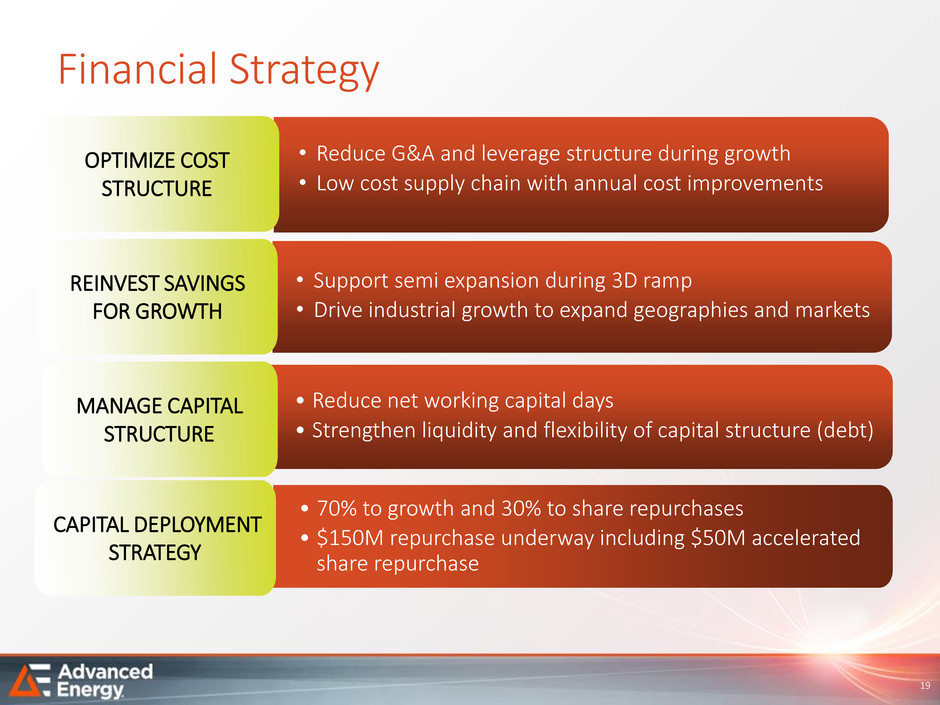
19 Financial Strategy • Support semi expansion during 3D ramp • Drive industrial growth to expand geographies and markets • Reduce net working capital days • Strengthen liquidity and flexibility of capital structure (debt) • 70% to growth and 30% to share repurchases • $150M repurchase underway including $50M accelerated share repurchase • Reduce G&A and leverage structure during growth • Low cost supply chain with annual cost improvements OPTIMIZE COST STRUCTURE REINVEST SAVINGS FOR GROWTH MANAGE CAPITAL STRUCTURE CAPITAL DEPLOYMENT STRATEGY
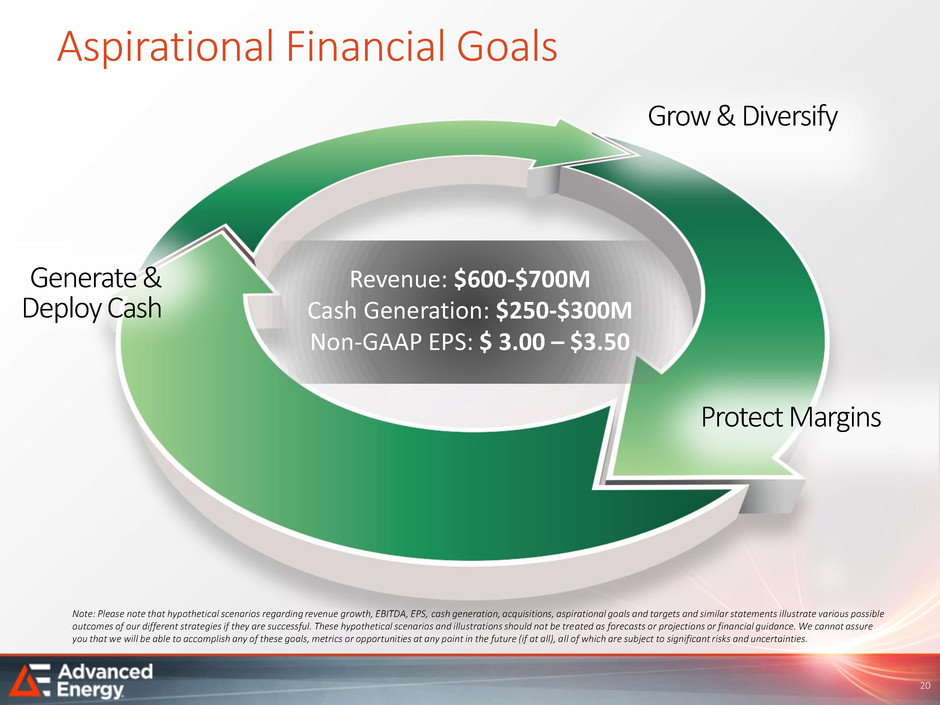
Aspirational Financial Goals Revenue: $600-$700M Cash Generation: $250-$300M Non-GAAP EPS: $ 3.00 – $3.50 Grow & Diversify Generate & Deploy Cash Protect Margins 20 Note: Please note that hypothetical scenarios regarding revenue growth, EBITDA, EPS, cash generation, acquisitions, aspirational goals and targets and similar statements illustrate various possible outcomes of our different strategies if they are successful. These hypothetical scenarios and illustrations should not be treated as forecasts or projections or financial guidance. We cannot assure you that we will be able to accomplish any of these goals, metrics or opportunities at any point in the future (if at all), all of which are subject to significant risks and uncertainties.

21 THANK YOU
