Attached files
| file | filename |
|---|---|
| EX-23 - EX-23 - PHX MINERALS INC. | phx-20150930xex23.htm |
| EX-99 - EX-99 - PHX MINERALS INC. | phx-20150930xex99.htm |
| EX-31.2 - EX-31.2 - PHX MINERALS INC. | phx-20150930xex312.htm |
| EX-32.2 - EX-32.2 - PHX MINERALS INC. | phx-20150930xex322.htm |
| EX-32.1 - EX-32.1 - PHX MINERALS INC. | phx-20150930xex321.htm |
| EX-31.1 - EX-31.1 - PHX MINERALS INC. | phx-20150930xex311.htm |
UNITED STATES
SECURITIES AND EXCHANGE COMMISSION
Washington, D.C. 20549
FORM 10-K

ANNUAL REPORT PURSUANT TO SECTION 13 OR 15(d) OF THE SECURITIES EXCHANGE ACT OF 1934
FOR THE FISCAL YEAR ENDED SEPTEMBER 30, 2015
Commission File Number:001-31759
PANHANDLE OIL AND GAS INC.
(Exact name of registrant as specified in its charter)
|
OKLAHOMA |
73-1055775 |
|
(State or other jurisdiction of incorporation |
(I.R.S. Employer Identification No.) |
|
or organization) |
|
|
|
|
|
Grand Centre, Suite 300, 5400 N. Grand Blvd., Oklahoma City, OK 73112 |
|
|
(Address of principal executive offices) |
(Zip code) |
|
|
|
|
Registrant's telephone number: (405) 948-1560 |
|
|
|
|
|
Securities registered under Section 12(b) of the Act: |
|
|
|
|
|
CLASS A COMMON STOCK (VOTING) |
NEW YORK STOCK EXCHANGE |
|
(Title of Class) |
(Name of each exchange on which registered) |
|
|
|
|
Securities registered under Section 12(g) of the Act: |
|
|
(Title of Class) |
|
|
|
|
|
CLASS B COMMON STOCK (NON-VOTING) $1.00 par value |
|
Indicate by check mark if the registrant is a well-known seasoned issuer, as defined in Rule 405 of the Securities Exchange Act of 1934. Yes X No
Indicate by check mark if the registrant is not required to file reports pursuant to Section 13 or Section 15(d) of the Securities Exchange Act of 1934. Yes X No
Indicate by check mark whether the registrant (1) has filed all reports required to be filed by Section 13 or 15(d) of the Securities Exchange Act of 1934 during the preceding 12 months (or for such shorter period that the registrant was required to file such reports), and (2) has been subject to such filing requirements for the past 90 days. X Yes No
(Facing Sheet Continued)
Indicate by check mark whether the registrant has submitted electronically and posted on its corporate Web site, if any, every Interactive Data File required to be submitted and posted pursuant to Rule 405 of Regulation S-T during the preceding 12 months (or for such shorter period) that the registrant was required to submit and post such files. X Yes No
Indicate by check mark if disclosure of delinquent filers pursuant to Item 405 of Regulation S-K (§229.405 of this chapter) is not contained herein, and will not be contained, to the best of the registrant’s knowledge, in definitive proxy or information statements incorporated by reference in Part III of this Form 10-K or any amendment to this Form 10-K.__
Indicate by check mark whether the registrant is a large accelerated filer, an accelerated filer, or a non-accelerated filer. See definition of “accelerated filer and large accelerated filer” in Rule 12b-2 of the Securities Exchange Act of 1934. (Check one):
Large accelerated filer___ Accelerated filer X Non-accelerated filer___ Smaller reporting company ___
Indicate by check mark whether the registrant is a shell company (as defined in Rule 12b-2 of the Securities Exchange Act of 1934). Yes X No
The aggregate market value of the voting stock held by non-affiliates of the registrant, computed by using the $19.79 per share closing price of registrant's Common Stock, as reported by the New York Stock Exchange at March 31, 2015, was $298,863,039. As of December 1, 2015, 16,560,381 shares of Class A Common Stock were outstanding.
Documents Incorporated By Reference
The information required by Part III of this Report, to the extent not set forth herein, is incorporated by reference from the registrant’s Definitive Proxy Statement relating to the annual meeting of stockholders to be held on March 10, 2016, which definitive proxy statement will be filed with the Securities and Exchange Commission within 120 days after the end of the fiscal year to which this Report relates.
T A B L E O F C O N T E N T S
|
PART I |
|
Page |
|
Item 1 |
1 | |
|
Item 1A |
11 | |
|
Item 1B |
13 | |
|
Item 2 |
13 | |
|
Item 3 |
22 | |
|
Item 4 |
22 | |
|
|
|
|
|
PART II |
|
|
|
Item 5 |
Market for Common Equity, Related Stockholder Matters and Issuer Purchases of Equity Securities |
23 |
|
Item 6 |
25 | |
|
Item 7 |
Management’s Discussion and Analysis of Financial Condition and Results of Operations |
26 |
|
Item 7A |
38 | |
|
Item 8 |
39 | |
|
Item 9 |
Changes in and Disagreements with Accountants on Accounting and Financial Disclosure |
77 |
|
Item 9A |
77 | |
|
Item 9B |
77 | |
|
|
|
|
|
PART III |
|
|
|
Item 10-14 |
77 | |
|
|
|
|
|
PART IV |
|
|
|
Item 15 |
Exhibits, Financial Statement Schedules and Reports on Form 8-K |
78 |
|
|
|
|
DEFINITIONS
The following defined terms are used in this report:
Bbl – barrel.
Bcf – billion cubic feet.
Bcfe – natural gas stated on a Bcf basis and crude oil and natural gas liquids converted to a billion cubic feet of natural gas equivalent by using the ratio of one million Bbl of crude oil or natural gas liquids to six Bcf of natural gas.
Board – board of directors.
BTU – British Thermal Units.
CEO – Chief Executive Officer.
CFO – Chief Financial Officer.
Company – Panhandle Oil and Gas Inc.
completion – the process of treating a drilled well followed by the installation of permanent equipment for the production of crude oil and/or natural gas.
conventional – an area believed to be capable of producing crude oil and natural gas occurring in discrete accumulations in structural and stratigraphic traps.
COO – Chief Operating Officer.
DD&A – depreciation, depletion and amortization.
developed acreage – the number of acres allocated or assignable to productive wells or wells capable of production.
development well – a well drilled within the proved area of a crude oil or natural gas reservoir to the depth of a stratigraphic horizon known to be productive.
dry gas – natural gas that remains in a gaseous state in the reservoir and does not produce large quantities of liquid hydrocarbons when brought to the surface. Also may refer to gas that has been processed or treated to remove all natural gas liquids.
dry hole – exploratory or development well that does not produce crude oil and/or natural gas in economically producible quantities.
ESOP – the Panhandle Oil and Gas Inc. Employee Stock Ownership and 401(k) Plan, a tax qualified, defined contribution plan.
exploratory well – a well drilled to find a new field or to find a new reservoir in a field previously found to be productive of crude oil or natural gas in another reservoir.
FASB – the Financial Accounting Standards Board.
field – an area consisting of a single reservoir or multiple reservoirs all grouped on, or related to, the same individual geological structural feature or stratigraphic condition. The field name refers to the surface area, although it may refer to both the surface and the underground productive formations.
formation – a layer of rock which has distinct characteristics that differs from nearby rock.
G&A – general and administrative expenses.
gross acres or gross wells – the total acres or wells in which a working interest is owned.
held by production or HBP – refers to an oil and gas lease continued into effect into its secondary term for so long as a producing oil and/or gas well is located on any portion of the leased premises or lands pooled therewith.
horizontal drilling – a drilling technique used in certain formations where a well is drilled vertically to a certain depth and then drilled horizontally within a specified interval.
hydraulic fracturing – a process involving the high pressure injection of water, sand and additives into rock formations to stimulate crude oil and natural gas production.
Independent Consulting Petroleum Engineer(s) or Independent Consulting Petroleum Engineering Firm – DeGolyer and MacNaughton of Dallas, Texas.
LOE – lease operating expense.
Mcf – thousand cubic feet.
Mcfd – thousand cubic feet per day.
Mcfe – natural gas stated on an Mcf basis and crude oil and natural gas liquids converted to a thousand cubic feet of natural gas equivalent by using the ratio of one Bbl of crude oil or natural gas liquids to six Mcf of natural gas.
Mmbtu – million BTU.
Mmcf – million cubic feet.
Mmcfe – natural gas stated on an Mmcf basis and crude oil and natural gas liquids converted to a million cubic feet of natural gas equivalent by using the ratio of one thousand Bbl of crude oil or natural gas liquids to six Mmcf of natural gas.
minerals, mineral acres or mineral interests – fee mineral acreage owned in perpetuity by the Company.
net acres or net wells – the sum of the fractional working interests owned in gross acres or gross wells.
NGL – natural gas liquids.
NYMEX – New York Mercantile Exchange.
OPEC – Organization of Petroleum Exporting Countries.
Panhandle – Panhandle Oil and Gas Inc.
PDP – proved developed producing.
play – term applied to identified areas with potential oil, NGL and/or natural gas reserves.
proved reserves – the quantities of crude oil and natural gas, which, by analysis of geoscience and engineering data, can be estimated with reasonable certainty to be economically producible from a given date forward, from known reservoirs and under existing economic conditions, operating methods, and government regulations prior to the time at which contracts providing the right to operate expire, unless evidence indicates renewal is reasonably certain.
proved developed reserves – reserves expected to be recovered through existing wells with existing equipment and operating methods.
proved undeveloped reserves or PUD – proved reserves expected to be recovered from new wells on undrilled acreage or from existing wells where a relatively major expenditure is required for recompletion.
PV-10 – estimated pre-tax present value of future net revenues discounted at 10% using SEC rules.
royalty interest – well interests in which the Company does not pay a share of the costs to drill, complete and operate a well, but receives a much smaller proportionate share (as compared to a working interest) of production.
SEC – the United States Securities and Exchange Commission.
unconventional – an area believed to be capable of producing crude oil and natural gas occurring in accumulations that are regionally extensive, but may lack readily apparent traps, seals and discrete hydrocarbonwater boundaries that typically define conventional reservoirs. These areas tend to have low permeability and may be closely associated with source rock, as is the case with oil and gas shale, tight oil and gas sands and coalbed methane, and generally require horizontal drilling, fracture stimulation treatments or other special recovery processes in order to achieve economic production.
undeveloped acreage – lease acreage on which wells have not been drilled or completed to a point that would permit the production of commercial quantities of crude oil and/or natural gas.
working interest – well interests in which the Company pays a share of the costs to drill, complete and operate a well and receives a proportionate share of production.
Fiscal year references
All references to years in this report, unless otherwise noted, refer to the Company’s fiscal year end of September 30. For example, references to 2015 mean the fiscal year ended September 30, 2015.
References to oil and natural gas properties
References to oil and natural gas properties inherently include NGL associated with such properties.
PART I
GENERAL
Panhandle Oil and Gas Inc. was founded in Range, Texas County, Oklahoma, in 1926, as Panhandle Cooperative Royalty Company and operated as a cooperative until 1979, when the Company merged into Panhandle Royalty Company, and its shares became publicly traded. On April 2, 2007, the Company’s name was changed to Panhandle Oil and Gas Inc.
While operating as a cooperative, the Company distributed most of its net income to shareholders as cash dividends. Upon conversion to a public company in 1979, although still paying dividends, the Company began to retain a substantial part of its cash flow to participate with a working interest in the drilling of wells on its mineral acreage and to purchase additional mineral acreage. Several acquisitions of additional mineral and leasehold acreage and small companies were made from 1980 to the present time.
The Company is involved in the acquisition, management and development of non-operated oil and natural gas properties, including wells located on the Company’s mineral and leasehold acreage. Panhandle’s mineral and leasehold properties are located primarily in Arkansas, New Mexico, North Dakota, Oklahoma and Texas, with properties also located in several other states. The majority of the Company’s oil, NGL and natural gas production is from wells located in Arkansas, Oklahoma and Texas.
In March 2007, the Company increased its authorized Class A Common Stock from 12 million shares to 24 million shares. On October 8, 2014, the Company split its Class A Common Stock on a 2-for-1 basis.
The Company’s office is located at Grand Centre, Suite 300, 5400 N. Grand Blvd., Oklahoma City, OK 73112; telephone – (405) 948-1560; facsimile – (405) 948-2038. The Company’s website is www.panhandleoilandgas.com.
The Company files periodic reports with the SEC on Forms 10-Q and 10-K. These forms, the Company’s annual report to shareholders and current press releases are available free of charge on our website as soon as reasonably practicable after they are filed with the SEC or made available to the public. Also, the Company posts copies of its various corporate governance documents on the website. From time to time, the Company posts other important disclosures to investors in the “Press Release” or “Upcoming Events” section of the website, as allowed by SEC rules.
Materials filed with the SEC may be read and copied at the SEC’s Public Reference Room at 100 F Street, N.E., Washington, D.C. 20549. Information on the operation of the Public Reference Room may be obtained by calling the SEC at 1-800-SEC-0330. The SEC also maintains an Internet website at www.sec.gov that contains reports, proxy and information statements, and other information regarding the Company that has been filed electronically with the SEC, including this Form 10-K.
(1)
BUSINESS STRATEGY
Most of Panhandle’s revenues are derived from the production and sale of oil, NGL and natural gas (see Item 8 - “Financial Statements and Supplementary Data”). The Company’s oil and natural gas properties, including its mineral acreage, leasehold acreage and working and royalty interests in producing wells are located mainly in Arkansas, New Mexico, North Dakota, Oklahoma and Texas (see Item 2 – “Properties”). Exploration and development of the Company’s oil and natural gas properties are conducted in association with oil and natural gas exploration and production companies, primarily larger independent companies. The Company does not operate any of its oil and natural gas properties, but has been an active working interest participant for many years in wells drilled on the Company’s mineral acres and leasehold. The majority of the Company’s drilling participations are on properties located in unconventional plays in Arkansas, Oklahoma and Texas.
PRINCIPAL PRODUCTS AND MARKETS
The Company’s principal products, in order of revenue generated, are natural gas, crude oil and NGL. These products are sold to various purchasers, including pipeline and marketing companies, which service the areas where the Company’s producing wells are located. Since the Company does not operate any of the wells in which it owns an interest, it relies on the operating expertise of numerous companies that operate wells in which the Company owns interests. This includes expertise in the drilling and completion of new wells, producing well operations and, in most cases, the marketing or purchasing of production from the wells. Natural gas and NGL sales are principally handled by the well operator. Payment for natural gas and NGL sold is received by the Company from the well operator or the contracted purchaser. Crude oil sales are handled by the well operator and payment for oil sold is received by the Company from the well operator or from the crude oil purchaser.
Prices of oil, NGL and natural gas are dependent on numerous factors beyond the control of the Company, including supply and demand, competition, weather, international events and circumstances, actions taken by OPEC, and economic, political and regulatory developments. Since demand for natural gas is subject to weather conditions, prices received for the Company’s natural gas production are subject to seasonal variations.
The Company enters into price risk management financial instruments (derivatives) to reduce the Company’s exposure to short-term fluctuations in the price of oil and natural gas. The derivative contracts apply only to a portion of the Company’s oil and natural gas production and provide only partial price protection against declines in oil and natural gas prices. These derivative contracts expose the Company to risk of financial loss and may limit the benefit of future increases in oil and natural gas prices. Please read Item 7A – “Quantitative and Qualitative Disclosures about Market Risk” and Note 1 to the financial statements included in Item 8 – “Financial Statements and Supplementary Data” for additional information regarding the derivative contracts.
COMPETITIVE BUSINESS CONDITIONS
The oil and natural gas industry is highly competitive, particularly in the search for new oil, NGL and natural gas reserves. Many factors affect Panhandle’s competitive position and the market for its products, which are beyond its control. Some of these factors include: the quantity and price of foreign oil imports; domestic supply of oil, NGL and natural gas; changes in prices received for oil, NGL and natural gas production; business and consumer demand for refined oil products, NGL and natural gas; and the effects of federal, state and local regulation of the exploration for, production of and sales of oil, NGL and natural gas (see Item 1A – “Risk Factors”). Changes in any of these factors can have a dramatic influence on the price Panhandle receives for its oil, NGL and natural gas production.
(2)
The Company does not operate any of the wells in which it has an interest; rather it relies on companies with greater resources, staff, equipment, research and experience for operation of wells in both the drilling and production phases. The Company’s business strategy is to use its strong financial base and its mineral and leasehold acreage ownership, coupled with its own geologic and economic evaluations, either to elect to participate in drilling operations with these companies or to lease or farmout its mineral or leasehold acreage while retaining a royalty interest. This strategy allows the Company to compete effectively in expensive and complex drilling operations it could not undertake on its own due to financial and personnel limitations.
SOURCES AND AVAILABILITY OF RAW MATERIALS
The existence of economically recoverable oil, NGL and natural gas reserves in commercial quantities is essential to the ultimate realization of value from the Company’s mineral and leasehold acreage. These mineral and leasehold properties are essentially the raw materials to our business. The production and sale of oil, NGL and natural gas from the Company’s properties are essential to provide the cash flow necessary to sustain the ongoing viability of the Company. The Company, from time to time, purchases oil and natural gas mineral and leasehold acreage to assure the continued availability of acreage with which to participate in exploration and development drilling operations and, subsequently, the production and sale of oil, NGL and natural gas. This participation in exploration, development and production activities and purchase of additional acreage is necessary to continue to supply the Company with the raw materials with which to generate additional cash flow. Mineral and leasehold acreage purchases are made from many owners. The Company does not rely on any particular companies or persons for the purchases of additional mineral and leasehold acreage.
MAJOR CUSTOMERS
The Company’s oil, NGL and natural gas production is sold, in most cases, through its well operators to many different purchasers. During 2015, sales through two separate well operators accounted for approximately 23% and 14% of the Company’s total oil, NGL and natural gas sales. During 2014, sales through two separate well operators accounted for approximately 17% and 11% of the Company’s total oil, NGL and natural gas sales. During 2013, sales through two separate well operators accounted for approximately 20% and 10% of the Company’s total oil, NGL and natural gas sales. Generally, if one purchaser declines to continue purchasing the Company’s production, several other purchasers can be located. Pricing is generally consistent from purchaser to purchaser.
PATENTS, TRADEMARKS, LICENSES, FRANCHISES AND ROYALTY AGREEMENTS
The Company does not own any patents, trademarks, licenses or franchises. Royalty agreements on wells producing oil, NGL and natural gas generate a portion of the Company’s revenues. These royalties are tied to ownership of mineral acreage, and this ownership is perpetual, unless sold by the Company. Royalties are due and payable to the Company whenever oil, NGL or natural gas is produced and sold from wells located on the Company’s mineral acreage.
REGULATION
All of the Company’s well interests and non-producing properties are located onshore in the contiguous United States, except for very minor foreign overriding royalty interests. The Company’s oil and natural gas properties are subject to various taxes, such as gross production taxes and, in some cases, ad valorem taxes.
States require permits for drilling operations, drilling bonds and reports concerning operations and impose other regulations relating to the exploration for and production of oil, NGL and natural gas. These states also have regulations addressing conservation matters, including provisions for the unitization or
(3)
pooling of oil and natural gas properties and the regulation of spacing, plugging and abandonment of wells. These regulations vary from state to state. As previously discussed, the Company must rely on its well operators to comply with governmental regulations.
ENVIRONMENTAL MATTERS
As the Company is directly involved in the extraction and use of natural resources, it is subject to various federal, state and local laws and regulations regarding environmental and ecological matters. Compliance with these laws and regulations may necessitate significant capital outlays. The Company does not believe the existence of these environmental laws, as currently written and interpreted, will materially hinder or adversely affect the Company’s business operations; however, there can be no assurances of future events or changes in laws, or the interpretation of laws, governing our industry. Current discussions regarding future governance of hydraulic fracturing and water disposal wells could have a material impact on the Company. Since the Company does not operate any wells in which it owns an interest, actual compliance with environmental laws is controlled by the well operators, with Panhandle being responsible for its proportionate share of the costs involved. As such, to its knowledge, the Company is not aware of any instances of non-compliance with existing laws and regulations. Absent an extraordinary event, any noncompliance is not likely to have a material adverse effect on the financial condition of the Company. Although the Company is not fully insured against all environmental risks, insurance coverage is maintained at levels which are customary in the industry.
EMPLOYEES
At September 30, 2015, Panhandle employed 21 people with 4 of the employees serving as executive officers. The President and CEO is also a director of the Company.
ITEM 1ARISK FACTORS
In addition to the other information included in this Form 10-K, the following risk factors should be considered in evaluating the Company’s business and future prospects. If any of the following risk factors should occur, the Company’s financial condition could be materially impacted, and the holders of our securities could lose part or all of their investment in Panhandle. The risk factors described below are not exhaustive, and investors are encouraged to perform their own investigation with respect to the Company and its business. Investors should also read the other information in this Form 10-K, including the financial statements and related notes.
Uncertainty of economic conditions, worldwide and in the United States, may have a significant negative effect on operating results, liquidity and financial condition.
Effects of change in domestic and international economic conditions could include: (1) an imbalance in supply and demand for oil, NGL and natural gas resulting in decreased oil, NGL and natural gas reserves due to curtailed drilling activity; (2) a decline in oil, NGL and natural gas prices; (3) risk of insolvency of well operators and oil, NGL and natural gas purchasers; (4) limited availability of certain insurance coverage; (5) limited access to derivative instruments; and (6) limited credit availability. A decline in reserves would lead to a decline in production, and either a production decline, or a decrease in oil, NGL and natural gas prices, would have a negative impact on the Company’s cash flow, profitability and value.
Oil, NGL and natural gas prices are volatile. Volatility in these prices can adversely affect operating results and the price of the Company’s common stock. This volatility also makes valuation of oil and natural gas producing properties difficult and can disrupt markets.
(4)
The supply of and demand for oil, NGL and natural gas impact the prices we realize on the sale of these commodities and, in turn, materially affect the Company’s financial results. Oil, NGL and natural gas prices have historically been, and will likely continue to be, volatile. The prices for oil, NGL and natural gas are subject to wide fluctuation in response to a number of factors, including:
|
· |
worldwide economic conditions |
|
· |
economic, political, regulatory and tax developments |
|
· |
market uncertainty |
|
· |
changes in the supply of and demand for oil, NGL and natural gas |
|
· |
availability and capacity of necessary transportation and processing facilities |
|
· |
commodity futures trading |
|
· |
regional price differentials |
|
· |
differing quality of oil produced (i.e., sweet crude versus heavy or sour crude) |
|
· |
differing quality and NGL content of natural gas produced |
|
· |
weather conditions |
|
· |
the level of imports and exports of oil, NGL and natural gas |
|
· |
political instability or armed conflicts in major oil and natural gas producing regions |
|
· |
actions taken by OPEC |
|
· |
competition from alternative sources of energy |
|
· |
technological advancements affecting energy consumption and energy supply |
Price volatility makes it difficult to budget and project the return on investment in exploration and development projects and to estimate with precision the value of producing properties that are owned or acquired by the Company. In addition, volatile prices often disrupt the market for oil and natural gas properties, as buyers and sellers have more difficulty agreeing on the purchase price of properties. Revenues, results of operations, reserves and capital availability may fluctuate significantly as a result of variations in oil, NGL and natural gas prices and production performance.
Lower oil, NGL and natural gas prices may also trigger significant impairment write-downs on a portion of the Company’s properties and negatively affect the Company’s results of operations and its ability to borrow under its credit facility.
A substantial decline in oil, NGL and natural gas prices for a prolonged period of time would have a material adverse effect on the Company.
The Company’s financial position, results of operations, access to capital and the quantities of oil, NGL and natural gas that may be economically produced would be negatively impacted if oil, NGL and natural gas prices decrease significantly for an extended period of time. The ways in which such price decreases could have a material negative effect include:
|
· |
significantly decrease the number of wells drilled by operators on the Company’s acreage, thereby reducing our production and cash flows |
|
· |
cash flow would be reduced, decreasing funds available for capital expenditures employed to replace reserves and maintain or increase production |
|
· |
future undiscounted and discounted net cash flows from producing properties would decrease, possibly resulting in impairment expense that may be significant |
|
· |
certain reserves may no longer be economic to produce, leading to lower proved reserves, production and cash flow |
|
· |
access to sources of capital, such as equity or long-term debt markets, could be severely limited or unavailable |
|
· |
the Company may incur a reduction in the borrowing base on its credit facility |
(5)
The Company cannot control activities on its properties.
The Company does not operate any of the properties in which it has an interest and has very limited ability to exercise influence over the third-party operators of these properties. Our dependence on the third-party operators of our properties, and on the cooperation of other working interest owners in these properties, could negatively affect the following:
|
· |
the Company’s return on capital used in drilling or property acquisition |
|
· |
the Company’s production and reserve growth rates |
|
· |
capital required to drill and complete wells |
|
· |
success and timing of drilling, development and exploitation activities on the Company’s properties |
|
· |
compliance with environmental, safety and other regulations |
|
· |
lease operating expenses |
|
· |
plugging and abandonment costs, including well-site restorations |
Dependency on each operator’s judgment, expertise and financial resources could result in unexpected future costs, lost revenues and/or capital restrictions to the extent they would cumulatively have a material adverse effect on the Company’s financial position and results of operations.
The Company’s derivative activities may reduce the cash flow received for oil and natural gas sales.
In order to manage exposure to price volatility on our oil and natural gas production, we enter into oil and natural gas derivative contracts for a portion of our expected production. Oil and natural gas price derivatives may limit the cash flow we actually realize and therefore reduce the Company’s ability to fund future projects. None of our oil and natural gas price derivative contracts are designated as hedges for accounting purposes; therefore, we record all derivative contracts at fair value on our balance sheet. Accordingly, these fair values may vary significantly from period to period, materially affecting reported earnings. The fair value of our oil and natural gas derivative instruments outstanding as of September 30, 2015, was a net asset of $4,210,764.
There is risk associated with our derivative contracts that involves the possibility that counterparties may be unable to satisfy contractual obligations to us. If any counterparty to our derivative instruments were to default or seek bankruptcy protection, it could subject a larger percentage of our future oil and natural gas production to commodity price changes and could have a negative effect on our ability to fund future projects.
There are also risks of financial loss associated with derivative instruments if there is an increase in the differential between the underlying price of the derivative contract and the actual received price.
Please read Item 7A – “Quantitative and Qualitative Disclosures about Market Risk” and Note 1 to the financial statements included in Item 8 – “Financial Statements and Supplementary Data” for additional information regarding derivative contracts.
Lower oil, NGL and natural gas prices or negative adjustments to oil, NGL and natural gas reserves may result in significant impairment charges.
The Company has elected to utilize the successful efforts method of accounting for its oil and natural gas exploration and development activities. Exploration expenses, including geological and geophysical costs, rentals and exploratory dry holes, are charged against income as incurred. Costs of
(6)
successful wells and related production equipment and development dry holes are capitalized and amortized by property using the unit-of-production method (the ratio of oil, NGL and natural gas volumes produced to total proved or proved developed reserves) as oil, NGL and natural gas are produced.
All long-lived assets, principally the Company’s oil and natural gas properties, are monitored for potential impairment when circumstances indicate that the carrying value of the asset on our books may be greater than its future net cash flows. The need to test a property for impairment may result from declines in oil, NGL and natural gas sales prices or unfavorable adjustments to oil, NGL and natural gas reserves. Also, once assets are classified as held for sale, they are reviewed for impairment. Because of the uncertainty inherent in these factors, the Company cannot predict when or if future impairment charges will be recorded. If an impairment charge is recognized, cash flow from operating activities is not impacted, but net income and, consequently, shareholders’ equity are reduced. In periods when impairment charges are incurred, it could have a material adverse effect on our results of operations. See Note 1 to the financial statements included in Item 8 – “Financial Statements and Supplemental Data” for further discussion on impairment under the heading “Depreciation, Depletion, Amortization and Impairment.”
Our estimated proved reserves are based on many assumptions that may prove to be inaccurate. Any inaccuracies in these reserve estimates or underlying assumptions may materially affect the quantities and present value of our reserves.
It is not possible to measure underground accumulations of oil, NGL and natural gas with precision. Oil, NGL and natural gas reserve engineering requires subjective estimates of underground accumulations of oil, NGL and natural gas using assumptions concerning future prices of these commodities, future production levels, and operating and development costs. In estimating our reserves, we and our Independent Consulting Petroleum Engineering Firm must make various assumptions with respect to many matters that may prove to be incorrect, including:
|
· |
future oil, NGL and natural gas prices |
|
· |
production rates |
|
· |
reservoir pressures, decline rates, drainage areas and reservoir limits |
|
· |
interpretation of subsurface conditions including geological and geophysical data |
|
· |
potential for water encroachment or mechanical failures |
|
· |
levels and timing of capital expenditures, lease operating expenses, production taxes and income taxes, and availability of funds for such expenditures |
|
· |
effects of government regulation |
If any of these assumptions prove to be incorrect, our estimates of reserves, the classifications of reserves based on risk of recovery and our estimates of the future net cash flows from our reserves could change significantly.
Our standardized measure of oil and natural gas reserves is calculated using the 12-month average price calculated as the unweighted arithmetic average of the first-day-of-the-month individual product prices for each month within the 12-month period prior to September 30. These prices and the operating costs in effect as of the date of estimation are held flat over the life of the properties. From this calculation of future estimated development, production and income tax expenses are deducted with the result discounted at 10% per annum to reflect the timing of future net revenue in accordance with the rules and regulations of the SEC. Over time, we may make material changes to reserve estimates to take into account changes in our assumptions and the results of actual development and production.
(7)
The reserve estimates made for fields that do not have a lengthy production history are less reliable than estimates for fields with lengthy production histories. A lack of production history may contribute to inaccuracy in our estimates of proved reserves, future production rates and the timing of development expenditures. Further, our lack of knowledge of all individual well information known to the well operators such as incomplete well stimulation efforts, restricted production rates for various reasons and up to date well production data, etc. may cause differences in our reserve estimates.
Because PUD reserves, under SEC reporting rules, may only be recorded if the wells they relate to are scheduled to be drilled within five years of the date of recording, the removal of PUD reserves that are not developed within this five-year period may be required. Removals of this nature may significantly reduce the quantity and present value of the Company’s oil, NGL and natural gas reserves.
Because forward-looking prices and costs are not used to estimate discounted future net cash flows from our estimated proved reserves, the standardized measure of our estimated proved reserves is not necessarily the same as the current market value of our estimated proved oil, NGL and natural gas reserves.
The timing of both our production and our incurrence of expenses in connection with the development and production of our properties will affect the timing of actual future net cash flows from proved reserves, and thus their actual present value. In addition, the 10% discount factor used when calculating discounted future net cash flows in compliance with the FASB statement on oil and natural gas producing activities disclosures may not be the most appropriate discount factor based on interest rates in effect from time to time and risks associated with the Company, or the oil and natural gas industry in general.
Failure to find or acquire additional reserves will cause reserves and production to decline materially from their current levels.
The rate of production from oil and natural gas properties generally declines as reserves are depleted. The Company’s proved reserves will decline materially as reserves are produced except to the extent that the Company acquires additional properties containing proved reserves, conducts additional successful exploration and development drilling, successfully applies new technologies or identifies additional behind-pipe zones (different productive zones within existing producing well bores) or secondary recovery reserves.
Drilling for oil and natural gas invariably involves unprofitable efforts, not only from dry wells, but also from wells that are productive but do not produce sufficient reserves to return a profit after deducting drilling, completion, operating and other costs. In addition, wells that are profitable may not achieve a targeted rate of return. The Company relies on third-party operators’ interpretation of seismic data and other advanced technologies in identifying prospects and in conducting exploration and development activities. Nevertheless, prior to drilling a well, the seismic data and other technologies used do not allow operators to know conclusively whether oil, NGL or natural gas is present in commercial quantities.
Cost factors can adversely affect the economics of any project, and ultimately the cost of drilling, completing and operating a well is controlled by well operators and existing market conditions. Further, drilling operations may be curtailed, delayed or canceled as a result of numerous factors, including:
|
· |
unexpected drilling conditions |
|
· |
title problems |
|
· |
pressure or irregularities in formations |
|
· |
equipment failures or accidents |
(8)
|
· |
fires, explosions, blowouts and surface cratering |
|
· |
lack of availability to market production via pipelines or other transportation |
|
· |
adverse weather conditions |
|
· |
environmental hazards or liabilities |
|
· |
lack of water disposal facilities |
|
· |
governmental regulations |
|
· |
cost and availability of drilling rigs, equipment and services |
|
· |
expected sales price to be received for oil, NGL or natural gas produced from the wells |
Oil and natural gas drilling and producing operations involve various risks.
The Company is subject to all the risks normally incident to the operation and development of oil and natural gas properties, including:
|
· |
well blowouts, cratering, explosions and human related accidents |
|
· |
mechanical, equipment and pipe failures |
|
· |
adverse weather conditions, earthquakes and other natural disasters |
|
· |
civil disturbances and terrorist activities |
|
· |
oil, NGL and natural gas price reductions |
|
· |
environmental risks stemming from the use, production, handling and disposal of water, waste materials, hydrocarbons and other substances into the air, soil or water |
|
· |
title problems |
|
· |
limited availability of financing |
|
· |
marketing related infrastructure, transportation and processing limitations |
|
· |
regulatory compliance issues |
As a non-operator, we are dependent on third-party operators and the contractors they hire for operational safety, environmental safety and compliance with regulations of governmental authorities.
The Company maintains insurance against many potential losses or liabilities arising from well operations in accordance with customary industry practices and in amounts believed by management to be prudent. However, this insurance does not protect the Company against all risks. For example, the Company does not maintain insurance for business interruption, acts of war or terrorism. Additionally, pollution and environmental risks generally are not fully insurable. These risks could give rise to significant uninsured costs that could have a material adverse effect on the Company’s business condition and financial results.
Debt level and interest rates may adversely affect our business.
The Company has a credit facility with a group of banks headed by Bank of Oklahoma (BOK) which consists of a revolving loan of $200,000,000. As of September 30, 2015, the Company had a balance of $65,000,000 drawn on the facility, with a borrowing base of $120,000,000. The facility has a current borrowing base of $100,000,000, is secured by certain of the Company’s properties and contains certain restrictive covenants.
Should the Company incur additional indebtedness under its credit facility to fund capital projects or for other reasons, there is risk of it adversely affecting our business operations as follows:
|
· |
cash flows from operating activities required to service indebtedness may not be available for other purposes |
|
· |
covenants contained in the Company’s borrowing agreement may limit our ability to borrow
(9) |
additional funds, pay dividends and make certain investments |
|
· |
any limitation on the borrowing of additional funds may affect our ability to fund capital projects and may also affect how we will be able to react to economic and industry changes |
|
· |
a significant increase in the interest rate on our credit facility will limit funds available for other purposes |
|
· |
changes in prevailing interest rates may affect the Company’s capability to meet its debt service requirements, as its credit facility bears interest at floating rates |
The borrowing base of our corporate revolving bank credit facility is subject to periodic redetermination and is based in part on oil, NGL and natural gas prices. A lowering of our borrowing base because of lower oil, NGL or natural gas prices, or for other reasons, could require us to repay indebtedness in excess of the newly established borrowing base, or we might need to further secure the debt with additional collateral. Our ability to meet any debt obligations depends on our future performance. General business, economic, financial and product pricing conditions, along with other factors, affect our future performance, and many of these factors are beyond our control. In addition, our failure to comply with the restrictive covenants relating to our credit facility could result in a default, which could adversely affect our business, financial condition, results of operations and cash flows.
Future legislative or regulatory changes may result in increased costs and decreased revenues, cash flows and liquidity.
Companies that operate wells in which Panhandle owns a working interest are subject to extensive federal, state and local regulation. Panhandle, as a working interest owner, is therefore indirectly subject to these same regulations. New or changed laws and regulations such as those described below could have a material adverse effect on our business.
Federal Income Taxation
Proposals to repeal the expensing of intangible drilling costs, repeal the percentage depletion allowance and increase the amortization period of geological and geophysical expenses, if enacted, would increase and accelerate the Company’s payment of federal income taxes. As a result, these changes would decrease the Company’s cash flows available for developing its oil and natural gas properties.
Hydraulic Fracturing and Water Disposal
The vast majority of oil and natural gas wells drilled in recent years have been, and future wells are expected to be, hydraulically fractured as a part of the process of completing the wells and putting them on production. This is true of the wells drilled in which the Company owns an interest. Hydraulic fracturing is a process that involves pumping water, sand and additives at high pressure into rock formations to stimulate oil and natural gas production. In developing plays where hydraulic fracturing, which requires large volumes of water, is necessary for successful development, the demand for water may exceed the supply. A lack of readily available water or a significant increase in the cost of water could cause delays or increased completion costs.
In addition to water, hydraulic fracturing fluid contains chemical additives designed to optimize production. Well operators are being required in certain states to disclose the components of these additives. Additional states and the federal government may follow with similar requirements or may restrict the use of certain additives. This could result in more costly or less effective development of wells.
(10)
Once a well has been hydraulically fractured, the fluid produced from the fractured wells must be either treated for reuse or disposed of by injecting the fluid into disposal wells. Injection well disposal processes have been, and continue to be, studied to determine if, or to the extent, there is a correlation between fracturing and/or injection well disposal and the occurrence of earthquakes. Some studies have concluded there is a correlation and this has resulted in the cessation of certain water disposal wells, especially in Oklahoma.
Efforts to regulate hydraulic fracturing and fluid disposal continue at the local, state and federal level. New regulations are being considered, including limiting water withdrawals and usage, limiting water disposition, restricting which additives may be used, implementing state-wide hydraulic fracturing moratoriums and temporary or permanent bans in certain environmentally sensitive areas. Public sentiment against hydraulic fracturing and fluid disposal and shale production could result in more stringent permitting and compliance requirements. Consequences of these actions could potentially increase capital, compliance and operating costs significantly, as well as delay or halt the further development of oil and gas reserves on the Company’s properties.
Any of the above factors could have a material adverse effect on our financial position, results of operations or cash flows.
Climate Change
Certain studies have suggested that emission of certain gases, commonly referred to as "greenhouse gases," may be impacting the earth's climate. Methane, the primary component of natural gas, and carbon dioxide, a by-product of burning oil and natural gas, are examples of greenhouse gases. Various state governments and regional organizations are considering enacting new legislation and promulgating new regulations governing or restricting the emission of greenhouse gases from stationary sources such as oil and gas production equipment and operations. At the federal level, the EPA has already made findings and issued regulations that require operators to establish and report an inventory of greenhouse gas emissions.
Legislative and regulatory proposals for restricting greenhouse gas emissions or otherwise addressing climate change could require us to incur additional operating costs and could adversely affect demand for the sale of oil and natural gas. The potential increase in our operating costs could include new or increased costs to obtain permits, operate and maintain equipment and facilities, install new emission controls on equipment and facilities, acquire allowances to authorize greenhouse gas emissions and pay taxes related to greenhouse gas emissions. Even without federal legislation or regulation of greenhouse gas emissions, states may pursue the issue either directly or indirectly.
Restrictions on emissions of methane or carbon dioxide that may be imposed in various states could adversely affect the oil and gas industry. Moreover, incentives to conserve energy or use alternative energy sources as a means of addressing climate change could reduce demand for oil and natural gas.
Shortages of oilfield equipment, services, qualified personnel and resulting cost increases could adversely affect results of operations.
The demand for qualified and experienced field personnel, geologists, geophysicists, engineers and other professionals in the oil and natural gas industry can fluctuate significantly, often in correlation with oil, NGL and natural gas prices, resulting in periodic shortages. When demand for rigs and equipment increases due to an increase in the number of wells being drilled, there have been shortages of drilling rigs, hydraulic fracturing equipment and personnel and other oilfield equipment. Higher oil, NGL
(11)
and natural gas prices generally stimulate increased demand for, and result in increased prices of, drilling rigs, crews and associated supplies, equipment and services. These shortages or price increases could negatively affect the ability to drill wells and conduct ordinary operations by the operators of the Company’s wells, resulting in an adverse effect on the Company’s financial condition, cash flow and operating results.
Competition in the oil and natural gas industry is intense, and most of our competitors have greater financial and other resources than we do.
We compete in the highly competitive areas of oil and natural gas acquisition, development, exploration and production. We face intense competition from both major and independent oil and natural gas companies to acquire desirable producing properties, new properties for future exploration and human resource expertise necessary to effectively develop properties. We also face similar competition in obtaining sufficient capital to maintain drilling rights in all drilling units.
A substantial number of our competitors have financial and other resources significantly greater than ours, and some of them are fully integrated oil and natural gas companies. These companies are able to pay more for development prospects and productive oil and natural gas properties and are able to define, evaluate, bid for, purchase and subsequently drill a greater number of properties and prospects than our financial or human resources permit, potentially reducing our ability to participate in drilling on certain of our acreage as a working interest owner. Our ability to develop and exploit our oil and natural gas properties and to acquire additional quality properties in the future will depend upon our ability to successfully evaluate, select and acquire suitable properties and join in drilling with reputable operators in this highly competitive environment.
Significant capital expenditures are required to replace our reserves and conduct our business.
The Company funds exploration, development and production activities primarily through cash flows from operations and acquisitions through borrowings under its credit facility. The timing and amount of capital necessary to carry out these activities can vary significantly as a result of product price fluctuations, property acquisitions, drilling results and the availability of drilling rigs, equipment, well services and transportation capacity.
Cash flows from operations and access to capital are subject to a number of variables, including the Company’s:
|
· |
amount of proved reserves |
|
· |
volume of oil, NGL and natural gas produced |
|
· |
received prices for oil, NGL and natural gas sold |
|
· |
ability to acquire and produce new reserves |
|
· |
ability to obtain financing |
We may have limited ability to obtain the capital required to sustain our operations at current levels if our borrowing base under our credit facility is lowered as a result of decreased revenues, lower product prices, declines in reserves or for other reasons. Failure to sustain operations at current levels could have a material adverse effect on our financial condition, cash flow and results of operations.
We may be subject to information technology system failures, network disruptions, cyber-attacks or other breaches in data security.
Power, telecommunication or other system failures due to hardware or software malfunctions, computer viruses, vandalism, terrorism, natural disasters, fire, human error or by other means could
(12)
significantly affect the Company’s ability to conduct its business. Though we have implemented complex network security measures, stringent internal controls and maintain offsite backup of all crucial electronic data, there cannot be absolute assurance that a form of system failure or data security breach will not have a material adverse effect on our financial condition and operations results.
ITEM 1BUNRESOLVED STAFF COMMENTS
None
At September 30, 2015, Panhandle’s principal properties consisted of (1) perpetual ownership of 255,411 net mineral acres, held principally in Arkansas, New Mexico, North Dakota, Oklahoma, Texas and six other states; (2) leases on 19,575 net acres primarily in Oklahoma: and (3) working interests, royalty interests, or both, in 6,195 producing oil and natural gas wells and 65 wells in the process of being drilled or completed.
Consistent with industry practice, the Company does not have current abstracts or title opinions on all of its mineral acreage and, therefore, cannot be certain that it has unencumbered title to all of these properties. In recent years, a few insignificant challenges have been made against the Company’s fee title to its acreage.
The Company pays ad valorem taxes on minerals owned in nine states.
ACREAGE
Mineral Interests Owned
The following table of mineral acreage owned reflects, in each respective state, the number of net and gross acres, net and gross producing acres, net and gross acres leased, and net and gross acres open (unleased) as of September 30, 2015.
|
State |
Net Acres |
Gross Acres |
Net Acres Producing (1) |
Gross Acres Producing (1) |
Net Acres Leased to Others (2) |
Gross Acres Leased to Others (2) |
Net Acres Open (3) |
Gross Acres Open (3) |
|||||||
|
Arkansas |
11,992 | 51,784 | 7,172 | 27,047 |
- |
- |
4,820 | 24,737 | |||||||
|
Colorado |
8,217 | 39,080 |
- |
- |
- |
- |
8,217 | 39,080 | |||||||
|
Florida |
3,832 | 8,212 |
- |
- |
- |
- |
3,832 | 8,212 | |||||||
|
Kansas |
3,082 | 11,816 | 144 | 1,200 |
- |
- |
2,938 | 10,616 | |||||||
|
Montana |
1,008 | 17,947 |
- |
- |
- |
- |
1,008 | 17,947 | |||||||
|
New Mexico |
57,374 | 174,300 | 1,366 | 6,965 | 160 | 320 | 55,848 | 167,015 | |||||||
|
North Dakota |
11,179 | 64,286 | 190 | 2,196 |
- |
- |
10,989 | 62,090 | |||||||
|
Oklahoma |
113,442 | 952,637 | 42,252 | 341,468 | 3,564 | 19,700 | 67,626 | 591,469 | |||||||
|
South Dakota |
1,825 | 9,300 |
- |
- |
- |
- |
1,825 | 9,300 | |||||||
|
Texas |
43,433 | 362,317 | 5,306 | 51,035 | 3,159 | 18,134 | 34,968 | 293,148 | |||||||
|
Other |
27 | 262 |
- |
- |
- |
- |
27 | 262 | |||||||
|
Total: |
255,411 | 1,691,941 | 56,430 | 429,911 | 6,883 | 38,154 | 192,098 | 1,223,876 |
|
(1) |
“Producing” represents the mineral acres in which Panhandle owns a royalty or working interest in a producing well. |
|
(2) |
“Leased” represents the mineral acres owned by Panhandle that are leased to third parties but not producing. |
|
(3) |
“Open” represents mineral acres owned by Panhandle that are not leased or in production. |
(13)
Leases
The following table reflects net mineral acres leased from others, lease expiration dates, and net leased acres held by production as of September 30, 2015.
|
State |
Net Acres |
Net Acres Expiring |
Net Acres Held by Production |
||||
| 2016 | 2017 | 2018 | 2019 | 2020 | |||
|
Arkansas |
2,186 |
- |
27 | 92 |
- |
- |
2,067 |
|
Kansas |
2,117 |
- |
- |
- |
- |
- |
2,117 |
|
Oklahoma |
11,837 |
- |
- |
- |
- |
- |
11,837 |
|
Texas |
2,352 |
- |
- |
- |
- |
- |
2,352 |
|
Other |
1,083 |
- |
- |
- |
- |
- |
1,083 |
|
TOTAL |
19,575 |
- |
27 | 92 |
- |
- |
19,456 |
PROVED RESERVES
The following table summarizes estimates of proved reserves of oil, NGL and natural gas held by Panhandle as of September 30, 2015. All proved reserves are located onshore within the contiguous United States and are principally made up of small interests in 6,195 wells, which are predominately located in the Mid-Continent region. Other than this report, the Company’s reserve estimates are not filed with any other federal agency.
|
Barrels of Oil |
Barrels of NGL |
Mcf of Natural Gas |
Mcfe |
|||||
|
Net Proved Developed Reserves |
||||||||
|
September 30, 2015 |
2,725,077 | 1,466,834 | 82,899,159 | 108,050,625 | ||||
|
September 30, 2014 |
2,890,678 | 1,564,859 | 88,512,767 | 115,245,989 | ||||
|
September 30, 2013 |
1,037,721 | 764,321 | 82,298,833 | 93,111,085 | ||||
|
Net Proved Undeveloped Reserves |
||||||||
|
September 30, 2015 |
4,313,353 | 1,453,766 | 37,314,885 | 71,917,599 | ||||
|
September 30, 2014 |
4,678,901 | 1,475,322 | 53,979,593 | 90,904,931 | ||||
|
September 30, 2013 |
605,582 | 851,805 | 49,990,334 | 58,734,656 | ||||
|
Net Total Proved Reserves |
||||||||
|
September 30, 2015 |
7,038,430 | 2,920,600 | 120,214,044 | 179,968,224 | ||||
|
September 30, 2014 |
7,569,579 | 3,040,181 | 142,492,360 | 206,150,920 | ||||
|
September 30, 2013 |
1,643,303 | 1,616,126 | 132,289,167 | 151,845,741 |
The 26.2 Bcfe decrease in total proved reserves from 2014 to 2015 is primarily a combination of the following factors:
|
· |
Negative pricing revisions of 44.8 Bcfe resulting from: |
|
a) |
12.4 Bcfe of negative proved developed revisions primarily due to wells reaching their projected economic limits much earlier than projected in 2014. |
(14)
|
b) |
32.4 Bcfe of negative proved undeveloped revisions principally attributable to the removal of dry gas reserves in the Fayetteville Shale which are no longer projected to be developed within five years from the date they were added to the proved undeveloped reserves due to low commodity prices. |
|
· |
Positive performance revisions of .7 Bcfe. |
|
· |
Proved developed reserve extensions, discoveries and other additions of 4.5 Bcfe principally resulting from: |
a)The Company’s participation in ongoing development of unconventional natural gas utilizing horizontal drilling in the Arkansas Fayetteville Shale.
b)The Company’s participation in ongoing development of conventional oil, NGL and natural gas plays including the Granite Wash play in western Oklahoma as well as minor activity in other areas.
c)The Company’s participation in ongoing development of unconventional oil, NGL and natural gas plays utilizing horizontal drilling in the Woodford Shale in western and southern Oklahoma as well as minor activity in other areas.
|
· |
The addition of 27.1 Bcfe of PUD reserves principally in the Anadarko Basin Woodford and Springer Shales in western and southern Oklahoma and the Eagle Ford Shale in South Texas. These additions result from reservoir delineation that occurred through continuing development and additional well performance data in each of the referenced plays. |
|
· |
Production of 13.7 Bcfe. |
The following details the changes in proved undeveloped reserves for 2015 (Mcfe):
|
Beginning proved undeveloped reserves |
90,904,931 |
|
Proved undeveloped reserves transferred to proved developed |
(13,642,311) |
|
Revisions |
(32,417,179) |
|
Extensions and discoveries |
27,072,158 |
|
Purchases |
- |
|
Ending proved undeveloped reserves |
71,917,599 |
Beginning PUD reserves were 90.9 Bcfe. A total of 13.6 Bcfe (15% of the beginning balance) were transferred to proved developed producing during 2015. The 32.4 Bcfe (36% of the beginning balance) of negative revisions to PUD reserves was a negative pricing revision. A total of 46.1 Bcfe (51% of the beginning balance) of PUD reserves were moved out of the category during 2015 as either a result of being transferred to proved developed or removed due to low commodity prices. No PUD locations from 2010 and 2011 remain in the PUD category and there are only nine remaining PUD locations from 2012. The Company’s total PUD locations decreased from 788 in 2014 to 409 in 2015. We anticipate that all the Company’s PUD locations will be drilled and converted to PDP within five years of the date they were added. However, PUD locations and associated reserves which are no longer projected to be drilled within five years from the date they were added to the proved undeveloped reserves will be removed as revisions at the time that determination is made, and in the event that there are undrilled PUD locations at the end of the five-year period, it is our intent to remove the reserves associated with those locations from our proved reserves as revisions. There were 27.1 Bcfe of PUD reserve additions principally in the Anadarko Basin Woodford and Springer shales in western and southern Oklahoma and the Eagle Ford
(15)
Shale in South Texas. These additions result from reservoir delineation that occurred through continuing development and additional well performance data in each of the referenced plays.
The determination of reserve estimates is a function of testing and evaluating the production and development of oil and natural gas reservoirs in order to establish a production decline curve. The established production decline curves, in conjunction with oil and natural gas prices, development costs, production taxes and operating expenses, are used to estimate oil and natural gas reserve quantities and associated future net cash flows. As information is processed regarding the development of individual reservoirs, and as market conditions change, estimated reserve quantities and future net cash flows will change over time as well. Estimated reserve quantities and future net cash flows are affected by changes in product prices. These prices have varied substantially in recent years and are expected to vary substantially from current pricing in the future.
The Company follows the SEC’s modernized oil and natural gas reporting rules, which were effective for annual reports on Form 10−K for fiscal years ending on or after December 31, 2009. See Note 11 to the financial statements in Item 8 – “Financial Statements and Supplementary Data” for disclosures regarding our oil and natural gas reserves.
Proved oil and natural gas reserves are those quantities of oil and natural gas which, by analysis of geoscience and engineering data, can be estimated with reasonable certainty to be economically producible – from a given date forward, from known reservoirs, and under existing economic conditions, operating methods, and government regulations – prior to the time at which contracts providing the right to operate expire, unless evidence indicates that renewal is reasonably certain, regardless of whether deterministic or probabilistic methods are used for the estimation. The project to extract the hydrocarbons must have commenced, or the operator must be reasonably certain that it will commence the project within a reasonable time. The area of the reservoir considered as proved includes: (i) the area identified by drilling and limited by fluid contacts, if any, and (ii) adjacent undrilled portions of the reservoir that can, with reasonable certainty, be judged to be continuous with it and to contain economically producible oil or natural gas on the basis of available geoscience and engineering data. In the absence of data on fluid contacts, proved quantities in a reservoir are limited by the lowest known hydrocarbons as seen in a well penetration unless geoscience, engineering or performance data and reliable technology establishes a lower contact with reasonable certainty. Where direct observation from well penetrations has defined a highest known oil elevation and the potential exists for an associated natural gas cap, proved oil reserves may be assigned in the structurally higher portions of the reservoir only if geoscience, engineering or performance data and reliable technology establish the higher contact with reasonable certainty. Reserves, which can be produced economically through application of improved recovery techniques (including, but not limited to, fluid injection), are included in the proved classification when: (i) successful testing by a pilot project in an area of the reservoir with properties no more favorable than in the reservoir as a whole, the operation of an installed program in the reservoir or an analogous reservoir, or other evidence using reliable technology establishes the reasonable certainty of the engineering analysis on which the project or program was based; and (ii) the project has been approved for development by all necessary parties and entities, including governmental entities. Existing economic conditions include prices and costs at which economic producibility from a reservoir is to be determined. The price shall be the average price during the 12-month period prior to the ending date of the period covered by the report, determined as an unweighted arithmetic average of the first-day-of-the-month price for each month within such period, unless prices are defined by contractual arrangements, excluding escalations based upon future conditions.
Developed oil and natural gas reserves are reserves of any category that can be expected to be recovered through existing wells with existing equipment and operating methods, or in which the cost of the required equipment is relatively minor compared to the cost of a new well, and through installed extraction equipment and infrastructure operational at the time of the reserve estimate, if the extraction is by means not involving a well.
(16)
Undeveloped oil and natural gas reserves are reserves of any category that are expected to be recovered from new wells on undrilled acreage or from existing wells where a relatively major expenditure is required for recompletion. Reserves on undrilled acreage are limited to those directly offsetting development spacing areas that are reasonably certain of production when drilled, unless evidence using reliable technology exists that establishes reasonable certainty of economic producibility at greater distances. Undrilled locations can be classified as having undeveloped reserves only if a development plan has been adopted indicating that they are scheduled to be drilled within five years, unless the specific circumstances justify a longer time. Under no circumstances shall estimates for undeveloped reserves be attributable to any acreage for which an application of fluid injection or other improved recovery technique is contemplated, unless such techniques have been proved effective by actual projects in the same reservoir or an analogous reservoir or by other evidence using reliable technology establishing reasonable certainty.
The independent consulting petroleum engineering firm of DeGolyer and MacNaughton of Dallas, Texas, calculated the Company’s oil, NGL and natural gas reserves as of September 30, 2015, 2014 and 2013 (see Exhibits 23 and 99).
The Company’s net proved oil, NGL and natural gas reserves (including certain undeveloped reserves described above) are located onshore in the contiguous United States. All studies have been prepared in accordance with regulations prescribed by the SEC. The reserve estimates were based on economic and operating conditions existing at September 30, 2015, 2014 and 2013. Since the determination and valuation of proved reserves is a function of testing and estimation, the reserves presented should be expected to change as future information becomes available.
ESTIMATED FUTURE NET CASH FLOWS
Set forth below are estimated future net cash flows with respect to Panhandle’s net proved reserves (based on the estimated units set forth above in Proved Reserves) for the year indicated, and the present value of such estimated future net cash flows, computed by applying a 10% discount factor as required by SEC rules and regulations. The Company follows the SEC Rule, Modernization of Oil and Gas Reporting Requirements. In accordance with the SEC rule, the estimated future net cash flows were computed using the 12-month average price calculated as the unweighted arithmetic average of the first-day-of-the-month individual product prices for each month within the 12-month period prior to September 30 held flat over the life of the properties and applied to future production of proved reserves less estimated future development and production expenditures for these reserves. The amounts presented are net of operating costs and production taxes levied by the respective states. Prices used for determining future cash flows from oil, NGL and natural gas as of September 30, 2015, 2014 and 2013 were as follows: $55.27/Bbl, $19.10/Bbl, $2.84/Mcf; $96.94/Bbl, $31.45/Bbl, $4.04/Mcf; $89.06/Bbl, $27.28/Bbl, $3.33/Mcf, respectively. These future net cash flows based on SEC pricing rules should not be construed as the fair market value of the Company’s reserves. A market value determination would need to include many additional factors, including anticipated oil, NGL and natural gas price and production cost increases or decreases, which could affect the economic life of the properties.
(17)
|
Estimated Future Net Cash Flows |
||||||||
|
9/30/2015 |
9/30/2014 |
9/30/2013 |
||||||
|
Proved Developed |
$ |
233,189,810 |
$ |
451,452,075 |
$ |
239,353,059 | ||
|
Proved Undeveloped |
116,314,237 | 383,970,247 | 123,822,641 | |||||
|
Income Tax Expense |
(123,007,909) | (308,149,182) | (131,397,192) | |||||
|
Total Proved |
$ |
226,496,138 |
$ |
527,273,140 |
$ |
231,778,508 | ||
|
10% Discounted Present Value of Estimated Future Net Cash Flows |
||||||||
|
9/30/2015 |
9/30/2014 |
9/30/2013 |
||||||
|
Proved Developed |
$ |
126,295,752 |
$ |
234,799,797 |
$ |
125,186,445 | ||
|
Proved Undeveloped |
17,948,482 | 135,228,020 | 51,276,694 | |||||
|
Income Tax Expense |
(62,653,023) | (165,245,313) | (74,788,243) | |||||
|
Total Proved |
$ |
81,591,211 |
$ |
204,782,504 |
$ |
101,674,896 | ||
OIL, NGL AND NATURAL GAS PRODUCTION
The following table sets forth the Company’s net production of oil, NGL and natural gas for the fiscal periods indicated.
|
Year Ended |
Year Ended |
Year Ended |
|||
|
9/30/2015 |
9/30/2014 |
9/30/2013 |
|||
|
Bbls - Oil |
453,125 | 346,387 | 234,084 | ||
|
Bbls - NGL |
210,960 | 207,688 | 111,897 | ||
|
Mcf - Natural Gas |
9,745,223 | 10,773,559 | 10,886,329 | ||
|
Mcfe |
13,729,733 | 14,098,009 | 12,962,215 |
AVERAGE SALES PRICES AND PRODUCTION COSTS
The following tables set forth unit price and cost data for the fiscal periods indicated.
|
Year Ended |
Year Ended |
Year Ended |
||||||
|
Average Sales Price |
9/30/2015 |
9/30/2014 |
9/30/2013 |
|||||
|
Per Bbl, Oil |
$ |
53.12 |
$ |
93.68 |
$ |
91.56 | ||
|
Per Bbl, NGL |
$ |
18.25 |
$ |
32.31 |
$ |
27.67 | ||
|
Per Mcf, Natural Gas |
$ |
2.73 |
$ |
4.05 |
$ |
3.31 | ||
|
Per Mcfe |
$ |
3.97 |
$ |
5.88 |
$ |
4.68 | ||
|
Year Ended |
Year Ended |
Year Ended |
||||||
|
Average Production (lifting) Costs |
9/30/2015 |
9/30/2014 |
9/30/2013 |
|||||
|
(Per Mcfe) |
||||||||
|
Well Operating Costs (1) |
$ |
1.27 |
$ |
0.99 |
$ |
0.92 | ||
|
Production Taxes (2) |
0.12 | 0.19 | 0.14 | |||||
|
$ |
1.39 |
$ |
1.18 |
$ |
1.06 | |||
(1)Includes actual well operating costs, compression, handling and marketing fees paid on natural gas sales and other minor expenses associated with well operations.
(18)
(2)Includes production taxes only.
In fiscal 2015, approximately 26% of the Company’s oil, NGL and natural gas revenue was generated from royalty payments received on its mineral acreage. Royalty interests bear no share of the operating costs on those producing wells.
GROSS AND NET PRODUCTIVE WELLS AND DEVELOPED ACRES
The following table sets forth Panhandle’s gross and net productive oil and natural gas wells as of September 30, 2015. Panhandle owns either working interests, royalty interests or both in these wells. The Company does not operate any wells.
|
Gross Working Interest Wells |
Net Working Interest Wells |
Gross Royalty Only Wells |
Total Gross Wells |
|||||
|
Oil |
373 | 28.82 | 1,039 | 1,412 | ||||
|
Natural Gas |
1,874 | 85.06 | 2,909 | 4,783 | ||||
|
Total |
2,247 | 113.88 | 3,948 | 6,195 |
Panhandle’s average interest in royalty interest only wells is 0.81%. Panhandle’s average interest in working interest wells is 5.07% working interest and 4.79% net revenue interest.
Information on multiple completions is not available from Panhandle’s records, but the number is not believed to be significant. With regard to Gross Royalty Only Wells, some of these wells are in multi-well unitized fields. In such cases, the Company’s ownership in each unitized field is counted as one gross well as the Company does not have access to the actual well count in all of these unitized fields.
As of September 30, 2015, Panhandle owned 429,911 gross developed mineral acres and 56,430 net developed mineral acres. Panhandle has also leased from others 147,548 gross developed acres containing 19,456 net developed acres.
UNDEVELOPED ACREAGE
As of September 30, 2015, Panhandle owned 1,262,030 gross and 198,981 net undeveloped mineral acres, and leases on 6,643 gross and 119 net undeveloped acres.
DRILLING ACTIVITY
The following net productive development, exploratory and purchased wells and net dry development, exploratory and purchased wells in which the Company had either a working interest, a royalty interest or both were drilled and completed during the fiscal years indicated.
(19)
|
Net Productive |
Net Productive |
Net Dry |
||||
|
Working Interest Wells |
Royalty Interest Wells |
Working Interest Wells |
||||
|
Development Wells |
||||||
|
Fiscal years ended: |
||||||
|
September 30, 2015 |
5.349843 |
1.372020 |
- |
|||
|
September 30, 2014 |
6.375382 |
1.215322 |
0.026849 |
|||
|
September 30, 2013 |
7.405905 |
1.532470 |
0.003906 |
|||
|
Exploratory Wells |
||||||
|
Fiscal years ended: |
||||||
|
September 30, 2015 |
0.188489 |
0.060184 |
- |
|||
|
September 30, 2014 |
0.141038 |
0.026367 |
- |
|||
|
September 30, 2013 |
- |
0.079589 |
0.048446 |
|||
|
Purchased Wells |
||||||
|
Fiscal years ended: |
||||||
|
September 30, 2015 |
- |
- |
- |
|||
|
September 30, 2014 |
11.644719 |
- |
- |
|||
|
September 30, 2013 |
- |
0.218122 |
- |
PRESENT ACTIVITIES
The following table sets forth the gross and net oil and natural gas wells drilling or testing as of September 30, 2015, in which Panhandle owns either a working interest, a royalty interest or both. These wells were not producing at September 30, 2015.
|
Gross Working Interest Wells |
Net Working Interest Wells |
Gross Royalty Only Wells |
Total Gross Wells |
|||||
|
Oil |
16 |
0.28 |
22 |
38 |
||||
|
Natural Gas |
13 |
0.11 |
14 |
27 |
OTHER FACILITIES
The Company has a lease on 12,369 square feet of office space in Oklahoma City, Oklahoma, which ends April 30, 2020.
SAFE HARBOR STATEMENT
This report, including information included in, or incorporated by reference from, future filings by the Company with the SEC, as well as information contained in written material, press releases and oral statements, contains, or may contain, certain statements that are “forward-looking statements,” within the meaning of the federal securities laws. All statements, other than statements of historical facts, included or incorporated by reference in this report, which address activities, events or developments which are expected to, or anticipated will, or may, occur in the future, are forward-looking statements. The words “believes,” “intends,” “expects,” “anticipates,” “projects,” “estimates,” “predicts” and similar expressions are used to identify forward-looking statements.
These forward-looking statements include, among others, such things as: the amount and nature of our future capital expenditures; wells to be drilled or reworked; prices for oil, NGL and natural gas; demand for oil, NGL and natural gas; estimates of proved oil, NGL and natural gas reserves;
(20)
development and infill drilling potential; drilling prospects; business strategy; production of oil, NGL and natural gas reserves; and expansion and growth of our business and operations.
These statements are based on certain assumptions and analyses made by the Company in light of experience and perception of historical trends, current conditions and expected future developments as well as other factors believed appropriate in the circumstances. However, whether actual results and development will conform to our expectations and predictions is subject to a number of risks and uncertainties, which could cause actual results to differ materially from our expectations.
One should not place undue reliance on any of these forward-looking statements. The Company does not currently intend to update forward-looking information and to release publicly the results of any future revisions made to forward-looking statements to reflect events or circumstances, which reflect the occurrence of unanticipated events, after the date of this report.
In order to provide a more thorough understanding of the possible effects of some of these influences on any forward-looking statements made, the following discussion outlines certain factors that in the future could cause results for 2016 and beyond to differ materially from those that may be presented in any such forward-looking statement made by or on behalf of the Company.
Commodity Prices. The prices received for oil, NGL and natural gas production have a direct impact on the Company’s revenues, profitability and cash flows, as well as the ability to meet its projected financial and operational goals. The prices for crude oil, NGL and natural gas are dependent on a number of factors beyond the Company’s control, including: the supply and demand for oil, NGL and natural gas; weather conditions in the continental United States (which can greatly influence the demand for natural gas at any given time as well as the price we receive for such natural gas); and the ability of current distribution systems in the United States to effectively meet the demand for oil, NGL and natural gas at any given time, particularly in times of peak demand, which may result because of adverse weather conditions.
Oil prices are sensitive to foreign influences based on political, social or economic factors, any one of which could have an immediate and significant effect on the price and supply of oil. In addition, prices of both natural gas and oil are becoming more and more influenced by trading on the commodities markets, which has, at times, increased the volatility associated with these prices.
Uncertainty of Oil, NGL and Natural Gas Reserves. There are numerous uncertainties inherent in estimating quantities of proved reserves and their values, including many factors beyond the Company’s control. The oil, NGL and natural gas reserve data included in this report represents only an estimate of these reserves. Oil and natural gas reservoir engineering is a subjective and inexact process of estimating underground accumulations of oil, NGL and natural gas that cannot be measured in an exact manner. Estimates of economically recoverable oil, NGL and natural gas reserves depend on a number of variable factors, including historical production from the area compared with production from other producing areas and assumptions concerning future oil, NGL and natural gas prices, future operating costs, severance and excise taxes, development costs, and workover and remedial costs.
Some or all of these assumptions may vary considerably from actual results. For these reasons, estimates of the economically recoverable quantities of oil, NGL and natural gas and estimates of the future net cash flows from oil, NGL and natural gas reserves prepared by different engineers or by the same engineers but at different times may vary substantially. Accordingly, oil, NGL and natural gas reserve estimates may be subject to periodic downward or upward adjustments. Actual production, revenues and expenditures with respect to oil, NGL and natural gas reserves will vary from estimates, and those variances can be material.
(21)
The Company does not operate any of the properties in which it has an interest and has very limited ability to exercise influence over operations for these properties or their associated costs. Dependence on the operator and other working interest owners for these projects and the limited ability to influence operations and associated costs could materially and adversely affect the realization of targeted returns on capital in drilling or acquisition activities and targeted production growth rates.
The information regarding discounted future net cash flows included in this report is not necessarily the current market value of the estimated oil, NGL and natural gas reserves attributable to the Company’s properties. As required by the SEC, the estimated discounted future net cash flows from proved oil, NGL and natural gas reserves are determined based on the fiscal year’s 12-month average of the first-day-of-the-month individual product prices and costs as of the date of the estimate. Actual future prices and costs may be materially higher or lower. Actual future net cash flows are also affected, in part, by the amount and timing of oil, NGL and natural gas production, supply and demand for oil, NGL and natural gas and increases or decreases in consumption.
In addition, the 10% discount factor required by the SEC used in calculating discounted future net cash flows for reporting purposes is not necessarily the most appropriate discount factor based on interest rates in effect from time to time and the risks associated with operations of the oil and natural gas industry in general.
There were no material legal proceedings involving Panhandle on September 30, 2015, or at the date of this report.
Not applicable.
(22)
PART II
ITEM 5MARKET FOR COMMON EQUITY, RELATED STOCKHOLDER MATTERS AND ISSUER PURCHASES OF EQUITY SECURITIES
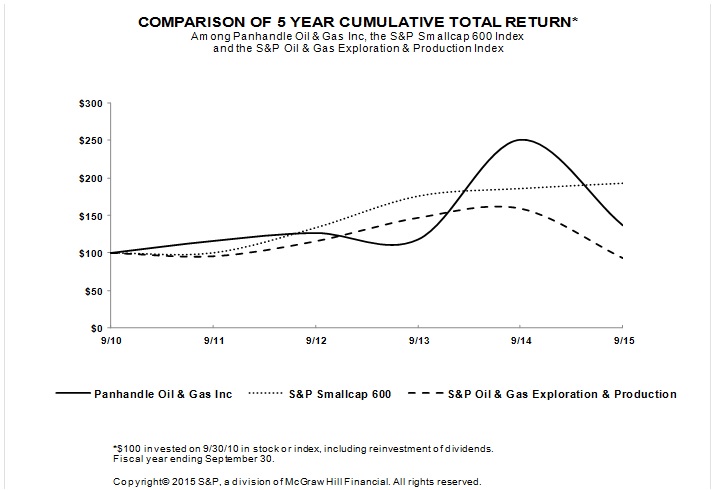
The above graph compares the 5-year cumulative total return provided shareholders on our Class A Common Stock (“Common Stock”) relative to the cumulative total returns of the S&P Smallcap 600 Index and the S&P Oil & Gas Exploration & Production Index. An investment of $100 (with reinvestment of all dividends) is assumed to have been made in our Common Stock and in each of the indexes on September 30, 2010, and its relative performance is tracked through September 30, 2015.
Since July 2008, the Company’s Common Stock has been listed and traded on the New York Stock Exchange (symbol PHX). The following table sets forth the high and low trade prices of the Common Stock during the periods indicated:
|
Quarter Ended |
High |
Low |
||||
|
December 31, 2013 |
$ |
17.00 |
$ |
13.79 | ||
|
March 31, 2014 |
$ |
24.10 |
$ |
16.17 | ||
|
June 30, 2014 |
$ |
30.66 |
$ |
21.01 | ||
|
September 30, 2014 |
$ |
34.45 |
$ |
26.00 | ||
|
December 31, 2014 |
$ |
29.80 |
$ |
15.68 | ||
|
March 31, 2015 |
$ |
25.20 |
$ |
17.58 | ||
|
June 30, 2015 |
$ |
24.00 |
$ |
19.57 | ||
|
September 30, 2015 |
$ |
21.23 |
$ |
13.81 | ||
At December 1, 2015, there were 1,373 holders of record of Panhandle’s Class A Common Stock and approximately 7,600 beneficial owners.
(23)
During the past two years, the Company has paid quarterly dividends of $.04 per share on its Common Stock. Approval by the Company’s Board is required before the declaration and payment of any dividends.
While the Company anticipates it will continue to pay dividends on its Common Stock, the payment and amount of future cash dividends will depend upon, among other things, financial condition, funds from operations, the level of capital and development expenditures, future business prospects, contractual restrictions and any other factors considered relevant by the Board.
The Company’s credit facility also contains a provision limiting the paying or declaring of a cash dividend during any fiscal year to 20% of net cash flow provided by operating activities from the Statement of Cash Flows of the preceding 12-month period. See Note 4 to the financial statements in Item 8 – “Financial Statements and Supplementary Data” for a further discussion of the credit facility.
Upon approval by the shareholders of the Company’s 2010 Restricted Stock Plan in March 2010, the Board directed the purchase of the Company’s Common Stock, from time to time, equal to the aggregate number of shares of Common Stock awarded pursuant to the Company’s 2010 Restricted Stock Plan, contributed by the Company to its ESOP and credited to the accounts of directors pursuant to the Deferred Compensation Plan for Non-Employee Directors. Effective May 2014, the board of directors approved for management to make these purchases of the Company’s Common Stock at their discretion. The Board’s approval included an initial authorization to purchase up to $1.5 million of Common Stock, with a provision for subsequent authorizations without specific action by the Board. As the amount of Common Stock purchased under any authorization reaches $1.5 million, another $1.5 million is automatically authorized for Common Stock purchases unless the Board determines otherwise.
(24)
ITEM 6SELECTED FINANCIAL DATA
The following table summarizes financial data of the Company for its last five fiscal years and should be read in conjunction with Item 7 – “Management’s Discussion and Analysis of Financial Condition and Results of Operations” and Item 8 – “Financial Statements and Supplementary Data,” including the Notes thereto, included elsewhere in this report.
|
As of and for the year ended September 30, |
||||||||||||||
|
2015 |
2014 |
2013 |
2012 |
2011 |
||||||||||
|
Revenues |
||||||||||||||
|
Oil, NGL and natural gas sales |
$ |
54,533,914 |
$ |
82,846,528 |
$ |
60,605,878 |
$ |
40,818,434 |
$ |
43,469,130 | ||||
|
Lease bonuses and rentals |
2,010,395 | 423,328 | 938,846 | 7,152,991 | 352,757 | |||||||||
|
Gains (losses) on derivative contracts |
13,822,506 | 247,414 | 611,024 | 73,822 | 734,299 | |||||||||
|
Income from partnerships |
515,278 | 893,954 | 733,372 | 487,070 | 420,465 | |||||||||
| 70,882,093 | 84,411,224 | 62,889,120 | 48,532,317 | 44,976,651 | ||||||||||
|
Costs and expenses |
||||||||||||||
|
Lease operating expense |
17,472,408 | 13,912,792 | 11,861,403 | 9,141,970 | 8,441,754 | |||||||||
|
Production taxes |
1,702,302 | 2,694,118 | 1,834,840 | 1,449,537 | 1,456,755 | |||||||||
|
Exploration costs |
48,404 | 86,017 | 9,795 | 979,718 | 1,025,542 | |||||||||
|
Depreciation, depletion and amortization |
23,821,139 | 21,896,902 | 21,945,768 | 19,061,239 | 14,712,188 | |||||||||
|
Provision for impairment |
5,009,191 | 1,096,076 | 530,670 | 826,508 | 1,728,162 | |||||||||
|
Loss (gain) on asset sales & other |
(398,994) | 8,378 | (942,959) | (88,477) | (68,325) | |||||||||
|
Interest expense |
1,550,483 | 462,296 | 157,558 | 127,970 |
- |
|||||||||
|
General and administrative |
7,339,320 | 7,433,183 | 6,801,996 | 6,388,856 | 5,994,663 | |||||||||
|
Bad debt expense (recovery) |
180,499 |
- |
- |
- |
- |
|||||||||
| 56,724,752 | 47,589,762 | 42,199,071 | 37,887,321 | 33,290,739 | ||||||||||
|
Income (loss) before provision |
||||||||||||||
|
(benefit) for income taxes |
14,157,341 | 36,821,462 | 20,690,049 | 10,644,996 | 11,685,912 | |||||||||
|
Provision (benefit) for income taxes |
4,836,000 | 11,820,000 | 6,730,000 | 3,274,000 | 3,192,000 | |||||||||
|
Net income (loss) |
$ |
9,321,341 |
$ |
25,001,462 |
$ |
13,960,049 |
$ |
7,370,996 |
$ |
8,493,912 | ||||
|
Basic and diluted earnings (loss) per share |
$ |
0.56 |
$ |
1.49 |
$ |
0.84 |
$ |
0.44 |
$ |
0.51 | ||||
|
Dividends declared per share |
$ |
0.16 |
$ |
0.16 |
$ |
0.14 |
$ |
0.14 |
$ |
0.14 | ||||
|
Weighted average shares outstanding |
||||||||||||||
|
Basic and diluted |
16,768,904 | 16,727,183 | 16,713,808 | 16,721,862 | 16,787,780 | |||||||||
|
Net cash provided by (used in): |
||||||||||||||
|
Operating activities |
$ |
45,571,014 |
$ |
52,622,602 |
$ |
37,402,109 |
$ |
25,371,195 |
$ |
29,283,929 | ||||
|
Investing activities |
$ |
(29,588,485) |
$ |
(121,950,995) |
$ |
(26,379,675) |
$ |
(38,372,702) |
$ |
(27,200,816) | ||||
|
Financing activities |
$ |
(15,888,369) |
$ |
66,970,977 |
$ |
(10,139,362) |
$ |
11,478,606 |
$ |
(4,173,372) | ||||
|
Total assets |
$ |
238,825,273 |
$ |
246,640,604 |
$ |
147,838,430 |
$ |
135,186,730 |
$ |
111,424,193 | ||||
|
Long-term debt |
$ |
65,000,000 |
$ |
78,000,000 |
$ |
8,262,256 |
$ |
14,874,985 |
$ |
- |
||||
|
Shareholders' equity |
$ |
127,004,675 |
$ |
119,188,653 |
$ |
95,655,486 |
$ |
83,852,146 |
$ |
78,802,317 | ||||
(25)
ITEM 7MANAGEMENT’S DISCUSSION AND ANALYSIS OF FINANCIAL CONDITION AND RESULTS OF OPERATIONS
BUSINESS OVERVIEW
The Company’s principal line of business is to explore for, develop, acquire, produce and sell oil, NGL and natural gas. Results of operations are dependent primarily upon the Company’s: existing reserve quantities; costs associated with acquiring, exploring for and developing new reserves; production quantities and related production costs; and oil, NGL and natural gas sales prices.
Fiscal 2015 oil and NGL production increased 31% and 2%, respectively, over that of 2014. The oil production increase is primarily the result of a full year’s production from the Texas Eagle Ford Shale (acquired in June 2014) and increased production from the North Dakota Bakken Shale which, combined, exceeded the natural decline of existing wells. The NGL production increase is attributed to a full year’s production from the Eagle Ford Shale and increased production from the Anadarko Basin Woodford Shale in western Oklahoma, which also exceeded the natural decline of existing wells. Fiscal 2015 natural gas production decreased 10% compared to 2014. The decrease in natural gas production was principally from declining natural gas production in the Arkansas Fayetteville Shale, declining associated natural gas production from the horizontal Cleveland, Marmaton and Granite Wash oil plays in western Oklahoma and the Texas Panhandle, and production declines in the Northern Oklahoma Mississippian and Southeastern Oklahoma Woodford Shale plays. These decreases were partially offset by production increases in the Anadarko Basin Woodford Shale in Oklahoma and the Eagle Ford Shale.
As of September 30, 2015, the Company owned an average 0.9% net revenue interest in 65 wells that were drilling or testing. Production from these wells and other scheduled wells during 2016 is not expected to be greater than the natural decline of existing wells; thus, the Company anticipates 2016 Mcfe production volumes will be less than those of 2015.
The increased production of oil and NGL in 2015, combined with lower natural gas production and lower oil, NGL and natural gas prices, resulted in a 34% decrease in revenues from the sale of oil, NGL and natural gas. Based on recent forward strip pricing, the Company believes 2016 average oil, NGL and natural gas prices will be lower than their corresponding average prices in 2015.
The Company’s proved developed oil, NGL and natural gas reserves decreased in 2015, compared to 2014, by 7.2 Bcfe, or 6%. The decrease was primarily due to negative pricing revisions.
Other than the lease of office space, the Company had no off balance sheet arrangements during 2015 or prior years.
(26)
The following table reflects certain operating data for the periods presented:
|
For the Year Ended September 30, |
||||||||||||
|
Percent |
Percent |
|||||||||||
|
2015 |
Incr. or (Decr.) |
2014 |
Incr. or (Decr.) |
2013 |
||||||||
|
Production: |
||||||||||||
|
Oil (Bbls) |
453,125 |
31% |
346,387 |
48% |
234,084 | |||||||
|
NGL (Bbls) |
210,960 |
2% |
207,688 |
86% |
111,897 | |||||||
|
Natural Gas (Mcf) |
9,745,223 |
(10%) |
10,773,559 |
(1%) |
10,886,329 | |||||||
|
Mcfe |
13,729,733 |
(3%) |
14,098,009 |
9% |
12,962,215 | |||||||
|
Average Sales Price: |
||||||||||||
|
Oil (per Bbl) |
$ |
53.12 |
(43%) |
$ |
93.68 |
2% |
$ |
91.56 | ||||
|
NGL (per Bbl) |
$ |
18.25 |
(44%) |
$ |
32.31 |
17% |
$ |
27.67 | ||||
|
Natural Gas (per Mcf) |
$ |
2.73 |
(33%) |
$ |
4.05 |
22% |
$ |
3.31 | ||||
|
Mcfe |
$ |
3.97 |
(32%) |
$ |
5.88 |
26% |
$ |
4.68 | ||||
RESULTS OF OPERATIONS
Fiscal Year 2015 Compared to Fiscal Year 2014
Overview
The Company recorded net income of $9,321,341, or $0.56 per share, in 2015, compared to net income of $25,001,462, or $1.49 per share, in 2014. Revenues decreased in 2015 primarily due to lower oil, NGL and natural gas sales partially offset by increased gains on derivative contracts and increased lease bonuses received.
Expenses increased in 2015 due mainly to higher LOE, DD&A, interest expense and provision for impairment partially offset by a decrease in production taxes and an increase in other miscellaneous income.
Oil, NGL and Natural Gas Sales
Oil, NGL and natural gas sales decreased $28,312,614 or 34% for 2015, as compared to 2014. The decrease was due to decreased oil, NGL and natural gas prices of 43%, 44% and 33%, respectively coupled with lower gas volumes of 10% , offset by increased oil and NGL volumes of 31% and 2%, respectively, in 2015.
The oil production volume increase is primarily the result of the Company’s acquisition of producing properties in the Eagle Ford Shale in South Texas in June 2014 and the associated horizontal drilling on that leasehold. To a lesser extent, Woodford Shale drilling in the Anadarko Basin in western and southern Oklahoma and drilling in the Bakken in North Dakota contributed to the increase. The increase in oil production volumes during 2015 was partially offset by declining oil production from the Company’s properties in Oklahoma and the Texas Panhandle.
The NGL production volume increase is primarily the result of Woodford Shale drilling in the Anadarko Basin in western and southern Oklahoma, the Eagle Ford Shale acquisition and subsequent drilling and drilling in the Bakken in North Dakota. The increase in NGL production volumes during 2015 was largely offset by declining NGL production from the Company’s properties in Oklahoma and the Texas Panhandle.
(27)
The natural gas production volume decrease is primarily the result of declining production in the Fayetteville Shale which was not offset by new production in the play due to significantly reduced drilling activity. Declining production from several of the Company’s properties in western Oklahoma and the Texas Panhandle as well as from the southeastern Oklahoma Woodford also contributed to the decrease. Lower production volumes were partially offset by production increases in the Anadarko Basin Woodford of western and southern Oklahoma and the Eagle Ford Shale in South Texas.
Production by quarter for 2015 and 2014 was as follows (Mcfe):
|
2015 |
2014 |
|||
|
First quarter |
3,737,483 |
3,509,270 |
||
|
Second quarter |
3,455,265 |
3,496,222 |
||
|
Third quarter |
3,315,899 |
3,309,394 |
||
|
Fourth quarter |
3,221,086 |
3,783,123 |
||
|
Total |
13,729,733 |
14,098,009 |
Lease Bonus and Rentals
Lease bonuses and rentals increased $1,587,067 in 2015. The increase was mainly due to the Company leasing 2,407 net mineral acres in Andrews and Winkler Counties, Texas, for $1.2 million. There were no significant leases of the Company’s mineral acreage in 2014.
Gains (Losses) on Derivative Contracts
Gains on derivative contracts increased $13,575,092 in 2015. The increase in gains was mainly due to the oil and natural gas collars and fixed price swaps being more beneficial in 2015, as NYMEX oil and natural gas futures had fallen further below the floor of the collars and the fixed prices of the swaps. As of September 30, 2015, the Company’s natural gas costless collar contracts have expiration dates of October and December 2015; the oil costless collar contracts and the oil fixed price swaps have an expiration date of December 2015.
Lease Operating Expenses (LOE)
LOE increased $3,559,616 or 26% in 2015. LOE costs per Mcfe of production increased from $0.99 in 2014 to $1.27 in 2015. The total LOE increase is primarily due to increased field operating costs of $3,598,103 in 2015 compared to 2014. Field operating costs increased mainly due to the acquisition of the Eagle Ford Shale properties and additional wells drilled in late 2014 and during 2015. Field operating costs were $.78 per Mcfe in 2015 compared to $.50 per Mcfe in 2014, a 56% increase. This increase in rate is principally the result of the significant number of oil and NGL rich wells drilled in recent years. These wells have higher lifting costs than our overall well population, which is and has been heavily gas weighted for several years.
The increase in LOE related to field operating costs was partially offset by a decrease in handling fees (primarily gathering, transportation and marketing costs) on natural gas of $38,487 in 2015, as compared to 2014. On a per Mcfe basis, these fees increased $.01 due to increased fees in areas that are currently being drilled. Natural gas sales bear the large majority of the handling fees. Handling fees are charged either as a percent of sales or based on production volumes.
(28)
Production Taxes
Production taxes decreased $991,816 or 37% in 2015 as compared to 2014. The decrease in amount is primarily the result of decreased oil, NGL and natural gas sales of $28,312,614 during 2015. Production taxes as a percentage of oil, NGL and natural gas sales decreased slightly from 3.3% in 2014 to 3.1% in 2015. The low overall production tax rate is due to a large proportion of the Company’s oil and natural gas revenues coming from horizontally drilled wells, which are eligible for reduced Oklahoma and Arkansas production tax rates.
Depreciation, Depletion and Amortization (DD&A)
DD&A increased $1,924,237 in 2015. DD&A per Mcfe was $1.74 in 2015, compared to $1.55 in 2014. DD&A increased $2,496,240 as the result of a $.19 increase in the DD&A rate. This rate increase was principally due to higher per Mcfe finding costs experienced in oil and liquids rich areas where the Company has added production, as well as much lower oil, NGL and natural gas prices utilized in the reserve calculations during 2015, as compared to 2014, resulting in lower projected remaining reserves on a significant number of wells. An offsetting decrease of $572,003 was due to oil, NGL and natural gas production volumes decreasing 3% collectively in 2015, compared to 2014.
Provision for Impairment
Provision for impairment increased $3,913,115 in 2015, as compared to 2014. During 2015, impairment of $5,009,191 was recorded on 27 fields primarily in Oklahoma, Kansas and Texas. One oil field in Hemphill County, Texas, accounted for $1,846,488 of the impairment due mainly to declining oil prices. During 2014, impairment of $1,096,076 was primarily recorded on 10 small fields in Oklahoma and Texas.
Loss (Gain) on Asset Sales and Other
Loss (gain) on asset sales and other was a net gain of $398,994 in 2015, as compared to a net loss of $8,378 in 2014. The net gain in 2015 was mainly the result of a lawsuit settlement of approximately $331,000 related to participation rights on some of the Company’s mineral acreage in Arkansas. The net loss in 2014 was primarily the result of a loss on the sale of marginal properties partially offset by higher interest income from operators.
Interest Expense
Interest expense increased $1,088,187 in 2015, as compared to 2014. The increase was primarily due to a larger average outstanding debt balance in 2015. The debt was used to purchase the Eagle Ford Shale properties on June 17, 2014.
Provision (Benefit) for Income Taxes
The 2015 provision for income taxes of $4,836,000 was based on a pre-tax income of $14,157,341, as compared to a provision for income taxes of $11,820,000 in 2014, based on a pre-tax income of $36,821,462. The effective tax rate for 2015 was 34%, compared to an effective tax rate for 2014 of 32%. The Company’s utilization of excess percentage depletion, which is a permanent tax benefit, decreased the provision for income taxes and reduced the effective tax rate below the statutory rate for both years.
(29)
Fiscal Year 2014 Compared to Fiscal Year 2013
Overview
The Company recorded net income of $25,001,462, or $1.49 per share, in 2014, compared to net income of $13,960,049, or $0.84 per share, in 2013. Revenues increased in 2014 primarily due to higher oil and NGL sales volumes and higher natural gas sales prices, partially offset by decreased gains on derivative contracts and decreased lease bonuses received.
Expenses increased in 2014 due to higher LOE, production taxes and G&A coupled with an increase in the provision for impairment and a decrease in other miscellaneous income.
Oil, NGL and Natural Gas Sales
Oil, NGL and natural gas sales increased $22,240,650 or 37% for 2014, as compared to 2013. The increase was due to increased oil and NGL volumes of 48% and 86%, respectively, and increased oil, NGL and natural gas prices of 2%, 17% and 22%, respectively, in 2014.
The oil and NGL production increase is primarily the result of the Company’s acquisition of producing properties in the Eagle Ford Shale in South Texas and the associated horizontal drilling on that leasehold, as well as horizontal drilling in the Marmaton, Hogshooter and Granite Wash in western Oklahoma and horizontal Woodford Shale drilling in the Anadarko Basin in western and southern Oklahoma. To a lesser extent, horizontal drilling in the Mississippian in northern Oklahoma and horizontal Cleveland drilling in the Texas Panhandle contributed to the oil and NGL production increase.
Production by quarter for 2014 and 2013 was as follows (Mcfe):
|
2014 |
2013 |
||
|
First quarter |
3,509,270 |
3,008,365 |
|
|
Second quarter |
3,496,222 |
3,245,411 |
|
|
Third quarter |
3,309,394 |
3,229,800 |
|
|
Fourth quarter |
3,783,123 |
3,478,639 |
|
|
Total |
14,098,009 |
12,962,215 |
Lease Bonus and Rentals
Lease bonuses and rentals decreased $515,518 in 2014 due to decreased mineral leasing activity. There were no significant leases of the Company’s mineral acreage in 2013 or 2014.
Gains (Losses) on Derivative Contracts
Gains on derivative contracts decreased $363,610 or 60% in 2014. The decrease in gains was mainly due to the natural gas collars and natural gas fixed price swaps being more beneficial in 2013, as NYMEX gas futures had fallen further below the floor of the collars and the fixed gas prices of the swaps. As of September 30, 2014, the Company’s natural gas fixed price swaps have expiration dates of October and December 2014; the natural gas costless collar contracts have an expiration date of December 2014; the oil costless collar contracts have an expiration date of December 2014 and the oil fixed price swaps have expiration dates of December 2014, March 2015, June 2015 and December 2015.
(30)
Lease Operating Expenses (LOE)
LOE increased $2,051,389 or 17% in 2014. LOE costs per Mcfe of production increased from $0.92 in 2013 to $0.99 in 2014. The total LOE increase is primarily due to increased field operating costs of $1,900,168 in 2014 compared to 2013. Field operating costs increased due to the acquisition of the Eagle Ford Shale properties and additional wells drilled in 2014. Field operating costs were $.50 per Mcfe in 2014 compared to $.40 per Mcfe in 2013, a 25% increase. This increase in rate is principally the result of the significant number of oil and NGL rich wells drilled in recent years. These wells have higher lifting costs than our overall well population.
The increase in LOE related to field operating costs was also coupled with an increase in handling fees (primarily gathering, transportation and marketing costs) on natural gas of $151,221 in 2014, as compared to 2013. On a per Mcfe basis, these fees were down $.03 due to significant increases in oil and NGL production, while natural gas production was essentially flat. Natural gas sales bear the large majority of the handling fees. Handling fees are charged either as a percent of sales or based on production volumes.
Depreciation, Depletion and Amortization (DD&A)
DD&A decreased $48,866 in 2014. DD&A per Mcfe was $1.55 in 2014, compared to $1.69 in 2013. DD&A increased $1,922,964 due to oil, NGL and natural gas production volumes increasing 9% collectively in the 2014 period, compared to the 2013 period. An offsetting decrease of $1,971,830 was the result of a $.14 decrease in the DD&A rate. This rate decrease was principally due to higher oil, NGL and natural gas prices utilized in the reserve calculations during 2014 as compared to 2013 resulting in higher projected remaining reserves on a significant number of wells.
Provision for Impairment
The provision for impairment increased $565,406 in 2014, as compared to 2013. During 2014, impairment of $1,096,076 was primarily recorded on ten small fields in Oklahoma and Texas. These fields have one to a few wells and are more susceptible to impairment when a well in the field experiences downward reserve revisions, or when a newly completed well with low reserves is added to one of these fields. During 2013, impairment of $530,670 was recorded on five small fields in Oklahoma and Texas.
Loss (Gain) on Asset Sales and Other
Loss (gain) on asset sales and other was a net loss of $8,378 in 2014, as compared to a net gain of $942,959 in 2013. The gain in 2013 was mainly the result of a class action lawsuit settlement of approximately $604,000 related to the underpayment of royalty revenues and gains on asset sales of $208,749.
Interest Expense
Interest expense increased $304,738 in 2014, as compared to 2013. The increase was primarily due to a larger outstanding debt balance that was used to purchase the Eagle Ford Shale properties in the third quarter of 2014.
General and Administrative Costs (G&A)
G&A increased $631,187 or 9% in 2014. The increase is primarily related to increases in the following expense categories: legal $275,286, personnel $123,586 and audit and tax $112,745. The increase in legal expenses was primarily the result of additional fees for legal services associated with the
(31)
Eagle Ford Shale acquisition and a property rights dispute in 2014. The increase in 2014 personnel related expenses was largely the result of compensation increases of $100,406. The increase in audit and tax fees in 2014 was principally due to increased fees for services associated with the Eagle Ford Shale acquisition.
Provision (Benefit) for Income Taxes
The 2014 provision for income taxes of $11,820,000 was based on a pre-tax income of $36,821,462, as compared to a provision for income taxes of $6,730,000 in 2013, based on a pre-tax income of $20,690,049. The effective tax rate for 2014 was 32%, compared to an effective tax rate for 2013 of 33%. The Company’s utilization of excess percentage depletion, which is a permanent tax benefit, decreased the provision for income taxes and reduced the effective tax rate below the statutory rate for both years.
LIQUIDITY AND CAPITAL RESOURCES
At September 30, 2015, the Company had positive working capital of $8,907,437, as compared to positive working capital of $9,919,037 at September 30, 2014.
Liquidity
Cash and cash equivalents were $603,915 as of September 30, 2015, compared to $509,755 at September 30, 2014, an increase of $94,160. Cash flows for the 12 months ended September 30 are summarized as follows:
|
Net cash provided (used) by: |
||||||||
|
2015 |
2014 |
Change |
||||||
|
Operating activities |
$ |
45,571,014 |
$ |
52,622,602 |
$ |
(7,051,588) | ||
|
Investing activities |
(29,588,485) | (121,950,995) | 92,362,510 | |||||
|
Financing activities |
(15,888,369) | 66,970,977 | (82,859,346) | |||||
|
Increase (decrease) in cash and cash equivalents |
$ |
94,160 |
$ |
(2,357,416) |
$ |
2,451,576 | ||
Operating activities:
Net cash provided by operating activities decreased $7,051,588 during 2015, as compared to 2014, the result of the following:
|
· |
Receipts of oil, NGL and natural gas sales (net of production taxes and gathering, transportation and marketing costs) and other decreased $17,147,678. |
|
· |
Decreased income tax payments of $2,467,208. |
|
· |
Increased net receipts on derivative contracts of $12,742,814. |
|
· |
Increased payments for interest expense of $1,178,434. |
|
· |
Increased payments for field operating expenses of $3,945,491. |
(32)
Investing activities:
Net cash used in investing activities decreased $92,362,510 during 2015, as compared to 2014, due to:
|
· |
A decrease in cash used to acquire properties of $83,002,022. |
|
· |
Lower drilling and completion activity during 2015 decreased capital expenditures by $7,812,163. |
|
· |
Higher proceeds from mineral leasing and asset sales of $1,576,756. |
Financing activities:
2015 net cash used in financing activities was $15,888,369, as compared to net cash provided by financing activities in 2014 of $66,970,977, resulting in a net decrease of $82,859,346 of cash provided by financing activities. This change is the result of the following:
|
· |
During 2015, net borrowings decreased $13,000,000. During 2014, net borrowings increased $69,737,744. Increased borrowings during 2014 were used to finance the acquisition of properties. |
Capital Resources
Capital expenditures to drill and complete wells decreased $7,812,163 (20%) in 2015, as compared to 2014. This decrease was primarily due to the suspension of drilling activity in the Texas Eagle Ford Shale oil play late in the 2015 first quarter, combined with a significant decrease in well proposals to the Company in all of its other plays. Of the well proposals received, many did not meet our participation criteria. However, due to completion cost reductions, expenditures were made during the 2015 third quarter to complete five North Dakota Bakken Shale oil wells and during the 2015 fourth quarter to complete five Eagle Ford Shale wells. Completion of these 10 wells had previously been suspended by the operators awaiting higher oil prices and/or completion cost reductions. Other notable drilling and completion expenditures were made during 2015 on the Company’s mineral acreage in the SCOOP Woodford Shale and Springer plays in south central Oklahoma and the Arkansas Fayetteville Shale.
Oil, NGL and natural gas production volumes decreased 3% on an Mcfe basis during 2015, as compared to 2014. Oil production increased 31% principally due to increased production from the Eagle Ford Shale properties acquired in June 2014 and from the Bakken Shale. These increases were partially offset by production declines of horizontal Cleveland, Marmaton and Granite Wash oil plays in western Oklahoma and the Texas Panhandle. NGL production increased 2% due to added production from the Eagle Ford Shale and increased production from the Anadarko Basin Woodford Shale, partially offset by production declines of horizontal Cleveland, Marmaton and Granite Wash oil plays in western Oklahoma and the Texas Panhandle, the Northern Oklahoma Mississippian play and the Southeastern Oklahoma Woodford Shale play. Natural gas production decreased 10%, the result of declining production from the Arkansas Fayetteville Shale, declining associated natural gas production from the horizontal Cleveland, Marmaton and Granite Wash oil plays in western Oklahoma and the Texas Panhandle and production declines in the Northern Oklahoma Mississippian and Southeastern Oklahoma Woodford Shale plays. These decreases were partially offset by added production from the Eagle Ford Shale and the Anadarko Basin Woodford Shale in Oklahoma.
(33)
The Company expects the current reduced level of capital expenditures to continue during 2016 as long as oil, NGL and natural gas prices remain at or near their current depressed levels. Reduced capital expenditures are anticipated to result in lower oil, NGL and natural gas production volumes in 2016, compared to 2015. Based on current projections, we expect 2016 cash provided by operating activities sufficient to fund expected capital expenditures.
Since the Company is not the operator of any of its oil and natural gas properties, it is extremely difficult for us to predict levels of future participation in the drilling and completion of new wells and their associated capital expenditures. This makes 2016 capital expenditures for drilling and completion projects difficult to forecast.
With continued oil and natural gas price volatility, management continues to evaluate opportunities for product price protection through additional hedging of the Company’s future oil and natural gas production. See Note 1 to the financial statements included in Item 8 – “Financial Statements and Supplementary Data” for a complete list of the Company’s outstanding derivative contracts.
The use of the Company’s cash provided by operating activities and resultant change to cash is summarized in the table below:
|
Twelve months ended |
||
|
9/30/2015 |
||
|
Cash provided by operating activities |
$ |
45,571,014 |
|
Cash used for: |
||
|
Capital expenditures - acquisitions |
308,180 | |
|
Capital expenditures - drilling and completion of wells |
30,800,625 | |
|
Quarterly dividends of $.04 per share |
2,669,056 | |
|
Treasury stock purchases |
242,313 | |
|
Net payments (borrowings) on credit facility |
13,000,000 | |
|
Other investing activities |
(1,543,320) | |
|
Net cash used |
45,476,854 | |
|
Net increase (decrease) in cash |
$ |
94,160 |
Outstanding borrowings on the credit facility at September 30, 2015, were $65,000,000.
Looking forward, the Company expects to fund overhead costs, capital additions related to the drilling and completion of wells, treasury stock purchases and dividend payments primarily from cash provided by operating activities and cash on hand. Any excess cash is intended to be used to reduce existing bank debt. As management evaluates opportunities to acquire additional assets, additional borrowings utilizing our bank credit facility could be necessary. Also, during times of oil, NGL and natural gas price decreases, or increased capital expenditures, it may be necessary to utilize the credit facility further in order to fund these expenditures. The Company had availability ($55,000,000 at September 30, 2015) under its revolving credit facility and is in compliance with its debt covenants (current ratio, debt to EBITDA and dividends as a percent of operating cash flow).
Based on expected capital expenditure levels and anticipated cash provided by operating activities for 2016, the Company has sufficient liquidity to fund its ongoing operations and, combined with the expected levels of availability under its credit facility, to fund any potential acquisitions.
(34)
CONTRACTUAL OBLIGATIONS AND COMMITMENTS
The Company has a credit facility with Bank of Oklahoma (BOK) consisting of a revolving loan of $200,000,000, which is subject to a semi-annual borrowing base determination. The current borrowing base is $100,000,000 and is secured by certain of the Company’s properties with a carrying value of $166,401,695 at September 30, 2015. The revolving loan matures on November 30, 2018. Borrowings under the revolving loan are due at maturity. The revolving loan bears interest at the BOK prime rate plus a range of 0.375% to 1.125%, or 30 day LIBOR plus a range of 1.875% to 2.625% annually. At September 30, 2015, the effective rate was 2.37%. The election of BOK prime or LIBOR is at the Company’s discretion. The interest rate spread from LIBOR or the prime rate increases as a larger percent of the loan value of the Company’s oil and natural gas properties is advanced.
Determinations of the borrowing base are made semi-annually, whenever BOK believes there has been a material change in the value of the Company’s oil and natural gas properties or upon reasonable request by the Company. The loan agreement contains customary covenants, which, among other things, require periodic financial and reserve reporting and limit the Company’s incurrence of indebtedness, liens, dividends and acquisitions of treasury stock and require the Company to maintain certain financial ratios. At September 30, 2015, the Company was in compliance with these covenants and projects compliance during 2016.
The table below summarizes the Company’s contractual obligations and commitments as of September 30, 2015:
|
Payments due by period |
|||||||||||||||
|
Contractual Obligations |
Less than |
More than |
|||||||||||||
|
and Commitments |
Total |
1 Year |
1-3 Years |
3-5 Years |
5 Years |
||||||||||
|
Long-term debt obligations |
$ |
65,000,000 |
$ |
- |
$ |
- |
$ |
65,000,000 |
$ |
- |
|||||
|
Building lease |
$ |
947,775 |
$ |
204,089 |
$ |
410,754 |
$ |
332,932 |
$ |
- |
|||||
At September 30, 2015, the Company’s derivative contracts were in a net asset position of $4,210,764. The ultimate settlement amounts of the derivative contracts are unknown because they are subject to continuing market risk. Please read Item 7A – “Quantitative and Qualitative Disclosures about Market Risk” and Note 1 to the financial statements included in Item 8 – “Financial Statements and Supplementary Data” for additional information regarding the derivative contracts.
As of September 30, 2015, the Company’s estimate for asset retirement obligations was $2,824,944. Asset retirement obligations represent the Company’s share of the future expenditures to plug and abandon the wells in which the Company owns a working interest upon the end of their economic lives. These amounts were not included in the schedule above due to the uncertainty of timing of the obligations. Please read Note 1 to the financial statements included in Item 8 – “Financial Statements and Supplementary Data” for additional information regarding the Company’s asset retirement obligations.
CRITICAL ACCOUNTING POLICIES
Preparation of financial statements in conformity with accounting principles generally accepted in the United States requires management to make estimates, judgments and assumptions that affect the reported amounts of assets, liabilities, revenues and expenses, and the disclosure of contingent assets and liabilities. However, the accounting principles used by the Company generally do not change the Company’s reported cash flows or liquidity. Existing rules must be interpreted and judgments made on how the specifics of a given rule apply to the Company.
(35)
The more significant reporting areas impacted by management’s judgments and estimates are: crude oil, NGL and natural gas reserve estimation; derivative contracts; impairment of assets; oil, NGL and natural gas sales revenue accruals; refundable production taxes and provision for income taxes. Management’s judgments and estimates in these areas are based on information available from both internal and external sources, including engineers, geologists, consultants and historical experience in similar matters. Actual results could differ from the estimates as additional information becomes known. The oil, NGL and natural gas sales revenue accrual is particularly subject to estimate inaccuracies due to the Company’s status as a non-operator on all of its properties. As such, production and price information obtained from well operators is substantially delayed. This causes the estimation of recent production and prices used in the oil, NGL and natural gas revenue accrual to be subject to future change.
Oil, NGL and Natural Gas Reserves
Management considers the estimation of the Company’s crude oil, NGL and natural gas reserves to be the most significant of its judgments and estimates. These estimates affect the unaudited standardized measure disclosures included in Note 11 to the financial statements in Item 8 – “Financial Statements and Supplementary Data,” as well as DD&A and impairment calculations. Changes in crude oil, NGL and natural gas reserve estimates affect the Company’s calculation of DD&A, asset retirement obligations and assessment of the need for asset impairments. On an annual basis, with a semi-annual update, the Company’s Independent Consulting Petroleum Engineer, with assistance from Company staff, prepares estimates of crude oil, NGL and natural gas reserves based on available geologic and seismic data, reservoir pressure data, core analysis reports, well logs, analogous reservoir performance history, production data and other available sources of engineering, geological and geophysical information. Between periods in which reserves would normally be calculated, the Company updates the reserve calculations utilizing prices which are updated through the current period. In accordance with the SEC rules, the reserve estimates were based on average individual product prices during the 12-month period prior to September 30 determined as an unweighted arithmetic average of the first-day-of-the-month price for each month within such period, unless prices were defined by contractual arrangements, excluding escalations based upon future conditions. Based on the Company’s 2015 DD&A, a 10% change in the DD&A rate per Mcfe would result in a corresponding $2,382,114 annual change in DD&A expense. Crude oil, NGL and natural gas prices are volatile and largely affected by worldwide production and consumption and are outside the control of management. However, projected future crude oil, NGL and natural gas pricing assumptions are used by management to prepare estimates of crude oil, NGL and natural gas reserves and future net cash flows used in asset impairment assessments and in formulating management’s overall operating decisions.
Successful Efforts Method of Accounting
The Company has elected to utilize the successful efforts method of accounting for its oil and natural gas exploration and development activities. This means exploration expenses, including geological and geophysical costs, non-producing lease impairment, rentals and exploratory dry holes, are charged against income as incurred. Costs of successful wells and related production equipment and developmental dry holes are capitalized and amortized by property using the unit-of-production method (the ratio of oil, NGL and natural gas volumes produced to total proved or proved developed reserves is used to amortize the remaining asset basis on each producing property) as oil, NGL and natural gas is produced. The Company’s exploratory wells are all on-shore and primarily located in the Mid-Continent area. Generally, expenditures on exploratory wells comprise less than 10% of the Company’s total expenditures for oil and natural gas properties. This accounting method may yield significantly different operating results than the full cost method.
(36)
Derivative Contracts
The Company has entered into oil and natural gas costless collar contracts and oil and natural gas fixed swap contracts. These instruments are intended to reduce the Company’s exposure to short-term fluctuations in the price of oil and natural gas. Collar contracts set a fixed floor price and a fixed ceiling price and provide payments to the Company if the index price falls below the floor or require payments by the Company if the index price rises above the ceiling. Fixed swap contracts set a fixed price and provide for payments to the Company if the index price is below the fixed price, or require payments by the Company if the index price is above the fixed price. These contracts cover only a portion of the Company’s oil and natural gas production and provide only partial price protection against declines in oil and natural gas prices. These derivative instruments expose the Company to risk of financial loss and may limit the benefit of future increases in prices. All of the Company’s derivative contracts are with Bank of Oklahoma and are secured under its credit facility with Bank of Oklahoma.
The Company is required to recognize all derivative instruments as either assets or liabilities in the balance sheet at fair value. The accounting for changes in the fair value of a derivative depends on the intended use of the derivative and resulting designation. At September 30, 2015, the Company had no derivative contracts designated as cash flow hedges, and therefore, changes in the fair value of derivatives are reflected in earnings.
Impairment of Assets
All long-lived assets, principally oil and natural gas properties, are monitored for potential impairment when circumstances indicate that the carrying value of the asset may be greater than its estimated future net cash flows. The evaluations involve significant judgment since the results are based on estimated future events, such as: inflation rates; future sales prices for oil, NGL and natural gas; future production costs; estimates of future oil, NGL and natural gas reserves to be recovered and the timing thereof; economic and regulatory climates and other factors. The Company estimates future net cash flows on its oil and natural gas properties utilizing differentially adjusted forward pricing curves for oil, NGL and natural gas and a discount rate in line with the discount rate we believe is most commonly used by market participants (10% for all periods presented). The need to test a property for impairment may result from significant declines in sales prices or unfavorable adjustments to oil, NGL and natural gas reserves. A further reduction in oil, NGL and natural gas prices (which are reviewed quarterly) or a decline in reserve volumes (which are re-evaluated semi-annually) would likely lead to additional impairment that may be material to the Company. Should product price expectations continue to decline below levels seen at September 30, 2015, in future periods, impairment charges significantly greater than the Company has incurred in prior periods could result. Any assets held for sale are reviewed for impairment when the Company approves the plan to sell. Estimates of anticipated sales prices are highly judgmental and subject to material revision in future periods. Because of the uncertainty inherent in these factors, the Company cannot predict when or if future impairment charges will be recorded.
Non-producing oil and natural gas leases are assessed for impairment on a property-by-property basis for individually significant balances and on an aggregate basis for individually insignificant balances. If the assessment indicates an impairment, a loss is recognized by providing a valuation allowance at the level at which impairment was assessed. The impairment assessment is affected by economic factors such as the results of exploration activities, commodity price outlooks, remaining lease terms and potential shifts in business strategy employed by management. In the case of individually insignificant balances, the amount of the impairment loss recognized is determined by amortizing the portion of these properties’ costs, which the Company believes will not be transferred to proved properties over the remaining lives of the leases. Impairment loss is charged to exploration costs when recognized. As of September 30, 2015, the remaining carrying cost of non-producing oil and natural gas leases was $185,124.
(37)
Oil, NGL and Natural Gas Sales Revenue Accrual
The Company does not operate its oil and natural gas properties and, therefore, receives actual oil, NGL and natural gas sales volumes and prices (in the normal course of business) more than a month later than the information is available to the operators of the wells. This being the case, on wells with greater significance to the Company, the most current available production data is gathered from the appropriate operators, and oil, NGL and natural gas index prices local to each well are used to estimate the accrual of revenue on these wells. Obtaining timely production data on all other wells from the operators is not feasible; therefore, the Company utilizes past production receipts and estimated sales price information to estimate its accrual of revenue on all other wells each quarter. The oil, NGL and natural gas sales revenue accrual can be impacted by many variables including rapid production decline rates, production curtailments by operators, the shut-in of wells with mechanical problems and rapidly changing market prices for oil, NGL and natural gas. These variables could lead to an over or under accrual of oil, NGL and natural gas sales at the end of any particular quarter. Based on past history, the Company’s estimated accruals have been materially accurate.
Income Taxes
The estimation of the amounts of income tax to be recorded by the Company involves interpretation of complex tax laws and regulations, as well as the completion of complex calculations, including the determination of the Company’s percentage depletion deduction, if any. To calculate the exact excess percentage depletion allowance, a well-by-well calculation is, and can only be, performed at the end of each fiscal year. During interim periods, an estimate is made taking into account historical data and current pricing. The Company has certain state net operating loss carry forwards (NOLs) that are recognized as tax assets when assessed as more likely than not to be utilized before their expiration dates. Criteria such as expiration dates, future excess state depletion and reversing taxable temporary differences are evaluated to determine whether the NOLs are more likely than not to be utilized before they expire. If any NOLs are determined to no longer be more likely than not to be utilized, then a valuation allowance is recognized to reduce the tax benefit of such NOLs. Although the Company’s management believes its tax accruals are adequate, differences may occur in the future depending on the resolution of pending and new tax matters.
The above description of the Company’s critical accounting policies is not intended to be an all-inclusive discussion of the uncertainties considered and estimates made by management in applying generally accepted accounting principles and policies. Results may vary significantly if different policies were used or required and if new or different information becomes known to management.
ITEM 7AQUANTITATIVE AND QUALITATIVE DISCLOSURES ABOUT MARKET RISK
Market Risk
Oil, NGL and natural gas prices historically have been volatile, and this volatility is expected to continue. Uncertainty continues to exist as to the direction of oil, NGL and natural gas price trends, and there remains a wide divergence in the opinions held in the industry. The Company can be significantly impacted by changes in oil and natural gas prices. The market price of oil, NGL and natural gas in 2016 will impact the amount of cash generated from operating activities, which will in turn impact the level of the Company’s capital expenditures and production. Excluding the impact of the Company’s 2016 derivative contracts (see below), the price sensitivity for each $0.10 per Mcf change in wellhead natural gas price is approximately $974,522 for operating revenue based on the Company’s prior year natural gas volumes. The price sensitivity in 2016 for each $1.00 per barrel change in wellhead oil is approximately $453,125 for operating revenue based on the Company’s prior year oil volumes.
(38)
Commodity Price Risk
The Company periodically utilizes derivative contracts to reduce its exposure to unfavorable changes in natural gas and oil prices. The Company does not enter into these derivatives for speculative or trading purposes. All of our outstanding derivative contracts are with Bank of Oklahoma and are secured. These arrangements cover only a portion of the Company’s production and provide only partial price protection against declines in natural gas and oil prices. These derivative contracts expose the Company to risk of financial loss and limit the benefit of future increases in prices. For the Company’s oil fixed price swaps, a change of $1.00 in the NYMEX WTI forward strip prices would result in a change to pre-tax operating income of approximately $48,000. For the Company’s natural gas collars, a change of $.10 in the NYMEX Henry Hub forward strip pricing would result in a change to pre-tax operating income of approximately $61,000. For the Company’s oil collars, a change of $1.00 in the NYMEX WTI forward strip prices would result in a change to pre-tax operating income of approximately $40,000. See Note 1 to the financial statements included in Item 8 – “Financial Statements and Supplementary Data” for additional information regarding the derivative contracts.
Financial Market Risk
Operating income could also be impacted, to a lesser extent, by changes in the market interest rates related to the Company’s credit facility. The revolving loan bears interest at the BOK prime rate plus from 0.375% to 1.125%, or 30 day LIBOR plus from 1.875% to 2.625%. At September 30, 2015, the Company had $65,000,000 outstanding under this facility and the effective interest rate was 2.37%. At this point, the Company does not believe that its liquidity has been materially affected by the debt market uncertainties noted in the last few years and the Company does not believe that its liquidity will be impacted in the near future.
ITEM 8FINANCIAL STATEMENTS AND SUPPLEMENTARY DATA
(39)
Management’s Annual Report on Internal Control Over Financial Reporting
Management of the Company is responsible for establishing and maintaining adequate internal control over financial reporting. Internal control over financial reporting is defined in Rules 13a-15(f) and 15d-15(f) under the Securities Exchange Act of 1934 (the “Exchange Act”) as a process designed by, or under the supervision of, the Company’s principal executive and principal financial officers and effected by the Company’s board of directors, management and other personnel, to provide reasonable assurance regarding the reliability of financial reporting and the preparation of financial statements for external purposes in accordance with generally accepted accounting principles, and includes those policies and procedures that:
|
· |
pertain to the maintenance of records that in reasonable detail accurately and fairly reflect the transactions and dispositions of the assets of the Company; |
|
· |
provide reasonable assurance that transactions are recorded as necessary to permit preparation of financial statements in accordance with generally accepted accounting principles in the United States, and that receipts and expenditures of the Company are being made only in accordance with authorizations of management and directors of the Company; and |
|
· |
provide reasonable assurance regarding prevention or timely detection of unauthorized acquisition, use or disposition of the Company’s assets that could have a material effect on the financial statements. |
Because of its inherent limitations, internal control over financial reporting may not prevent or detect misstatements. Also, projections of any evaluation of effectiveness to future periods are subject to the risk that controls may become inadequate because of changes in conditions, or that the degree of compliance with the policies or procedures may deteriorate. Internal control over financial reporting cannot provide absolute assurance of achieving financial reporting objectives because of its inherent limitations. Internal control over financial reporting is a process that involves human diligence and compliance and is subject to lapses in judgment and breakdowns resulting from human failures. Internal control over financial reporting also can be circumvented by collusion or improper management override. Because of such limitations, there is a risk that material misstatements may not be prevented or detected on a timely basis by internal control over financial reporting. However, these inherent limitations are known features of the financial reporting process. Therefore, it is possible to design into the process safeguards to reduce, though not eliminate, this risk.
The Company’s management assessed the effectiveness of the Company’s internal control over financial reporting as of September 30, 2015. In making this assessment, the Company’s management used the criteria set forth in Internal Control – Integrated Framework (as updated in 2013) issued by the Committee of Sponsoring Organizations of the Treadway Commission (COSO). Based on our assessment, management has concluded that, as of September 30, 2015, the Company’s internal control over financial reporting was effective based on those criteria.
Our independent registered public accounting firm has issued an attestation report on our internal control over financial reporting. This report appears on the following page.
(40)
Report of Independent Registered Public Accounting Firm
on Internal Control Over Financial Reporting
The Board of Directors and Stockholders of
Panhandle Oil and Gas Inc.
We have audited Panhandle Oil and Gas Inc.’s internal control over financial reporting as of September 30, 2015, based on criteria established in Internal Control—Integrated Framework issued by the Committee of Sponsoring Organizations of the Treadway Commission (2013 framework) (the COSO criteria). Panhandle Oil and Gas Inc.’s management is responsible for maintaining effective internal control over financial reporting, and for its assessment of the effectiveness of internal control over financial reporting included in the accompanying Management’s Annual Report on Internal Control Over Financial Reporting. Our responsibility is to express an opinion on the Company’s internal control over financial reporting based on our audit.
We conducted our audit in accordance with the standards of the Public Company Accounting Oversight Board (United States). Those standards require that we plan and perform the audit to obtain reasonable assurance about whether effective internal control over financial reporting was maintained in all material respects. Our audit included obtaining an understanding of internal control over financial reporting, assessing the risk that a material weakness exists, testing and evaluating the design and operating effectiveness of internal control based on the assessed risk, and performing such other procedures as we considered necessary in the circumstances. We believe that our audit provides a reasonable basis for our opinion.
A company’s internal control over financial reporting is a process designed to provide reasonable assurance regarding the reliability of financial reporting and the preparation of financial statements for external purposes in accordance with generally accepted accounting principles. A company’s internal control over financial reporting includes those policies and procedures that (1) pertain to the maintenance of records that, in reasonable detail, accurately and fairly reflect the transactions and dispositions of the assets of the company; (2) provide reasonable assurance that transactions are recorded as necessary to permit preparation of financial statements in accordance with generally accepted accounting principles, and that receipts and expenditures of the company are being made only in accordance with authorizations of management and directors of the company; and (3) provide reasonable assurance regarding prevention or timely detection of unauthorized acquisition, use, or disposition of the company’s assets that could have a material effect on the financial statements.
Because of its inherent limitations, internal control over financial reporting may not prevent or detect misstatements. Also, projections of any evaluation of effectiveness to future periods are subject to the risk that controls may become inadequate because of changes in conditions, or that the degree of compliance with the policies or procedures may deteriorate.
In our opinion, Panhandle Oil and Gas Inc. maintained, in all material respects, effective internal control over financial reporting as of September 30, 2015, based on the COSO criteria.
We also have audited, in accordance with the standards of the Public Company Accounting Oversight Board (United States), the balance sheets of Panhandle Oil and Gas Inc. as of September 30, 2015 and 2014, and the related statements of operations, stockholders’ equity, and cash flows for each of the three years in the period ended September 30, 2015 and our report dated December 10, 2015 expressed an unqualified opinion thereon.
/s/ Ernst & Young LLP
Oklahoma City, Oklahoma
December 10, 2015
(41)
Report of Independent Registered Public Accounting Firm
The Board of Directors and Stockholders of
Panhandle Oil and Gas Inc.
We have audited the accompanying balance sheets of Panhandle Oil and Gas Inc. (the Company) as of September 30, 2015 and 2014, and the related statements of operations, stockholders' equity, and cash flows for each of the three years in the period ended September 30, 2015. These financial statements are the responsibility of the Company’s management. Our responsibility is to express an opinion on these financial statements based on our audits.
We conducted our audits in accordance with the standards of the Public Company Accounting Oversight Board (United States). Those standards require that we plan and perform the audit to obtain reasonable assurance about whether the financial statements are free of material misstatement. An audit includes examining, on a test basis, evidence supporting the amounts and disclosures in the financial statements. An audit also includes assessing the accounting principles used and significant estimates made by management, as well as evaluating the overall financial statement presentation. We believe that our audits provide a reasonable basis for our opinion.
In our opinion, the financial statements referred to above present fairly, in all material respects, the financial position of Panhandle Oil and Gas Inc. at September 30, 2015 and 2014, and the results of its operations and its cash flows for each of the three years in the period ended September 30, 2015, in conformity with U.S. generally accepted accounting principles.
We also have audited, in accordance with the standards of the Public Company Accounting Oversight Board (United States), Panhandle Oil and Gas Inc.’s internal control over financial reporting as of September 30, 2015, based on criteria established in Internal Control—Integrated Framework issued by the Committee of Sponsoring Organizations of the Treadway Commission (2013 framework) and our report dated December 10, 2015, expressed an unqualified opinion thereon.
/s/ Ernst & Young LLP
Oklahoma City, Oklahoma
December 10, 2015
(42)
Panhandle Oil and Gas Inc.
|
September 30, |
|||||
|
2015 |
2014 |
||||
|
Assets |
|||||
|
Current Assets: |
|||||
|
Cash and cash equivalents |
$ |
603,915 |
$ |
509,755 | |
|
Oil, NGL and natural gas sales receivables (net of |
|||||
|
allowance for uncollectable accounts) |
7,895,591 | 16,227,469 | |||
|
Refundable income taxes |
345,897 |
- |
|||
|
Refundable production taxes |
476,001 | 625,996 | |||
|
Derivative contracts, net |
4,210,764 | 1,650,563 | |||
|
Other |
252,016 | 354,828 | |||
|
Total current assets |
13,784,184 | 19,368,611 | |||
|
Properties and equipment at cost, based on successful |
|||||
|
efforts accounting: |
|||||
|
Producing oil and natural gas properties |
441,141,337 | 418,237,512 | |||
|
Non-producing oil and natural gas properties |
8,293,997 | 10,260,717 | |||
|
Furniture and fixtures |
1,393,559 | 1,317,725 | |||
| 450,828,893 | 429,815,954 | ||||
|
Less accumulated depreciation, depletion and |
|||||
|
amortization |
(228,036,803) | (204,731,661) | |||
|
Net properties and equipment |
222,792,090 | 225,084,293 | |||
|
Investments |
2,248,999 | 1,936,421 | |||
|
Derivative contracts, net |
- |
251,279 | |||
|
Total assets |
$ |
238,825,273 |
$ |
246,640,604 | |
(Continued on next page)
See accompanying notes.
(43)
Panhandle Oil and Gas Inc.
Balance Sheets
|
September 30, |
|||||
|
2015 |
2014 |
||||
|
Liabilities and Stockholders' Equity |
|||||
|
Current Liabilities: |
|||||
|
Accounts payable |
$ |
2,028,746 |
$ |
7,034,773 | |
|
Deferred income taxes |
1,517,100 | 600,100 | |||
|
Income taxes payable |
- |
523,843 | |||
|
Accrued liabilities and other |
1,330,901 | 1,290,858 | |||
|
Total current liabilities |
4,876,747 | 9,449,574 | |||
|
Long-term debt |
65,000,000 | 78,000,000 | |||
|
Deferred income taxes |
39,118,907 | 37,363,907 | |||
|
Asset retirement obligations |
2,824,944 | 2,638,470 | |||
|
Stockholders' equity: |
|||||
|
Class A voting common stock, $.0166 par value; |
|||||
|
24,000,000 shares authorized, 16,863,004 issued at |
|||||
|
September 30, 2015 and 2014 |
280,938 | 280,938 | |||
|
Capital in excess of par value |
2,993,119 | 2,861,343 | |||
|
Deferred directors' compensation |
3,084,289 | 3,110,351 | |||
|
Retained earnings |
125,446,473 | 118,794,188 | |||
| 131,804,819 | 125,046,820 | ||||
|
Treasury stock, at cost; 302,623 shares at |
|||||
|
September 30, 2015, and 372,364 shares at |
|||||
|
September 30, 2014 |
(4,800,144) | (5,858,167) | |||
|
Total stockholders' equity |
127,004,675 | 119,188,653 | |||
|
Total liabilities and stockholders' equity |
$ |
238,825,273 |
$ |
246,640,604 | |
See accompanying notes.
(44)
Panhandle Oil and Gas Inc.
|
Year ended September 30, |
||||||||
|
2015 |
2014 |
2013 |
||||||
|
Revenues: |
||||||||
|
Oil, NGL and natural gas sales |
$ |
54,533,914 |
$ |
82,846,528 |
$ |
60,605,878 | ||
|
Lease bonuses and rentals |
2,010,395 | 423,328 | 938,846 | |||||
|
Gains (losses) on derivative contracts |
13,822,506 | 247,414 | 611,024 | |||||
|
Income from partnerships |
515,278 | 893,954 | 733,372 | |||||
| 70,882,093 | 84,411,224 | 62,889,120 | ||||||
|
Costs and expenses: |
||||||||
|
Lease operating expenses |
17,472,408 | 13,912,792 | 11,861,403 | |||||
|
Production taxes |
1,702,302 | 2,694,118 | 1,834,840 | |||||
|
Exploration costs |
48,404 | 86,017 | 9,795 | |||||
|
Depreciation, depletion and amortization |
23,821,139 | 21,896,902 | 21,945,768 | |||||
|
Provision for impairment |
5,009,191 | 1,096,076 | 530,670 | |||||
|
Loss (gain) on asset sales and other |
(398,994) | 8,378 | (942,959) | |||||
|
Interest expense |
1,550,483 | 462,296 | 157,558 | |||||
|
General and administrative |
7,339,320 | 7,433,183 | 6,801,996 | |||||
|
Bad debt expense (recovery) |
180,499 |
- |
- |
|||||
| 56,724,752 | 47,589,762 | 42,199,071 | ||||||
|
Income (loss) before provision (benefit) |
||||||||
|
for income taxes |
14,157,341 | 36,821,462 | 20,690,049 | |||||
|
Provision (benefit) for income taxes |
4,836,000 | 11,820,000 | 6,730,000 | |||||
|
Net income (loss) |
$ |
9,321,341 |
$ |
25,001,462 |
$ |
13,960,049 | ||
|
Basic and diluted earnings (loss) per common share |
$ |
0.56 |
$ |
1.49 |
$ |
0.84 | ||
See accompanying notes.
(45)
Panhandle Oil and Gas Inc.
Statements of Stockholders’ Equity
|
Class A voting |
Capital in |
Deferred |
||||||||||||||||||||
|
Common Stock |
Excess of |
Directors' |
Retained |
Treasury |
Treasury |
|||||||||||||||||
|
Shares |
Amount |
Par Value |
Compensation |
Earnings |
Shares |
Stock |
Total |
|||||||||||||||
|
Balances at September 30, 2012 |
16,863,004 |
$ |
280,938 |
$ |
1,879,815 |
$ |
2,676,160 |
$ |
84,821,395 | (362,620) |
$ |
(5,806,162) |
$ |
83,852,146 | ||||||||
|
Purchase of treasury stock |
- |
- |
- |
- |
- |
(84,412) | (1,214,638) | (1,214,638) | ||||||||||||||
|
Issuance of treasury shares to ESOP |
- |
- |
(33,812) |
- |
- |
21,814 | 342,262 | 308,450 | ||||||||||||||
|
Restricted stock awards |
- |
- |
683,968 |
- |
- |
- |
- |
683,968 | ||||||||||||||
|
Distribution of deferred directors' |
||||||||||||||||||||||
|
compensation |
- |
- |
(82,547) | (297,154) |
- |
24,722 | 394,687 | 14,986 | ||||||||||||||
|
Common shares to be issued to |
||||||||||||||||||||||
|
directors for services |
- |
- |
- |
377,520 |
- |
- |
- |
377,520 | ||||||||||||||
|
Dividends declared ($.14 per share) |
- |
- |
- |
- |
(2,326,995) |
- |
- |
(2,326,995) | ||||||||||||||
|
Net income |
- |
- |
- |
- |
13,960,049 |
- |
- |
13,960,049 | ||||||||||||||
|
Balances at September 30, 2013 |
16,863,004 |
$ |
280,938 |
$ |
2,447,424 |
$ |
2,756,526 |
$ |
96,454,449 | (400,496) |
$ |
(6,283,851) |
$ |
95,655,486 | ||||||||
|
Purchase of treasury stock |
- |
- |
- |
- |
- |
(7,444) | (122,044) | (122,044) | ||||||||||||||
|
Issuance of treasury shares to ESOP |
- |
- |
161,363 |
- |
- |
11,428 | 179,762 | 341,125 | ||||||||||||||
|
Restricted stock awards |
- |
- |
659,320 |
- |
- |
- |
- |
659,320 | ||||||||||||||
|
Distribution of restricted stock |
||||||||||||||||||||||
|
to officers and directors |
- |
- |
(406,764) |
- |
- |
24,148 | 367,966 | (38,798) | ||||||||||||||
|
Common shares to be issued to |
||||||||||||||||||||||
|
directors for services |
- |
- |
- |
353,825 |
- |
- |
- |
353,825 | ||||||||||||||
|
Dividends declared ($.16 per share) |
- |
- |
- |
- |
(2,661,723) |
- |
- |
(2,661,723) | ||||||||||||||
|
Net income |
- |
- |
- |
- |
25,001,462 |
- |
- |
25,001,462 | ||||||||||||||
|
Balances at September 30, 2014 |
16,863,004 |
$ |
280,938 |
$ |
2,861,343 |
$ |
3,110,351 |
$ |
118,794,188 | (372,364) |
$ |
(5,858,167) |
$ |
119,188,653 | ||||||||
|
Purchase of treasury stock |
- |
- |
- |
- |
- |
(12,719) | (242,313) | (242,313) | ||||||||||||||
|
Issuance of treasury shares to ESOP |
- |
- |
3,437 |
- |
- |
11,455 | 181,676 | 185,113 | ||||||||||||||
|
Restricted stock awards |
- |
- |
895,127 |
- |
- |
- |
- |
895,127 | ||||||||||||||
|
Distribution of restricted stock |
||||||||||||||||||||||
|
to officers and directors |
- |
- |
(782,832) |
- |
- |
48,633 | 766,301 | (16,531) | ||||||||||||||
|
Distribution of deferred directors' |
||||||||||||||||||||||
|
compensation |
- |
- |
16,044 | (328,415) |
- |
22,372 | 352,359 | 39,988 | ||||||||||||||
|
Common shares to be issued to |
||||||||||||||||||||||
|
directors for services |
- |
- |
- |
302,353 |
- |
- |
- |
302,353 | ||||||||||||||
|
Dividends declared ($.16 per share) |
- |
- |
- |
- |
(2,669,056) |
- |
- |
(2,669,056) | ||||||||||||||
|
Net income |
- |
- |
- |
- |
9,321,341 |
- |
- |
9,321,341 | ||||||||||||||
|
Balances at September 30, 2015 |
16,863,004 |
$ |
280,938 |
$ |
2,993,119 |
$ |
3,084,289 |
$ |
125,446,473 | (302,623) |
$ |
(4,800,144) |
$ |
127,004,675 | ||||||||
See accompanying notes.
(46)
Statements of Cash Flows
|
Year ended September 30, |
||||||||
|
2015 |
2014 |
2013 |
||||||
|
Operating Activities |
||||||||
|
Net income (loss) |
$ |
9,321,341 |
$ |
25,001,462 |
$ |
13,960,049 | ||
|
Adjustments to reconcile net income (loss) to net |
||||||||
|
cash provided by operating activities: |
||||||||
|
Depreciation, depletion and amortization |
23,821,139 | 21,896,902 | 21,945,768 | |||||
|
Impairment |
5,009,191 | 1,096,076 | 530,670 | |||||
|
Provision for deferred income taxes |
2,672,000 | 6,610,000 | 4,767,000 | |||||
|
Exploration costs |
48,404 | 86,017 | 9,795 | |||||
|
Gain from leasing fee mineral acreage |
(2,007,993) | (422,818) | (936,701) | |||||
|
Net (gain) loss on sales of assets |
- |
149,062 | (208,750) | |||||
|
Income from partnerships |
(515,278) | (893,954) | (733,372) | |||||
|
Distributions received from partnerships |
736,280 | 1,129,324 | 917,718 | |||||
|
Common stock contributed to ESOP |
185,113 | 341,125 | 308,450 | |||||
|
Common stock (unissued) to Directors' |
||||||||
|
Deferred Compensation Plan |
302,353 | 353,825 | 377,520 | |||||
|
Restricted stock awards |
895,127 | 659,320 | 683,968 | |||||
|
Bad debt expense (recovery) |
180,499 |
- |
- |
|||||
|
Cash provided (used) by changes in assets |
||||||||
|
and liabilities: |
||||||||
|
Oil, NGL and natural gas sales receivables |
8,151,379 | (2,506,708) | (5,370,896) | |||||
|
Fair value of derivative contracts |
(2,308,922) | (1,476,644) | (597,469) | |||||
|
Refundable income taxes |
(345,897) |
- |
325,715 | |||||
|
Refundable production taxes |
149,995 | 576,537 | 294,881 | |||||
|
Other current assets |
102,812 | (224,830) | 73,508 | |||||
|
Accounts payable |
(343,186) | 252,860 | 298,191 | |||||
|
Income taxes payable |
(523,843) | (284,149) | 751,992 | |||||
|
Accrued liabilities |
40,500 | 279,195 | 4,072 | |||||
|
Total adjustments |
36,249,673 | 27,621,140 | 23,442,060 | |||||
|
Net cash provided by operating activities |
45,571,014 | 52,622,602 | 37,402,109 | |||||
(Continued on next page)
(47)
Panhandle Oil and Gas Inc.
Statements of Cash Flows (continued)
|
Year ended September 30, |
||||||||
|
2015 |
2014 |
2013 |
||||||
|
Investing Activities |
||||||||
|
Capital expenditures, including dry hole costs |
$ |
(30,800,625) |
$ |
(38,612,788) |
$ |
(26,765,785) | ||
|
Acquisition of working interest properties |
(308,180) | (83,253,952) |
- |
|||||
|
Acquisition of minerals and overrides |
- |
(56,250) | (783,750) | |||||
|
Proceeds from leasing fee mineral acreage |
2,053,900 | 477,144 | 1,023,368 | |||||
|
Investments in partnerships |
(533,580) | (597,149) | (724,118) | |||||
|
Proceeds from sales of assets |
- |
92,000 | 870,610 | |||||
|
Net cash used in investing activities |
(29,588,485) | (121,950,995) | (26,379,675) | |||||
|
Financing Activities |
||||||||
|
Borrowings under debt agreement |
25,833,116 | 99,846,333 | 11,569,652 | |||||
|
Payments of loan principal |
(38,833,116) | (30,108,589) | (18,182,381) | |||||
|
Purchases of treasury stock |
(242,313) | (122,044) | (1,214,638) | |||||
|
Payments of dividends |
(2,669,056) | (2,661,723) | (2,326,995) | |||||
|
Excess tax benefit on stock-based compensation |
23,000 | 17,000 | 15,000 | |||||
|
Net cash provided by (used in) financing activities |
(15,888,369) | 66,970,977 | (10,139,362) | |||||
|
Increase (decrease) in cash and cash equivalents |
94,160 | (2,357,416) | 883,072 | |||||
|
Cash and cash equivalents at beginning of year |
509,755 | 2,867,171 | 1,984,099 | |||||
|
Cash and cash equivalents at end of year |
$ |
603,915 |
$ |
509,755 |
$ |
2,867,171 | ||
|
Supplemental Disclosures of Cash Flow |
||||||||
|
Information |
||||||||
|
Interest paid (net of capitalized interest) |
$ |
1,558,885 |
$ |
380,451 |
$ |
157,558 | ||
|
Income taxes paid, net of refunds received |
$ |
3,009,939 |
$ |
5,477,147 |
$ |
870,295 | ||
|
Supplemental schedule of noncash |
||||||||
|
investing and financing activities: |
||||||||
|
Additions and revisions, net, to asset |
||||||||
|
retirement obligations |
$ |
70,529 |
$ |
225,453 |
$ |
161,065 | ||
|
Gross additions to properties and equipment |
$ |
26,183,115 |
$ |
120,284,639 |
$ |
29,261,285 | ||
|
Net (increase) decrease in accounts payable for |
||||||||
|
properties and equipment additions |
4,925,690 | 1,638,351 | (1,711,750) | |||||
|
Capital expenditures, including dry hole costs |
$ |
31,108,805 |
$ |
121,922,990 |
$ |
27,549,535 | ||
See accompanying notes.
(48)
Panhandle Oil and Gas Inc.
September 30, 2015, 2014 and 2013
1. SUMMARY OF SIGNIFICANT ACCOUNTING POLICIES
Nature of Business
Through management of its fee mineral and leasehold acreage, the Company’s principal line of business is to explore for, develop, acquire, produce and sell oil, NGL and natural gas. Panhandle’s mineral and leasehold properties and other oil and natural gas interests are all located in the contiguous United States, primarily in Arkansas, New Mexico, North Dakota, Oklahoma and Texas, except for very minor foreign overriding royalty interests. The Company’s oil, NGL and natural gas production is from interests in 6,195 wells located principally in Arkansas, Oklahoma and Texas. The Company is not the operator of any wells. Approximately 49% of oil, NGL and natural gas revenues were derived from the sale of natural gas in 2015. Approximately 71% of the Company’s total sales volumes in 2015 were derived from natural gas. Substantially all the Company’s oil, NGL and natural gas production is sold through the operators of the wells. The Company from time to time disposes of certain non-material, non-core or small-interest oil and natural gas properties in the normal course of business.
Use of Estimates
Preparation of financial statements in conformity with accounting principles generally accepted in the United States requires management to make estimates and assumptions that affect the amounts and disclosures reported in the financial statements and accompanying notes. Actual results could differ from those estimates.
Of these estimates and assumptions, management considers the estimation of crude oil, NGL and natural gas reserves to be the most significant. These estimates affect the unaudited standardized measure disclosures, as well as DD&A and impairment calculations. On an annual basis, with a semi-annual update, the Company’s Independent Consulting Petroleum Engineer, with assistance from the Company, prepares estimates of crude oil, NGL and natural gas reserves based on available geologic and seismic data, reservoir pressure data, core analysis reports, well logs, analogous reservoir performance history, production data and other available sources of engineering, geological and geophysical information. For DD&A purposes, and as required by the guidelines and definitions established by the SEC, the reserve estimates were based on average individual product prices during the 12-month period prior to September 30, determined as an unweighted arithmetic average of the first-day-of-the-month price for each month within such period, unless prices were defined by contractual arrangements, excluding escalations based upon future conditions. For impairment purposes, projected future crude oil, NGL and natural gas prices as estimated by management are used. Crude oil, NGL and natural gas prices are volatile and largely affected by worldwide production and consumption and are outside the control of management. Projected future crude oil, NGL and natural gas pricing assumptions are used by management to prepare estimates of crude oil, NGL and natural gas reserves used in formulating management’s overall operating decisions.
(49)
Panhandle Oil and Gas Inc.
Notes to Financial Statements (continued)
1. SUMMARY OF SIGNIFICANT ACCOUNTING POLICIES (CONTINUED)
The Company does not operate its oil and natural gas properties and, therefore, receives actual oil, NGL and natural gas sales volumes and prices (in the normal course of business) more than a month later than the information is available to the operators of the wells. This being the case, on wells with greater significance to the Company, the most current available production data is gathered from the appropriate operators, and oil, NGL and natural gas index prices local to each well are used to estimate the accrual of revenue on these wells. Timely obtaining production data on all other wells from the operators is not feasible; therefore, the Company utilizes past production receipts and estimated sales price information to estimate its accrual of revenue on all other wells each quarter. The oil, NGL and natural gas sales revenue accrual can be impacted by many variables including rapid production decline rates, production curtailments by operators, the shut-in of wells with mechanical problems and rapidly changing market prices for oil, NGL and natural gas. These variables could lead to an over or under accrual of oil, NGL and natural gas sales at the end of any particular quarter. Based on past history, the Company’s estimated accrual has been materially accurate.
Cash and Cash Equivalents
Cash and cash equivalents consist of all demand deposits and funds invested in short-term investments with original maturities of three months or less.
Oil, NGL and Natural Gas Sales and Natural Gas Imbalances
The Company sells oil, NGL and natural gas to various customers, recognizing revenues as oil, NGL and natural gas is produced and sold. Charges for compression, marketing, gathering and transportation of natural gas are included in lease operating expenses.
The Company uses the sales method of accounting for natural gas imbalances in those circumstances where it has underproduced or overproduced its ownership percentage in a property. Under this method, a receivable or liability is recorded to the extent that an underproduced or overproduced position in a well cannot be recouped through the production of remaining reserves. At September 30, 2015 and 2014, the Company had no material natural gas imbalances.
Accounts Receivable and Concentration of Credit Risk
Substantially all of the Company’s accounts receivable are due from purchasers of oil, NGL and natural gas or operators of the oil and natural gas properties. Oil, NGL and natural gas sales receivables are generally unsecured. This industry concentration has the potential to impact our overall exposure to credit risk, in that the purchasers of our oil, NGL and natural gas and the operators of the properties we have an interest in may be similarly affected by changes in economic, industry or other conditions. During 2015 and 2014, the Company recognized a reserve for bad debt expense of $180,499 and $0, respectively.
Oil and Natural Gas Producing Activities
The Company follows the successful efforts method of accounting for oil and natural gas producing activities. Intangible drilling and other costs of successful wells and development dry holes are capitalized and amortized. The costs of exploratory wells are initially capitalized, but charged against
(50)
Panhandle Oil and Gas Inc.
Notes to Financial Statements (continued)
1. SUMMARY OF SIGNIFICANT ACCOUNTING POLICIES (CONTINUED)
income if and when the well is determined to be nonproductive. Oil and natural gas mineral and leasehold costs are capitalized when incurred.
Non-producing oil and natural gas leases are assessed for impairment on a property-by-property basis for individually significant balances and on an aggregate basis for individually insignificant balances. If the assessment indicates an impairment, a loss is recognized by providing a valuation allowance at the level at which impairment was assessed. The impairment assessment is affected by economic factors such as the results of exploration activities, commodity price outlooks, remaining lease terms and potential shifts in business strategy employed by management. In the case of individually insignificant balances, the amount of the impairment loss recognized is determined by amortizing the portion of these properties’ costs, which the Company believes will not be transferred to proved properties over the remaining lives of the leases. Impairment loss is charged to exploration costs when recognized. As of September 30, 2015, the remaining carrying cost of non-producing oil and natural gas leases was $185,124.
It is common business practice in the petroleum industry for drilling costs to be prepaid before spudding a well. The Company frequently fulfills these prepayment requirements with cash payments, but at times will utilize letters of credit to meet these obligations. As of September 30, 2015, the Company had no outstanding letters of credit.
Leasing of Mineral Rights
When the Company leases its mineral acreage to third-party exploration and production companies, it retains a royalty interest in any future revenues from the production and sale of oil, NGL or natural gas, and often receives an up-front, non-refundable, cash payment (lease bonus) in addition to the retained royalty interest. A royalty interest does not bear any portion of the cost of drilling, completing or operating a well; these costs are borne by the working interest owners. The Company sometimes leases only a portion of its mineral acres in a tract and retains the right to participate as a working interest owner with the remainder.
The Company recognizes revenue from mineral lease bonus payments when it has received an executed lease agreement with the exploration company transferring the rights to explore for and produce any oil or natural gas they may find within the term of the lease, the payment has been collected, and the Company has no obligation to refund the payment. The Company accounts for its lease bonuses in accordance with the guidance set forth in ASC 932, and it recognizes the lease bonus as a cost recovery with any excess above its cost basis in the mineral being treated as a gain. The excess of lease bonus above the mineral basis is shown in the lease bonuses and rentals line item on the Company’s Statements of Operations.
Derivatives
The Company has entered into fixed swap contracts and costless collar contracts. These instruments are intended to reduce the Company’s exposure to short-term fluctuations in the price of oil and natural gas. Collar contracts set a fixed floor price and a fixed ceiling price and provide payments to the Company if the index price falls below the floor or require payments by the Company if the index price rises above the ceiling. Fixed swap contracts set a fixed price and provide payments to the Company if the index price is below the fixed price, or require payments by the Company if the index
(51)
Panhandle Oil and Gas Inc.
Notes to Financial Statements (continued)
1. SUMMARY OF SIGNIFICANT ACCOUNTING POLICIES (CONTINUED)
price is above the fixed price. These contracts cover only a portion of the Company’s oil and natural gas production and provide only partial price protection against declines in oil and natural gas prices. These derivative instruments expose the Company to risk of financial loss and may limit the benefit of future increases in prices. All of the Company’s derivative contracts are with Bank of Oklahoma and are secured under its credit facility with Bank of Oklahoma. The derivative instruments have settled or will settle based on the prices below, which are adjusted for location differentials and tied to certain pipelines.
Derivative contracts in place as of September 30, 2014
(prices below reflect the Company’s net price from the listed pipelines)
|
Production volume |
Indexed |
|||||
|
Contract period |
covered per month |
Pipeline |
Fixed price |
|||
|
Natural gas costless collars |
||||||
|
July - December 2014 |
140,000 Mmbtu |
NYMEX Henry Hub |
$3.75 floor / $4.50 ceiling |
|||
|
Natural gas fixed price swaps |
||||||
|
July - December 2014 |
140,000 Mmbtu |
NYMEX Henry Hub |
$4.11 |
|||
|
May - October 2014 |
30,000 Mmbtu |
NYMEX Henry Hub |
$4.30 |
|||
|
October - December 2014 |
40,000 Mmbtu |
NYMEX Henry Hub |
$4.61 |
|||
|
Oil costless collars |
||||||
|
January - December 2014 |
4,000 Bbls |
NYMEX WTI |
$85.00 floor / $100.00 ceiling |
|||
|
July - December 2014 |
5,000 Bbls |
NYMEX WTI |
$90.00 floor / $97.00 ceiling |
|||
|
Oil fixed price swaps |
||||||
|
January - December 2014 |
3,000 Bbls |
NYMEX WTI |
$94.50 |
|||
|
June - December 2014 |
4,000 Bbls |
NYMEX WTI |
$99.40 |
|||
|
July - December 2014 |
4,000 Bbls |
NYMEX WTI |
$95.25 |
|||
|
July - December 2014 |
5,000 Bbls |
NYMEX WTI |
$94.20 |
|||
|
January - March 2015 |
6,000 Bbls |
NYMEX WTI |
$92.85 |
|||
|
January - June 2015 |
7,000 Bbls |
NYMEX WTI |
$96.80 |
|||
|
January - June 2015 |
5,000 Bbls |
NYMEX WTI |
$97.40 |
|||
|
January - June 2015 |
4,000 Bbls |
NYMEX WTI |
$97.25 |
|||
|
April - December 2015 |
5,000 Bbls |
NYMEX WTI |
$94.56 |
|||
|
July - December 2015 |
7,000 Bbls |
NYMEX WTI |
$93.91 |
(52)
Panhandle Oil and Gas Inc.
Notes to Financial Statements (continued)
1. SUMMARY OF SIGNIFICANT ACCOUNTING POLICIES (CONTINUED)
Derivative contracts in place as of September 30, 2015
(prices below reflect the Company’s net price from the listed pipelines)
|
Production volume |
Indexed |
|||||
|
Contract period |
covered per month |
pipeline |
Fixed price |
|||
|
Natural gas costless collars |
||||||
|
January - December 2015 |
100,000 Mmbtu |
NYMEX Henry Hub |
$3.50 floor / $4.10 ceiling |
|||
|
January - December 2015 |
70,000 Mmbtu |
NYMEX Henry Hub |
$3.25 floor / $4.00 ceiling |
|||
|
April - October 2015 |
50,000 Mmbtu |
NYMEX Henry Hub |
$3.50 floor / $4.00 ceiling |
|||
|
May - October 2015 |
70,000 Mmbtu |
NYMEX Henry Hub |
$3.50 floor / $3.95 ceiling |
|||
|
Oil costless collars |
||||||
|
July - December 2015 |
10,000 Bbls |
NYMEX WTI |
$80.00 floor / $86.50 ceiling |
|||
|
Oil fixed price swaps |
||||||
|
April - December 2015 |
5,000 Bbls |
NYMEX WTI |
$94.56 |
|||
|
July - December 2015 |
7,000 Bbls |
NYMEX WTI |
$93.91 |
The Company has elected not to complete the documentation requirements necessary to permit these derivative contracts to be accounted for as cash flow hedges. The Company’s fair value of derivative contracts was a net asset of $4,210,764 as of September 30, 2015, and a net asset of $1,901,842 as of September 30, 2014. Realized and unrealized gains and (losses) are recorded in gains (losses) on derivative contracts on the Company’s Statement of Operations.
The fair value amounts recognized for the Company’s derivative contracts executed with the same counterparty under a master netting arrangement may be offset. The Company has the choice to offset or not, but that choice must be applied consistently. A master netting arrangement exists if the reporting entity has multiple contracts with a single counterparty that are subject to a contractual agreement that provides for the net settlement of all contracts through a single payment in a single currency in the event of default on or termination of any one contract. Offsetting the fair values recognized for the derivative contracts outstanding with a single counterparty results in the net fair value of the transactions being reported as an asset or a liability in the Balance Sheets. The following table summarizes and reconciles the Company's derivative contracts’ fair values at a gross level back to net fair value presentation on the Company's Balance Sheets at September 30, 2015, and September 30, 2014. The Company has offset all amounts subject to master netting agreements in the Company's Balance Sheets at September 30, 2015, and September 30, 2014.
(53)
Panhandle Oil and Gas Inc.
Notes to Financial Statements (continued)
1. SUMMARY OF SIGNIFICANT ACCOUNTING POLICIES (CONTINUED)
|
9/30/2015 |
9/30/2014 |
|||||||||||
|
Fair Value (a) |
Fair Value (a) |
|||||||||||
|
Commodity Contracts |
Commodity Contracts |
|||||||||||
|
Current Assets |
Current Assets |
Current Liabilities |
Non-Current Assets |
|||||||||
|
Gross amounts recognized |
$ |
4,210,764 |
$ |
1,658,785 |
$ |
8,222 |
$ |
251,279 | ||||
|
Offsetting adjustments |
- |
(8,222) | (8,222) |
- |
||||||||
|
Net presentation on |
||||||||||||
|
Balance Sheets |
$ |
4,210,764 |
$ |
1,650,563 |
$ |
- |
$ |
251,279 | ||||
(a)See Fair Value Measurements section for further disclosures regarding fair value of financial instruments.
The fair value of derivative assets and derivative liabilities is adjusted for credit risk only if the impact is deemed material. The impact of credit risk was immaterial for all periods presented.
Fair Value Measurements
Fair value is defined as the amount that would be received from the sale of an asset or paid for the transfer of a liability in an orderly transaction between market participants, i.e., an exit price. To estimate an exit price, a three-level hierarchy is used. The fair value hierarchy prioritizes the inputs, which refer broadly to assumptions market participants would use in pricing an asset or a liability, into three levels. Level 1 inputs are unadjusted quoted prices in active markets for identical assets and liabilities. Level 2 inputs are inputs other than quoted prices included within Level 1 that are observable for the asset or liability, either directly or indirectly. If the asset or liability has a specified (contractual) term, a Level 2 input must be observable for substantially the full term of the asset or liability. Level 2 inputs include the following: (i) quoted prices for similar assets or liabilities in active markets; (ii) quoted prices for identical or similar assets or liabilities in markets that are not active; (iii) inputs other than quoted prices that are observable for the asset or liability; or (iv) inputs that are derived principally from, or corroborated by, observable market data by correlation or other means. Level 3 inputs are unobservable inputs for the financial asset or liability.
The following table provides fair value measurement information for financial assets and liabilities measured at fair value on a recurring basis.
(54)
Panhandle Oil and Gas Inc.
Notes to Financial Statements (continued)
1. SUMMARY OF SIGNIFICANT ACCOUNTING POLICIES (CONTINUED)
|
Fair Value Measurement at September 30, 2015 |
||||||||||||
|
Quoted Prices in Active Markets |
Significant Other Observable Inputs |
Significant Unobservable Inputs |
Total Fair |
|||||||||
|
(Level 1) |
(Level 2) |
(Level 3) |
Value |
|||||||||
|
Financial Assets (Liabilities): |
||||||||||||
|
Derivative Contracts - Swaps |
$ |
- |
$ |
2,319,515 |
$ |
- |
$ |
2,319,515 | ||||
|
Derivative Contracts - Collars |
$ |
- |
$ |
- |
$ |
1,891,249 |
$ |
1,891,249 | ||||
|
Fair Value Measurement at September 30, 2014 |
||||||||||||
|
Quoted Prices in Active Markets |
Significant Other Observable Inputs |
Significant Unobservable Inputs |
Total Fair |
|||||||||
|
(Level 1) |
(Level 2) |
(Level 3) |
Value |
|||||||||
|
Financial Assets (Liabilities): |
||||||||||||
|
Derivative Contracts - Swaps |
$ |
- |
$ |
1,871,798 |
$ |
- |
$ |
1,871,798 | ||||
|
Derivative Contracts - Collars |
$ |
- |
$ |
- |
$ |
30,044 |
$ |
30,044 | ||||
Level 2 – Market Approach - The fair values of the Company’s swaps are based on a third-party pricing model which utilizes inputs that are either readily available in the public market, such as natural gas curves, or can be corroborated from active markets. These values are based upon future prices, time to maturity and other factors. These values are then compared to the values given by our counterparties for reasonableness.
Level 3 – The fair values of the Company’s costless collar contracts are based on a pricing model which utilizes inputs that are unobservable or not readily available in the public market. These values are based upon future prices, volatility, time to maturity and other factors. These values are then compared to the values given by our counterparties for reasonableness.
The significant unobservable inputs for Level 3 derivative contracts include market volatility and credit risk of counterparties. Changes in these inputs will impact the fair value measurement of our derivative contracts. An increase (decrease) in the forward prices and volatility of oil and natural gas prices will decrease (increase) the fair value of oil and natural gas derivatives, and adverse changes to our counterparties’ creditworthiness will decrease the fair value of our derivatives.
The following table represents quantitative disclosures about unobservable inputs for Level 3 Fair Value Measurements.
(55)
Panhandle Oil and Gas Inc.
Notes to Financial Statements (continued)
1. SUMMARY OF SIGNIFICANT ACCOUNTING POLICIES (CONTINUED)
|
Instrument Type |
Unobservable Input |
Range |
Weighted Average |
Fair Value Assets (Liabilities) September 30, 2015 |
|||||
|
Oil Collars |
Oil price volatility curve |
0% - 21.36% |
14.92% |
$ |
1,367,820 | ||||
|
Natural Gas Collars |
Natural gas price volatility curve |
0% - 16.42% |
7.49% |
$ |
523,429 | ||||
A reconciliation of the Company’s derivative contracts classified as Level 3 measurements is presented below.
|
Derivatives |
||
|
Net Asset (Liability) Balance of Level 3 as of October 1, 2014 |
$ |
30,044 |
|
Total gains or (losses): |
||
|
Included in earnings |
(1,704,094) | |
|
Included in other comprehensive income (loss) |
- |
|
|
Purchases, issuances and settlements |
3,565,299 | |
|
Transfers in and out of Level 3 |
- |
|
|
Net Asset (Liability) Balance of Level 3 as of September 30, 2015 |
$ |
1,891,249 |
The following table presents impairments associated with certain assets that have been measured at fair value on a nonrecurring basis within Level 3 of the fair value hierarchy.
|
Year Ended September 30, |
||||||||||||
|
2015 |
2014 |
|||||||||||
|
Fair Value |
Impairment |
Fair Value |
Impairment |
|||||||||
|
Producing Properties (a) |
$ |
4,897,269 |
$ |
5,009,191 |
$ |
988,673 |
$ |
1,096,076 | ||||
|
(a) |
At the end of each quarter, the Company assessed the carrying value of its producing properties for impairment. This assessment utilized estimates of future cash flows. Significant judgments and assumptions in these assessments include estimates of future oil, NGL and natural gas prices using a forward NYMEX curve adjusted for projected inflation, locational basis differentials, drilling plans, expected capital costs and an applicable discount rate commensurate with risk of the underlying cash flow estimates. These assessments identified certain properties with carrying value in excess of their calculated fair values. |
At September 30, 2015, and September 30, 2014, the fair value of financial instruments approximated their carrying amounts. Financial instruments include long-term debt, which valuation is classified as Level 3 and is based on a valuation technique that requires inputs that are both unobservable and significant to the overall fair value measurement. The fair value measurement of our long-term debt is valued using a discounted cash flow model that calculates the present value of future cash flows pursuant to the terms of the debt agreements and applies estimated current market interest rates. The estimated current market interest rates are based primarily on interest rates currently being
(56)
Panhandle Oil and Gas Inc.
Notes to Financial Statements (continued)
1. SUMMARY OF SIGNIFICANT ACCOUNTING POLICIES (CONTINUED)
offered on borrowings of similar amounts and terms. In addition, no valuation input adjustments relating to nonperformance risk for the debt agreements were considered necessary.
Depreciation, Depletion, Amortization and Impairment
Depreciation, depletion and amortization of the costs of producing oil and natural gas properties are generally computed using the unit-of-production method primarily on an individual property basis using proved or proved developed reserves, as applicable, as estimated by the Company’s Independent Consulting Petroleum Engineer. The Company’s capitalized costs of drilling and equipping all development wells and those exploratory wells that have found proved reserves are amortized on a unit-of-production basis over the remaining life of associated proved developed reserves. Lease costs are amortized on a unit-of-production basis over the remaining life of associated total proved reserves. Depreciation of furniture and fixtures is computed using the straight-line method over estimated productive lives of five to eight years.
Non-producing oil and natural gas properties include non-producing minerals, which had a net book value of $4,016,465 and $4,322,637 at September 30, 2015 and 2014, respectively, consisting of perpetual ownership of mineral interests in several states, with 91% of the acreage in Arkansas, New Mexico, North Dakota, Oklahoma and Texas. As mentioned, these mineral rights are perpetual and have been accumulated over the 89-year life of the Company. There are approximately 198,981 net acres of non-producing minerals in more than 6,570 tracts owned by the Company. An average tract contains approximately 30 acres, and the average cost per acre is $41. Since inception, the Company has continually generated an interest in several thousand oil and natural gas wells using its ownership of the fee mineral acres as an ownership basis. There continues to be significant drilling and leasing activity each year on these mineral interests. Non-producing minerals are being amortized straight-line over a 33-year period. These assets are considered a long-term investment by the Company, as they do not expire (as do oil and natural gas leases). Given the above, management concluded that a long-term amortization was appropriate and that 33 years, based on past history and experience, was an appropriate period. Due to the fact that the minerals consist of a large number of properties, whose costs are not individually significant, and because virtually all are in the Company’s core operating areas, the minerals are being amortized on an aggregate basis.
The Company recognizes impairment losses for long-lived assets when indicators of impairment are present and the undiscounted cash flows are not sufficient to recover the assets’ carrying amount. The impairment loss is measured by comparing the fair value of the asset to its carrying amount. Fair values are based on discounted cash flow as estimated by the Company’s Independent Consulting Petroleum Engineer. The Company's estimate of fair value of its oil and natural gas properties at September 30, 2015, is based on the best information available as of that date, including estimates of forward oil, NGL and natural gas prices and costs. The Company’s oil and natural gas properties were reviewed for impairment on a field-by-field basis, resulting in the recognition of impairment provisions of $5,009,191, $1,096,076 and $530,670 for 2015, 2014 and 2013, respectively,. A further reduction in oil, NGL and natural gas prices or a decline in reserve volumes may lead to additional impairment in future periods that may be material to the Company. Should product price expectations continue to decline below levels seen at September 30, 2015, in future periods, impairment charges significantly greater than the Company has incurred in prior periods could result.
(57)
Panhandle Oil and Gas Inc.
Notes to Financial Statements (continued)
1. SUMMARY OF SIGNIFICANT ACCOUNTING POLICIES (CONTINUED)
Capitalized Interest
During 2015, 2014 and 2013, interest of $148,493, $172,499 and $121,418, respectively, was included in the Company’s capital expenditures. Interest of $1,550,483, $462,296 and $157,558, respectively, was charged to expense during those periods. Interest is capitalized using a weighted average interest rate based on the Company’s outstanding borrowings. These capitalized costs are included with intangible drilling costs and amortized using the unit-of-production method.
Investments
Insignificant investments in partnerships and limited liability companies (LLC) that maintain specific ownership accounts for each investor and where the Company holds an interest of 5% or greater, but does not have control of the partnership or LLC, are accounted for using the equity method of accounting.
Asset Retirement Obligations
The Company owns interests in oil and natural gas properties, which may require expenditures to plug and abandon the wells upon the end of their economic lives. The fair value of legal obligations to retire and remove long-lived assets is recorded in the period in which the obligation is incurred (typically when the asset is installed at the production location). When the liability is initially recorded, this cost is capitalized by increasing the carrying amount of the related properties and equipment. Over time the liability is increased for the change in its present value, and the capitalized cost in properties and equipment is depreciated over the useful life of the remaining asset. The Company does not have any assets restricted for the purpose of settling the asset retirement obligations.
The following table shows the activity for the years ended September 30, 2015 and 2014, relating to the Company’s asset retirement obligations:
|
2015 |
2014 |
|||||
|
Asset Retirement Obligations as of beginning of the year |
$ |
2,638,470 |
$ |
2,393,190 | ||
|
Accretion of Discount |
126,769 | 127,656 | ||||
|
Wells Acquired or Drilled |
78,110 | 251,155 | ||||
|
Wells Sold or Plugged |
(18,405) | (133,531) | ||||
|
Asset Retirement Obligations as of end of the year |
$ |
2,824,944 |
$ |
2,638,470 | ||
Environmental Costs
As the Company is directly involved in the extraction and use of natural resources, it is subject to various federal, state and local provisions regarding environmental and ecological matters. Compliance with these laws may necessitate significant capital outlays. The Company does not believe the existence of current environmental laws or interpretations thereof will materially hinder or adversely affect the Company’s business operations; however, there can be no assurances of future effects on the Company of new laws or interpretations thereof. Since the Company does not operate any wells where it owns an interest, actual compliance with environmental laws is controlled by the well operators, with Panhandle
(58)
Panhandle Oil and Gas Inc.
Notes to Financial Statements (continued)
1. SUMMARY OF SIGNIFICANT ACCOUNTING POLICIES (CONTINUED)
being responsible for its proportionate share of the costs involved. Panhandle carries liability and pollution control insurance. However, all risks are not insured due to the availability and cost of insurance.
Environmental liabilities, which historically have not been material, are recognized when it is probable that a loss has been incurred and the amount of that loss is reasonably estimable. Environmental liabilities, when accrued, are based upon estimates of expected future costs. At September 30, 2015 and 2014, there were no such costs accrued.
Earnings (Loss) Per Share of Common Stock
Earnings (loss) per share is calculated using net income (loss) divided by the weighted average number of common shares outstanding, plus unissued, vested directors’ deferred compensation shares during the period.
Share-based Compensation
The Company recognizes current compensation costs for its Deferred Compensation Plan for Non-Employee Directors (the “Plan”). Compensation cost is recognized for the requisite directors’ fees as earned and unissued stock is recorded to each director’s account based on the fair market value of the stock at the date earned. The Plan provides that upon retirement, termination or death of the director or upon a change in control of the Company, the shares accrued under the Plan will be issued to the director.
In accordance with guidance on accounting for employee stock ownership plans, the Company records as expense the fair market value of the stock contributed into its ESOP.
Restricted stock awards to officers provide for cliff vesting at the end of three or five years from the date of the awards. These restricted stock awards can be granted based on service time only (non-performance based) or subject to certain share price performance standards (performance based). Restricted stock awards to the non-employee directors provide for quarterly vesting during the calendar year of the award. The fair value of the awards on the grant date is ratably expensed over the vesting period in accordance with accounting guidance.
Income Taxes
The estimation of amounts of income tax to be recorded by the Company involves interpretation of complex tax laws and regulations, as well as the completion of complex calculations, including the determination of the Company’s percentage depletion deduction. Although the Company’s management believes its tax accruals are adequate, differences may occur in the future depending on the resolution of pending and new tax regulations. Deferred income taxes are computed using the liability method and are provided on all temporary differences between the financial basis and the tax basis of the Company’s assets and liabilities.
The threshold for recognizing the financial statement effect of a tax position is when it is more likely than not, based on the technical merits, that the position will be sustained by a taxing authority. Recognized tax positions are initially and subsequently measured as the largest amount of tax benefit that is more likely than not to be realized upon ultimate settlement with a taxing authority. The Company files
(59)
Panhandle Oil and Gas Inc.
Notes to Financial Statements (continued)
1. SUMMARY OF SIGNIFICANT ACCOUNTING POLICIES (CONTINUED)
income tax returns in the U.S. federal jurisdiction and various state jurisdictions. Subject to statutory exceptions that allow for a possible extension of the assessment period, the Company is no longer subject to U.S. federal, state, and local income tax examinations for fiscal years prior to 2012.
The Company includes interest assessed by the taxing authorities in interest expense and penalties related to income taxes in general and administrative expense on its Statements of Operations. For fiscal September 30, 2015, 2014 and 2013, the Company recorded interest and penalties of $17, $0 and $927, respectively. The Company does not believe it has any significant uncertain tax positions.
New Accounting Standards
In May 2014, the Financial Accounting Standards Board (“FASB”) issued Accounting Standard Update (“ASU”) 2014-09-Revenue from Contracts with Customers, which will supersede nearly all existing revenue recognition guidance under GAAP. The standard’s core principle is that a company will recognize revenue when it transfers promised goods or services to customers in an amount that reflects the consideration to which the company expects to be entitled in exchange for those goods or services. We are evaluating our existing revenue recognition policies to determine whether any contracts in the scope of the guidance will be affected by the new requirements. The standard is effective for us on October 1, 2018. Early adoption is not permitted. The standard allows for either “full retrospective” adoption, meaning the standard is applied to all of the periods presented, or “modified retrospective” adoption, meaning the standard is applied only to the most current period presented in the financial statements. We are currently evaluating the transition method that will be elected and the impact on our financial statements.
In April 2015, the FASB issued an accounting standards update on the presentation of debt issuance costs. The update requires that debt issuance costs related to a recognized debt liability be presented in the balance sheet as a direct deduction from the carrying amount of that debt liability, consistent with debt discounts. The recognition and measurement guidance for debt issuance costs is not affected by the update. For public entities, the guidance is effective for reporting periods beginning after December 15, 2015, and it is not expected to have a material impact on our financial statements.
In August 2015, the FASB issued an accounting standards update which allows for line-of-credit arrangements to be handled consistently with the presentation of debt issuance costs update issued in April 2015. For public entities, the guidance is effective for reporting periods beginning after December 15, 2015, and it is not expected to have a material impact on our financial statements.
Other accounting standards that have been issued or proposed by the FASB, or other standards-setting bodies, that do not require adoption until a future date are not expected to have a material impact on the financial statements upon adoption.
2. COMMITMENTS
The Company leases office space in Oklahoma City, Oklahoma, under the terms of an operating lease expiring in April 2020. Future minimum rental payments under the terms of the lease are $204,089, $204,089, $206,665, $210,273 and $122,659 in 2016, 2017, 2018, 2019 and 2020, respectively. Total rent expense incurred by the Company was $198,238 in 2015, $202,134 in 2014 and $200,782 in 2013.
(60)
Panhandle Oil and Gas Inc.
Notes to Financial Statements (continued)
3. INCOME TAXES
The Company’s provision (benefit) for income taxes is detailed as follows:
|
2015 |
2014 |
2013 |
||||||
|
Current: |
||||||||
|
Federal |
$ |
2,053,000 |
$ |
4,996,000 |
$ |
1,813,000 | ||
|
State |
111,000 | 214,000 | 150,000 | |||||
| 2,164,000 | 5,210,000 | 1,963,000 | ||||||
|
Deferred: |
||||||||
|
Federal |
2,033,000 | 5,702,000 | 4,003,000 | |||||
|
State |
639,000 | 908,000 | 764,000 | |||||
| 2,672,000 | 6,610,000 | 4,767,000 | ||||||
|
$ |
4,836,000 |
$ |
11,820,000 |
$ |
6,730,000 | |||
The difference between the provision (benefit) for income taxes and the amount which would result from the application of the federal statutory rate to income before provision (benefit) for income taxes is analyzed below for the years ended September 30:
|
2015 |
2014 |
2013 |
||||||
|
Provision (benefit) for income taxes at statutory rate |
$ |
4,955,069 |
$ |
12,887,512 |
$ |
7,241,517 | ||
|
Percentage depletion |
(530,783) | (1,466,456) | (1,059,303) | |||||
|
State income taxes, net of federal provision (benefit) |
487,500 | 1,018,550 | 572,650 | |||||
|
Other |
(75,786) | (619,606) | (24,864) | |||||
|
$ |
4,836,000 |
$ |
11,820,000 |
$ |
6,730,000 | |||
Deferred tax assets and liabilities, resulting from differences between the financial statement carrying amounts and the tax basis of assets and liabilities, consist of the following at September 30:
(61)
Panhandle Oil and Gas Inc.
Notes to Financial Statements (continued)
3. INCOME TAXES (CONTINUED)
|
2015 |
2014 |
||||
|
Deferred tax liabilities: |
|||||
|
Financial basis in excess of tax basis, principally |
|||||
|
intangible drilling costs capitalized for financial |
|||||
|
purposes and expensed for tax purposes |
$ |
41,880,691 |
$ |
40,052,983 | |
|
Derivative contracts |
1,637,987 | 739,817 | |||
| 43,518,678 | 40,792,800 | ||||
|
Deferred tax assets: |
|||||
|
State net operating loss carry forwards |
323,536 | 498,539 | |||
|
AMT credit carry forwards |
164,478 |
- |
|||
|
Deferred directors' compensation |
1,149,217 | 1,159,355 | |||
|
Restricted stock expense |
457,934 | 475,561 | |||
|
Other |
787,506 | 695,338 | |||
| 2,882,671 | 2,828,793 | ||||
|
Net deferred tax liabilities |
$ |
40,636,007 |
$ |
37,964,007 | |
At September 30, 2015, the Company had an income tax benefit of $323,536 related to Oklahoma state income tax net operating loss (OK NOL) carry forwards expiring from 2028 to 2031. There is no valuation allowance for the OK NOL’s as management believes they will be utilized before they expire. The AMT carry forwards do not have an expiration date.
4. LONG-TERM DEBT
The Company has a $200,000,000 credit facility with a group of banks headed by Bank of Oklahoma (BOK) with a borrowing base of $100,000,000 and a maturity date of November 30, 2018. The credit facility is subject to a semi-annual borrowing base determination, wherein BOK applies their own current pricing forecast and an 8% discount rate to the Company’s proved reserves as calculated by the Company’s Independent Consulting Petroleum Engineering Firm. The facility is secured by certain of the Company’s properties with a carrying value of $166,401,695 at September 30, 2015. The interest rate is based on BOK prime plus from 0.375% to 1.125%, or 30 day LIBOR plus from 1.875% to 2.625%. The election of BOK prime or LIBOR is at the Company’s discretion. The interest rate spread from BOK prime or LIBOR will be charged based on the ratio of the loan balance to the borrowing base. The interest rate spread from LIBOR or the prime rate increases as a larger percent of the borrowing base is advanced. At September 30, 2015, the effective interest rate was 2.37%.
The Company’s debt is recorded at the carrying amount on its balance sheet. The carrying amount of the Company’s revolving credit facility approximates fair value because the interest rates are reflective of market rates.
On December 10, 2015, the borrowing base was adjusted by the banks from $120,000,000 to $100,000,000. Determinations of the borrowing base are made semi-annually or whenever the bank, in its sole discretion, believes that there has been a material change in the value of the oil and natural gas properties. The loan agreement contains customary covenants which, among other things, require periodic financial and reserve reporting and limit the Company’s incurrence of indebtedness, liens,
(62)
Panhandle Oil and Gas Inc.
Notes to Financial Statements (continued)
4. LONG-TERM DEBT (CONTINUED)
dividends and acquisitions of treasury stock, and require the Company to maintain certain financial ratios. At September 30, 2015, the Company was in compliance with the covenants of the BOK agreement.
5. SHAREHOLDERS’ EQUITY
Upon approval by the shareholders of the Company’s 2010 Restricted Stock Plan in March 2010, the Board approved purchase of up to $1.5 million of the Company’s Common Stock, from time to time, equal to the aggregate number of shares of Common Stock awarded pursuant to the Company’s 2010 Restricted Stock Plan, contributed by the Company to its ESOP and credited to the accounts of directors pursuant to the Deferred Compensation Plan for Non-Employee Directors. Effective May 2014, the board of directors approved for management to make these purchases of the Company’s Common Stock at their discretion. The Board’s approval included an initial authorization to purchase up to $1.5 million of Common Stock, with a provision for subsequent authorizations without specific action by the Board. As the amount of Common Stock purchased under any authorization reaches $1.5 million, another $1.5 million is automatically authorized for Common Stock purchases unless the Board determines otherwise. Pursuant to these resolutions adopted by the Board, the purchase of additional $1.5 million increments of the Company’s Common Stock became authorized and approved effective March 2011, March 2012, and June 2013. As of September 30, 2015, $4,880,625 had been spent under the current program to purchase 337,731 shares. The shares are held in treasury and are accounted for using the cost method. On September 30 each year, treasury shares contributed to the Company’s ESOP on behalf of the ESOP participants were 11,455 in 2015, 11,428 in 2014 and 21,814 in 2013.
6. EARNINGS PER SHARE
The following table sets forth the computation of earnings per share.
|
Year ended September 30, |
||||||||
|
2015 |
2014 |
2013 |
||||||
|
Numerator for basic and diluted earnings per share: |
||||||||
|
Net income (loss) |
$ |
9,321,341 |
$ |
25,001,462 |
$ |
13,960,049 | ||
|
Denominator for basic and diluted earnings per share: |
||||||||
|
weighted average shares (including for 2015, 2014 |
||||||||
|
and 2013, unissued, vested directors' shares |
||||||||
|
of 246,442, 255,039 and 232,224, respectively) |
16,768,904 | 16,727,183 | 16,713,808 | |||||
(63)
Panhandle Oil and Gas Inc.
Notes to Financial Statements (continued)
7. EMPLOYEE STOCK OWNERSHIP PLAN
The Company’s ESOP was established in 1984 and is a tax qualified, defined contribution plan that serves as the Company’s sole retirement plan for all its employees. Company contributions are made at the discretion of the Board and, to date, all contributions have been made in shares of Company Common Stock. The Company contributions are allocated to all ESOP participants in proportion to their compensation for the plan year, and 100% vesting occurs after three years of service. Any shares that do not vest are treated as forfeitures and are distributed among other vested employees. For contributions of Common Stock, the Company records as expense the fair market value of the stock contributed. The 383,443 shares of the Company’s Common Stock held by the plan as of September 30, 2015, are allocated to individual participant accounts, are included in the weighted average shares outstanding for purposes of earnings-per-share computations and receive dividends.
Contributions to the plan consisted of:
|
Year |
Shares |
Amount |
|||
|
2015 |
11,455 |
$ |
185,113 | ||
|
2014 |
11,428 |
$ |
341,125 | ||
|
2013 |
21,814 |
$ |
308,450 | ||
8. DEFERRED COMPENSATION PLAN FOR DIRECTORS
Annually, outside directors may elect to be included in the Panhandle Oil and Gas Inc. Deferred Directors’ Compensation Plan for Non-Employee Directors (the “Plan”). The Plan provides that each outside director may individually elect to be credited with future unissued shares of Company Common Stock rather than cash for all or a portion of the annual retainers, Board meeting fees and committee meeting fees, and may elect to receive shares, if and when issued, over annual time periods up to ten years. These unissued shares are recorded to each director’s deferred compensation account at the closing market price of the shares (i) on the dates of the Board and committee meetings, and (ii) on the payment dates of the annual retainers. Only upon a director’s retirement, termination, death, or a change-in-control of the Company will the shares recorded for such director under the Plan be issued to the director. The promise to issue such shares in the future is an unsecured obligation of the Company. As of September 30, 2015, there were 253,712 shares (260,726 shares at September 30, 2014) recorded under the Plan. The deferred balance outstanding at September 30, 2015, under the Plan was $3,084,289 ($3,110,351 at September 30, 2014). Expenses totaling $302,353, $353,825 and $377,520 were charged to the Company’s results of operations for the years ended September 30, 2015, 2014 and 2013, respectively, and are included in general and administrative expense in the accompanying Statement of Operations.
(64)
Panhandle Oil and Gas Inc.
Notes to Financial Statements (continued)
9. RESTRICTED STOCK PLAN
In March 2010, shareholders approved the Panhandle Oil and Gas Inc. 2010 Restricted Stock Plan (2010 Stock Plan), which made available 200,000 shares of Common Stock to provide a long-term component to the Company’s total compensation package for its officers and to further align the interest of its officers with those of its shareholders. In March 2014, shareholders approved an amendment to increase the number of shares of common stock reserved for issuance under the 2010 Stock Plan from 200,000 shares to 500,000 shares and to allow the grant of shares of restricted stock to our directors. The 2010 Stock Plan is designed to provide as much flexibility as possible for future grants of restricted stock so the Company can respond as necessary to provide competitive compensation in order to retain, attract and motivate officers of the Company and to align their interests with those of the Company’s shareholders.
In June 2010, the Company began awarding shares of the Company’s Common Stock as restricted stock (non-performance based) to certain officers. The restricted stock vests at the end of the vesting period and contains nonforfeitable rights to receive dividends and voting rights during the vesting period. The fair value of the shares was based on the closing price of the shares on their award date and will be recognized as compensation expense ratably over the vesting period. Upon vesting, shares are expected to be issued out of shares held in treasury.
In December 2010, the Company also began awarding shares of the Company’s Common Stock, subject to certain share price performance standards (performance based), as restricted stock to certain officers. Vesting of these shares is based on the performance of the market price of the Common Stock over the vesting period. The fair value of the performance shares was estimated on the grant date using a Monte Carlo valuation model that factors in information, including the expected price volatility, risk-free interest rate and the probable outcome of the market condition, over the expected life of the performance shares. Compensation expense for the performance shares is a fixed amount determined at the grant date and is recognized over the vesting period regardless of whether performance shares are awarded at the end of the vesting period. Should the shares vest, they are expected to be issued out of shares held in treasury.
In May 2014, the Company also began awarding shares of the Company’s Common Stock as restricted stock (non-performance based) to its non-employee directors. The restricted stock vests quarterly during the calendar year of the award and contains nonforfeitable rights to receive dividends and voting rights during the vesting period. The fair value of the shares was based on the closing price of the shares on their award date and will be recognized as compensation expense ratably over the vesting period. Upon vesting, shares are expected to be issued out of shares held in treasury.
Compensation expense for the restricted stock awards is recognized in G&A.
The following table summarizes the Company’s pre-tax compensation expense for the years ended September 30, 2015, 2014 and 2013, related to the Company’s performance based and non-performance based restricted stock.
(65)
Panhandle Oil and Gas Inc.
Notes to Financial Statements (continued)
9. RESTRICTED STOCK PLAN (CONTINUED)
|
Year Ended September 30, |
||||||||
|
2015 |
2014 |
2013 |
||||||
|
Performance based, restricted stock |
$ |
480,159 |
$ |
287,789 |
$ |
345,405 | ||
|
Non-performance based, restricted stock |
414,968 | 371,531 | 338,563 | |||||
|
Total compensation expense |
$ |
895,127 |
$ |
659,320 |
$ |
683,968 | ||
A summary of the Company’s unrecognized compensation cost for its unvested performance based and non-performance based restricted stock and the weighted-average periods over which the compensation cost is expected to be recognized are shown in the following table.
|
Unrecognized Compensation Cost |
Weighted Average Period (in years) |
|||
|
Performance based, restricted stock |
$ |
221,596 | 1.71 | |
|
Non-performance based, restricted stock |
261,818 | 1.52 | ||
|
Total |
$ |
483,414 | ||
Upon vesting, shares are expected to be issued out of shares held in treasury.
A summary of the status of unvested shares of restricted stock awards and changes is presented below:
(66)
Panhandle Oil and Gas Inc.
Notes to Financial Statements (continued)
9. RESTRICTED STOCK PLAN (CONTINUED)
|
Performance Based Unvested Restricted Shares |
Weighted Average Grant-Date Fair Value |
Non-Performance Based Unvested Restricted Shares |
Weighted Average Grant-Date Fair Value |
||||||
|
Unvested shares as of |
|||||||||
|
September 30, 2012 |
52,982 |
$ |
9.75 | 46,366 |
$ |
14.51 | |||
|
Granted |
40,208 | 7.59 | 13,402 | 14.60 | |||||
|
Vested |
- |
- |
- |
- |
|||||
|
Forfeited |
- |
- |
- |
- |
|||||
|
Unvested shares as of |
|||||||||
|
September 30, 2013 |
93,190 |
$ |
8.82 | 59,768 |
$ |
14.53 | |||
|
Granted |
36,558 | 8.07 | 20,022 | 20.47 | |||||
|
Vested |
(720) | 9.77 | (23,437) | 17.21 | |||||
|
Forfeited |
(16,844) | 9.77 |
- |
- |
|||||
|
Unvested shares as of |
|||||||||
|
September 30, 2014 |
112,184 |
$ |
8.42 | 56,353 |
$ |
15.52 | |||
|
Granted |
35,485 | 12.18 | 22,028 | 19.25 | |||||
|
Vested |
(10,209) | 9.73 | (38,415) | 16.58 | |||||
|
Forfeited |
(25,209) | 9.73 |
- |
- |
|||||
|
Unvested shares as of |
|||||||||
|
September 30, 2015 |
112,251 |
$ |
9.20 | 39,966 |
$ |
16.56 | |||
The intrinsic value of the vested shares in 2015 was $940,247.
(67)
Panhandle Oil and Gas Inc.
Notes to Financial Statements (continued)
10. INFORMATION ON OIL AND NATURAL GAS PRODUCING ACTIVITIES
All oil and natural gas producing activities of the Company are conducted within the contiguous United States (principally in Arkansas, Oklahoma and Texas) and represent substantially all of the business activities of the Company.
The following table shows sales through various operators/purchasers during 2015, 2014 and 2013.
|
2015 |
2014 |
2013 |
|||
|
Cheyenne Petroleum |
23% | 6% |
- |
||
|
Southwestern Energy Company |
14% | 17% | 20% | ||
|
Chesapeake Operating, Inc. |
7% | 11% | 10% |
11. SUPPLEMENTARY INFORMATION ON OIL, NGL AND NATURAL GAS RESERVES (UNAUDITED)
Aggregate Capitalized Costs
The aggregate amount of capitalized costs of oil and natural gas properties and related accumulated depreciation, depletion and amortization as of September 30 is as follows:
|
2015 |
2014 |
||||
|
Producing properties |
$ |
441,141,337 |
$ |
418,237,512 | |
|
Non-producing minerals |
8,088,134 | 8,247,509 | |||
|
Non-producing leasehold |
204,101 | 302,631 | |||
|
Exploratory wells in progress |
1,762 | 1,710,577 | |||
| 449,435,334 | 428,498,229 | ||||
|
Accumulated depreciation, depletion and amortization |
(227,165,334) | (204,045,504) | |||
|
Net capitalized costs |
$ |
222,270,000 |
$ |
224,452,725 | |
Costs Incurred
For the years ended September 30, the Company incurred the following costs in oil and natural gas producing activities:
(68)
Panhandle Oil and Gas Inc.
Notes to Financial Statements (continued)
11. SUPPLEMENTARY INFORMATION ON OIL, NGL AND NATURAL GAS RESERVES (UNAUDITED) (CONTINUED)
|
2015 |
2014 |
2013 |
||||||
|
Property acquisition costs |
$ |
146,261 |
$ |
83,405,404 |
$ |
1,242,615 | ||
|
Exploration costs |
898,818 | 2,013,231 |
- |
|||||
|
Development costs |
24,931,571 | 34,219,072 | 27,938,160 | |||||
|
$ |
25,976,650 |
$ |
119,637,707 |
$ |
29,180,775 | |||
In 2014, $81.5 million of property acquisition costs related to the Eagle Ford Shale acquisition.
Estimated Quantities of Proved Oil, NGL and Natural Gas Reserves
The following unaudited information regarding the Company’s oil, NGL and natural gas reserves is presented pursuant to the disclosure requirements promulgated by the SEC and the FASB.
Proved oil and natural gas reserves are those quantities of oil and natural gas which, by analysis of geosciences and engineering data, can be estimated with reasonable certainty to be economically producible – from a given date forward, from known reservoirs, and under existing economic conditions, operating methods, and government regulations – prior to the time at which contracts providing the right to operate expire, unless evidence indicates that renewal is reasonably certain, regardless of whether deterministic or probabilistic methods are used for the estimation. Existing economic conditions include prices and costs at which economic producibility from a reservoir is to be determined. The price shall be the average price during the 12-month period prior to the ending date of the period covered by the report, determined as an unweighted arithmetic average of the first-day-of-the-month price for each month within such period, unless prices are defined by contractual arrangements, excluding escalations based upon future conditions. The project to extract the hydrocarbons must have commenced, or the operator must be reasonably certain that it will commence the project within a reasonable time. The area of the reservoir considered as proved includes: (i) the area identified by drilling and limited by fluid contacts, if any, and (ii) adjacent undrilled portions of the reservoir that can, with reasonable certainty, be judged to be continuous with it and to contain economically producible oil or natural gas on the basis of available geoscience and engineering data. In the absence of data on fluid contacts, proved quantities in a reservoir are limited by the lowest known hydrocarbons as seen in a well penetration unless geoscience, engineering or performance data and reliable technology establishes a lower contact with reasonable certainty. Where direct observation from well penetrations has defined a highest known oil elevation and the potential exists for an associated natural gas cap, proved oil reserves may be assigned in the structurally higher portions of the reservoir only if geoscience, engineering or performance data and reliable technology establish the higher contact with reasonable certainty. Reserves which can be produced economically through application of improved recovery techniques (including, but not limited to, fluid injection) are included in the proved classification when: (i) successful testing by a pilot project in an area of the reservoir with properties no more favorable than in the reservoir as a whole, the operation of an installed program in the reservoir or an analogous reservoir, or other evidence using reliable technology establishes the reasonable certainty of the engineering analysis on which the project or program was based; and (ii) the project has been approved for development by all necessary parties and entities, including governmental entities.
(69)
Panhandle Oil and Gas Inc.
Notes to Financial Statements (continued)
11. SUPPLEMENTARY INFORMATION ON OIL, NGL AND NATURAL GAS RESERVES (UNAUDITED) (CONTINUED)
The independent consulting petroleum engineering firm of DeGolyer and MacNaughton of Dallas, Texas, calculated the Company’s oil, NGL and natural gas reserves as of September 30, 2015, 2014 and 2013.
The Company’s net proved oil, NGL and natural gas reserves, all of which are located in the contiguous United States, as of September 30, 2015, 2014 and 2013, have been estimated by the Company’s Independent Consulting Petroleum Engineering Firm. Estimates of reserves were prepared by the use of appropriate geologic, petroleum engineering and evaluation principals and techniques that are in accordance with practices generally recognized by the petroleum industry as presented in the publication of the Society of Petroleum Engineers entitled “Standards Pertaining to the Estimating and Auditing of Oil and Gas Reserves Information (Revision as of February 19, 2007).” The method or combination of methods used in the analysis of each reservoir was tempered by experience with similar reservoirs, stage of development, quality and completeness of basic data and production history.
All of the reserve estimates are reviewed and approved by our Vice President and COO, who reports directly to our President and CEO. Paul Blanchard, our COO, holds a Bachelor of Science Degree
in Petroleum Engineering from the University of Oklahoma. Before joining the Company, he was sole proprietor of a consulting petroleum engineering firm, spent 10 years as Vice President of the Mid-
Continent business unit of Range Resources Corporation and spent several years as an engineer with Enron Oil and Gas. He is an active member of the Society of Petroleum Engineers (SPE) with over 29 years of oil and gas industry experience, including engineering assignments in several field locations.
Our COO and internal staff work closely with our Independent Consulting Petroleum Engineers to ensure the integrity, accuracy and timeliness of data furnished to them for their reserves estimation process. We provide historical information to our Independent Consulting Petroleum Engineers for all properties such as ownership interest, oil and gas production, well test data, commodity prices, operating costs and handling fees, and development costs. Throughout the year, our team meets regularly with representatives of our Independent Consulting Petroleum Engineers to review properties and discuss methods and assumptions.
When applicable, the volumetric method was used to estimate the original oil in place (OOIP) and the original gas in place (OGIP). Structure and isopach maps were constructed to estimate reservoir volume. Electrical logs, radioactivity logs, core analyses and other available data were used to prepare these maps as well as to estimate representative values for porosity and water saturation. When adequate data was available and when circumstances justified, material balance and other engineering methods were used to estimate OOIP or OGIP.
Estimates of ultimate recovery were obtained after applying recovery factors to OOIP or OGIP. These recovery factors were based on consideration of the type of energy inherent in the reservoirs, analyses of the petroleum, the structural positions of the properties and the production histories. When applicable, material balance and other engineering methods were used to estimate recovery factors. An analysis of reservoir performance, including production rate, reservoir pressure and gas-oil ratio behavior, was used in the estimation of reserves.
For depletion-type reservoirs or those whose performance disclosed a reliable decline in producing-rate trends or other diagnostic characteristics, reserves were estimated by the application of appropriate decline curves or other performance relationships. In the analyses of production-decline
(70)
Panhandle Oil and Gas Inc.
Notes to Financial Statements (continued)
11. SUPPLEMENTARY INFORMATION ON OIL, NGL AND NATURAL GAS RESERVES (UNAUDITED) (CONTINUED)
curves, reserves were estimated only to the limits of economic production or to the limit of the production licenses as appropriate.
Accordingly, these estimates should be expected to change, and such changes could be material and occur in the near term as future information becomes available.
Net quantities of proved, developed and undeveloped oil, NGL and natural gas reserves are summarized as follows:
|
Proved Reserves |
|||||
|
Oil |
NGL |
Natural Gas |
|||
|
(Barrels) |
(Barrels) |
(Mcf) |
|||
|
September 30, 2012 |
1,072,319 | 788,742 | 113,514,056 | ||
|
Revisions of previous estimates |
(90,968) | 141,081 | (2,697,853) | ||
|
Acquisitions (divestitures) |
- |
- |
1,660,649 | ||
|
Extensions, discoveries and other additions |
896,036 | 798,200 | 30,698,644 | ||
|
Production |
(234,084) | (111,897) | (10,886,329) | ||
|
September 30, 2013 |
1,643,303 | 1,616,126 | 132,289,167 | ||
|
Revisions of previous estimates |
(50,025) | 469,897 | (3,917,380) | ||
|
Acquisitions (divestitures) |
5,882,886 | 884,889 | 8,191,448 | ||
|
Extensions, discoveries and other additions |
439,802 | 276,957 | 16,702,684 | ||
|
Production |
(346,387) | (207,688) | (10,773,559) | ||
|
September 30, 2014 |
7,569,579 | 3,040,181 | 142,492,360 | ||
|
Revisions of previous estimates |
(1,697,309) | (425,300) | (31,273,207) | ||
|
Acquisitions (divestitures) |
- |
- |
- |
||
|
Extensions, discoveries and other additions |
1,619,285 | 516,679 | 18,740,114 | ||
|
Production |
(453,125) | (210,960) | (9,745,223) | ||
|
September 30, 2015 |
7,038,430 | 2,920,600 | 120,214,044 | ||
The prices used to calculate reserves and future cash flows from reserves for oil, NGL and natural gas, respectively, were as follows: September 30, 2015 - $55.27/Bbl, $19.10/Bbl, $2.84/Mcf ; September 30, 2014 - $96.94/Bbl, $31.45/Bbl, $4.04/Mcf; September 30, 2013 - $89.06/Bbl, $27.28/Bbl, $3.33/Mcf.
The revisions of previous estimates from 2014 to 2015 were primarily the result of:
|
· |
Negative pricing revisions of 44.8 Bcfe resulting from: |
|
a) |
12.4 Bcfe of negative proved developed revisions primarily due to wells reaching their projected economic limits much earlier than projected in 2014. |
(71)
Panhandle Oil and Gas Inc.
Notes to Financial Statements (continued)
11. SUPPLEMENTARY INFORMATION ON OIL, NGL AND NATURAL GAS RESERVES (UNAUDITED) (CONTINUED)
|
b) |
32.4 Bcfe of negative proved undeveloped revisions principally attributable to the removal of dry gas reserves in the Arkansas Fayetteville Shale which are no longer projected to be developed within five years from the date they were added to the proved undeveloped reserves due to low commodity prices. |
|
· |
Positive performance revisions of 0.7 Bcfe. |
Extensions, discoveries and other additions from 2014 to 2015 are principally attributable to:
|
· |
The Company’s participation in ongoing development of unconventional natural gas utilizing horizontal drilling in the Arkansas Fayetteville Shale. |
|
· |
The Company’s participation in ongoing development of conventional oil, NGL and natural gas plays including the Granite Wash play in western Oklahoma as well as minor activity in other areas. |
|
· |
The Company’s participation in ongoing development of unconventional oil, NGL and natural gas plays utilizing horizontal drilling in the Woodford Shale in western and southern Oklahoma as well as minor activity in other areas. |
|
· |
The addition of 27.1 Bcfe of PUD reserves principally in the Anadarko Basin Woodford and Springer shales in western and southern Oklahoma and the Eagle Ford Shale in South Texas. These additions result from reservoir delineation that occurred through continuing development and additional well performance data in each of the referenced plays. |
|
Proved Developed Reserves |
Proved Undeveloped Reserves |
||||||||||
|
Oil |
NGL |
Natural Gas |
Oil |
NGL |
Natural Gas |
||||||
|
(Barrels) |
(Barrels) |
(Mcf) |
(Barrels) |
(Barrels) |
(Mcf) |
||||||
|
September 30, 2013 |
1,037,721 | 764,321 | 82,298,833 | 605,582 | 851,805 | 49,990,334 | |||||
|
September 30, 2014 |
2,890,678 | 1,564,859 | 88,512,767 | 4,678,901 | 1,475,322 | 53,979,593 | |||||
|
September 30, 2015 |
2,725,077 | 1,466,834 | 82,899,159 | 4,313,353 | 1,453,766 | 37,314,885 | |||||
The following details the changes in proved undeveloped reserves for 2015 (Mcfe):
|
Beginning proved undeveloped reserves |
90,904,931 |
|
Proved undeveloped reserves transferred to proved developed |
(13,642,311) |
|
Revisions |
(32,417,179) |
|
Extensions and discoveries |
27,072,158 |
|
Purchases |
- |
|
Ending proved undeveloped reserves |
71,917,599 |
Beginning PUD reserves were 90.9 Bcfe. A total of 13.6 Bcfe (15% of the beginning balance) were transferred to proved developed producing during 2015. The 32.4 Bcfe (36% of the beginning
(72)
Panhandle Oil and Gas Inc.
Notes to Financial Statements (continued)
11. SUPPLEMENTARY INFORMATION ON OIL, NGL AND NATURAL GAS RESERVES (UNAUDITED) (CONTINUED)
balance) of negative revisions to PUD reserves was a negative pricing revision. A total of 46.1 Bcfe (51% of the beginning balance) of PUD reserves were moved out of the category during 2015 as either the result of being transferred to proved developed or removed due to low commodity prices. No PUD locations from 2010 and 2011 remain in the PUD category and there are only nine remaining PUD locations from 2012. The Company’s total PUD locations decreased from 788 in 2014 to 409 in 2015. We anticipate that all the Company’s PUD locations will be drilled and converted to PDP within five years of the date they were added. However, PUD locations and associated reserves which are no longer projected to be drilled within five years from the date they were added to the proved undeveloped reserves will be removed as revisions at the time that determination is made, and in the event that there are undrilled PUD locations at the end of the five-year period, it is our intent to remove the reserves associated with those locations from our proved reserves as revisions. There were 27.1 Bcfe of PUD reserve additions principally in the Anadarko Basin Woodford and Springer shales in western and southern Oklahoma and the Eagle Ford Shale in South Texas. These additions result from reservoir delineation that occurred through continuing development and additional well performance data in each of the referenced plays.
Standardized Measure of Discounted Future Net Cash Flows
Accounting Standards prescribe guidelines for computing a standardized measure of future net cash flows and changes therein relating to estimated proved reserves. The Company has followed these guidelines, which are briefly discussed below.
Future cash inflows and future production and development costs are determined by applying the trailing unweighted 12-month arithmetic average of the first-day-of-the-month individual product prices and year-end costs to the estimated quantities of oil, natural gas and NGL to be produced. Actual future prices and costs may be materially higher or lower than the unweighted 12-month arithmetic average of the first-day-of-the-month individual product prices and year-end costs used. For each year, estimates are made of quantities of proved reserves and the future periods during which they are expected to be produced based on continuation of the economic conditions applied for such year.
Estimated future income taxes are computed using current statutory income tax rates including consideration for the current tax basis of the properties and related carry forwards, giving effect to permanent differences and tax credits. The resulting future net cash flows are reduced to present value amounts by applying a 10% annual discount factor. The assumptions used to compute the standardized measure are those prescribed by the FASB and, as such, do not necessarily reflect our expectations of actual revenue to be derived from those reserves nor their present worth. The limitations inherent in the reserve quantity estimation process, as discussed previously, are equally applicable to the standardized measure computations since these estimates affect the valuation process.
(73)
Panhandle Oil and Gas Inc.
Notes to Financial Statements (continued)
11. SUPPLEMENTARY INFORMATION ON OIL, NGL AND NATURAL GAS RESERVES (UNAUDITED) (CONTINUED)
|
2015 |
2014 |
2013 |
||||||
|
Future cash inflows |
$ |
786,295,155 |
$ |
1,405,400,261 |
$ |
630,332,900 | ||
|
Future production costs |
(311,933,151) | (423,512,430) | (216,584,982) | |||||
|
Future development and asset retirement costs |
(124,857,957) | (146,465,509) | (50,572,218) | |||||
|
Future income tax expense |
(123,007,909) | (308,149,182) | (131,397,192) | |||||
|
Future net cash flows |
226,496,138 | 527,273,140 | 231,778,508 | |||||
|
10% annual discount |
(144,904,927) | (322,490,636) | (130,103,612) | |||||
|
Standardized measure of discounted |
||||||||
|
future net cash flows |
$ |
81,591,211 |
$ |
204,782,504 |
$ |
101,674,896 | ||
Changes in the standardized measure of discounted future net cash flows are as follows:
|
2015 |
2014 |
2013 |
||||||
|
Beginning of year |
$ |
204,782,504 |
$ |
101,674,896 |
$ |
67,414,288 | ||
|
Changes resulting from: |
||||||||
|
Sales of oil, NGL and natural gas, net of production costs |
(35,359,204) | (66,239,618) | (46,909,635) | |||||
|
Net change in sales prices and production costs |
(211,336,729) | 164,240,162 | 47,270,404 | |||||
|
Net change in future development and asset retirement costs |
9,569,985 | (46,593,511) | (7,363,224) | |||||
|
Extensions and discoveries |
34,327,400 | 44,308,910 | 54,101,830 | |||||
|
Revisions of quantity estimates |
(51,375,950) | (3,235,695) | (3,150,420) | |||||
|
Acquisitions (divestitures) of reserves-in-place |
- |
102,945,609 | 2,198,612 | |||||
|
Accretion of discount |
37,000,855 | 17,646,314 | 11,473,819 | |||||
|
Net change in income taxes |
102,592,290 | (90,457,070) | (27,464,341) | |||||
|
Change in timing and other, net |
(8,609,940) | (19,507,493) | 4,103,563 | |||||
|
Net change |
(123,191,293) | 103,107,608 | 34,260,608 | |||||
|
End of year |
$ |
81,591,211 |
$ |
204,782,504 |
$ |
101,674,896 | ||
(74)
Panhandle Oil and Gas Inc.
Notes to Financial Statements (continued)
12. ACQUISITIONS
On June 17, 2014, the Company closed an acquisition of certain assets located in the core of the Eagle Ford Shale in LaSalle and Frio Counties, Texas. The assets were purchased from private sellers and included a 16% non-operated working interest in 11,100 gross (1,775 net) acres. The acreage is largely contiguous, entirely held by production and, at the time of closing, included 63 producing wells, 1 drilling well, 3 wells in the completion phase and 109 undeveloped locations. The adjusted purchase price at closing was $81.5 million and was funded by utilizing the Company’s bank credit facility. The purchase price was allocated to the producing wells and undeveloped locations based on fair value determined by estimated reserves and adjusted for working capital.
Actual and Pro Forma Impact of Acquisitions (Unaudited)
Revenues attributable to this acquisition included in the Company’s statement of operations for the year ended September 30, 2015, were $11,212,410. Net income attributable to the acquisition included in the statement of operations for the year ended September 30, 2015, was $360,172.
The following table presents the unaudited pro forma financial information assuming the Company had acquired this business on October 1, 2012:
|
For the Year Ended |
||||||||
|
September 30, |
||||||||
|
2015 |
2014 |
2013 |
||||||
|
Revenue: |
||||||||
|
As reported |
$ |
70,882,093 |
$ |
84,411,224 |
$ |
62,889,120 | ||
|
Pro forma revenue |
- |
16,842,595 | 21,562,379 | |||||
|
Pro forma |
$ |
70,882,093 |
$ |
101,253,819 |
$ |
84,451,499 | ||
|
Net Income: |
||||||||
|
As reported |
$ |
9,321,341 |
$ |
25,001,462 |
$ |
13,960,049 | ||
|
Pro forma income |
- |
6,437,605 | 8,107,985 | |||||
|
Pro forma |
$ |
9,321,341 |
$ |
31,439,067 |
$ |
22,068,034 | ||
The unaudited pro forma financial information is for informational purposes only and does not purport to present what our results would actually have been had this transaction actually occurred on the date presented or to project our results of operations or financial position for any future period.
(75)
Panhandle Oil and Gas Inc.
Notes to Financial Statements (continued)
13. QUARTERLY RESULTS OF OPERATIONS (UNAUDITED)
The following is a summary of the Company’s unaudited quarterly results of operations.
|
Fiscal 2015 |
|||||||||||
|
Quarter Ended |
|||||||||||
|
December 31 |
March 31 |
June 30 |
September 30 |
||||||||
|
Revenues |
$ |
30,999,170 |
$ |
14,679,034 |
$ |
11,748,888 |
$ |
13,455,001 | |||
|
Income (loss) before provision |
|||||||||||
|
for income taxes |
$ |
14,875,761 |
$ |
627,207 |
$ |
(496,946) |
$ |
(848,681) | |||
|
Net income (loss) |
$ |
10,233,761 |
$ |
704,207 |
$ |
(728,946) |
$ |
(887,681) | |||
|
Earnings (loss) per share |
$ |
0.61 |
$ |
0.04 |
$ |
(0.04) |
$ |
(0.05) | |||
|
Fiscal 2014 |
|||||||||||
|
Quarter Ended |
|||||||||||
|
December 31 |
March 31 |
June 30 |
September 30 |
||||||||
|
Revenues |
$ |
18,396,756 |
$ |
19,752,045 |
$ |
18,374,977 |
$ |
27,887,446 | |||
|
Income (loss) before provision |
|||||||||||
|
for income taxes |
$ |
7,164,318 |
$ |
8,445,573 |
$ |
7,627,585 |
$ |
13,583,986 | |||
|
Net income (loss) |
$ |
4,926,318 |
$ |
5,654,573 |
$ |
5,122,585 |
$ |
9,297,986 | |||
|
Earnings (loss) per share |
$ |
0.29 |
$ |
0.34 |
$ |
0.31 |
$ |
0.55 | |||
(76)
ITEM 9CHANGES IN AND DISAGREEMENTS WITH ACCOUNTANTS ON
ACCOUNTING AND FINANCIAL DISCLOSURE
None
ITEM 9ACONTROLS AND PROCEDURES
(a)EVALUATION OF DISCLOSURE CONTROLS AND PROCEDURES
The Company maintains “disclosure controls and procedures,” as such term is defined in Rule 13a-15(e) under the Exchange Act, that are designed to ensure that information required to be disclosed in reports the Company files or submits under the Exchange Act is recorded, processed, summarized and reported within the time periods specified in SEC rules and forms, and that such information is collected and communicated to management, including the Company’s President/CEO and Vice President/CFO, as appropriate, to allow timely decisions regarding required disclosure. In designing and evaluating its disclosure controls and procedures, management recognized that no matter how well conceived and operated, disclosure controls and procedures can provide only reasonable, not absolute, assurance that the objectives of the disclosure controls and procedures are met. The Company’s disclosure controls and procedures have been designed to meet, and management believes that they do meet, reasonable assurance standards. Based on their evaluation as of the end of the fiscal period covered by this report, the Chief Executive Officer and Chief Financial Officer have concluded that, subject to the limitations noted above, the Company’s disclosure controls and procedures were effective.
(b)MANAGEMENT’S REPORT ON INTERNAL CONTROL OVER FINANCIAL REPORTING
The Company’s management is responsible for establishing and maintaining adequate “internal control over financial reporting,” as such term is defined in Exchange Act Rule 13a-15(f). The Company’s management, including the President/CEO and Vice President/CFO, conducted an evaluation of the effectiveness of its internal control over financial reporting based on the Internal Control – Integrated Framework issued by the Committee of Sponsoring Organizations of the Treadway Commission. Based on the results of this evaluation, the Company’s management concluded that its internal control over financial reporting was effective as of September 30, 2015.
(c)CHANGES IN INTERNAL CONTROL OVER FINANCIAL REPORTING
There were no changes in the Company’s internal control over financial reporting that have materially affected, or are reasonably likely to materially affect, the Company’s internal control over financial reporting made during the fiscal quarter ended September 30, 2015, or subsequent to the date the assessment was completed.
None
The information called for by Part III of Form 10-K (Item 10 – Directors and Executive Officers of the Registrant, Item 11 – Executive Compensation, Item 12 – Security Ownership of Certain Beneficial Owners and Management and Related Stockholder Matters, Item 13 – Certain Relationships and Related Transactions, and Item 14 – Principal Accountant Fees and Services), is incorporated by reference from the Company’s definitive proxy statement, which will be filed with the SEC within 120 days after the end of the fiscal year to which this report relates.
(77)
PART IV
ITEM 15EXHIBITS, FINANCIAL STATEMENT SCHEDULES, AND REPORTS ON FORM 8-K
FINANCIAL STATEMENT SCHEDULES
The Company has omitted all schedules because the conditions requiring their filing do not exist or because the required information appears in the Company’s Financial Statements, including the notes to those statements.
EXHIBITS
|
(3) |
Amended Certificate of Incorporation (incorporated by reference to Exhibit attached |
|
|
to Form 10 filed January 27, 1980, and to Forms 8-K dated June 1, 1982, December 3, |
|
|
1982, to Form 10-QSB dated March 31, 1999, and to Form 10-Q dated March 31, 2007) |
|
|
By-Laws as amended (incorporated by reference to Form 8-K dated October 31, 1994) |
|
|
By-Laws as amended (incorporated by reference to Form 8-K dated February 24, 2006) |
|
|
By-Laws as amended (incorporated by reference to Form 8-K dated October 29, 2008) |
|
|
By-Laws as amended (incorporated by reference to Form 8-K dated August 2, 2011) |
|
|
By-Laws as amended (incorporated by reference to Form 8-K dated December 11, 2013) |
|
(4) |
Instruments defining the rights of security holders (incorporated by reference to |
|
|
Certificate of Incorporation and By-Laws listed above) |
|
*(10.1) |
Agreement indemnifying directors and officers (incorporated by reference to |
|
|
Form 10-K dated September 30, 1989, and Form 8-K dated June 15, 2007) |
|
*(10.2) |
Agreements to provide certain severance payments and benefits to executive officers |
|
|
should a Change-in-Control occur as defined by the agreements (incorporated by reference |
|
|
to Form 8-K dated September 4, 2007) |
|
(10.3) |
Amended and Restated Credit Agreement dated November 25, 2013 (incorporated by reference to Form 10-K dated December 11, 2013) |
|
(10.4) |
Second Amendment to Amended and Restated Credit Agreement and Joinder dated June 17, 2014 (incorporated by reference to Form 8-K dated June 19, 2014) |
|
|
|
|
(23) |
Consent of DeGolyer and MacNaughton, Independent Petroleum Engineering Consultants |
|
(31.1) |
Certification of Chief Executive Officer pursuant to Section 302 of the Sarbanes-Oxley Act of 2002 |
|
(31.2) |
Certification of Chief Financial Officer pursuant to Section 302 of the Sarbanes-Oxley Act of 2002 |
|
(32.1) |
Certification of Chief Executive Officer pursuant to Section 906 of the Sarbanes-Oxley Act of 2002 |
|
(32.2) |
Certification of Chief Financial Officer pursuant to Section 906 of the Sarbanes-Oxley Act of 2002 |
|
(99) |
Report of DeGolyer and MacNaughton, Independent Petroleum Engineering Consultants |
|
(101.INS) |
XBRL Instance Document |
|
(101.SCH) |
XBRL Taxonomy Extension Schema Document |
|
(101.CAL) |
XBRL Taxonomy Extension Calculation Linkbase Document |
|
(101.LAB) |
XBRL Taxonomy Extension Labels Linkbase Document |
|
(101.PRE) |
XBRL Taxonomy Extension Presentation Linkbase Document |
|
(101.DEF) |
XBRL Taxonomy Extension Definition Linkbase Document |
|
|
|
|
* |
Indicates management contract or compensatory plan or arrangement |
(78)
REPORTS ON FORM 8-K
No Form 8-K’s were filed in the fourth quarter of 2015.
SIGNATURES
Pursuant to the requirements of Section 13 of the Securities Exchange Act of 1934, the registrant caused this Report to be signed on its behalf by the undersigned, thereunto duly authorized.
|
PANHANDLE OIL AND GAS INC. |
|
|
|
|
|
By: /s/ Michael C. Coffman |
|
|
Michael C. Coffman |
|
|
Chief Executive Officer |
|
|
|
|
|
Date: December 10, 2015 |
|
In accordance with the Securities Exchange Act of 1934, this report has been signed below by the following persons on behalf of the registrant and in the capacities and on the dates indicated.
|
Signature |
|
Title |
|
Date |
|
|
|
|
|
|
|
/s/ Michael C. Coffman |
|
President, Chief Executive Officer, Director |
|
December 10, 2015 |
|
Michael C. Coffman |
|
|
|
|
|
|
|
|
|
|
|
/s/ Lonnie J. Lowry |
|
Vice President, Chief Financial Officer |
|
December 10, 2015 |
|
Lonnie J. Lowry |
|
|
|
|
|
|
|
|
|
|
|
/s/Robb P. Winfield |
|
Controller, Chief Accounting Officer |
|
December 10, 2015 |
|
Robb P. Winfield |
|
|
|
|
|
|
|
|
|
|
|
/s/ Lee M. Canaan |
|
Director |
|
December 10, 2015 |
|
Lee M. Canaan |
|
|
|
|
|
|
|
|
|
|
|
/s/ Robert O. Lorenz |
|
Lead Independent Director |
|
December 10, 2015 |
|
Robert O. Lorenz |
|
|
|
|
|
|
|
|
|
|
|
/s/ Robert A. Reece |
|
Director |
|
December 10, 2015 |
|
Robert A. Reece |
|
|
|
|
|
|
|
|
|
|
|
/s/ Robert E. Robotti |
|
Director |
|
December 10, 2015 |
|
Robert E. Robotti |
|
|
|
|
|
|
|
|
|
|
|
/s/ Darryl G. Smette |
|
Director |
|
December 10, 2015 |
|
Darryl G. Smette |
|
|
|
|
|
|
|
|
|
|
|
/s/ H. Grant Swartzwelder |
|
Director |
|
December 10, 2015 |
|
H. Grant Swartzwelder |
|
|
|
|
(79)