Attached files
| file | filename |
|---|---|
| 8-K - NORTHERN OIL AND GAS, INC. 8-K 12-9-2015 - NORTHERN OIL & GAS, INC. | form8k.htm |
Exhibit 99.1
Company presentation December 2015

2 Forward Looking Statements Statements made by representatives of Northern Oil and Gas, Inc. (“Northern” or the “Company”) during the course of this presentation that are not historical facts are forward-looking statements. These statements are based on certain assumptions and expectations made by the Company which reflect management’s experience, estimates and perception of historical trends, current conditions, anticipated future developments and other factors believed to be appropriate. Such statements are subject to a number of assumptions, risks and uncertainties, many of which are beyond the control of the Company, which may cause actual results to differ materially from those implied or anticipated in the forward-looking statements. These include risks relating to crude oil and natural gas prices; the pace of drilling and completions activity on our properties, our ability to raise or access capital; general economic or industry conditions, nationally and/or in the communities in which the Company conducts business; changes in the interest rate environment; legislation or regulatory requirements; conditions of the securities markets; changes in accounting principles, policies or guidelines; financial or political instability; acts of war or terrorism; other economic, competitive, governmental, regulatory and technical factors affecting our operations, products and prices; and other important factors that could cause actual results to differ materially from those anticipated or implied in the forward-looking statements. Northern undertakes no obligation to publicly update any forward-looking statements, whether as a result of new information or future events.

find a place to hide in the storm 3

“Non-Op”…..what is it? Do not drill or operate wellsWe own minority leasehold/working interest (WI) percentage in Drilling Spacing Units (DSU)Operator of the DSU initiates/proposes drill schedule State law requires the operator of the DSU to send all minority Leasehold/WI owners in the DSU a well proposalState law and Forced Pooling advantages for Non-Op participantsNo mandate for minority WI owners to participateOption to participate “heads-up” with the operator for our WI percentage, or non-consent the proposalNo long-term rig, frac, sand or takeaway contractsAbility to control large acreage postion, substantial production profile, and high-quality reserves with only 20 employeesDiversifed among the best opertors in the Williston Basin 4

Benefits of non-op 5

consent or non-consent a well 6 Non-ConsentAcreage still HBP even multiple zones with single wellRetain right to participate in other wells/zones in DSUEach well in unit is a standalone decision
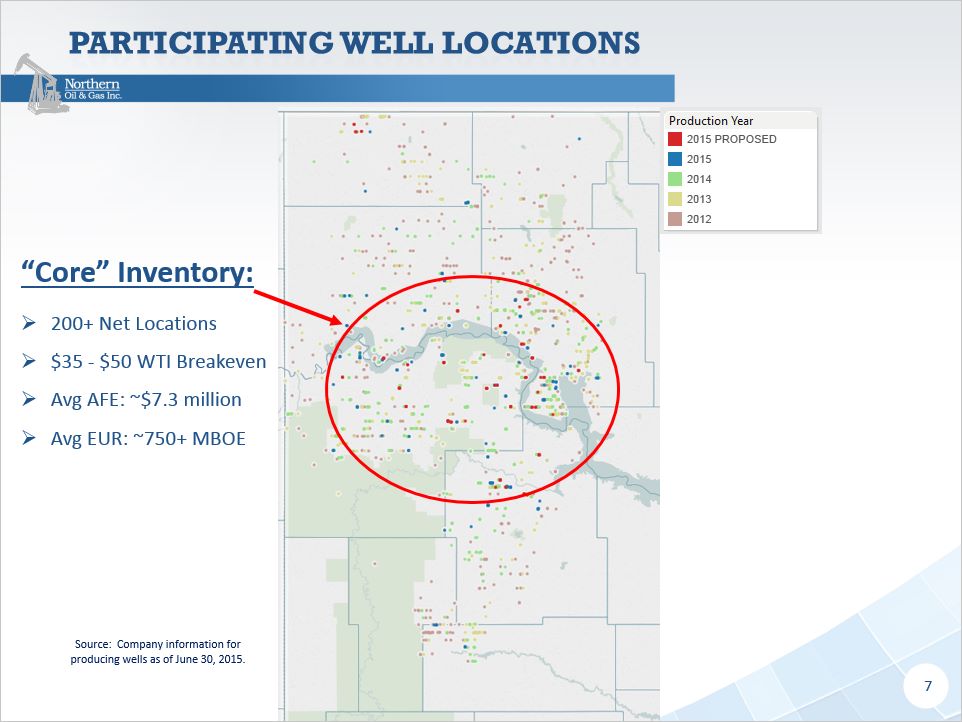
Source: Company information for producing wells as of June 30, 2015. Participating well locations “Core” Inventory:200+ Net Locations$35 - $50 WTI BreakevenAvg AFE: ~$7.3 millionAvg EUR: ~750+ MBOE 7

8 Northern Average Well Profile by Year, Proposed IP Rates up 30% from 2014 Well productivity continues to improve

Disciplined investment decisions 9 Average YTD IRR on consented wells of 38%, average for non-consented wells of 9% 43% Increase 16% Decrease Ave EUR for 1280 acre DSUsThrough 9/30/15

Liquidity profile 10 $550 million borrowing base reaffirmed – October 20159/30/15 Liquidity of$ 387 Million

crude oil Hedges SWAPS Contract Period Volume (Bbls) Weighted Average Price (per Bbl) 2015: Q4 990,000 $89.82 2016: Q1 450,000 $90.00 Q2 450,000 $90.00 Q3 450,000 $65.00 Q4 450,000 $65.00 11

LOWER COSTS IMPROVING Performance 12 Well Costs ($MM) Cash Operating Costs ($/Boe)
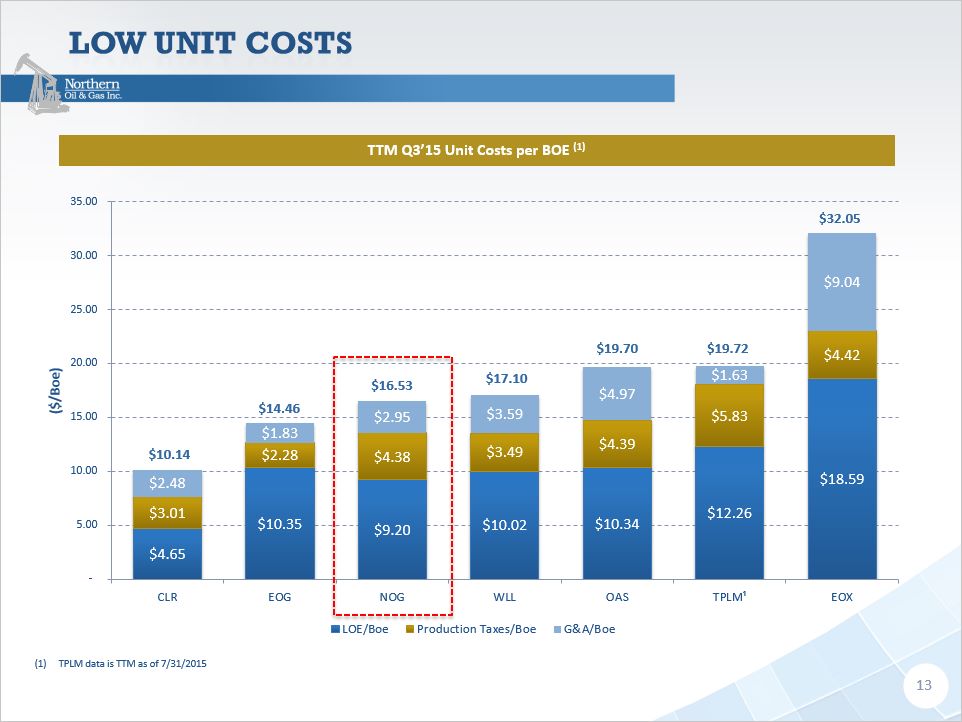
Low Unit costs 13 TPLM data is TTM as of 7/31/2015 TTM Q3’15 Unit Costs per BOE (1) $14.46 $16.53 $17.10 $19.70 $32.05 $19.72

High cash operating margin 14 Realized Price is defined as oil, gas and NGL sales, including the effects of realized hedging gains or losses. Data as of 9/30/15.Cash Operating Margin is defined as oil and gas sales, including settled derivatives, less production expenses, production taxes and cash G&A.TPLM data is TTM as of 7/31/2015 NOG Historical Cash Operating Margins per BOE (1)(2) TTM Q3’15 Peer Cash Operating Margins per BOE (1)(2)
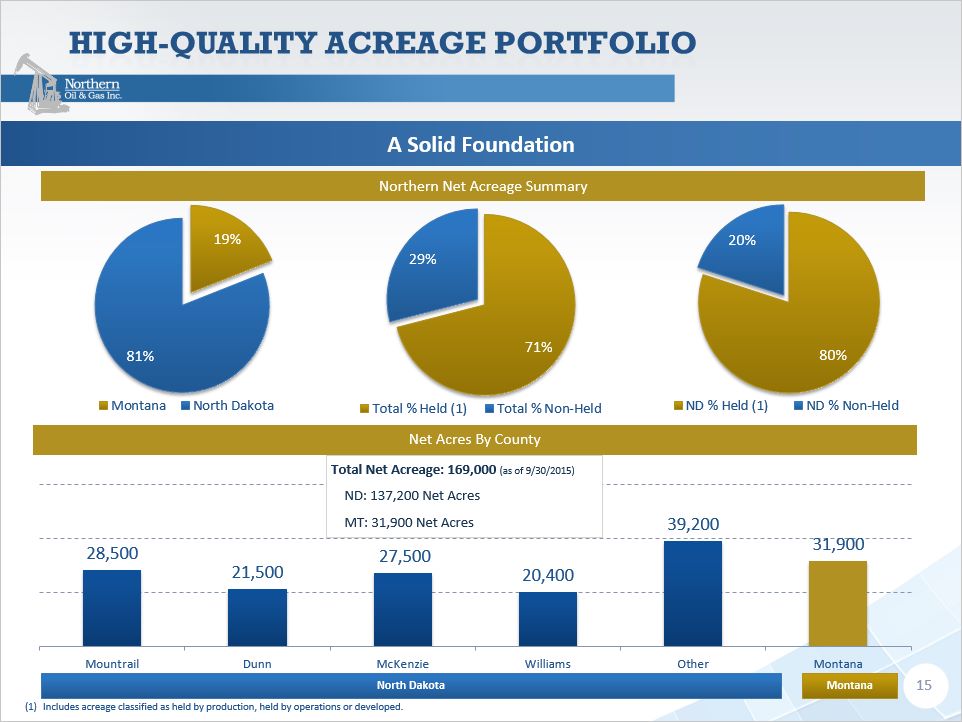
High-Quality Acreage portfolio 15 North Dakota Montana Includes acreage classified as held by production, held by operations or developed. Net Acres By County Northern Net Acreage Summary Total Net Acreage: 169,000 (as of 9/30/2015)ND: 137,200 Net AcresMT: 31,900 Net Acres A Solid Foundation
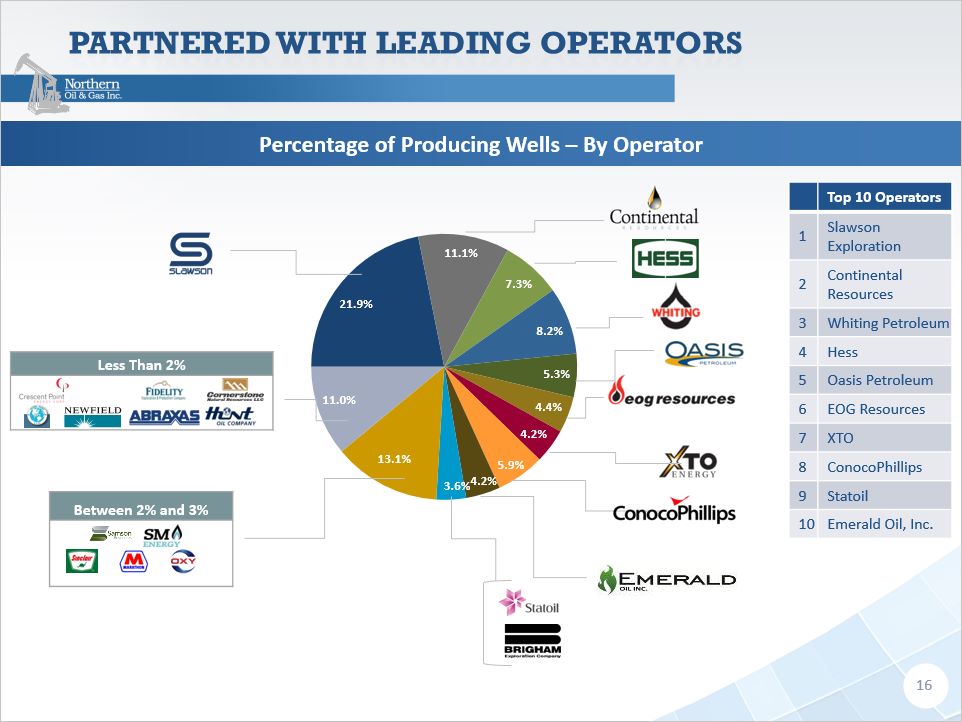
Partnered with leading operators 16 Percentage of Producing Wells – By Operator Less Than 2% Between 2% and 3% Top 10 Operators 1 Slawson Exploration 2 Continental Resources 3 Whiting Petroleum 4 Hess 5 Oasis Petroleum 6 EOG Resources 7 XTO 8 ConocoPhillips 9 Statoil 10 Emerald Oil, Inc.

High intensity completions Completion Trends:~80% of new consented wells are planned high intensity completions ~25% increase in EURs with new completion design2016 per-well productivity expected to improve 17 Source: NDIC and DrillingInfo
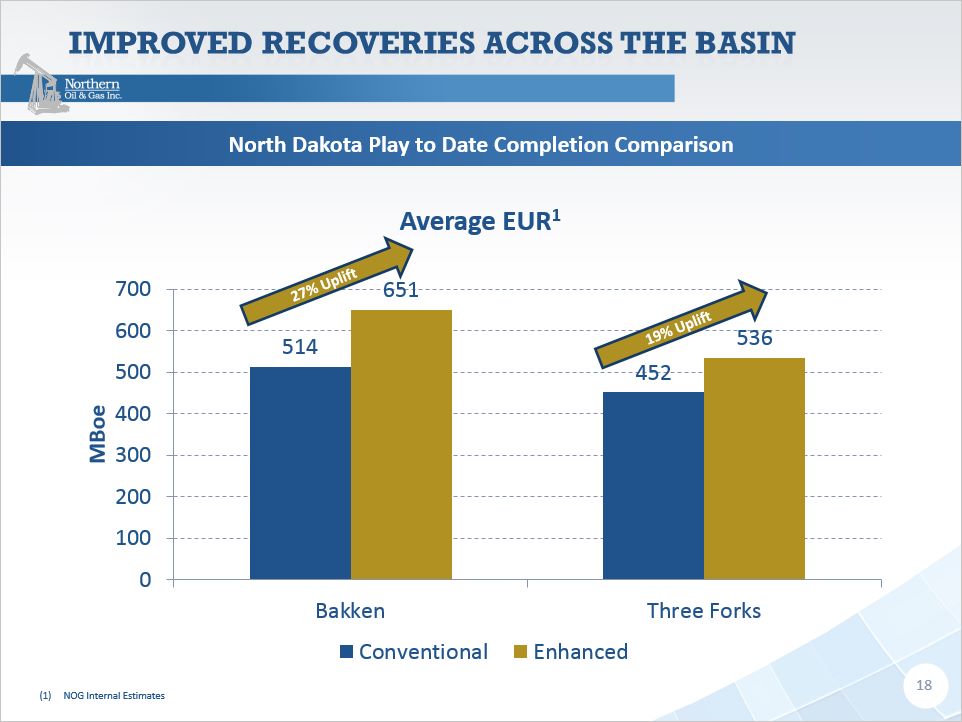
Improved recoveries across the basin 18 North Dakota Play to Date Completion Comparison 27% Uplift 19% Uplift NOG Internal Estimates

Embracing the challenges Capital Discipline2015 budget down 74% vs. 2014 actual capex spend2015 production expected to be flat vs. 2014 levelsMaintain Liquidity$387 million of available liquidity (up $18 million versus prior quarter)8% senior notes do not mature until 2020Allocate capital only to high IRR opportunitiesImproving Operational Efficiencies Weighted Average AFE Cost ~$7.7 mm – Down ~16% vs. 20143Q 2015 Cash Costs per BOE down 29% vs. 3Q 2014 Exposure to high intensity completions helping to drive per well productivity improvementsResilient Asset Strength & Inventory200+ net locations with breakeven pricing from $35 - $50 WTIAt current rate - 10+ years of inventory 19

2015 GUIDANCE & Recent developments 20 CapEx Decreases 74% Production Flat Capital Expenditures & Production Capital Expenditures by Quarter Capital Expenditures:Drilling and Completion $120 millionAcreage & Other $20 millionProduction:Total Production ~5.8 MMBoe Operating Expenses for 4Q15LOE ($ per Boe) $8.50 – $8.75Tax (% of Oil & Gas Revenue) 10.5%Total G&A ($ per Boe) $4.30 Cash G&A $2.00 Non-Cash G&A $2.30Average Differential for 4Q15NYMEX WTI ($9.00) to ($11.00) Revenue Charge in 4Q15$3.8 million revenue reduction due to a decrease in ownership interests in connection with two leasehold title dispute matters E

Why Northern today? 21 ENDURANCE DURABILITY OPTIONALITY Northern’s non-op business modelAccess to core acreage and best in class operatorsConsent v Non-Consent capital allocation processLiquidityAbility to adjust spending up or down based on rate of return
APPENDIX: Supplemental information 22

CORPORATE PROFILE 23 As of 10/31/2015As of 12/3/15As of 9/30/15As of 12/31/14 NYSE MKT: NOG Shares Outstanding (Fully-Diluted)(1) ~62.9 million Market Capitalization(2) ~$302 million Enterprise Value(2) ~$1,180 billion Adjusted EBITDA (TTM) $291.2 million Net Producing Wells(3) 201.9 net Average Q3 2015 Daily Production 15,844 Boepd Production (2015 Estimate) ~5.8 MMBoe Oil (87%) Natural Gas (13%) Proved Reserves(4) 100.7 MMBoe % Proved Developed 51% % Oil 88% Net Acreage 169,000 acres

production and cash flow 24 Adjusted EBITDA ($ millions) Adjusted EBITDA 72% CAGR Annual Production 67% CAGR Annual Production (Boepd) Cash Flow from Operation ($ millions) Growth in production, cash flow, and EBITDA through cyclesFocus capital on high return, organic growth, funded by cash flow and prudent financial leverageMaintain a strong balance sheet and liquidity position
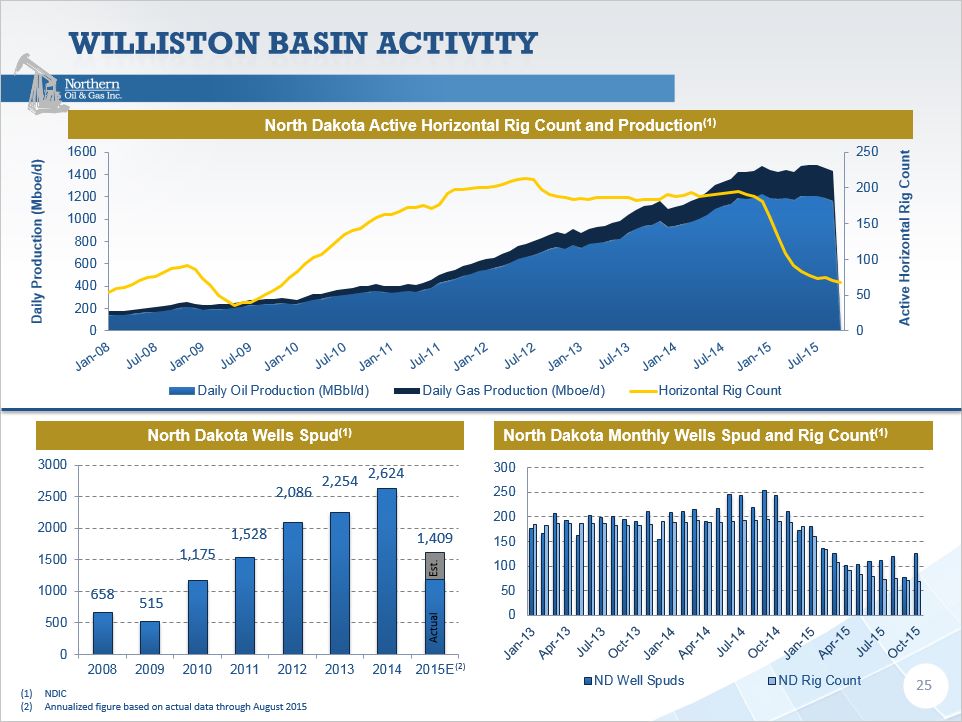
Williston Basin activity 25 Daily Production (Mboe/d) Active Horizontal Rig Count NDICAnnualized figure based on actual data through August 2015 North Dakota Wells Spud(1) North Dakota Monthly Wells Spud and Rig Count(1) North Dakota Active Horizontal Rig Count and Production(1) Actual Est.

Getting production to market 26 NDIC Takeaway Capacity (Mbopd) (1) Takeaway Capacity Options Pipeline and rail provide multiple destinations for Bakken crudeNew pipelines in 2016/2017 provide excellent optionality for low cost transportationGiven the pipe and rail options, there is ample capacity for Bakken crude production

Historical operating information 27 Year Ended December 31, First 9 months 2011 2012 2013 2014 2015 Production Oil (MBbls) 1,792.0 3,465.3 4,046.7 5,150.9 3,904.8 Natural Gas and NGLs 800.2 1,768.9 2,572.3 3,682.8 3,559.6 Total Production (Mboe) 1,925.3 3,760.1 4,475.4 5,764.7 4,498.1 Realized Oil Price, including settled derivatives ($ / Bbl) $ 78.53 $ 83.11 $ 84.89 $ 77.70 $ 69.47 Realized Natural Gas and NGL Price ($ / Mcf) 6.63 4.67 5.24 6.38 1.68 Total Oil & Gas Revenues, including settled derivatives (millions) $ 146.0 $ 296.2 $ 357.0 $ 423.7 $ 277.2 Adjusted EBITDA (millions) $ 112.3 $ 225.3 $ 268.0 $ 309.6 $ 209.6 Key Operating Statistics ($ / Boe) Average Realized Price $ 75.85 $ 78.79 $ 79.77 $ 73.51 $ 61.63 Production Expenses 6.77 8.61 9.35 9.66 8.97 Production Taxes 7.43 7.58 7.81 7.58 3.85 General & Administrative Expenses-Cash 3.87 2.73 2.63 2.57 2.22 Total Cash Costs $ 18.07 $ 18.92 $ 19.79 $ 19.81 $ 15.04 Operating Margin ($ / Boe) $ 57.78 $ 59.87 $ 59.98 $ 53.70 $ 46.59 Operating Margin % 76.2% 76.0% 75.2% 73.1% 75.6%
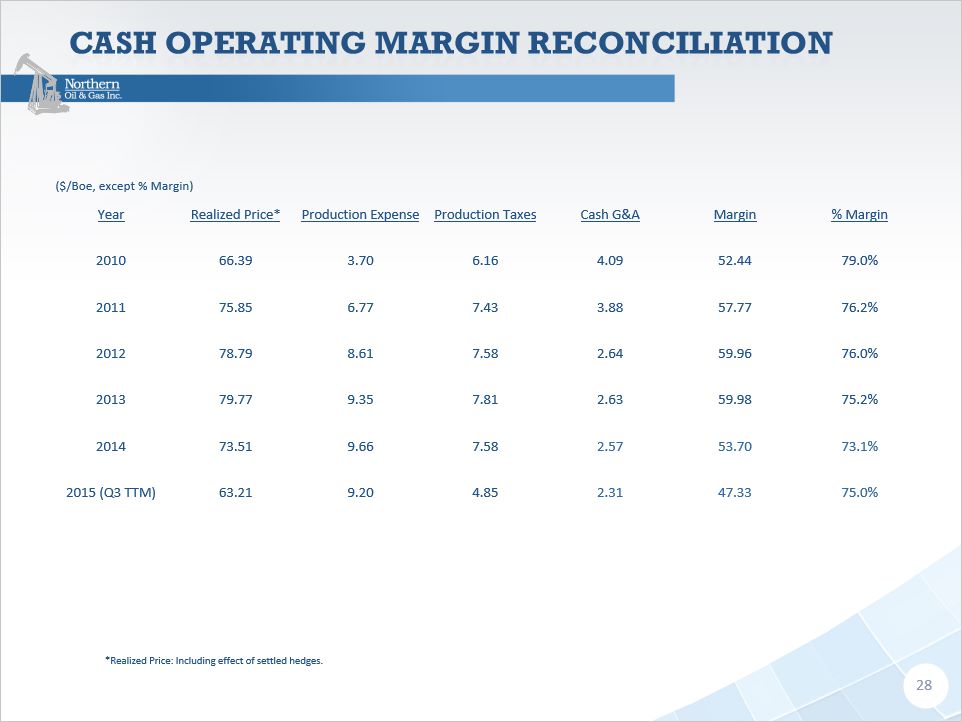
Cash operating margin reconciliation ($/Boe, except % Margin) Year Realized Price* Production Expense Production Taxes Cash G&A Margin % Margin 2010 66.39 3.70 6.16 4.09 52.44 79.0% 2011 75.85 6.77 7.43 3.88 57.77 76.2% 2012 78.79 8.61 7.58 2.64 59.96 76.0% 2013 79.77 9.35 7.81 2.63 59.98 75.2% 2014 73.51 9.66 7.58 2.57 53.70 73.1% 2015 (Q3 TTM) 63.21 9.20 4.85 2.31 47.33 75.0% 28 *Realized Price: Including effect of settled hedges.

adjusted ebitda by quarter Quarter Ended September 30, June 30, March 31, December 31, In thousands 2015 2015 2015 2014 Net Income $(323,242) $(250,061) $(229,739) $103,584 Add Back: Interest Expense 16,154 14,388 11,737 11,258 Income Tax Provision (78) (66,867) (135,480) 62,967 Depreciation, Depletion, Amortization and Accretion 36,671 36,746 45,213 48,926 Impairment of Oil and NaturalGas Properties 354,423 281,964 360,429 - Non- Cash Share Based Compensation 1,141 1,050 1,030 739 Unrealized Loss (Gain) on Derivative Instruments (8,409) 53,193 14,331 (145,842) Adjusted EBITDA $71,660 $70,414 $67,522 $81,627 29

adjusted ebitda by year 2014 2013 2012 2011 2010 (In Thousands) Net Income $ 163,746 $ 53,067 $ 72,285 $ 40,611 $ 6,917 Add Back: Interest Expense 42,106 32,709 13,875 586 583 Income Tax Provision 99,367 30,768 43,002 26,835 4,419 Depreciation, Depletion, Amortization and Accretion 172,884 124,383 98,923 41,170 17,083 Non-Cash Share Based Compensation 2,759 4,799 12,382 6,164 3,566 Unrealized Loss (Gain) on Derivative Instruments (171,276) 21,259 (15,147) (3,072) 14,545 Adjusted EBITDA $309,586 $267,985 $225,320 $112,294 $47,113 30