Attached files
| file | filename |
|---|---|
| EX-21 - JOHNSON OUTDOORS INC | ex21dec32015form10k.htm |
| EX-23 - JOHNSON OUTDOORS INC | ex23dece32015form10k.htm |
| EX-31.1 - JOHNSON OUTDOORS INC | ex31-1dec32015form10k.htm |
| EX-31.2 - JOHNSON OUTDOORS INC | ex31-2dec32015form10k.htm |
| EX-32.1 - JOHNSON OUTDOORS INC | ex32-1dec32015form10k.htm |
| EX-10.32 - JOHNSON OUTDOORS INC | ex10-32dec32015form10k.htm |
UNITED STATES
SECURITIES AND EXCHANGE COMMISSION
Washington, D.C. 20549
FORM 10-K
[ X ] ANNUAL REPORT PURSUANT TO SECTION 13 OR 15(d) OF THE SECURITIES EXCHANGE ACT OF 1934
For the fiscal year ended October 2, 2015
OR
[____] TRANSITION REPORT PURSUANT TO SECTION 13 OR 15(d) OF THE SECURITIES EXCHANGE ACT OF 1934
For the transition period from ______ to ______
Commission file number 0-16255
JOHNSON OUTDOORS INC.
(Exact name of registrant as specified in its charter)
|
Wisconsin
|
39-1536083
|
|
|
(State or other jurisdiction of incorporation or organization)
|
(I.R.S. Employer Identification No.)
|
555 Main Street, Racine, Wisconsin 53403
(Address of principal executive offices, including zip code)
(262) 631-6600
(Registrant’s telephone number, including area code)
Securities registered pursuant to Section 12(b) of the Act:
Title of Each Class Name of Exchange on Which Registered
Class A Common Stock, $.05 par value per share NASDAQ Global MarketSM
Securities registered pursuant to section 12(g) of the Act: None
Indicate by check mark if the registrant is a well-known seasoned issuer, as defined in Rule 405 of the Securities Act. Yes [ ] No [ X ]
Indicate by check mark if the registrant is not required to file reports pursuant to Section 13 or Section 15(d) of the Act. Yes [ ] No [ X ]
Indicate by check mark whether the registrant (1) has filed all reports required to be filed by Section 13 or 15(d) of the Securities Exchange Act of 1934 during the preceding 12 months (or for such shorter period that the registrant was required to file such reports), and (2) has been subject to such filing requirements for the past 90 days. Yes [ X ] No [ ]
Indicate by check mark whether the registrant has submitted electronically and posted on its corporate website, if any, every Interactive Data File required to be submitted and posted pursuant to Rule 405 of Regulation S-T during the preceding 12 months (or for such shorter period that the registrant was required to submit and post such files). Yes [ X ] No [ ]
1
Indicate by check mark if disclosure of delinquent filers pursuant to Item 405 of Regulation S-K is not contained herein, and will not be contained, to the best of registrant’s knowledge, in definitive proxy or information statements incorporated by reference in Part III of this Form 10-K, or any amendment to this Form 10-K. [X ]
Indicate by check mark whether the registrant is a large accelerated filer, an accelerated filer, a non-accelerated filer or a smaller reporting company. See the definitions of "large accelerated filer,” “accelerated filer" and “smaller reporting company” in Rule 12b-2 of the Exchange Act (Check one):
Large Accelerated Filer [ ]
Accelerated Filer [X]
Non-Accelerated Filer [ ] (do not check if a smaller reporting company)
Smaller Reporting Company [ ]
Indicate by check mark whether the registrant is a shell company (as defined in Rule 12b-2 of the Exchange Act). Yes [ ] No [ X ]
As of November 27, 2015, 8,770,612 shares of Class A and 1,212,382 shares of Class B common stock of the registrant were outstanding. The aggregate market value of voting and non-voting common stock of the registrant held by nonaffiliates of the registrant was approximately $139,000,000 on April 2, 2015 (the last business day preceding the registrant’s most recently completed fiscal second quarter) based on approximately 4,760,000 shares of Class A common stock held by nonaffiliates as of such date. For purposes of this calculation only, shares of all voting stock are deemed to have a market value of $34.66 per share, the closing price of the Class A common stock as reported on the NASDAQ Global MarketSM on April 2, 2015 (the last trading day preceding the registrant’s most recently completed fiscal second quarter). Shares of common stock held by any executive officer or director of the registrant (including all shares beneficially owned by the Johnson Family) have been excluded from this computation because such persons may be deemed to be affiliates. This determination of affiliate status is not a conclusive determination for other purposes.
DOCUMENTS INCORPORATED BY REFERENCE
Portions of the Proxy Statement for the 2016 Annual Meeting of the Shareholders of the Registrant are incorporated by reference into Part III of this report.
As used in this report, the terms “we,” “us,” “our,” “Johnson Outdoors” and the “Company” mean Johnson Outdoors Inc. and its subsidiaries collectively, unless the context indicates another meaning.
2
|
TABLE OF CONTENTS
|
Page
|
|||
|
Business
|
4 | |||
|
Risk Factors
|
10 | |||
|
Unresolved Staff Comments
|
16 | |||
|
Properties
|
16 | |||
|
Legal Proceedings
|
17 | |||
|
Mine Safety Disclosures
|
17 | |||
|
Market for Registrant’s Common Equity, Related Stockholder Matters and Issuer Purchases of Equity Securities
|
18 | |||
|
Selected Financial Data
|
20 | |||
|
Management’s Discussion and Analysis of Financial Condition and Results of Operations
|
21 | |||
|
Quantitative and Qualitative Disclosures about Market Risk
|
31 | |||
|
Financial Statements and Supplementary Data
|
31 | |||
|
Changes in and Disagreements with Accountants on Accounting and Financial Disclosure
|
31 | |||
|
Controls and Procedures
|
31 | |||
|
Other Information
|
32 | |||
|
Directors, Executive Officers and Corporate Governance
|
32 | |||
|
Executive Compensation
|
32 | |||
|
Security Ownership of Certain Beneficial Owners and Management and Related Stockholder Matters
|
33 | |||
|
Certain Relationships and Related Transactions, and Director Independence
|
33 | |||
|
Principal Accountant Fees and Services
|
33 | |||
|
Exhibits and Financial Statement Schedules
|
34 | |||
|
Signatures
|
35 | |||
|
Exhibit Index
|
36 | |||
|
Consolidated Financial Statements
|
F-1 | |||
Forward Looking Statements
Certain matters discussed in this Form 10-K are “forward-looking statements,” and the Company intends these forward-looking statements to be covered by the safe harbor provisions for forward-looking statements contained in the Private Securities Litigation Reform Act of 1995 and is including this statement for purposes of those safe harbor provisions. These statements may be identified by the use of forward-looking words or phrases such as “anticipate,” “believe,” “confident,” “could,” “expect,” “intend,” “may,” “planned,” “potential,” “should,” “will,” “would” or the negative of those terms or other words of similar meaning. Such forward-looking statements are subject to certain risks and uncertainties, which could cause actual results or outcomes to differ materially from those currently anticipated. Similarly, statements that describe the Company’s future plans, objectives or goals are also forward-looking statements.
Factors that could affect actual results or outcomes include the matters described under the caption “Risk Factors” in Item 1A of this report and the following: changes in economic conditions, consumer confidence levels and discretionary spending patterns in key markets; the Company’s success in implementing its strategic plan, including its targeted sales growth platforms and focus on innovation; litigation costs related to actions of and disputes with third parties, including competitors; the Company’s continued success in working capital management and cost-structure reductions; the Company’s ongoing success in meeting financial covenants in its credit agreements with its lenders; the Company’s success in integrating strategic acquisitions; the risk of future writedowns of goodwill or other long-lived assets; the ability of the Company's customers to meet payment obligations; movements in foreign currencies, interest rates or commodity costs; fluctuations in the prices of raw materials or the availability of raw materials used by the Company; the success of the Company’s suppliers and customers; the ability of the Company to deploy its capital successfully; unanticipated outcomes related to outsourcing certain manufacturing processes; unanticipated outcomes related to litigation matters; and adverse weather conditions. Shareholders, potential investors and other readers are urged to consider these factors in evaluating the forward-looking statements and are cautioned not to place undue reliance on such forward-looking statements. The forward-looking statements included herein are only made as of the date of this filing. The Company assumes no obligation, and disclaims any obligation, to update such forward-looking statements to reflect subsequent events or circumstances.
3
Trademarks
We have registered the following trademarks, which may be used in this report: Minn Kota®, Cannon®, Humminbird®, LakeMaster®, Silva®, Eureka!®, Jetboil®, Old Town®, Ocean Kayakä, Necky®, Extrasport®, Carlisle®, SCUBAPRO®, and SUBGEAR®.
PART I
ITEM 1. BUSINESS
Johnson Outdoors is a leading global manufacturer and marketer of branded seasonal, outdoor recreation products used primarily for fishing from a boat, diving, paddling, hiking and camping. The Company’s portfolio of well-known consumer brands has attained leading market positions due to continuous innovation, marketing excellence, product performance and quality. Company values and culture support innovation in all areas, promoting and leveraging best practices and synergies within and across its subsidiaries to advance the Company’s strategic vision set by executive management and approved by the Board of Directors. The Company is controlled by Helen P. Johnson-Leipold (Chairman and Chief Executive Officer), members of her family and related entities.
The Company was incorporated in Wisconsin in 1987 as successor to various businesses.
Marine Electronics
The Company’s Marine Electronics segment key brands are: Minn Kota battery-powered fishing motors for quiet trolling or primary propulsion, marine battery chargers and shallow water anchors; Humminbird sonar and GPS equipment for fishfinding, navigation and marine cartography; and Cannon downriggers for controlled-depth fishing.
Marine Electronics’ brands and related accessories are sold across the globe, with the majority of sales coming from North America through large outdoor specialty retailers, such as Bass Pro Shops and Cabela’s; large retail store chains; marine products distributors; original equipment manufacturers (OEM) of boat brands such as Tracker, Skeeter and Ranger; and internet retailers and distributors. Markets outside of North America are accessed through a network of international distributors.
Marine Electronics has achieved market share gains by focusing on product innovation, quality products and effective marketing. Such consumer marketing and promotion activities include: product placements on fishing-related television shows; print advertising and editorial coverage in outdoor, general interest and sport magazines; professional angler and tournament sponsorships; packaging and point-of-purchase materials and offers to increase consumer appeal and sales; branded websites; social media networks; and online promotions.
Outdoor Equipment
The Company’s Outdoor Equipment segment key brands are: Eureka! consumer, commercial and military tents and accessories, sleeping bags, camping furniture and other recreational camping products; Jetboil portable outdoor cooking systems; and Silva field compasses.
Eureka! consumer tents, sleeping bags, camping furniture and other recreational camping products are mid- to high-price range products sold in the U.S. and Canada through independent sales representatives, primarily to camping and backpacking specialty stores, sporting goods stores, catalog and mail order houses and through internet retailers. Marketing of the Company’s tents, sleeping bags and other recreational camping products is focused on building the Eureka! brand name and establishing the Company as a leader in tent design and innovation. The Company’s consumer camping tents and sleeping bags are produced by third party manufacturing sources in Asia. Eureka! camping products are sold under license in Japan, Australia and Europe.
Eureka! commercial tents include party tents and accessories, sold primarily to general rental stores, and other commercial tents and accessories sold directly to tent erectors. The Company’s commercial tent products range from 10’x10’ canopies to 120’ wide pole tents and other large scale frame structures and are primarily manufactured by the Company at the Company’s Binghamton, New York location.
4
Eureka! also designs and manufactures large, heavy-duty tents and lightweight backpacking tents for the military at its Binghamton, New York location. Tents produced for military use in the last twelve months include modular general purpose tents, rapid deployment shelters and various lightweight one and two person tents. The Company manufactures military tent accessories like fabric floors and insulated thermal liners and is also a subcontract manufacturer for other providers of military tents.
Jetboil portable outdoor cooking systems are sold in the U.S. and Canada through independent sales representatives, primarily to camping and backpacking specialty stores, sporting goods stores, catalog and mail order houses and through internet retailers. Marketing of Jetboil systems is focused on building brand awareness and leadership in product features and innovation. Jetboil products are produced at both the Company’s operating location in Manchester, New Hampshire and by third party manufacturing sources in Asia. Jetboil products are sold in approximately 30 countries around the world.
Silva field compasses are manufactured by the Company and marketed exclusively in North America where the Company owns Silva trademark rights.
Watercraft
The Company’s Watercraft segment designs and markets Necky high performance sea touring kayaks; sit on top Ocean Kayaks; and Old Town canoes and kayaks for family recreation, touring, angling and tripping. With the exception of Necky fiberglass boats and Old Town wooden canoes, these brands are manufactured at the Company’s facility in Old Town, Maine.
The Company uses a rotational molding process for manufacturing mid- to high-end polyethylene kayaks and canoes. The Company uses a thermoform molding process in the manufacturing of lower priced models. The Company’s United States warehouse and distribution center for all of its Watercraft brands is also located in Old Town, Maine.
Watercraft accessory brands, including Extrasport personal flotation devices and Carlisle branded paddles, are produced primarily by third party sources located in North America and Asia.
The Company’s kayaks, canoes and accessories are sold through multiple channels in the U.S., Europe and the Pacific Basin with an emphasis on independent specialty retailers and large outdoor retailers such as REI, L.L. Bean, Academy and Cabela’s. The Company has a network of distributors who sell Company products outside of North America.
The Company’s Watercraft business competes in the mid- to high-end of the product category by introducing product innovations, creating quality products and by focusing on the product-specific needs of each marketing channel. Consumer marketing and promotion activities include: print advertising and editorial coverage in outdoor, general interest and sport magazines; direct marketing; and using branded websites and social media networks.
Diving
The Company manufactures and markets underwater diving products for recreational divers, which it sells and distributes under the SCUBAPRO brand name.
The Company markets a complete line of underwater diving and snorkeling equipment, including regulators, buoyancy compensators, dive computers and gauges, wetsuits, masks, fins, snorkels and accessories. SCUBAPRO diving equipment is marketed to the premium segment and high performance technical diving market. Products are sold via select distribution to independent specialty dive stores worldwide. These specialty dive stores sell the Company’s products over the counter as well as through their own websites. In addition, they generally provide a wide range of services to divers, including regular maintenance, product repair, diving education and travel programs. The Company also sells diving gear to dive training centers, resorts, search and rescue units and armed forces around the world.
5
The Company’s consumer communication focuses on building brand awareness and highlighting exclusive product features and consumer benefits of its product lines. The Company’s communication and distribution strategies reinforce the SCUBAPRO brand’s position as the industry’s quality and innovation leader. The Company markets its equipment in diving magazines, via websites, through social media and through information and displays in dive specialty stores.
The Company manufactures regulators, dive computers, gauges, and instruments at its Italian and Indonesian facilities. The Company sources buoyancy compensators, neoprene goods, plastic products, proprietary materials, and other components from third parties.
Financial Information for Business Segments
As noted above, the Company has four reportable business segments. See Note 12 to the consolidated financial statements included elsewhere in this report for financial information concerning each business segment.
International Operations
See Note 12 to the consolidated financial statements included elsewhere in this report for financial information regarding the Company’s domestic and international operations. See Note 1, subheading “Foreign Operations and Related Derivative Financial Instruments,” to the consolidated financial statements included elsewhere in this report for information regarding risks related to the Company’s foreign operations.
Research and Development
The Company commits significant resources to new product research and development in each of its business segments. Marine Electronics conducts its product research, design, engineering and software development activities at its locations in Mankato and Little Falls, Minnesota; Alpharetta, Georgia; and Eufaula, Alabama. Diving maintains research and development facilities in Zurich, Switzerland and Casarza Ligure, Italy. Research and development activities for Watercraft are performed in Old Town, Maine. Product research, design and innovation for Outdoor Equipment products are conducted at the Company's Binghamton, New York and Manchester, New Hampshire locations.
The Company expenses research and development costs as incurred, except for software development for new electronics products and bathymetry data collection and processing. These costs are capitalized once technological feasibility is established and then amortized over the expected useful life of the software or database. The amounts expensed by the Company in connection with research and development activities for each of the last three fiscal years are set forth in the Company’s Consolidated Statements of Operations included elsewhere in this report.
Industry and Competitive Environment
The Company believes its products compete favorably on the basis of product innovation, product performance and marketing support and, to a lesser extent, price.
Marine Electronics: Minn Kota’s main competitors in the electric trolling motors business are Motor Guide®, owned by Brunswick Corporation, and private label branded motors sourced primarily from manufacturers in Asia. Competition in this business is focused on technological innovation, product quality and durability as well as product benefits and features for fishing.
The primary competitors in the marine battery charging business are Dual Pro™, owned by Pro Charging Systems, and various Pro Mariner™ products, owned by Power Products, LLC. Competition in this business is based on charging time, reliability and battery protection. The primary competitor in shallow water anchors is Power Pole®, owned by JL Marine Systems. Competition in this business is based on secure positioning, speed of deployment and quiet operation.
6
Humminbird’s main competitors in the market for on-boat electronics are GarminTM, LowranceTM and Simrad, owned by Navico, and Raymarine®, owned by FLIR Systems. Competition in this business is primarily focused on the quality of sonar imaging and display, easy to use graphical interfaces as well as the integration of mapping and GPS technology. Humminbird products contain marine cartography features. Competitors offering marine cartography products include Navionics®, and C-Map, owned by Jeppesen Marine Inc. Competition in this business focuses primarily on quality of data and quantity of available charts for inland lakes and ocean shoreline.
Cannon’s main competitors in the downrigger market are Big Jon Sports®, Walker and Scotty®. Competition in this business primarily focuses on ease of operation, speed and durability.
Outdoor Equipment: The Company’s outdoor equipment brands and products compete in the sporting goods and specialty segments of the outdoor equipment market. Competitive brands with a strong position in the sporting goods channel include Coleman® and private label brands. The Company also competes with specialty companies such as Kelty®, The North Face® and Marmot® on the basis of materials and innovative designs for consumers who want performance products priced at a value.
The Company’s portable outdoor cooking systems compete in the specialty and higher end performance backpacking and camping markets. The primary competitor in portable outdoor cooking systems is MSR® which is owned by Cascade Designs®. Competition in this market is based on product size and weight, ease of use, reliability and performance.
The Company’s competitors in the commercial tent market include Anchor Industries® and Aztec Tents for tension, frame and canopy tents. Competition in the commercial tent business is based on price, quality, structure, styling, ease of installation and technical support.
The Company sells military tents to prime vendors and third party distributors who hold supply contracts primarily with the U.S. Government, as well as to international governments. Such supply contracts can be for commercial off-the-shelf products in addition to products required to be built to unique specifications. Competitors in the military tent business include HDT®, Alaska Structures®, Camel, Outdoor Venture, and Diamond Brand.
Watercraft: The Company primarily competes in this segment in the kayak and canoe product categories of the paddlesports market. The Company’s main competitors in this market are Confluence Outdoor, Hobie Cat®, Wenonah Canoe, Jackson Kayak and Legacy Paddlesports™, each of which competes on the basis of their product’s design, performance, quality and price.
Diving: The main competitors in the Diving segment include Aqua Lung®, Suunto®, Atomic Aquatics, Oceanic, Cressi and Mares®. Competitive advantage in the life support product category of this segment, which consists of regulators, dive computers, and buoyancy compensators, is a function of product innovation, performance, quality and safety.
Competition in the general diving product category of fins, masks, snorkels and wetsuits is characterized by low barriers to entry and numerous competitors who compete on the basis of product innovation, performance, quality and price.
Backlog
Unfilled orders for future delivery of products totaled approximately $55 million at October 2, 2015. For the majority of its products, the Company’s businesses do not receive significant orders in advance of expected shipment dates.
Employees
At October 2, 2015, the Company had approximately 1,200 regular, full-time employees. The Company considers its employee relations to be excellent. Temporary employees are utilized primarily to manage peaks in the seasonal manufacturing of products.
7
Patents, Trademarks and Proprietary Rights
The Company holds various patents for sonar, diving products and electric trolling motors, amongst other products, and regularly files applications for patents. The Company has numerous trademarks and trade names which it considers important to its business, many of which are noted in this report. Historically, the Company has vigorously defended its intellectual property rights and expects to continue to do so.
Supply Chain and Sourcing of Materials
The Company manufactures some products that use parts or materials that, due to geographical distance, limited supplier capacity or availability or competing demands for such parts or materials, are only available in a cost effective manner from a single vendor or require the Company to place orders several months in advance of required delivery.
The Company attempts to mitigate product availability and these supply chain risks when possible through the purchase of safety stock, use of forecast-based supply contracts, and, to a lesser extent, with just in time inventory deliveries or supplier-owned inventory located close to the Company’s manufacturing locations. The Company strives to balance the businesses’ need to maintain adequate inventory levels with the cost of holding such inventory by manufacturing to forecast for high volume products, utilizing build-to-order strategies wherever possible, and by having contract-manufactured products delivered to customers directly from the supplier. The Company also seeks to manage its inventory through on-going product design and logistical initiatives with its suppliers to reduce lead times.
As most military contracts require utilization of domestic suppliers, the Company is limited to key vendors for materials used in its military tent business.
A significant driver of the delivered cost of the Company’s Watercraft products is fuel prices. The Company seeks to mitigate this cost through negotiated fuel surcharge rates with its shipping firms and by optimizing the loads and routing of its deliveries to customers.
Seasonality
The Company’s products are outdoor recreation-related, which results in seasonal variations in sales and profitability. This seasonal variability is due to customers’ increasing their inventories in the quarters ending March and June, the primary selling season for the Company’s outdoor recreation products, with lower inventory volumes during the quarters ending September and December. The Company mitigates the seasonality of its businesses somewhat by encouraging customers to purchase and take delivery of products more evenly through the year. The following table shows, for the past three fiscal years, the total net sales and operating profit or loss of the Company for each quarter, as a percentage of the total year.
| Fiscal Year | ||||||||||||||||||||||||
|
2015
|
2014
|
2013
|
||||||||||||||||||||||
|
Quarter Ended
|
Net
Sales
|
Operating
Profit
|
Net
Sales
|
Operating
Profit
|
Net
Sales
|
Operating
Profit
|
||||||||||||||||||
|
December
|
16 | % | -41 | % | 19 | % | -17 | % | 21 | % | 6 | % | ||||||||||||
|
March
|
31 | % | 43 | % | 29 | % | 69 | % | 31 | % | 49 | % | ||||||||||||
|
June
|
33 | % | 92 | % | 32 | % | 56 | % | 30 | % | 63 | % | ||||||||||||
|
September
|
20 | % | 6 | % | 20 | % | -8 | % | 18 | % | -18 | % | ||||||||||||
| 100 | % | 100 | % | 100 | % | 100 | % | 100 | % | 100 | % | |||||||||||||
8
Environment and Climate Change
The Company is subject to various supranational, federal, state and local environmental laws, ordinances, regulations, and other requirements of governmental authorities. We believe we comply with such laws and regulations. Expenditures on environmental compliance have not had, and we believe in the future, will not have, a material effect on the Company’s capital expenditures, earnings or competitive position. We do not believe that any direct or indirect consequences of legislation related to climate change will have a material effect on our operating costs, facilities or products.
Available Information
The Company maintains a website at www.johnsonoutdoors.com. On its website, the Company makes available, free of charge, its Annual Report on Form 10-K, quarterly reports on Form 10-Q, current reports on Form 8-K and amendments to those reports, as soon as reasonably practical after the reports have been electronically filed or furnished to the Securities and Exchange Commission. In addition, the Company makes available on its website, free of charge, its (a) proxy statement for its annual meeting of shareholders; (b) Code of Business Conduct; (c) Code of Ethics for its Chief Executive Officer and Senior Financial and Accounting Officers; and (d) the charters for the following committees of the Board of Directors: Audit; Compensation; Executive; and Nominating and Corporate Governance. Except as specifically provided herein, the Company is not including the information contained on or available through its website as a part of, or incorporating such information by reference into, this Annual Report on Form 10-K. This report includes all material information about the Company that is included on the Company’s website and is otherwise required to be included in this report. Copies of any materials the Company files with the Securities and Exchange Commission (SEC) can also be obtained free of charge through the SEC’s website at www.sec.gov. The SEC’s Public Reference Room can be contacted at 100 F Street, N.E., Washington, D.C. 20549, or by calling 1 (800) 732-0330.
9
ITEM 1A. RISK FACTORS
The risks described below are not the only risks we face. Additional risks that we do not yet know of or that we currently think are immaterial may also impair our future business operations. If any of the events or circumstances described in the following risks actually occur, our business, financial condition or results of operations could be materially adversely affected. In such cases, the trading price of our common stock could decline.
Our net sales and profitability depend on our ability to continue to conceive, design and market products that appeal to our consumers.
Our business depends on our ability to continue to conceive, design, manufacture and market new products and upon continued market acceptance of our product offering. Rapidly changing consumer preferences and trends make it difficult to predict how long consumer demand for our existing products will continue or what new products will be successful. A decline in consumer demand for our products, our failure to develop new products on a timely basis in anticipation of changing consumer preferences or the failure of our new products to achieve and sustain consumer acceptance could reduce our net sales and profitability.
Competition in our markets could reduce our net sales and profitability.
We operate in highly competitive markets. We compete with several large domestic and foreign companies such as Brunswick, Navico, Garmin, Confluence Outdoor and Aqua Lung International, with private label products sold by many of our retail customers and with other producers of outdoor recreation products. Some of our competitors have longer operating histories, stronger brand recognition and greater financial, technical, marketing and other resources than us. In addition, we may face competition from new participants in our markets because some of the outdoor recreation product industries have limited barriers to entry. We experience price competition for our products, and competition for shelf space at retailers, all of which may increase in the future. If we cannot compete in our product markets successfully in the future, our net sales and profitability will likely decline.
General economic conditions affect the Company’s results.
Our revenues are affected by economic conditions and consumer confidence worldwide, but especially in the United States and Europe. In times of economic uncertainty, consumers tend to defer expenditures for discretionary items, which affects demand for our products. Moreover, our businesses are cyclical in nature, and their success is impacted by general economic conditions and specific economic conditions affecting the regions and markets we serve, the overall level of consumer confidence in the economy and discretionary income levels. Any substantial deterioration in general economic conditions that diminishes consumer confidence or discretionary income can reduce our sales and adversely affect our financial results. Moreover, declining economic conditions create the potential for future impairments of goodwill and other intangible and long-lived assets that may negatively impact our financial condition and results of operations. The impact of weak consumer credit markets, corporate restructurings, layoffs, prolonged high unemployment rates, declines in the value of investments and residential real estate, higher fuel prices and increases in federal and state taxation all can negatively affect our operating results.
Intellectual property disputes relating to our products could increase our costs.
Our industry is susceptible to litigation regarding patent infringement and infringement of other intellectual property rights. We could be either a plaintiff or a defendant in trademark, patent and/or other intellectual property infringement or misappropriation claims and claims of breach of license from time to time. The prosecution or defense of any intellectual property litigation is both costly and disruptive of the time and resources of our management and product development teams, even if the claim or defense against us is without merit. The scope of any patent or other intellectual property to which we have or may obtain rights also may not prevent others from developing and selling competing products. The validity and breadth of claims covered in patents and other intellectual property involve complex legal and factual questions, and the resolution of such claims may be highly uncertain, lengthy and expensive. In addition, our patents or other intellectual property may be held invalid upon challenge, or others may claim that we have improperly or invalidly sought patent or other intellectual property protection for our technology, thus exposing us to direct or counter claims in any patent or intellectual property proceeding. We could also be required to pay substantial damages or settlement costs to resolve intellectual property litigation.
10
Furthermore, we may rely on trade secret law to protect technologies and proprietary information that we cannot or have chosen not to patent. Trade secrets, however, are difficult to protect. Although we attempt to maintain protection through confidentiality agreements with necessary personnel, contractors and consultants, we cannot guarantee that such contracts will not be breached. In the event of a breach of a confidentiality agreement or the divulgence of proprietary information, we may not have adequate legal remedies to maintain our trade secret protection. Litigation to determine the scope of intellectual property rights, even if ultimately successful, could be costly and could divert management’s attention away from the Company’s business. Any of these negative events could adversely affect our profitability or operating results.
Product recalls and other claims could affect our financial position and results of operations.
As a manufacturer and distributor of consumer products, we could be required to repurchase or recall one or more of our products if they are found to be unsafe or defective. A repurchase or recall of our products could be costly to us and could damage the reputation of our brands. If we were required to remove, or we voluntarily removed, our products from the market, our reputation could be tarnished and we might have large quantities of finished products that we could not sell. As a result, product recalls could have a material adverse effect on our business, results of operations and financial condition.
Impairment charges could impact our future financial position and results of operations.
We test our goodwill and other long-lived assets for impairment on an annual basis or when an event occurs that might reduce the fair value of the reporting unit or applicable asset or group of assets below its carrying value. Various uncertainties, including significant adverse changes in business climate, adverse actions by regulators, unanticipated competition, loss of key customers, a downturn in the economy or in discretionary income levels or changes in consumer preferences could impact the expected cash flows to be generated by an asset or group of assets, and may result in an impairment of those assets. Although any such impairment charge would be a non-cash expense, any impairment of our assets could materially increase our expenses and reduce our profitability. We recorded impairment charges totaling $8,475 in the year ended October 3, 2014.
Sales of our products are seasonal, which causes our operating results to vary from quarter to quarter.
Sales of our products are seasonal. Historically, our net sales and profitability have peaked in our second and third fiscal quarters due to the buying patterns of our customers for our products. Seasonal variations in operating results may also cause us to increase our debt levels and interest expense primarily in the second and third fiscal quarters as we fund our working capital requirements.
The trading price of shares of our common stock fluctuates and investors in our common stock may experience substantial losses.
The trading price of our common stock has been volatile and may continue to be volatile in the future. The trading price of our common stock could decline or fluctuate in response to a variety of factors, including:
-
the timing of our announcements or those of our competitors concerning significant product developments, acquisitions or financial performance;
-
fluctuation in our quarterly operating results;
-
substantial sales of our common stock;
-
general stock market conditions; or
-
other economic or external factors.
You may be unable to sell your stock at or above your purchase price.
A limited number of our shareholders can exert significant influence over the Company.
11
As of November 27, 2015, Helen P. Johnson-Leipold, members of her family and related entities (hereinafter the Johnson Family), held approximately 77% of the voting power of both classes of our common stock taken as a whole. This voting power would permit these shareholders, if they chose to act together, to exert significant influence over the outcome of shareholder votes, including votes concerning the election of directors, by-law amendments, possible mergers, corporate control contests and other significant corporate transactions. Moreover, certain members of the Johnson Family have entered into a voting trust agreement covering approximately 96% of our outstanding class B common shares. This voting trust agreement permits these shareholders, if they continue to choose to act together, to exert significant influence over the outcome of shareholder votes, including votes concerning the election of directors, by-law amendments, possible mergers, corporate control contests and other significant corporate transactions.
We may experience difficulties in integrating strategic acquisitions.
We have, as part of our strategy, historically pursued strategic acquisitions. The pursuit of future growth through acquisitions, involves significant risks that could have a material adverse effect on our business. Risks associated with integrating strategic acquisitions include:
- the acquired business may experience losses which could adversely affect our profitability;
-
unanticipated costs relating to the integration of acquired businesses may increase our expenses and reduce our profitability;
-
the possible failure to obtain any necessary consents to the transfer of licenses or other material agreements of the acquired company;
-
the possible failure to maintain customer, licensor and other relationships of the acquired company after the closing of the transaction with the acquired company;
-
difficulties in achieving planned cost savings and synergies may increase our expenses;
-
diversion of our management’s attention could impair their ability to effectively manage our other business operations;
-
unanticipated management or operational problems or liabilities may adversely affect our profitability and financial condition; and/or
-
breaches of the representations or warranties or other violations of the contractual obligations required by the acquisition agreement of other parties to the acquisition transaction and any contractual remedies related thereto may not adequately protect or compensate us.
We are dependent upon certain key members of management.
Our success will depend to a significant degree on the abilities and efforts of our senior management. Moreover, our success depends on our ability to attract, retain and motivate qualified management, marketing, technical and sales personnel. These people are in high demand and often have competing employment opportunities. The labor market for skilled employees is highly competitive and we may lose key employees or be forced to increase their compensation to retain these people. Employee turnover could significantly increase our recruitment, training and other related employee costs. The loss of key personnel, or the failure to attract qualified personnel, could have a material adverse effect on our business, financial condition or results of operations.
Sources of and fluctuations in market prices of raw materials can affect our operating results.
The primary raw materials we use in manufacturing our products are metals, resins and packaging materials. These materials are generally available from a number of suppliers, but we have chosen to concentrate our sourcing with a limited number of vendors for each commodity or purchased component. We believe our sources of raw materials are reliable and adequate for our needs. However, the development of future sourcing issues related to the availability of these materials as well as significant fluctuations in the market prices of these materials may have an adverse effect on our financial results.
Our profitability is also affected by significant fluctuations in the prices of the raw materials we use in our products, including the effect of fluctuations in foreign currency exchange rates on raw materials and purchased components. We may not be able to pass along any price increases in our raw materials or other component costs to our customers. As a result, an increase in the cost of raw materials, labor or other costs associated with the manufacturing of our products could increase our costs of sales and reduce our gross margins.
12
Financial distress in supply chain and shortage of raw materials or components of supply.
Deteriorating industry conditions can adversely affect our supply base. Lower production levels at our major suppliers and volatility in certain raw material and energy costs may result in severe financial distress among many companies within our supply base. Financial distress within our supply base and/or our suppliers’ inability to obtain credit from lending institutions could lead to commercial disputes and possible supply chain interruptions to our business. In addition, potential adverse industry conditions may require us to provide financial assistance or other measures to ensure uninterrupted production of key components or materials used in the production of our products which could have a material adverse effect on our existing and future revenues and net income.
Additionally, in the event of catastrophic acts of nature such as fires, tsunamis, hurricanes and earthquakes or a rapid increase in production demands, either we, or our suppliers may experience supply shortages of raw materials or components. This could be caused by a number of factors, including a lack of production line capacity or manpower or working capital constraints. In order to manage and reduce the costs of purchased goods and services, we, and others within our industry have been rationalizing and consolidating our supply base. As a result, there is greater dependence on fewer sources of supply for certain components and materials used in our products, which could increase the possibility of a supply shortage of any particular component. If we or one of our own suppliers experience a supply shortage, we may become unable to produce the affected products if we cannot procure the components from another source. Such production interruptions could impede a ramp-up in production and could have a material adverse effect on our business, results of operations and financial condition.
We consider the production capacities and financial condition of suppliers in our selection process, and expect that they will meet our delivery requirements. However, there can be no assurance that strong demand, capacity limitations, shortages of raw materials, labor disputes or other problems will not result in any shortages or delays in the supply of components to us.
Currency exchange rate fluctuations could adversely affect the Company’s results.
We have significant foreign operations, for which the functional currencies are denominated primarily in euros, Swiss francs, Hong Kong dollars, Japanese yen and Canadian dollars. As the values of the currencies of the foreign countries in which we have operations increase or decrease relative to the U.S. dollar, the sales, expenses, profits, losses, assets and liabilities of our foreign operations, as reported in our consolidated financial statements, increase or decrease, accordingly. Approximately 18% of our revenues for the year ended October 2, 2015 were denominated in currencies other than the U.S. dollar. Approximately 8% were denominated in euros and approximately 6% were denominated in Canadian dollars with the remaining 4% denominated in various other foreign currencies. We may mitigate a portion of the impact of fluctuations in certain foreign currencies on our operations through the purchase of foreign currency swaps, forward contracts and options to hedge known commitments denominated in foreign currencies or to reduce the risk of changes in foreign currency exchange rates on foreign currency borrowings.
Because we rely on foreign suppliers and we sell products in foreign markets, we are susceptible to numerous international business risks that could increase our costs or disrupt the supply of our products.
Our international operations subject us to risks, including:
-
economic and political instability;
-
restrictive actions by foreign governments;
-
opportunity costs and reputational damage related to the presence of counterfeit versions of the Company’s products in such foreign markets;
-
greater difficulty enforcing intellectual property rights and weaker laws protecting intellectual property rights;
-
changes in import duties or import or export restrictions;
-
timely shipping of product and unloading of product, including the timely rail/truck delivery to our warehouses and/or a customer’s warehouse of our products;
-
complications in complying with the laws and policies of the United States affecting the importation of goods, including duties, quotas and taxes;
-
required compliance with U.S. laws that impact the Company’s operations in foreign jurisdictions that don’t impact local operating companies; and
-
complications in complying with trade and foreign tax laws.
13
Any of these risks, including the cost of compliance with trade and foreign tax laws, could disrupt the supply of our products or increase our expenses. In particular, the uncertainty regarding the ability of certain European countries to continue to service their sovereign debt obligations and the related financial restructuring efforts by European governments may cause the value of several European currencies, including the euro, to fluctuate, which may adversely affect our non-U.S. dollar sales and earnings. As we have manufacturing operations in Italy, a significant disruption of the political or financial systems there could put these manufacturing operations at risk, which could ultimately adversely affect our profitability or operating results.
We may be subject to disruptions or failures in our information technology systems and network infrastructures that could have a material adverse effect on our business.
We rely on the efficient and uninterrupted operation of complex information technology systems and network infrastructures to operate our business. We also hold data in various data center facilities upon which our business depends. A disruption, infiltration or failure of our information technology systems or any of our data centers as a result of software or hardware malfunctions, system implementations or upgrades, computer viruses, third-party security breaches, employee error, theft or misuse, malfeasance, power disruptions, natural disasters or accidents could cause breaches of data security, loss of intellectual property and critical data and the release and misappropriation of sensitive competitive information. Any of these events could result in the loss of key information, impair our production and supply chain processes, harm our competitive position, damage our reputation with customers, cause us to incur significant costs to remedy any damages and ultimately materially and adversely affect our business, results of operations and financial condition. While we have implemented a number of protective measures, such measures may not be adequate or implemented properly to prevent or fully address the adverse effect of such events.
Our failure to adequately protect personal information could have a material adverse effect on our business.
A wide variety of local, state, national, and international laws, directives and regulations apply to the collection, use, retention, protection, disclosure, transfer, and other processing of personal data. These data protection and privacy-related laws and regulations continue to evolve and may result in ever-increasing regulatory and public scrutiny and escalating levels of enforcement and sanctions and increased costs of compliance. Certain safe-harbor exemptions upon which the Company relies for data transfers have been challenged and may no longer available to us in the future. Our failure to comply with applicable laws and regulations, or to protect such data, could result in enforcement actions against us, including fines, imprisonment of company officials and public censure, claims for damages by end-customers and other affected individuals, damage to our reputation and loss of goodwill (both in relation to existing end-customers and prospective end-customers), any of which could have a material adverse effect on our operations, financial performance, and business. Changing definitions of personal data and personal information, within the European Union, the United States, and elsewhere may limit or inhibit our ability to operate or expand our business, including limiting strategic partnerships that may involve the sharing of data. The evolving data protection regulatory environment may require significant management attention and financial resources to analyze and modify our information technology infrastructure to meet these changing requirements all of which could reduce our operating margins and impact our operating results and financial condition.
Future terror attacks, war, natural disasters or other catastrophic events beyond our control could negatively impact our business.
Terror attacks, war or other civil disturbances, natural disasters and other catastrophic events could lead to economic instability and decreased demand for our products, which could negatively impact our business, financial condition, results of operations and cash flows. In the past, terrorist attacks have caused instability in global financial markets and the industries in which we compete and have negatively affected spending on consumer discretionary products. In addition, our facilities are located throughout the world and could be subject to damage from terrorism incidents or from fires, floods, earthquakes or other natural or man-made disasters. Terrorist incidents could also lead to increased border security which could in turn negatively impact our global supply chain by causing shipping delays or shortages in key materials or components, increasing the cost of such goods or requiring us to keep greater inventories, any of which may adversely impact our business, results of operations, financial condition or cash flows.
14
The inability to successfully defend claims asserted by taxing authorities could adversely affect our financial condition, results of operations and cash flows.
We conduct business in many countries, which requires us to interpret the income tax laws and rulings in each of those taxing jurisdictions. Due to the subjectivity of tax laws in or between those jurisdictions, as well as the subjectivity of factual interpretations, our estimates of income tax liabilities may differ from actual payments or assessments. Claims from taxing authorities related to these differences could have an adverse impact on our financial condition, results of operations and cash flows.
We are subject to environmental, safety and human rights regulations.
We are subject to supranational, federal, state, local and foreign laws and other legal requirements related to the generation, storage, transport, treatment and disposal of materials as a result of our manufacturing and assembly operations. These laws include the Resource Conservation and Recovery Act (as amended), the Clean Air Act (as amended) and the Comprehensive Environmental Response, Compensation and Liability Act (as amended). Risk of environmental liability and changes associated with maintaining compliance with environmental laws is inherent in the nature of our business and there is no assurance that material liabilities or changes would not arise.
The Company is also subject to the requirement of Section 1502 of the Dodd-Frank Wall Street Reform and Consumer Protection Act and SEC rules related thereto to conduct due diligence and disclose and report on whether certain minerals and metals, known as “conflict minerals,” are contained in the Company’s products and whether they originate from the Democratic Republic of Congo (“DRC”) and adjoining countries. Among other things, compliance with this rule could adversely affect the sourcing, availability and pricing of such materials if they are found to be used in the manufacture of the Company’s products, and this in turn could affect the costs associated with the Company’s products. As there may be only a limited number of suppliers offering “conflict free” conflict minerals, we cannot be sure that going forward we will be able to obtain the necessary conflict minerals from such suppliers in sufficient quantities or at competitive prices. Moreover, since the Company’s supply chain structure is complex, management may have difficulty verifying the origin of these materials and if they exist within the Company’s products and, as a result, the Company may be unable to certify that its products are DRC conflict mineral free. Also, we may face reputational challenges if we determine that certain of our products contain minerals not determined to be conflict free or if we are unable to sufficiently verify the origins of all conflict minerals used in our products through the procedures we may implement.
We rely on our credit facilities to provide us with sufficient working capital to operate our business.
Historically, we have relied upon our existing credit facilities to provide us with adequate working capital to operate our business. If our lenders reduce or terminate our access to amounts under our credit facilities, we may not have sufficient capital to fund our working capital needs and/or we may need to secure additional capital or financing to fund our working capital requirements or to repay outstanding debt under our credit facilities. We can make no assurance that we will be successful in ensuring our availability of amounts under our credit facilities or in connection with raising additional capital and that any amount, if raised, will be sufficient to meet our cash flow requirements. If we are not able to maintain our borrowing availability under our credit facilities and/or raise additional capital when needed, we may be forced to sharply curtail our efforts to manufacture and promote the sale of our products or to curtail our operations. Ultimately, we may be forced to cease operations.
Our debt covenants may limit our ability to complete acquisitions, incur debt, make investments, sell assets, merge or complete other significant transactions.
Our credit facilities and certain other of our debt instruments include limitations on a number of our activities, including our ability to:
-
incur additional debt;
-
create liens on our assets or make guarantees;
-
make certain investments or loans;
-
pay dividends; or
-
dispose of or sell assets, make acquisitions above certain amounts or enter into a merger or similar transaction.
15
Our credit facilities also contain a number of financial covenants. The restrictive covenants in our credit facilities may limit our ability to engage in acts that may be in our best long term interests. A breach of any of the restrictive covenants in our credit facilities could result in a default under these facilities. If a default occurs, the lenders under our credit facilities may elect to declare all outstanding borrowings, together with accrued interest, to be immediately due and payable, to terminate any commitments they have to provide further borrowings and to exercise any other rights they have under the facilities or applicable law.
Our shares of common stock are thinly traded and our stock price may be volatile.
Because our common stock is thinly traded, its market price may fluctuate significantly more than the stock market in general or the stock prices of similar companies, which are exchanged, listed or quoted on NASDAQ. We believe there are approximately 4,760,000 shares of our Class A common stock held by non-affiliates as of November 27, 2015. Thus, our common stock will be less liquid than the stock of companies with broader public ownership, and as a result, the trading price for our shares of common stock may be more volatile. Among other things, trading of a relatively small volume of our common stock may have a greater impact on the trading price for our stock than would be the case if our public float were larger.
Our business is susceptible to adverse weather conditions or events.
Our success is in part affected by adverse weather conditions, including fires, floods, tornados, severe cold and other natural disasters. Such events have the tendency to create fluctuations in demand for our products which may impact our borrowing costs, increase our expenses and reduce our profitability. Moreover, our profitability is affected by our ability to successfully manage our inventory levels and demand for our products, which, in part depends upon the efficient operation of our production and delivery systems. These systems are vulnerable to damage or interruption from the aforementioned natural disasters. Such natural disasters could adversely impact our ability to meet delivery requirements of our customers, which may result in our need to incur extra costs to expedite production and delivery of product to meet customer demand. Any of these events could negatively impact our profitability.
ITEM 1A. UNRESOLVED STAFF COMMENTS
Not Applicable
ITEM 2. PROPERTIES
The Company maintains leased and owned manufacturing, warehousing, distribution and office facilities throughout the world. The Company believes that its facilities are well maintained and have capacity adequate to meet its current needs.
See Note 5 to the consolidated financial statements included elsewhere in this report for a discussion of the Company’s lease obligations.
As of October 2, 2015, the Company’s principal manufacturing (identified with an asterisk) and other locations are:
Alpharetta, Georgia (Marine Electronics)
Antibes, France (Diving)
Barcelona, Spain (Diving)
Batam, Indonesia* (Diving and Outdoor Equipment)
Binghamton, New York* (Outdoor Equipment)
16
Brussels, Belgium (Diving)
Burlington, Ontario, Canada (Marine Electronics, Outdoor Equipment, Watercraft)
Casarza Ligure, Italy* (Diving)
Chai Wan, Hong Kong (Diving)
Chatswood, Australia (Diving)
El Cajon, California (Diving)
Eufaula, Alabama* (Marine Electronics)
Little Falls, Minnesota* (Marine Electronics)
Manchester, New Hampshire* (Outdoor Equipment)
Mankato, Minnesota* (Marine Electronics)
Mexicali, Mexico* (Marine Electronics)
Old Town, Maine* (Watercraft)
Wendelstein, Germany (Diving)
Yokahama, Japan (Diving)
Zurich, Switzerland (Diving)
The Company’s corporate headquarters is located in a leased facility in Racine, Wisconsin.
ITEM 3. LEGAL PROCEEDINGS
In the normal course of business, we may be involved in various legal proceedings from time to time. Except as noted below, we are not involved in any litigation involving amounts deemed to be material to the business or financial condition of the Company.
In the Matter of Certain Marine Sonar Imaging Systems, Products Containing the Same and Components Thereof (ITC Investigation No. 337-TA-926).
On July 18, 2014, the Company and Johnson Outdoors Marine Electronics, Inc. filed a complaint with the United States International Trade Commission (“ITC”), Investigation No. 337-TA-926, against Respondents Garmin International Inc., Garmin USA, Inc. and Garmin Corporation (collectively “Garmin”) alleging a violation of Section 337 of the Tariff Act of 1930, as amended, to block the importation of one or more side scan imaging products that are believed to infringe U.S. Patents 7,652,952 (“the ‘952 patent”); 7,710,825 (“the ‘825 patent”); and 7,755,974 (“the ‘974 patent”). The inventions of these asserted patents are used in certain Humminbird® fishfinders.
On July 13, 2015, an Administrative Law Judge (“ALJ”) at the ITC determined that Garmin violated Section 337 of the Tariff Act of 1930, as amended, by importing and selling SideVü sonars, which the judge found infringed the ‘974 patent. The ALJ also found that all three of the asserted patents are valid and enforceable.
On November 18, 2015, the full ITC affirmed the initial determination by the ALJ. The ITC affirmed that all three patents asserted by Johnson Outdoors are valid and enforceable and that numerous models of Garmin’s SideVü sonars directly infringe six Johnson Outdoors patent claims. The ITC also issued a limited exclusion order barring Garmin’s infringing SideVü sonar systems and components thereof which are manufactured overseas from import into the United States and a cease and desist order prohibiting Garmin from selling or distributing any infringing product or component thereof from its inventory. The orders will go into effect pending the mandatory review by the U.S. Trade Representative.
Johnson Outdoors Inc. and Johnson Outdoors Marine Electronics, Inc. v. Garmin International Inc. and Garmin USA, Inc. (Civil Action No.: 2:14-cv-683).
On July 1, 2014, the Company and Johnson Outdoors Marine Electronics, Inc. filed a parallel patent infringement lawsuit (similar in nature to the ITC proceeding noted above) against Garmin in the United States District Court for the Middle District of Alabama, Northern Division, Civil Action No.: 2:14-cv-683. This lawsuit has been stayed by the District Court pending a final resolution of the above ITC proceeding.
ITEM 4. MINE SAFETY DISCLOSURES
None.
17
PART II
ITEM 5. MARKET FOR REGISTRANT’S COMMON EQUITY, RELATED STOCKHOLDER MATTERS AND ISSUER PURCHASES OF EQUITY SECURITIES
Market Information
Certain information with respect to this item is included in Notes 9 and 10 to the Company's consolidated financial statements included elsewhere in this report. The Company’s Class A common stock is traded on the NASDAQ Global MarketSM under the symbol: JOUT. There is no public market for the Company’s Class B common stock. However, the Class B common stock is convertible at all times at the option of the holder into shares of Class A common stock on a share for share basis. As of November 27, 2015, the Company had 641 holders of record of its Class A common stock and 27 holders of record of its Class B common stock. We believe the number of beneficial owners of our Class A common stock on that date was substantially greater.
A summary of the high and low closing prices for the Company’s Class A common stock during each quarter of the years ended October 2, 2015, October 3, 2014 and September 27, 2013 is as follows:
|
First Quarter
|
Second Quarter
|
Third Quarter
|
Fourth Quarter
|
|||||||||||||||||||||||||||||||||||||||||||||
|
2015
|
2014
|
2013
|
2015
|
2014
|
2013
|
2015
|
2014
|
2013
|
2015
|
2014
|
2013
|
|||||||||||||||||||||||||||||||||||||
|
Stock prices:
|
||||||||||||||||||||||||||||||||||||||||||||||||
|
High
|
$ | 31.74 | $ | 28.70 | $ | 21.75 | $ | 34.66 | $ | 28.37 | $ | 23.84 | $ | 34.86 | $ | 26.36 | $ | 25.03 | $ | 26.95 | $ | 27.10 | $ | 27.03 | ||||||||||||||||||||||||
|
Low
|
25.60 | 25.26 | 18.63 | 28.35 | 21.57 | 19.92 | 20.43 | 19.82 | 22.43 | 20.50 | 22.47 | 24.75 | ||||||||||||||||||||||||||||||||||||
Dividends
The Company’s Articles of Incorporation provide that no dividend, other than a dividend payable in shares of the Company’s common stock, may be declared or paid upon the Class B common stock unless such dividend is declared or paid upon both classes of common stock. Whenever a dividend (other than a dividend payable in shares of Company common stock) is declared or paid upon any shares of Class B common stock, at the same time there must be declared and paid a dividend on the shares of Class A common stock equal in value to 110% of the amount per share of the dividend declared and paid on the shares of Class B common stock. Whenever a dividend is payable in shares of Company common stock, such dividend must be declared or paid at the same rate on the Class A common stock and the Class B common stock.
Pursuant to the Company’s revolving credit agreement dated September 16, 2013, the Company is limited in the amount of restricted payments (primarily dividends and repurchases of common stock) made during each fiscal year. The Company may declare, and pay, dividends in accordance with historical practices, but in no event may the aggregate amount of all dividends or repurchases of common stock exceed $10 million in any fiscal year.
Quarterly dividends were $0.075 per share of Class A common stock and $0.068 per share of Class B common stock for each of the first three quarters of 2015. Beginning with the dividend declared on October 1, 2015, the Company increased the dividend to $0.08 per share of Class A common stock and $0.073 per share of Class B common stock. Total dividends declared in 2015 were $3,016. Cash dividends paid in 2015 totaled $2,966 and dividends payable of $790 was included in current liabilities at October 2, 2015.
While the Board of Directors of the Company presently intends to continue the payment of regular quarterly cash dividends on the Company’s common stock, they monitor and evaluate the Company’s dividend practice quarterly and may elect to increase, decrease or not pay a dividend at any time. The Company’s ability to pay dividends could be affected by future business performance, liquidity, capital needs, alternative investment opportunities and debt covenants in its loan agreements.
18
Total Shareholder Return
The graph below compares on a market cap weighted cumulative basis the yearly percentage change since October 1, 2010 in the total return (assuming reinvestment of dividends) to shareholders on the Class A common stock with (a) the total return (assuming reinvestment of dividends) on The NASDAQ Stock Market-U.S. Index; (b) the total return (assuming reinvestment of dividends) on the Russell 2000 Index; and (c) the total return (assuming reinvestment of dividends) on a self-constructed peer group index. The Company’s new peer group consists of Arctic Cat Inc., Black Diamond Inc., Brunswick Corporation, Callaway Golf Company, Escalade Inc., Garmin Ltd., Jarden Corp., Marine Products Corporation, and Nautilus, Inc.; Quiksilver Inc. has been removed. The graph assumes $100 was invested on October 1, 2010 in the Company’s Class A common stock, The NASDAQ Stock Market-U.S. Index, the Russell 2000 Index and the peer group index.
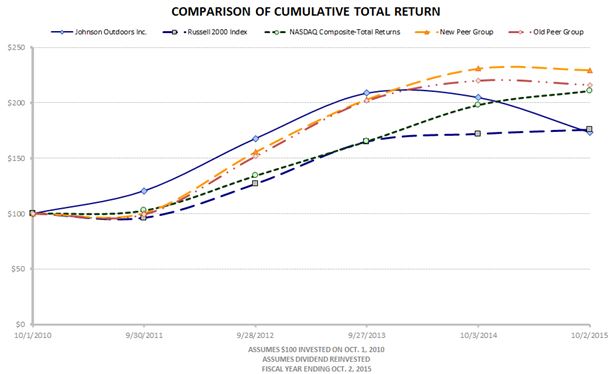
* $100 invested on October 1, 2010 in stock or index, including reinvestment of dividends.
Indexes calculated on a mid-month basis.
|
10/1/2010
|
9/30/2011
|
9/28/2012
|
9/27/2013
|
10/3/2014
|
10/2/2015
|
|||||||||||||||||||
|
Johnson Outdoors Inc.
|
$ | 100.0 | $ | 120.6 | $ | 167.8 | $ | 208.6 | $ | 204.8 | $ | 173.3 | ||||||||||||
|
NASDAQ Composite
|
100.0 | 102.9 | 134.8 | 165.3 | 198.1 | 210.7 | ||||||||||||||||||
|
Russell 2000 Index
|
100.0 | 96.0 | 126.7 | 164.8 | 171.8 | 175.5 | ||||||||||||||||||
|
New Peer Group
|
100.0 | 100.5 | 155.7 | 203.2 | 230.9 | 229.6 | ||||||||||||||||||
|
Old Peer Group
|
100.0 | 99.2 | 151.7 | 202.0 | 220.0 | 216.1 | ||||||||||||||||||
The information in this section titled “Total Shareholder Return” shall not be deemed to be “soliciting material” or “filed” with the Securities and Exchange Commission or subject to Regulation 14A or 14C promulgated by the Securities and Exchange Commission or subject to the liabilities of section 18 of the Securities Exchange Act of 1934, as amended, and this information shall not be deemed to be incorporated by reference into any filing under the Securities Act of 1933, as amended, or the Securities Exchange Act of 1934, as amended.
19
ITEM 6. SELECTED FINANCIAL DATA
The following table presents selected consolidated financial data, which should be read along with the Company’s consolidated financial statements and the notes to those statements and with “Item 7 – Management’s Discussion and Analysis of Financial Condition and Results of Operations” included in or referred to elsewhere in this report. The operating results for the years ended October 2, 2015, October 3, 2014 and September 27, 2013 and the balance sheet data as of October 2, 2015 and October 3, 2014, are derived from the Company’s audited consolidated financial statements included elsewhere herein. The operating results for the years ended September 28, 2012 and September 30, 2011, and the balance sheet data as of September 27, 2013, September 28, 2012 and September 30, 2011 are derived from the Company’s audited consolidated financial statements which are not included in this report. The historical results are not necessarily indicative of results to be expected for future periods.
|
October 2
|
October 3
|
September 27
|
September 28
|
September 30
|
||||||||||||||||
|
(thousands, except per share data)
|
2015
|
2014
|
2013
|
2012
|
2011
|
|||||||||||||||
|
OPERATING RESULTS
|
||||||||||||||||||||
|
Net sales
|
$ | 430,489 | $ | 425,410 | $ | 426,461 | $ | 412,292 | $ | 407,422 | ||||||||||
|
Gross profit
|
171,733 | 168,613 | 171,049 | 164,322 | 163,135 | |||||||||||||||
|
Impairment losses
|
- | 8,475 | - | - | - | |||||||||||||||
|
Litigation settlement
|
- | - | - | (3,500 | ) | - | ||||||||||||||
|
Operating expenses
|
153,880 | 143,447 | 145,458 | 146,409 | 145,465 | |||||||||||||||
|
Operating profit
|
17,853 | 16,691 | 25,591 | 21,413 | 17,670 | |||||||||||||||
|
Interest expense
|
865 | 788 | 1,285 | 2,258 | 3,220 | |||||||||||||||
|
Other expense (income), net
|
1,235 | (1,519 | ) | (354 | ) | (771 | ) | 2,200 | ||||||||||||
|
Income before income taxes
|
15,753 | 17,422 | 24,660 | 19,926 | 12,250 | |||||||||||||||
|
Income tax expense (benefit)
|
5,137 | 8,299 | 5,333 | 9,792 | (20,394 | ) | ||||||||||||||
|
Net income
|
$ | 10,616 | $ | 9,123 | $ | 19,327 | $ | 10,134 | $ | 32,644 | ||||||||||
|
Weighted average common shares - Dilutive
|
9,727 | 9,635 | 9,523 | 9,379 | 9,287 | |||||||||||||||
|
Net income per common share - Diluted:
|
||||||||||||||||||||
|
Class A
|
$ | 1.06 | $ | 0.90 | $ | 1.95 | $ | 1.03 | $ | 3.36 | ||||||||||
|
Class B
|
1.06 | 0.90 | 1.95 | 1.03 | 3.36 | |||||||||||||||
|
Dividends declared, per common share*:
|
||||||||||||||||||||
|
Class A
|
$ | 0.31 | $ | 0.38 | $ | - | $ | - | $ | - | ||||||||||
|
Class B
|
0.28 | 0.34 | - | - | - | |||||||||||||||
|
* There were five quarterly dividends declared in fiscal 2014 and four quarterly dividends declared in fiscal 2015.
|
||||||||||||||||||||
|
October 2
|
October 3
|
September 27
|
September 28
|
September 30
|
||||||||||||||||
|
(thousands, except per share data)
|
2015
|
2014
|
2013
|
2012
|
2011
|
|||||||||||||||
|
BALANCE SHEET DATA
|
||||||||||||||||||||
|
Current assets
|
$ | 209,370 | $ | 197,550 | $ | 188,572 | $ | 182,952 | $ | 176,445 | ||||||||||
|
Total assets
|
299,204 | 288,626 | 288,350 | 263,632 | 259,356 | |||||||||||||||
|
Current liabilities
|
69,554 | 60,232 | 63,372 | 58,967 | 65,000 | |||||||||||||||
|
Long-term debt, less current maturities
|
7,062 | 7,431 | 7,794 | 8,334 | 11,478 | |||||||||||||||
|
Total debt
|
7,430 | 7,791 | 8,333 | 8,860 | 14,972 | |||||||||||||||
|
Shareholders' equity
|
197,968 | 198,458 | 197,668 | 173,604 | 163,525 | |||||||||||||||
20
ITEM 7. MANAGEMENT’S DISCUSSION AND ANALYSIS OF FINANCIAL CONDITION AND RESULTS OF OPERATIONS
Unless otherwise stated, all monetary amounts in this Management’s Discussion and Analysis of Financial Condition and Results of Operations, other than per share amounts, are stated in thousands.
Executive Overview
The Company designs, manufactures and markets high quality recreational products for the outdoor enthusiast. Through a combination of innovative products, strong marketing, a talented and passionate workforce and efficient distribution, the Company seeks to set itself apart from the competition. Its subsidiaries operate as a network that promotes innovation and leverages best practices and synergies, following the strategic vision set by executive management and approved by the Company’s Board of Directors.
Highlights
Despite a 2.5% unfavorable impact of foreign currency exchange on our net sales, the Company’s fiscal 2015 revenues increased by 1% versus the prior year driven largely by strong new product performance. Operating profit grew 7% in the current year compared to last year and was impacted by the increase in sales volume as well as higher gross margins on sold products. One time charges in fiscal 2014 of $6,875 ($8,475 of impairment charges related to certain intangible assets in the Outdoor Equipment segment, net of $1,600 of cash recoveries from the Jetboil indemnity escrow) were more than offset by non-recurring legal fees in the current year of $7,333 related to litigation brought by the Company against a competitor relating to infringement of its patented side scan sonar technology. See “Item 3 – Legal Proceedings” included in or referred to elsewhere in this report for additional information on this litigation.
Results of Operations
Summary consolidated financial results from continuing operations for the fiscal years presented were as follows:
|
(thousands, except per share data)
|
2015
|
2014
|
2013
|
|||||||||
|
Net sales
|
$ | 430,489 | $ | 425,410 | $ | 426,461 | ||||||
|
Gross profit
|
171,733 | 168,613 | 171,049 | |||||||||
|
Operating expenses
|
153,880 | 151,922 | 145,458 | |||||||||
|
Operating profit
|
17,853 | 16,691 | 25,591 | |||||||||
|
Interest expense
|
865 | 788 | 1,285 | |||||||||
|
Other expense (income), net
|
1,235 | (1,519 | ) | (354 | ) | |||||||
|
Income tax expense
|
5,137 | 8,299 | 5,333 | |||||||||
|
Net income
|
10,616 | 9,123 | 19,327 | |||||||||
The Company’s internal and external sales and operating profit (loss) by business segment for each of the three most recent completed fiscal years were as follows:
|
2015
|
2014
|
2013
|
||||||||||
|
Net sales
|
||||||||||||
|
Marine Electronics
|
$ | 262,518 | $ | 249,561 | $ | 247,744 | ||||||
|
Outdoor Equipment
|
47,573 | 47,443 | 44,223 | |||||||||
|
Watercraft
|
48,961 | 49,492 | 50,858 | |||||||||
|
Diving
|
72,125 | 79,559 | 84,536 | |||||||||
|
Other / Eliminations
|
(688 | ) | (645 | ) | (900 | ) | ||||||
| $ | 430,489 | $ | 425,410 | $ | 426,461 | |||||||
| 2015 | 2014 | 2013 | ||||||||||
|
Operation profit (loss):
|
||||||||||||
|
Marine Electronics
|
$ | 26,055 | $ | 30,722 | $ | 32,172 | ||||||
|
Outdoor Equipment
|
3,847 | (3,726 | ) | 2,180 | ||||||||
|
Watercraft
|
1,620 | 210 | (2,116 | ) | ||||||||
|
Diving
|
934 | 3,596 | 5,694 | |||||||||
|
Other / Eliminations
|
(14,603 | ) | (14,111 | ) | (12,339 | ) | ||||||
| 17,853 | $ | 16,691 | $ | 25,591 | ||||||||
21
See Note 12 to the Consolidated Financial Statements included elsewhere in this report for the definition of segment net sales and operating profit.
Fiscal 2015 vs. Fiscal 2014
Net Sales
Net sales in 2015 increased by 1% to $430,489 compared to $425,410 in 2014. Strong demand for new products overcame a 2.5% unfavorable impact from foreign currency exchange on the current year’s sales levels.
Net sales for the Marine Electronics business increased by $12,957, or 5% during 2015. The increase from fiscal 2014 was driven primarily by exceptional new product performance in the Minn Kota product line, particularly with regard to the new Ulterra automatic stow and deploy trolling motor.
Outdoor Equipment net sales increased $130, less than 1%, in 2015 over their levels in 2014. A significant increase in sales of Jetboil products was nearly offset by declines in sales of tents year over year.
The Watercraft business experienced a decrease in net sales of $531, or 1%, due primarily to the decision to exit certain unprofitable international markets.
Net sales for the Diving business declined $7,434, or 9%, year over year, due primarily to a 9% unfavorable impact of foreign currency exchange.
Cost of Sales
Cost of sales was $258,756, or 60.1% of net sales, on a consolidated basis for the year ended October 2, 2015 compared to $256,797 or 60.4% of net sales, in the prior year. Costs of raw materials and components increased only slightly over the prior year while modest increases in labor rates were nearly offset by process improvements in each of the business segments.
Gross Profit
Gross profit of $171,733 was 39.9% of net sales on a consolidated basis for the year ended October 2, 2015 compared to $168,613 or 39.6% of net sales in the prior year.
Gross profit in the Marine Electronics business increased by $7,076 from the prior year due primarily to the 5% increase in net sales.
Outdoor Equipment gross profit increased by $379 from 2014 due primarily to a favorable sales mix with the increase in sales of Jetboil products.
22
Gross profit in the Watercraft segment was $738 higher than 2014 levels due primarily to a more favorable sales mix occurring during 2015 as a result of the segment’s de-emphasis on selling low-margin products and selling in low-margin markets.
The 9% decrease in net sales in the Diving segment noted above was the primary driver of a $5,086 decrease in gross profit of that segment. Foreign currency exchange had a $1,700 unfavorable impact on Diving’s gross profit year over year.
Operating Expenses
Operating expenses overall increased from the prior year by $1,958. The increase was driven primarily by higher sales volume related expenses. Non-recurring legal costs related to patent litigation described elsewhere herein recognized in the current year offset the $6,875 net effect of impairment charges on Jetboil intangible assets and the cash recovery from the Jetboil indemnity escrow, recognized in 2014.
Operating expenses for the Marine Electronics segment increased by $11,743 from fiscal 2014 levels. The increase was due mainly to approximately $7,300 of patent litigation costs incurred in the current year as well as higher sales volume related costs.
Outdoor Equipment operating expenses decreased by $7,195 from the prior year due primarily to $8,475 of impairment charges recognized in fiscal 2014 on Jetboil intangible assets, which was partially offset by a $1,600 cash recovery from the Jetboil indemnity claim in that same year.
In the Watercraft segment, operating expenses decreased $673 from their levels in fiscal 2014 due primarily to lower operating costs as a result of our decision to exit certain unprofitable international markets.
Operating expenses for the Diving business decreased by $2,425 year over year due primarily to cost containment efforts in light of lower sales volumes in this segment.
Operating Results
The Company’s operating profit was $17,853 in fiscal 2015 compared to an operating profit of $16,691 in fiscal 2014. Marine Electronics operating profit decreased by $4,667 to $26,055 from $30,722 in the prior year due primarily to $7,300 of patent litigation costs incurred in the current year. Excluding the effect of these charges, operating profit for this segment would have been $2,666 higher than in the prior year. The operating profit for Outdoor Equipment was $3,847 compared to an operating loss of $3,726 in the prior year due primarily to the Jetboil impairment charges noted above. Excluding the effect of these charges, operating profit for this segment would have been $698 higher than in the prior year. Operating profit for the Watercraft business increased by $1,410 in fiscal 2015. Operating profit for the Diving business declined $2,662 from fiscal 2014 to $934 in fiscal 2015.
Other Income and Expenses
Interest expense of $865 increased from the prior year by $77. Interest income was less than $100 in both years. Net other expense of $1,299 in fiscal 2015 compared to other income of $1,434 in fiscal 2014. The current year other expense included currency losses of $1,196 and market losses, net of dividend income, of $106 on deferred compensation plan assets. In the prior year, other income included $427 of currency gains as well as $965 of market gains and dividends on the deferred compensation plan assets. The dividends and market gains and losses on deferred compensation plan assets recognized in the Consolidated Statement of Operations in “Other expense (income), net” are offset as deferred compensation expense in “Operating expenses.”
Pretax Income and Income Taxes
The Company realized pretax income of $15,753 in fiscal 2015 compared to $17,422 in fiscal 2014. The Company recorded income tax expense of $5,137 in 2015, which equated to an effective tax rate of 32.6%, compared to $8,299 in 2014, which equated to an effective tax rate of 47.6%. The fiscal 2014 tax expense reflects the impact of impairment charges against goodwill which is discussed in Note 17 to the consolidated financial statements included elsewhere in this report.
23
Net Income
The Company recognized net income of $10,616, or $1.06 per diluted common share, in fiscal 2015 compared to $9,123, or $0.90 per diluted common share, in fiscal 2014 based on the factors discussed above.
Fiscal 2014 vs. Fiscal 2013
Net Sales
Net sales in fiscal 2014 decreased by less than one half of one percent to $425,410 compared to $426,461 in 2013. While the first half of 2014 lagged 2013 by 7%, due in large part to extreme cold weather conditions across much of North America, the second half of 2014 increased by 7% as the weather improved and the Company saw strong demand for its new products across most of its businesses.
Net sales for the Marine Electronics business increased by $1,817, or 1% during 2014. The uptick from fiscal 2013 was driven primarily by exceptional new product performance in the latter part of the fiscal year and growth in the Minn Kota product line.
Outdoor Equipment net sales increased $3,220, or 7%, in fiscal 2014 as a result of a full twelve months of sales for Jetboil versus 10.5 months in the prior year as well as a 14% increase in military tent sales year over year.
The Watercraft business experienced a decrease in net sales of 3% during 2014 over 2013 levels, due primarily to our decision to exit unprofitable international markets.
Net sales for the Diving business declined $4,977, or 6%, year over year, due primarily to delays in new product shipments and weak diving markets in our key regions.
Cost of Sales
Cost of sales was $256,797, or 60.4% of net sales, on a consolidated basis for the year ended October 3, 2014 compared to $255,412 or 59.9% of net sales, in fiscal 2013. With the exception of resin prices in the Watercraft segment, costs of raw materials and components increased only slightly in 2014 over the prior year while modest increases in labor rates were nearly offset by process improvements in each of the business segments.
Gross Profit
Gross profit of $168,613 was 39.6% of net sales on a consolidated basis for the year ended October 3, 2014 compared to $171,049 or 40.1% of net sales in fiscal 2013.
Gross profit in the Marine Electronics business decreased by $262 during 2014 from the prior year despite the 1% increase in net sales due primarily to new pricing strategies which were implemented to enhance the Company’s competitive position.
Outdoor Equipment gross profit increased by $1,464 during 2014 from 2013 due primarily to the increase in sales volume and improved efficiencies particularly related to the integration of Jetboil.
Gross profit in the Watercraft segment was $101 lower in 2014 than in 2013 due primarily to the increase in resin prices and lower sales volumes, which were nearly offset by a favorable sales mix due to the segment’s de-emphasis on low-margin products.
The $3,592 decrease in gross profit of the Diving segment from 2013 to 2014 was driven primarily by the 6% reduction in sales volume in 2014 as compared to 2013 as noted above.
Operating Expenses
Operating expenses during 2014 overall increased from the prior year by $6,464. The increase was significantly driven by the $8,475 impairment charge related to Jetboil intangible assets as well as higher health care costs, offset in part by a $1,600 cash recovery from the Jetboil indemnity escrow, lower restructuring charges in the Watercraft segment and lower incentive compensation expense.
24
Operating expenses for the Marine Electronics segment increased by $1,188 during 2014 from 2013 levels. The increase was due mainly to higher sales volume related costs and higher professional services expense in the current year.
Outdoor Equipment operating expenses increased by $7,371 in 2014 from the prior year due primarily to $8,475 of impairment charges recognized during 2014 on Jetboil intangible assets, which was partially offset by a $1,600 cash recovery from the Jetboil indemnity claim. See further discussion of the valuation of the Jetboil intangible assets at Note 17 to our accompanying consolidated financial statements included elsewhere herein.
In the Watercraft segment, operating expenses decreased $2,427 during 2014 from fiscal 2013 due primarily to lower restructuring costs related to our decision to exit unprofitable international markets and lower infrastructure costs resulting from those efforts.
Operating expenses for the Diving business decreased by $1,494, or 4%, year over year due primarily to cost containment efforts in light of lower sales volumes.
Operating Results
The Company’s operating profit was $16,691 in 2014 compared to an operating profit of $25,591 in fiscal 2013. Marine Electronics operating profit decreased by $1,450 during 2014 to $30,722 from $32,172 in the prior year. The operating loss for Outdoor Equipment was $3,726 during 2014 compared to operating profit of $2,180 in the prior year due primarily to $6,875 of impairment charges on certain Jetboil intangible assets incurred during 2014, net of indemnity escrow recoveries during 2014 related to the acquisition, which were all recognized in the third quarter of 2014. Excluding the effect of these charges, operating profit for this segment would have been $969 higher in 2014 than in fiscal 2013. Despite a slight decline in net sales year over year, operating results for the Watercraft business increased by $2,326 to a profit of $210 in fiscal 2014. Operating profit for the Diving business declined $2,098 from fiscal 2013 to $3,596 in fiscal 2014.
Other Income and Expenses
Interest expense of $788 during 2014 decreased from the prior year by $497, due largely to lower interest rates and lower principal balances. Interest income was approximately $100 in both 2014 and 2013. Net other income of $1,434 in fiscal 2014 increased from fiscal 2013 by $1,171. Other income during 2014 included currency gains of $427 and market gains and dividends of $965 on deferred compensation plan assets. In 2013, this line item included $929 of currency losses which were more than offset by market gains and dividends of $1,265 on the deferred compensation plan assets. The dividends and market gains and losses on deferred compensation plan assets recognized in the accompanying Consolidated Statement of Operations in Other (income) expense, net are offset as deferred compensation expense in our Operating expenses.
Pretax Income and Income Taxes
The Company realized pretax income of $17,422 in fiscal 2014 compared to $24,660 in fiscal 2013. The Company recorded income tax expense of $8,299 in 2014, which equated to an effective tax rate of 47.6%, compared to $5,333 in 2013, which equated to an effective tax rate of 21.6%. The 2013 tax expense reflects the net reduction of the Company’s deferred tax asset valuation allowance. See further discussion of the deferred tax asset valuation allowance in Note 6 to the Consolidated Financial Statements found elsewhere in this report.
Net Income
The Company recognized net income of $9,123, or $0.90 per diluted common share in fiscal 2014 compared to $19,327 in fiscal 2013, or $1.95 per diluted common share, based on the factors discussed above.
Financial Condition, Liquidity and Capital Resources
The Company’s cash flows from operating, investing and financing activities, as reflected in the accompanying Consolidated Statements of Cash Flows, are summarized in the following table:
|
Year Ended
|
||||||||||||
|
(thousands)
|
October 2
2015
|
October 3
2014
|
September 27
2013
|
|||||||||
|
Cash provided by (used for):
|
|
|||||||||||
|
Operating activities
|
$ | 18,056 | $ | 33,218 | $ | 30,003 | ||||||
|
Investing activities
|
(10,394 | ) | (11,887 | ) | (31,753 | ) | ||||||
|
Financing activities
|
(3,989 | ) | (3,498 | ) | (1,041 | ) | ||||||
|
Effect of foreign currency rate changes on cash
|
(5,307 | ) | (2,734 | ) | (419 | ) | ||||||
|
(Decrease) Increase in cash and cash equivalents
|
$ | (1,634 | ) | $ | 15,099 | $ | (3,210 | ) | ||||
25
Operating Activities
The following table sets forth the Company’s working capital position at the end of each of the years shown:
|
October 2
|
October 3
|
|||||||
|
(thousands, except share data)
|
2015
|
2014
|
||||||
|
Current assets
|
$ | 209,370 | $ | 197,550 | ||||
|
Current liabilities
|
69,554 | 60,232 | ||||||
|
Working capital
|
$ | 139,816 | 137,318 | |||||
|
Current ratio
|
3:1
|
3.3:1
|
||||||
Cash flows provided by operations totaled $18,056, $33,218 and $30,003 in fiscal 2015, 2014 and 2013, respectively. The decrease in operating cash flow over the prior year was driven largely by net changes in operating assets. Additionally, the change in cash flows provided by operations year over year was significantly impacted by the nature of non-recurring expenses in each year. Current year net income was impacted by the effect of $7,300 of cash charges related to litigation expense. In the prior year, net income was impacted by $8,475 of non-recurring, non-cash impairment expense recognized on certain Jetboil intangible assets.
Depreciation and amortization charges were $11,824, $10,863 and $10,070 in fiscal 2015, 2014 and 2013, respectively.
Investing Activities
Cash flows used for investing activities were $10,394, $11,887 and $31,753 in fiscal 2015, 2014 and 2013, respectively. The purchase of Jetboil in fiscal 2013 used cash of $15,420. Expenditures for property, plant and equipment were $10,409, $13,263 and $16,333 in fiscal 2015, 2014 and 2013, respectively. In general, the Company’s ongoing capital expenditures are primarily related to tooling for new products and facilities and information systems improvements.
Financing Activities
The following table sets forth the Company’s debt and capital structure at the end of the past two fiscal years:
|
(thousands, except share data)
|
2015
|
2014
|
||||||
|
Current debt
|
$ | 368 | $ | 360 | ||||
|
Long-term debt
|
7,062 | 7,431 | ||||||
|
Total debt
|
7,430 | 7,791 | ||||||
|
Shareholders' equity
|
198,378 | 198,458 | ||||||
|
Total capitalization
|
$ | 205,808 | 206,249 | |||||
|
Total debt to total capitalization
|
4 | % | 4 | % | ||||
26
Cash flows used for financing activities totaled $3,989 in fiscal 2015 compared to $3,498 in 2014 and $1,041 in 2013. Dividend payments were $2,966, $2,955 and $0 in 2015, 2014 and 2013, respectively. Payments on long-term debt were $360, $542 and $528 in fiscal 2015, 2014 and 2013, respectively. The Company had current maturities of its long-term debt of $368 and $360 as of October 2, 2015 and October 3, 2014, respectively, and no outstanding borrowings on its revolving credit facilities as of the end of either fiscal year. The Company had outstanding borrowings on long-term debt (net of current maturities) of $7,062 and $7,431 as of October 2, 2015 and October 3, 2014, respectively.
The Company’s term loans have a maturity date of September 29, 2029. Each term loan requires monthly payments of principal and interest. Interest on the aggregate outstanding amount of the term loans is based on the prime rate plus an applicable margin. The interest rate in effect on the term loans was 5.25% at October 2, 2015 and October 3, 2014.
The term loans are guaranteed in part under the United States Department of Agriculture Rural Development program and are secured with a first priority lien on land, buildings, machinery and equipment of the Company’s domestic subsidiaries and a second lien on working capital and certain patents and trademarks of the Company and its subsidiaries. Any proceeds from the sale of secured property are first applied against the related term loans and then against the Revolvers (as defined below).
The aggregate term loan borrowings are subject to a pre-payment penalty. The penalty is currently 4% of the pre-payment amount, and the penalty will decrease by 1% annually on the anniversary date of the effective date of the loan agreement.
On September 16, 2013, the Company and certain of its subsidiaries entered into a new credit facility with PNC Bank National Association and certain other lenders which terminated the Amended Revolving Credit and Security agreement with PNC Bank National Association and the other lenders named therein, dated as of November 16, 2010. The new credit facility consists of a Revolving Credit Agreement dated September 16, 2013 among the Company, certain of the Company’s subsidiaries, PNC Bank, National Association, as lender and as administrative agent and the other lenders named therein (the “Revolving Credit Agreement” or “Revolver”). The Revolver has a 60 month term and provides for borrowing of up to an aggregate principal amount not to exceed $90,000 with an accordion feature that gives the Company the option to increase the maximum seasonal financing availability subject to the conditions of the Revolving Credit Agreement and subject to the approval of the lenders. The Revolver imposes a seasonal borrowing limit such that borrowings under the facility may not exceed $60,000 from the period June 30th through October 31st of each year under the agreement.
The interest rate on the Revolver is based on LIBOR plus an applicable margin. The applicable margin resets each quarter and ranges from 1.25% to 2.00% and is dependent on the Company’s leverage ratio for the trailing twelve month period. The interest rate on the Revolver at October 2, 2015 and October 3, 2014 was approximately 1.4%.
The Revolver is secured with a first priority lien on working capital assets and certain patents and trademarks of the Company and its subsidiaries and a second priority lien on land, buildings, machinery and equipment of the Company’s domestic subsidiaries. The Revolving Credit Agreement limits asset or stock acquisitions to no more than $20,000 in the event that the Company’s consolidated leverage ratio is greater than 2.5 times. No limits are imposed if the Company’s consolidated leverage ratio is less than 2.5 times and the remaining borrowing availability under the Revolver is greater than $10,000 at the time of the acquisition. The Revolving Credit Agreement limits the amount of restricted payments (primarily dividends and repurchases of common stock) made during each fiscal year. The Company may declare, and pay, dividends in accordance with historical practices, but in no event may the aggregate amount of all dividends or repurchases of common stock exceed $10,000 in any fiscal year. The Revolving Credit Agreement includes maximum leverage ratio and minimum interest coverage ratio limitations.
Concurrent with the execution of the Revolving Credit Agreement described above, Johnson Outdoors Canada Inc. repaid and terminated its Amended Revolving Credit and Security Agreement with PNC Bank Canada Branch dated as of November 16, 2010.
As of October 2, 2015, the Company held approximately $55,492 of cash and cash equivalents in bank accounts in foreign jurisdictions.
27
Contractual Obligations and Off Balance Sheet Arrangements
The Company has contractual obligations and commitments to make future payments under its existing credit facilities, including interest, operating leases and open purchase orders. The following schedule details these significant contractual obligations at October 2, 2015.
|
Total
|
Less than 1 year
|
2-3 years
|
4-5 years
|
After 5 years
|
||||||||||||||||
|
Long-term debt
|
$ | 7,430 | $ | 368 | $ | 799 | $ | 887 | $ | 5,376 | ||||||||||
|
Operating lease obligations
|
27,858 | 5,868 | 8,204 | 7,104 | 6,682 | |||||||||||||||
|
Open purchase orders
|
72,014 | 72,014 | - | - | - | |||||||||||||||
|
Contractually obligated interest payments
|
3,654 | 382 | 702 | 615 | 1,955 | |||||||||||||||
|
Total contractual obligations
|
$ | 110,956 | $ | 78,632 | $ | 9,705 | $ | 8,606 | $ | 14,013 | ||||||||||
The Company utilizes letters of credit primarily as security for the payment of future claims under its workers’ compensation insurance. Letters of credit outstanding at October 2, 2015 were $684 compared to $691 on October 3, 2014 and were included in the Company’s total loan availability. The Company had no unsecured revolving credit facilities at its foreign subsidiaries as of October 2, 2015 or October 3, 2014.
The Company has no other off-balance sheet arrangements.
The Company anticipates making contributions to its defined benefit pension plans of $476 through September 30, 2016.
Market Risk Management
Foreign Exchange Risk
The Company has significant foreign operations, for which the functional currencies are denominated primarily in euros, Swiss francs, Hong Kong dollars, Japanese yen and Canadian dollars. As the values of the currencies of the foreign countries in which the Company has operations increase or decrease relative to the U.S. dollar, the sales, expenses, profits, losses, assets and liabilities of the Company’s foreign operations, as reported in the Company’s consolidated financial statements, increase or decrease, accordingly. Approximately 18% of the Company’s revenues for the fiscal year ended October 2, 2015 were denominated in currencies other than the U.S. dollar. Approximately 8% were denominated in euros and approximately 6% were denominated in Canadian dollars, with the remaining 4% denominated in various other foreign currencies. Changes in foreign currency exchange rates can cause unexpected financial losses or cash flow needs.
The Company may mitigate the impact on its operating results of a portion of the fluctuations in certain foreign currencies through the use of foreign currency forward contracts. Foreign currency forward contracts enable the Company to lock in the foreign currency exchange rate for a fixed amount of currency to be paid or received on a specified date in the future. The Company may use such foreign currency forward contracts to mitigate the risk associated with changes in foreign currency exchange rates on financial instruments and known commitments denominated in foreign currencies. As of October 2, 2015 and October 3, 2014, the Company held no foreign currency forward contracts.
Interest Rate Risk
The Company operates in a seasonal business and experiences significant fluctuations in operating cash flow as working capital needs increase in advance of the Company’s primary selling and cash generation season, and decline as accounts receivable are collected and cash is accumulated or debt is repaid. The Company’s goal in managing its interest rate risk is to maintain a mix of floating rate and fixed rate debt such that permanent non-equity capital needs are largely funded with long term fixed rate debt and seasonal working capital needs are funded with short term floating rate debt.
28
Commodities
Certain components used in the Company’s products are exposed to commodity price changes. The Company manages this risk through instruments such as purchase orders and non-cancelable supply contracts. Primary commodity price exposures include costs associated with metals, resins and packaging materials.
Impact of Inflation
The Company anticipates that changing costs of basic raw materials may impact future operating costs and, accordingly, the prices of its products. The Company is involved in continuing programs to mitigate the impact of cost increases through changes in product design and identification of sourcing and manufacturing efficiencies. Price increases and, in certain situations, price decreases are implemented for individual products, when appropriate.
The Company’s results of operations and financial condition are presented based on historical cost. The Company does not believe that inflation has significantly affected its results of operations.
Sensitivity to Changes in Value
The estimates that follow are intended to measure the maximum potential fair value or earnings the Company could lose in one year from adverse changes in market interest rates. The calculations are not intended to represent actual losses in fair value or earnings that the Company expects to incur. The estimates do not consider favorable changes in market rates. The table below presents the estimated maximum potential loss in fair value and annual income before income taxes from a 100 basis point movement in interest rates on the Company's term loans outstanding at October 2, 2015:
|
Estimated Impact on
|
||||||||
|
(thousands)
|
Fair Value
|
Income Before Income Taxes
|
||||||
|
Interest rate instruments
|
$ | - | $ | 79 | ||||
Critical Accounting Estimates
The Company’s management discussion and analysis of its financial condition and results of operations are based upon the Company’s consolidated financial statements, which have been prepared in accordance with accounting principles generally accepted in the U.S. The preparation of these financial statements requires the Company to make estimates and judgments that affect the reported amounts of its assets, liabilities, sales and expenses, and related footnote disclosures. On an on-going basis, the Company evaluates its estimates for product returns, bad debts, inventories, long lived assets and goodwill, income taxes, warranty obligations, pensions and other post-retirement benefits, litigation and other subjective matters impacting the financial statements. The Company bases its estimates on historical experience and on various other assumptions that are believed to be reasonable under the circumstances, the results of which form the basis for making judgments about the carrying values of assets and liabilities that are not readily apparent from other sources. Actual results may differ from these estimates under different assumptions or conditions.
The Company believes the following critical accounting policies affect its more significant judgments and estimates used in the preparation of its consolidated financial statements. Management has discussed these policies with the Audit Committee of the Company’s Board of Directors.
Allowance for Doubtful Accounts
Allowances for doubtful accounts are estimated by the individual operating companies based on estimates of losses related to customer accounts receivable balances. Estimates are developed by using standard quantitative measures based on historical losses, adjusting for current economic conditions and, in some cases, evaluating specific customer accounts for risk of loss. The establishment of reserves requires the use of judgment and assumptions regarding the potential for losses on receivable balances. Though the Company considers these balances adequate and proper, changes in economic conditions in specific markets in which the Company operates and any specific customer collection issues the Company identifies could have a favorable or unfavorable effect on required reserve balances.
29
Inventories
The Company values inventory at the lower of cost (determined using the first-in first-out method) or market. Management’s judgment is required to determine the reserve for obsolete or excess inventory. Inventory on hand may exceed future demand either because the product is outdated or because the amount on hand is more than will be used to meet future needs. Inventory reserves are estimated by the individual operating companies using standard quantitative measures based on criteria established by the Company. The Company also considers current forecast plans, as well as market and industry conditions in establishing reserve levels. Though the Company considers these reserve balances to be adequate, changes in economic conditions, customer inventory levels or competitive conditions could have a favorable or unfavorable effect on required reserve balances.
Deferred Taxes
The Company records a valuation allowance to reduce its deferred tax assets to the amount that is more likely than not to be realized. While the Company has considered future taxable income and ongoing prudent and feasible tax planning strategies in assessing the need for the valuation allowance, in the event the Company were to determine that it would not be able to realize all or part of its net deferred tax assets in the future, an adjustment to the deferred tax assets would be charged to income in the period such determination was made. Likewise, should the Company determine that it would be able to realize its deferred tax assets in the future in excess of its net recorded amount, an adjustment to the deferred tax assets would increase income in the period such determination was made. See further discussion of the impact of the adjustment to the deferred tax asset valuation allowance at Note 6 to the consolidated financial statements included elsewhere in this report.
Goodwill and Other Intangible Assets Impairment
Goodwill and indefinite-lived intangible assets are tested for impairment annually or more frequently if events or changes in circumstances indicate that the assets might be impaired. Generally, annual impairment tests are performed by the Company in the fourth quarter of each fiscal year.
In assessing the recoverability of the Company's goodwill, the Company estimates the fair value of the businesses to which the goodwill relates. Fair value is estimated using a discounted cash flow analysis. If the fair value of a reporting unit exceeds its net book value, no impairment exists. When fair value is less than the carrying value of the net assets and related goodwill, an impairment test is performed to measure and recognize the amount of the impairment loss, if any. The Company recognized goodwill impairment charges of $6,475 in 2014. See further discussion at Note 17 to the consolidated financial statements included elsewhere in this report.
The discounted cash flow analysis used to estimate fair value requires a number of key estimates and assumptions. The Company estimates the future cash flows of the reporting units based on historical and forecasted revenues and operating costs and applies a discount rate to the estimated future cash flows for purposes of the valuation. This discount rate is based on the estimated weighted average cost of capital, which includes certain assumptions made by management such as market capital structure, market betas, the risk-free rate of return and the estimated costs of borrowing. Changes in these key estimates and assumptions, or in other assumptions used in this process, could materially affect our impairment analysis in a given year.
In assessing the recoverability of the Company's other indefinite lived intangible assets, the Company estimates the fair value of the various intangible assets. The fair value of trademarks and patents is estimated using the relief from royalty method. If the fair value of an intangible asset exceeds its net book value, no impairment exists. When fair value is less than the carrying value of the intangible asset, an impairment loss is recognized for the amount of the difference. The Company recognized impairment charges of $2,000 on indefinite lived intangible assets in 2014. See further discussion at Note 17 to the consolidated financial statements included elsewhere in this report.
30
A number of factors, many of which the Company has no ability to control, could affect its financial condition, operating results and business prospects and could cause actual results to differ from the estimates and assumptions that the Company uses in preparing its financial statements. These factors include: a prolonged global economic crisis, a significant decrease in demand for the Company’s products, a significant adverse change in legal factors or in the business climate, an adverse action or assessment by a regulator and successful efforts by the Company’s competitors to gain market share.
Impairment of Long-Lived Assets and Long-Lived Assets to be Disposed of
The Company evaluates long-lived assets for impairment whenever events or changes in circumstances, such as unplanned negative cash flow indicate that the carrying amount of an asset group may not be recoverable. Recoverability of assets to be held and used is measured by a comparison of the carrying amount of an asset group to future undiscounted cash flows expected to be generated by the asset group. If such assets are determined to be impaired, the impairment to be recognized is measured by the amount by which the carrying amount of the assets exceeds the fair value of the assets. Assets to be disposed of are reported at the lower of the carrying amount or fair value less costs to sell. Application of alternative assumptions, such as changes in the estimate of future cash flows, could produce significantly different results. Because of the significance of the judgments and estimation processes, it is likely that materially different amounts could be recorded if we used different assumptions or if the underlying circumstances were to change.
Warranties
The Company accrues a warranty reserve for estimated costs to provide warranty services. Warranty reserves are estimated by the individual operating companies using standard quantitative measures based on criteria established by the Company. Estimates of costs to service its warranty obligations are based on historical experience, expectation of future conditions and known product issues. To the extent the Company experiences increased warranty claim activity or increased costs associated with servicing those claims, revisions to the estimated warranty reserve would be required. The Company engages in product quality programs and processes, including monitoring and evaluating the quality of its suppliers, to help minimize warranty obligations.
ITEM 7A. QUANTITATIVE AND QUALITATIVE DISCLOSURES ABOUT MARKET RISK
Information with respect to this item is included in Management’s Discussion and Analysis of Financial Condition and Results of Operations under the heading “Market Risk Management.”
ITEM 8. FINANCIAL STATEMENTS AND SUPPLEMENTARY DATA
Information with respect to this item is included in the Company’s consolidated financial statements attached to this report on pages F-1 to F-38.
ITEM 9. CHANGES IN AND DISAGREEMENTS WITH ACCOUNTANTS ON ACCOUNTING AND FINANCIAL DISCLOSURE
None.
ITEM 9A. CONTROLS AND PROCEDURES
(a) Evaluation of Disclosure Controls and Procedures
The Company maintains disclosure controls and procedures (as defined in Rules 13a-15(e) and 15d-15(e) under the Securities Exchange Act of 1934) designed to ensure that information required to be disclosed by the Company in the reports that it files or submits under the Securities Exchange Act of 1934 is recorded, processed, summarized and reported within the time periods specified in the Securities and Exchange Commission’s rules and forms, and that the information required to be disclosed by the Company in reports that it files or submits under the Securities Exchange Act of 1934 is accumulated and communicated to its management, including its Chief Executive Officer and Chief Financial Officer, as appropriate to allow timely decisions regarding required disclosure. The Company carried out an evaluation as of October 2, 2015, under the supervision and with the participation of the Company’s management, including its Chief Executive Officer and Chief Financial Officer, of the effectiveness of the design and operation of the Company’s disclosure controls and procedures. Based on such evaluation, the Company’s Chief Executive Officer and Chief Financial Officer concluded that the Company’s disclosure controls and procedures were effective as of October 2, 2015 at reaching a level of reasonable assurance. In designing and evaluating the disclosure controls and procedures, management recognized that any controls and procedures, no matter how well designed and operated, can provide only reasonable assurance of achieving the desired control objectives, and management necessarily was required to apply its judgment in evaluating the cost-benefit relationship of possible controls and procedures. The Company has designed its disclosure controls and procedures to reach a level of reasonable assurance of achieving the desired control objectives.
31
The report of management required under this Item 9A is included on page F-2 of the Company’s Consolidated Financial Statements attached to this Report under the heading “Management’s Report on Internal Control over Financial Reporting” and is incorporated herein by reference.
(b) Changes in Internal Control over Financial Reporting.
There was no change in the Company’s internal control over financial reporting (as defined in Rules 13a-15(f) and 15d-15(f) under the Securities Exchange Act of 1934, as amended) that occurred during the Company’s most recently completed fiscal quarter that has materially affected, or is reasonably likely to materially affect, the Company’s internal control over financial reporting.
(c) Attestation Report of Independent Registered Public Accounting Firm
RSM US LLP, the independent registered public accounting firm who audited the Company’s consolidated financial statements, has issued an attestation report on the Company’s internal control over financial reporting, which is contained in the Company’s consolidated financial statements under the heading “Report of Independent Registered Public Accounting Firm on Internal Control over Financial Reporting.”
ITEM 9B. OTHER INFORMATION
None.
PART III
ITEM 10. DIRECTORS, EXECUTIVE OFFICERS AND CORPORATE GOVERNANCE
Information with respect to this item is incorporated herein by reference to the discussion under the headings “Proposal 1: Election of Directors,” “Executive Officers,” “Section 16(a) Beneficial Ownership Reporting Compliance,” “Corporate Governance-Director Nominations” and “Audit Committee Matters – Audit Committee Financial Expert” in the Company's Proxy Statement for the 2016 Annual Meeting of Shareholders, which will be filed with the Securities and Exchange Commission on or before January 30, 2016. Information regarding the Company’s Code of Business Ethics is incorporated herein by reference to the discussion under “Corporate Governance Matters – Employee Code of Conduct and Code of Ethics and Procedures for Reporting of Accounting Concerns” in the Company's Proxy Statement for the 2016 Annual Meeting of Shareholders, which will be filed with the Securities and Exchange Commission on or before January 30, 2016.
The Audit Committee of the Company's Board of Directors is an “audit committee” for purposes of Section 3(a)(58)(A) of the Securities Exchange Act of 1934. The members of the Audit Committee are Terry E. London (Chairman), Thomas F. Pyle, Jr., Edward F. Lang and Richard (“Casey”) Sheahan.
ITEM 11. EXECUTIVE COMPENSATION
Information with respect to this item is incorporated herein by reference to the discussion under the headings “Directors Compensation” and “Executive Compensation” in the Company’s Proxy Statement for the 2016 Annual Meeting of Shareholders, which will be filed with the Securities and Exchange Commission on or before January 30, 2016.
32
The information incorporated by reference from “Report of the Compensation Committee” in the Company’s Proxy Statement for the 2016 Annual Meeting of Shareholders, which will be filed with the Securities and Exchange Commission on or before January 30, 2016, shall not be deemed “filed” for purposes of Section 18 of the Securities Exchange Act of 1934 nor shall it be deemed incorporated by reference in any filing under the Securities Act of 1933 or the Securities Exchange Act of 1934, except as shall be expressly set forth by specific reference in such filing.
ITEM 12. SECURITY OWNERSHIP OF CERTAIN BENEFICIAL OWNERS AND MANAGEMENT AND RELATED STOCKHOLDER MATTERS
Information with respect to this item is incorporated herein by reference to the discussion under the heading “Stock Ownership of Management and Others” in the Company's Proxy Statement for the 2016 Annual Meeting of Shareholders, which will be filed with the Securities and Exchange Commission on or before January 30, 2016.
Equity Compensation Plan Information
The following table summarizes share information, as of October 2, 2015, for the Company’s equity compensation plans, including the Johnson Outdoors Inc. 2012 Non-Employee Director Stock Ownership Plans, the Johnson Outdoors Inc. 2010 Long-Term Stock Incentive Plan and the Johnson Outdoors Inc. 2009 Employee Stock Purchase Plan. All of these plans have been approved by the Company’s shareholders.
|
Plan Category
|
Number of Common Shares to Be Issued Upon Exercise of Outstanding Options, Warrants and Rights
|
Weighted-average Exercise Price of Outstanding Options, Warrants and Rights
|
Number of Common Shares Available for Future Issuance Under Equity Compensation Plans
|
|||||||||
|
2010 Long-Term Stock Incentive Plan
|
- | $ | - | 659,866 | ||||||||
|
2012 Non-Employee Director Stock Ownership Plan
|
7,336 | - | 25,272 | |||||||||
|
2009 Employee Stock Purchase Plan
|
- | - | 20,135 | |||||||||
|
Total All Plans
|
7,336 | - | 705,273 | |||||||||
ITEM 13. CERTAIN RELATIONSHIPS AND RELATED TRANSACTIONS AND DIRECTOR INDEPENDENCE
Information with respect to this item is incorporated herein by reference to the discussion under the heading “Certain Relationships and Related Transactions” in the Company's Proxy Statement for the 2016 Annual Meeting of Shareholders, which will be filed with the Securities and Exchange Commission on or before January 30, 2016. Information regarding director independence is incorporated by reference to the discussions under “Corporate Governance Matters-Director Independence” in the Company’s Proxy Statement for the 2016 Annual Meeting of Shareholders, which will be filed with the Securities and Exchange Commission on or before January 30, 2016.
ITEM 14. PRINCIPAL ACCOUNTANT FEES AND SERVICES
Information with respect to this item is incorporated herein by reference to the discussion under the heading “Audit Committee Matters – Fees of Independent Registered Public Accounting Firm” in the Company's Proxy Statement for the 2016 Annual Meeting of Shareholders, which will be filed with the Securities and Exchange Commission on or before January 30, 2016.
33
PART IV
ITEM 15. EXHIBITS AND FINANCIAL STATEMENT SCHEDULES
The following documents are filed as a part of this report:
Financial Statements
Included in Item 8 of Part II of this report are the following:
-
Reports of Independent Registered Public Accounting Firm
-
Consolidated Balance Sheets – October 2, 2015 and October 3, 2014
-
Consolidated Statements of Operations – Years ended October 2, 2015, October 3, 2014 and September 27, 2013
-
Consolidated Statements of Comprehensive Income - Years ended October 2, 2015, October 3, 2014 and September 27, 2013
-
Consolidated Statements of Shareholders’ Equity – Years ended October 2, 2015, October 3, 2014 and September 27, 2013
-
Consolidated Statements of Cash Flows – Years ended October 2, 2015, October 3, 2014 and September 27, 2013
-
Notes to Consolidated Financial Statements
Exhibits
See Exhibit Index.
34
SIGNATURES
Pursuant to the requirements of Section 13 or 15(d) of the Securities Exchange Act of 1934, the registrant has duly caused this report to be signed on its behalf by the undersigned, thereunto duly authorized, in the City of Racine and State of Wisconsin, on the 7th day of December 2015.
|
JOHNSON OUTDOORS INC.
(Registrant)
|
|||
|
By
|
/s/ Helen P. Johnson-Leipold
|
||
|
Helen P. Johnson-Leipold
Chairman and Chief Executive Officer
|
|||
Pursuant to the requirements of the Securities Exchange Act of 1934, this report has been signed by the following persons on behalf of the registrant and in the capacities indicated on the 7th day of December 2015.
|
/s/Helen P. Johnson-Leipold
|
Chairman and Chief Executive Officer
|
|
|
(Helen P. Johnson-Leipold)
|
and Director
|
|
|
(Principal Executive Officer)
|
||
|
/s/ Thomas F. Pyle, Jr.
|
Vice Chairman of the Board
|
|
|
(Thomas F. Pyle, Jr.)
|
and Lead Outside Director
|
|
|
/s/ Terry E. London
|
Director
|
|
|
(Terry E. London)
|
||
|
/s/ John M. Fahey, Jr.
|
Director
|
|
|
(John M. Fahey, Jr.)
|
||
|
/s/ W. Lee McCollum
|
Director
|
|
|
(W. Lee McCollum)
|
||
|
/s/ Edward F. Lang
|
Director
|
|
|
(Edward F. Lang)
|
||
|
/s/ Katherine Button Bell
|
Director
|
|
|
(Katherine Button Bell)
|
||
|
/s/ Richard Sheahan
|
Director
|
|
|
(Richard (“Casey”) Sheahan)
|
||
|
/s/ David W. Johnson
|
Vice President and Chief Financial Officer
|
|
|
(David W. Johnson)
|
(Principal Financial and Accounting Officer)
|
35
EXHIBIT INDEX
|
Exhibit
|
Title
|
|
2
|
Agreement and Plan of Merger, dated October 28, 2004, by and between JO Acquisition Corp. and Johnson Outdoors Inc. (Filed as Exhibit 2 to the Company’s Form 8-K dated October 28, 2004 and incorporated herein by reference.)
|
|
3.1
|
Articles of Incorporation of the Company as amended through February 17, 2000. (Filed as Exhibit 3.1(a) to the Company’s Form 10-Q for the quarter ended March 31, 2000 and incorporated herein by reference.)
|
|
3.2
|
Bylaws of the Company as amended and restated through December 6, 2010. (Filed as Exhibit 3.2 to the Company’s Form 10-K for the year ended October 1, 2010 and incorporated herein by reference.)
|
|
4.1
|
Note Agreement dated October 1, 1995. (Filed as Exhibit 4.1 to the Company’s Form 10-Q for the quarter ended December 29, 1995 and incorporated herein by reference.)
|
|
4.2
|
First Amendment dated October 11, 1996 to Note Agreement dated October 1, 1995. (Filed as Exhibit 4.3 to the Company’s Form 10-Q for the quarter ended December 27, 1996 and incorporated herein by reference.)
|
|
4.3
|
Second Amendment dated September 30, 1997 to Note Agreement dated October 1, 1995. (Filed as Exhibit 4.8 to the Company’s Form 10-K for the year ended October 1, 1997 and incorporated herein by reference.)
|
|
4.4
|
Third Amendment dated October 1, 1997 to Note Agreement dated October 1, 1995. (Filed as Exhibit 4.9 to the Company’s Form 10-K for the year ended October 1, 1997 and incorporated herein by reference.)
|
|
4.5
|
Fourth Amendment dated January 10, 2000 to Note Agreement dated October 1, 1995. (Filed as Exhibit 4.9 to the Company’s Form 10-Q for the quarter ended March 31, 2000 and incorporated herein by reference.)
|
|
4.6
|
Fifth Amendment dated December 13, 2001 to Note Agreement dated October 1, 1995. (Filed as Exhibit 4.6 to the Company’s Form 10-K for the year ended October 3, 2003 and incorporated herein by reference.)
|
|
4.7
|
Consent and Amendment dated September 6, 2002 to Note Agreement dated October 1, 1995. (Filed as Exhibit 4.7 to the Company’s Form 10-K for the year ended October 3, 2003 and incorporated herein by reference.)
|
|
4.8
|
Note Agreement dated as of September 15, 1997. (Filed as Exhibit 4.15 to the Company’s Form 10-K for the year ended October 1, 1997 and incorporated herein by reference.)
|
|
4.9
|
First Amendment dated January 10, 2000 to Note Agreement dated September 15, 1997. (Filed as Exhibit 4.10 to the Company’s Form 10-Q for the quarter ended March 31, 2000 and incorporated herein by reference.)
|
|
4.10
|
Second Amendment dated December 13, 2001 to Note Agreement dated September 15, 1997. (Filed as Exhibit 4.9 to the Company’s Form 10-K for the year ended October 3, 2003 and incorporated herein by reference.)
|
|
4.11
|
Consent and Amendment dated as of September 6, 2002 to Note Agreement dated September 15, 1997. (Filed as Exhibit 4.11 to the Company’s Form 10-K for the year ended October 3, 2003 and incorporated herein by reference.)
|
|
4.12
|
Note Agreement dated as of December 13, 2001. (Filed as Exhibit 4.12 to the Company’s Form 10-K for the year ended October 3, 2003 and incorporated herein by reference.)
|
|
4.13
|
Consent and Amendment dated of September 6, 2002 to Note Agreement dated as of December 13, 2001. (Filed as Exhibit 4.15 to the Company’s Form 10-K for the year ended October 3, 2003 and incorporated herein by reference.)
|
|
9.1
|
Johnson Outdoors Inc. Class B common stock Amended and Restated Voting Trust Agreement, dated as of February 16, 2010 (Filed as Exhibit 1 to Amendment No. 13 to the Schedule 13D filed by Helen P. Johnson-Leipold on February 3, 2011 and incorporated herein by reference.)
|
|
10.1
|
Stock Purchase Agreement, dated as of January 12, 2000, by and between Johnson Outdoors Inc. and Berkley Inc. (Filed as Exhibit 2.1 to the Company’s Form 8-K dated March 31, 2000 and incorporated herein by reference.)
|
|
10.2
|
Amendment to Stock Purchase Agreement, dated as of February 28, 2000, by and between Johnson Outdoors Inc. and Berkley Inc. (Filed as Exhibit 2.2 to the Company’s Form 8-K dated March 31, 2000 and incorporated herein by reference.)
|
|
10.3+
|
Johnson Outdoors Inc. Amended and Restated 1986 Stock Option Plan. (Filed as Exhibit 10 to the Company’s Form 10-Q for the quarter ended July 2, 1993 and incorporated herein by reference.)
|
|
10.4
|
Registration Rights Agreement regarding Johnson Outdoors Inc. common stock issued to the Johnson family prior to the acquisition of Johnson Diversified, Inc. (Filed as Exhibit 10.6 to the Company’s Form S-1 Registration Statement No. 33-16998 and incorporated herein by reference.)
|
|
10.5
|
Registration Rights Agreement regarding Johnson Outdoors Inc. Class A common stock held by Mr. Samuel C. Johnson. (Filed as Exhibit 28 to the Company’s Form 10-Q for the quarter ended March 29, 1991 and incorporated herein by reference.)
|
|
10.6+
|
Form of Restricted Stock Agreement. (Filed as Exhibit 10.8 to the Company’s Form S-1 Registration Statement No. 33-23299 and incorporated herein by reference.)
|
|
10.7+
|
Form of Supplemental Retirement Agreement of Johnson Diversified, Inc. (Filed as Exhibit 10.9 to the Company’s Form S-1 Registration Statement No. 33-16998 and incorporated herein by reference.)
|
|
10.8+
|
Johnson Outdoors Retirement and Savings Plan. (Filed as Exhibit 10.9 to the Company’s Form 10-K for the year ended September 29, 1989 and incorporated herein by reference.)
|
|
10.9+
|
Form of Agreement of Indemnity and Exoneration with Directors and Officers. (Filed as Exhibit 10.11 to the Company’s Form S-1 Registration Statement No. 33-16998 and incorporated herein by reference.)
|
|
10.10
|
Consulting and administrative agreements with S. C. Johnson & Son, Inc. (Filed as Exhibit 10.12 to the Company’s Form S-1 Registration Statement No. 33-16998 and incorporated herein by reference.)
|
|
10.11+
|
Johnson Outdoors Inc. 1994 Long-Term Stock Incentive Plan. (Filed as Exhibit 4 to the Company’s Form S-8 Registration Statement No. 333-88091 and incorporated herein by reference.)
|
|
10.12+
|
Johnson Outdoors Economic Value Added Bonus Plan (Filed as Exhibit 10.15 to the Company’s Form 10-K for the year ended October 1, 1997 and incorporated herein by reference.)
|
|
10.13+
|
Johnson Outdoors Inc. 2000 Long-Term Stock Incentive Plan. (Filed as Exhibit 99.1 to the Company’s Current Report on Form 8-K dated July 29, 2005 and incorporated herein by reference.)
|
|
10.14
|
Share Purchase and Transfer Agreement, dated as of August 28, 2002, by and between, among others, Johnson Outdoors Inc. and an affiliate of Bain Capital Fund VII-E (UK), Limited Partnership. (Filed as Exhibit 2.1 to the Company’s Form 8-K dated September 9, 2002 and incorporated herein by reference.)
|
|
10.15+
|
Johnson Outdoors Inc. Worldwide Key Executive Phantom Share Long-Term Incentive Plan (Filed as Exhibit 10.1 to the Company’s Form 10-Q dated March 28, 2003 and incorporated herein by reference.)
|
|
10.16+
|
Johnson Outdoors Inc. Worldwide Key Executives’ Discretionary Bonus Plan. (Filed as Appendix A to the Company’s Proxy Statement on Schedule 14A filed with the Securities and Exchange Commission on January 13, 2014 and incorporated herein by reference.)
|
|
10.17
|
Stock Purchase Agreement by and between Johnson Outdoors Inc. and TFX Equities Incorporated. (Filed as Exhibit 2.1 to the Company’s Form 10-Q dated April 2, 2004 and incorporated herein by reference.)
|
|
10.18
|
Intellectual Property Purchase Agreement by and among Johnson Outdoors Inc., Technology Holding Company II and Teleflex Incorporated. (Filed as Exhibit 2.2 to the Company’s Form 10-Q dated April 2, 2004 and incorporated herein by reference.)
|
|
10.19+
|
Johnson Outdoors Inc. 2003 Non-Employee Director Stock Ownership Plan. (Filed as Exhibit 10.2 to the Company’s Form 10-Q dated April 2, 2004 and incorporated herein by reference.)
|
|
10.20+
|
Form of Restricted Stock Agreement under Johnson Outdoors Inc. 2003 Non-Employee Director Stock Ownership Plan. (Filed as Exhibit 4.2 to the Company’s Form S-8 Registration Statement No. 333-115298 and incorporated herein by reference.)
|
|
10.21+
|
Form of Stock Option Agreement under Johnson Outdoors Inc. 2003 Non-Employee Director Stock Ownership Plan. (Filed as Exhibit 10.2 to the Company’s Form S-8 Registration Statement No. 333-115298 and incorporated herein by reference.)
|
|
10.22
|
Revolving Credit and Security Agreement dated as of September 16, 2013 among Johnson Outdoors Inc., certain subsidiaries of Johnson Outdoors Inc., PNC Bank, National Association, as lender and administrative agent, and the other lenders named therein (filed as Exhibit 99.2 to the current report on Form 8-K dated and filed with the Securities and Exchange Commission on September 18, 2013).
|
|
10.23
|
Term Loan Agreement (loan number 15613) dated as of September 29, 2009 among Techsonic Industries Inc., Johnson Outdoors Marine Electronics LLC and Ridgestone Bank (filed as Exhibit 99.3 to the current report on Form 8-K dated and filed with the Securities and Exchange Commission on September 30, 2009).
|
|
10.24
|
Term Loan Agreement (loan number 15612) dated as of September 29, 2009 between Johnson Outdoors Gear LLC and Ridgestone Bank (filed as Exhibit 99.4 to the current report on Form 8-K dated and filed with the Securities and Exchange Commission on September 30, 2009).
|
|
10.25
|
Term Loan Agreement (loan number 15628) dated as of September 29, 2009 between Johnson Outdoors Watercraft Inc. and Ridgestone Bank (filed as Exhibit 99.5 to the current report on Form 8-K dated and filed with the Securities and Exchange Commission on September 30, 2009).
|
|
10.26
|
Term Loan Agreement (loan number 15614) dated as of September 29, 2009 between Johnson Outdoors Watercraft Inc. and Ridgestone Bank (filed as Exhibit 99.6 to the current report on Form 8-K dated and filed with the Securities and Exchange Commission on September 30, 2009).
|
|
10.27
|
Term Loan Agreement (loan number 15627) dated as of September 29, 2009 between Johnson Outdoors Watercraft Inc. and Ridgestone Bank (filed as Exhibit 99.7 to the current report on Form 8-K dated and filed with the Securities and Exchange Commission on September 30, 2009).
|
|
10.28+
|
Johnson Outdoors Inc. 2009 Employees’ Stock Purchase Plan. (Filed as Exhibit 99.2 to the current report on Form 8-K dated and filed with the Securities and Exchange Commission on March 8, 2010.)
|
|
10.29+
|
Johnson Outdoors Inc. 2010 Long Term Stock Incentive Plan. (Filed as Appendix A to the Company’s Proxy Statement on Schedule 14A filed with the Securities and Exchange Commission on January 15, 2015 and incorporated herein by reference.)
|
|
10.30+
|
Johnson Outdoors Inc. 2012 Non-Employee Director Stock Ownership Plan. (Filed as Appendix A to the Company’s Proxy Statement on Schedule 14A filed with the Securities and Exchange Commission on January 23, 2013 and incorporated herein by reference.)
|
|
10.31+
|
Form of Restricted Stock Unit Agreement under Johnson Outdoors Inc. 2012 Non-Employee Director Stock Ownership Plan. (Filed as Exhibit 10.31 to the annual report on Form 10-K dated and filed with the Securities and Exchange Commission on December 5, 2014.)
|
|
10.32+
|
Form of Restricted Stock Unit Agreement (Performance Based) under Johnson Outdoors Inc. 2012 Non-Employee Director Stock Ownership Plan.
|
|
21
|
Subsidiaries of the Company as of October 2, 2015.
|
|
23
|
Consent of Independent Registered Public Accounting Firm.
|
|
31.1
|
Certification of Chief Executive Officer pursuant to Rule 13a-14(a) or 15d-14(a).
|
|
31.2
|
Certification of Chief Financial Officer pursuant to Rule 13a-14(a) or 15d-14(a).
|
|
32.1
|
Certifications of Chief Executive Officer and Chief Financial Officer pursuant to 18 U.S.C. Section 1350. (1)
|
|
101
|
The following materials from Johnson Outdoors Inc.’s Annual Report on Form 10-K for the fiscal year ended October 2, 2015 formatted in XBRL (eXtensible Business Reporting Language) and furnished electronically herewith: (i) Consolidated Statements of Operations; (ii) Consolidated Statements of Comprehensive Income, (iii) Consolidated Balance Sheets; (iv) Consolidated Statements of Shareholders’ Equity; (v) Consolidated Statements of Cash Flows; and (vi) Notes to Consolidated Financial Statements.
|
+ A management contract or compensatory plan or arrangement.
(1) This certification is not “filed” for purposes of Section 18 of the Securities Exchange Act of 1934, as amended, or incorporated by reference into any filing under the Securities Act of 1933, as amended, or the Securities Exchange Act of 1934, as amended.
37
CONSOLIDATED FINANCIAL STATEMENTS
|
Table of Contents
|
Page
|
|
|
Management’s Report on Internal Control over Financial Reporting
|
F-2
|
|
|
Report of Independent Registered Public Accounting Firm on Internal Control over Financial Reporting
|
F-3
|
|
|
Report of Independent Registered Public Accounting Firm
|
F-4
|
|
|
Consolidated Statements of Operations
|
F-5
|
|
|
Consolidated Statements of Comprehensive Income
|
F-6
|
|
|
Consolidated Balance Sheets
|
F-7
|
|
|
Consolidated Statements of Shareholders’ Equity
|
F-8
|
|
|
Consolidated Statements of Cash Flows
|
F-9
|
|
|
Notes to Consolidated Financial Statements
|
F-10
|
MANAGEMENT’S REPORT ON INTERNAL CONTROL OVER FINANCIAL REPORTING
The management of Johnson Outdoors Inc. is responsible for establishing and maintaining adequate internal control over financial reporting, as such term is defined in Rule 13a-15(f) of the Securities Exchange Act of 1934. The Company’s internal control over financial reporting is designed to provide reasonable assurance to the Company’s management and board of directors regarding the preparation and fair presentation of published financial statements. The Company’s internal control over financial reporting includes those policies and procedures that:
(a) pertain to the maintenance of records that, in reasonable detail, accurately and fairly reflect the transactions and dispositions of the assets of the Company;
(b) provide reasonable assurance that transactions are recorded as necessary to permit preparation of financial statements in accordance with U.S. generally accepted accounting principles, and that
receipts and expenditures of the Company are being made only in accordance with authorizations of management and directors of the Company; and
(c) provide reasonable assurance regarding prevention or timely detection of unauthorized acquisition, use or disposition of the Company’s assets that could have a material effect on the financial
statements.
Because of its inherent limitations, internal control over financial reporting may not prevent or detect misstatements. Therefore, even those systems determined to be effective can provide only reasonable assurance with respect to financial statement preparation and presentation. Also, projections of any evaluation of effectiveness to future periods are subject to the risk that controls may become inadequate because of changes in conditions, or that the degree of compliance with the policies or procedures may deteriorate.
Management assessed the effectiveness of the Company’s internal control over financial reporting as of October 2, 2015. In making this assessment, management used the criteria established in Internal Control Integrated Framework issued by the Committee of Sponsoring Organizations of the Treadway Commission (COSO) in 2013. Based on our assessment, management believes that, as of October 2, 2015, the Company’s internal control over financial reporting was effective based on those criteria.
|
/s/ Helen P. Johnson-Leipold
|
/s/ David W. Johnson
|
|
Chairman and Chief Executive Officer
|
Vice President and Chief Financial Officer
|
F-2
REPORT OF INDEPENDENT REGISTERED PUBLIC ACCOUNTING FIRM ON INTERNAL CONTROL OVER FINANCIAL REPORTING
To the Board of Directors and Shareholders
Johnson Outdoors Inc.
We have audited Johnson Outdoors Inc.'s internal control over financial reporting as of October 2, 2015, based on criteria established in Internal Control — Integrated Framework issued by the Committee of Sponsoring Organizations of the Treadway Commission in 2013. Johnson Outdoors Inc.’s management is responsible for maintaining effective internal control over financial reporting and for its assessment of the effectiveness of internal control over financial reporting included in the accompanying Management’s Report on Internal Control over Financial Reporting. Our responsibility is to express an opinion on the company's internal control over financial reporting based on our audit.
We conducted our audit in accordance with the standards of the Public Company Accounting Oversight Board (United States). Those standards require that we plan and perform the audit to obtain reasonable assurance about whether effective internal control over financial reporting was maintained in all material respects. Our audit included obtaining an understanding of internal control over financial reporting, assessing the risk that a material weakness exists, and testing and evaluating the design and operating effectiveness of internal control based on the assessed risk. Our audit also included performing such other procedures as we considered necessary in the circumstances. We believe that our audit provides a reasonable basis for our opinion.
A company's internal control over financial reporting is a process designed to provide reasonable assurance regarding the reliability of financial reporting and the preparation of financial statements for external purposes in accordance with generally accepted accounting principles. A company's internal control over financial reporting includes those policies and procedures that (a) pertain to the maintenance of records that, in reasonable detail, accurately and fairly reflect the transactions and dispositions of the assets of the company; (b) provide reasonable assurance that transactions are recorded as necessary to permit preparation of financial statements in accordance with generally accepted accounting principles, and that receipts and expenditures of the company are being made only in accordance with authorizations of management and directors of the company; and (c) provide reasonable assurance regarding prevention or timely detection of unauthorized acquisition, use, or disposition of the company's assets that could have a material effect on the financial statements.
Because of its inherent limitations, internal control over financial reporting may not prevent or detect misstatements. Also, projections of any evaluation of effectiveness to future periods are subject to the risk that controls may become inadequate because of changes in conditions, or that the degree of compliance with the policies or procedures may deteriorate.
In our opinion, Johnson Outdoors Inc. maintained, in all material respects, effective internal control over financial reporting as of October 2, 2015, based on criteria established in Internal Control — Integrated Framework issued by the Committee of Sponsoring Organizations of the Treadway Commission in 2013.
We have also audited, in accordance with the standards of the Public Company Accounting Oversight Board (United States), the consolidated financial statements of Johnson Outdoors Inc. and our report dated December 7, 2015 expressed an unqualified opinion.
/s/ RSM US LLP
Milwaukee, Wisconsin
December 7, 2015
F-3
REPORT OF INDEPENDENT REGISTERED PUBLIC ACCOUNTING FIRM
To the Board of Directors and Shareholders
Johnson Outdoors Inc.
We have audited the accompanying consolidated balance sheets of Johnson Outdoors Inc. as of October 2, 2015 and October 3, 2014, and the related consolidated statements of operations, comprehensive income, shareholders' equity, and cash flows for each of the three years in the period ended October 2, 2015. These financial statements are the responsibility of the Company's management. Our responsibility is to express an opinion on these financial statements based on our audits.
We conducted our audits in accordance with the standards of the Public Company Accounting Oversight Board (United States). Those standards require that we plan and perform the audit to obtain reasonable assurance about whether the financial statements are free of material misstatement. An audit includes examining, on a test basis, evidence supporting the amounts and disclosures in the financial statements. An audit also includes assessing the accounting principles used and significant estimates made by management, as well as evaluating the overall financial statement presentation. We believe that our audits provide a reasonable basis for our opinion.
In our opinion, the consolidated financial statements referred to above present fairly, in all material respects, the financial position of Johnson Outdoors Inc. as of October 2, 2015 and October 3, 2014, and the results of their operations and their cash flows for each of the three years in the period ended October 2, 2015, in conformity with U.S. generally accepted accounting principles.
We have also audited, in accordance with the standards of the Public Company Accounting Oversight Board (United States), Johnson Outdoors Inc.’s internal control over financial reporting as of October 2, 2015, based on criteria established in Internal Control — Integrated Framework issued by the Committee of Sponsoring Organizations of the Treadway Commission in 2013, and our report dated December 7, 2015 expressed an unqualified opinion on the effectiveness of Johnson Outdoors Inc.’s internal control over financial reporting.
/s/ RSM US LLP
Milwaukee, Wisconsin
December 7, 2015
F-4
CONSOLIDATED STATEMENTS OF OPERATIONS
|
Year Ended
|
||||||||||||
|
October 2
|
October 3
|
September 27
|
||||||||||
|
(thousands, except per share data)
|
2015
|
2014
|
2013
|
|||||||||
|
Net sales
|
$ | 430,489 | $ | 425,410 | $ | 426,461 | ||||||
|
Cost of sales
|
258,756 | 256,797 | 255,412 | |||||||||
|
Gross profit
|
171,733 | 168,613 | 171,049 | |||||||||
|
Operating expenses:
|
||||||||||||
|
Marketing and selling
|
93,707 | 87,902 | 88,218 | |||||||||
|
Administrative management, finance and information systems
|
43,690 | 39,078 | 41,894 | |||||||||
|
Goodwill and other intangible assets impairment
|
- | 8,475 | - | |||||||||
|
Research and development
|
16,483 | 16,467 | 15,346 | |||||||||
|
Total operating expenses
|
153,880 | 151,922 | 145,458 | |||||||||
|
Operating profit
|
17,853 | 16,691 | 25,591 | |||||||||
|
Interest income
|
(64 | ) | (85 | ) | (91 | ) | ||||||
|
Interest expense
|
865 | 788 | 1,285 | |||||||||
|
Other expense (income), net
|
1,299 | (1,434 | ) | (263 | ) | |||||||
|
Profit before income taxes
|
15,753 | 17,422 | 24,660 | |||||||||
|
Income tax expense
|
5,137 | 8,299 | 5,333 | |||||||||
|
Net income
|
$ | 10,616 | $ | 9,123 | $ | 19,327 | ||||||
|
Weighted average common shares - Basic:
|
||||||||||||
|
Class A
|
8,515 | 8,420 | 8,305 | |||||||||
|
Class B
|
1,212 | 1,212 | 1,212 | |||||||||
|
Dilutive stock options and restricted stock units
|
- | 3 | 6 | |||||||||
|
Weighted average common shares - Dilutive
|
9,727 | 9,635 | 9,523 | |||||||||
|
Net income per common share - Basic:
|
||||||||||||
|
Class A
|
$ | 1.08 | $ | 0.93 | $ | 1.98 | ||||||
|
Class B
|
$ | 0.98 | $ | 0.84 | $ | 1.79 | ||||||
|
Net income per common share - Diluted:
|
||||||||||||
|
Class A
|
$ | 1.06 | $ | 0.90 | $ | 1.95 | ||||||
|
Class B
|
$ | 1.06 | $ | 0.90 | $ | 1.95 | ||||||
|
Dividends declared per common share:
|
||||||||||||
|
Class A
|
$ | 0.31 | $ | 0.38 | $ | - | ||||||
|
Class B
|
$ | 0.28 | $ | 0.34 | $ | - | ||||||
The accompanying notes are an integral part of the Consolidated Financial Statements.
F-5
CONSOLIDATED STATEMENTS OF COMPREHENSIVE INCOME
|
Year Ended
|
||||||||||||
|
October 2
|
October 3
|
September 27
|
||||||||||
|
(thousands, except per share data)
|
2015
|
2014
|
2013
|
|||||||||
|
Comprehensive income:
|
||||||||||||
|
Net income
|
$ | 10,616 | $ | 9,123 | $ | 19,327 | ||||||
|
Other comprehensive (loss) income:
|
||||||||||||
|
Foreign currency translation (loss) gain
|
(8,348 | ) | (5,500 | ) | (28 | ) | ||||||
|
Write off of currency translation adjustment loss (gain)
|
177 | 135 | (84 | ) | ||||||||
|
Change in pension plans, net of tax of $541, $750 and $1,976, respectively
|
(970 | ) | (1,223 | ) | 3,223 | |||||||
|
Amortization of unrealized loss on interest rate swap
|
- | - | 138 | |||||||||
|
Total other comprehensive (loss) income
|
(9,141 | ) | (6,588 | ) | 3,249 | |||||||
|
Total comprehensive income
|
$ | 1,475 | $ | 2,535 | $ | 22,576 | ||||||
The accompanying notes are an integral part of the Consolidated Financial Statements.
F-6
CONSOLIDATED BALANCE SHEETS
|
October 2
|
October 3
|
|||||||
|
(thousands, except share data)
|
2015
|
2014
|
||||||
|
ASSETS
|
||||||||
|
Current assets:
|
||||||||
|
Cash and cash equivalents
|
$ | 69,159 | $ | 70,793 | ||||
|
Accounts receivable, net
|
44,798 | 44,452 | ||||||
|
Inventories
|
79,919 | 66,341 | ||||||
|
Deferred income taxes
|
10,649 | 8,360 | ||||||
|
Other current assets
|
4,845 | 7,604 | ||||||
|
Total current assets
|
209,370 | 197,550 | ||||||
|
Property, plant and equipment, net of accumulated
|
||||||||
|
depreciation of $116,902 and $108,668, respectively
|
45,287 | 46,100 | ||||||
|
Deferred income taxes
|
5,218 | 5,353 | ||||||
|
Goodwill
|
14,292 | 14,416 | ||||||
|
Other intangible assets, net
|
11,688 | 12,518 | ||||||
|
Other assets
|
13,349 | 12,689 | ||||||
|
Total assets
|
$ | 299,204 | $ | 288,626 | ||||
|
LIABILITIES AND SHAREHOLDERS' EQUITY
|
||||||||
|
Current liabilities:
|
||||||||
|
Short-term debt
|
$ | - | $ | - | ||||
|
Current maturities of long-term debt
|
368 | 360 | ||||||
|
Accounts payable
|
28,455 | 27,896 | ||||||
|
Accrued liabilities:
|
||||||||
|
Salaries, wages and benefits
|
16,815 | 14,780 | ||||||
|
Accrued warranty
|
4,301 | 4,078 | ||||||
|
Income taxes payable
|
3,837 | 833 | ||||||
|
Other
|
15,778 | 12,285 | ||||||
|
Total current liabilities
|
69,554 | 60,232 | ||||||
|
Long-term debt, less current maturities
|
7,062 | 7,431 | ||||||
|
Deferred income taxes
|
1,182 | 1,133 | ||||||
|
Retirement benefits
|
10,118 | 7,804 | ||||||
|
Other liabilities
|
13,320 | 13,568 | ||||||
|
Total liabilities
|
101,236 | 90,168 | ||||||
|
Shareholders' equity:
|
||||||||
|
Preferred stock: none issued
|
- | - | ||||||
|
Common stock:
|
||||||||
|
Class A shares issued and outstanding:
|
441 | 439 | ||||||
|
October 2, 2015: 8,770,612
|
||||||||
|
October 3, 2014: 8,769,426
|
||||||||
|
Class B shares issued and outstanding:
|
61 | 61 | ||||||
|
October 2, 2015: 1,212,382
|
||||||||
|
October 3, 2014: 1,212,382
|
||||||||
|
Capital in excess of par value
|
69,545 | 67,882 | ||||||
|
Retained earnings
|
125,173 | 117,573 | ||||||
|
Accumulated other comprehensive income
|
3,637 | 12,778 | ||||||
|
Treasury stock at cost, shares of Class A common
|
||||||||
|
stock: 33,241 and 11,203, respectively
|
(889 | ) | (275 | ) | ||||
|
Total shareholders' equity
|
197,968 | 198,458 | ||||||
|
Total liabilities and shareholders' equity
|
$ | 299,204 | $ | 288,626 | ||||
The accompanying notes are an integral part of the Consolidated Financial Statements.
F-7
CONSOLIDATED STATEMENTS OF SHAREHOLDERS’ EQUITY
|
(thousands except for shares)
|
Shares
|
Common Stock
|
Capital in
Excess of Par Value
|
Retained
Earnings
|
Treasury
Stock
|
Accumulated
Other Comprehensive Income (Loss)
|
||||||||||||||||||
|
BALANCE AT SEPTEMBER 28, 2012
|
9,892,461 | $ | 495 | $ | 64,184 | $ | 92,817 | $ | (9 | ) | $ | 16,117 | ||||||||||||
|
Net income
|
- | - | - | 19,327 | - | - | ||||||||||||||||||
|
Issuance of stock under employee stock purchase plan
|
9,562 | 1 | 227 | - | - | - | ||||||||||||||||||
|
Award of non-vested shares
|
70,545 | 3 | (3 | ) | - | - | - | |||||||||||||||||
|
Stock-based compensation
|
- | - | 1,488 | - | - | - | ||||||||||||||||||
|
Tax effects on stock based awards
|
- | - | 572 | - | - | |||||||||||||||||||
|
Currency translation adjustment
|
- | - | - | - | - | (28 | ) | |||||||||||||||||
|
Write off of currency translation adjustment gain
|
- | - | - | - | - | (84 | ) | |||||||||||||||||
|
Change in pension plans, net of tax of $1,976
|
- | - | - | - | - | 3,223 | ||||||||||||||||||
|
Purchase of treasury stock at cost
|
(43,464 | ) | - | - | - | (886 | ) | |||||||||||||||||
|
Reissue of treasury stock
|
8,300 | - | (94 | ) | - | 180 | - | |||||||||||||||||
|
Amortization of unrealized loss on interest rate swaps
|
- | - | - | - | - | 138 | ||||||||||||||||||
|
BALANCE AT SEPTEMBER 27, 2013
|
9,937,404 | 499 | 66,374 | 112,144 | (715 | ) | 19,366 | |||||||||||||||||
|
Net income
|
- | - | - | 9,123 | - | - | ||||||||||||||||||
|
Dividends declared
|
- | - | - | (3,694 | ) | - | - | |||||||||||||||||
|
Issuance of stock under employee stock purchase plan
|
15,969 | 1 | 328 | - | - | - | ||||||||||||||||||
|
Award of non-vested shares
|
4,910 | - | - | - | - | - | ||||||||||||||||||
|
Stock-based compensation
|
- | - | 1,688 | - | - | - | ||||||||||||||||||
|
Tax effects on stock based awards
|
- | - | 493 | - | - | |||||||||||||||||||
|
Currency translation adjustment
|
- | - | - | - | - | (5,500 | ) | |||||||||||||||||
|
Write off of currency translation adjustment loss
|
- | - | - | - | - | 135 | ||||||||||||||||||
|
Change in pension plans, net of tax of $750
|
- | - | - | - | - | (1,223 | ) | |||||||||||||||||
|
Purchase of treasury stock at cost
|
(23,399 | ) | - | - | - | (605 | ) | |||||||||||||||||
|
Reissue of treasury stock
|
46,924 | - | (1,001 | ) | - | 1,045 | - | |||||||||||||||||
|
BALANCE AT OCTOBER 3, 2014
|
9,981,808 | 500 | 67,882 | 117,573 | (275 | ) | 12,778 | |||||||||||||||||
|
Net income
|
- | - | - | 10,616 | - | - | ||||||||||||||||||
|
Dividends declared
|
- | - | - | (3,016 | ) | - | - | |||||||||||||||||
|
Exercise of stock options
|
- | - | 77 | - | - | - | ||||||||||||||||||
|
Issuance of stock under employee stock purchase plan
|
8,062 | 2 | 194 | - | - | - | ||||||||||||||||||
|
Award of non-vested shares
|
40,526 | - | - | - | - | - | ||||||||||||||||||
|
Stock-based compensation
|
- | - | 1,573 | - | - | - | ||||||||||||||||||
|
Tax effects on stock based awards
|
- | - | (8 | ) | - | - | ||||||||||||||||||
|
Currency translation adjustment
|
- | - | - | - | - | (8,348 | ) | |||||||||||||||||
|
Write off of currency translation adjustment loss
|
- | - | - | - | - | 177 | ||||||||||||||||||
|
Change in pension plans, net of tax of $541
|
- | - | - | - | - | (970 | ) | |||||||||||||||||
|
Non-vested stock forfeitures
|
(25,364 | ) | - | - | - | - | - | |||||||||||||||||
|
Purchase of treasury stock at cost
|
(31,934 | ) | - | - | - | (865 | ) | - | ||||||||||||||||
|
Reissue of treasury stock
|
9,896 | - | (173 | ) | - | 251 | - | |||||||||||||||||
|
BALANCE AT OCTOBER 2, 2015
|
9,982,994 | $ | 502 | $ | 69,545 | $ | 125,173 | $ | (889 | ) | $ | 3,637 | ||||||||||||
The accompanying notes are an integral part of the Consolidated Financial Statements.
F-8
CONSOLIDATED STATEMENTS OF CASH FLOWS
|
Year Ended
|
||||||||||||
|
(thousands)
|
October 2 2015
|
October 3 2014
|
September 27
2013
|
|||||||||
|
CASH PROVIDED BY OPERATING ACTIVITIES
|
|
|||||||||||
|
Net income
|
$ | 10,616 | $ | 9,123 | $ | 19,327 | ||||||
|
Adjustments to reconcile net income to net cash provided by operating activities:
|
||||||||||||
|
Depreciation
|
10,846 | 9,978 | 9,105 | |||||||||
|
Amortization of intangible assets
|
856 | 765 | 650 | |||||||||
|
Amortization of deferred financing costs
|
122 | 120 | 315 | |||||||||
|
Impairment losses
|
- | 8,475 | - | |||||||||
|
Stock based compensation
|
1,606 | 1,744 | 1,488 | |||||||||
|
Amortization of deferred loss on interest rate swap
|
- | - | 138 | |||||||||
|
Write off of currency translation adjustment loss (gain)
|
178 | 135 | (84 | ) | ||||||||
|
Provision for doubtful accounts receivable
|
292 | 288 | 769 | |||||||||
|
Provision for inventory reserves
|
2,123 | 1,043 | 1,269 | |||||||||
|
Deferred income taxes
|
(1,485 | ) | 2,667 | 1,613 | ||||||||
|
Change in operating assets and liabilities:
|
||||||||||||
|
Accounts receivable, net
|
(2,534 | ) | (1,484 | ) | (3,144 | ) | ||||||
|
Inventories, net
|
(17,999 | ) | 7,815 | (8,115 | ) | |||||||
|
Accounts payable and accrued liabilities
|
10,582 | (3,825 | ) | 3,336 | ||||||||
|
Other current assets
|
2,599 | (4,197 | ) | 3,377 | ||||||||
|
Other non-current assets
|
(284 | ) | (565 | ) | (1,817 | ) | ||||||
|
Other long-term liabilities
|
(160 | ) | 1,145 | 1,595 | ||||||||
|
Other, net
|
698 | (9 | ) | 181 | ||||||||
|
|
18,056 | 33,218 | 30,003 | |||||||||
|
CASH USED FOR INVESTING ACTIVITIES
|
||||||||||||
|
Payments for purchase of business
|
- | - | (15,420 | ) | ||||||||
|
Capital expenditures
|
(10,409 | ) | (13,263 | ) | (16,333 | ) | ||||||
|
Proceeds from sales of property, plant and equipment
|
15 | 1,376 | - | |||||||||
|
|
(10,394 | ) | (11,887 | ) | (31,753 | ) | ||||||
|
CASH USED FOR FINANCING ACTIVITIES
|
||||||||||||
|
Principal payments on senior notes and other long-term debt
|
(360 | ) | (542 | ) | (528 | ) | ||||||
|
Deferred financing costs paid to lenders
|
- | (34 | ) | (339 | ) | |||||||
|
Common stock transactions
|
202 | 638 | 712 | |||||||||
|
Dividends paid
|
(2,966 | ) | (2,955 | ) | - | |||||||
|
Purchases of treasury stock
|
(865 | ) | (605 | ) | (886 | ) | ||||||
| (3,989 | ) | (3,498 | ) | (1,041 | ) | |||||||
|
Effect of foreign currency rate changes on cash
|
(5,307 | ) | (2,734 | ) | (419 | ) | ||||||
|
(Decrease) Increase in cash and cash equivalents
|
(1,634 | ) | 15,099 | (3,210 | ) | |||||||
|
CASH AND CASH EQUIVALENTS
|
||||||||||||
|
Beginning of period
|
70,793 | 55,694 | 58,904 | |||||||||
|
End of period
|
$ | 69,159 | $ | 70,793 | $ | 55,694 | ||||||
The accompanying notes are an integral part of the Consolidated Financial Statements.
F-9
NOTES TO CONSOLIDATED FINANCIAL STATEMENTS
OCTOBER 2, 2015
(IN THOUSANDS EXCEPT SHARE AND PER SHARE AMOUNTS)
1 SUMMARY OF SIGNIFICANT ACCOUNTING POLICIES
Business
Johnson Outdoors Inc. (the "Company") is an integrated, global outdoor recreation products company engaged in the design, manufacture and marketing of brand name outdoor equipment, diving, watercraft and marine electronics products.
Principles of Consolidation
The consolidated financial statements include the accounts of Johnson Outdoors Inc. and all majority owned subsidiaries and are stated in conformity with U.S. generally accepted accounting principles. Intercompany accounts and transactions have been eliminated upon consolidation.
Use of Estimates
The preparation of financial statements requires management to make estimates and assumptions that impact the reported amounts of assets, liabilities and operating results and the disclosure of commitments and contingent liabilities. Actual results could differ significantly from those estimates.
Fiscal Year
The Company’s fiscal year ends on the Friday nearest September 30. The fiscal year ended October 2, 2015 (hereinafter 2015) comprised 52 weeks. The fiscal year ended October 3, 2014 (hereinafter 2014) comprised 53 weeks. The fiscal year ended September 27, 2013 (hereinafter 2013) comprised 52 weeks.
Cash and Cash Equivalents
The Company considers all short-term investments in interest-bearing bank accounts, and all securities and other instruments with an original maturity of three months or less, to be equivalent to cash. Cash equivalents are stated at cost which approximates market value.
The Company maintains cash in bank accounts in excess of insured limits. The Company has not experienced any losses and does not believe that significant credit risk exists as a result of this practice.
Accounts Receivable
Accounts receivable are recorded at face value less an allowance for doubtful accounts. The allowance for doubtful accounts is based on a combination of factors. In circumstances where specific collection concerns exist, a reserve is established to reduce the amount recorded to an amount the Company believes will be collected. For all other customers, the Company recognizes allowances for doubtful accounts based on historical experience of bad debts as a percent of outstanding accounts receivable for each business unit. Uncollectible accounts are written off against the allowance for doubtful accounts after collection efforts have been exhausted. The Company typically does not require collateral on its accounts receivable.
Inventories
The Company values inventory at the lower of cost (determined using the first-in first-out method) or market. Management’s judgment is required to determine the reserve for obsolete or excess inventory. Inventory on hand may exceed future demand either because the product is outdated or because the amount on hand is more than will be used to meet future needs. Inventory reserves are estimated by the individual operating companies using standard quantitative measures based on criteria established by the Company. The Company also considers current forecast plans, as well as market and industry conditions in establishing reserve levels. Though the Company considers these reserve balances to be adequate, changes in economic conditions, customer inventory levels or competitive conditions could have a favorable or unfavorable effect on required reserve balances.
Inventories at the end of the respective fiscal years consisted of the following:
F-10
|
October 2
|
October 3
|
|||||||
|
2015
|
2014
|
|||||||
|
Raw materials
|
$ | 34,711 | $ | 27,295 | ||||
|
Work in process
|
24 | 72 | ||||||
|
Finished goods
|
45,184 | 38,974 | ||||||
| $ | 79,919 | $ | 66,341 | |||||
Property, Plant and Equipment
Property, plant and equipment are stated at cost less accumulated depreciation. Depreciation of property, plant and equipment is determined by straight-line methods over the following estimated useful lives:
|
Property improvements
|
5-20 years
|
|||
|
Buildings and improvements
|
20-40 years
|
|||
|
Furniture, fixtures and equipment
|
3-10 years
|
Upon retirement or disposition, cost and the related accumulated depreciation are removed from the applicable account and any resulting gain or loss is recognized in the results of operations.
Property, plant and equipment at the end of the respective years consisted of the following:
|
2015
|
2014
|
|||||||
|
Property improvements
|
$ | 588 | $ | 633 | ||||
|
Buildings and improvements
|
21,127 | 20,956 | ||||||
|
Furniture, fixtures and equipment
|
140,474 | 133,179 | ||||||
| 162,189 | 154,768 | |||||||
|
Less accumulated depreciation
|
116,902 | 108,668 | ||||||
| $ | 45,287 | $ | 46,100 | |||||
Goodwill
The Company applies a fair value-based impairment test to the carrying value of goodwill on an annual basis as of the last day of the eleventh month of the Company’s fiscal year and, if certain events or circumstances indicate that an impairment loss may have been incurred, on an interim basis.
The analysis of potential impairment of goodwill requires a two-step process. The first step is the estimation of the fair value of the applicable reporting unit. Estimated fair value is based on management judgments and assumptions and the Company cannot predict what future events may occur that could adversely affect the reported value of its goodwill. The fair values as determined by management are compared with the aggregate carrying values of the reporting units. If the fair value of the reporting unit is greater than its carrying amount, there is no impairment. If the reporting unit carrying amount is greater than the fair value, then the second step must be completed to measure the amount of impairment, if any.
The second step calculates the implied fair value of the goodwill which is compared to its carrying value. If the implied fair value is less than the carrying value, an impairment loss is recognized equal to the difference.
See Note 17 for a discussion of the impairment charges recognized as a result of the impairment tests performed in 2014. The results of the impairment tests performed in 2015 and 2013 indicated no impairment to the Company’s goodwill. Due to the uncertainty of future events, the Company cannot assure that growth rates will not be lower than expected, discount rates will not increase or the projected cash flows of the individual reporting units will not decline, all of which factors could impact the carrying value of any remaining goodwill (or portion thereof) in future periods, and accordingly, whether any impairment losses need to be recorded in future periods.
F-11
The changes in the carrying amount of those segments with goodwill and the composition of consolidated net goodwill for fiscal 2015 and 2014 were as follows:
|
Segment
|
Consolidated
|
|||||||||||||||||||||||||||
|
Marine
Electronics
|
Diving
|
Outdoor
Equipment
|
Consolidated
|
Gross
Goodwill
|
Accumulated
Impairment
|
Total
|
||||||||||||||||||||||
|
Balance at September 27, 2013
|
$ | 10,367 | $ | 4,211 | $ | 6,475 | $ | 21,053 | $ | 60,968 | $ | 39,915 | $ | 21,053 | ||||||||||||||
|
Impairment
|
- | - | (6,475 | ) | (6,475 | ) | - | 6,475 | (6,475 | ) | ||||||||||||||||||
|
Amount attributable to movements in foreign currency rates
|
- | (162 | ) | - | (162 | ) | (162 | ) | - | (162 | ) | |||||||||||||||||
|
Balance at October 3, 2014
|
$ | 10,367 | $ | 4,049 | $ | - | $ | 14,416 | $ | 60,806 | $ | 46,390 | $ | 14,416 | ||||||||||||||
|
Amount attributable to movements in foreign currency rates
|
- | (124 | ) | - | (124 | ) | (124 | ) | - | (124 | ) | |||||||||||||||||
|
Balance at October 2, 2015
|
$ | 10,367 | $ | 3,925 | $ | - | $ | 14,292 | $ | 60,682 | $ | 46,390 | $ | 14,292 | ||||||||||||||
Other Intangible Assets
Indefinite-lived intangible assets are also tested for impairment annually and, if certain events or circumstances indicate that an impairment loss may have been incurred, on an interim basis. There were no impairment losses recognized in fiscal 2015.
During fiscal 2013, the acquisition of Jetboil resulted in indefinite-lived intangible assets of $5,400 consisting of the Jetboil tradename. During the third quarter of fiscal 2014, forecasted cash flows related to Jetboil declined from the assumptions used in the initial valuation. This change led the Company to perform an interim impairment test on the acquired indefinite lived intangible assets by comparing their carrying value to their fair value. The fair value was determined using a relief from royalty method under the income approach which uses projected revenue allocable to the tradename and a royalty rate at which it is assumed a market participant would be willing to incur as its cost in order to manufacture a branded product. As a result of this analysis, the Company recognized an impairment charge of $2,000 in “Goodwill and other intangible assets impairment” in the accompanying Consolidated Statements of Operations in the Outdoor Equipment segment reducing the fair value of the tradename to $3,400. There was no additional impairment of indefinite-lived intangible assets recorded for fiscal 2014.
Intangible assets with definite lives are stated at cost less accumulated amortization. Amortization is computed using the straight-line method over periods ranging from 4 to 15 years. Amortization of patents and other intangible assets with definite lives was $856, $765 and $650 for 2015, 2014 and 2013, respectively. Amortization of these definite-lived intangible assets is expected to be approximately $836, $502, $458, $458 and $395 for fiscal years 2016, 2017, 2018, 2019 and 2020, respectively.
Intangible assets at the end of the last two years consisted of the following:
F-12
|
2015
|
2014
|
|||||||||||||||||||||||
|
Gross
Intangible
|
Accumulated
Amortization
|
Net
|
Gross
Intangible
|
Accumulated
Amortization
|
Net
|
|||||||||||||||||||
|
Amortized other intangible assets:
|
||||||||||||||||||||||||
|
Patents and trademarks
|
$ | 4,149 | $ | (3,929 | ) | $ | 220 | $ | 4,306 | $ | (4,006 | ) | $ | 300 | ||||||||||
|
Other amortizable intangibles
|
6,746 | (2,303 | ) | 4,443 | 6,749 | (1,556 | ) | 5,193 | ||||||||||||||||
|
Non-amortized trademarks
|
7,025 | - | 7,025 | 7,025 | - | 7,025 | ||||||||||||||||||
| $ | 17,920 | $ | (6,232 | ) | $ | 11,688 | $ | 18,080 | $ | (5,562 | ) | $ | 12,518 | |||||||||||
Impairment of Long-Lived Assets
The Company reviews long-lived assets for impairment whenever events or changes in business circumstances such as unplanned negative cash flow indicate that the carrying amount of these assets may not be fully recoverable. In such an event, the carrying amount of the asset group is compared to the future undiscounted cash flows expected to be generated by the asset group to determine if impairment exists on these assets. If impairment is determined to exist, any related impairment loss is calculated based on the difference between the fair value and the carrying value on these assets.
Warranties
The Company provides for warranties of certain products as they are sold. Warranty reserves are estimated by the individual operating companies using standard quantitative measures based on criteria established by the Company. Estimates of costs to service its warranty obligations are based on historical experience, expectation of future conditions and known product issues. The following table summarizes the warranty activity for the three years in the period ended October 2, 2015.
|
Balance at September 28, 2012
|
$ | 4,751 | ||
|
Expense accruals for warranties issued during the period
|
2,901 | |||
|
Less current period warranty claims paid
|
2,438 | |||
|
Balance at September 27, 2013
|
$ | 5,214 | ||
|
Expense accruals for warranties issued during the period
|
3,717 | |||
|
Less current period warranty claims paid
|
4,853 | |||
|
Balance at October 3, 2014
|
$ | 4,078 | ||
|
Expense accruals for warranties issued during the period
|
5,631 | |||
|
Less current period warranty claims paid
|
5,408 | |||
|
Balance at October 2, 2015
|
$ | 4,301 | ||
Accumulated Other Comprehensive Income (Loss)
The components of “Accumulated other comprehensive income (loss)” on the accompanying Consolidated Balance Sheets as of the end of fiscal year 2015, 2014 and 2013 were as follows:
|
2015
|
2014
|
2013
|
||||||||||||||||||||||||||||||||||
|
Pre-Tax
Amount
|
Tax
Effect
|
Net of Tax
Effect
|
Pre-Tax
Amount
|
Tax
Effect
|
Net of Tax
Effect
|
Pre-Tax
Amount
|
Tax
Effect
|
Net of
Tax Effect
|
||||||||||||||||||||||||||||
|
Foreign currency translation adjustment
|
$ | 10,253 | $ | - | $ | 10,253 | $ | 18,424 | $ | - | $ | 18,424 | $ | 23,789 | $ | - | $ | 23,789 | ||||||||||||||||||
|
Unamortized loss on pension plans
|
(8,492 | ) | 1,876 | (6,616 | ) | (6,981 | ) | 1,335 | (5,646 | ) | (5,008 | ) | 585 | (4,423 | ) | |||||||||||||||||||||
|
Accumulated other comprehensive income
|
$ | 1,761 | $ | 1,876 | $ | 3,637 | $ | 11,443 | $ | 1,335 | $ | 12,778 | $ | 18,781 | $ | 585 | $ | 19,366 | ||||||||||||||||||
F-13
The reclassifications out of AOCI for the year ended October 2, 2015 were as follows:
|
Statement of Operations
|
|||||
|
Presentation
|
|||||
|
Unamortized loss on defined benefit pension plans:
|
|||||
|
Amortization of loss
|
$
|
622
|
Cost of sales / Operating expense
|
||
|
Tax effects
|
(237)
|
Income tax expense
|
|||
|
Foreign currency translation adjustments:
|
|||||
|
Write off of currency translation amounts
|
177
|
Other income and expense
|
|||
|
Total reclassifications for the period
|
$
|
562
|
|||
|
The reclassifications out of AOCI for the year ended October 3, 2014 were as follows:
|
|||||
|
Statement of Operations
|
|||||
|
Presentation
|
|||||
|
Unamortized loss on defined benefit pension plans:
|
|||||
|
Amortization of loss
|
$
|
341
|
Cost of sales / Operating expense
|
||
|
Tax effects
|
(130)
|
Income tax expense
|
|||
|
Foreign currency translation adjustments:
|
|||||
|
Write off of currency translation amounts
|
135
|
Other income and expense
|
|||
|
Total reclassifications for the period
|
$
|
346
|
|||
|
The changes in AOCI by component, net of tax, for the year ended October 2, 2015 were as follows:
|
||||||||||||
|
Foreign
Currency
Translation
Adjustment
|
Unamortized Loss
on Defined
Benefit Pension
Plans
|
Accumulated
Other
Comprehensive
Income (Loss)
|
||||||||||
|
Balance at October 3, 2014
|
$ | 18,424 | $ | (5,646 | ) | $ | 12,778 | |||||
|
Other comprehensive income before reclassifications
|
(8,348 | ) | (2,133 | ) | (10,481 | ) | ||||||
|
Amounts reclassified from accumulated other comprehensive income
|
177 | 622 | 799 | |||||||||
|
Tax effects
|
- | 541 | 541 | |||||||||
|
Balance at October 2, 2015
|
$ | 10,253 | $ | (6,616 | ) | $ | 3,637 | |||||
|
The changes in AOCI by component, net of tax, for the year ended October 3, 2014 were as follows:
|
||||||||||||
|
Foreign
Currency
Translation
Adjustment
|
Unamortized Loss
on Defined
Benefit Pension
Plans
|
Accumulated
Other
Comprehensive
Income (Loss)
|
||||||||||
|
Balance at September 27, 2013
|
$ | 23,789 | $ | (4,423 | ) | $ | 19,366 | |||||
|
Other comprehensive income before reclassifications
|
(5,500 | ) | (2,314 | ) | (7,814 | ) | ||||||
|
Amounts reclassified from accumulated other comprehensive income
|
135 | 341 | 476 | |||||||||
|
Tax effects
|
- | 750 | 750 | |||||||||
|
Balance at October 3, 2014
|
$ | 18,424 | $ | (5,646 | ) | $ | 12,778 | |||||
F-14
Earnings per Share (“EPS”)
Net income or loss per share of Class A common stock and Class B common stock is computed using the two-class method. Grants of restricted stock (whether vested or unvested) which receive non-forfeitable dividends are required to be included as part of the basic weighted average share calculation under the two-class method.
Holders of Class A common stock are entitled to cash dividends equal to 110% of all dividends declared and paid on each share of Class B common stock. The Company grants shares of unvested restricted stock in the form of Class A shares, which carry the same distribution rights as the Class A common stock described above. As such, the undistributed earnings for each period are allocated to each class of common stock based on the proportionate share of the amount of cash dividends that each such class is entitled to receive.
Basic EPS
Basic net income or loss per share is computed by dividing net income or loss allocated to Class A common stock and Class B common stock by the weighted-average number of shares of Class A common stock and Class B common stock outstanding, respectively. In periods with cumulative year to date net income and undistributed income, the undistributed income for each period is allocated to each class of common stock based on the proportionate share of the amount of cash dividends that each such class is entitled to receive. In periods where there is a cumulative year to date net loss or no undistributed income because distributions through dividends exceed net income, Class B shares are treated as anti-dilutive and, therefore, net losses are allocated equally on a per share basis among all participating securities.
For the years ended October 2, 2015, October 3, 2014 and September 27, 2013, basic income per share for Class A and Class B shares has been presented using the two class method as described above.
Diluted EPS
Diluted net income per share is computed by dividing allocated net income by the weighted-average number of common shares outstanding, adjusted for the effect of dilutive stock options, restricted stock units and non-vested restricted stock. Anti-dilutive stock options, restricted stock units and non-vested stock are excluded from the calculation of diluted EPS. The computation of diluted net income per share of Class A common stock assumes that Class B common stock is converted into Class A common stock. Therefore, diluted net income per share is the same for both Class A and Class B common shares. In periods where the Company reports a net loss, the effect of anti-dilutive stock options, restricted stock units and non-vested stock is excluded and diluted loss per share is equal to basic loss per share.
For the years ended October 2, 2015, October 3, 2014 and September 27, 2013, diluted net income per share reflects the effect of dilutive stock options and restricted stock units and assumes the conversion of Class B common stock into Class A common stock.
There were no stock options that could potentially dilute earnings per share in the future which were not included in the fully diluted computation because they would have been anti-dilutive for the years ended October 2, 2015, October 3, 2014 and September 27, 2013. Non-vested stock that could potentially dilute earnings per share in the future which were not included in the fully diluted computation because they would have been anti-dilutive totaled 214,027, 319,632 and 386,409 shares for the years ended October 2, 2015, October 3, 2014 and September 27, 2013, respectively.
The following table sets forth a reconciliation of net income to dilutive earnings used in the diluted earnings per common share calculations and the computation of basic and diluted earnings per common share:
F-15
|
2015
|
2014
|
2013
|
||||||||||
|
Net income
|
$ | 10,616 | $ | 9,123 | $ | 19,327 | ||||||
|
Less: Undistributed earnings reallocated to non-vested shareholders
|
(191 | ) | (304 | ) | (792 | ) | ||||||
|
Dilutive earnings
|
$ | 10,425 | $ | 8,819 | $ | 18,535 | ||||||
|
Weighted average common shares – Basic:
|
||||||||||||
|
Class A
|
8,515 | 8,420 | 8,305 | |||||||||
|
Class B
|
1,212 | 1,212 | 1,212 | |||||||||
|
Dilutive stock options and restricted stock units
|
- | 3 | 6 | |||||||||
|
Weighted average common shares - Dilutive
|
9,727 | 9,635 | 9,523 | |||||||||
|
Net income per common share – Basic:
|
||||||||||||
|
Class A
|
$ | 1.08 | $ | 0.93 | $ | 1.98 | ||||||
|
Class B
|
$ | 0.98 | $ | 0.84 | $ | 1.79 | ||||||
|
Net income per common share – Diluted:
|
||||||||||||
|
Class A
|
$ | 1.06 | $ | 0.90 | $ | 1.95 | ||||||
|
Class B
|
$ | 1.06 | $ | 0.90 | $ | 1.95 | ||||||
Stock-Based Compensation
Stock-based compensation cost is recorded for all option grants and awards of non-vested stock and restricted stock units based on their grant-date fair value. Stock-based compensation expense is recognized on a straight-line basis over the vesting period of each award. No stock options were granted in 2015, 2014 or 2013. See Note 10 of these Notes to Consolidated Financial Statements for information regarding the Company’s stock-based incentive plans, including stock options, non-vested stock, and employee stock purchase plans.
Income Taxes
The Company provides for income taxes currently payable and deferred income taxes resulting from temporary differences between financial statement income/loss and taxable income/loss. Accrued interest and penalties related to unrecognized tax benefits are recognized as a component of income tax expense. Deferred income tax assets and liabilities are determined based on the difference between the amounts reported in the financial statements and the tax basis of assets and liabilities, using enacted tax rates in effect in the years in which the differences are expected to reverse. Deferred income tax assets and liabilities are adjusted for the effects of changes in tax laws and rates on the date of enactment. A valuation allowance is established if it is more likely than not that some portion or all of a deferred income tax asset will not be realized. See Note 6 of these Notes to Consolidated Financial Statements for further discussion.
Employee Benefits
The Company and certain of its subsidiaries have various retirement and profit sharing plans. The Company does not have any significant foreign retirement plans. Pension obligations, which are generally based on compensation and years of service, are funded by payments to pension fund trustees. The Company’s policy is to annually fund the minimum amount required under the Employee Retirement Income Security Act of 1974 for plans subject thereto. Other retirement costs are funded at least annually. See Note 7 of these Notes to Consolidated Financial Statements for additional discussion.
Foreign Operations and Related Derivative Financial Instruments
The functional currencies of the Company’s foreign operations are the local currencies. Accordingly, assets and liabilities of foreign operations are translated into U.S. dollars at the rate of exchange existing at the end of the year. Results of operations are translated at monthly average exchange rates. Adjustments resulting from the translation of foreign currency financial statements are classified as “Accumulated other comprehensive income (loss),” a separate component of Shareholders’ equity.
Currency gains and losses are recognized when assets and liabilities of foreign operations, denominated in other than their local currency, are converted into the local currency of the entity. Additionally, currency gains and losses are recognized through the settlement of transactions denominated in other than the local currency. The Company recognized currency losses from transactions of $1,196 and $916 in 2015 and 2013, respectively, and currency gains from transactions of $427 in 2014, all of which were included in the “Other expense (income), net” line of the Company’s Consolidated Statements of Operations.
F-16
Because the Company operates internationally, it has exposure to market risk from movements in foreign currency exchange rates. Approximately 18% of the Company’s revenues for the year ended October 2, 2015 were denominated in currencies other than the U.S. dollar. Approximately 8% were denominated in euros and approximately 6% were denominated in Canadian dollars, with the remaining 4% denominated in various other foreign currencies. The Company may mitigate the impact on its operating results of a portion of the fluctuations in certain foreign currencies through the purchase of foreign currency swaps, forward contracts and options to hedge known commitments denominated in foreign currencies or borrowings in foreign currencies. In 2015 the Company did not use foreign currency forward contracts. The Company does not enter into foreign exchange contracts for trading or speculative purposes.
Revenue Recognition
The Company recognizes revenue when all of the following criteria have been met:
-
Persuasive evidence of an arrangement exists. Contracts, internet commerce agreements, and customer purchase orders are generally used to determine the existence of an arrangement.
-
All substantial risk of ownership transfers to the customer. Shipping documents and customer acceptance, when applicable, are used to verify delivery.
-
The fee is fixed or determinable. This is assessed based on the payment terms associated with the transaction and whether the sales price is subject to refund or adjustment.
-
Collectability is reasonably assured. Collectability is assessed based on the creditworthiness of the customer as determined by credit checks and analysis, as well as by the customer’s payment history.
Advertising & Promotions
The Company expenses substantially all costs related to the production of advertising the first time the advertising takes place. Cooperative promotional arrangements are accrued as related revenue is earned.
Advertising and promotions expense in 2015, 2014 and 2013 totaled $24,460, $22,135 and $22,902, respectively. These charges are included in “Marketing and selling expenses.” Capitalized advertising costs, included in Other current assets, totaled $1,049 and $1,156 at October 2, 2015 and October 3, 2014, respectively, and primarily included catalogs and costs of advertising which have not yet run for the first time.
Shipping and Handling Costs
Shipping and handling fees billed to customers are included in “Net sales.” Shipping and handling costs are included in “Marketing and selling expenses” and totaled $10,838, $10,675 and $10,436 for 2015, 2014 and 2013, respectively.
Research and Development
The Company expenses research and development costs as incurred except for costs of software development for new electronic products which are capitalized once technological feasibility is established and are included in Furniture, Fixtures and Equipment. The gross amount capitalized related to software development was $26,487, less accumulated amortization of $11,858, at October 2, 2015 and $23,350, less accumulated amortization of $9,324, at October 3, 2014. These costs are amortized over the expected life of the software of three to seven years. Amortization expense related to capitalized software in 2015, 2014 and 2013 was $2,535, $2,045 and $1,268, respectively, and is included in depreciation expense on plant, property and equipment.
F-17
Fair Values
The carrying amounts of cash, cash equivalents, accounts receivable, and accounts payable approximated fair value at October 2, 2015 and October 3, 2014 due to the short maturities of these instruments. During 2015, 2014 and 2013, the Company held investments in equity and debt securities that were carried at fair value. When indicators of impairment are present, the Company may be required to value certain long-lived assets such as property, plant, and equipment, and other intangibles at fair value.
Valuation Techniques
Rabbi Trust Assets
Rabbi trust assets, used to fund amounts the Company owes to certain officers and other employees under the Company’s non-qualified deferred compensation plan, are included in “Other assets,” and are classified as trading securities. These assets are comprised of marketable debt and equity securities that are marked to fair value based on unadjusted quoted prices in active markets.
Goodwill and Other Intangible Assets
In assessing the recoverability of the Company's goodwill and other intangible assets, the Company estimates the future discounted cash flows of the business segments to which the goodwill relates. When estimated future discounted cash flows are less than the carrying value of the net assets and related goodwill, an impairment test is performed to measure and recognize the amount of the impairment loss, if any. In determining estimated future cash flows, the Company makes assumptions regarding anticipated financial position, future earnings and other factors to determine the fair value of the respective assets.
See Note 2 of these Notes to Consolidated Financial Statements for disclosures regarding the fair value of long-term debt and Note 4 of these Notes to Consolidated Financial Statements for disclosures regarding fair value measurements.
New Accounting Pronouncements
In May 2014, the FASB issued a new standard on revenue recognition from contracts with customers. This standard supersedes nearly all existing revenue recognition guidance and involves a five-step approach to recognizing revenue based on individual performance obligations in a contract. The new standard will also require additional qualitative and quantitative disclosures about the Company’s contracts with customers, any significant judgments made in applying the revenue guidance, and the Company’s assets recognized from the costs to obtain or fulfill a contract. This guidance becomes effective for the Company at the beginning of its 2019 fiscal year. The Company is currently evaluating the impact the adoption of this guidance will have on its consolidated financial statements and its related disclosures.
In April 2015, the FASB issued ASU No. 2015-03, Interest - "Imputation of Interest (Subtopic 835-30): Simplifying the Presentation of Debt Issuance Costs." The guidance requires debt issuance costs related to a recognized debt liability be presented on the balance sheet as a direct deduction from the carrying amount of that debt liability, consistent with the presentation for debt discounts. The recognition and measurement guidance for debt issuance costs are not affected by the amendments in this ASU. In August 2015, the FASB issued ASU No. 2015-15, Interest-Imputation of Interest (Subtopic 835-30): Presentation and Subsequent Measurement of Debt Issuance Costs Associated with Line-of-Credit Arrangements - Amendments to SEC Paragraphs Pursuant to Staff Announcements at the June 2015 EITF Meeting. ASU 2015-15 amends Subtopic 835-30 to include that the SEC would not object to the deferral and presentation of debt issuance costs as an asset and subsequent amortization of debt issuance costs over the term of the line-of-credit arrangement, whether or not there are any outstanding borrowings on the line-of-credit arrangement. This guidance is effective for fiscal years and interim periods within those years beginning after December 15, 2015, and must be applied on a retrospective basis with early adoption permitted. The adoption is not expected to have a material impact on the Company’s Consolidated Financial Statements.
In July 2015, the FASB issued ASU No. 2015-12, "Plan Accounting—Defined Benefit Pension Plans (Topic 960), Defined Contribution Pension Plans (Topic 962) Health and Welfare Benefit Plans (Topic 965)". There are three parts to the ASU that aim to simplify the accounting and presentation of plan accounting. Part I of this ASU requires fully benefit-responsive investment contracts to be measured at contract value instead of the current fair value measurement. Part II of this ASU requires investments (both participant-directed and nonparticipant-directed investments) of employee benefit plans be grouped only by general type, eliminating the need to disaggregate the investments in multiple ways. Part III of this ASU provides a similar measurement date practical expedient for employee benefit plans as available in ASU No. 2015-04, which allows employers to measure defined benefit plan assets on a month-end date that is nearest to the year’s fiscal year-end when the fiscal period does not coincide with a month-end. Parts I and II of the new guidance should be applied on a retrospective basis. Part III of the new guidance should be applied on a prospective basis. This ASU is effective for fiscal years beginning after December 15, 2015, and for interim periods within those fiscal years. The adoption is not expected to have a material impact on the Company’s Consolidated Financial Statements.
F-18
In July 2015, the FASB issued ASU No. 2015-11, "Simplifying the Measurement of Inventory," which amends ASC 330, Inventory. This ASU simplifies the subsequent measurement of inventory by using only the lower of cost and net realizable value. This guidance is effective for fiscal years and interim periods within those years beginning after December 15, 2016, and must be applied on a retrospective basis with early adoption permitted. The adoption is not expected to have a material impact on the Company’s Consolidated Financial Statements.
In September 2015, the FASB issued ASU No. 2015-16, Business Combinations (Topic 805): "Simplifying the Accounting for Measurement-Period Adjustments," which eliminates the requirement for an acquirer in a business combination to account for measurement-period adjustments retrospectively. Under this ASU, acquirers must recognize measurement-period adjustments in the period in which they determine the amounts, including the effect on earnings of any amounts they would have recorded in previous periods if the accounting had been completed at the acquisition date. This guidance is effective for fiscal years beginning after December 15, 2016, with early adoption permitted. The Company does not anticipate the adoption of this standard will have a material impact on its Consolidated Financial Statements.
2 INDEBTEDNESS
Debt was comprised of the following at October 2, 2015 and October 3, 2014:
|
October 2
2015
|
October 3
2014
|
|||||||
|
Term loans
|
$ | 7,430 | $ | 7,781 | ||||
|
Revolvers
|
- | - | ||||||
|
Other
|
- | 10 | ||||||
|
Total debt
|
7,430 | 7,791 | ||||||
|
Less current portion of long term debt
|
368 | 360 | ||||||
|
Less short term debt
|
- | - | ||||||
|
Total long-term debt
|
$ | 7,062 | $ | 7,431 | ||||
Term Loans
The Company’s term loans have a maturity date of September 29, 2029. Each term loan requires monthly payments of principal and interest. Interest on the aggregate outstanding amount of the term loans is based on the prime rate plus an applicable margin. The interest rate in effect on the term loans was 5.25% at October 2, 2015 and October 3, 2014.
The term loans are guaranteed in part under the United States Department of Agriculture Rural Development program and are secured with a first priority lien on land, buildings, machinery and equipment of the Company’s domestic subsidiaries and a second priority lien on working capital and certain patents and trademarks of the Company and its subsidiaries. Any proceeds from the sale of secured property are first applied against the related term loans and then against the Revolvers (as defined below). The Company’s term loans include covenants related to its current ratio, debt to net worth ratio, fixed charge ratio, minimum net worth and capital expenditures.
F-19
The aggregate term loan borrowings are subject to a pre-payment penalty. The penalty is currently 4% of the pre-payment amount, and the penalty will decrease by 1% annually on the anniversary date of the effective date of the loan agreement.
Revolvers
On September 16, 2013, the Company and certain of its subsidiaries entered into a new credit facility with PNC Bank National Association and certain other lenders which terminated the Amended Revolving Credit and Security agreement with PNC Bank National Association and the other lenders named therein, dated as of November 16, 2010. The new credit facility consists of a Revolving Credit Agreement dated September 16, 2013 among the Company, certain of the Company’s subsidiaries, PNC Bank National Association, as lender and as administrative agent, and the other lenders named therein (the “Revolving Credit Agreement” or “Revolver”). The Revolver has an expiration date of September 16, 2018 and provides for borrowing of up to an aggregate principal amount not to exceed $90,000 with an accordion feature that gives the Company the option to increase the maximum seasonal financing availability subject to the conditions of the Revolving Credit Agreement and subject to the approval of the lenders. The Revolver imposes a seasonal borrowing limit such that borrowings under this facility may not exceed $60,000 from the period June 30th through October 31st of each year under the agreement. The Company had no borrowings against the Revolving Credit Facility as of October 2, 2015 or October 3, 2014.
The interest rate on the Revolver is based on LIBOR plus an applicable margin. The applicable margin resets each quarter and ranges from 1.25% to 2.00% and is dependent on the Company’s leverage ratio for the trailing twelve month period. The interest rate on the Revolver at October 2, 2015 and October 3, 2014 was approximately 1.4%.
The Revolver is secured with a first priority lien on working capital assets and certain patents and trademarks of the Company and its subsidiaries and a second priority lien on land, buildings, machinery and equipment of the Company’s domestic subsidiaries. Under the terms of the Revolver, the Company is required to comply with certain financial and non-financial covenants. The Revolving Credit Agreement limits asset or stock acquisitions to no more than $20,000 in the event that the Company’s consolidated leverage ratio is greater than 2.5 times. No limits are imposed if the Company’s consolidated leverage ratio is less than 2.5 times and the remaining borrowing availability under the Revolver is greater than $10,000 at the time of the acquisition. The Revolving Credit Agreement limits the amount of restricted payments (primarily dividends and repurchases of common stock) made during each fiscal year. The Company may declare, and pay, dividends in accordance with historical practices, but in no event may the aggregate amount of all dividends or repurchases of common stock exceed $10,000 in any fiscal year. The Revolving Credit Agreement restricts the Company’s ability to incur additional debt and includes maximum leverage ratio and minimum interest coverage ratio covenants.
Concurrent with the execution of the Revolving Credit Agreement described above, Johnson Outdoors Canada Inc. repaid and terminated its Amended Revolving Credit and Security Agreement with PNC Bank Canada Branch dated as of November 16, 2010.
Other Borrowings
The Company had no unsecured revolving credit facilities at its foreign subsidiaries as of October 2, 2015. The Company utilizes letters of credit primarily as security for the payment of future claims under its workers’ compensation insurance which totaled $684 and $691 at October 2, 2015 and October 3, 2014, respectively. The Company had no unsecured lines of credit as of October 2, 2015 or October 3, 2014.
Aggregate scheduled maturities of long-term debt as of October 2, 2015 were as follows:
|
Fiscal Year
|
||||
|
2016
|
$ | 368 | ||
|
2017
|
389 | |||
|
2018
|
410 | |||
|
2019
|
432 | |||
|
2020
|
455 | |||
|
Thereafter
|
5,376 | |||
|
Total
|
$ | 7,430 | ||
F-20
Interest paid was $754, $672 and $915 for 2015, 2014 and 2013, respectively.
The weighted average borrowing rate for short-term debt was approximately 1.4%, 1.4% and 2.5% for 2015, 2014 and 2013, respectively.
Based on the borrowing rates currently available to the Company for debt with similar terms and maturities, the fair value of the Company’s long-term debt approximated its carrying value as of October 2, 2015 and October 3, 2014. See Note 4 of these Notes to Consolidated Financial Statements for additional disclosures regarding the fair value.
Under the Company’s Revolving Credit Agreement, a change in control of the Company would constitute an event of default. A change in control would be deemed to have occurred if, among other events described in the terms of the Credit Agreement, a person or group other than the Company’s Chief Executive Officer, Helen P. Johnson-Leipold, members of her family and related entities (hereinafter the Johnson Family) became or obtain rights as a beneficial owner (as interpreted under the Securities Exchange Act of 1934) of a certain percentage of the outstanding capital stock of the Company, if the Johnson Family ceases to own (without lien or encumbrance) at least a certain percentage of the shares of capital stock of the Company with voting power or if the members of the Company’s Board of Directors as of the date of the Credit Agreement (together with any new directors elected to the Board who were also approved for appointment by the then serving directors) cease for any reason to constitute a majority of the Company’s Board of Directors. At November 27, 2015, the Johnson Family held 3,831,731 shares or approximately 44% of the Class A common stock, 1,211,196 shares or approximately 100% of the Class B common stock and approximately 77% of the voting power of both classes of common stock taken as a whole.
3 DERIVATIVE INSTRUMENTS AND HEDGING ACTIVITIES
The following disclosures describe the Company’s objectives in using derivative instruments, the business purpose or context for using derivative instruments, and how the Company believes the use of derivative instruments helps achieve the stated objectives. In addition, the following disclosures describe the effects of the Company’s use of derivative instruments and hedging activities on its financial statements. See Note 4 of these Notes to Consolidated Financial Statements for disclosures regarding the fair value and effects of changes in the fair value of derivative instruments.
Foreign Exchange Risk
The Company has significant foreign operations, for which the functional currencies are denominated primarily in euros, Swiss francs, Hong Kong dollars, Japanese yen and Canadian dollars. As the values of the currencies of the foreign countries in which the Company has operations increase or decrease relative to the U.S. dollar, the sales, expenses, profits, losses, assets and liabilities of the Company’s foreign operations, as reported in the Company’s consolidated financial statements, increase or decrease, accordingly. Approximately 18% of the Company’s revenues for the fiscal year ended October 2, 2015 were denominated in currencies other than the U.S. dollar. Approximately 8% were denominated in euros and approximately 6% were denominated in Canadian dollars, with the remaining 4% denominated in various other foreign currencies. Changes in foreign currency exchange rates can cause unexpected financial losses or cash flow needs.
The Company may mitigate the impact on its operating results of a portion of the fluctuations in certain foreign currencies through the use of foreign currency forward contracts. Foreign currency forward contracts enable the Company to lock in the foreign currency exchange rate for a fixed amount of currency to be paid or received on a specified date in the future. The Company may use such foreign currency forward contracts to mitigate the risk associated with changes in foreign currency exchange rates on financial instruments and known commitments denominated in foreign currencies. As of October 2, 2015 and October 3, 2014, the Company held no foreign currency forward contracts.
Interest Rate Risk
F-21
The Company operates in a seasonal business and experiences significant fluctuations in operating cash flow as working capital needs increase in advance of the Company’s primary selling and cash generation season, and decline as accounts receivable are collected and cash is accumulated or debt is repaid. The Company’s goal in managing its interest rate risk is to maintain a mix of floating rate and fixed rate debt such that permanent non-equity capital needs are largely funded with long term fixed rate debt and seasonal working capital needs are funded with short term floating rate debt.
The Company held no interest rate swap contracts in 2015 or 2014. As of October 2, 2015, the Company was unhedged with respect to interest rate risk on its floating rate debt.
The following discloses the location of the Company’s loss reclassified from Accumulated Other Comprehensive Income (“AOCI”) into net income related to previously held derivative instruments during the years ended October 2, 2015, October 3, 2014, and September 27, 2013:
|
Loss reclassified from AOCI into:
|
2015
|
2014
|
2013
|
|||||||||
|
Interest expense
|
$ | - | $ | - | $ | 138 | ||||||
The following discloses the location and amount of income or loss recognized for changes in the fair value of derivative instruments not designated as hedging instruments for the years ended October 2, 2015, October 3, 2014 and September 27, 2013:
|
Location of loss (gain)
|
|||||||||||||
|
Derivatives not designated as
|
recognized in Statement
|
||||||||||||
|
hedging instruments
|
of Operations
|
2015
|
2014
|
2013
|
|||||||||
|
Foreign exchange forward contract
|
Other expense (income), net
|
$ | - | $ | - | $ | 13 | ||||||
4 FAIR VALUE MEASUREMENTS
Fair value is defined as the exchange price that would be received for an asset or paid to transfer a liability (an exit price) in the principal or most advantageous market for the asset or liability in an orderly transaction between market participants on the measurement date. Valuation techniques used to measure fair value must maximize the use of observable inputs and minimize the use of unobservable inputs. A fair value hierarchy has been established based on three levels of inputs, of which the first two are considered observable and the last unobservable.
-
Level 1 - Quoted prices in active markets for identical assets or liabilities. These are typically obtained from real-time quotes for transactions in active exchange markets involving identical assets.
-
Level 2 - Inputs, other than quoted prices included within Level 1, which are observable for the asset or liability, either directly or indirectly. These are typically obtained from readily-available pricing sources for comparable instruments.
-
Level 3 - Unobservable inputs, where there is little or no market activity for the asset or liability. These inputs reflect the reporting entity’s own assumptions of the data that market participants would use in pricing the asset or liability, based on the best information available in the circumstances.
F-22
|
The following table summarizes the Company's financial assets measured at fair value as of October 2, 2015:
|
||||||||||||||||
|
Level 1
|
Level 2
|
Level 3
|
Total
|
|||||||||||||
|
Assets:
|
||||||||||||||||
|
Rabbi trust assets
|
$ | 11,441 | $ | - | $ | - | $ | 11,441 | ||||||||
|
The following table summarizes the Company's financial assets measured at fair value as of October 3, 2014:
|
||||||||||||||||
|
Level 1
|
Level 2
|
Level 3
|
Total
|
|||||||||||||
|
Assets:
|
||||||||||||||||
|
Rabbi trust assets
|
$ | 10,933 | $ | - | $ | - | $ | 10,933 | ||||||||
Rabbi trust assets are classified as trading securities and are comprised of marketable debt and equity securities that are marked to fair value based on unadjusted quoted prices in active markets. The rabbi trust assets are used to fund amounts the Company owes to certain officers and other employees under the Company’s non-qualified deferred compensation plan. The mark-to-market adjustments are recorded in “Other expense (income), net” in the accompanying Consolidated Statements of Operations.
|
The effect of changes in the fair value of financial instruments on the Consolidated Statements of Operations for the years ended October 2, 2015, October 3, 2014 and September 27, 2013, was:
|
|||||||||||||
|
Location of loss (income) recognized in Statement of Operations
|
2015
|
2014
|
2013
|
||||||||||
|
Rabbi trust assets
|
Other expense (income), net
|
$ | 638 | $ | (703 | ) | $ | (1,013 | ) | ||||
|
Foreign currency forward contracts
|
Other expense (income), net
|
- | - | 13 | |||||||||
Certain assets and liabilities are measured at fair value on a non-recurring basis in periods subsequent to their initial recognition. During 2014, the Company recorded a $2,000 impairment charge in “Goodwill and other intangible assets impairment” on a trademark held by the Outdoor Equipment business reducing its fair value to $3,400. The Company also recorded an impairment charge on goodwill held by the Outdoor Equipment business during 2014. A $6,475 charge was included in “Goodwill and other intangible assets impairment” related to this impairment during 2014. See further discussion of these impairment charges at Note 17 of these Notes to Consolidated Financial Statements.
The following table summarizes the Company’s assets measured at fair value on a non-recurring basis as of October 3, 2014 and the losses recognized as a result of this measurement in 2014. The assets and losses were all included in the Outdoor Equipment segment.
|
Level 1
|
Level 2
|
Level 3
|
Losses incurred
|
|||||||||||||
|
Goodwill
|
$ | - | $ | - | $ | - | $ | 6,475 | ||||||||
|
Tradename
|
- | - | 3,400 | 2,000 | ||||||||||||
No assets or liabilities were measured at fair value on a non-recurring basis in 2015.
5 LEASES AND OTHER COMMITMENTS
The Company leases certain facilities and machinery and equipment under long-term, non-cancelable operating leases. Future minimum rental commitments under non-cancelable operating leases with an initial lease term in excess of one year at October 2, 2015 were as follows:
F-23
|
|
||||||||
|
Year
|
Related parties included
in total
|
Total
|
||||||
|
2016
|
$ | 853 | $ | 5,868 | ||||
|
2017
|
170 | 4,468 | ||||||
|
2018
|
3,736 | |||||||
|
2019
|
3,535 | |||||||
|
2020
|
3,569 | |||||||
|
Thereafter
|
6,682 | |||||||
Rental expense under all leases was approximately $6,933, $8,360 and $8,627 for 2015, 2014 and 2013, respectively. Rent expense to related parties was $873, $970 and $1,127 for 2015, 2014 and 2013, respectively.
6 INCOME TAXES
The U.S. and foreign income before income taxes for the respective years consisted of the following:
|
2015
|
2014
|
2013
|
||||||||||
|
United States
|
$ | 11,886 | $ | 11,592 | $ | 19,885 | ||||||
|
Foreign
|
3,867 | 5,830 | 4,775 | |||||||||
| $ | 15,753 | $ | 17,422 | $ | 24,660 | |||||||
Income tax expense for the respective years consisted of the following:
|
2015
|
2014
|
2013
|
||||||||||
|
Current:
|
||||||||||||
|
Federal
|
$ | 4,916 | $ | 3,888 | $ | 2,832 | ||||||
|
State
|
882 | 403 | 470 | |||||||||
|
Foreign
|
1,469 | 1,886 | 1,437 | |||||||||
|
Deferred
|
(2,130 | ) | 2,122 | 594 | ||||||||
| $ | 5,137 | $ | 8,299 | $ | 5,333 | |||||||
The tax effects of temporary differences that give rise to deferred tax assets and deferred tax liabilities at the end of the respective years are presented below:
|
2015
|
2014
|
|||||||
|
Deferred tax assets:
|
||||||||
|
Inventories
|
$ | 2,495 | $ | 1,809 | ||||
|
Compensation
|
12,312 | 10,362 | ||||||
|
Tax credit carryforwards
|
4,888 | 3,462 | ||||||
|
Net operating loss carryforwards
|
6,360 | 7,333 | ||||||
|
Other
|
5,532 | 4,635 | ||||||
|
Total gross deferred tax assets
|
31,587 | 27,601 | ||||||
|
Less valuation allowance
|
9,786 | 8,734 | ||||||
|
Deferred tax assets
|
21,801 | 18,867 | ||||||
|
Deferred tax liabilities:
|
||||||||
|
Goodwill and other intangibles
|
1,185 | 989 | ||||||
|
Depreciation and amortization
|
5,411 | 4,795 | ||||||
|
Foreign statutory reserves
|
520 | 503 | ||||||
|
Net deferred tax assets
|
$ | 14,685 | $ | 12,580 | ||||
F-24
The net deferred tax assets recorded in the accompanying Consolidated Balance Sheet as of the years ended October 2, 2015 and October 3, 2014 were as follows:
|
2015
|
2014
|
|||||||
|
Current assets
|
$ | 10,649 | $ | 8,360 | ||||
|
Non-current assets
|
5,218 | 5,353 | ||||||
|
Non-current liabilities
|
1,182 | 1,133 | ||||||
|
Net deferred tax assets
|
$ | 14,685 | $ | 12,580 | ||||
The significant differences between the statutory federal tax rate and the effective income tax rates for the Company for the respective years shown below were as follows:
|
2015
|
2014
|
2013
|
||||||||||
|
Statutory U.S. federal income tax rate
|
35.0 | % | 35.0 | % | 35.0 | % | ||||||
|
Foreign rate differential
|
(2.4 | ) | (0.5 | ) | (4.1 | ) | ||||||
|
State income tax, net of federal benefit
|
2.4 | 4.4 | 4.5 | |||||||||
|
Tax credit
|
(18.8 | ) | (6.3 | ) | (3.1 | ) | ||||||
|
Deferred tax asset valuation allowance
|
10.0 | (4.3 | ) | (11.5 | ) | |||||||
|
Unrecognized tax benefit
|
1.7 | 5.4 | - | |||||||||
|
Goodwill impairment
|
0.0 | 10.4 | - | |||||||||
|
Other
|
4.7 | 3.6 | 0.8 | |||||||||
| 32.6 | % | 47.7 | % | 21.6 | % | |||||||
The Company’s net operating loss carryforwards and their expirations as of October 2, 2015 were as follows:
|
State
|
Foreign
|
Total
|
||||||||||||
|
Year of expiration
|
||||||||||||||
| 2016-2020 | $ | 1,357 | $ | 2,263 | $ | 3,620 | ||||||||
| 2021-2025 | 3,232 | 3,298 | 6,530 | |||||||||||
| 2026-2030 | 30,149 | - | 30,149 | |||||||||||
| 2031-2035 | 1,693 | - | 1,693 | |||||||||||
|
Indefinite
|
- | 7,150 | 7,150 | |||||||||||
|
Total
|
$ | 36,431 | $ | 12,711 | $ | 49,142 | ||||||||
The Company has tax credit carryforwards comprised of state credits as shown in the table below.
F-25
|
State
|
Federal
|
Total
|
||||||||||||
|
Year of expiration
|
||||||||||||||
| 2016-2020 | $ | 1,408 | $ | - | $ | 1,408 | ||||||||
| 2021-2025 | 1,851 | - | 1,851 | |||||||||||
| 2026-2030 | 1,058 | - | 1,058 | |||||||||||
| 2031-2035 | 478 | - | 478 | |||||||||||
|
Indefinite
|
- | 93 | 93 | |||||||||||
|
Total
|
$ | 4,795 | $ | 93 | $ | 4,888 | ||||||||
Under generally accepted accounting principles, the Company considers at each reporting period all available evidence, both positive and negative, to determine whether, based on the weight of that evidence, a valuation allowance is needed to reduce its deferred tax asset to an amount that is more likely than not to be realized. The determination of the need for a valuation allowance for the deferred tax assets is dependent upon management’s evaluation of both positive and negative evidence. Positive evidence includes the probability of achieving forecasted future taxable income, applicable tax strategies and assessments of the current and future economic and business conditions. Negative evidence includes a jurisdiction’s cumulative losses and expiring tax carryforwards.
The negative impact of the valuation allowance in 2015 was primarily the result of more likely than not realizing a significant portion of the U.S. state deferred tax assets. In the fourth quarter of 2015, the Company reached the conclusion that it was appropriate to (1) release the valuation allowance against the Italian deferred tax assets due to the sustained positive operating performance of its Italy operations and (2) setup a valuation allowance against the deferred tax assets in Australia and Switzerland due to continued negative operating performance in both of these jurisdictions.
The positive impact of the valuation allowance in fiscal 2014 of a tax benefit was primarily the result of earnings in Italy, Netherlands, Spain and United Kingdom offsetting operating losses in France, Japan and New Zealand. The Company believed at that time that the negative evidence continued to outweigh the positive evidence and, as such, the valuation allowance during fiscal 2014 remained in place.
For 2013, the positive impact of the valuation allowance on tax expense was primarily the result of the expected usage of foreign tax credits, offset in part by increases in foreign valuation allowances. Operating losses in France, Netherlands, New Zealand and the United Kingdom were partially offset by income in Italy, Spain and Japan.
Taxes paid were $2,269, $6,581 and $2,399 for 2015, 2014 and 2013, respectively.
In accordance with its accounting policy, the Company recognizes accrued interest and penalties related to unrecognized tax benefits as a component of income tax expense. The total accrued interest and penalties with respect to income taxes was approximately $787 and $778 for the years ended October 2, 2015 and October 3, 2014, respectively. Interest and penalties of $148, $186 and ($21) were recorded as a component of income tax expense (benefit) in the accompanying Consolidated Statements of Operations during fiscal years 2015, 2014 and 2013, respectively.
A reconciliation of the beginning and ending amount of unrecognized tax benefits for the last three fiscal years was as follows:
F-26
|
Balance at September 28, 2012
|
$ | 1,900 | ||
|
Settlement
|
(186 | ) | ||
|
Lapse of statute of limitations
|
(214 | ) | ||
|
Gross increases - tax positions in period
|
655 | |||
|
Balance at September 27, 2013
|
$ | 2,155 | ||
|
Settlement
|
- | |||
|
Lapse of statute of limitations
|
(161 | ) | ||
|
Gross increases - tax positions in period
|
1,097 | |||
|
Balance at October 3, 2014
|
$ | 3,091 | ||
|
Settlement
|
(103 | ) | ||
|
Lapse of statute of limitations
|
(329 | ) | ||
|
Gross increases - tax positions in period
|
698 | |||
|
Balance at October 2, 2015
|
$ | 3,357 | ||
The Company has not provided additional U.S. income taxes on $104,481 of undistributed earnings of consolidated foreign subsidiaries included in shareholders’ equity attributable to the Company. Such earnings could become taxable upon the sale or liquidation of these foreign subsidiaries or upon dividend repatriation. The Company’s intent is for such earnings to be reinvested by the subsidiaries or to be repatriated only when it would be tax effective through the utilization of foreign tax credits. It is not practicable to estimate the amount of unrecognized withholding taxes and deferred tax liability on such earnings. As of October 2, 2015, the Company held approximately $55,492 of cash and cash equivalents in foreign jurisdictions.
The Company is currently undergoing examinations in Italy and Germany. The amount of unrecognized tax benefits recognized within the next twelve months may decrease due to expiration of the statute of limitations for certain years in various jurisdictions. However, it is possible that a jurisdiction may open an audit prior to the statute expiring or one of the aforementioned audits may result in adjustments to the Company’s tax filings. At this time, an estimate of the range of the reasonably possible change cannot be made.
The Company files income tax returns, including returns for its subsidiaries, with federal, state, local and foreign taxing jurisdictions. The following tax years remain subject to examination by the respective major tax jurisdictions:
|
Jurisdiction
|
Fiscal Years
|
|
United States
|
2012-2015
|
|
Canada
|
2011-2015
|
|
France
|
2011-2015
|
|
Germany
|
2010-2015
|
|
Italy
|
2010-2015
|
|
Japan
|
2012-2015
|
|
Switzerland
|
2005-2015
|
7 EMPLOYEE BENEFITS
The Company has non-contributory defined benefit pension plans covering certain U.S. employees. Retirement benefits are generally provided based on employees’ years of service and average earnings. Normal retirement age is 65, with provisions for earlier retirement. The Company elected to freeze its U.S. defined benefit pension plans as of September 30, 2009 and, as a result, there are no benefit accruals related to service performed after that date.
The financial position of the Company’s non-contributory defined benefit plans as of fiscal year end 2015 and 2014 was as follows:
F-27
|
2015
|
2014
|
|||||||
|
Projected benefit obligation:
|
||||||||
|
Projected benefit obligation, beginning of year
|
$ | 25,301 | $ | 22,051 | ||||
|
Service cost
|
- | - | ||||||
|
Interest cost
|
1,108 | 1,078 | ||||||
|
Actuarial loss
|
684 | 3,012 | ||||||
|
Benefits paid
|
(881 | ) | (840 | ) | ||||
|
Projected benefit obligation, end of year
|
26,212 | 25,301 | ||||||
|
Fair value of plan assets:
|
||||||||
|
Fair value of plan assets, beginning of year
|
17,551 | 15,864 | ||||||
|
Actual (loss) gain on plan assets
|
(252 | ) | 1,795 | |||||
|
Company contributions
|
602 | 732 | ||||||
|
Benefits paid
|
(881 | ) | (840 | ) | ||||
|
Fair value of plan assets, end of year
|
17,020 | 17,551 | ||||||
|
Funded status of the plans
|
(9,192 | ) | (7,750 | ) | ||||
|
Amounts recognized in the Consolidated Balance Sheets consist of:
|
||||||||
|
Current pension liabilities
|
192 | 189 | ||||||
|
Non-current pension liabilities
|
9,000 | 7,561 | ||||||
|
Accumulated other comprehensive loss
|
(8,493 | ) | (6,981 | ) | ||||
|
Components of accumulated other comprehensive loss:
|
||||||||
|
Net actuarial loss
|
(8,493 | ) | (6,981 | ) | ||||
|
Accumulated other comprehensive loss
|
$ | (8,493 | ) | $ | (6,981 | ) | ||
Net periodic benefit cost for the non-contributory defined benefit pension plans for the respective years included the following pre-tax amounts:
|
2015
|
2014
|
2013
|
||||||||||
|
Interest cost
|
$ | 1,108 | $ | 1,078 | $ | 997 | ||||||
|
Expected return on plan assets
|
(1,197 | ) | (1,097 | ) | (977 | ) | ||||||
|
Amortization of unrecognized net actuarial loss
|
622 | 341 | 666 | |||||||||
|
Net periodic pension cost
|
533 | 322 | 686 | |||||||||
|
Other changes in benefit obligations recognized in other comprehensive income (loss), ("OCI"):
|
||||||||||||
|
Net actuarial loss (gain)
|
1,511 | 1,974 | (5,199 | ) | ||||||||
|
Total recognized in net periodic pension cost and OCI
|
$ | 2,044 | $ | 2,296 | $ | (4,513 | ) | |||||
The Company expects to recognize $506 of unrecognized loss amortization as a component of net periodic benefit cost in 2016. This amount is included in accumulated other comprehensive income as of October 2, 2015.
At October 2, 2015, the aggregate accumulated benefit obligation and aggregate fair value of plan assets for plans with benefit obligations in excess of plan assets was $26,212 and $17,020, respectively, and there were no plans with plan assets in excess of benefit obligations. At October 3, 2014, the aggregate accumulated benefit obligation and aggregate fair value of plan assets for plans with benefit obligations in excess of plan assets was $25,301 and $17,551, respectively, and there were no plans with plan assets in excess of benefit obligations.
The Company anticipates making contributions to the defined benefit pension plans of $476 through September 30, 2016.
F-28
Estimated benefit payments from the Company’s defined benefit plans to participants for each of the next five years and the five years thereafter are as follows:
|
2016
|
$ | 1,025 | ||
|
2017
|
1,034 | |||
|
2018
|
1,083 | |||
|
2019
|
1,123 | |||
|
2020
|
1,178 | |||
|
Five years thereafter
|
6,368 | |||
Actuarial assumptions used to determine the projected benefit obligation and net periodic pension cost as of the following fiscal years were as follows:
|
Projected Benefit Obligation
|
Net Periodic Pension Cost
|
|||||||
|
2015
|
2014
|
2013
|
2015
|
2014
|
2013
|
|||
|
Discount rate
|
4.35%
|
4.25%
|
5.00%
|
4.25%
|
5.00%
|
4.00%
|
||
|
Long-term rate of return
|
N/A
|
N/A
|
N/A
|
7.50%
|
7.50%
|
7.50%
|
||
|
Average salary increase rate
|
N/A
|
N/A
|
N/A
|
N/A
|
N/A
|
N/A
|
||
The change in discount rates in 2015 resulted in an actuarial gain during 2015 of approximately $390. The change in discount rates in 2014 resulted in actuarial losses during 2014 of approximately $2,640. The change in discount rates in 2013 resulted in an actuarial gain during 2013 of approximately $3,500. The remainder of the actuarial gains or losses for each of the three years was related to adjustments to mortality tables and other modifications to actuarial assumptions.
To determine the discount rate assumption used in the Company’s pension valuation, the Company identified a benefit payout stream based on the demographics of the pension plans and constructed a hypothetical bond portfolio using high-quality corporate bonds with cash flows that matched that benefit payout stream. A yield curve was calculated based on this hypothetical portfolio which was used for the discount rate determination.
The Company determines the long-term rate of return assumption for plan assets by using the historical asset returns for various investment asset classes and adjusting them to reflect future expectations. The expected asset class returns are weighted by the targeted asset allocations, resulting in a weighted average return which is rounded to the nearest quarter percent.
The Company uses measurement dates of October 1 to determine pension expenses for each year and the last day of the fiscal year to determine the fair value of the pension assets.
The Company’s pension plans’ weighted average asset allocations at October 2, 2015 and October 3, 2014, by asset category were as follows:
|
2015
|
2014
|
||
|
Equity securities
|
74%
|
74%
|
|
|
Fixed income securities
|
25%
|
24%
|
|
|
Other securities
|
1%
|
2%
|
|
|
100%
|
100%
|
||
The Company’s primary investment objective for the plans’ assets is to maximize the probability of meeting the plans’ actuarial target rate of return of 7.5%, with a secondary goal of returning 4% above the rate of inflation. These return objectives are targeted while simultaneously striving to minimize risk of loss to the plans’ assets. The investment horizon over which the investment objectives are expected to be met is a full market cycle or five years, whichever is greater.
F-29
The Company’s investment strategy for the plans is to invest in a diversified portfolio that will generate average long-term returns commensurate with the aforementioned objectives while minimizing risk.
The following table summarizes the Company’s pension plan assets measured at fair value as of October 2, 2015:
|
Level 1
|
Level 2
|
Level 3
|
Total
|
|||||||||||||
|
Description:
|
||||||||||||||||
|
Mutual fund
|
$ | 16,821 | $ | - | $ | - | $ | 16,821 | ||||||||
|
Money market funds
|
44 | - | - | 44 | ||||||||||||
|
Group annuity contract
|
- | - | 155 | 155 | ||||||||||||
|
Total
|
$ | 16,865 | $ | - | $ | 155 | $ | 17,020 | ||||||||
The following table summarizes the Company’s pension plan assets measured at fair value as of October 3, 2014:
|
Level 1
|
Level 2
|
Level 3
|
Total
|
|||||||||||||
|
Description:
|
||||||||||||||||
|
Mutual fund
|
$ | 17,299 | $ | - | $ | - | $ | 17,299 | ||||||||
|
Money market funds
|
36 | - | - | 36 | ||||||||||||
|
Group annuity contract
|
- | - | 216 | 216 | ||||||||||||
|
Total
|
$ | 17,335 | $ | - | $ | 216 | $ | 17,551 | ||||||||
The tables below set forth a summary of changes in fair value of the Company’s Level 3 pension plan assets for the years ended October 2, 2015 and October 3, 2014:
|
2015
|
2014
|
|||||||
|
Level 3 assets, beginning of year
|
$ | 216 | $ | 270 | ||||
|
Purchases
|
3 | 7 | ||||||
|
Unrealized loss
|
(10 | ) | (15 | ) | ||||
|
Sales
|
(54 | ) | (46 | ) | ||||
|
Level 3 assets, end of year
|
$ | 155 | $ | 216 | ||||
The fair values of the money market fund and mutual fund assets were derived from quoted market prices as substantially all of these instruments have active markets. The fair value of the group annuity contract was derived using a discounted cash flow model with inputs based on current yields of similar instruments with comparable durations. The asset allocation of the mutual fund is a U.S. large-cap blend based on a moderate allocation style, generally investing approximately 70% to 75% in equity securities and the remainder in fixed income securities. The annuity contract consists of high quality bonds.
The Company also has a non-qualified deferred compensation plan that provides certain officers and employees the ability to defer a portion of their compensation until a later date. The deferred amounts and earnings thereon are payable to participants, or designated beneficiaries, at specified future dates upon retirement, death or termination of employment from the Company. The deferred compensation liability, which is classified as Other liabilities on our accompanying Consolidated Balance Sheets, was approximately $11,445 and $10,938 as of October 2, 2015 and October 3, 2014, respectively.
F-30
A majority of the Company’s full-time employees are covered by defined contribution programs. Expenses attributable to the defined contribution programs were approximately $1,093, $1,061 and $931 for 2015, 2014 and 2013, respectively.
8 PREFERRED STOCK
The Company is authorized to issue 1,000,000 shares of preferred stock in various classes and series, of which there are none currently issued and none outstanding.
9 COMMON STOCK
The number of authorized and outstanding shares of each class of the Company's common stock at the end of the respective years was as follows:
|
2015
|
2014
|
|||||||
|
Class A, $0.05 par value:
|
||||||||
|
Authorized
|
20,000,000 | 20,000,000 | ||||||
|
Outstanding
|
8,770,612 | 8,769,426 | ||||||
|
Class B, $0.05 par value:
|
||||||||
|
Authorized
|
3,000,000 | 3,000,000 | ||||||
|
Outstanding
|
1,212,382 | 1,212,382 | ||||||
Holders of Class A common stock are entitled to elect 25% of the members of the Company’s Board of Directors and holders of Class B common stock are entitled to elect the remaining directors. With respect to matters other than the election of directors or any matters for which class voting is required by law, holders of Class A common stock are entitled to one vote per share while holders of Class B common stock are entitled to ten votes per share. If any dividends (other than dividends paid in shares of the Company’s stock) are paid by the Company on its common stock, a dividend would be paid on each share of Class A common stock equal to 110% of the amount paid on each share of Class B common stock. Each share of Class B common stock is convertible at any time into one share of Class A common stock. During 2015 and 2014, there were 0 and 38 shares of Class B common stock converted into Class A common stock, respectively.
10 STOCK-BASED COMPENSATION AND STOCK OWNERSHIP PLANS
The Company’s current stock ownership plans provide for issuance of options to acquire shares of Class A common stock by key executives and non-employee directors. Current plans also allow for issuance of shares of restricted stock, restricted stock units or stock appreciation rights in lieu of options.
Under the Company’s 2010 Long-Term Stock Incentive Plan and the 2012 Non-Employee Director Stock Ownership Plan there were 685,138 shares of the Company’s Class A common stock available for grant to key executives and non-employee directors at October 2, 2015. Shares issued pursuant to the exercise of stock options or grants of restricted stock are typically issued first out of treasury stock to the extent that treasury shares are available.
The Company recognized tax benefits from the exercise of stock options and the vesting of restricted stock of $482, $493 and $572 for 2015, 2014 and 2013, respectively. These amounts were recorded as increases in additional paid-in capital on the consolidated balance sheets and as cash from financing activities on the consolidated statements of cash flows.
Stock Options
All stock options have been granted at a price not less than fair market value at the date of grant and are currently exercisable. Stock options generally have a term of 10 years.
All of the Company’s stock options outstanding are fully vested, with no further compensation expense to be recorded. There were no grants of stock options in 2015, 2014 or 2013.
F-31
A summary of stock option activity related to the Company’s plans is shown below.
|
Shares
|
Weighted Average Exercise Price
|
Aggregate Intrinsic Value
|
Weighted
Average
Remaining
Contractual
Term (Years)
|
|||||||||||||
|
Outstanding and exercisable at September 27, 2013
|
15,066 | $ | 18.16 | |||||||||||||
|
Exercised
|
(3,900 | ) | 19.88 | |||||||||||||
|
Cancelled
|
(1,950 | ) | 19.88 | |||||||||||||
|
Outstanding and exercisable at October 3, 2014
|
9,216 | 17.07 | ||||||||||||||
|
Exercised
|
(9,216 | ) | 17.07 | |||||||||||||
|
Outstanding and exercisable at October 2, 2015
|
- | - | $ | - | - | |||||||||||
The intrinsic values of the stock received upon exercise of such options at their date of exercise during 2015, 2014 and 2013 were $221, $96 and $171, respectively.
The Company received cash proceeds from stock option exercises totaling $118, $78 and $86 for the years ending October 2, 2015, October 3, 2014 and September 27, 2013, respectively.
Non-Vested Stock
All shares of non-vested stock awarded by the Company have been granted at their fair market value on the date of grant and vest within five years after the grant date. The fair value at date of grant is based on the number of shares granted and the average of the Company’s high and low Class A common stock price on the date of grant or, if the Company’s shares did not trade on the date of grant, the average of the Company’s high and low Class A common stock price on the last preceding date on which the Company’s shares traded.
A summary of non-vested stock activity for the two year period ended October 2, 2015 related to the Company’s stock ownership plans is as follows:
|
Weighted Average
|
||||||||
|
Shares
|
Grant Price
|
|||||||
|
Non-vested stock at September 27, 2013
|
386,409 | $ | 13.78 | |||||
|
Non-vested stock grants
|
47,934 | 27.70 | ||||||
|
Restricted stock vested
|
(114,711 | ) | 10.32 | |||||
|
Non-vested stock at October 3, 2014
|
319,632 | 17.10 | ||||||
|
Non-vested stock grants
|
38,222 | 30.05 | ||||||
|
Non-vested stock forfeited
|
(25,364 | ) | 21.27 | |||||
|
Restricted stock vested
|
(118,463 | ) | 12.57 | |||||
|
Non-vested stock at October 2, 2015
|
214,027 | $ | 21.43 | |||||
Non-vested stock grantees may elect to reimburse the Company for withholding taxes due as a result of the vesting of shares by tendering a portion of the vested shares back to the Company. Shares tendered back to the Company were 30,353 and 24,719 during 2015 and 2014, respectively. The fair value of restricted stock vested during 2015, 2014 and 2013 was approximately $3,294, $3,123 and $3,607, respectively. The weighted average grant date fair value for non-vested stock issued in 2015 and 2014 was $30.05 and $27.70, respectively.
Stock compensation expense, net of forfeitures, related to non-vested stock was $1,287, $1,523 and $1,400 during 2015, 2014 and 2013, respectively. The tax benefit recognized during 2015, 2014 and 2013 related to stock based compensation was $598, $641 and $532, respectively. Unrecognized compensation cost related to non-vested stock as of October 2, 2015 was $1,431, which amount will be amortized to expense through November 2018 or adjusted for changes in future estimated or actual forfeitures.
F-32
Restricted Stock Units
All restricted stock units awarded by the Company during fiscal 2015 and in prior years have been granted at their fair market value on the date of grant and vest on the one year anniversary of the grant date. The fair value at date of grant is based on the number of units granted and the average of the Company’s high and low Class A common stock trading price on the date of grant or, if the Company’s shares did not trade on the date of grant, the average of the Company’s high and low Class A common stock trading price on the last preceding date on which the Company’s shares traded.
The Company issued 7,336, 10,792 and 6,600 restricted stock units at a weighted average grant date fair value of $33.40, $22.71 and $22.73 for the years ended October 2, 2015, October 3, 2014 and September 27, 2013, respectively.
Stock compensation expense, net of forfeitures, related to restricted stock units was $286, $165 and $88 for the years ended October 2, 2015, October 3, 2014 and September 27, 2013, respectively. Unrecognized compensation cost related to non-vested restricted stock units as of October 2, 2015 was $102, which amount will be amortized to expense through February 2016 or adjusted for changes in future estimated or actual forfeitures.
Employee Stock Purchase Plan
The 2009 Employees’ Stock Purchase Plan (the “Purchase Plan”) provides for the issuance of shares of Class A common stock at a purchase price of not less than 85% of the fair market value of such shares on the date of grant or at the end of the offering period, whichever is lower.
The Company issued 8,062, 15,969 and 9,562 shares of Class A common stock under the Purchase Plan during the years 2015, 2014 and 2013, respectively, and recognized expense of $33, $57 and $41 in 2015, 2014 and 2013, respectively.
11 RELATED PARTY TRANSACTIONS
The Company conducts transactions with certain related parties including organizations controlled by the Johnson Family and other related parties. These transactions include consulting services, aviation services, office rental, and certain administrative activities. Total costs of these transactions were $1,112, $1,246 and $1,434 for 2015, 2014 and 2013, respectively. Amounts due to/from related parties were immaterial at October 2, 2015 and October 3, 2014.
12 SEGMENTS OF BUSINESS
The Company conducts its worldwide operations through separate business segments, each of which represent major product lines. Operations are conducted in the U.S. and various foreign countries, primarily in Europe, Canada and the Pacific Basin.
Net sales and operating profit include both sales to customers, as reported in the Company’s accompanying Consolidated Statements of Operations, and inter-unit transfers, which are priced to recover costs plus an appropriate profit margin. Total assets represent assets that are used in the Company’s operations in each business segment at the end of the years presented.
F-33
A summary of the Company’s operations by business segment is presented below:
|
2015
|
2014
|
2013
|
||||||||||
|
Net sales:
|
||||||||||||
|
Marine Electronics:
|
||||||||||||
|
Unaffiliated customers
|
$ | 262,184 | $ | 249,344 | $ | 247,474 | ||||||
|
Interunit transfers
|
334 | 217 | 270 | |||||||||
|
Outdoor Equipment:
|
||||||||||||
|
Unaffiliated customers
|
47,526 | 47,393 | 44,147 | |||||||||
|
Interunit transfers
|
47 | 50 | 76 | |||||||||
|
Watercraft:
|
||||||||||||
|
Unaffiliated customers
|
48,805 | 49,349 | 50,745 | |||||||||
|
Interunit transfers
|
156 | 143 | 113 | |||||||||
|
Diving
|
||||||||||||
|
Unaffiliated customers
|
71,414 | 78,779 | 83,532 | |||||||||
|
Interunit transfers
|
711 | 780 | 1,004 | |||||||||
|
Other / Corporate
|
560 | 545 | 563 | |||||||||
|
Eliminations
|
(1,248 | ) | (1,190 | ) | (1,463 | ) | ||||||
|
Total
|
$ | 430,489 | $ | 425,410 | $ | 426,461 | ||||||
|
Operating profit (loss):
|
||||||||||||
|
Marine Electronics
|
$ | 26,055 | $ | 30,722 | $ | 32,172 | ||||||
|
Outdoor Equipment
|
3,847 | (3,726 | ) | 2,180 | ||||||||
|
Watercraft
|
1,620 | 210 | (2,116 | ) | ||||||||
|
Diving
|
934 | 3,596 | 5,694 | |||||||||
|
Other / Corporate
|
(14,603 | ) | (14,111 | ) | (12,339 | ) | ||||||
| $ | 17,853 | $ | 16,691 | $ | 25,591 | |||||||
|
Depreciation and amortization expense:
|
||||||||||||
|
Marine Electronics
|
$ | 7,749 | $ | 6,409 | $ | 5,371 | ||||||
|
Outdoor Equipment
|
1,128 | 1,099 | 1,051 | |||||||||
|
Watercraft
|
972 | 1,274 | 1,483 | |||||||||
|
Diving
|
826 | 904 | 839 | |||||||||
|
Other / Corporate
|
1,149 | 1,177 | 1,326 | |||||||||
| $ | 11,824 | $ | 10,863 | $ | 10,070 | |||||||
|
Capital expenditures:
|
||||||||||||
|
Marine Electronics
|
$ | 6,739 | $ | 9,726 | $ | 12,400 | ||||||
|
Outdoor Equipment
|
427 | 348 | 381 | |||||||||
|
Watercraft
|
889 | 837 | 1,282 | |||||||||
|
Diving
|
661 | 947 | 973 | |||||||||
|
Other / Corporate
|
1,693 | 1,405 | 1,297 | |||||||||
| $ | 10,409 | $ | 13,263 | $ | 16,333 | |||||||
|
Goodwill, net:
|
||||||||||||
|
Marine Electronics
|
$ | 10,367 | $ | 10,367 | ||||||||
|
Outdoor Equipment
|
- | - | ||||||||||
|
Watercraft
|
- | - | ||||||||||
|
Diving
|
3,925 | 4,049 | ||||||||||
| $ | 14,292 | $ | 14,416 | |||||||||
|
Total assets (end of period):
|
||||||||||||
|
Marine Electronics
|
$ | 125,113 | $ | 111,411 | ||||||||
|
Outdoor Equipment
|
33,663 | 32,033 | ||||||||||
|
Watercraft
|
20,898 | 20,367 | ||||||||||
|
Diving
|
62,589 | 64,933 | ||||||||||
|
Other / Corporate
|
56,941 | 59,882 | ||||||||||
| $ | 299,204 | $ | 288,626 | |||||||||
F-34
A summary of the Company’s operations by geographic area is presented below:
|
2015
|
2014
|
2013
|
||||||||||
|
Net sales:
|
||||||||||||
|
United States:
|
||||||||||||
|
Unaffiliated customers
|
$ | 350,340 | $ | 337,603 | $ | 327,606 | ||||||
|
Interunit transfers
|
17,872 | 16,186 | 19,881 | |||||||||
|
Europe:
|
||||||||||||
|
Unaffiliated customers
|
35,547 | 40,659 | 46,740 | |||||||||
|
Interunit transfers
|
9,371 | 12,349 | 12,018 | |||||||||
|
Canada:
|
||||||||||||
|
Unaffiliated customers
|
28,155 | 27,715 | 29,656 | |||||||||
|
Interunit transfers
|
11 | 11 | 4 | |||||||||
|
Other:
|
||||||||||||
|
Unaffiliated customers
|
16,447 | 19,433 | 22,459 | |||||||||
|
Interunit transfers
|
82 | 186 | 664 | |||||||||
|
Eliminations
|
(27,336 | ) | (28,732 | ) | (32,567 | ) | ||||||
| $ | 430,489 | $ | 425,410 | $ | 426,461 | |||||||
|
Total assets:
|
||||||||||||
|
United States
|
$ | 210,060 | $ | 190,069 | ||||||||
|
Europe
|
59,740 | 65,116 | ||||||||||
|
Canada and other
|
29,404 | 33,441 | ||||||||||
| $ | 299,204 | $ | 288,626 | |||||||||
|
Long-term assets (1):
|
||||||||||||
|
United States
|
$ | 79,045 | $ | 79,585 | ||||||||
|
Europe
|
5,162 | 5,669 | ||||||||||
|
Canada and other
|
409 | 469 | ||||||||||
| $ | 84,616 | $ | 85,723 | |||||||||
(1) Long term assets consist of net property, plant and equipment, net intangible assets, goodwill and other assets excluding deferred income taxes.
F-35
The Company had no single customer that accounted for more than 10% of its net sales in fiscal 2015, 2014 or 2013.
13 CONTINGENCIES
The Company is subject to various legal actions and proceedings in the normal course of business, including those related to commercial disputes, product liability, intellectual property and environmental matters. The Company is insured against loss for certain of these matters. Although litigation is subject to many uncertainties and the ultimate exposure with respect to these matters cannot be ascertained, management does not believe the final outcome of any pending litigation will have a material adverse effect on the financial condition, results of operations, liquidity or cash flows of the Company.
14 SUBSEQUENT EVENT
On October 27, 2015, the Company purchased certain assets for approximately $2,000. On that same day, the Company also acquired a diving technology venture for approximately $3,000. These transactions will all be accounted for in the Diving segment.
15 VALUATION AND QUALIFYING ACCOUNTS
The following summarizes changes to valuation and qualifying accounts for 2015, 2014 and 2013:
|
Balance at Beginning of Year
|
Additions Charged
to Costs and
Expenses
|
Less Deductions
|
Balance at End of Year
|
|||||||||||||
|
Year ended October 2, 2015
|
||||||||||||||||
|
Allowance for doubtful accounts
|
$ | 2,665 | $ | 292 | $ | 628 | $ | 2,329 | ||||||||
|
Reserves for inventory valuation
|
3,950 | 2,123 | 1,194 | 4,879 | ||||||||||||
|
Valuation of deferred tax assets
|
8,734 | 2,602 | 1,550 | 9,786 | ||||||||||||
|
Reserves for sales returns
|
1,428 | 3,139 | 2,622 | 1,945 | ||||||||||||
|
Year ended October 3, 2014
|
||||||||||||||||
|
Allowance for doubtful accounts
|
$ | 3,759 | $ | 288 | $ | 1,382 | $ | 2,665 | ||||||||
|
Reserves for inventory valuation
|
4,015 | 1,043 | 1,108 | 3,950 | ||||||||||||
|
Valuation of deferred tax assets
|
9,479 | 668 | 1,413 | 8,734 | ||||||||||||
|
Reserves for sales returns
|
1,129 | 2,553 | 2,254 | 1,428 | ||||||||||||
|
Year ended September 27, 2013
|
||||||||||||||||
|
Allowance for doubtful accounts
|
$ | 4,172 | $ | 769 | $ | 1,182 | $ | 3,759 | ||||||||
|
Reserves for inventory valuation
|
5,679 | 1,269 | 2,933 | 4,015 | ||||||||||||
|
Valuation of deferred tax assets
|
13,299 | 1,262 | 5,082 | 9,479 | ||||||||||||
|
Reserves for sales returns
|
1,367 | 1,857 | 2,095 | 1,129 | ||||||||||||
16 QUARTERLY FINANCIAL SUMMARY (UNAUDITED)
The following summarizes quarterly operating results for the years presented below:
F-36
|
First Quarter
|
Second Quarter
|
Third Quarter
|
Fourth Quarter
|
|||||||||||||||||||||||||||||
|
(thousands, except per share data)
|
2015
|
2014
|
2015
|
2014
|
2015
|
2014
|
2015
|
2014
|
||||||||||||||||||||||||
|
Net sales
|
$ | 70,822 | $ | 79,100 | $ | 133,111 | $ | 124,273 | $ | 140,883 | $ | 137,133 | $ | 85,673 | $ | 84,904 | ||||||||||||||||
|
Gross profit
|
27,334 | 29,929 | 51,936 | 48,846 | 58,752 | 55,819 | 33,711 | 34,019 | ||||||||||||||||||||||||
|
Operating profit (loss)
|
(7,331 | ) | (2,908 | ) | 7,623 | 11,546 | 16,421 | 9,332 | 1,140 | (1,279 | ) | |||||||||||||||||||||
|
Income (loss) before income taxes
|
(6,924 | ) | (2,920 | ) | 6,820 | 11,214 | 16,101 | 10,105 | (244 | ) | (977 | ) | ||||||||||||||||||||
|
Income tax expense (benefit)
|
(2,730 | ) | (727 | ) | 3,174 | 3,810 | 6,104 | 5,407 | (1,411 | ) | (191 | ) | ||||||||||||||||||||
|
Net income (loss)
|
$ | (4,194 | ) | $ | (2,193 | ) | $ | 3,646 | $ | 7,404 | $ | 9,997 | $ | 4,698 | $ | 1,167 | $ | (786 | ) | |||||||||||||
|
Net income (loss) per common share - Basic:
|
||||||||||||||||||||||||||||||||
|
Class A
|
$ | (0.42 | ) | $ | (0.22 | ) | $ | 0.37 | $ | 0.75 | $ | 1.01 | $ | 0.48 | $ | 0.12 | $ | (0.08 | ) | |||||||||||||
|
Class B
|
$ | (0.42 | ) | $ | (0.22 | ) | $ | 0.34 | $ | 0.68 | $ | 0.92 | $ | 0.43 | $ | 0.11 | $ | (0.07 | ) | |||||||||||||
|
Net income (loss) per common share - Diluted:
|
||||||||||||||||||||||||||||||||
|
Class A
|
$ | (0.42 | ) | $ | (0.22 | ) | $ | 0.36 | $ | 0.74 | $ | 1.00 | $ | 0.47 | $ | 0.12 | $ | (0.08 | ) | |||||||||||||
|
Class B
|
$ | (0.42 | ) | $ | (0.22 | ) | $ | 0.36 | $ | 0.74 | $ | 1.00 | $ | 0.47 | $ | 0.12 | $ | (0.08 | ) | |||||||||||||
Due to changes in stock prices during the year and the timing of issuance of shares, the cumulative total of quarterly net income (loss) per share amounts may not equal the net income (loss) per share for the entire year.
17 ACQUISITION
On November 14, 2012, the Company acquired all of the outstanding common and preferred stock of Jetboil, Inc. (“Jetboil”) in a purchase transaction with Jetboil’s founders and other shareholders (the “Sellers”). Jetboil, founded and based in Manchester, New Hampshire, designs and manufactures the world’s top brand of portable outdoor cooking systems.
The $15,420 of consideration paid in this acquisition was funded with existing cash and credit facilities. Approximately $3,200 of the purchase price was paid into a segregated escrow account which was set aside to fund potential indemnity claims that might be made by the Company against the Sellers in connection with the inaccuracy of certain representations and warranties made by Sellers or related to the breach or nonperformance of certain other actions or conditions related to the acquisition, for a period of 15 months from the acquisition date. On February 14, 2014, the Company filed an indemnity claim against the Sellers and, as a result, received a distribution of $1,600 from the escrow during the third fiscal quarter of 2014, which was recorded as a favorable adjustment in “Administrative management, finance and information systems” in the accompanying Consolidated Statement of Operations in the Outdoor Equipment segment. The remaining escrow balance was released to the Seller during the Company’s fiscal 2014.
The acquisition included an indefinite lived tradename valued at $5,400. During the third quarter of fiscal 2014, forecasted cash flows related to Jetboil declined from the assumptions used in the initial valuation. This change led the Company to perform an interim impairment test on the acquired indefinite lived intangible assets. The test consisted of comparing the carrying value of the assets to their fair value. The fair value was determined using a relief from royalty method under the income approach which uses projected revenue allocable to the tradename and a royalty rate at which it is assumed a market participant would be willing to incur as its cost to manufacture branded product. As a result of this analysis, the Company recognized an impairment charge of $2,000 in “Goodwill and other intangible asset impairment” in the accompanying Consolidated Statements of Operations in the Outdoor Equipment segment in the third quarter of fiscal 2014.
F-37
Based on these same indicators of potential impairment, the Company also performed an impairment analysis on the goodwill related to the Outdoor Equipment-Consumer reporting unit using the income approach based on estimated cash flows. As of the measurement date of June 27, 2014, the carrying value of the reporting unit exceeded its indicated fair value. As a result, the Company proceeded to Step 2 of the impairment test and determined an impairment charge of $6,475, the entire carrying amount, was required. The charge was included in “Goodwill and other intangible asset impairment” in the third quarter of fiscal 2014 in the accompanying Consolidated Statements of Operations in the Outdoor Equipment segment. The Company also evaluated long-lived assets and identified no impairment on those assets. There were no further impairment charges recorded in fiscal 2015.
F-38