Attached files
| file | filename |
|---|---|
| EX-32 - EXHIBIT 32 - DIGI INTERNATIONAL INC | dgii-ex32_2015930x10k.htm |
| EX-23 - EXHIBIT 23 - DIGI INTERNATIONAL INC | dbii-ex23_2015930x10k.htm |
| EX-21 - EXHIBIT 21 - DIGI INTERNATIONAL INC | dgii-ex21_2015930x10k.htm |
| EX-24 - EXHIBIT 24 - DIGI INTERNATIONAL INC | dgii-ex24_2015930x10k.htm |
| EX-31.B - EXHIBIT 31.B - DIGI INTERNATIONAL INC | dgii-ex31b_2015930x10k.htm |
| EX-31.A - EXHIBIT 31.A - DIGI INTERNATIONAL INC | dgii-ex31a_2015930x10k.htm |
UNITED STATES SECURITIES AND EXCHANGE COMMISSION
Washington, D.C. 20549
FORM 10-K
þ | ANNUAL REPORT PURSUANT TO SECTION 13 OR 15 (d) OF THE SECURITIES EXCHANGE ACT OF 1934 | |
For the fiscal year ended: September 30, 2015
or
o | TRANSITION REPORT PURSUANT TO SECTION 13 OR 15 (d) OF THE SECURITIES EXCHANGE ACT OF 1934 | |
For the transition period from to .
Commission file number: 1-34033

DIGI INTERNATIONAL INC.
(Exact name of registrant as specified in its charter)
Delaware | 41-1532464 | |
(State or other jurisdiction of incorporation or organization) | (I.R.S. Employer Identification Number) | |
11001 Bren Road East | ||
Minnetonka, Minnesota | 55343 | |
(Address of principal executive offices) | (Zip Code) | |
(952) 912-3444
(Registrant’s telephone number, including area code)
Securities registered pursuant to Section 12(b) of the Act:
Title of each class | Name of each exchange on which registered | |
Common Stock, par value $.01 per share | The NASDAQ Global Select Market | |
Securities registered pursuant to Section 12(g) of the Act: None
Indicate by check mark if the registrant is a well-known seasoned issuer, as defined in Rule 405 of the Securities Act. Yes o No þ
Indicate by check mark if the registrant is not required to file reports pursuant to Section 13 or Section 15(d) of the Act. Yes o No þ
Indicate by check mark whether the Registrant (1) has filed all reports required to be filed by Section 13 or 15(d) of the Securities Exchange Act of 1934 during the preceding 12 months (or for such shorter period that the registrant was required to file such reports), and (2) has been subject to such filing requirements for the past 90 days. Yes þ No o
Indicate by check mark whether the registrant has submitted electronically and posted on its corporate Web site, if any, every Interactive Data File required to be submitted and posted pursuant to Rule 405 of Regulation S-T (§232.405 of this chapter) during the preceding 12 months (or for such shorter period that the registrant was required to submit and post such files.) Yes þ No o
Indicate by check mark if disclosure of delinquent filers pursuant to Item 405 of Regulation S-K (§229.405 of this chapter) is not contained herein, and will not be contained, to the best of registrant's knowledge, in definitive proxy or information statements incorporated by reference in Part III of this Form 10-K or any amendment to this Form 10-K. o
Indicate by check mark whether the registrant is a large accelerated filer, an accelerated filer, a non-accelerated filer, or a smaller reporting company. See the definitions of “large accelerated filer,” “accelerated filer” and “smaller reporting company” in Rule 12b-2 of the Exchange Act. (Check one):
Large accelerated filer o | Accelerated filer þ | Non-accelerated filer o | Smaller reporting company o | |||
Indicate by check mark whether the registrant is a shell company (as defined in Rule 12b-2 of the Act). Yes o No þ
The aggregate market value of voting stock held by non-affiliates of the Registrant as of the last business day of the Registrant's most recently competed second fiscal quarter was $246,475,812 based on a closing price of $9.98 per common share as reported on the NASDAQ Global Select Market. (For purposes of this calculation all of the registrant's directors and executive officers are deemed affiliates of the registrant.)
Shares of common stock outstanding as of November 23, 2015: 25,299,260
DOCUMENTS INCORPORATED BY REFERENCE
Portions of the Registrant's Proxy Statement for its 2016 Annual Meeting of Stockholders are incorporated by reference into Part III hereto.
INDEX
Page | |
EX-21 | |
EX-23 | |
EX-24 | |
EX-31.A | |
EX-31.B | |
EX-32 | |
EX-101 INSTANCE DOCUMENT | |
EX-101 SCHEMA DOCUMENT | |
EX-101 CALCULATION LINKBASE DOCUMENT | |
EX-101 DEFINITION LINKBASE DOCUMENT | |
EX-101 LABELS LINKBASE DOCUMENT | |
EX-101 PRESENTATION LINKBASE DOCUMENT | |
2
PART I.
FORWARD-LOOKING STATEMENTS
This Annual Report contains certain statements that are “forward-looking statements” as that term is defined under the Private Securities Litigation Reform Act of 1995, and within the meaning of Section 27A of the Securities Act of 1933, as amended, and Section 21E of the Securities Exchange Act of 1934, as amended.
Words such as “assume,” “believe,” “anticipate,” “intend,” “estimate,” “target,” “may,” “will,” “expect,” “plan,” “project,” “should,” or “continue” or the negative thereof or other expressions, which are predictions of or indicate future events and trends and which do not relate to historical matters, identify forward-looking statements. Among other items, these statements relate to expectations of the business environment in which the company operates, projections of future performance, perceived marketplace opportunities and statements regarding our mission and vision. Such statements are not guarantees of future performance and involve certain risks, uncertainties and assumptions, including risks related to the highly competitive market in which our company operates, rapid changes in technologies that may displace products sold by us, declining prices of networking products, our reliance on distributors and other third parties to sell our products, delays in product development efforts, uncertainty in user acceptance of our products, the ability to integrate our products and services with those of other parties in a commercially accepted manner, potential liabilities that can arise if any of our products have design or manufacturing defects, our ability to defend or settle satisfactorily any litigation, uncertainty in global economic conditions and economic conditions within particular regions of the world which could negatively affect product demand and the financial solvency of customers and suppliers, the impact of natural disasters and other events beyond our control that could negatively impact our supply chain and customers, potential unintended consequences associated with restructuring or other similar business initiatives that my impact our ability to retain important employees, the ability to achieve the anticipated benefits and synergies associated with acquisitions, and changes in our level of revenue or profitability which can fluctuate for many reasons beyond our control.
These and other risks, uncertainties and assumptions identified from time to time in our filings with the United States Securities and Exchange Commission, including without limitation, those described in Item 1A, Risk Factors, of this Form 10-K and subsequent quarterly reports of Form 10-Q and other filings, could cause our future results to differ materially from those expressed in any forward-looking statements made by us or on our behalf. Many of such factors are beyond our ability to control or predict. These forward-looking statements speak only as of the date for which they are made. We disclaim any intent or obligation to update any forward-looking statements, whether as a result of new information, future events or otherwise.
ITEM 1. BUSINESS
General Background and Product Offerings
Digi International Inc. (“Digi,” “we,” “our,” or “us”) was incorporated in 1985 as a Minnesota corporation. We were reorganized as a Delaware corporation in 1989 in conjunction with our initial public offering. Our common stock is traded on the NASDAQ Global Select Market under the symbol DGII. Our World Headquarters is located at 11001 Bren Road East, Minnetonka, Minnesota 55343. Our telephone number is (952) 912-3444.
We are a leading provider of Internet of Things (IoT) networking hardware products and solutions that enable the connection, monitoring and control of local or remote physical assets by electronic means. These networking products and solutions can connect communication hardware to a physical asset, convey information about the asset’s status and performance to a computer system and then use that information to improve or automate one or more processes. These products and solutions are deployed via both wired and, ever increasingly, wireless networks. Our solutions are deployed by a wide range of businesses and institutions. Any business that utilizes a significant number of devices, whose operation could benefit from remote monitoring or control, may realize benefits from IoT networking.
Our present portfolio primarily includes:
• | Wireless and wired hardware products that have been the historical foundation of our business; |
• | Services and solutions that include the following offerings: |
◦ | Digi Cold Chain Solutions is a wireless end-to-end solution that utilizes sensors, gateways and an easy-to-use software application that enables companies to monitor the temperature of perishable goods effectively and economically. Our Digi Cold Chain Solutions are the result of our acquisition of Bluenica Corporation on October 5, 2015 (see Note 18 to our Consolidated Financial Statements). |
3
◦ | Digi Device Cloud and Digi Remote Manager™ - Digi Device Cloud (Device Cloud) is a platform as-a-service (PaaS) offering that provides a secure environment for customers to aggregate their interaction with a large number of disparate devices and connect enterprise applications to these devices. This allows for devices to be monitored and controlled remotely and allows customers collect, interpret and utilize data from many devices to operate their businesses more easily and efficiently. Digi Remote Manager™ is a complete, centralized remote device management solution that is housed on the Digi Device Cloud and allows customers to meet service level commitments and stay compliant with Payment Card Industry (PCI) standards. Digi Remote Manager™ also allows customers to monitor, diagnose and fix remote devices without sending a technician on site. |
◦ | Wireless Design Services provide customers with turn-key wireless networking product design, testing, and certification for a wide range of wireless technology platforms and applications to improve speed to market and reduce risk. |
◦ | Digi Enterprise Support Services provide technical help for customers with programming and implementation challenges related to Digi products. These services help ensure optimal performance. We also offer implementation services that support features like Digi Remote Manager™ web service programming, code debugging and review and provide API assistance for any Digi product or development kit. |
On October 23, 2015, West Monroe Partners, LLC purchased our Etherios CRM consulting services business, which focused on integration and configuration of enterprise resource management (ERM) systems, including customer relationship management (CRM) systems. This part of our business principally provided integration and configuration of salesforce.com products. For more information on this divestiture see Note 18 to the Consolidated Financial Statements.
For more in-depth descriptions of our primary hardware products, please refer to the heading “Listing of Principal Hardware Products and Services” at the end of Part I, Item 1 of this Form 10-K.
Our hardware product revenue represented 91.8%, 89.7% and 88.6% of our total revenue in fiscal 2015, 2014 and 2013, respectively. Our service revenue represented 8.2%, 10.3% and 11.4% of our total revenue in fiscal 2015, 2014 and 2013, respectively.
Our corporate website address is www.digi.com. In the “Company - Investor Relations” section of our website, we make our annual reports on Form 10-K, quarterly reports on Form 10-Q, current reports on Form 8-K, our proxy statement and any amendments to these reports available free of charge as soon as reasonably practicable after these reports are filed with or furnished to the United States Securities and Exchange Commission (the “SEC”). Each of these documents can also be obtained free of charge (except for a reasonable charge for duplicating exhibits to our reports on Form 10-K, 10-Q or 8-K) in print by any stockholder who requests them from our investor relations personnel. The Investor Relations email address is ir@digi.com and its mailing address is: Investor Relations Administrator, Digi International Inc., 11001 Bren Road East, Minnetonka, Minnesota 55343. These reports can also be accessed via the SEC website, www.sec.gov, or via the SEC’s Public Reference Room located at 100 F Street, N.E., Washington, D.C. 20549. Information concerning the operation of the SEC’s Public Reference Room can be obtained by calling 1-800-SEC-0330.
Information on our website is not incorporated by reference into this report or any other report we file with or furnish to the SEC.
Industry and Marketplace Conditions
Long-Term Growth Prospects
For several years a wide range of sources have provided strong long-term growth projections for IoT hardware and software networking products and related services. We believe our company is well positioned to capitalize on this potential growth given our present market position as a leading provider of IoT networking products and our long-standing experience and expertise in developing and deploying these solutions.
We believe IoT networking is poised for strong long term growth in our view for these primary reasons:
• | The cost of deploying sensors and transmitting data used to capture and share information from equipment, machines and other devices is falling rapidly; and |
• | Businesses and institutions desire to operate more efficiently and productively in a competitive global marketplace. |
With tens of billions of electronic devices deployed around the world, we believe the capacity of organizations to conduct more efficient operations by gathering and analyzing data is immense. The willingness of organizations to deploy networking
4
products and applications to capture and analyze that data will depend on how efficiently these networking solutions can be deployed and maintained and the expected benefits to be derived in doing so. We believe a critical element in our ability to grow our business will be our ability to develop and market IoT networking solutions at price points that can provide customers with a demonstrable return on their investment operating in mission-critical applications.
Market Conditions
In fiscal 2015, the marketplace for IoT products and services generally expanded. Within our own business this expansion was most pronounced for cellular routers and gateways and RF products that are used by customers to connect equipment and machine data to networks using wireless technology. We expect this growth trend to continue in fiscal 2016, although it is susceptible to downturns in general economic conditions as well as uncertainty or changes in the regulatory environments. These impacts may be more pronounced in certain industries. For instance, in fiscal 2015 the oil and gas marketplace for IoT networking products and services was more challenging than in prior years because the price for these natural resources declined significantly.
Strategy
Long-Term Goal
Our primary long-term goal is to continue to be a leading global provider of IoT networking hardware and solutions that enables electronic devices to be provisioned, maintained, monitored, analyzed and managed remotely by businesses. In our present business, IoT networking includes the following components that can be provided together or separately:
• | custom designed or off-the-shelf hardware that enables the delivery of data from devices to networks; |
• | software applications that allow customers to monitor and manage networked devices. For instance, our Digi Cold Chain solutions are deployed with applications that enable customers to monitor the performance of refrigeration units on any computer or smart-phone with an easy to configure and intuitive user interface; |
• | our Device Cloud, which aggregates and hosts device data securely as well as related software applications such as our Digi Remote Device Manager; and |
• | professional services such as those offered by our Wireless Design Services group that help customers define front-end requirements for their products and deploy IoT solutions. |
Current Status of Our Business
Following the appointment of Ronald E. Konezny as our Chief Executive Officer (CEO) in December 2014, we have been focused on driving the scale and leverage of our businesses, simplifying our operations and improving our profitability. While this remains an ongoing effort, we have taken or expect to take a number of actions such as:
• | In the second quarter of fiscal 2015, we restructured our services business so the ongoing costs associated with our operations were more aligned to our ability to generate revenue. |
• | In the second quarter of fiscal 2015, we closed our operations in India. |
• | Throughout fiscal 2015, we continued an initiative we started in fiscal 2014 to globally expand our relationships with large distributors such as DigiKey. We believe this will strengthen our sales channel and enable us to more easily service our customers around the world. |
• | In October 2015, we sold our Etherios CRM consulting business to West Monroe Partners, LLC. While we initially acquired Etherios in large part because we believed it would help drive engagements with companies looking to deploy IoT solutions within their businesses, we were not rewarded in the marketplace as we had hoped. In turn, we were operating a business that was not fully tied to our core expertise. The divestiture brings more focus to our core business and is expected to increase our profitability by lowering our operating expenses. |
• | In the first quarter of fiscal 2016, we plan to consolidate office locations in the Minneapolis area, moving our Wireless Design Services team from an office in downtown Minneapolis to our World Headquarters in suburban Minnetonka. |
• | We have placed greater emphasis on controlling operating expenses across all areas of our business. |
5
• | During fiscal 2015, we started an initiative to reduce the number of product stock keeping units (SKUs) we produce, which we believe will have significant implications on our ability to manage inventory effectively, improve channel stocking strategies and control costs. |
In addition to the above initiatives, we also have been examining ways to expand the scope and scale of our business to enhance our existing operations. In October 2015, we acquired Bluenica Corporation, a company that uses wireless sensors, gateways and a software application to enable companies to monitor the temperature of food and other perishable goods remotely. The acquisition leverages our existing strength as a provider of IoT hardware and related software while providing us with a recurring revenue stream. We intend to investigate other potential investments that we believe could compliment our existing business.
Acquisitions and Dispositions
On October 5, 2015, we acquired Bluenica Corporation, a company focused on temperature monitoring of perishable goods in the food industry by using wireless sensors which are installed in grocery and convenience stores, restaurants, and in products during shipment and storage to ensure that quality, freshness and public health requirements are met (see Note 18 to our Consolidated Financial Statements). Bluenica forms the basis of the Digi Cold Chain solutions business.
On October 31, 2012, we acquired Etherios, Inc., a provider of consulting and professional services that uses a new cloud-based method for integrating machines into core business process via the salesforce.com service cloud (see Note 2 to our Consolidated Financial Statements). On October 23, 2015, we entered into a stock purchase agreement with West Monroe Partners, LLC, pursuant to which they acquired this business (see Note 18 to our Consolidated Financial Statements).
These are the only acquisitions and dispositions we have completed in the past five years. We will continue to evaluate strategic opportunities to acquire businesses as they arise.
Sales Channels
We sell our products through a global network of distributors, systems integrators and value added resellers (VARs). We also complete sales through our own dedicated sales organization to original equipment manufacturers (OEMs) and other customers.
Distributors
Our larger distributors, based on sales we make to them, include A-Unit Electronic Co., Ltd., Anewtech Systems Pte Ltd., Anixter International, Arrow Electronics, Inc., Atlantik Elektronik GmbH, Avnet, Digi-Key Corporation, Express Systems & Peripherals, Future Electronics, Ingram Micro, Melchoni S.p.A., Miel, Mouser Electronics, Novotech, Scansource Corporation, Solid State Supplies, Ltd., Synnex, Tech Data Corporation and Tokyo Electron Device Ltd. We also maintain relationships with many other distributors in the U.S., Canada, Europe, Asia Pacific and Latin America.
Strategic Sales Relationships
We maintain alliances with other industry leaders to develop and market technology solutions. These include many major communications hardware and software vendors, operating system suppliers, computer hardware manufacturers, enterprise application providers and cellular carriers. Among others, partners include: AT&T, Bell Mobility, Ericsson, Freescale, Qualcomm, Rogers, Silicon Laboratories, Sprint, Telus, Verizon and several other cellular carriers worldwide. Furthermore, we maintain a worldwide network of authorized developers that extends our reach into certain other technology applications and geographical regions.
We have established relationships with equipment vendors in a range of industries such as energy, industrial, retail, transportation, medical, and government that allow the vendors to ship our products and services as component parts of their overall solutions. Our products are used by many of the world’s leading telecommunications companies and Internet service providers, including AT&T Inc., Sprint Nextel Corp. and Verizon Communications Inc.
No single customer comprised more than 10% of our consolidated revenue for any of the years ended September 30, 2015, 2014 or 2013.
6
Competition
We compete primarily in the communications technology industry, which is characterized by rapid technological advances and evolving industry standards. The market can be affected significantly by new product introductions and marketing activities of industry participants. In addition, we may compete with other companies to acquire new businesses or technologies and the competition to secure such assets may be intense. We compete for customers on the basis of existing and planned product features, service and software application capabilities, company reputation, brand recognition, technical support, alliance relationships, quality and reliability, product development capabilities, price and availability. While no competitor offers a comparable range of products and services, various companies do compete with us with respect to one or more of our products or solutions. We believe that as the marketplace for IoT connectivity products and solutions continues to grow and as we continue to expand our product and service offerings, it is likely we will encounter increased competition, some of whom may have access to significantly more financial and technical resources than we possess.
Manufacturing Operations
Our manufacturing operations are conducted through a combination of internal manufacturing and external subcontractors specializing in various parts of the manufacturing process. We rely on third party foundries for our semiconductor devices that are Application Specific Integrated Circuits (ASICs) and we outsource printed circuit board production. This approach allows us to reduce our fixed costs, maintain production flexibility and optimize our profits.
Our products are manufactured to our designs with standard and semi-custom components. Most of these components are available from multiple vendors. We have several single-sourced supplier relationships, either because alternative sources are not available or because the relationship is advantageous to us. If these suppliers are unable to provide a timely and reliable supply of components, we could experience manufacturing delays that could adversely affect our consolidated results of operations in a material way. For instance, in November 2014 a fire disrupted the operations at one of our contract manufacturers in Thailand. We utilized alternate suppliers, as well as expanded production at our own manufacturing facility to mitigate the impact of the supply chain disruption resulting from the fire.
Seasonality
In general, our business is not considered to be highly seasonal, although our first fiscal quarter revenue is often less than other quarters due to holidays and fewer shipping days.
Working Capital
We fund our business operations through a combination of cash and cash equivalents, marketable securities and cash generated from operations. We believe that our current financial resources, cash generated from operations, and our capacity for debt and/or equity financing will be sufficient to fund our business operations for the next twelve months and beyond.
Research & Development and Intellectual Property Rights
During fiscal years 2015, 2014 and 2013, our research and development expenditures were $32.0 million, $29.8 million and $30.3 million, respectively.
Due to rapidly changing technology in the communications technology industry, we believe a large part of our success depends upon the product and service development skills of our personnel as well as our ability to integrate any acquired technologies with organically developed technologies.
Our proprietary rights and technology are protected by a combination of copyrights, patents, trade secrets and trademarks.
We have established common law and registered trademark rights on a family of marks for a number of our products. Our products and services primarily are sold under the Digi, Rabbit® and Xbee® brands. We believe that the Digi and Rabbit® brands have established strong identities with our targeted customer base and our customers associate the Digi brand with “reliability” and the Rabbit® brand with “ease of integration.” We believe that our customers associate Xbee® with “ease of use.” Many of our customers choose us because they are building a very complex system solution and they want the highest level in product reliability and ease of integration and use. Our Etherios® brand was sold in connection with the sale of Etherios, Inc. in October 2015.
Our patents are applicable to specific technologies and are valid for varying periods of time based on the date of patent application or patent grant in the U.S. and the legal term of patents in the various foreign countries where patent protection is
7
obtained. We believe our intellectual property has significant value and is an important factor in the marketing of our company and products.
Backlog
Backlog as of September 30, 2015 and 2014 was $27.2 million and $26.2 million, respectively. The majority of the backlog at September 30, 2015 is expected to be shipped in fiscal 2016. Backlog as of any particular date is not necessarily indicative of our future sales trends.
Employees
We had 565 employees on September 30, 2015. We consider our relations with our employees to be good. Approximately 50 employees were included in the sale of Etherios, Inc. in October 2015 and consequently their employment with us was terminated.
Geographic Areas and Currency Risks
Our customers are located throughout North America, Europe, Middle East & Africa (EMEA), Asia Pacific and Latin America. We are exposed to foreign currency transaction risk associated with certain sales being denominated in Euros, British Pounds and Japanese Yen and foreign currency translation risk as the financial position and operating results of our foreign subsidiaries are translated into U.S. Dollars for consolidation. We manage our net asset or net liability position for U.S. dollar accounts in our foreign locations to reduce our foreign currency risk. We have not implemented a formal hedging strategy to reduce foreign currency risk.
During 2015, we had approximately $76.3 million of revenue related to foreign customers including export sales, of which $21.3 million was denominated in foreign currency, predominantly the Euro and British Pound. During 2014 and 2013, we had approximately $76.3 million and $78.8 million, respectively, of revenue to foreign customers including export sales, of which $23.3 million and $24.3 million, respectively, were denominated in foreign currency, predominantly the Euro and British Pound. In future periods, we expect a significant portion of sales will continue to be made in Euros and British Pounds.
Financial information about geographic areas appears in Note 4 to our Consolidated Financial Statements in this Form 10-K.
PRINCIPAL HARDWARE PRODUCTS AND SERVICES
Hardware Products
Cellular routers and gateways - Cellular routers provide connectivity for devices over a cellular data network. They can be used as a cost effective alternative to landlines for primary or backup connectivity for remote locations and devices. These products have been certified by the major wireless providers in North America and abroad, including AT&T®, Verizon Wireless®, Sprint®, Bell Mobility and Rogers. Cellular gateway products enable devices or groups of devices to be networked in locations where there is no existing network or where access to a network is prohibited. All of our cellular products include a unique remote management platform that provides secure management of devices across remote networks and can all use the Device Cloud for remote management. In addition, application connectivity, management and customization are enabled via the Device Cloud platform for many of these products.
Radio Frequency (RF) - Our RF products are small box or module products that utilize a variety of wireless protocols for PC-to-device or device-to-device connectivity, often in locations where deploying a wired network is not possible either because of cost, disruption or impracticality. By supporting ZigBee®, Wi-Fi® and other radio frequency "RF" technologies, we can meet most customer application requirements. In conjunction with one of our gateways, RF products can be connected into the Device Cloud for remote management, application connectivity and customization.
Embedded - Our Connect, Rabbit®, and ARM-based embedded systems on module, and single board computers are designed and developed with small footprints, low power consumption and software, making them ideal for medical, transportation and industrial device manufacturers. A number of these modules can be connected directly to the Device Cloud, enabling remote management and remote application connectivity. Also included in our embedded grouping are our chips (or microprocessors) that provides the “brains” and processing power of an intelligent electronic device or communication sub-system. Some of our higher volume customers choose to purchase chips and build their own products. Chips are low cost but require the highest level of development expertise. We do not develop chips and use Commercial-Off-the-Shelf (COTS) technology from companies such as Freescale and Ember for our products.
8
Network - Our network product category consists of:
• | Console servers - Our console servers provide a secure remote graphical access to computer systems and network equipment that can communicate with virtually any server or device. |
• | USB - Our Universal Serial Bus (USB) solutions include USB-to-serial converters that offer instant I/O expansion for peripheral device connectivity. We also offer USB over IP products that connect USB and serial devices on a wired or wireless LAN, while eliminating the need to locally-attached host PCs. In addition, we also offer multiport USB hubs which offer a simple solution for adding switched USB ports to a PC, server or thin client. |
• | Serial servers - Our serial servers (also known as device servers and terminal servers) provide secure, reliable and flexible serial-to-Ethernet integration of most devices into wired Ethernet networks. They are used for a variety of applications such as automation, robotics control, centralized device monitoring and management, data acquisition and point-of-sale applications. |
Services
Digi Cold Chain Solutions - Our Digi Cold Chain Solutions is an end-to-end, cost-effective system that uses sensors, gateways and a cloud based application to enable customers such as restaurants, groceries and convenience stores to monitor wirelessly the temperature of food and other perishable goods. Our Digi Cold Chain Solutions was introduced as a result of our acquisition of Bluenica Corporation on October 5, 2015 (see Note 18 to our Consolidated Financial Statements).
Digi Device Cloud and Digi Remote Manager™ - Our Digi Device Cloud is a platform as-a-service (PaaS) offering that provides a secure environment for customers to aggregate their interaction with a large number of disparate devices and connect them to enterprise applications. This allows for devices to be monitored and controlled remotely and allows customers to collect, interpret and utilize data from many devices to operate their businesses more easily and efficiently. The Digi Remote Manager™ is a complete centralized remote device management solution that is housed on the Digi Device Cloud and allows customers to meet service level commitments and stay compliant with Payment Card Industry (PCI) standards. Digi Remote Manager™ also allows customers to monitor, diagnose and fix remote devices without sending a technician on site.
Wireless Design Services - Our Wireless Design Services provide customers turn-key wireless networking product designs, testing, and certification for a wide range of wireless technology platforms and applications.
Digi Enterprise Support Services - Our Enterprise Support Services provide technical help for customers with programming and implementation challenges related to Digi products. These services help minimize design risk and ensure optimal performance. We also offer implementation services that cover support for features like Digi Remote Manager™ web service programming, code debugging and review and application program interface (API) assistance for any Digi product or development kit.
Etherios CRM Services - Our Etherios team provided professional consulting services that are focused on integration and configuration of enterprise resource management (ERM) systems including customer relationship management (CRM) systems. Our Etherios team had capabilities that span operational strategy, technical design and architecture, system integration, implementation, program management, and change management services principally on salesforce.com projects. On October 23, 2015, we sold our Etherios business, which included Etherios CRM Services (see Note 18 to the Consolidated Financial Statements).
ITEM 1A. RISK FACTORS
Multiple risk factors exist which could have a material effect on our operations, results of operations, profitability, financial position, liquidity, capital resources and common stock.
Risks Relating to Our Business
Our dependence on new product development and the rapid technological change that characterizes our industry makes us susceptible to loss of market share resulting from competitors’ product introductions and enhancements, service capabilities and similar risks.
Our industry is characterized by rapidly changing technologies, evolving industry standards, frequent new product introductions, short product life cycles in certain instances and rapidly changing customer requirements. The introduction of products and enhancements embodying new technologies and the emergence of new industry standards can render existing products obsolete and unmarketable.
9
Our future success will depend on our ability to enhance our existing products, to introduce new products to meet changing customer requirements and emerging technologies, and to demonstrate the performance advantages and cost-effectiveness of our products over competing products. Failure by us to modify our products to support new alternative technologies or failure to achieve widespread customer acceptance of such modified products could cause us to lose market share and cause our revenue to decline. Further, if competitors offer better service capabilities associated with the implementation and use of products in communication networks, our business could be impacted negatively.
We may experience delays in developing and marketing product enhancements or new products that respond to technological change, evolving industry standards and changing customer requirements. There can be no assurance that we will not experience difficulties that could delay or prevent the successful development, introduction, and marketing of these products or product enhancements, or that our new products and product enhancements will meet the requirements of the marketplace adequately and achieve any significant or sustainable degree of market acceptance in existing or additional markets. In addition, the future introductions or announcements of products by us or one of our competitors embodying new technologies or changes in industry standards or customer requirements could render our then-existing products obsolete or unmarketable. This risk may become more pronounced as new competitors enter the marketplace, especially if these competitors have more resources than us to develop and market new products and technologies and provide related services. There can be no assurance that the introduction or announcement of new product offerings by us or one or more of our competitors will not cause customers to defer their purchase of our existing products, which could cause our revenue to decline.
Our participation in a services and solutions model, using cloud-based services, presents execution and competitive risks.
We are deploying a services and solutions model using our own internally developed hosted services and cloud-based platform, software applications, and supporting products and services. We are employing significant human and financial resources to develop and deploy this cloud-based platform and related software applications and services. As we are working to grow and scale this part of our business, these investments have impacted our gross margins and profitability adversely in the past and may continue to do so in the future. While we believe our wireless, device networking and connectivity expertise, investments in infrastructure, and our innovative environment provide us with a strong foundation to compete, it is uncertain whether our strategies will attract the users or generate the revenue required to be successful. We expect to encounter competition from other solutions providers, many of whom may have more significant resources than us with which to compete. Whether we are successful in this business model depends on a number of factors, including:
• | our ability to put in place the infrastructure to deploy and evolve our solutions effectively and continuously ; |
• | the features and functionality of our platform relative to any competing platforms as well as our ability to market our platform effectively; |
• | our ability to engage in successful strategic relationships with third parties such as telecommunications carriers, chip makers and systems integrators; |
• | competing effectively for market share; and |
• | deploying complete end-to-end solutions that meet the needs of the marketplace generally as well as the particular requirements of our customers more effectively and efficiently than competitive solutions. |
We intend to continue to devote significant resources to our research and development, which, if not successful, could cause a decline in our revenue and harm our business.
We intend to continue to devote significant resources to research and development in the coming years to enhance and develop additional products. For the fiscal years ended 2015, 2014 and 2013, our research and development expenses comprised 15.1%, 15.5% and 15.5%, respectively, of our revenue. If we are unable to develop new products, applications and services as a result of our research and development efforts, or if the products, applications and services we develop are not successful, our business could be harmed. Even if we develop new products, applications and services that are accepted by our target markets, the net revenue from these products, applications and services may not be sufficient to justify our investment in research and development.
Many of our products, applications and services have been developed through a combination of internally developed technologies and acquired technologies. Our ability to continue to develop new products, applications and services partially is dependent on finding and acquiring new technologies in the marketplace. Even if we identify new technologies that we believe would be complementary to our internally developed technologies, we may not be successful in obtaining those technologies or we may not be able to acquire the technologies at a price that is acceptable to us.
10
A substantial portion of our development efforts have been directed toward the development of new products targeted to manufacturers of intelligent, network-enabled devices and other embedded systems in various markets, including markets in which networking solutions for embedded systems have not historically been sold, such as markets for industrial automation equipment and medical equipment.
Our gross margins may be subject to decline.
Our gross margins may be subject to decline which could decrease our overall profitability and impact our financial performance adversely. Many of the hardware products we sell are approaching the end of their product life cycle. These mature hardware products typically sell at higher gross margins than our other product and service offerings. In fiscal 2015, sales of mature hardware products represented about 37.2% of our overall revenue. For several years revenues from the sale of these mature hardware products have been declining at a rate of between 1% and 10%, a trend we expect to continue. In addition, ongoing cost pressures in our industry create downward pressure on the prices at which we and other manufacturers can sell hardware products. We also have indicated that we would be willing to realize lower levels of gross margins from customers in return for long-term, binding purchase commitments, a strategy that, if successful, could also put downward pressure on our gross margins. While part of our longer term strategy is to sell software applications and IoT solutions such as Digi Cold Chain which can provide recurring revenues at relatively high gross margin, these types of offerings are at early stages of adoption by customers and their sales growth is not necessarily predictable or assured. As such, our gross margins may be subject to decline unless we can implement cost reduction initiatives effectively to offset the impact of these factors.
Certain of our products are sold into mature markets, which could limit our ability to continue to generate revenue from these products.
Many of our hardware products are sold into mature markets that are characterized by a trend of declining demand. As the overall market for these mature hardware products decreases due to the adoption of new technologies, we expect that our revenue from these products will continue to decline. As a result, our future prospects depend in part on our ability to acquire or develop and successfully market additional products that address growth markets.
Our failure to anticipate or manage product transitions effectively could have a material adverse effect on our revenue and profitability.
From time to time, we or our competitors may announce new products, capabilities, or technologies that may replace or shorten the life cycles of our existing products. Announcements of currently planned or other new products may cause customers to defer or stop purchasing our products until new products become available. Furthermore, the introduction of new or enhanced products requires us to manage the transition from older product inventories and ensure that adequate supplies of new products can be delivered to meet customer demand. Our failure to anticipate the revenue declines associated with older products or manage transitions from older products effectively could result in inventory obsolescence and also have a material adverse effect on our revenue and profitability.
Our failure to compete successfully in our highly competitive market could result in reduced prices and loss of market share.
The market in which we operate is characterized by rapid technological advances and evolving industry standards. The market can be affected significantly by new product introductions and marketing activities of industry participants. Certain of our competitors and potential competitors may have greater financial, technological, manufacturing, marketing, and personnel resources than us. In addition, the amount of competition we face in the marketplace may change and grow as the market for our industry grows and new entrants enter the marketplace. Present and future competitors may be able to identify new markets and develop products more quickly, which are superior to those developed by us. They may also adapt new technologies faster, devote greater resources to research and development, promote products more aggressively, and price products more competitively than us. Competition may also intensify or we may no longer be able to compete effectively in the markets in which we compete.
Our ability to sustain and grow our business depends in large part on the success of our channel partner distributors and resellers.
A substantial part of our revenue is generated through sales by channel partner distributors and resellers. Sales through our channel partners accounted for 59.1%, 59.9% and 59.1% of our total revenue in fiscal 2015, 2014 and 2013 respectively. Further, in recent years we have been taking steps to expand our relationship with certain distributors who have global reach, an effort that could potentially increase the percent of our revenue driven through channel partners or our reliance on certain channel partners to drive sales. To the extent our channel partners are unsuccessful in selling our products or if we are unable to obtain and retain a sufficient number of high-quality channel partners, our operating results could be materially and
11
adversely affected. In addition, our channel partners may also market, sell and support products and services that are competitive with ours, and may devote more resources to the marketing, sales and support of such products. They also may have incentives to promote our competitors’ products in lieu of our products, particularly for our competitors with larger volumes of orders, more diverse product offerings and a longer relationship with our distributors and resellers. In these cases, one or more of our important channel partners may stop selling our products completely. Our channel partner sales structure also could subject us to lawsuits, potential liability and reputational harm if, for example, any of our channel partners misrepresents the functionality of our products or services to customers, or violates laws or our corporate policies. If we fail to manage our existing or future sales channel partners effectively, our business and operating results could be materially and adversely affected.
Our ability to grow our business is dependent in part on strategic relationships we develop and maintain with third parties as well as our ability to integrate and assure use of our products and services in coordination with the products and services of certain strategic partners in a commercially acceptable manner.
We believe that our ability to increase our sales depends in part on maintaining and strengthening relationships with parties such as telecommunications carriers, systems integrators, enterprise application providers and other strategic technology companies. Once a relationship is established, we likely will dedicate significant time and resources to it in an effort to advance our business interests and there is no assurance any strategic relationship will generate enough revenue to offset the significant resources we use to advance the relationship. Parties with whom we establish strategic relationships may also work with companies that compete with us. We also have limited, if any, control as to whether these parties devote adequate resources to promoting, selling, and implementing our products. Further, new or emerging technologies, technological trends or changes in customer requirements may result in certain companies with whom we maintain strategic relationships de-emphasizing their dealings with us or becoming potential competitors in the future. We also have limited, if any, control as to other business activities of these parties and we could experience reputational harm because of our association with such parties if they fail to execute on business initiatives, are accused of breaking the law or otherwise suffer reputational harm for other reasons. All of these factors could materially and adversely impact our business and results of operations.
In some cases we expect the establishment of a strategic relationship with a third party to result in integrations of our products or services with those of other parties. Identifying appropriate parties for these relationships as well as negotiating and documenting business agreements with them requires significant time and resources. We expect these agreements typically to be non-exclusive and not to prohibit the other party from working with our competitors or offering competing services. Once the relationship is established we may also encounter difficulties in combining our products and services in a commercially acceptable manner. We expect this type of dynamic where our ability to realize sales opportunities is dependent on how our products and services interact with those sold by third parties may become more common as the marketplace in our industry evolves. There can be no guaranty in any particular instance that we will be successful in making our products interact with those of other parties in a commercially acceptable manner and, even if we do, we cannot guaranty the resulting products and services will be marketed or sold effectively via the relationship.
We are subject to various cybersecurity risks, which are particularly acute in the cloud-based technologies operated by us and other third parties that form a part of our solutions. These risks may increase our costs and could damage our brand and reputation.
As we continue to direct a substantial portion of our sales and development efforts toward broader based solutions, such as the Device Cloud and Digi Cold Chain solutions, we expect to store, convey and potentially process increasing amounts of data produced by devices. This data may include confidential or proprietary information, intellectual property or personally identifiable information of our customers or other third parties with whom they do business. It is important for us to maintain solutions and related infrastructure that are perceived by our customers and other parties with whom we do business to provide a reasonable level of reliability and security. Despite available security measures and other precautions, the infrastructure and transmission methods used by our products and services may be vulnerable to interception, attack or other disruptive problems. Continued high-profile data breaches at other companies evidence an external environment that is becoming increasingly hostile to information security. Improper disclosure of data or perception that our data security is insufficient could harm our reputation, give rise to legal proceedings, or subject our company to liability under laws that protect data, any of which could result in increased costs and loss of revenue.
If a cyberattack or other security incident were to allow unauthorized access to or modification of our customers’ data or our own data, whether due to a failure with our systems or related systems operated by third parties, we could suffer damage to our brand and reputation. The costs we would incur to address and fix these incidents could significantly increase our expenses. These types of security incidents could also lead to lawsuits, regulatory investigations and increased legal liability, including in some cases contractual costs related to customer notification and fraud monitoring. Further, as regulatory focus on privacy and
12
data security issues continues to increase and worldwide laws and regulations concerning the protection of information become more complex, the potential risks and costs of compliance to our business will intensify.
Acquisitions could disrupt our business and seriously harm our financial condition.
We will continue to consider acquisitions of complementary businesses, products or technologies. In the event of any future acquisitions, we could issue stock that would dilute our current stockholders’ percentage ownership, incur debt, assume liabilities, or incur large and immediate write-offs.
Our operation of any acquired business also involves numerous risks, including but not limited to:
• | problems combining the purchased operations, technologies, or products; |
• | unanticipated costs; |
• | diversion of management’s attention from our core business; |
• | difficulties integrating businesses in different countries and cultures; |
• | adverse effects on existing business relationships with suppliers and customers; |
• | risks associated with entering markets in which we have no or limited prior experience; and |
• | potential loss of key employees, particularly those of the purchased organization. |
We cannot assure that we will be able to successfully integrate any businesses, products, technologies, or personnel that we have acquired or that we might acquire in the future and any failure to do so could disrupt our business and have a material adverse effect on our consolidated financial condition and results of operations. Moreover, from time to time, we may enter into negotiations for a proposed acquisition, but be unable or unwilling to consummate the acquisition under consideration. This could cause significant diversion of management’s attention and out-of-pocket expenses for us. We could also be exposed to litigation as a result of any consummated or unconsummated acquisition.
If we fail to establish and maintain effective internal control over financial reporting, our ability to accurately report our financial results could be adversely affected.
If any material weakness in our internal control over financial reporting is discovered or occurs in the future, our consolidated financial statements may contain material misstatements and we could be required to restate our financial results. Further, regardless of how well designed, operated and evaluated it may be, any system of internal control over financial reporting can provide only reasonable, not absolute, assurance that its objective will be satisfied. We cannot be certain that, in the future, material weaknesses will not exist or otherwise be discovered. If we fail to maintain effective internal control over financial reporting, the accuracy and timing of our financial reporting may be adversely affected by misstatements or restatements of our consolidated financial statements, our business and financial condition could be harmed. Further, we experienced a material weakness in internal control in fiscal 2014. While this material weakness has been remediated, investors may lose confidence in our reported financial information and the market price of our common shares may decline if we experience any further material weaknesses.
Our consolidated operating results and financial condition may be adversely impacted by worldwide economic conditions and credit tightening.
If worldwide economic conditions experience a significant downturn, these conditions may make it difficult or impossible for our customers and suppliers to accurately forecast and plan future business activities, which may cause them to slow or suspend spending on products and services. Our customers may find it difficult to gain sufficient credit in a timely manner, which could result in an impairment of their ability to place orders with us or to make timely payments to us for previous purchases. If this occurs, our revenue may be reduced, thereby having a negative impact on our results of operations. In addition, we may be forced to increase our allowance for doubtful accounts and our days sales outstanding may increase, which would have a negative impact on our cash position, liquidity and financial condition. We cannot predict either the timing or duration of an economic downturn in the economy, should one occur.
13
Our revenue may be subject to fluctuations based on the level of significant one time purchases.
No single customer has represented more than 10% of our revenue in any of the last three fiscal years. However, many of our customers make significant one-time hardware purchases for large projects that are not repeated. As a result, our revenue may be subject to significant fluctuations based on whether we are able to close significant sales opportunities. Our failure to complete one or a series of significant sales opportunities in a particular fiscal period could have a material adverse effect on our revenue for that period.
The long and variable sales cycle for certain of our products makes it more difficult for us to predict our operating results and manage our business.
The sale of our products and services can involve a significant technical evaluation and commitment of capital and other resources by potential customers and end users, as well as delays frequently associated with end users’ internal procedures to deploy new technologies within their products and to test and accept new technologies. For these and other reasons, the sales cycle associated with certain of our products is typically lengthy and is subject to a number of significant risks, such as end users’ internal purchasing reviews, that are beyond our control. Because of the lengthy sales cycle and the large size of certain customer orders, if orders forecasted for a specific customer are not realized or delayed, our operating results could be materially adversely affected.
We depend on manufacturing relationships and on limited-source suppliers, and any disruptions in these relationships may cause damage to our customer relationships.
We procure all parts and certain services involved in the production of our products and subcontract most of our product manufacturing to outside firms that specialize in such services. Although most of the components of our products are available from multiple vendors, we have several single-source supplier relationships, either because alternative sources are not available or because the relationship is advantageous to us. There can be no assurance that our suppliers will be able to meet our future requirements for products and components in a timely fashion. In addition, the availability of many of these components to us is dependent in part on our ability to provide our suppliers with accurate forecasts of our future requirements. Delays or lost revenue could be caused by other factors beyond our control, including late deliveries by vendors of components, or force majeure events. For instance, a fire in November 2014 disrupted the operations at one of our contract manufacturers in Thailand. If we are required to identify alternative suppliers for any of our required components, qualification and pre-production periods could be lengthy and may cause an increase in component costs and delays in providing products to customers. Any extended interruption in the supply of any of the key components currently obtained from limited sources could disrupt our operations and have a material adverse effect on our customer relationships and profitability.
Our inability to obtain the appropriate telecommunications carrier certifications or approvals from governmental regulatory bodies could impede our ability to grow revenue in our wireless products.
The sale of our wireless products in certain geographical markets is sometimes dependent on the ability to gain telecommunications carrier certifications and/or approvals by certain governmental bodies. Failure to obtain these approvals, or delays in receiving the approvals, could impact our ability to enter our targeted markets or to compete effectively or at all in these markets and could have an adverse impact on our revenue.
We are dependent on wireless communication networks owned and controlled by others.
Our revenue could decline if we are unable to deliver continued access to digital cellular wireless carriers that we depend on to provide sufficient network capacity, reliability and security to our customers. Our financial condition could be impacted if our wireless carriers were to increase the prices of their services, or to suffer operational or technical failures.
The impact of natural disasters could negatively impact our supply chain and customers resulting in an adverse impact to our revenue and profitability.
Certain of our components and other materials used in producing our products are from regions susceptible to natural disasters. If we are unable to procure necessary materials, we could experience a disruption to our supply chain that would hinder our ability to produce our products in a timely manner, or cause us to seek other sources of supply, which may be more costly or which we may not be able to procure on a timely basis. We also risk damage to any tooling, equipment or inventory at the supplier’s facilities. For instance, flooding in October 2011 and a fire in November 2014 disrupted the operations at one of our contract manufacturers in Thailand. In addition, our customers may not follow their normal purchasing patterns or temporarily cease purchasing from us due to impacts to their businesses in the region, creating unexpected fluctuations or decreases in our
14
revenue and profitability. Natural disasters in other parts of the world on which our operations are reliant also could have material adverse impacts on our business.
Our use of suppliers in other parts of the world involves risks that could negatively impact us.
We purchase a number of components from suppliers in other parts of the world. Product delivery times may be extended due to the distances involved, requiring more lead time in ordering. In addition, ocean freight delays may occur as a result of labor problems, weather delays or expediting and customs issues. Any extended delay in receipt of the component parts could eliminate anticipated cost savings and have a material adverse effect on our customer relationships and profitability.
Our ability to compete could be jeopardized if we are unable to protect our intellectual property rights.
Our ability to compete depends in part on our proprietary rights and technology. Our proprietary rights and technology are protected by a combination of copyrights, patents, trade secrets and trademarks.
We enter into confidentiality agreements with our employees, and sometimes with our customers, potential customers and other third parties, and limit access to the distribution of our proprietary information. There can be no assurance that the steps taken by us in this regard will be adequate to prevent the misappropriation of our technology. Our pending patent applications may be denied and any patents, once issued, may be circumvented by our competitors. Furthermore, there can be no assurance that others will not develop technologies that are superior to our technologies. Despite our efforts to protect our proprietary rights, unauthorized parties may attempt to copy aspects of our products or to obtain and use information that we regard as proprietary. In addition, the laws of some foreign countries do not protect our proprietary rights as fully as do the laws of the United States. There can be no assurance that our means of protecting our proprietary rights in the United States or abroad will be adequate or that competing companies will not independently develop similar technologies. Our failure to adequately protect our proprietary rights could have a material adverse effect on our competitive position and result in loss of revenue.
From time to time, we are subject to claims and litigation regarding intellectual property rights or other claims, which could seriously harm us and require us to incur significant costs.
The communications technology industry is characterized by frequent litigation regarding patent and other intellectual property rights. From time to time, we receive notification of a third-party claim that our products infringe other intellectual property rights. Any litigation to determine the validity of third-party infringement claims, whether or not determined in our favor or settled by us, may be costly and divert the efforts and attention of our management and technical personnel from productive tasks, which could have a material adverse effect on our ability to operate our business and service the needs of our customers. There can be no assurance that any infringement claims by third parties, regardless if they have merit, will not materially adversely affect our business, operating results or financial condition. In the event of an adverse ruling in any such matter, we may be required to pay substantial damages, cease the manufacture, use and sale of infringing products, discontinue the use of certain processes or be required to obtain a license under the intellectual property rights of the third party claiming infringement. There can be no assurance that a license would be available on reasonable terms or at all. Any limitations on our ability to market our products, or delays and costs associated with redesigning our products or payments of license fees to third parties, or any failure by us to develop or license a substitute technology on commercially reasonable terms could have a material adverse effect on our business, operating results and financial condition.
We face risks associated with our international operations and expansion that could impair our ability to grow our revenue abroad as well as our overall financial condition.
We believe that our future growth is dependent in part upon our ability to increase sales in international markets. These sales are subject to a variety of risks, including fluctuations in currency exchange rates, tariffs, import restrictions and other trade barriers, unexpected changes in regulatory requirements, longer accounts receivable payment cycles, potentially adverse tax consequences, and export license requirements. In addition, we are subject to the risks inherent in conducting business internationally, including political and economic instability and unexpected changes in diplomatic and trade relationships. In many markets where we operate business and cultural norms are different than those in the United States and practices that may violate laws and regulations applicable to us like the Foreign Corrupt Practices Act (FCPA) and the UK Anti-Bribery Act (UKBA) are more commonplace. Although we have implemented policies and procedures with the intention of ensuring compliance with these laws and regulations, our employees, contractors and agents, as well as channel partners involved in our international sales, may take actions in violation of our policies. Many of our vendors and strategic business allies also have international operations and are subject to the risks described above. Even if we are able to successfully manage the risks of international operations, our business may be adversely affected if one or more of our business partners are not able to successfully manage these risks. There can be no assurance that one or more of these factors will not have a material adverse effect on our business strategy and financial condition.
15
Our failure to comply effectively with regulatory laws pertaining to our foreign operations could have a material adverse effect on our revenue and profitability.
We are required to comply with U.S. government export regulations in the sale of our products to foreign customers, including requirements to properly classify and screen our products against a denied parties list prior to shipment. We are also required to comply with the provisions of the FCPA and all other anti-corruption laws, such as UKBA, of all other countries in which we do business, directly or indirectly, including compliance with the anti-bribery prohibitions and the accounting and recordkeeping requirements of this law. Violations of the FCPA or other similar laws could trigger sanctions, including ineligibility for U.S. government insurance and financing, as well as large fines. Failure to comply with the aforementioned regulations could also deter us from selling our products in international jurisdictions, which could have a material adverse effect on our revenue and profitability.
Foreign currency exchange rates may adversely affect our operating results.
We are exposed to a variety of market risks, including the effects of changes in foreign currency exchange rates on transactions that are denominated in foreign currencies. Because our financial statements are denominated in U.S. Dollars and approximately 10% of our revenue is denominated in a currency other than U.S. Dollars, such as Euros, British Pounds and Yen, our revenues and earnings may be adversely impacted if the U.S. dollar strengthens significantly against these foreign currencies.
The loss of key personnel could prevent us from executing our business strategy.
Our business and prospects depend to a significant degree upon the continuing contributions of our executive officers and key technical and other personnel. Competition for such personnel is intense, and there can be no assurance that we will be successful in attracting and retaining qualified personnel. Failure to attract and retain key personnel could result in our failure to execute our business strategy.
Our failure to comply effectively with the requirements of applicable environmental legislation and regulation could have a material adverse effect on our revenue and profitability.
Production and marketing of products in certain states and countries may subject us to environmental and other regulations. In addition, certain states and countries may pass new regulations requiring our products to meet certain requirements to use environmentally friendly components. The European Union has issued two directives relating to chemical substances in electronic products. The Waste Electrical and Electronic Equipment Directive (WEEE) makes producers of certain electrical and electronic equipment financially responsible for collection, reuse, recycling, treatment and disposal of equipment placed in the European Union market. The Restrictions of Hazardous Substances Directive (RoHS) bans the use of certain hazardous materials in electric and electrical equipment which are put on the market in the European Union. In the future, China and other countries including the United States are expected to adopt further environmental compliance programs. If we fail to comply with these regulations, we may not be able to sell our products in jurisdictions where these regulations apply, which could have a material adverse effect on our revenue and profitability.
Negative conditions in the global credit markets may impair a portion of our investment portfolio.
Our investment portfolio consists of certificates of deposit, commercial paper, money market funds, corporate bonds and government municipal bonds. These marketable securities are classified as available-for-sale and are carried at fair market value. Some of our investments could experience reduced liquidity and could result in an impairment charge should the impairment be considered as other-than-temporary. This loss would be recorded in our consolidated statement of operations, which could materially adversely impact our consolidated results of operations and financial condition.
Unanticipated changes in our tax rates could affect our future results.
Our future effective tax rates could be favorably or unfavorably affected by unanticipated changes in the mix of earnings in countries with differing statutory tax rates, changes in the valuation of our deferred tax assets and liabilities, or by changes in tax laws or our interpretation of such laws. In addition, we may be subject to the examination of our income tax returns by the Internal Revenue Service and other U.S. and international tax authorities. We regularly assess the potential outcomes resulting from these examinations to determine the adequacy of our provision for income taxes. There can be no assurance that the outcomes from these examinations will not have an effect on our consolidated operating results and financial condition.
16
We may have additional tax liabilities.
We are subject to income taxes in the United States and many foreign jurisdictions. Significant judgment is required in determining our worldwide provision for income taxes, including our reserves for uncertain tax positions. In the ordinary course of business, there are many transactions and calculations where the ultimate tax determination is uncertain. We regularly are under audit by tax authorities. Although we believe our tax estimates are reasonable, the final determination of tax audits could be materially different from our historical income tax provisions and accruals. The results of an audit could have a material effect on our consolidated financial position, results of operations, or cash flows in the period or periods for which that determination is made.
Risks Related to Our Common Stock
The price of our common stock has been volatile and could continue to fluctuate in the future.
The market price of our common stock, like that of many other high-technology companies, has fluctuated significantly and is likely to continue to fluctuate in the future. During fiscal year 2015, the closing price of our common stock on the NASDAQ Global Select Market ranged from $7.14 to $11.86 per share. Our closing sale price on November 23, 2015 was $12.50 per share. Announcements by us or others regarding the receipt of customer orders, quarterly variations in operating results, departures of key personnel, acquisitions or divestitures, additional equity or debt financings, results of customer field trials, scientific discoveries, technological innovations, litigation, product developments, patent or proprietary rights, government regulation and general market conditions and risks may, for example, have a significant impact on the market price of our common stock.
If our stock price declines over a sustained period of time or our profits significantly decrease, we may need to recognize an impairment of our goodwill.
The price of our common stock could decline. If such a decline continued over a sustained period of time, we could have an impairment of our goodwill. Our market value is dependent upon certain factors, including continued future growth of our products and solutions. If such growth does not materialize or our forecasts are not met, our profits could be significantly reduced and our market value may decline, which could result in an impairment of our goodwill. Goodwill is tested for impairment on an annual basis as of June 30, or more frequently if events or circumstances occur which could indicate impairment.
Certain provisions of the Delaware General Corporation Law and our charter documents have an anti-takeover effect.
There exist certain mechanisms under the Delaware General Corporation Law and our charter documents that may delay, defer or prevent a change of control. For instance, under Delaware law, we are prohibited from engaging in certain business combinations with interested stockholders for a period of three years after the date of the transaction in which the person became an interested stockholder unless certain requirements are met, and majority stockholder approval is required for certain business combination transactions with interested parties.
Our Certificate of Incorporation contains a “fair price” provision requiring majority stockholder approval for certain business combination transactions with interested parties, and this provision may not be changed without the vote of at least 80% of the outstanding shares of our voting stock. Other mechanisms in our charter documents may also delay, defer or prevent a change of control. For instance, our Certificate of Incorporation provides that our Board of Directors has authority to issue series of our preferred stock with such voting rights and other powers as the Board of Directors may determine. Furthermore, we have a classified board of directors, which means that our directors are divided into three classes that are elected to three-year terms on a staggered basis. Since the three-year terms of each class overlap the terms of the other classes of directors, the entire board of directors cannot be replaced in any one year. Under Delaware law, directors serving on a classified board may not be removed by shareholders except for cause. Also, pursuant to the terms of our shareholder rights plan, each outstanding share of common stock has one attached right. The rights will cause substantial dilution of the ownership of a person or group that attempts to acquire us on terms not approved by the Board of Directors and may have the effect of deterring hostile takeover attempts. The effect of these anti-takeover provisions may deter business combination transactions not approved by our Board of Directors, including acquisitions that may offer a premium over the market price to some or all stockholders.
ITEM 1B. UNRESOLVED STAFF COMMENTS
None.
17
ITEM 2. PROPERTIES
The following table contains a listing of our significant property locations as of September 30, 2015:
Location of Property | Use of Facility | Approximate Square Footage | Ownership or Lease Expiration Date | |||
Minnetonka, MN (Corporate headquarters) | Research & development, sales, sales support, marketing and administration | 130,000 | Owned | |||
Eden Prairie, MN | Manufacturing and warehousing | 58,000 | Owned | |||
Minneapolis, MN | Engineering services | 16,837 | November 2016 | |||
Waltham, MA | Research & development, sales and sales support | 4,249 | October 2020 | |||
Rochester, MN | Engineering services | 3,090 | September 2016 | |||
Lindon, UT | Sales, technical support, research & development and administration | 11,986 | December 2020 | |||
Herndon, VA | Sales, marketing and technical support | 2,416 | October 2017 | |||
Hong Kong, China | Sales, marketing and administration | 1,656 | April 2016 | |||
Beijing, China | Sales, marketing and administration | 3,149 | November 2016 | |||
Shanghai, China | Sales, marketing and administration | 1,991 | May 2017 | |||
Dortmund, Germany | Sales, sales support, marketing and administration | 9,293 | March 2016 | |||
Ismaning, Germany | Sales, sales support and marketing | 6,878 | September 2019 | |||
Neuilly sur Seine, France | Sales and marketing | 2,895 | January 2018 | |||
Logrono, Spain | Sales, research & development and administration | 3,228 | November 2018 | |||
Tokyo, Japan | Sales | 1,371 | Perpetual | |||
Singapore | Sales, marketing and administration | 3,498 | April 2017 | |||
In addition to the above locations, we perform sales activities in various other locations in Europe which are not deemed to be principal locations and which are not listed above. In connection with our sale of the Etherios business on October 23, 2015, we no longer maintain operations in Chicago, IL, Dallas, TX or San Francisco, CA.
ITEM 3. LEGAL PROCEEDINGS
In the normal course of business, we are subject to various claims and litigation, which may include, but are not limited to, patent infringement and intellectual property claims. While we are unable to predict the outcome of any potential claims or litigation due to the inherent unpredictability of these matters, we believe that it is possible that we could, in the future, incur judgments or enter into settlements of claims that could have a material adverse effect on our operations in any particular period.
ITEM 4. MINE SAFETY DISCLOSURES
None.
18
PART II.
ITEM 5. MARKET FOR REGISTRANT’S COMMON EQUITY, RELATED STOCKHOLDER MATTERS AND ISSUER PURCHASES OF EQUITY SECURITIES
Stock Listing
Our common stock trades under the symbol DGII on the NASDAQ Global Select Market tier of the NASDAQ Stock Market LLC. On November 23, 2015 there were 129 shareholders of record.
The high and low sale prices for our common stock for each quarter during the years ended September 30, 2015 and 2014, as reported on the NASDAQ Stock Market LLC, were:
Stock Prices
2015 | First | Second | Third | Fourth | ||||||||||||
High | $ | 9.45 | $ | 10.78 | $ | 10.69 | $ | 12.08 | ||||||||
Low | $ | 6.90 | $ | 8.23 | $ | 8.95 | $ | 9.39 | ||||||||
2014 | First | Second | Third | Fourth | ||||||||||||
High | $ | 12.50 | $ | 12.75 | $ | 10.73 | $ | 9.53 | ||||||||
Low | $ | 9.39 | $ | 9.38 | $ | 7.90 | $ | 7.46 | ||||||||
Dividend Policy
We have never paid cash dividends on our common stock. Our Board of Directors presently intends to retain all earnings for use in our business, except for periodic stock repurchases, and does not anticipate paying cash dividends in the foreseeable future.
Issuer Repurchases of Equity Securities
On October 28, 2014, our Board of Directors authorized a program to repurchase up to $15.0 million of our common stock, primarily to return capital to shareholders and to support our employee stock purchase program. This repurchase authorization began on November 1, 2014 and expired on October 31, 2015. Shares repurchased under this program were permitted either through open market or privately negotiated transactions from time to time and in amounts that management deemed appropriate. There were no shares repurchased under this program.
On October 29, 2013, our Board of Directors authorized a program to repurchase up to $20.0 million of our common stock. We repurchased 287,787 shares for $2.2 million under this program during the first quarter of fiscal 2015. This repurchase authorization expired on October 31, 2014.
19
ITEM 5. MARKET FOR REGISTRANT’S COMMON EQUITY, RELATED STOCKHOLDER MATTERS AND ISSUER PURCHASES OF EQUITY SECURITIES (CONTINUED)
Performance Evaluation
The graph below compares the total cumulative stockholders’ return on our Common Stock for the period from the close of the NASDAQ Stock Market - U.S. Companies on September 30, 2010 to September 30, 2015, the last day of fiscal 2015, with the total cumulative return for the NASDAQ U.S. Benchmark TR Index (the "U.S. Benchmark Index") and the NASDAQ Telecommunications Index (the “Peer Index”) over the same period. We have determined that our line of business is mostly comparable to those companies in the Peer Index. The index level for the graph and table was set to $100 on September 30, 2010, for our Common Stock, the U.S. Benchmark Index and the Peer Index and assumes the reinvestment of all dividends.
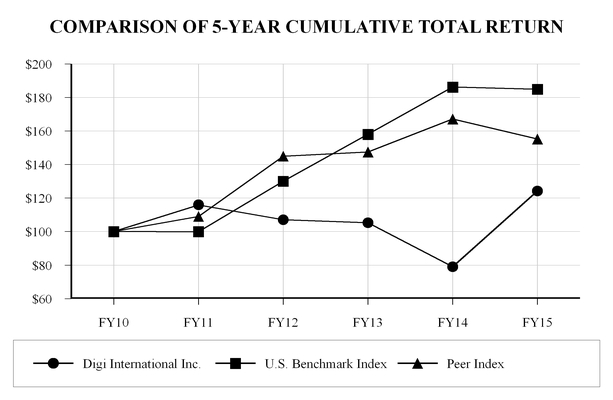
FY10 | FY11 | FY12 | FY13 | FY14 | FY15 | |||||||||||||||||||
Digi International Inc. | $ | 100.00 | $ | 115.91 | $ | 107.06 | $ | 105.27 | $ | 79.03 | $ | 124.24 | ||||||||||||
U.S. Benchmark Index | $ | 100.00 | $ | 99.95 | $ | 130.07 | $ | 158.04 | $ | 186.25 | $ | 184.93 | ||||||||||||
Peer Index | $ | 100.00 | $ | 109.03 | $ | 144.98 | $ | 147.45 | $ | 167.13 | $ | 155.21 | ||||||||||||
20
ITEM 6. SELECTED FINANCIAL DATA
(in thousands, except per common share data amounts and number of employees)
For Fiscal Years Ended September 30, | 2015 | 2014 | 2013 | 2012 | 2011 | ||||||||||||||
Revenue (1) | $ | 212,858 | $ | 192,701 | $ | 195,381 | $ | 190,558 | $ | 204,160 | |||||||||
Gross profit | $ | 98,031 | $ | 90,484 | $ | 100,123 | $ | 100,337 | $ | 106,588 | |||||||||
Sales and marketing | 39,544 | 40,576 | 40,513 | 39,242 | 39,549 | ||||||||||||||
Research and development | 32,047 | 29,789 | 30,327 | 30,767 | 31,642 | ||||||||||||||
General and administrative (2) | 19,514 | 19,913 | 21,423 | 18,188 | 18,206 | ||||||||||||||
Restructuring charges, net | 509 | 81 | 313 | 1,259 | 154 | ||||||||||||||
Operating income | 6,417 | 125 | 7,547 | 10,881 | 17,037 | ||||||||||||||
Total other income (expense), net (3) | 2,228 | 672 | 691 | 16 | (522 | ) | |||||||||||||
Income before income taxes | 8,645 | 797 | 8,238 | 10,897 | 16,515 | ||||||||||||||
Income tax provision (benefit) (4) | 2,057 | (954 | ) | 2,433 | 3,282 | 5,496 | |||||||||||||
Net income | $ | 6,588 | $ | 1,751 | $ | 5,805 | $ | 7,615 | $ | 11,019 | |||||||||
Net income per common share - basic | $ | 0.27 | $ | 0.07 | $ | 0.22 | $ | 0.30 | $ | 0.44 | |||||||||
Net income per common share - diluted | $ | 0.26 | $ | 0.07 | $ | 0.22 | $ | 0.29 | $ | 0.43 | |||||||||
Balance sheet data as of September 30, | |||||||||||||||||||
Working capital (current assets less current liabilities) | $ | 136,996 | $ | 125,927 | $ | 127,672 | $ | 155,035 | $ | 142,406 | |||||||||
Total assets | $ | 300,360 | $ | 290,459 | $ | 299,930 | $ | 293,403 | $ | 283,875 | |||||||||
Stockholders' equity | $ | 274,938 | $ | 265,298 | $ | 274,243 | $ | 270,834 | $ | 260,693 | |||||||||
Book value per common share (stockholders' equity divided by outstanding shares) | $ | 10.98 | $ | 10.88 | $ | 10.73 | $ | 10.45 | $ | 10.17 | |||||||||
Number of employees as of September 30 | 565 | 649 | 686 | 643 | 691 | ||||||||||||||
(1) | Etherios, acquired on October 31, 2012, provided $11.0 million of revenue in fiscal 2013. |
(2) | Included in general and administrative expense in fiscal 2013 is $1.5 million ($1.0 million after tax) related to the patent infringement lawsuit settlement for U.S. Ethernet Innovations. (See Note 16 to our Consolidated Financial Statements). |
(3) | Included in total other income (expense), net for fiscal 2015 is a $1.4 million gain from the settlement of a property and casualty insurance claim related to the replacement of our capital equipment destroyed in the fire at our subcontract manufacturer's location in Thailand. |
(4) | In fiscal 2015, 2014 and 2013, we recorded net tax benefits of $0.9 million, $1.4 million and $0.8 million, respectively (see Note 10 to our Consolidated Financial Statements). In fiscal 2012 we recorded $1.5 million of additional research and development tax credits pertaining to prior fiscal years and reversed tax reserves for closure of various jurisdiction's tax matters and tax rate reductions in foreign jurisdictions. In fiscal 2011, we reversed $0.7 million of income tax reserves from various jurisdictions, primarily foreign, related to the expiration of the statute of limitations. |
21
ITEM 7. MANAGEMENT’S DISCUSSION AND ANALYSIS OF FINANCIAL CONDITION AND RESULTS OF OPERATIONS
Our management’s discussion and analysis should be read in conjunction with our consolidated financial statements and other information in this Annual Report on Form 10-K for the fiscal year ended September 30, 2015.
OVERVIEW
We provide a wide range of wireless products for the IoT, a cloud computing platform tailored to enable monitoring and remote control of devices and development services to help customers get to market fast with wireless devices and applications. Our solution set is capable of allowing any device to communicate with any application, anywhere in the world.
We have a single operating and reporting segment. Our revenue consists of hardware product revenue and service revenue. Our hardware product offerings are comprised of our cellular routers and gateways, RF, embedded and network products. Our service offerings include wireless design services, Digi Device Cloud (which includes Digi Remote Manager™) and enterprise support services. CRM consulting services are included in our fiscal 2015, 2014 and 2013 financial results. That business was sold during the first fiscal quarter of 2016 to West Monroe Partners, LLC. Digi Cold Chain solutions, which was formed in October 2015 through our acquisition of Bluenica Corporation, is also one of our service offerings. For more information on our acquisition and disposition, see Note 18 to our Consolidated Financial Statements.
We utilize many financial, operational, and other metrics to evaluate our financial condition and financial performance. Below we highlight the fiscal 2015 metrics that we feel are most important in these evaluations:
• | Revenue was $212.9 Million. We recorded record annual revenue in fiscal 2015. Our revenue increased by $20.2 million, or 10.5%, compared to revenue of approximately $192.7 million in fiscal 2014. The increase in revenue was primarily attributable to increases in revenue in our cellular router and gateway products and RF modules. |
• | Gross Margin was 46.1%. Our gross margin decreased as a percentage of revenue to 46.1% in fiscal 2015 from 47.0% in fiscal 2014. This decrease primarily was related to our hardware product gross margin, which was 48.3% in fiscal 2015, compared to 50.4% in the prior fiscal year. Our growth products increased as a percent of our total revenue in fiscal 2015, which created a decrease in gross margin as these products typically have a lower gross margin than our mature products. Additionally we incurred additional manufacturing expenses to recover from the impact of the fire at our subcontract manufacturer in Thailand that took place in November 2014. This was offset partially by an increase in service gross margin. Service gross margin for fiscal 2015 was 21.2% compared to 17.0% in the prior fiscal year as service gross margin benefited from improved utilization of consulting labor in connection with the restructuring of our CRM business in the second quarter of fiscal 2015. |
• | Net Income was $6.6 Million and Earnings Per Diluted Share were $0.26. Our net income increased by $4.8 million, or 276.2%, compared to net income of $1.8 million in fiscal 2014. Earnings per diluted share were $0.26 in fiscal 2015, compared to $0.07 in fiscal 2014. The increases in both net income and earnings per diluted share resulted from an increase in gross profit of $7.5 million in fiscal 2015 partially offset by an increase in operating expenses of $1.3 million compared to the prior fiscal year. Our net income in fiscal 2015 also included $1.4 million of insurance proceeds associated with the fire at our subcontract manufacturer. |
• | Adjusted Earnings Before Interest, Taxes, Depreciation and Amortization adjusted for gain from insurance recovery (Adjusted EBITDA) was $12.9 Million. Our Adjusted EBITDA was $12.9 million, or 6.1% of revenue, in fiscal 2015, compared to $7.8 million, or 4.0% of revenue, in fiscal 2014. We believe that the presentation of Adjusted EBITDA as a percentage of revenue, which is a non-GAAP financial measure, is useful because it provides a consistent approach to measuring our performance from year to year and to assess our performance against that of other companies. We also believe this information helps compare operating results and corporate performance exclusive of the impact of our capital structure and the method by which assets were acquired. Earnings before interest, taxes, depreciation and amortization (EBITDA) is used as an internal metric for executive compensation, as well as incentive compensation for the rest of the employee base. It is monitored quarterly for these purposes. Below is a table reconciling net income to Adjusted EBITDA (in thousands): |
22
ITEM 7. MANAGEMENT'S DISCUSSION AND ANALYSIS OF FINANCIAL CONDITION AND RESULTS OF OPERATIONS (CONTINUED)
Year ended September 30, | ||||||||||||||
2015 | 2014 | |||||||||||||
% of total revenue | % of total revenue | |||||||||||||
Total revenue | $ | 212,858 | 100.0 | % | $ | 192,701 | 100.0 | % | ||||||
Net income | $ | 6,588 | 3.1 | % | $ | 1,751 | 0.9 | % | ||||||
Gain from insurance recovery | (1,375 | ) | (0.7 | ) | — | — | ||||||||
Interest income, net | (214 | ) | (0.1 | ) | (171 | ) | (0.1 | ) | ||||||
Income tax provision (benefit) | 2,057 | 1.0 | (954 | ) | (0.5 | ) | ||||||||
Depreciation and amortization | 5,859 | 2.8 | 7,146 | 3.7 | ||||||||||
Adjusted earnings before interest, taxes, depreciation and amortization adjusted for gain from insurance recovery | $ | 12,915 | 6.1 | % | $ | 7,772 | 4.0 | % | ||||||
• | Our Balance Sheet was Positively Impacted by Investing and Financing Decisions. Our current ratio was 6.9 to 1 at September 30, 2015, compared to 6.8 to 1 at September 30, 2014. Cash and cash equivalents and marketable securities, including long-term marketable securities, increased $13.9 million to $105.8 million at September 30, 2015 from $91.9 million at September 30, 2014. During fiscal 2015, we repurchased $2.2 million of our common stock (see Note 12 to our Consolidated Financial Statements). |
We accomplished a number of key initiatives in fiscal 2015 and also faced significant challenges relative to our business.
Accomplishments
• | We hired a new Chief Executive Officer, Ronald E. Konezny, and a new Chief Financial Officer, Michael Goergen, following the retirement announcements of former CEO, Joseph Dunsmore, in fiscal 2014 and former CFO, Steven Snyder, in fiscal 2015. We also elected a new director, Spiro C. Lazarakis. |
• | We achieved record annual revenues of approximately $213 million in fiscal 2015 that, together with an increased focus on our operating expenses, drove a more than 275% increase in our net income. |
• | Our cellular products experienced over 45% revenue growth vs. fiscal 2014. We believe this growth rate significantly outpaced the industry average. |
• | Our RF products experienced over 18% revenue growth vs. fiscal 2014 despite headwinds relative to customers in industries facing economic difficulties such as oil and gas producers. |
• | We expanded relationships with key customers of our embedded products which should provide us with steady streams of revenue for several years. |
• | We expanded relationships with key distribution partners such as Mouser, Avnet and DigiKey to include global territories. We believe this further strengthens our ability to service customers outside of North America. |
• | We restructured our services business during the second quarter of fiscal 2015 and completed the sale of our CRM consulting business in the first quarter of fiscal 2016. These actions are expected to improve our business focus, cost structure and profitability. |
• | In early October, 2015 we completed the acquisition of Bluenica Corporation, which will serve as the basis for our Digi Cold Chain solution. We anticipate this industry-focused solution will provide us with a solid foundation of recurring revenue and a higher margin business. |
Challenges
• | A key contract manufacturer in Thailand suffered a fire during the first quarter of fiscal 2015 that disrupted our manufacturing operations during the first half of fiscal 2015. |
• | Our services business experienced a revenue decline of 12.6% during fiscal 2015 vs. fiscal 2014, including an approximate $2.0 million decline for Wireless Design Services. |
23
ITEM 7. MANAGEMENT'S DISCUSSION AND ANALYSIS OF FINANCIAL CONDITION AND RESULTS OF OPERATIONS (CONTINUED)
• | As expected, our network products continued to experience revenue decline. In fiscal 2015 these products were down approximately 6% in fiscal 2015 as compared to fiscal 2014. This ongoing trend presents a challenge to us as these products produce higher gross margins than other products we sell. We expect continued future decreases in network product revenue of 5% to 15% annually. |
• | Our EMEA sales were challenged by macro-economic conditions. Currency fluctuations in the region had a negative impact of $3.2 million on our revenue in fiscal 2015 as compared to fiscal 2014. |
CONSOLIDATED RESULTS OF OPERATIONS
The following table sets forth selected information derived from our Consolidated Statements of Operations, expressed in dollars and as a percentage of revenue and as a percentage of change from year-to-year for the years indicated.
Year ended September 30, | % Increase (decrease) | ||||||||||||||||||||||||||
($ in thousands) | 2015 | 2014 | 2013 | 2015 compared to 2014 | 2014 compared to 2013 | ||||||||||||||||||||||
Revenue: | |||||||||||||||||||||||||||
Hardware product | $ | 195,497 | 91.8 | % | $ | 172,846 | 89.7 | % | $ | 173,078 | 88.6 | % | 13.1 | % | (0.1 | )% | |||||||||||
Service | 17,361 | 8.2 | 19,855 | 10.3 | 22,303 | 11.4 | (12.6 | ) | (11.0 | ) | |||||||||||||||||
Total revenue | 212,858 | 100.0 | 192,701 | 100.0 | 195,381 | 100.0 | 10.5 | (1.4 | ) | ||||||||||||||||||
Cost of sales: | |||||||||||||||||||||||||||
Cost of hardware product | 101,155 | 47.5 | 85,737 | 44.5 | 82,276 | 42.1 | 18.0 | 4.2 | |||||||||||||||||||
Cost of service | 13,672 | 6.4 | 16,480 | 8.5 | 12,982 | 6.7 | (17.0 | ) | 26.9 | ||||||||||||||||||
Total cost of sales | 114,827 | 53.9 | 102,217 | 53.0 | 95,258 | 48.8 | 12.3 | 7.3 | |||||||||||||||||||
Gross profit | 98,031 | 46.1 | 90,484 | 47.0 | 100,123 | 51.2 | 8.3 | (9.6 | ) | ||||||||||||||||||
Operating expenses: | |||||||||||||||||||||||||||
Sales and marketing | 39,544 | 18.6 | 40,576 | 21.1 | 40,513 | 20.7 | (2.5 | ) | 0.2 | ||||||||||||||||||
Research and development | 32,047 | 15.1 | 29,789 | 15.5 | 30,327 | 15.5 | 7.6 | (1.8 | ) | ||||||||||||||||||
General and administrative | 19,514 | 9.2 | 19,913 | 10.3 | 21,423 | 11.0 | (2.0 | ) | (7.0 | ) | |||||||||||||||||
Restructuring charges, net | 509 | 0.2 | 81 | — | 313 | 0.2 | 528.4 | (74.1 | ) | ||||||||||||||||||
Total operating expenses | 91,614 | 43.1 | 90,359 | 46.9 | 92,576 | 47.4 | 1.4 | (2.4 | ) | ||||||||||||||||||
Operating income | 6,417 | 3.0 | 125 | 0.1 | 7,547 | 3.8 | 5,033.6 | (98.3 | ) | ||||||||||||||||||
Other income, net | 2,228 | 1.1 | 672 | 0.3 | 691 | 0.4 | 231.5 | (2.7 | ) | ||||||||||||||||||
Income before income taxes | 8,645 | 4.1 | 797 | 0.4 | 8,238 | 4.2 | 984.7 | (90.3 | ) | ||||||||||||||||||
Income tax provision (benefit) | 2,057 | 1.0 | (954 | ) | (0.5 | ) | 2,433 | 1.2 | 315.6 | (139.2 | ) | ||||||||||||||||
Net income | $ | 6,588 | 3.1 | % | $ | 1,751 | 0.9 | % | $ | 5,805 | 3.0 | % | 276.2 | % | (69.8 | )% | |||||||||||
REVENUE
Overview
Total revenue was $212.9 million in fiscal 2015 compared to $192.7 million in fiscal 2014, an increase of $20.2 million or 10.5%. Product revenue increased by $22.7 million, or 13.1%, partially offset by a decline in service revenue of $2.5 million, or 12.6%. Total revenue was $192.7 million in fiscal 2014 compared to $195.4 million in fiscal 2013, a decrease of $2.7 million or 1.4%. Product revenue decreased by $0.3 million, or 0.1%, and service revenue decreased by $2.4 million, or 11.0%. We did not experience a material change in revenue due to pricing during fiscal 2015, 2014 or 2013.
In fiscal 2015, foreign currency rates compared to the prior year's rates had an unfavorable impact on revenue of $3.4 million. Fluctuation in foreign currency rates compared to the prior year’s rates had a favorable impact on revenue of $0.8 million in fiscal 2014 and an unfavorable impact on revenue of $0.1 million in fiscal 2013.
Hardware Products
In an effort to provide further transparency of our financial information we have expanded our hardware product categories for revenue reporting. Beginning with the first quarter of fiscal 2016, we will transition away from reporting revenue in terms of
24
ITEM 7. MANAGEMENT'S DISCUSSION AND ANALYSIS OF FINANCIAL CONDITION AND RESULTS OF OPERATIONS (CONTINUED)
growth and mature hardware products and will report four product categories: Cellular routers and gateways, RF, Embedded and Network. We believe this is a more meaningful presentation and reflects how we are monitoring our revenue.
Our cellular product category includes our cellular routers and all gateways. Our RF product category includes our XBee® modules as well as other RF Solutions. Our Embedded product category includes Digi Connect® and Rabbit® embedded systems on module and single board computers. Our network product category, which has the highest concentration of mature products, includes console and serial servers and USB connected products.
Our growth hardware product offerings include all wireless products as well as the ARM-based embedded module product line with both wired and wireless connectivity. Our mature hardware product offerings include generally all wired products, such as our serial servers, Rabbit®-branded modules, chips and USB hardware offerings along with satellite-related products (which we discontinued in fiscal 2014).
The following summarizes our product revenue by product categories:
Product Revenue | % of Product Revenue | ||||||||||||||||||||
($ in millions) | 2015 | 2014 | 2013 | 2015 | 2014 | 2013 | |||||||||||||||
Cellular routers and gateways | $ | 58.7 | $ | 39.2 | $ | 33.2 | 30.0 | % | 22.7 | % | 19.1 | % | |||||||||
RF | 34.4 | 29.1 | 29.2 | 17.6 | % | 16.8 | % | 16.9 | % | ||||||||||||
Embedded | 51.0 | 49.6 | 57.6 | 26.1 | % | 28.7 | % | 33.3 | % | ||||||||||||
Network | 51.4 | 54.9 | 53.1 | 26.3 | % | 31.8 | % | 30.7 | % | ||||||||||||
Total product revenue | $ | 195.5 | $ | 172.8 | $ | 173.1 | 100.0 | % | 100.0 | % | 100.0 | % | |||||||||
Growth hardware products | $ | 116.2 | $ | 89.9 | $ | 88.1 | 59.4 | % | 52.0 | % | 50.9 | % | |||||||||
Mature hardware products | 79.3 | 82.9 | 85.0 | 40.6 | % | 48.0 | % | 49.1 | % | ||||||||||||
Total product revenue | $ | 195.5 | $ | 172.8 | $ | 173.1 | 100.0 | % | 100.0 | % | 100.0 | % | |||||||||
2015 Compared to 2014
Cellular routers and gateway product revenue increased $19.5 million, or 49.6%, in fiscal 2015 as compared to fiscal 2014. These increases primarily were due to a growing market performance and expanding market share with large sales to certain customers of our cellular routers and gateway products. We believe sales of these products in fiscal 2015 significantly outpaced the industry growth rate. While we remain optimistic about the sales performance of these products in fiscal 2016, growth rates could differ materially from fiscal 2015. All of our cellular products are included in the growth product category.
RF product revenue increased $5.3 million, or 18.1%, in fiscal 2015 as compared to fiscal 2014 primarily due to larger sales to certain customers of modules and wireless communication adapters. All of our RF products are included in the growth product category.
Embedded product revenue increased by $1.4 million, or 2.8%, in fiscal 2015 as compared to fiscal 2014 primarily related to our embedded modules and chips, partially offset by a decrease in the sales of Rabbit®-branded modules, which are in the mature portion of their product life cycle.
Network product revenue decreased $3.5 million, or 6.3%, in fiscal 2015 as compared to fiscal 2014. The decrease was mostly due to a decrease in sales of serial cards which are in the mature portion of their product life cycle. There was also a decrease in USB connected products, device servers and satellite products (which have been discontinued), partially offset by an increase in revenue from terminal servers. All of our network products are included in the mature product category. We expect that revenue from these products will continue to decrease in the future.
2014 Compared to 2013
Cellular routers and gateway product revenue increased $6.0 million, or 18.0%, in fiscal 2014 as compared to fiscal 2013. This increase primarily was due to large sales to certain customers of our cellular routers and gateway products. All of our cellular products are included in the growth product category.
25
ITEM 7. MANAGEMENT'S DISCUSSION AND ANALYSIS OF FINANCIAL CONDITION AND RESULTS OF OPERATIONS (CONTINUED)
RF product revenue was flat in fiscal 2014 as compared to the prior fiscal year. All of our RF products are included in the growth product category.
Embedded product revenue decreased $7.9 million, or 13.7%, in fiscal 2014 as compared to fiscal 2013 related to modules as certain customers delayed purchases. Embedded products also declined since Rabbit®-branded modules and chips are in the mature portion of their product life cycles.
Network product revenue increased $1.7 million, or 3.3%, in fiscal 2014 as compared to fiscal 2013 primarily related to the increase in satellite product revenue resulting from the announcement of the discontinuation of these satellite products early in fiscal 2014 which prompted final purchases from customers. All of our network products are included in the mature product category.
Service
2015 Compared to 2014
Our service offerings in fiscal 2015 include wireless design services, Etherios CRM services, revenue generated from the Digi Device Cloud platform and our enterprise support services. The significant majority of our service revenue was generated from our Etherios CRM services and our wireless design services. We completed the sale of our Etherios business in the first quarter of fiscal 2016.
Service revenue for fiscal 2015 was $17.4 million compared to $19.9 million in the prior fiscal year, a decrease of $2.5 million, or 12.6%. The decrease was primarily due to declines of $2.0 million in fiscal 2015 of our wireless design services.
2014 Compared to 2013
Service revenue for fiscal 2014 was $19.9 million compared to $22.3 in the prior fiscal year, a decrease of $2.4 million, or 11.0%. The decrease is primarily due to a decline in revenue in fiscal 2014 of $1.4 million for our Etherios CRM services and $0.9 million for our wireless design services as certain customers cancelled or deferred projects that were not replaced.
Revenue by Geographic Location
Our revenue by geographic location of our customers was as follows:
Revenue | % of Revenue | ||||||||||||||||||||
($ in millions) | 2015 | 2014 | 2013 | 2015 | 2014 | 2013 | |||||||||||||||
North America, primarily United States | $ | 136.6 | $ | 116.4 | $ | 116.6 | 64.2 | % | 60.4 | % | 59.7 | % | |||||||||
Europe, Middle East & Africa | 47.6 | 47.7 | 48.8 | 22.3 | % | 24.8 | % | 25.0 | % | ||||||||||||
Asia | 22.9 | 22.8 | 24.5 | 10.8 | % | 11.8 | % | 12.5 | % | ||||||||||||
Latin America | 5.8 | 5.8 | 5.5 | 2.7 | % | 3.0 | % | 2.8 | % | ||||||||||||
Total revenue | $ | 212.9 | $ | 192.7 | $ | 195.4 | 100.0 | % | 100.0 | % | 100.0 | % | |||||||||
2015 Compared to 2014
North America revenue in fiscal 2015 increased $20.2 million, or 17.3%, compared to fiscal 2014, as certain customers made large purchases of our cellular products. There was also an increase in revenue from our RF and embedded modules and serial servers, partially offset by a decline of $2.5 million in service revenue.
EMEA revenue decreased $0.1 million, or 0.4%, in fiscal 2015 as compared to fiscal 2014. The decrease primarily was due to fluctuations of foreign currency rates, which had an unfavorable impact on total revenue of $3.2 million for fiscal 2015 as compared to fiscal 2014 due to the weakening of the Euro and British Pound compared to the U.S. Dollar. This was offset partially by increased revenue from cellular products and embedded products compared to the prior fiscal year.
Asian countries revenue increased $0.1 million, or 0.6%, in fiscal 2015 as compared to fiscal 2014.
Latin America revenue remained flat in fiscal 2015 as compared to fiscal 2014.
26
ITEM 7. MANAGEMENT'S DISCUSSION AND ANALYSIS OF FINANCIAL CONDITION AND RESULTS OF OPERATIONS (CONTINUED)
2014 Compared to 2013
North America revenue in fiscal 2014 decreased $0.2 million, or 0.1%, compared to fiscal 2013. This was primarily due to a $2.4 million decrease in service revenue as certain customers cancelled or deferred projects that were not replaced and a reduction in embedded modules revenue that resulted from delays in purchases by certain OEM customers. This was offset partially by an increase in cellular products lines.
EMEA revenue decreased $1.1 million, or 2.2%, in fiscal 2014 from fiscal 2013. This primarily was due to lower project-based customer purchases, particularly in the cellular product lines. It was offset partially by a favorable impact from fluctuations in foreign currency rates due to the strengthening of the British Pound and Euro compared to the U.S. Dollar.
Revenue in Asian countries decreased by $1.7 million, or 7.1%, in fiscal 2014 compared to fiscal 2013 mostly related to lower revenue from chips, serial servers and USB connected products as they are all mature products. We also experienced a decrease in our embedded modules and cellular-related products. This was offset partially by an increase in satellite-related products as we experienced increased demand when we announced in early fiscal 2014 that these products would be discontinued.
Latin America revenue increased by $0.3 million, or 4.9%, in fiscal 2014 from fiscal 2013. This primarily was due to an increase in revenue from cellular products and embedded modules.
Revenue by Distribution Channel
The following table presents our revenue by distribution channel:
Revenue | % of Revenue | ||||||||||||||||||||
($ in millions) | 2015 | 2014 | 2013 | 2015 | 2014 | 2013 | |||||||||||||||
Direct/OEM channel | $ | 87.0 | $ | 77.2 | $ | 80.0 | 40.9 | % | 40.1 | % | 40.9 | % | |||||||||
Distributors channel | 125.9 | 115.5 | 115.4 | 59.1 | % | 59.9 | % | 59.1 | % | ||||||||||||
Total revenue | $ | 212.9 | $ | 192.7 | $ | 195.4 | 100.0 | % | 100.0 | % | 100.0 | % | |||||||||
2015 Compared to 2014
During fiscal 2015, revenue in our Direct/OEM channel increased $9.8 million, or 12.6%, compared to revenue in fiscal 2014 due to large sales to certain customers. Revenue in fiscal 2015 for our distributors increased by $10.4 million, or 9.0%, compared to revenue in fiscal 2014. We have been taking steps to expand our relationship with certain distributors who have a global reach.
2014 Compared to 2013
Revenue in fiscal 2014 in our Direct/OEM channel decreased by $2.8 million, or 3.5%, compared to the prior fiscal year mostly due to a decrease in revenue from our service offerings, which are typically sold through direct channels. During fiscal 2014, revenue by our distributors increased by $0.1 million, or 0.1%, compared to revenue in fiscal 2013.
GROSS PROFIT
2015 Compared to 2014
Gross profit was $98.0 million and $90.5 million in fiscal 2015 and 2014, respectively, an increase of $7.5 million, or 8.3%. The gross margin for fiscal 2015 was 46.1% compared to 47.0% in fiscal 2014, a decrease of 0.9 percentage points.
Hardware product gross profit was $94.3 million and $87.1 million in fiscal 2015 and 2014, respectively, an increase of $7.2 million, or 8.3%. The hardware product gross margin for fiscal 2015 was 48.3% compared to 50.4% in fiscal 2014, a decrease of 2.1 percentage points, primarily due to the mix of our hardware products since we sold proportionately more growth hardware products in fiscal 2015 that generally have a lower gross margin compared to mature hardware products. In the future we expect to focus more on securing larger and longer-term opportunities that may impact our gross margins negatively. Additionally, for fiscal 2015, we incurred additional manufacturing expenses to recover from the impact of the Thailand fire that also reduced gross margin.
27
ITEM 7. MANAGEMENT'S DISCUSSION AND ANALYSIS OF FINANCIAL CONDITION AND RESULTS OF OPERATIONS (CONTINUED)
Service gross profit was $3.7 million and $3.4 million in fiscal 2015 and 2014, respectively, an increase of $0.3 million, or 9.3%. The service gross margin for fiscal 2015 was 21.2% compared to 17.0% in fiscal 2014, an increase of 4.2 percentage points. The increase is a direct result of improved utilization of consulting labor in connection with our restructuring (see Note 9 to our Consolidated Financial Statements). We expect our service gross margin to vary from quarter to quarter for the foreseeable future as our wireless product design and development services margins are dependent on the utilization rates of our personnel.
2014 Compared to 2013
Gross profit was $90.5 million and $100.1 million in fiscal 2014 and 2013, respectively, a decrease of $9.6 million, or 9.6%. The gross margin for fiscal 2014 was 47.0% compared to 51.2% in fiscal 2013, a decrease of 4.2 percentage points.
Hardware product gross profit was $87.1 million and $90.8 million in fiscal 2014 and 2013, respectively, a decrease of $3.7 million, or 4.1%. The hardware product gross margin for fiscal 2014 was 50.4% compared to 52.5% in fiscal 2013, a decrease of 2.1 percentage points. The decrease primarily resulted from a change in hardware product mix and customer mix as we sold more products that have a lower gross margin than our more mature products which have a higher gross margin.
Service gross profit was $3.4 million and $9.3 million in fiscal 2014 and 2013, respectively, a decrease of $5.9 million, or 63.8%. The service gross margin for fiscal 2014 was 17.0% compared to 41.8% in fiscal 2013, a decrease of 24.8 percentage points, mostly related to the underutilization of consulting labor that had been retained for the expected demand of our service offerings.
OPERATING EXPENSES
2015 Compared to 2014
Operating expenses were $91.6 million in fiscal 2015, an increase of $1.2 million, or 1.4%, compared to $90.4 million in fiscal 2014. Below is a summary of our operating expenses by function:
Sales and marketing expenses were $39.6 million and $40.6 million in fiscal 2015 and 2014, respectively, a decrease of $1.0 million or 2.5%. The decrease was primarily due to a reduction in travel, facility and compensation-related expenses of $1.5 million, partially offset by an increase in commissions of $0.5 million.
Research and development expenses were $32.0 million and $29.8 million in fiscal 2015 and 2014, respectively, an increase of $2.2 million or 7.6%. Compensation and employee-related expenses increased by $3.1 million primarily due to underutilization of billable research and development and using those employees resources for completing internal products. In addition, incentive compensation expenses increased due to improved company performance in fiscal 2015. This was partially offset by a decrease $0.9 million in other miscellaneous research and development costs and professional services.
General and administrative expenses were $19.5 million and $19.9 million in fiscal 2015 and 2014, respectively, a decrease of $0.4 million or 2.0%. This was primarily due a decrease of $0.7 million related to CEO transition expenses in the fiscal 2014 partially offset by CFO transition expenses in fiscal 2015. General and administrative expenses also decreased $1.0 million in fiscal 2015 compared to the prior fiscal year due to occupancy expenses, miscellaneous general and administrative expenses, depreciation and amortization as certain intangibles were fully amortized. This was partially offset by an increase in professional fees of $0.5 million and compensation and employee-related expenses of $0.8 million mostly related to increased incentive compensation expenses due to improved company performance in fiscal 2015.
Restructuring expenses were $0.5 million and $0.1 million in fiscal 2015 and fiscal 2014, respectively, an increase of $0.4 million. During fiscal 2015, we recorded $0.5 million related to the restructuring of our India and Etherios locations. During fiscal 2014, we recorded a restructuring charge in India of $0.2 million related to actions that were announced October 31, 2013, partially offset by a $0.1 million reversal of our 2013 restructuring of our U.S. operations. For further information on restructuring, see Note 9 to our Consolidated Financial Statements.
2014 Compared to 2013
Operating expenses were $90.4 million in fiscal 2014, a decrease of $2.2 million, or 2.4%, compared to $92.6 million in fiscal 2013. Below is a summary of our operating expenses by function:
28
ITEM 7. MANAGEMENT'S DISCUSSION AND ANALYSIS OF FINANCIAL CONDITION AND RESULTS OF OPERATIONS (CONTINUED)
Sales and marketing expenses were $40.6 million and $40.5 million in fiscal 2014 and 2013, respectively, an increase of $0.1 million or 0.2%. Commissions, travel and professional services increased by $0.7 million, partially offset by a $0.6 million decrease in trade show expenses.
Research and development expenses were $29.8 million and $30.3 million in fiscal 2014 and 2013, respectively, a decrease of $0.5 million or 1.8%. Compensation and employee-related expenses decreased by $0.7 million resulting primarily from lower headcount compared to the prior fiscal year. This was partially offset by $0.2 million in other miscellaneous research and development costs.
General and administrative expenses were $19.9 million and $21.4 million in fiscal 2014 and 2013, respectively, a decrease of $1.5 million or 7.0%. In fiscal 2013 we recorded a charge of $1.5 million due to a settlement on the U.S. Ethernet Innovations lawsuit and an asset impairment charge on identifiable intangible assets of $0.4 million. General and administrative expenses decreased $2.1 million in fiscal 2014 compared to the prior fiscal year due to outside services, occupancy expenses, and amortization as certain intangibles were fully amortized. This was partially offset by an increase in compensation and employee-related expenses of $1.4 million. We also incurred expenses in fiscal 2014 $1.0 million related to a transition agreement with our former Chief Executive Officer pertaining to his retirement which took place at the end of calendar 2014.
Restructuring expenses were $0.1 million in fiscal 2014 and $0.3 million in fiscal 2013. For further information on restructuring, see Note 9 to our Consolidated Financial Statements.
OTHER INCOME (EXPENSE), NET
2015 Compared to 2014
Other income, net was $2.2 million in fiscal 2015 compared to $0.7 million in fiscal 2014. In fiscal 2015, we recorded $1.4 million of gain from the settlement of a property and casualty insurance claim related to the replacement of our capital equipment destroyed in the fire at our subcontract manufacturer's location. We also recorded $0.6 million of foreign currency net transaction gains in fiscal 2015 as compared to $0.4 million of foreign currency net transaction gains in fiscal 2014. Our interest income remained mostly the same. Our average investment balance was $74.0 million in fiscal 2015 and $74.1 million in fiscal 2014. We earned an average interest rate of 0.3% in both fiscal 2015 and fiscal 2014.
2014 Compared to 2013
Total other income, net was $0.7 million in both fiscal 2014 and fiscal 2013. In fiscal 2014, we recorded $0.5 million of foreign currency net transaction gains compared to fiscal 2013 in which we recorded $0.4 million of foreign currency net transaction gains and $0.1 million gain on the sale of an investment. Our interest income on marketable securities and cash and cash equivalents declined slightly from fiscal 2013 to fiscal 2014 as our average investment balance decreased from $80.2 million in fiscal 2013 to $74.1 million in fiscal 2014. We earned an average interest rate of 0.3% in both fiscal 2014 and fiscal 2013.
INCOME TAXES
Our effective income tax rate was 23.8%, (119.7)% and 29.5% for fiscal years 2015, 2014 and 2013, respectively. Our effective tax rate will vary based on a variety of factors, including overall profitability, the geographical mix of income before taxes and related statutory tax rate in each jurisdiction, and discrete events, such as settlements of audits (see Note 10 to our Consolidated Financial Statements).
During fiscal 2015, we recorded net tax benefits of $0.9 million resulting from the reinstatement of the research and development tax credit for calendar year 2014, reversal of tax reserves due to the expiration of statute of limitations from U.S. and foreign tax jurisdictions and reversal of tax reserves due to the resolution of tax audits.
During fiscal 2014, we recorded net tax benefits of $1.4 million, related to the re-measurement and reversal of certain income tax reserves as a result of a federal income tax audit of fiscal 2012, the reassessment of state research and development tax credits and the release of income tax reserves due to the expiration of statute of limitations from U.S. and foreign tax jurisdictions.
29
ITEM 7. MANAGEMENT'S DISCUSSION AND ANALYSIS OF FINANCIAL CONDITION AND RESULTS OF OPERATIONS (CONTINUED)
During fiscal 2013, we recorded net tax benefits of $0.8 million related to the January 2, 2013 enactment of the American Taxpayers Relief Act of 2012 extending the research and development tax credit for the last three quarters of fiscal 2012 and the release of income tax reserves due to the expiration of the statute of limitations from various U.S. and foreign tax jurisdictions.
INFLATION
Management believes that during fiscal years 2015, 2014 and 2013, inflation has not had a material effect on our consolidated statement of operations or financial position.
LIQUIDITY AND CAPITAL RESOURCES
We have financed our operations principally with funds generated from operations. We held cash, cash equivalents and short-term marketable securities of $92.2 million, $80.4 million and $88.3 million at September 30, 2015, 2014 and 2013, respectively. Our working capital was $137.0 million, $125.9 million and $127.7 million at September 30, 2015, 2014 and 2013, respectively. The increase of cash, cash equivalents and short-term marketable securities and working capital during fiscal 2015 was attributable primarily to increases related to net income and less repurchases of our common stock than in fiscal 2014, partially offset by additional purchases of marketable securities.
Consolidated Statements of Cash Flows Highlights:
Year ended September 30, | ||||||||||||
($ in thousands) | 2015 | 2014 | 2013 | |||||||||
Operating activities | $ | 14,074 | $ | 1,809 | $ | 11,748 | ||||||
Investing activities | (19,454 | ) | 16,579 | (19,739 | ) | |||||||
Financing activities | 5,145 | (10,960 | ) | (10,790 | ) | |||||||
Effect of exchange rate changes on cash and cash equivalents | (2,237 | ) | (1,258 | ) | (145 | ) | ||||||
Net (decrease) increase in cash and cash equivalents | $ | (2,472 | ) | $ | 6,170 | $ | (18,926 | ) | ||||
2015 Compared to 2014
Net cash provided by operating activities was $14.1 million during fiscal 2015 compared to $1.8 million in fiscal 2014, a net increase of $12.3 million. This net increase was primarily due to increases in net income of $4.8 million, deferred income tax benefit of $4.2 million and a net increase in cash flows related to working capital of $4.6 million, partially offset by a decrease of $1.4 million for the non-cash adjustment related to the gain from insurance recovery. The net increase in cash flows related to working capital of $4.6 million was primarily due to a $4.8 million increase in accrued liabilities resulting from larger incentive compensation accruals on improved company performance in fiscal 2015. We also had an increase in cash flows as we spent $4.0 million less on inventory in fiscal 2015 compared to fiscal 2014. In addition, we had a $0.9 million increase in cash flows as our accounts receivable increased by a smaller amount in fiscal 2015 compared to fiscal 2014. This was partially offset by a $4.7 million decrease in cash flows related to accounts payable and a $0.4 million decrease related to income taxes payable.
Net cash used in investing activities was $19.5 million in fiscal 2015 compared to net cash provided of $16.6 million in fiscal 2014, a decrease of $36.1 million. There were net purchases of marketable securities in fiscal 2015 compared to net maturities of marketable securities in fiscal 2014 which accounted for $36.4 million of the decrease along with $1.1 million of additional purchases of capital expenditures. This was partially offset by an increase of $1.4 million related to the gain from insurance recovery.
Net cash provided by financing activities was $5.1 million in fiscal 2015 compared to net cash used by financing activities of $11.0 million in fiscal 2014. We had $13.4 million fewer repurchases of common stock in fiscal 2015 compared to fiscal 2014. We also had $2.7 million of additional proceeds from exercises of stock options and employee stock purchase plan transactions in fiscal 2015 compared to fiscal 2014.
2014 Compared to 2013
Net cash provided by operating activities was $1.8 million during fiscal 2014 compared to $11.7 million during fiscal 2013, a net decrease of $9.9 million. This net decrease is due to a decrease in net income of $4.1 million, net decreases in non-cash items of $2.5 million and a decrease in net working capital of $3.3 million. The decrease in cash flows related to working
30
ITEM 7. MANAGEMENT'S DISCUSSION AND ANALYSIS OF FINANCIAL CONDITION AND RESULTS OF OPERATIONS (CONTINUED)
capital is primarily due to an increase in inventory of $3.0 million due to large purchases of components that were being discontinued by the suppliers and delays in purchases by certain customers.
Net cash provided by investing activities was $16.6 million in fiscal 2014 compared to net cash used by investing activities of $19.7 million in fiscal 2013, an increase of $36.3 million. Marketable securities accounted for $24.0 million of the increase as we received net proceeds from maturities in fiscal 2014 compared to net purchases of marketable securities in fiscal 2013. We acquired Etherios in fiscal 2013 for $12.9 million, net of cash acquired. Our purchases of capital expenditures increased by $0.5 million in fiscal 2014 compared to the prior fiscal year. We received $0.1 million related to proceeds from an investment in fiscal 2013.
Net cash used in by financing activities was $11.0 million in fiscal 2014 compared to $10.8 million in fiscal 2013. We used $15.7 million of cash to repurchase our common stock in fiscal 2014, partially offset by $4.7 million of proceeds related to exercises of stock options and employee stock purchase plan transactions.
We expect positive cash flows from operations and believe that our current cash, cash equivalents and marketable securities balances, cash generated from operations and our ability to secure debt and/or equity financing will be sufficient to fund our business operations and capital expenditures for the next twelve months and beyond.
At September 30, 2015, our total cash and cash equivalents and marketable securities balance, including long-term marketable securities was $105.8 million. At September 30, 2015, we had $28.2 million of accumulated undistributed foreign earnings that are indefinitely reinvested in non-U.S. subsidiaries, resulting in slightly more than half of our cash and cash equivalents being held by non-U.S. subsidiaries. Approximately $28.3 million of cash and cash equivalents was being held by our controlled foreign subsidiaries at September 30, 2015. Although we have no current need or intention to repatriate historical earnings in the form of cash in the United States, if we change our assertion from indefinitely reinvesting undistributed foreign earnings, we would have to accrue applicable taxes. The amount of any taxes and the application of any tax credits would be determined based on the income tax laws at the time of such repatriation. Under current tax laws, we estimate the unrecognized deferred tax liability to be up to $0.8 million.
The following summarizes our contractual obligations at September 30, 2015:
Payments due by fiscal period | ||||||||||||||||||||
($ in thousands) | Total | Less than 1 year | 1-3 years | 3-5 years | Thereafter | |||||||||||||||
Operating leases | $ | 4,252 | $ | 1,993 | $ | 1,775 | $ | 484 | $ | — | ||||||||||
The operating lease agreements included above primarily relate to office space. The table above does not include possible payments for uncertain tax positions. Our reserve for uncertain tax positions, including accrued interest and penalties, was $2.0 million as of September 30, 2015. Due to the nature of the underlying liabilities and the extended time often needed to resolve income tax uncertainties, we cannot make reliable estimates of the amount or timing of future cash payments that may be required to settle these liabilities.
The above table also does not include those obligations for royalties under license agreements as these royalties are calculated based on future sales of licensed products and we cannot make reliable estimates of the amount of cash payments.
FOREIGN CURRENCY
We are exposed to foreign currency transaction risk associated with certain sales being denominated in Euros, British Pounds, and Japanese Yen and foreign currency translation risk as the financial position and operating results of our foreign subsidiaries are translated into U.S. Dollars for consolidation. We manage our net asset or net liability position for U.S. dollar accounts in our foreign locations to reduce our foreign currency risk. We have not implemented a formal hedging strategy to reduce foreign currency risk.
During 2015, we had approximately $76.3 million of revenue related to foreign customers including export sales, of which $21.3 million was denominated in foreign currency, predominantly the Euro and British Pound. During 2014 and 2013, we had approximately $76.3 million and $78.8 million, respectively, of revenue to foreign customers including export sales, of which $23.3 million and $24.3 million, respectively, were denominated in foreign currency, predominantly the Euro and British Pound. In future periods, we expect a significant portion of sales will continue to be made in Euros and British Pounds.
31
ITEM 7. MANAGEMENT'S DISCUSSION AND ANALYSIS OF FINANCIAL CONDITION AND RESULTS OF OPERATIONS (CONTINUED)
RECENT ACCOUNTING DEVELOPMENTS
Adopted
In July 2013, the Financial Accounting Standards Board (“FASB”) issued ASU 2013-11, “Presentation of an Unrecognized Tax Benefit When a Net Operating Loss Carryforward, a Similar Tax Loss, or a Tax Credit Carryforward Exists.” This guidance relates to the presentation of an unrecognized tax benefit when a net operating loss carryforward, a similar tax loss, or a tax credit carryforward exists. The standard update provides that a liability related to an unrecognized tax benefit should be offset against same jurisdiction deferred tax assets for a net operating loss carryforward, a similar tax loss, or a tax credit carryforward if such settlement is required or expected in the event the uncertain tax position is disallowed. This guidance was effective prospectively for fiscal years (and interim reporting periods within those years) beginning after December 15, 2013. We adopted this guidance during the fiscal quarter ended December 31, 2014, resulting in a reclassification of $0.4 million of unrecognized tax benefits to noncurrent deferred tax assets.
In March 2013, FASB issued ASU 2013-05, “Foreign Currency Matters (Topic 830): Parent’s Accounting for the Cumulative Translation Adjustment upon Derecognition of Certain Subsidiaries or Groups of Assets within a Foreign Entity or of an Investment in a Foreign Entity.” This guidance applies to the release of the cumulative translation adjustment into net income when a parent either sells a part or all of its investment in a foreign entity or no longer holds a controlling financial interest in a subsidiary or group of assets that is a business within a foreign entity. ASU 2013-05 was effective prospectively for fiscal years (and interim reporting periods within those years) beginning after December 15, 2013. We adopted this guidance during the fiscal quarter ended December 31, 2014. There was no impact on our condensed consolidated financial statements as we have not sold any foreign entities for which we hold a controlling financial interest.
Not Yet Adopted
In September 2015, FASB issued ASU 2015-16, "Simplifying the Accounting for Measurement-Period Adjustments." To simplify the accounting for adjustments made to provisional amounts recognized in a business combination, the amendments in this update eliminate the requirement to retrospectively account for those adjustments. The amendments in this update are effective for fiscal years beginning after December 15, 2015, including interim periods within those years, which for us will be the first fiscal quarter ending December 31, 2016. Earlier application is permitted for financial statements that have not been issued. We are currently evaluating the impact of the adoption of ASU 2015-16.
In July 2015, FASB issued ASU 2015-11, "Simplifying the Measurement of Inventory." This provision would require inventory that was previously recorded using first-in, first-out (FIFO) to lower of cost and net realizable value. Net realizable value is the estimated selling price in the ordinary course of business, less reasonably predictable costs of completion, disposal, and transportation. This guidance is effective for fiscal years beginning after December 15, 2016 and interim periods within those years, which for us will be the first fiscal quarter ending December 31, 2017. The amendments in this guidance should be applied prospectively with earlier application permitted as of the beginning of an interim or annual period. We are currently evaluating the impact of the adoption of ASU 2015-11 and whether it would have a material impact on our consolidated financial statements.
In April 2015, FASB issued ASU 2015-05, “Intangibles-Goodwill and Other-Internal-Use Software (Subtopic 350-40) - Customer’s Accounting for Fees Paid in a Cloud Computing Arrangement. The new standard provides guidance to customers about whether a cloud computing arrangement includes a software license. If the arrangement does include a software license, the software license element of the arrangement should be accounted for in the same manner as the acquisition of other software licenses. This guidance is effective for fiscal years, and interim periods within those years, beginning after December 15, 2015, with early adoption permitted. We expect to adopt this guidance beginning with our fiscal quarter ending December 31, 2016. We do not expect this guidance to have a material impact on our consolidated financial statements.
In August 2014, FASB issued ASU 2014-15, “Presentation of Financial Statements - Going Concern.” This guidance requires management to evaluate whether there is substantial doubt about a company’s ability to continue as a going concern and to provide related footnote disclosures. These amendments are effective for the annual period ending after December 15, 2016, and for annual periods and interim periods thereafter, which for us, will be the fourth fiscal quarter ended September 30, 2017. Early adoption is permitted. While we are evaluating the impact of the adoption of ASU 2014-15, we do not expect it to have an impact on our consolidated financial statements.
In May 2014, FASB issued ASU 2014-09, “Revenue from Contracts with Customers.” This guidance provides a five-step analysis in determining when and how revenue is recognized so that an entity will recognize revenue when it transfers promised
32
ITEM 7. MANAGEMENT'S DISCUSSION AND ANALYSIS OF FINANCIAL CONDITION AND RESULTS OF OPERATIONS (CONTINUED)
goods or services to customers in an amount that reflects what it expects in exchange for the goods and services. It also requires more detailed disclosures to enable users of financial statements to understand the nature, amount, timing and uncertainty of revenue and cash flows arising from contracts with customers. In August 2015, the FASB issued ASU 2015-14 "Revenue from Contracts with Customers (Topic 606): Deferral of the Effective Date" which approved a one-year deferral of the effective date of ASU 2014-09. As a result of this deferral, ASU 2014-09 is effective for our fiscal 2019, including interim periods within that reporting period. The FASB also agreed to allow us to choose to adopt the standard effective for our fiscal 2018. We are assessing the adoption date and potential impact of adopting this ASU on our consolidated financial statements and related disclosures.
CRITICAL ACCOUNTING POLICIES AND ESTIMATES
Our discussion and analysis of our financial condition and results of operations are based upon our consolidated financial statements, which have been prepared in accordance with accounting principles generally accepted in the United States of America. The preparation of these consolidated financial statements requires us to make estimates and judgments that affect the reported amounts of assets, liabilities, revenue and expenses, the disclosure of contingent assets and liabilities and the values of purchased assets and assumed liabilities in acquisitions. We base our estimates on historical experience and various other assumptions that are believed to be reasonable under the circumstances, the results of which form the basis for making judgments about the carrying values of assets and liabilities that are not readily apparent from other sources. Actual results may differ from these estimates.
We believe the following critical accounting policies impact our more significant judgments and estimates used in the preparation of our consolidated financial statements.
REVENUE RECOGNITION
Our revenue is derived primarily from the sale of wired and wireless hardware products to our distributors and Direct/OEM customers. We recognize hardware product revenue when persuasive evidence of an arrangement exists, delivery has occurred, the sales price is fixed or determinable, collectability is reasonably assured and there are no post-delivery obligations, other than warranty. Under these criteria, product revenue generally is recognized upon shipment of product to customers. Sales to authorized domestic distributors and Direct / OEMs are made with certain rights of return and price adjustment provisions. Estimated reserves for future returns and pricing adjustments are established by us based on an analysis of historical patterns of returns and price adjustments as well as an analysis of authorized returns compared to received returns and distribution sales for the current period. Estimated reserves for future returns and price adjustments are charged against revenue in the same period as the corresponding sales are recorded. Material differences between the historical trends used to determine estimated reserves and actual returns and pricing adjustments could result in a material change to our consolidated results of operations or financial position. We have applied consistent methodologies for estimating reserves for future returns and pricing adjustments for all years presented. The reserve for future returns and pricing adjustments was $1.8 million at September 30, 2015 and $1.7 million at September 30, 2014.
Revenue recognized for service revenue as a percentage of total revenue represented 8.2%, 10.3% and 11.4% in fiscal 2015, 2014 and 2013, respectively. Our service revenue is derived primarily from professional and engineering services performed by our Etherios® CRM and wireless design teams. We also have some service revenue that is derived from our Digi Device Cloud, which is a platform-as-a-service (PaaS) offering in which customers pay for services consumed in terms of devices being managed and monitored, or as a monthly service fee for access to information. We recognize service revenue from our Etherios® CRM services, wireless design services, and Digi Device Cloud based upon performance, including, but not limited to, final product delivery and customer acceptance. In addition, we recognize small amounts of revenue from enterprise support services which are recognized over the life of the contract, and training as the services are performed.
MARKETABLE SECURITIES
We regularly monitor and evaluate the realizable value of our marketable securities. When assessing marketable securities for other-than-temporary declines in value, we consider several factors. These factors include: how significant the decline in value is as a percentage of the original cost, how long the market value of the investment has been less than its original cost, the underlying factors contributing to a decline in the prices of securities in a single asset class, the performance of the issuer’s stock price in relation to the stock price of its competitors within the industry, expected market volatility, analyst recommendations, the views of external investment managers, any news or financial information that has been released specific to the investee and the outlook for the overall industry in which the issuer operates. If events and circumstances indicate that a
33
ITEM 7. MANAGEMENT'S DISCUSSION AND ANALYSIS OF FINANCIAL CONDITION AND RESULTS OF OPERATIONS (CONTINUED)
decline in the value of these securities has occurred and is other-than-temporary, we would record a charge to other income (expense).
ACCOUNTS RECEIVABLE AND ALLOWANCE FOR DOUBTFUL ACCOUNTS
We maintain an allowance for doubtful accounts, which reflects the estimate of losses that may result from the inability of some of our customers to make required payments. The estimate for the allowance for doubtful accounts is based on known circumstances regarding collectability of customer accounts and historical collections experience. If the financial condition of one or more of our customers were to deteriorate, resulting in an inability to make payments, additional allowances may be required. Material differences between the historical trends used to estimate the allowance for doubtful accounts and actual collection experience could result in a material change to our consolidated results of operations or financial position. The allowance for doubtful accounts was $0.5 million at September 30, 2015 and $0.4 million at September 30, 2014.
INVENTORIES
Inventories are stated at the lower of cost or fair market value, with cost determined using the first-in, first-out method. We reduce the carrying value of our inventories for estimated excess and obsolete inventories equal to the difference between the cost of inventory and its estimated realizable value based upon assumptions about future product demand and market conditions. Once the new cost basis is established, the value is not increased with any changes in circumstances that would indicate an increase in value after the remeasurement. If actual product demand or market conditions are less favorable than those projected by management, additional inventory write-downs may be required that could result in a material change to our consolidated results of operations or financial position. We have applied consistent methodologies for the net realizable value of inventories.
GOODWILL
Goodwill represents the excess of cost over the fair value of identifiable assets acquired. Goodwill is tested for impairment on an annual basis as of June 30, or more frequently if events or circumstances occur which could indicate impairment. At June 30, 2015, our market capitalization was $238.6 million compared to our carrying value of $270.6 million. Our market capitalization plus our estimated control premium of 35% resulted in a fair value in excess of our carrying value by a margin of 19%. As a result, no impairment was indicated and we were not required to complete the second step of the goodwill impairment analysis. No goodwill impairment charges were recorded. The control premium used in our annual goodwill assessment at June 30, 2015 was based on a control premium study as of June 2014, resulting in a range of control premium of 30% to 40%. We re-evaluated the data and concluded that a 35% control premium continues to best represent the amount an investor would likely pay, over and above market capitalization, in order to obtain a controlling interest given the economic conditions at June 30, 2015.
During the fourth quarter of fiscal 2015, we assessed various qualitative factors to determine whether or not an additional goodwill impairment assessment was required as of September 30, 2015. We concluded that no additional goodwill impairment assessment was required. We continue to monitor our stock price on a daily basis. If the stock price remained below certain thresholds for a significant period of time, we would complete an interim impairment assessment. We also monitor other events or circumstances that could have a significant impact on our operations. If one of these events or circumstances were to occur, we would evaluate whether an interim goodwill impairment assessment should be completed.
INCOME TAXES
We operate in multiple tax jurisdictions both in the U.S. and outside of the U.S. Accordingly, we must determine the appropriate allocation of income to each of these jurisdictions. This determination requires us to make several estimates and assumptions. Tax audits associated with the allocation of this income, and other complex issues, may require an extended period of time to resolve and could result in adjustments to our income tax balances that are material to our consolidated financial position and results of operations and could result in potential cash outflows.
We have unrecognized tax benefits of $2.0 million. We expect that it is reasonably possible that the total amounts of unrecognized tax benefits will decrease approximately $0.2 million over the next 12 months due to the expiration of various statutes of limitations. The total amount of unrecognized tax benefits that if recognized would affect our effective tax rate is $1.6 million. We recognize interest and penalties related to income tax matters in income tax expense.
34
ITEM 7. MANAGEMENT'S DISCUSSION AND ANALYSIS OF FINANCIAL CONDITION AND RESULTS OF OPERATIONS (CONTINUED)
WARRANTIES
In general, we warrant our products to be free from defects in material and workmanship under normal use and service. The warranty periods generally range from one to five years. We typically have the option to repair or replace products we deem defective due to material or workmanship. Estimated warranty costs are accrued in the period that the related revenue is recognized based upon an estimated average per unit repair or replacement cost applied to the estimated number of units under warranty. These estimates are based upon historical warranty incidents and are evaluated on an ongoing basis to ensure the adequacy of the warranty accrual. The product warranty accrual was $1.0 million and $0.9 million at September 30, 2015 and September 30, 2014, respectively.
ITEM 7A. QUANTITATIVE AND QUALITATIVE DISCLOSURES ABOUT MARKET RISK
INTEREST RATE RISK
Our exposure to interest rate risk relates primarily to our investment portfolio. We do not use derivative financial instruments to hedge against interest rate risk.
FOREIGN CURRENCY RISK
We are exposed to foreign currency transaction risk associated with certain sales being denominated in Euros, British Pounds or Japanese Yen and foreign currency translation risk as the financial position and operating results of our foreign subsidiaries are translated into U.S. Dollars for consolidation. We manage our net asset or net liability position for U.S. dollar accounts in our foreign locations to reduce our foreign currency risk. We have not implemented a formal hedging strategy.
The table below compares the average monthly exchange rates of the Euro, British Pound and Japanese Yen:
Fiscal year ended September 30, | % increase | |||||||
2015 | 2014 | (decrease) | ||||||
Euro | 1.1499 | 1.3575 | (15.3 | )% | ||||
British Pound | 1.5462 | 1.6570 | (6.7 | )% | ||||
Japanese Yen | 0.0084 | 0.0098 | (14.3 | )% | ||||
A 10.0% change from the 2015 average exchange rate for the Euro, British Pound and Yen to the U.S. Dollar would have resulted in a 2.2% increase or decrease in fiscal 2015 annual revenue and a 2.0% increase or decrease in stockholders' equity at September 30, 2015. The above analysis does not take into consideration any pricing adjustments we may make in response to changes in the exchange rate.
CREDIT RISK
We have some exposure to credit risk related to our accounts receivable portfolio. Exposure to credit risk is controlled through regular monitoring of customer financial status, credit limits and collaboration with sales management on customer contacts to facilitate payment.
Investments are made in accordance with our investment policy and consist of certificates of deposit, money market funds, corporate bonds and government municipal bonds. We may have some credit exposure related to the fair value of our securities, which could change based on changes in market conditions. If market conditions deteriorate or, if these securities experience credit rating downgrades, we may incur impairment charges for securities in our investment portfolio.
35
ITEM 8. FINANCIAL STATEMENTS AND SUPPLEMENTARY DATA
REPORT OF INDEPENDENT REGISTERED PUBLIC ACCOUNTING FIRM
To the Board of Directors and Stockholders of Digi International Inc.
In our opinion, the accompanying consolidated balance sheets and the related consolidated statements of operations, comprehensive income (loss), stockholders’ equity and cash flows present fairly, in all material respects, the financial position of Digi International Inc. and its subsidiaries at September 30, 2015 and 2014, and the results of their operations and their cash flows for each of the three years in the period ended September 30, 2015 in conformity with accounting principles generally accepted in the United States of America. In addition, in our opinion, the financial statement schedule listed in the index appearing under Item 15(a)(2) presents fairly, in all material respects, the information set forth therein when read in conjunction with the related consolidated financial statements. Also in our opinion, the Company maintained, in all material respects, effective internal control over financial reporting as of September 30, 2015, based on criteria established in Internal Control - Integrated Framework (2013) issued by the Committee of Sponsoring Organizations of the Treadway Commission (COSO). The Company's management is responsible for these financial statements and financial statement schedule, for maintaining effective internal control over financial reporting and for its assessment of the effectiveness of internal control over financial reporting, included in Management’s Report on Internal Control Over Financial Reporting appearing under Item 9A. Our responsibility is to express opinions on these financial statements, on the financial statement schedule, and on the Company's internal control over financial reporting based on our integrated audits. We conducted our audits in accordance with the standards of the Public Company Accounting Oversight Board (United States). Those standards require that we plan and perform the audits to obtain reasonable assurance about whether the financial statements are free of material misstatement and whether effective internal control over financial reporting was maintained in all material respects. Our audits of the financial statements included examining, on a test basis, evidence supporting the amounts and disclosures in the financial statements, assessing the accounting principles used and significant estimates made by management, and evaluating the overall financial statement presentation. Our audit of internal control over financial reporting included obtaining an understanding of internal control over financial reporting, assessing the risk that a material weakness exists, and testing and evaluating the design and operating effectiveness of internal control based on the assessed risk. Our audits also included performing such other procedures as we considered necessary in the circumstances. We believe that our audits provide a reasonable basis for our opinions.
A company’s internal control over financial reporting is a process designed to provide reasonable assurance regarding the reliability of financial reporting and the preparation of financial statements for external purposes in accordance with generally accepted accounting principles. A company’s internal control over financial reporting includes those policies and procedures that (i) pertain to the maintenance of records that, in reasonable detail, accurately and fairly reflect the transactions and dispositions of the assets of the company; (ii) provide reasonable assurance that transactions are recorded as necessary to permit preparation of financial statements in accordance with generally accepted accounting principles, and that receipts and expenditures of the company are being made only in accordance with authorizations of management and directors of the company; and (iii) provide reasonable assurance regarding prevention or timely detection of unauthorized acquisition, use, or disposition of the company’s assets that could have a material effect on the financial statements.
Because of its inherent limitations, internal control over financial reporting may not prevent or detect misstatements. Also, projections of any evaluation of effectiveness to future periods are subject to the risk that controls may become inadequate because of changes in conditions, or that the degree of compliance with the policies or procedures may deteriorate.
/s/ PricewaterhouseCoopers LLP
Minneapolis, Minnesota
November 30, 2015
36
DIGI INTERNATIONAL INC.
CONSOLIDATED STATEMENTS OF OPERATIONS
Fiscal years ended September 30, | |||||||||||
2015 | 2014 | 2013 | |||||||||
(in thousands, except per common share data) | |||||||||||
Revenue: | |||||||||||
Hardware product | $ | 195,497 | $ | 172,846 | $ | 173,078 | |||||
Service | 17,361 | 19,855 | 22,303 | ||||||||
Total revenue | 212,858 | 192,701 | 195,381 | ||||||||
Cost of sales: | |||||||||||
Cost of hardware product | 101,155 | 85,737 | 82,276 | ||||||||
Cost of service | 13,672 | 16,480 | 12,982 | ||||||||
Total cost of sales | 114,827 | 102,217 | 95,258 | ||||||||
Gross profit | 98,031 | 90,484 | 100,123 | ||||||||
Operating expenses: | |||||||||||
Sales and marketing | 39,544 | 40,576 | 40,513 | ||||||||
Research and development | 32,047 | 29,789 | 30,327 | ||||||||
General and administrative | 19,514 | 19,913 | 21,423 | ||||||||
Restructuring charges, net | 509 | 81 | 313 | ||||||||
Total operating expenses | 91,614 | 90,359 | 92,576 | ||||||||
Operating income | 6,417 | 125 | 7,547 | ||||||||
Other income, net: | |||||||||||
Interest income | 218 | 176 | 210 | ||||||||
Interest expense | (4 | ) | (5 | ) | (42 | ) | |||||
Other income, net | 2,014 | 501 | 523 | ||||||||
Total other income, net | 2,228 | 672 | 691 | ||||||||
Income before income taxes | 8,645 | 797 | 8,238 | ||||||||
Income tax provision (benefit) | 2,057 | (954 | ) | 2,433 | |||||||
Net income | $ | 6,588 | $ | 1,751 | $ | 5,805 | |||||
Net income per common share: | |||||||||||
Basic | $ | 0.27 | $ | 0.07 | $ | 0.22 | |||||
Diluted | $ | 0.26 | $ | 0.07 | $ | 0.22 | |||||
Weighted average common shares: | |||||||||||
Basic | 24,645 | 25,345 | 25,956 | ||||||||
Diluted | 25,227 | 25,730 | 26,237 | ||||||||
The accompanying notes are an integral part of the consolidated financial statements.
37
DIGI INTERNATIONAL INC.
CONSOLIDATED STATEMENTS OF COMPREHENSIVE INCOME (LOSS)
Fiscal years ended September 30, | |||||||||||
2015 | 2014 | 2013 | |||||||||
(in thousands) | |||||||||||
Net income | $ | 6,588 | $ | 1,751 | $ | 5,805 | |||||
Other comprehensive loss, net of tax: | |||||||||||
Foreign currency translation adjustment | (4,323 | ) | (2,713 | ) | (1,826 | ) | |||||
Change in net unrealized (loss) gain on investments | (21 | ) | 43 | (63 | ) | ||||||
Less income tax benefit (provision) | 7 | (17 | ) | 24 | |||||||
Reclassification of realized loss on investments included in net income (1) | 1 | — | — | ||||||||
Other comprehensive loss, net of tax | (4,336 | ) | (2,687 | ) | (1,865 | ) | |||||
Comprehensive income (loss) | $ | 2,252 | $ | (936 | ) | $ | 3,940 | ||||
(1) | Recorded in Other income, net in our Consolidated Statements of Operations. |
The accompanying notes are an integral part of the consolidated financial statements.
38
DIGI INTERNATIONAL INC.
CONSOLIDATED BALANCE SHEETS
As of September 30, | |||||||
2015 | 2014 | ||||||
(in thousands, except share data) | |||||||
ASSETS | |||||||
Current assets: | |||||||
Cash and cash equivalents | $ | 45,018 | $ | 47,490 | |||
Marketable securities | 47,191 | 32,898 | |||||
Accounts receivable, net | 29,205 | 28,576 | |||||
Inventories | 31,877 | 31,247 | |||||
Deferred tax assets | 3,379 | 3,221 | |||||
Other | 3,515 | 4,249 | |||||
Total current assets | 160,185 | 147,681 | |||||
Marketable securities, long-term | 13,626 | 11,541 | |||||
Property, equipment and improvements, net | 14,357 | 13,231 | |||||
Identifiable intangible assets, net | 4,179 | 6,785 | |||||
Goodwill | 102,097 | 103,398 | |||||
Deferred tax assets | 5,666 | 7,383 | |||||
Other | 250 | 440 | |||||
Total assets | $ | 300,360 | $ | 290,459 | |||
LIABILITIES AND STOCKHOLDERS’ EQUITY | |||||||
Current liabilities: | |||||||
Accounts payable | $ | 6,723 | $ | 10,451 | |||
Income taxes payable | 828 | — | |||||
Accrued compensation | 11,502 | 8,133 | |||||
Other | 4,136 | 3,170 | |||||
Total current liabilities | 23,189 | 21,754 | |||||
Income taxes payable | 1,546 | 2,724 | |||||
Deferred tax liabilities | 135 | 272 | |||||
Other noncurrent liabilities | 552 | 411 | |||||
Total liabilities | 25,422 | 25,161 | |||||
Commitments and Contingencies (see Notes 15 & 16) | |||||||
Stockholders’ equity: | |||||||
Preferred stock, $.01 par value; 2,000,000 shares authorized; none issued and outstanding | — | — | |||||
Common stock, $.01 par value; 60,000,000 shares authorized; 31,534,198 and 30,703,895 shares issued | 315 | 307 | |||||
Additional paid-in capital | 227,367 | 218,689 | |||||
Retained earnings | 124,404 | 117,816 | |||||
Accumulated other comprehensive loss | (22,613 | ) | (18,277 | ) | |||
Treasury stock, at cost, 6,487,248 and 6,313,937 shares | (54,535 | ) | (53,237 | ) | |||
Total stockholders’ equity | 274,938 | 265,298 | |||||
Total liabilities and stockholders’ equity | $ | 300,360 | $ | 290,459 | |||
The accompanying notes are an integral part of the consolidated financial statements.
39
DIGI INTERNATIONAL INC.
CONSOLIDATED STATEMENTS OF CASH FLOWS
Fiscal years ended September 30, | ||||||||||||
2015 | 2014 | 2013 | ||||||||||
Operating activities: | (in thousands) | |||||||||||
Net income | $ | 6,588 | $ | 1,751 | $ | 5,805 | ||||||
Adjustments to reconcile net income to net cash provided by operating activities: | ||||||||||||
Depreciation of property, equipment and improvements | 2,949 | 3,557 | 3,461 | |||||||||
Amortization of identifiable intangible assets | 2,910 | 3,589 | 4,416 | |||||||||
Stock-based compensation | 4,301 | 4,330 | 3,773 | |||||||||
Excess tax benefits from stock-based compensation | — | (44 | ) | (67 | ) | |||||||
Deferred income tax benefit | (769 | ) | (2,783 | ) | (2,055 | ) | ||||||
Gain on insurance settlement related to property and equipment | (1,375 | ) | — | — | ||||||||
Bad debt/product return provision | 357 | 98 | 811 | |||||||||
Inventory obsolescence | 1,284 | 860 | 1,258 | |||||||||
Intangible impairment charge | — | — | 361 | |||||||||
Restructuring charges, net | 509 | 81 | 313 | |||||||||
Other | 87 | 3 | (85 | ) | ||||||||
Changes in operating assets and liabilities (net of acquisition): | ||||||||||||
Accounts receivable | (1,794 | ) | (2,730 | ) | (2,368 | ) | ||||||
Inventories | (1,913 | ) | (5,966 | ) | (2,972 | ) | ||||||
Other assets | 241 | 210 | (212 | ) | ||||||||
Income taxes | 387 | (1,408 | ) | (2,634 | ) | |||||||
Accounts payable | (3,769 | ) | 970 | 1,413 | ||||||||
Accrued expenses | 4,081 | (709 | ) | 530 | ||||||||
Net cash provided by operating activities | 14,074 | 1,809 | 11,748 | |||||||||
Investing activities: | ||||||||||||
Purchase of marketable securities | (54,427 | ) | (27,420 | ) | (67,159 | ) | ||||||
Proceeds from maturities of marketable securities | 38,028 | 47,420 | 63,089 | |||||||||
Acquisition of businesses, net of cash acquired | — | — | (12,919 | ) | ||||||||
Proceeds from insurance settlement related to property and equipment | 1,400 | — | — | |||||||||
Proceeds from sale of property and equipment | 45 | — | — | |||||||||
Proceeds from sale of investment | — | — | 136 | |||||||||
Purchase of property, equipment, improvements and certain other intangible assets | (4,500 | ) | (3,421 | ) | (2,886 | ) | ||||||
Net cash (used in) provided by in investing activities | (19,454 | ) | 16,579 | (19,739 | ) | |||||||
Financing activities: | ||||||||||||
Excess tax benefits from stock-based compensation | — | 44 | 67 | |||||||||
Proceeds from stock option plan transactions | 6,559 | 3,689 | 2,193 | |||||||||
Proceeds from employee stock purchase plan transactions | 925 | 1,009 | 1,008 | |||||||||
Purchase of common stock | (2,339 | ) | (15,702 | ) | (14,058 | ) | ||||||
Net cash provided by (used in) financing activities | 5,145 | (10,960 | ) | (10,790 | ) | |||||||
Effect of exchange rate changes on cash and cash equivalents | (2,237 | ) | (1,258 | ) | (145 | ) | ||||||
Net (decrease) increase in cash and cash equivalents | (2,472 | ) | 6,170 | (18,926 | ) | |||||||
Cash and cash equivalents, beginning of period | 47,490 | 41,320 | 60,246 | |||||||||
Cash and cash equivalents, end of period | $ | 45,018 | $ | 47,490 | $ | 41,320 | ||||||
Supplemental disclosures of cash flow information: | ||||||||||||
Interest paid | $ | 4 | $ | 5 | $ | 42 | ||||||
Income taxes paid, net | $ | 1,296 | $ | 3,197 | $ | 6,300 | ||||||
Supplemental schedule of non-cash investing and financing activities: | ||||||||||||
Accrual for capitalized intangible asset | $ | 17 | $ | — | $ | 42 | ||||||
Issuance of common stock for business acquisition | $ | — | $ | — | $ | 6,741 | ||||||
Accrual for purchase of common stock | $ | — | $ | 100 | $ | — | ||||||
The accompanying notes are an integral part of the consolidated financial statements.
40
DIGI INTERNATIONAL INC.
CONSOLIDATED STATEMENTS OF STOCKHOLDERS’ EQUITY
For fiscal years ended September 30, 2015, 2014 and 2013 | ||||||||||||||||||||||||||||||
Accumulated | ||||||||||||||||||||||||||||||
Additional | Other | Total | ||||||||||||||||||||||||||||
Common Stock | Treasury Stock | Paid-In | Retained | Comprehensive | Stockholders’ | |||||||||||||||||||||||||
Shares | Par Value | Shares | Value | Capital | Earnings | Loss | Equity | |||||||||||||||||||||||
Balances, September 30, 2012 | 29,269 | $ | 293 | 3,356 | $ | (25,489 | ) | $ | 199,495 | $ | 110,260 | $ | (13,725 | ) | $ | 270,834 | ||||||||||||||
Net income | 5,805 | 5,805 | ||||||||||||||||||||||||||||
Other comprehensive loss | (1,865 | ) | (1,865 | ) | ||||||||||||||||||||||||||
Employee stock purchase issuances | (128 | ) | 1,030 | (22 | ) | 1,008 | ||||||||||||||||||||||||
Repurchase of common stock | 1,481 | (14,058 | ) | (14,058 | ) | |||||||||||||||||||||||||
Issuance of stock upon exercise of stock options | 280 | 3 | 2,190 | 2,193 | ||||||||||||||||||||||||||
Tax impact from equity awards | (188 | ) | (188 | ) | ||||||||||||||||||||||||||
Acquisition of Etherios, Inc. | 715 | 7 | 6,734 | 6,741 | ||||||||||||||||||||||||||
Stock-based compensation expense | 3,773 | 3,773 | ||||||||||||||||||||||||||||
Balances, September 30, 2013 | 30,264 | $ | 303 | 4,709 | $ | (38,517 | ) | $ | 211,982 | $ | 116,065 | $ | (15,590 | ) | $ | 274,243 | ||||||||||||||
Net income | 1,751 | 1,751 | ||||||||||||||||||||||||||||
Other comprehensive loss | (2,687 | ) | (2,687 | ) | ||||||||||||||||||||||||||
Employee stock purchase issuances | (129 | ) | 1,082 | (73 | ) | 1,009 | ||||||||||||||||||||||||
Repurchase of common stock | 1,734 | (15,802 | ) | (15,802 | ) | |||||||||||||||||||||||||
Issuance of stock under stock award plans | 440 | 4 | 3,685 | 3,689 | ||||||||||||||||||||||||||
Tax impact from equity awards | (1,235 | ) | (1,235 | ) | ||||||||||||||||||||||||||
Stock-based compensation expense | 4,330 | 4,330 | ||||||||||||||||||||||||||||
Balances, September 30, 2014 | 30,704 | $ | 307 | 6,314 | $ | (53,237 | ) | $ | 218,689 | $ | 117,816 | $ | (18,277 | ) | $ | 265,298 | ||||||||||||||
Net income | 6,588 | 6,588 | ||||||||||||||||||||||||||||
Other comprehensive loss | (4,336 | ) | (4,336 | ) | ||||||||||||||||||||||||||
Employee stock purchase issuances | (124 | ) | 1,041 | (116 | ) | 925 | ||||||||||||||||||||||||
Repurchase of common stock | 297 | (2,339 | ) | (2,339 | ) | |||||||||||||||||||||||||
Issuance of stock under stock award plans | 830 | 8 | 6,551 | 6,559 | ||||||||||||||||||||||||||
Tax impact from equity awards | (2,058 | ) | (2,058 | ) | ||||||||||||||||||||||||||
Stock-based compensation expense | 4,301 | 4,301 | ||||||||||||||||||||||||||||
Balances, September 30, 2015 | 31,534 | $ | 315 | 6,487 | $ | (54,535 | ) | $ | 227,367 | $ | 124,404 | $ | (22,613 | ) | $ | 274,938 | ||||||||||||||
The accompanying notes are an integral part of the consolidated financial statements.
41
NOTES TO CONSOLIDATED FINANCIAL STATEMENTS
1. SUMMARY OF SIGNIFICANT ACCOUNTING POLICIES
Business Description
We are a leading provider of Internet of Things (IoT) networking hardware products and solutions that enable the connection, monitoring and control of local or remote physical assets by electronic means. These networking products and solutions can connect communication hardware to a physical asset, convey information about the asset’s status and performance to a computer system and then use that information to improve or automate one or more processes. These products and solutions are deployed via both wired and, ever increasingly wireless networks. Our solutions are deployed by a wide range of businesses and institutions. Any business that utilizes a significant number of devices, whose operation could benefit from remote monitoring or control, may realize benefits from IoT networking.
Principles of Consolidation
The consolidated financial statements include our accounts and the accounts of our wholly-owned subsidiaries. All intercompany accounts and transactions have been eliminated in consolidation.
Cash Equivalents
Cash equivalents consist of money market accounts and other highly liquid investments purchased with an original maturity of three months or less. The carrying amounts approximate fair value due to the short maturities of these investments.
Marketable Securities
Marketable securities consist of certificates of deposit, commercial paper, corporate bonds and government municipal bonds. All marketable securities are accounted for as available-for-sale and are carried at fair value on our consolidated balance sheets with unrealized gains and losses recorded in accumulated other comprehensive loss within stockholders’ equity. In order to estimate the fair value for each security in our investment portfolio, we obtain quoted market prices and trading activity for each security where available. We obtain relevant information from our investment advisor and, if warranted, also may review the financial solvency of certain security issuers.
We regularly monitor and evaluate the value of our marketable securities. When assessing marketable securities for other-than-temporary declines in value, we consider several factors. These factors include: how significant the decline in value is as a percentage of the original cost, how long the market value of the investment has been less than its original cost, the underlying factors contributing to a decline in the prices of securities in a single asset class, the performance of the issuer’s stock price in relation to the stock price of its competitors within the industry, expected market volatility, analyst recommendations, the views of external investment managers, any news or financial information that has been released specific to the investee and the outlook for the overall industry in which the issuer operates. If events and circumstances indicate that a decline in the value of a security has occurred and is other-than-temporary, we would record a charge to other income (expense).
Accounts Receivable
Accounts receivable are stated at the amount we expect to collect, which is net of an allowance for doubtful accounts for estimated losses resulting from the inability of our customers to make required payments. The following factors are considered when determining the collectability of specific customer accounts: customer creditworthiness, past transaction history with the customer, and changes in customer payment terms or practices. In addition, overall historical collection experience, current economic industry trends, and a review of the current status of trade accounts receivable are considered when determining the required allowance for doubtful accounts. Based on our assessment, we provide for estimated uncollectible amounts through a charge to earnings and a credit to our allowance for doubtful accounts. Balances that remain outstanding after we have used reasonable collection efforts are written off through a charge to the allowance for doubtful accounts and a credit to accounts receivable.
Inventories
Inventories are stated at the lower of cost or fair market value, with cost determined using the first-in, first-out method. Appropriate consideration is given to deterioration, obsolescence and other factors in evaluating fair market value.
42
NOTES TO CONSOLIDATED FINANCIAL STATEMENTS
1. SUMMARY OF SIGNIFICANT ACCOUNTING POLICIES (CONTINUED)
Property, Equipment and Improvements, Net
Property, equipment and improvements are carried at cost, net of accumulated depreciation. Depreciation is provided by charges to operations using the straight-line method over the estimated asset useful lives. Furniture and fixtures and other equipment are depreciated over a period of three to five years. Building improvements and buildings are depreciated over ten and thirty-nine years, respectively.
Expenditures for maintenance and repairs are charged to operations as incurred, while major renewals and betterments are capitalized. The assets and related accumulated depreciation accounts are adjusted for asset retirements and disposals with the resulting gain or loss included in operations.
Identifiable Intangible Assets
Purchased proven technology, license agreements, covenants not to compete and other identifiable intangible assets are recorded at fair value when acquired in a business acquisition, or at cost when not purchased in a business acquisition. Purchased in-process research and development costs (IPR&D) related to business combinations are capitalized and amortized once placed in service. All other identifiable intangible assets are amortized on either a straight-line basis over their estimated useful lives of three to thirteen years or based on the pattern in which the asset is consumed. Useful lives for identifiable intangible assets are estimated at the time of acquisition based on the periods of time from which we expect to derive benefits from the identifiable intangible assets. Amortization of purchased and core technology is included in cost of product in the Consolidated Statements of Operations. Amortization of all other acquired identifiable intangible assets is charged to operating expenses as a component of general and administrative expense.
Identifiable intangible assets are reviewed for impairment annually or whenever events or circumstances indicate that undiscounted expected future cash flows are not sufficient to recover the carrying value amount. We measure impairment loss by utilizing an undiscounted cash flow valuation technique using fair values indicated by the income approach. Impairment losses, if any, would be recorded in the period the impairment is identified. During the fourth quarter of fiscal 2013, we recorded an impairment charge of $0.4 million which was included in general and administrative expense on our Consolidated Statements of Operations for our single operating and reporting segment (see Note 4 to our Consolidated Financial Statements). There was an immaterial amount of impairments identified in fiscal 2015 and no impairments identified during fiscal 2014.
Goodwill
Goodwill represents the excess of cost over the fair value of identifiable assets acquired. Goodwill is tested for impairment on an annual basis as of June 30, or more frequently if events or circumstances occur which could indicate impairment. The calculation of goodwill impairment requires us to make assumptions about the fair value of our one reporting unit, which historically has been approximated by using our market capitalization plus a control premium. Control premium assumptions require judgment and actual results may differ from assumed or estimated amounts.
Our test for potential goodwill impairment is a two-step approach. We estimate the fair value for our one reporting unit by comparing its fair value (market capitalization plus control premium) to our carrying value. If the carrying value of the reporting unit exceeds its estimated fair value, the second step of the goodwill impairment analysis requires us to measure the amount of the impairment loss. An impairment loss is calculated by comparing the implied fair value of the goodwill to its carrying amount. To calculate the implied fair value of goodwill, the fair value of the reporting unit's assets and liabilities, excluding goodwill, is estimated. The excess of the fair value of the reporting unit over the amount assigned to its assets and liabilities, excluding goodwill, is the implied fair value of the reporting unit's goodwill.
In June 2014, we performed a control premium study to determine the appropriate control premium to include in the calculation of fair value. We used a third party valuation firm to assist us in performing the control premium analysis. In order to estimate the range of control premiums appropriate for us, the following three methodologies were used: (1) analysis of individual transactions within our industry; (2) analysis of industry-wide data, and (3) analysis of global transaction data. Individual transactions in the Communication Equipment or Technology Hardware, Storage and Peripherals industries were used to find transactions of target companies that operated in similar markets and shared similar operating characteristics with us.
43
NOTES TO CONSOLIDATED FINANCIAL STATEMENTS
1. SUMMARY OF SIGNIFICANT ACCOUNTING POLICIES (CONTINUED)
Transaction screening criteria included selection of transactions with the following characteristics:
•At least 50 percent of a target company’s equity sought by an acquirer,
•Target company considered operating (not in bankruptcy),
•Target company had publicly traded stock outstanding at the transaction date, and
• | Transactions announced between June 30, 2009 and the valuation date. |
In analyzing industry-wide data, transactions in the following three industries were identified that encompassed the products offered by us: Office Equipment and Computer Hardware, Communications, and Computer, Supplies and Services. Finally, control premiums were considered for both domestic and international transactions. The control premium analysis resulted in a range of control premium of 30% to 40%. We re-evaluated the data and concluded that a 35% control premium continues to best represent the amount an investor would likely pay, over and above market capitalization, in order to obtain a controlling interest given the economic conditions at June 30, 2015.
Based on our industry knowledge, including recent industry merger and acquisition activity, we concluded that a 35% control premium continues to be appropriate to use for our June 30, 2015 goodwill impairment assessment.
At June 30, 2015, our market capitalization was $238.6 million compared to our carrying value of $270.6 million. Our market capitalization plus our estimated control premium of 35% resulted in a fair value in excess of our carrying value by a margin of 19%. As a result, no goodwill impairment was indicated and we were not required to complete the second step of the goodwill impairment analysis. No goodwill impairment charges were recorded. During the fourth quarter of fiscal 2015, we assessed various qualitative factors to determine whether or not an additional goodwill impairment assessment was required as of September 30, 2015, and we concluded that no additional impairment assessment was required.
As of June 30, 2014, our market capitalization was $235.8 million compared to our carrying value of $273.0 million. Our market capitalization plus our estimated control premium of 35% resulted in a fair value in excess of our carrying value by a margin of 17% and therefore no impairment was indicated.
We continue to monitor our stock price on a daily basis. If the stock price remained below certain thresholds for a significant period of time, we would complete an interim impairment assessment. We also monitor other events or circumstances that could have a significant impact on our operations. If one of these events or circumstances were to occur, we would evaluate whether an interim goodwill impairment assessment should be completed.
If our stock price or control premium declines, the first step of our goodwill impairment analysis may fail. We have identified factors that could result in additional interim goodwill impairment testing; for example, we would perform the second step of the impairment testing if our stock price fell below certain thresholds for a significant period of time, or if our control premium significantly decreased. Events or circumstances may occur that could negatively impact our stock price, including changes in our anticipated revenue and profits and our ability to execute on our strategies. In addition, our control premium could decline due to changes in economic conditions, in the technology industry, in the financial markets or more generally. An impairment could have a material effect on our consolidated balance sheet and results of operations. We have had no goodwill impairment losses since the adoption of Accounting Standards Codification (ASC) 350, Intangibles-Goodwill and Others, in fiscal 2003.
Warranties
In general, we warrant our hardware products to be free from defects in material and workmanship under normal use and service. The warranty periods generally range from one to five years. We typically have the option to either repair or replace hardware products we deem defective with regard to material or workmanship. Estimated warranty costs are accrued in the period that the related revenue is recognized based upon an estimated average per unit repair or replacement cost applied to the estimated number of units under warranty. These estimates are based upon historical warranty incidents and are evaluated on an ongoing basis to ensure the adequacy of the warranty accrual.
44
NOTES TO CONSOLIDATED FINANCIAL STATEMENTS
1. SUMMARY OF SIGNIFICANT ACCOUNTING POLICIES (CONTINUED)
Revenue Recognition
We recognize revenue in accordance with authoritative guidance issued by FASB related to revenue recognition.
Hardware product revenue as a percentage of total revenue was 91.8%, 89.7% and 88.6% in fiscal 2015, 2014 and 2013, respectively. We recognize hardware product revenue when persuasive evidence of an arrangement exists, delivery has occurred, the sales price is fixed or determinable, collectability is reasonably assured and there are no post-delivery obligations, other than warranty. Under these criteria, product revenue generally is recognized upon shipment of product to customers.
Sales to authorized domestic and foreign distributors and Direct / OEMs are made with certain rights of return and price adjustment provisions. Estimated reserves for future returns and pricing adjustments are established by us based on an analysis of historical patterns of returns and price adjustments as well as an analysis of authorized returns compared to received returns and distribution sales for the current period. Estimated reserves for future returns and price adjustments are charged against revenue in the same period as the corresponding revenue is recorded.
Service revenue as a percentage of total revenue represented 8.2%, 10.3% and 11.4% in fiscal 2015, 2014 and 2013, respectively. Our service revenue is derived primarily from professional and engineering services performed by our Etherios customer relationship management (CRM) services and our wireless design services. We also have some service revenue that is derived from our Digi Device Cloud, which is a platform-as-a-service (PaaS) offering in which customers pay for services consumed in terms of devices being managed and monitored, or as a monthly service fee for access to information. In addition, we have small amounts of revenue from our enterprise support services. We recognize service revenue from our Etherios CRM services, wireless design services, and Device Cloud based upon performance, including final product delivery and customer acceptance. In addition, we recognize small amounts of revenue from and enterprise support services which is recognized over the life of the contract, and training as the services are performed.
Research and Development
Research and development costs are expensed when incurred. Research and development costs include compensation, allocation of corporate costs, depreciation, utilities, professional services and prototypes. Software development costs are expensed as incurred until the point that technological feasibility and proven marketability of the product are established. To date, the time period between the establishment of technological feasibility and completion of software development has been short, and no significant development costs have been incurred during that period. Accordingly, we have not capitalized any software development costs to date.
Income Taxes
Deferred income taxes are recognized for the tax consequences in future years of differences between the tax basis of assets and liabilities and their financial reporting amounts at each year end based on enacted tax laws and statutory tax rates applicable to the periods in which the differences are expected to affect taxable income. Income tax expense is equal to the tax payable for the period and the change during the period in deferred tax assets and liabilities and also changes in income tax reserves.
Stock-Based Compensation
Stock-based compensation expense represents the cost of employee services received in exchange for an award of equity instruments based on the grant date fair value of the award. This cost must be recognized over the period during which an employee is required to provide the service (usually the vesting period).
Foreign Currency Translation
Financial position and results of operations of our international subsidiaries are measured using local currencies as the functional currency, except for our Singapore location which uses the U.S. Dollar as its local currency. Assets and liabilities of these operations are translated at the exchange rates in effect at the end of each reporting period. For our larger international subsidiaries, statements of operations accounts are translated at the daily rate. For all other international subsidiaries, our statements of operations accounts are translated at the weighted average rates of exchange prevailing during each reporting period. Translation adjustments arising from the use of differing currency exchange rates from period to period are included in accumulated other comprehensive loss in stockholders’ equity. Gains and losses on foreign currency exchange transactions, as well as translation gains or losses on transactions denominated in currencies other than an entity’s functional currency, are reflected in the statement of operations. During fiscal 2015, 2014 and 2013, there were net transaction gains of $0.6 million,
45
NOTES TO CONSOLIDATED FINANCIAL STATEMENTS
1. SUMMARY OF SIGNIFICANT ACCOUNTING POLICIES (CONTINUED)
$0.5 million and $0.4 million, respectively, that were recorded in other income (expense). We manage our net asset or net liability position for U.S. dollar accounts in our foreign locations to reduce our foreign currency risk. We have not implemented a formal hedging strategy.
Net Income Per Common Share
Basic net income per common share is calculated based on the weighted average number of common shares outstanding during the period. Diluted net income per common share is computed by dividing net income by the weighted average number of common and potentially dilutive common shares outstanding during the period. Potentially dilutive common shares of our stock result from dilutive common stock options and restricted stock units. We use the treasury stock method to calculate the weighted-average shares used in the diluted earnings per share computation. Under the treasury stock method, the proceeds from exercise of an option, the amount of compensation cost, if any, for future service that we have not yet recognized, and the amount of estimated tax benefits that would be recorded in paid-in capital, if any, when the option is exercised are assumed to be used to repurchase shares in the current period.
The following table is a reconciliation of the numerators and denominators in the net income per common share calculations (in thousands, except per common share data):
Fiscal years ended September 30, | |||||||||||
2015 | 2014 | 2013 | |||||||||
Numerator: | |||||||||||
Net income | $ | 6,588 | $ | 1,751 | $ | 5,805 | |||||
Denominator: | |||||||||||
Denominator for basic net income per common share — weighted average shares outstanding | 24,645 | 25,345 | 25,956 | ||||||||
Effect of dilutive securities: | |||||||||||
Stock options and restricted stock units | 582 | 385 | 281 | ||||||||
Denominator for diluted net income per common share — adjusted weighted average shares | 25,227 | 25,730 | 26,237 | ||||||||
Net income per common share, basic | $ | 0.27 | $ | 0.07 | $ | 0.22 | |||||
Net income per common share, diluted | $ | 0.26 | $ | 0.07 | $ | 0.22 | |||||
Because their effect would be anti-dilutive at period end, certain potentially dilutive shares related to stock options to purchase common shares were excluded in the above computation of diluted earnings per share because the options’ exercise prices were greater than the average market price of our common shares. At September 30, 2015, 2014 and 2013, such excluded stock options were 3,016,911, 3,284,993 and 3,939,541, respectively.
Use of Estimates and Risks and Uncertainties
The preparation of consolidated financial statements in conformity with generally accepted accounting principles in the United States requires management to make estimates and assumptions that affect the reported amounts of assets and liabilities and disclosure of contingent assets and liabilities at the date of the financial statements and the reported amount of revenue and expenses during the reporting period. Actual results could differ from those estimates. Estimates that could significantly affect our results of operations or financial condition involve the assignment of fair values upon acquisition of goodwill and other intangible assets and testing for impairment; the determination of our allowance for doubtful accounts and reserve for future returns and pricing adjustments; the estimation of our inventory obsolescence, warranty reserve, income tax reserves and other contingencies.
Comprehensive Income (Loss)
Our comprehensive income (loss) is comprised of net income, foreign currency translation adjustments and unrealized gains and losses on available-for-sale marketable securities, which are charged or credited to the accumulated other comprehensive loss account in stockholders’ equity.
46
NOTES TO CONSOLIDATED FINANCIAL STATEMENTS
1. SUMMARY OF SIGNIFICANT ACCOUNTING POLICIES (CONTINUED)
Recent Accounting Developments
Adopted
In July 2013, the Financial Accounting Standards Board (“FASB”) issued ASU 2013-11, “Presentation of an Unrecognized Tax Benefit When a Net Operating Loss Carryforward, a Similar Tax Loss, or a Tax Credit Carryforward Exists.” This guidance relates to the presentation of an unrecognized tax benefit when a net operating loss carryforward, a similar tax loss, or a tax credit carryforward exists. The standard update provides that a liability related to an unrecognized tax benefit should be offset against same jurisdiction deferred tax assets for a net operating loss carryforward, a similar tax loss, or a tax credit carryforward if such settlement is required or expected in the event the uncertain tax position is disallowed. This guidance was effective prospectively for fiscal years (and interim reporting periods within those years) beginning after December 15, 2013. We adopted this guidance during the fiscal quarter ended December 31, 2014, resulting in a reclassification of $0.4 million of unrecognized tax benefits to noncurrent deferred tax assets.
In March 2013, FASB issued ASU 2013-05, “Foreign Currency Matters (Topic 830): Parent’s Accounting for the Cumulative Translation Adjustment upon Derecognition of Certain Subsidiaries or Groups of Assets within a Foreign Entity or of an Investment in a Foreign Entity.” This guidance applies to the release of the cumulative translation adjustment into net income when a parent either sells a part or all of its investment in a foreign entity or no longer holds a controlling financial interest in a subsidiary or group of assets that is a business within a foreign entity. ASU 2013-05 was effective prospectively for fiscal years (and interim reporting periods within those years) beginning after December 15, 2013. We adopted this guidance during the fiscal quarter ended December 31, 2014. There was no impact on our condensed consolidated financial statements as we have not sold any foreign entities for which we hold a controlling financial interest.
Not Yet Adopted
In September 2015, FASB issued ASU 2015-16, "Simplifying the Accounting for Measurement-Period Adjustments." To simplify the accounting for adjustments made to provisional amounts recognized in a business combination, the amendments in this update eliminate the requirement to retrospectively account for those adjustments. The amendments in this update are effective for fiscal years beginning after December 15, 2015, including interim periods within those years, which for us will be the first fiscal quarter ending December 31, 2016. Earlier application is permitted for financial statements that have not been issued. We are currently evaluating the impact of the adoption of ASU 2015-16.
In July 2015, FASB issued ASU 2015-11, "Simplifying the Measurement of Inventory." This provision would require inventory that was previously recorded using first-in, first-out (FIFO) to lower of cost and net realizable value. Net realizable value is the estimated selling price in the ordinary course of business, less reasonably predictable costs of completion, disposal, and transportation. This guidance is effective for fiscal years beginning after December 15, 2016 and interim periods within those years, which for us will be the first fiscal quarter ending December 31, 2017. The amendments in this guidance should be applied prospectively with earlier application permitted as of the beginning of an interim or annual period. We are currently evaluating the impact of the adoption of ASU 2015-11 and whether it would have a material impact on our consolidated financial statements.
In April 2015, FASB issued ASU 2015-05, “Intangibles-Goodwill and Other-Internal-Use Software (Subtopic 350-40) - Customer’s Accounting for Fees Paid in a Cloud Computing Arrangement. The new standard provides guidance to customers about whether a cloud computing arrangement includes a software license. If the arrangement does include a software license, the software license element of the arrangement should be accounted for in the same manner as the acquisition of other software licenses. This guidance is effective for fiscal years, and interim periods within those years, beginning after December 15, 2015, with early adoption permitted. We expect to adopt this guidance beginning with our fiscal quarter ending December 31, 2016. We do not expect this guidance to have a material impact on our consolidated financial statements.
In August 2014, FASB issued ASU 2014-15, “Presentation of Financial Statements - Going Concern.” This guidance requires management to evaluate whether there is substantial doubt about a company’s ability to continue as a going concern and to provide related footnote disclosures. These amendments are effective for the annual period ending after December 15, 2016, and for annual periods and interim periods thereafter, which for us, will be the fourth fiscal quarter ended September 30, 2017. Early adoption is permitted. While we are evaluating the impact of the adoption of ASU 2014-15, we do not expect it to have an impact on our consolidated financial statements.
47
NOTES TO CONSOLIDATED FINANCIAL STATEMENTS
1. SUMMARY OF SIGNIFICANT ACCOUNTING POLICIES (CONTINUED)
In May 2014, FASB issued ASU 2014-09, “Revenue from Contracts with Customers.” This guidance provides a five-step analysis in determining when and how revenue is recognized so that an entity will recognize revenue when it transfers promised goods or services to customers in an amount that reflects what it expects in exchange for the goods and services. It also requires more detailed disclosures to enable users of financial statements to understand the nature, amount, timing and uncertainty of revenue and cash flows arising from contracts with customers. In August 2015, the FASB issued ASU 2015-14 "Revenue from Contracts with Customers (Topic 606): Deferral of the Effective Date" which approved a one-year deferral of the effective date of ASU 2014-09. As a result of this deferral, ASU 2014-09 is effective for our fiscal 2019, including interim periods within that reporting period. The FASB also agreed to allow us to choose to adopt the standard effective for our fiscal 2018. We are assessing the adoption date and potential impact of adopting this ASU on our consolidated financial statements and related disclosures.
2. ACQUISITION
Etherios, Inc.
On October 31, 2012, we acquired Etherios, Inc. ("Etherios"). The total purchase price of $20.4 million included $13.7 million in cash (excluding cash acquired of $0.8 million) and $6.7 million represented by 715,571 shares of our common stock. The common stock issued was valued at $9.42 per common share.
Cash in the amount of $2.35 million was deposited to an escrow fund with a third party agent. Of the $2.35 million escrow, $0.3 million related to a holdback amount pending final determination of the unpaid debt and working capital as shown on the closing balance sheet. This holdback amount was released to the sellers in February 2013 as there were no changes to the closing balance sheet. An additional $2.05 million was held in escrow in accordance with the terms of the stock purchase agreement until eighteen months after closing. These amounts were held in escrow to satisfy any claims that representations and warranties in the stock purchase agreement were not true. Ultimately, no claims were made and the escrow agent released these funds on April 30, 2014. The escrowed amounts were included in the determination of the purchase consideration on the date of acquisition as management expected that the representation and warranty matters were determinable beyond a reasonable doubt.
The purchase price was allocated to the estimated fair value of assets acquired and liabilities assumed. During the fourth quarter of fiscal 2013, we recorded final purchase accounting entries that reduced the value of the common stock issued by $0.1 million to reflect the closing price on the date of the acquisition and we reduced the fair value of the net tangible assets acquired by $0.3 million. These adjustments resulted in an increase of $0.2 million in goodwill. The final purchase price allocation resulted in the recognition of $17.3 million of goodwill. The acquisition resulted in the recognition of goodwill primarily because Etherios is a salesforce.com Platinum Partner and experienced in end user implementation of the Salesforce Service Cloud. Although the relationship with salesforce.com was important to us, it was not an exclusive relationship and required Etherios to compete with others for business opportunities. Accordingly, we determined that this relationship could not be valued as a separate intangible asset of Etherios and as a result was a component of goodwill. As salesforce.com has signaled its intent for the Service Cloud to be used as a means to monitor machines, we determined the acquisition of Etherios likely would further enhance our solutions offerings and provide another channel for revenue of our networking products.
Costs related to the acquisition, which included legal, accounting and valuation fees, in the amount of $0.2 million were charged directly to operations and were included in general and administrative expense in our Consolidated Statements of Operations for fiscal 2013.
Etherios’ operating results were included in our Consolidated Results of Operations from the day following the acquisition on October 31, 2012. Because the Etherios acquisition was not material to our consolidated results of operations or financial position, pro forma financial information was not presented. On October 23, 2015, we entered into a stock purchase agreement with West Monroe Partners, LLC, in which they acquired all of the outstanding capital stock of our wholly owned subsidiary, Etherios, Inc. (see Note 18 to our Consolidated Financial Statements).
48
NOTES TO CONSOLIDATED FINANCIAL STATEMENTS
3. GOODWILL AND OTHER IDENTIFIABLE INTANGIBLE ASSETS, NET
Identifiable Intangible Assets, Net
Amortizable identifiable intangible assets, net as of September 30, 2015 and 2014 are comprised of the following (in thousands):
September 30, 2015 | September 30, 2014 | ||||||||||||||||||||||
Gross carrying amount | Accum. amort. | Net | Gross carrying amount | Accum. amort. | Net | ||||||||||||||||||
Purchased and core technology | $ | 45,449 | $ | (45,424 | ) | $ | 25 | $ | 45,952 | $ | (45,162 | ) | $ | 790 | |||||||||
License agreements | 18 | (4 | ) | 14 | 2,440 | (2,440 | ) | — | |||||||||||||||
Patents and trademarks | 11,817 | (10,568 | ) | 1,249 | 11,667 | (9,799 | ) | 1,868 | |||||||||||||||
Customer relationships | 18,490 | (16,057 | ) | 2,433 | 18,894 | (15,445 | ) | 3,449 | |||||||||||||||
Non-compete agreements | 1,100 | (642 | ) | 458 | 1,100 | (422 | ) | 678 | |||||||||||||||
Order backlog | — | — | — | 360 | (360 | ) | — | ||||||||||||||||
Total | $ | 76,874 | $ | (72,695 | ) | $ | 4,179 | $ | 80,413 | $ | (73,628 | ) | $ | 6,785 | |||||||||
During the fourth quarter of fiscal 2013, we recorded an impairment charge of $0.4 million in general and administrative expense on our Consolidated Statements of Operations for our single operating and reporting segment. Management determined to end-of-life certain product lines acquired in connection with the MobiApps acquisition due to various factors impacting the viability of these product lines. These products lines utilized certain identifiable intangible technology assets which were part of the assets purchased at the time of acquisition. The impairment charge consisted of $0.2 million for patented satellite technology and $0.1 million relating to an associated license agreement as the net carrying values of these intangible assets were not recoverable and the undiscounted future cash flows did not exceed the net carrying value of the assets. We also wrote off $0.1 million of various patents that were abandoned.
Amortization expense for fiscal years 2015, 2014 and 2013 is as follows (in thousands):
Fiscal year | Total | ||
2015 | $ | 2,910 | |
2014 | $ | 3,589 | |
2013 | $ | 4,416 | |
Estimated amortization expense for the next five years is as follows (in thousands):
Fiscal year | Total | ||
2016 | $ | 1,944 | |
2017 | $ | 1,061 | |
2018 | $ | 487 | |
2019 | $ | 451 | |
2020 | $ | 168 | |
Goodwill
The changes in the carrying amount of goodwill were (in thousands):
Fiscal years ended September 30, | |||||||
2015 | 2014 | ||||||
Beginning balance, October 1 | $ | 103,398 | $ | 103,569 | |||
Foreign currency translation adjustment | (1,301 | ) | (171 | ) | |||
Ending balance, September 30 | $ | 102,097 | $ | 103,398 | |||
49
NOTES TO CONSOLIDATED FINANCIAL STATEMENTS
4. SEGMENT INFORMATION AND MAJOR CUSTOMERS
We operate under a single operating and reporting segment. Our revenue consists of hardware product revenue and service revenue. In an effort to provide further transparency of our financial information, we have expanded our hardware product categories for revenue reporting. Beginning with the first quarter of fiscal 2016, we will transition away from reporting revenue in terms of growth and mature hardware products and will report four product categories: Cellular routers and gateways, Radio Frequency (RF), Embedded and Network. We believe this is a more meaningful presentation and reflects how we are monitoring our revenue.
Our cellular product category includes cellular routers and all gateways, and the RF product category includes XBee® modules as well as other RF solutions. The embedded product category includes Digi Connect® and Rabbit® embedded systems on module and single board computers. The network product category, which has the highest concentration of mature products, includes console and serial servers and USB connected devices.
Our service offerings include wireless product design and development services, CRM consulting services, application development services, our PaaS recurring revenue generated from Device Cloud platform, post-contract customer support and fees associated with enterprise support services.
The following table presents our revenue by our new product categories (in thousands):
Fiscal years ended September 30, | |||||||||||
2015 | 2014 | 2013 | |||||||||
Cellular routers and gateways | $ | 58,666 | $ | 39,215 | $ | 33,227 | |||||
RF | 34,373 | 29,094 | 29,157 | ||||||||
Embedded | 51,063 | 49,681 | 57,597 | ||||||||
Network | 51,395 | 54,856 | 53,097 | ||||||||
Total product revenue | 195,497 | 172,846 | 173,078 | ||||||||
Service | 17,361 | 19,855 | 22,303 | ||||||||
Total revenue | $ | 212,858 | $ | 192,701 | $ | 195,381 | |||||
The following table presents revenue for our growth and mature categories (in thousands):
Fiscal years ended September 30, | |||||||||||
2014 | 2013 | 2012 | |||||||||
Growth hardware products and all services | $ | 133,572 | $ | 109,763 | $ | 110,350 | |||||
Mature hardware products | 79,286 | 82,938 | 85,031 | ||||||||
Total revenue | $ | 212,858 | $ | 192,701 | $ | 195,381 | |||||
The information in the following table provides revenue by the geographic location of the customer for the fiscal years ended September 30, 2015, 2014 and 2013 (in thousands):
Fiscal years ended September 30, | |||||||||||
2015 | 2014 | 2013 | |||||||||
North America, primarily United States | $ | 136,603 | $ | 116,421 | $ | 116,541 | |||||
Europe, Middle East & Africa | 47,523 | 47,729 | 48,815 | ||||||||
Asia | 22,907 | 22,762 | 24,507 | ||||||||
Latin America | 5,825 | 5,789 | 5,518 | ||||||||
Total revenue | $ | 212,858 | $ | 192,701 | $ | 195,381 | |||||
50
NOTES TO CONSOLIDATED FINANCIAL STATEMENTS
4. SEGMENT INFORMATION AND MAJOR CUSTOMERS (CONTINUED)
Net property, equipment and improvements by geographic location are as follows (in thousands):
Fiscal years ended September 30, | |||||||||||
2015 | 2014 | 2013 | |||||||||
United States | $ | 14,103 | $ | 12,813 | $ | 13,321 | |||||
International, primarily Europe | 254 | 418 | 589 | ||||||||
Total net property, equipment and improvements | $ | 14,357 | $ | 13,231 | $ | 13,910 | |||||
Our U.S. export sales comprised 37.7% , 41.2% and 41.7% of revenue for the fiscal years ended September 30, 2015, 2014 and 2013. No single customer exceeded 10% of revenue for any of the periods presented. At September 30, 2015, we had two customers, whose accounts receivable balance comprised 10.2% and 11.0% of total accounts receivable. No single customer exceeded 10% of total accounts receivable at September 30, 2014.
5. SELECTED BALANCE SHEET DATA
(in thousands)
As of September 30, | |||||||
2015 | 2014 | ||||||
Accounts receivable, net: | |||||||
Accounts receivable | $ | 29,688 | $ | 28,943 | |||
Less allowance for doubtful accounts | 483 | 367 | |||||
Total accounts receivable, net | $ | 29,205 | $ | 28,576 | |||
Inventories: | |||||||
Raw materials | $ | 26,037 | $ | 26,402 | |||
Work in process | 598 | 315 | |||||
Finished goods | 5,242 | 4,530 | |||||
Total inventories | $ | 31,877 | $ | 31,247 | |||
Property, equipment and improvements, net: | |||||||
Land | $ | 1,800 | $ | 1,800 | |||
Buildings | 10,522 | 10,522 | |||||
Improvements | 3,328 | 3,420 | |||||
Equipment | 15,691 | 13,646 | |||||
Purchased software | 3,458 | 3,559 | |||||
Furniture and fixtures | 2,742 | 2,477 | |||||
Total property, equipment and improvements, gross | 37,541 | 35,424 | |||||
Less accumulated depreciation and amortization | 23,184 | 22,193 | |||||
Total property, equipment and improvements, net | $ | 14,357 | $ | 13,231 | |||
6. MARKETABLE SECURITIES
Our marketable securities consist of certificates of deposit, commercial paper, corporate bonds and government municipal bonds. We analyze our available-for-sale marketable securities for impairment on an ongoing basis. When we perform this analysis, we consider factors such as the length of time and extent to which the securities have been in an unrealized loss position and the trend of any unrealized losses. We also consider whether an unrealized loss is a temporary loss or an other-than-temporary loss such as: (a) whether we have the intent to sell the security, or (b) whether it is more likely than not that we will be required to sell the security before its anticipated recovery, or (c) permanent impairment due to bankruptcy or insolvency.
In order to estimate the fair value for each security in our investment portfolio, we obtain quoted market prices and trading activity for each security where available. We obtain relevant information from our investment advisor and, if warranted, also
51
NOTES TO CONSOLIDATED FINANCIAL STATEMENTS
6. MARKETABLE SECURITIES (CONTINUED)
may review the financial solvency of certain security issuers. As of September 30, 2015, 44 of our 81 securities that we held were trading below our amortized cost basis. We determined each decline in value to be temporary based upon the above described factors. We expect to realize the fair value of these securities, plus accrued interest, either at the time of maturity or when the security is sold. All of our current holdings are classified as available-for-sale marketable securities and are recorded at fair value on our consolidated balance sheet with the unrealized gains and losses recorded in accumulated other comprehensive loss. All of our current marketable securities will mature in less than one year and our non-current marketable securities will mature in less than 3 years. We received proceeds from the sale of our available-for-sale marketable securities of $38.0 million, $47.4 million and $63.1 million for fiscal 2015, 2014 and 2013, respectively.
At September 30, 2015 our marketable securities were (in thousands):
Amortized Cost (1) | Unrealized Gains | Unrealized Losses | Fair Value (1) | ||||||||||||
Current marketable securities: | |||||||||||||||
Corporate bonds | $ | 31,753 | $ | — | $ | (39 | ) | $ | 31,714 | ||||||
Commercial paper | 7,986 | — | (1 | ) | 7,985 | ||||||||||
Certificates of deposit | 6,253 | 8 | — | 6,261 | |||||||||||
Government municipal bonds | 1,232 | — | — | 1,232 | |||||||||||
Current marketable securities | 47,224 | 8 | (40 | ) | 47,192 | ||||||||||
Non-current marketable securities: | |||||||||||||||
Corporate bonds | 4,138 | — | (13 | ) | 4,125 | ||||||||||
Certificates of deposit | 7,511 | 3 | (7 | ) | 7,507 | ||||||||||
Government municipal bonds | 1,996 | — | (3 | ) | 1,993 | ||||||||||
Non-current marketable securities | 13,645 | 3 | (23 | ) | 13,625 | ||||||||||
Total marketable securities | $ | 60,869 | $ | 11 | $ | (63 | ) | $ | 60,817 | ||||||
(1) | Included in amortized cost and fair value is purchased and accrued interest of $252. |
At September 30, 2014 our marketable securities were (in thousands):
Amortized Cost (1) | Unrealized Gains | Unrealized Losses | Fair Value (1) | ||||||||||||
Current marketable securities: | |||||||||||||||
Corporate bonds | $ | 24,668 | $ | 1 | $ | (22 | ) | $ | 24,647 | ||||||
Commercial paper | 3,998 | — | (1 | ) | 3,997 | ||||||||||
Certificates of deposit | 4,252 | 2 | — | 4,254 | |||||||||||
Current marketable securities | 32,918 | 3 | (23 | ) | 32,898 | ||||||||||
Non-current marketable securities: | |||||||||||||||
Corporate bonds | 2,051 | — | (4 | ) | 2,047 | ||||||||||
Certificates of deposit | 9,502 | 14 | (22 | ) | 9,494 | ||||||||||
Non-current marketable securities | 11,553 | 14 | (26 | ) | 11,541 | ||||||||||
Total marketable securities | $ | 44,471 | $ | 17 | $ | (49 | ) | $ | 44,439 | ||||||
(1) | Included in amortized cost and fair value is purchased and accrued interest of $629. |
52
NOTES TO CONSOLIDATED FINANCIAL STATEMENTS
6. MARKETABLE SECURITIES (CONTINUED)
The following tables show the fair values and gross unrealized losses of our available-for-sale securities that have been in a continuous unrealized loss position deemed to be temporary, aggregated by investment category (in thousands):
September 30, 2015 | |||||||||||||||
Less than 12 Months | More than 12 Months | ||||||||||||||
Fair Value | Unrealized Losses | Fair Value | Unrealized Losses | ||||||||||||
Corporate bonds | $ | 33,664 | $ | (52 | ) | $ | — | $ | — | ||||||
Commercial paper | 5,987 | (1 | ) | — | — | ||||||||||
Certificates of deposit | 4,244 | (6 | ) | 499 | (1 | ) | |||||||||
Government municipal bonds | 3,159 | (3 | ) | — | — | ||||||||||
Total | $ | 47,054 | $ | (62 | ) | $ | 499 | $ | (1 | ) | |||||
September 30, 2014 | |||||||||||||||
Less than 12 Months | More than 12 Months | ||||||||||||||
Fair Value | Unrealized Losses | Fair Value | Unrealized Losses | ||||||||||||
Corporate bonds | $ | 23,475 | $ | (26 | ) | $ | — | $ | — | ||||||
Commercial paper | 3,998 | (1 | ) | — | — | ||||||||||
Certificates of deposit | 2,980 | (20 | ) | 748 | (2 | ) | |||||||||
Total | $ | 30,453 | $ | (47 | ) | $ | 748 | $ | (2 | ) | |||||
7. FAIR VALUE MEASUREMENTS
Fair value is defined as the amount that would be received to sell an asset or paid to transfer a liability in an orderly transaction between market participants as of the measurement date. This standard also establishes a hierarchy for inputs used in measuring fair value. This standard maximizes the use of observable inputs and minimizes the use of unobservable inputs by requiring that the most observable inputs be used when available. Observable inputs are inputs market participants would use in valuing the asset or liability based on market data obtained from independent sources. Unobservable inputs are inputs that reflect our assumptions about the factors market participants would use in valuing the asset or liability based upon the best information available in the circumstances. The categorization of financial assets and liabilities within the valuation hierarchy is based upon the lowest level of input that is significant to the fair value measurement.
The hierarchy is broken down into the following three levels:
• | Level 1 — Inputs are quoted prices in active markets for identical assets or liabilities. |
• | Level 2 — Inputs include quoted prices for similar assets or liabilities in active markets, quoted prices for identical or similar assets or liabilities in markets that are not active, and inputs (other than quoted prices) that are observable for the asset or liability, either directly or indirectly. |
• | Level 3 — Inputs are unobservable for the asset or liability and their fair values are determined using pricing models, discounted cash flow methodologies or similar techniques and at least one significant model assumption or input is unobservable. Level 3 may also include certain investment securities for which there is limited market activity or a decrease in the observability of market pricing for the investments, such that the determination of fair value requires significant judgment or estimation. |
53
NOTES TO CONSOLIDATED FINANCIAL STATEMENTS
7. FAIR VALUE MEASUREMENTS (CONTINUED)
Fair value is applied to financial assets such as our marketable securities, which are classified and accounted for as available-for-sale. These items are stated at fair value at each reporting period using the above guidance. The following tables provide information by level for financial assets that are measured at fair value on a recurring basis (in thousands):
Fair Value Measurements at September 30, 2015 using: | |||||||||||||||
Total carrying value at September 30, 2015 | Quoted price in active markets (Level 1) | Significant other observable inputs (Level 2) | Significant unobservable inputs (Level 3) | ||||||||||||
Cash equivalents: | |||||||||||||||
Money market | $ | 14,436 | $ | 14,436 | $ | — | $ | — | |||||||
Available-for-sale marketable securities: | |||||||||||||||
Corporate bonds | 35,839 | — | 35,839 | — | |||||||||||
Commercial paper | 7,985 | — | 7,985 | — | |||||||||||
Certificates of deposit | 13,768 | — | 13,768 | — | |||||||||||
Government municipal bonds | 3,225 | — | 3,225 | — | |||||||||||
Total cash equivalents and marketable securities measured at fair value | $ | 75,253 | $ | 14,436 | $ | 60,817 | $ | — | |||||||
Fair Value Measurements at September 30, 2014 using: | |||||||||||||||
Total carrying value at September 30, 2014 | Quoted price in active markets (Level 1) | Significant other observable inputs (Level 2) | Significant unobservable inputs (Level 3) | ||||||||||||
Cash equivalents: | |||||||||||||||
Money market | $ | 19,630 | $ | 19,630 | $ | — | $ | — | |||||||
Available-for-sale marketable securities: | |||||||||||||||
Corporate bonds | 26,694 | — | 26,694 | — | |||||||||||
Commercial paper | 3,997 | — | 3,997 | — | |||||||||||
Certificates of deposit | 13,748 | — | 13,748 | — | |||||||||||
Total cash equivalents and marketable securities measured at fair value | $ | 64,069 | $ | 19,630 | $ | 44,439 | $ | — | |||||||
Cash equivalents are measured at fair value using quoted market prices in active markets for identical assets and are therefore classified as Level 1 assets. We value our Level 2 assets using inputs that are based on market indices of similar assets within an active market. There were no transfers into or out of our Level 2 financial assets during the twelve months ended September 30, 2015.
We had no financial assets valued with Level 3 inputs as of September 30, 2015 nor did we purchase or sell any Level 3 financial assets during the twelve months ended September 30, 2015.
The use of different assumptions, applying different judgment to matters that are inherently subjective and changes in future market conditions could result in different estimates of fair value of our securities, currently and in the future. If market conditions deteriorate, we may incur impairment charges for securities in our investment portfolio.
54
NOTES TO CONSOLIDATED FINANCIAL STATEMENTS
8. PRODUCT WARRANTY OBLIGATION
The following table summarizes the activity associated with the product warranty accrual (in thousands) and is listed on our Consolidated Balance Sheets under Current Liabilities:
Balance at | Warranties | Settlements | Balance at | ||||||||||||
Fiscal year | October 1 | issued | made | September 30 | |||||||||||
2015 | $ | 862 | $ | 967 | $ | (815 | ) | $ | 1,014 | ||||||
2014 | $ | 1,063 | $ | 627 | $ | (828 | ) | $ | 862 | ||||||
2013 | $ | 1,021 | $ | 669 | $ | (627 | ) | $ | 1,063 | ||||||
We are not responsible for, and do not warrant that, custom software versions, created by original equipment manufacturer (OEM) customers based upon our software source code, will function in a particular way, will conform to any specifications or are fit for any particular purpose. Further, we do not indemnify these customers from any third-party liability as it relates to or arises from any customization or modifications made by the OEM customer.
9. RESTRUCTURING
Below is a summary of the restructuring charges and other activity within the restructuring accrual (in thousands):
2015 Restructuring | 2014 Restructuring | 2013 Restructuring | 2012 Restructuring | ||||||||||||||||||||
Employee Termination Costs | Employee Termination Costs | Employee Termination Costs | Employee Termination Costs | Other | Total | ||||||||||||||||||
Balance at September 30, 2012 | $ | — | $ | — | $ | — | $ | 13 | 108 | $ | 121 | ||||||||||||
Restructuring charge | — | — | 350 | — | — | 350 | |||||||||||||||||
Payments | — | — | — | — | (84 | ) | (84 | ) | |||||||||||||||
Reversals | — | — | — | (13 | ) | (24 | ) | (37 | ) | ||||||||||||||
Balance at September 30, 2013 | — | — | 350 | — | — | 350 | |||||||||||||||||
Restructuring charge | — | 152 | — | — | — | 152 | |||||||||||||||||
Payments | — | (152 | ) | (279 | ) | — | — | (431 | ) | ||||||||||||||
Reversals | — | — | (71 | ) | — | — | (71 | ) | |||||||||||||||
Balance at September 30, 2014 | — | — | — | — | — | — | |||||||||||||||||
Restructuring charge | 518 | — | — | — | — | 518 | |||||||||||||||||
Payments | (509 | ) | — | — | — | — | (509 | ) | |||||||||||||||
Reversals | (9 | ) | — | — | — | — | (9 | ) | |||||||||||||||
Balance at September 30, 2015 | $ | — | $ | — | $ | — | $ | — | $ | — | $ | — | |||||||||||
2015 Restructuring
On February 20, 2015, we announced a restructuring plan related to our Etherios operations in order to refocus the business on CRM and service cloud implementations. We recorded a restructuring charge of $0.3 million related to severance during the second quarter of fiscal 2015. We scaled the business to expected revenue levels resulting in an elimination of approximately 21 positions. The payments associated with these charges were completed during the fourth quarter of fiscal 2015.
On January 22, 2015, we announced the closure of our India location. The March closure resulted in the elimination of approximately 38 employees from engineering, sales and administration. We recorded a restructuring charge of $0.2 million related to severance during the second quarter of fiscal 2015. The payments associated with this charge were completed during the third quarter of fiscal 2015.
55
NOTES TO CONSOLIDATED FINANCIAL STATEMENTS
9. RESTRUCTURING (CONTINUED)
2014 Restructuring
On October 31, 2013, we announced our intention to restructure certain of our operations in India. The restructuring was primarily associated with cost reduction initiatives resulting in the elimination of approximately 40 engineering and sales positions in our work force. We recorded a restructuring charge of 0.2 million related to severance during the first quarter of fiscal 2014. The payments associated with these charges and all the actions associated with the restructuring were completed during the third quarter of fiscal 2014.
2013 Restructuring
On September 27, 2013, we announced our intention to restructure certain of our operations in the U.S. The restructuring was primarily associated with cost reduction initiatives and resulted in the elimination of 15 positions in our work force. We recorded a restructuring charge of 0.4 million for severance during the fourth quarter of fiscal 2013. The payments associated with these charges and all the actions associated with the restructuring were completed during the first quarter of fiscal 2014.
2012 Restructuring
On April 26, 2012, we announced our intention to restructure certain of our operations. We recorded a $1.0 million restructuring charge. The restructuring related primarily to changes being implemented to focus on a shift in our business to more aggressively sell end-to-end IoT solutions. As a result of this restructuring, we eliminated employment positions in our work force of 30 employees at a cost of $0.6 million for severance. We also incurred expenses from vacating facilities in Davis, California and Huntington Beach, California at a cost of approximately $0.4 million. The payments associated with these charges and all the actions associated with the restructuring were completed by the second quarter of fiscal 2013.
10. INCOME TAXES
The components of income before income taxes are as follows (in thousands):
Fiscal years ended September 30, | |||||||||||
2015 | 2014 | 2013 | |||||||||
United States | $ | 2,462 | $ | (5,097 | ) | $ | (395 | ) | |||
International | 6,183 | 5,894 | 8,633 | ||||||||
Income before income taxes | $ | 8,645 | $ | 797 | $ | 8,238 | |||||
The components of the income tax provision (benefit) are as follows (in thousands):
Fiscal years ended September 30, | |||||||||||
2015 | 2014 | 2013 | |||||||||
Current: | |||||||||||
Federal | $ | 240 | $ | (309 | ) | $ | 1,418 | ||||
State | 308 | (58 | ) | 263 | |||||||
Foreign | 2,278 | 2,196 | 3,148 | ||||||||
Deferred: | |||||||||||
U.S. | (566 | ) | (2,623 | ) | (2,270 | ) | |||||
Foreign | (203 | ) | (160 | ) | (126 | ) | |||||
Income tax provision (benefit) | $ | 2,057 | $ | (954 | ) | $ | 2,433 | ||||
56
NOTES TO CONSOLIDATED FINANCIAL STATEMENTS
10. INCOME TAXES (CONTINUED)
The net deferred tax asset consists of the following (in thousands):
As of September 30, | |||||||
2015 | 2014 | ||||||
Current deferred tax asset | $ | 3,379 | $ | 3,221 | |||
Non-current deferred tax asset | 5,666 | 7,383 | |||||
Current deferred tax liability | (36 | ) | — | ||||
Non-current deferred tax liability | (135 | ) | (272 | ) | |||
Net deferred tax asset | $ | 8,874 | $ | 10,332 | |||
Uncollectible accounts and other reserves | $ | 1,075 | $ | 1,023 | |||
Depreciation and amortization | 190 | 276 | |||||
Inventories | 999 | 1,297 | |||||
Compensation costs | 7,148 | 8,606 | |||||
Tax carryforwards | 1,185 | 1,347 | |||||
Valuation allowance | (862 | ) | (572 | ) | |||
Identifiable intangible assets | (861 | ) | (1,645 | ) | |||
Net deferred tax asset | $ | 8,874 | $ | 10,332 | |||
As of September 30, 2015, we have estimated carryforwards for tax purposes as follows: We have $0.7 million of carryforwards mostly related to state research and development credits of tax credits and $0.5 million related to non-U.S. net operating losses. The majority of the state research and development tax credits and non-U.S. net operating losses have an unlimited carryforward period. The majority of our non-U.S. tax credit carryforwards will expire in 2027.
Our valuation allowance for certain U.S. and foreign locations increased to $0.9 million at September 30, 2015 from $0.6 million at September 30, 2014, due to foreign losses and limitations on current year state research and development credits. The amount of the deferred tax assets realized could vary if there are differences in the timing or amount of future reversals of existing deferred tax liabilities or changes in the amounts of future taxable income. If our future taxable income projections are not realized, an additional valuation allowance may be required, and would be reflected as income tax expense at the time that any such change in future taxable income is determined.
The reconciliation of the statutory federal income tax amount to our income tax provision (benefit) is as follows (in thousands):
Fiscal years ended September 30, | |||||||||||
2015 | 2014 | 2013 | |||||||||
Statutory income tax amount | $ | 2,939 | $ | 271 | $ | 2,801 | |||||
Increase (decrease) resulting from: | |||||||||||
State taxes, net of federal benefits | (222 | ) | (281 | ) | (32 | ) | |||||
Utilization of tax credits | (250 | ) | (76 | ) | (601 | ) | |||||
Manufacturing deduction | (285 | ) | (92 | ) | (65 | ) | |||||
Discrete tax benefits | (845 | ) | (1,470 | ) | (863 | ) | |||||
Foreign operations | 181 | 316 | 166 | ||||||||
Valuation reserve | 297 | 11 | 65 | ||||||||
Adjustment of tax contingency reserves | 71 | 168 | 800 | ||||||||
Meals and entertainment | 93 | 99 | 80 | ||||||||
Employee stock purchase plan | 76 | 85 | 77 | ||||||||
Other, net | 2 | 15 | 5 | ||||||||
Income tax provision (benefit) | $ | 2,057 | $ | (954 | ) | $ | 2,433 | ||||
57
NOTES TO CONSOLIDATED FINANCIAL STATEMENTS
10. INCOME TAXES (CONTINUED)
During fiscal 2015, we recorded net tax benefits of $0.9 million resulting from the reinstatement of the research and development tax credit for calendar year 2014, reversal of tax reserves due to the expiration of statute of limitations from U.S. and foreign tax jurisdictions and reversal of tax reserves due to the resolution of tax audits. These benefits are included within the discrete tax benefits in the above table.
During fiscal 2014, we recorded net tax benefits of $1.4 million, related to the re-measurement and reversal of certain income tax reserves as a result of a federal income tax audit of fiscal 2012, the reassessment of state research and development tax credits and the release of income tax reserves due to the expiration of statute of limitations from U.S. and foreign tax jurisdictions. These benefits are included within the discrete tax benefits in the above table.
During fiscal 2013, we recorded net tax benefits of $0.8 million related to the January 2, 2013 enactment of the American Taxpayers Relief Act of 2012 extending the research and development tax credit for the last three quarters of fiscal 2012 and the release of income tax reserves due to the expiration of the statute of limitations from various U.S. and foreign tax jurisdictions. These benefits are included within the discrete tax benefits in the above table.
A reconciliation of the beginning and ending amount of unrecognized tax benefits is (in thousands):
Fiscal years ended September 30, | |||||||||||
2015 | 2014 | 2013 | |||||||||
Unrecognized tax benefits at beginning of fiscal year | $ | 2,301 | $ | 3,332 | $ | 2,720 | |||||
Increases related to: | |||||||||||
Prior year income tax positions | 110 | 181 | 162 | ||||||||
Current year income tax positions | 144 | 148 | 733 | ||||||||
Decreases related to: | |||||||||||
Prior year income tax positions | (255 | ) | (1,105 | ) | — | ||||||
Settlements | (74 | ) | (95 | ) | — | ||||||
Expiration of statute of limitations | (608 | ) | (160 | ) | (283 | ) | |||||
Unrecognized tax benefits at end of fiscal year | $ | 1,618 | $ | 2,301 | $ | 3,332 | |||||
The total amount of unrecognized tax benefits at September 30, 2015 that, if recognized, would affect our effective tax rate is $1.6 million. We expect that it is reasonably possible that the total amounts of unrecognized tax benefits will decrease approximately $0.2 million over the next 12 months due to the expiration of various statutes of limitations.
Of the $1.6 million of unrecognized tax benefits, $1.2 million is included in non-current income taxes payable and $0.4 million is included with non-current deferred tax assets on the consolidated balance sheet at September, 20, 2015.
We recognize interest and penalties related to income tax matters in income tax expense. During the fiscal years ended 2015 and 2014, there were $0.1 million and $0.2 million, respectively, of benefits for interest and penalties related to income tax matters in income tax expense. We had accrued interest and penalties related to unrecognized tax benefits of $0.3 million at September 30, 2015 and $0.4 million at September 30, 2014. Our long-term income taxes payable on our consolidated balance sheets includes these accrued interest and penalties in addition to the unrecognized tax benefits in the table above.
We operate in multiple tax jurisdictions both in the U.S. and outside of the U.S and face audits from various tax authorities regarding transfer pricing, tax credits, and other matters. Accordingly, we must determine the appropriate allocation of income to each of these jurisdictions. This determination requires us to make several estimates and assumptions. Tax audits associated with the allocation of this income, and other complex issues, may require an extended period of time to resolve and may result in adjustments to our income tax balances in those years that are material to our consolidated balance sheet and results of operations. With a few exceptions, we are no longer subject to income tax examination for tax years prior to fiscal 2013. For state taxing authorities, most notably in California and Texas, we are no longer subject to income tax examination for tax years generally before fiscal 2011, and for Minnesota for tax years prior to fiscal 2013. We do not anticipate significant changes to our unrecognized tax benefits as a result of these examinations.
At September 30, 2015, we had approximately $28.2 million of accumulated undistributed foreign earnings, for which we have not accrued additional U.S. tax. Our policy is to reinvest earnings of our foreign subsidiaries indefinitely to fund current
58
NOTES TO CONSOLIDATED FINANCIAL STATEMENTS
10. INCOME TAXES (CONTINUED)
operations and provide for future international expansion opportunities, and only repatriate earnings to the extent that U.S. taxes have already been recorded. Although we have no current need or intention to repatriate historical earnings in the form of cash in the United States, if we change our assertion from indefinitely reinvesting undistributed foreign earnings, we would have to accrue applicable taxes. The amount of any taxes and the application of any tax credits would be determined based on the income tax laws at the time of such repatriation. Under current tax laws, we estimate the unrecognized deferred tax liability to be up to $0.8 million.
11. STOCK-BASED COMPENSATION
During fiscal 2015, stock-based awards were granted under the terms of the 2014 Omnibus Incentive Plan (the 2014 Plan). The authority to grant options under the 2014 Plan and set other terms and conditions rests with the Compensation Committee of the Board of Directors. We also have outstanding shares related to stock-based awards for plans in which we can no longer grant shares. These plans include the 2013 Omnibus Incentive Plan (the 2013 Plan), which expired during the second quarter of fiscal 2014, the 2000 Omnibus Stock Plan as amended and restated as of December 4, 2009 (the Omnibus Plan), which expired during the second quarter of fiscal 2013 and the Stock Option Plan as amended and restated as of November 27, 2006 (the Stock Option Plan) and Non-Officer Stock Option Plan as amended and restated as of November 27, 2006 (the Non-Officer Plan), both of which expired during the first quarter of fiscal 2007 (the Plans).
The 2014 Plan authorizes the issuance of up to 2,250,000 common shares in connection with awards of stock options, stock appreciation rights, restricted stock, restricted stock units, performance-based full value awards or other stock-based awards. Eligible participants include our employees, our affiliates, non-employee directors of our Company and any consultant or advisor who is a natural person and provides services to us or our affiliates. Options granted under this plan generally vest over a four year service period and will expire if unexercised after eight years from the date of grant. Restricted stock awards (RSU's) that were granted to Directors typically vest in one year. RSU's that were granted to executives and employees typically vest in November over a four-year period. Awards may be granted under the 2014 Plan until January 27, 2024 as the 2014 Plan was ratified on January 27, 2014 at the Annual Meeting of Stockholders. Options under the 2014 Plan can be granted as either incentive stock options (ISOs) or non-statutory stock options (NSOs). The exercise price of options and the grant date price of restricted stock shall be determined by our Compensation Committee but shall not be less than the fair market value of our common stock based on the closing price on the date of grant. As of September 30, 2015, there were approximately 1,369,684 shares available for future grants under the 2014 Plan.
The 2013 Plan authorized the issuance of up to 1,750,000 common shares in connection with awards of stock options, stock appreciation rights, restricted stock, restricted stock units, performance-based full value awards or stock awards. Eligible participants included our employees, non-employee directors, consultants and advisors. Options granted under this plan generally vested over a four year service period and will expire if unexercised after eight years from the date of grant. RSU's that were granted to Directors typically vested in one year. Awards may no longer be granted under the Incentive Plan as the plan was terminated effective January 27, 2014 at the Annual Meeting of Stockholders. Options under the 2013 Plan were granted as either ISOs or NSOs. The exercise price was determined by our Compensation Committee but could not be less than the fair market value of our common stock based on the closing price on the date of grant.
The Omnibus Plan authorized the issuance of up to 5,750,000 common shares in connection with awards of stock options, stock appreciation rights, restricted stock, performance units or stock awards. Eligible participants included our employees, non-employee directors, consultants and advisors. An authorization to issue an additional 2,500,000 common shares was ratified on January 25, 2010 at the Annual Meeting of Stockholders. Awards may no longer be granted under the Omnibus Plan as the plan was terminated as to future awards on January 28, 2013 at the Annual Meeting of Stockholders. Options under the Omnibus Plan were granted as either ISOs or non-statutory stock options NSOs. The exercise price was determined by our Compensation Committee but could not be less than the fair market value of our common stock based on the closing price on the date of grant.
Awards outstanding under the Stock Option Plan and the Non-Officer Plan included NSOs. In addition, the Stock Option Plan also included ISOs to employees and others who provided services to us, including consultants, advisers and directors. Options granted under these plans generally vested over a four year service period and will expire if unexercised after ten years from the date of grant. The exercise price for ISOs and non-employee director options granted under the Stock Option Plan was set at the fair market value of our common stock based on the closing price on the date of grant. The exercise price for NSOs granted under the Stock Option Plan or the Non-Officer Plan was set by the Compensation Committee of the Board of Directors and was set to the exercise price based on the closing price on the date of grant.
59
NOTES TO CONSOLIDATED FINANCIAL STATEMENTS
11. STOCK-BASED COMPENSATION (CONTINUED)
We recorded cash received from the exercise of stock options of $6.6 million, $3.7 million and $2.2 million during fiscal years 2015, 2014 and 2013, respectively. During fiscal 2015, there were no excess tax benefits from stock-based compensation. The excess tax benefits from stock-based compensation were minimal during fiscal 2014 and $0.1 million during fiscal year 2013. Upon exercise, we issue new shares of stock. Our award plans have provisions allowing employees to elect to pay their withholding obligation through share reduction (see Note 12).
We sponsor an Employee Stock Purchase Plan as amended and restated as of October 29, 2013, December 4, 2009 and November 27, 2006 (the Purchase Plan), covering all domestic employees with at least 90 days of continuous service and who are customarily employed at least 20 hours per week. The Purchase Plan allows eligible participants the right to purchase common stock on a quarterly basis at the lower of 85% of the market price at the beginning or end of each three-month offering period. The Purchase Plan was ratified on January 27, 2014 at the Annual Meeting of Stockholders to increase the number of shares reserved for future purchases by 800,000 shares bringing the total number of shares to 2,800,000 shares of our Common Stock that may be purchased under the plan. Employee contributions to the Purchase Plan were $0.9 million in fiscal 2015, and $1.0 million in both fiscal 2014 and 2013. Pursuant to the Purchase Plan, 123,847, 129,449, and 128,853 common shares were issued to employees during the fiscal years ended 2015, 2014 and 2013, respectively. Shares are issued under the Purchase Plan from treasury stock. As of September 30, 2015, 617,531 common shares were available for future issuances under the Purchase Plan.
Stock-based compensation cost capitalized as part of inventory was immaterial as of September 30, 2015, 2014 and 2013.
Stock-based compensation expense is included in the consolidated results of operations as follows (in thousands):
Fiscal years ended September 30, | |||||||||||
2015 | 2014 | 2013 | |||||||||
Cost of sales | $ | 356 | $ | 345 | $ | 183 | |||||
Sales and marketing | 1,197 | 1,179 | 1,261 | ||||||||
Research and development | 785 | 735 | 772 | ||||||||
General and administrative | 1,963 | 2,071 | 1,556 | ||||||||
Stock-based compensation before income taxes | 4,301 | 4,330 | 3,772 | ||||||||
Income tax benefit | (1,493 | ) | (1,491 | ) | (1,192 | ) | |||||
Stock-based compensation after income taxes | $ | 2,808 | $ | 2,839 | $ | 2,580 | |||||
The following table summarizes our stock option activity (in thousands, except per common share amounts):
Options Outstanding | Weighted Average Exercised Price | Weighted Average Contractual Term (in years) | Aggregate Intrinsic Value (1) | ||||||||
Balance at September 30, 2014 | 6,029 | $10.61 | |||||||||
Granted | 810 | 8.12 | |||||||||
Exercised | (739 | ) | 8.87 | ||||||||
Forfeited / Canceled | (1,300 | ) | 11.55 | ||||||||
Balance at September 30, 2015 | 4,800 | $10.21 | 4.8 | $ | 9,163 | ||||||
Exercisable at September 30, 2015 | 3,540 | $10.66 | 4.1 | $ | 5,575 | ||||||
(1) The aggregate intrinsic value represents the total pre-tax intrinsic value, based on our closing stock price of $11.79 as of September 30, 2015, which would have been received by the option holders had all option holders exercised their options as of that date.
The intrinsic value of an option is the amount by which the fair value of the underlying stock exceeds its exercise price. The total intrinsic value of all options exercised during each of the twelve months ended September 30, 2015, 2014 and 2013 was $0.9 million, $0.5 million and $0.5 million, respectively.
60
NOTES TO CONSOLIDATED FINANCIAL STATEMENTS
11. STOCK-BASED COMPENSATION (CONTINUED)
The table below shows the weighted average fair value, which was determined based upon the fair value of each option on the grant date utilizing the Black-Scholes option-pricing model and the related assumptions:
Fiscal years ended September 30, | |||||||||||
2015 | 2014 | 2013 | |||||||||
Weighted average per option grant date fair value | $ | 2.98 | $ | 4.35 | $ | 3.77 | |||||
Assumptions used for option grants: | |||||||||||
Risk free interest rate | 1.57% - 1.85% | 1.76% - 2.02% | 0.88% - 1.78% | ||||||||
Expected term | 6.00 years | 6.00 years | 6.25 years | ||||||||
Expected volatility | 32% - 36% | 38% - 40% | 40% | ||||||||
Weighted average volatility | 35% | 40% | 40% | ||||||||
Expected dividend yield | 0 | 0 | 0 | ||||||||
The fair value of each option award granted during the periods presented was estimated using the Black-Scholes option valuation model that uses the assumptions noted in the table above. Expected volatilities are based on the historical volatility of our stock. We use historical data to estimate option exercise and employee termination information within the valuation model; separate groups of grantees that have similar historical exercise behaviors are considered separately for valuation purposes. The expected term of options granted is derived from the vesting period and historical information and represents the period of time that options granted are expected to be outstanding. The risk-free rate used is the zero-coupon U.S. Treasury bond rate in effect at the time of the grant whose maturity equals the expected term of the option.
We use historical data to estimate pre-vesting forfeiture rates. The pre-vesting forfeiture rate used in fiscal 2015 was 6.0%. As of September 30, 2015 the total unrecognized compensation cost related to non-vested stock-based compensation arrangements, net of expected forfeitures, was $3.6 million and the related weighted average period over which it is expected to be recognized is approximately 2.7 years.
At September 30, 2015, the weighted average exercise price and remaining life of the stock options are as follows (in thousands, except remaining life and exercise price):
Options Outstanding | Options Exercisable | |||||||||||||||
Range of Exercise Prices | Options Outstanding | Weighted Average Remaining Contractual Life (In Years) | Weighted Average Exercise Price | Number of Shares Vested | Weighted Average Exercise Price | |||||||||||
$7.40 - $8.03 | 777 | 5.32 | $ | 7.74 | 439 | $ | 8.01 | |||||||||
$8.04 - $9.35 | 1,006 | 6.10 | $ | 8.79 | 521 | $ | 8.98 | |||||||||
$9.36 - $9.95 | 751 | 4.94 | $ | 9.69 | 709 | $ | 9.69 | |||||||||
$9.96 - $10.81 | 1,119 | 6.05 | $ | 10.66 | 724 | $ | 10.68 | |||||||||
$10.82 - $13.41 | 883 | 2.00 | $ | 12.41 | 883 | $ | 12.41 | |||||||||
$13.42 - $14.75 | 27 | 3.22 | $ | 14.35 | 27 | $ | 14.35 | |||||||||
$14.76 - $15.23 | 237 | 2.05 | $ | 15.23 | 237 | $ | 15.23 | |||||||||
$7.40 - $15.23 | 4,800 | 4.81 | $ | 10.21 | 3,540 | $ | 10.66 | |||||||||
The total grant date fair value of shares vested was $2.9 million in fiscal 2015, $0.8 million in fiscal 2014 and $3.1 million in fiscal 2013.
61
NOTES TO CONSOLIDATED FINANCIAL STATEMENTS
11. STOCK-BASED COMPENSATION (CONTINUED)
A summary of our non-vested restricted stock units as of September 30, 2015 and changes during the twelve months then ended is presented below (in thousands, except per common share amounts):
Number of Awards | Weighted Average Grant Date Fair Value | |||||
Nonvested at September 30, 2014 | 171 | $ | 9.35 | |||
Granted | 503 | $ | 8.27 | |||
Vested | (91 | ) | $ | 9.66 | ||
Canceled | (40 | ) | $ | 7.77 | ||
Nonvested at September 30, 2015 | 543 | $ | 8.41 | |||
As of September 30, 2015, the total unrecognized compensation cost related to non-vested restricted stock units was $3.2 million and the related weighted average period over which it is expected to be recognized is approximately 1.4 years.
12. COMMON STOCK REPURCHASE
Common Stock Repurchase Program
On October 29, 2013, our Board of Directors authorized a program to repurchase up to $20.0 million of our common stock, primarily to support our employee stock purchase program and to return capital to shareholders. Shares repurchased under this program were permitted either through the open market or privately negotiated transactions from time to time and in amounts that management deemed appropriate. During the first quarter of fiscal 2015, we repurchased 287,787 shares for $2.2 million under this plan which expired on October 31, 2014.
On October 28, 2014, our Board of Directors authorized a program to repurchase up to $15 million of our common stock, primarily to return capital to shareholders and to support our employee stock purchase program. This authorization began on November 1, 2014 and expired on October 31, 2015. There were no shares repurchased under this program.
Restricted Stock Unit Withholdings
We issue restricted stock units as part of our equity incentive plans. When the restricted stock units vest and become taxable to our employees, they may elect to have us deduct shares on their behalf to pay the appropriate taxing authorities. In our consolidated financial statements, we treat these shares withheld for tax purposes on behalf of our employees as common stock repurchases. These withheld shares are not considered common stock repurchases on our authorized common stock repurchase program. During fiscal 2015, we used $0.1 million to repurchase shares to satisfy these withholding obligations. There were no purchases of shares to satisfy withholding obligations during fiscal 2014 and 2013.
13. SHARE RIGHTS PLAN
Under our share rights plan, each right entitles its holder to buy one one-hundredth of a share of a Series A Junior Participating Preferred Stock at an exercise price of $60, subject to adjustment. The rights are not exercisable until a specified distribution date as defined in the Share Rights Agreement. The Rights will expire on June 30, 2018, unless extended or earlier redeemed or exchanged by us as defined in the Share Rights Agreement.
14. EMPLOYEE BENEFIT PLANS
We currently have a savings and profit sharing plan pursuant to Section 401(k) of the Internal Revenue Code (the Code), whereby eligible employees may contribute up to 25% of their pre-tax earnings, not to exceed amounts allowed under the Code.
We provide a match of 100% on the first 3% of each employee’s bi-weekly contribution and a 50% match on the next 2% of each employee’s bi-weekly contribution. In addition, we may make contributions to the plan at the discretion of the Board of Directors. We provided matching contributions of $1.7 million for fiscal 2015, $1.6 million for fiscal 2014 and $1.4 million for fiscal 2013.
62
NOTES TO CONSOLIDATED FINANCIAL STATEMENTS
15. COMMITMENTS
We have entered into various operating lease agreements for office facilities and equipment, the last of which expires in fiscal 2020. The office facility leases generally require us to pay a pro-rata share of the lessor’s operating expenses. Certain operating leases contain escalation clauses and are being amortized on a straight-line basis over the term of the lease.
The following schedule reflects future minimum rental commitments under noncancelable operating leases (in thousands):
Fiscal year | Amount | |||
2016 | $ | 1,993 | ||
2017 | 1,127 | |||
2018 | 648 | |||
2019 | 444 | |||
2020 | 40 | |||
Thereafter | — | |||
Total minimum payments required | $ | 4,252 | ||
The following schedule shows the composition of total rental expense for all operating leases for the years ended September 30 (in thousands):
Fiscal years ended September 30, | |||||||||||
2015 | 2014 | 2013 | |||||||||
Rentals | $ | 2,591 | $ | 2,967 | $ | 3,053 | |||||
Less: sublease rentals | (56 | ) | (24 | ) | (31 | ) | |||||
Total rental expense | $ | 2,535 | $ | 2,943 | $ | 3,022 | |||||
16. CONTINGENCIES
Patent Infringement Lawsuits
On May 29, 2012, U.S. Ethernet Innovations, LLC filed a patent infringement lawsuit against us in federal court in the Eastern District of Texas. The lawsuit included allegations against us and one other company pertaining to the infringement of four patents related to Ethernet technology. On April 22, 2013, we announced the settlement of this patent infringement lawsuit for $1.5 million, which was recorded in general and administrative expense on our Consolidated Statements of Operations during the second quarter of fiscal 2013. The settlement was paid during the third quarter of fiscal 2013. The settlement fully resolved the claims by USEI with no future payment obligations. Net of taxes, the settlement was $1.0 million and therefore reduced earnings per diluted share for the second quarter of fiscal 2013 by approximately $0.04.
In addition to the matters discussed above, in the normal course of business, we are subject to various claims and litigation, which may include, but are not limited to, patent infringement and intellectual property claims. While we are unable to predict the outcome of any potential claims or litigation due to the inherent unpredictability of these matters, we believe that it is possible that we could, in the future, incur judgments or enter into settlements of claims that could have a material adverse effect on our operations in any particular period.
63
NOTES TO CONSOLIDATED FINANCIAL STATEMENTS
17. QUARTERLY FINANCIAL DATA (UNAUDITED)
(in thousands, except per common share data)
Quarter ended | |||||||||||||||
Dec. 31 | March 31 | June 30 | Sept. 30 | ||||||||||||
Fiscal 2015 | |||||||||||||||
Revenue | $ | 48,723 | $ | 53,151 | $ | 54,538 | $ | 56,446 | |||||||
Gross profit | 21,922 | 24,078 | 25,349 | 26,682 | |||||||||||
Net (loss) income (1)(2)(3) | (339 | ) | 1,446 | 2,496 | 2,985 | ||||||||||
Net (loss) income per common share - basic | (0.01 | ) | 0.06 | 0.10 | 0.12 | ||||||||||
Net (loss) income per common share - diluted | (0.01 | ) | 0.06 | 0.10 | 0.12 | ||||||||||
Fiscal 2014 | |||||||||||||||
Revenue | $ | 47,322 | $ | 45,882 | $ | 47,885 | $ | 51,612 | |||||||
Gross profit | 22,908 | 21,780 | 22,149 | 23,647 | |||||||||||
Net income (loss) (1) | 688 | 738 | (101 | ) | 426 | ||||||||||
Net income per common share - basic | 0.03 | 0.03 | — | 0.02 | |||||||||||
Net income per common share - diluted | 0.03 | 0.03 | — | 0.02 | |||||||||||
(1) | During fiscal 2015 and 2014, we recorded net tax benefits of $0.9 million and $1.4 million, respectively. We recorded a benefit of $0.5 million in the first quarter of fiscal 2015 resulting from the reinstatement of the research and development tax credit for calendar year 2014, reversal of income tax reserves due to the expiration of the statute of limitations from various U.S. and foreign tax jurisdictions and reversal of tax reserves due to the resolution of tax audits. In the third quarter of fiscal 2015, we recorded a tax benefit of $0.4 million primarily due to the reversal of reserves for state research and development tax credits and transfer pricing, partially offset by an adjustment of the state rate on net deferred tax assets. We recorded net tax benefits of $0.2 million in the first quarter of fiscal 2014 resulting from the release of income tax reserves due to the expiration of the statute of limitations from various U.S. and foreign tax jurisdictions. During the second quarter of fiscal 2014, we recorded a tax benefit of $1.1 million resulting from re-measurement and reversal of certain income tax reserves as a result of the conclusion of a federal income tax audit for fiscal 2012. In the third quarter of fiscal 2014, we recorded a tax benefit of $0.1 million primarily for a valuation allowance reversal associated with the reassessment of state research and development tax credits. |
(2) | In the second quarter of fiscal 2015, we recorded a business restructuring accrual of $0.5 million ($0.3 million after tax). |
(3) | During fiscal 2015, we recorded a gain of $1.4 million from the settlement of a property and casualty insurance claim related to the replacement of our capital equipment destroyed in the fire at our subcontract manufacturer's location. We recorded $1.0 million ($0.6 million after tax) during the second quarter of fiscal 2015 and $0.4 million ($0.3 million after tax) during the third quarter of fiscal 2015. |
64
NOTES TO CONSOLIDATED FINANCIAL STATEMENTS
18. SUBSEQUENT EVENTS
Acquisition of Bluenica Corporation
On October 5, 2015 we purchased all of the outstanding stock of Bluenica Corporation, a company focused on temperature monitoring of perishable goods in the food industry by using wireless sensors which are installed in grocery and convenience stores, restaurants, and in products during shipment and storage to ensure that quality, freshness and public health requirements are met. We believe that this is a complementary acquisition for us and will provide a source of recurring subscription revenue from cloud services in addition to product revenue from sensors and gateways.
The terms of the acquisition include an upfront cash payment together with earn-out payments. Cash of $2.9 million was paid at time of closing. The earn-out payments are scheduled to be paid in installments over a four-year period based on revenue achievement of the acquired business. The cumulative amount of these earn-out payments will not exceed $11.6 million. An additional payment, not to exceed $3.5 million, may also be due depending on revenue performance. We have determined that the earn-out will be considered as part of the purchase price consideration as there are no continuing employment requirements associated with the earn-out. A preliminary purchase price allocation and estimated acquisition costs are not available due to the timing of the acquisition.
Disposition of Etherios, Inc.
On October 23, 2015, we sold all the outstanding stock of our wholly owned subsidiary, Etherios, Inc. to West Monroe Partners, LLC. We sold our CRM business as part of a strategy to improve our focus on providing highly reliable machine connectivity solutions for business-critical and mission-critical application environments. Beginning in fiscal 2016, we will report Etherios as discontinued operations within our single operating segment.
We sold the Etherios business for $9.0 million, subject to certain purchase price adjustments. Of the total purchase price, $4.0 million, less employee related liabilities of approximately $1.1 million, was paid at closing. Below is a summary of the proceeds (in thousands):
Cash due at closing | $ | 4,000 | ||
Less: Employee related liabilities | (1,134 | ) | ||
Net cash proceeds at closing | 2,866 | |||
Deferred payment due October 23, 2016 | 3,000 | |||
Deferred payment due October 23, 2017 | 2,000 | |||
Total proceeds | $ | 7,866 | ||
Restructuring
On November 19, 2015, we approved a restructuring plan impacting our corporate staff. The plan most principally will close our Dortmund office and relocate certain employees to our Munich office. We expect to incur charges in the range of $0.4 million to $0.6 million in connection with these restructuring activities. The charges relate to severance payments to impacted employees. We expect to complete all payments associated with the charges by the end of fiscal 2016.
65
ITEM 9. CHANGES IN AND DISAGREEMENTS WITH ACCOUNTANTS ON ACCOUNTING AND FINANCIAL DISCLOSURE
None.
ITEM 9A. CONTROLS AND PROCEDURES
This Annual Report on Form 10-K includes the certifications attached as Exhibits 31.1 and 31.2 of our Chief Executive Officer and Chief Financial Officer required by Rule 13a-14 of the Securities Exchange Act of 1934, as amended (the “Exchange Act”). This Item 9A includes information concerning the controls and control evaluations referred to in those certifications.
Evaluation of Disclosure Controls and Procedures
We maintain disclosure controls and procedures (as defined in Rules 13a-15(e) and 15d-15(e) under the Exchange Act that are designed to provide reasonable assurance that information required to be disclosed in our reports filed or submitted under the Exchange Act) is recorded, processed, summarized and reported within the time periods specified in the SEC’s rules and forms and that such information is accumulated and communicated to management of the Company, including our Chief Executive Officer and Chief Financial Officer, to allow timely decisions regarding required disclosure.
Our management with the participation of our Chief Executive Officer and Chief Financial Officer, evaluated the effectiveness of our disclosure controls and procedures. Based on their evaluation as of September 30, 2015, the Chief Executive Officer and Chief Financial Officer concluded that our disclosure controls and procedures were effective and provide reasonable assurance on the reliability of the Company's financial reporting and the preparation of its financial statements for external purposes in accordance with generally accepted accounting principles.
Management’s Report on Internal Control Over Financial Reporting
Management is responsible for establishing and maintaining adequate internal control over financial reporting (as defined in Rules 13a-15(f) and 15d-15(f) under the Exchange Act). Our internal control over financial reporting is a process designed to provide reasonable assurance regarding the reliability of financial reporting and the preparation of our consolidated financial statements for external purposes in accordance with generally accepted accounting principles. Management, with the participation of our Chief Executive Officer and Chief Financial Officer, assessed the effectiveness of our internal control over financial reporting as of September 30, 2015. In making this assessment, management used the framework set forth by the Committee of Sponsoring Organizations of the Treadway Commission (COSO) in Internal Control - Integrated Framework (2013). Based on this assessment, management concluded that the Company's internal control over financial reporting was effective as of September 30, 2015 based on Internal Control – Integrated Framework (2013) issued by the COSO.
The effectiveness of our internal control over financial reporting as of September 30, 2015 has been audited by PricewaterhouseCoopers LLP, an independent registered public accounting firm, as stated in their report which appears in Item 8 of this Annual Report on Form 10-K.
Remediation of Material Weakness in Internal Control Over Financial Reporting
A material weakness is a deficiency, or combination of deficiencies, in internal control over financial reporting, such that there is a reasonable possibility that a material misstatement of our interim or annual financial statements will not be prevented or detected on a timely basis.
As disclosed in the Company's 2014 Annual Report on Form 10-K, management concluded that our internal control over financial reporting was previously not effective based on the material weakness in internal control over financial reporting as we did not maintain effective controls over the preparation, review and analysis of income tax balances. Specifically, we did not maintain effective controls over the interim and annual reconciliation analysis and review of the components of our consolidated income taxes receivable account to ensure all account components existed and were recorded at their appropriate amounts in the consolidated financial statements. Management has remediated this material weakness in fiscal 2015. Specifically, during the year ended September 30, 2015, we engaged a reputable firm to assist in performing responsibilities in our tax department, which provides us with more tax personnel and expertise than we previously had internally. We also added new controls to strengthen the reconciliation and review process over income tax accounts. Certain controls have also been re-designed to operate at a higher level of precision, resulting from enhanced account-level reviews and pre-closing processes to identify business events that may impact income taxes.
66
ITEM 9A. CONTROLS AND PROCEDURES (CONTINUED)
Changes in Internal Control Over Financial Reporting
There were no changes in the Company's internal control over financial reporting during the quarterly period ended September 30, 2015 that has materially affected, or is reasonable likely to affect, our internal control over financial reporting.
ITEM 9B. OTHER INFORMATION
Costs Associated with Exit or Disposal Activities
On November 19, 2015, we approved a restructuring plan impacting our corporate staff. The plan most principally will close our Dortmund office and relocate certain employees to our Munich office. We expect to incur charges in the range of $0.4 million to $0.6 million in connection with these restructuring activities. The charges relate to severance payments to impacted employees. We expect to complete all payments associated with the charges by the end of fiscal 2016. We began notifying impacted employees on November 24, 2015.
67
PART III.
ITEM 10. DIRECTORS, EXECUTIVE OFFICERS AND CORPORATE GOVERNANCE
Incorporated into this item by reference is the information appearing under the headings “Proposal No. 1 - Election of Directors” and “Security Ownership of Principal Stockholders and Management” in our Proxy Statement for our 2016 Annual Meeting of Stockholders we will file with the SEC (the “Proxy Statement”).
Executive Officers of the Registrant
As of the date of filing this Form 10-K, the following individuals were executive officers of the Registrant:
Name | Age | Position | ||
Ronald E. Konezny | 47 | President and Chief Executive Officer | ||
Michael C. Goergen | 48 | Senior Vice President, Chief Financial Officer and Treasurer | ||
Jon A. Nyland | 52 | Vice President Manufacturing Operations | ||
Kevin C. Riley | 54 | Senior Vice President of Global Sales | ||
Tracy L. Roberts | 53 | Vice President of Human Resources and Information Technology | ||
David H. Sampsell | 47 | Vice President of Corporate Development, General Counsel and Corporate Secretary | ||
Joel K. Young | 51 | Senior Vice President of Research and Development and Chief Technical Officer | ||
Jeffrey F. Liebl | 44 | Vice President and Chief Marketing Officer | ||
Mr. Konezny joined our company in December 2014 as President and Chief Executive Officer and as a member of our Board of Directors. Prior to joining us, he had served as Vice President, Global Transportation and Logistics at Trimble Navigation Limited, a global provider of navigation and range-finding equipment and related solutions, since September 2013. From August 2011 to September 2013, he served as General Manager of Trimble’s Global Transportation and Logistics division. From 2007 to September 2013, he served as Chief Executive Officer of PeopleNet, Inc., a provider of telematics solutions for the transportation industry, which was acquired by Trimble in 2011. Mr. Konezny founded PeopleNet in 1996 and served in various other roles, including Chief Technology Officer, Chief Financial Officer and Chief Operating Officer, before serving as its Chief Executive Officer. Mr. Konezny serves on the board of directors of I.D. Systems, Inc.
Michael C. Goergen joined our company as Senior Vice President, Chief Financial Officer and Treasurer in April 2015. He most recently served as Senior Vice President -Finance of the Transport - Logistics division of Trimble Navigation Limited from April, 2013 to March, 2015. From June 2007 to April, 2013, Mr. Goergen served as Chief Financial Officer of PeopleNet Communications. PeopleNet was acquired by Trimble in 2011. Prior to his role as Chief Financial Officer of PeopleNet, he served since 1997 in various financial roles at PeopleNet.
Mr. Nyland joined our company in 1993 as Manager of Manufacturing and Test Engineering. He served in roles of increasing responsibility until he was promoted in April 1999 to his current position of Vice President of Manufacturing Operations. Prior to joining us, from 1985 to 1993, Mr. Nyland held engineering and consulting positions with ITT Corporation, Minnesota Technology, and Turtle Mountain Corporation.
Mr. Riley joined our company in January 2013 as Senior Vice President of Global Sales. Prior to joining us, Mr. Riley served as Senior Vice President - Global Markets for Infor Global Solutions, an enterprise software solutions company, where he led four global business units to profitable growth from January 2010 to November 2011. Prior to his time at Infor, he was Vice President and General Manager at Oracle, an enterprise software company, from September 2008 to January 2010, and President of Global Knowledge Software from September 2002 to September 2008, when Global Knowledge Software was acquired by Oracle. He also served as President and Chief Operating Officer for Learn2 Corporation from 1999 to 2002.
Ms. Roberts has served as our Vice President of Human Resources and Information Technology since March 2005 and has been employed by our company since June 1999. Prior to joining us, Ms. Roberts served as the Director of Human Resources at Novartis Nutrition Corporation where she served the medical nutritional business unit. Prior to her time at Novartis, Ms. Roberts had an extensive career with Cray Research (now Silicon Graphics) including various roles with Human Resources and Marketing.
68
ITEM 10. DIRECTORS, EXECUTIVE OFFICERS AND CORPORATE GOVERNANCE (CONTINUED)
Mr. Sampsell joined our company in April 2011 as Vice President, General Counsel and Corporate Secretary. Prior to joining us, Mr. Sampsell worked as corporate counsel at ADC Telecommunications, Inc., a supplier of network infrastructure products and services, from December 1999 until March 2011. ADC Telecommunications, Inc. was acquired by TE Connectivity in December 2010. His most recent role at ADC was as Associate General Counsel overseeing corporate transactions and securities law compliance. Prior to joining ADC, Mr. Sampsell was an attorney in private practice with Leonard, Street and Deinard, P.A. from 1996 to 1999 and Moore & Van Allen, PLLC from 1993 to 1996.
Mr. Young joined our company in July 2000 as Vice President of Engineering and was named Vice President of Research and Development and Chief Technical Officer in November 2005. In October 2006, Mr. Young was named Senior Vice President of Research and Development and Chief Technical Officer. Prior to joining us, Mr. Young served as a Vice President for Transcrypt International, a provider of encryption products, in various engineering, sales and marketing positions from February 1996 to June 2000. Before that, he held various engineering and management positions at AT&T and AT&T Bell Laboratories from 1986 to 1996.
Mr. Liebl joined our company in October 2013 as Vice President and Chief Marketing Officer. Prior to joining us, Mr. Liebl served as Vice President of Sales and Marketing for TST Media from May 2012 to March 2013. Prior to his time at TST Media, he served as Chief Strategy Officer for eBureau from September 2006 to April 2012, and Vice President of Global Marketing and Product Management for Ubiquity Software from June 2001 to April 2006.
Code of Ethics/Code of Conduct
We have in place a “code of ethics” within the meaning of Rule 406 of Regulation S-K, which is applicable to our senior financial management, including specifically our principal executive officer, principal financial officer and controller. A copy of this financial code of ethics is available on our website (www.digi.com) under the “Company - Investor Relations - Corporate Governance” caption. We intend to satisfy our disclosure obligations regarding any amendment to, or a waiver from, a provision of this code of ethics by posting such information on the same website. We also have a “code of conduct” that applies to all directors, officers and employees, a copy of which is available through our website (www.digi.com) under the “Company - Investor Relations - Corporate Governance” caption.
ITEM 11. EXECUTIVE COMPENSATION
Incorporated into this item by reference is the information appearing under the heading “Compensation of Directors,” “Executive Compensation,” the information regarding compensation committee interlocks and insider participation under the heading “Proposal No. 1 - Election of Directors” on our Proxy Statement.
ITEM 12. SECURITY OWNERSHIP OF CERTAIN BENEFICIAL OWNERS AND MANAGEMENT AND RELATED STOCKHOLDER MATTERS
Incorporated into this item by reference is the information appearing under the headings “Security Ownership of Principal Stockholders and Management” and “Equity Compensation Plan Information” in our Proxy Statement.
ITEM 13. CERTAIN RELATIONSHIPS AND RELATED TRANSACTIONS, AND DIRECTOR INDEPENDENCE
Incorporated into this item by reference is the information regarding director independence under the heading “Proposal No. 1 - Election of Directors” and the information regarding related person transactions under the heading “Related Person Transaction Approval Policy” on our Proxy Statement.
ITEM 14. PRINCIPAL ACCOUNTING FEES AND SERVICES
Incorporated into this item by reference is the information under “Proposal No. 4 - Ratification of Independent Registered Public Accounting Firm” in our Proxy Statement.
69
PART IV.
ITEM 15. EXHIBITS, FINANCIAL STATEMENT SCHEDULES
(a) | Consolidated Financial Statement and Schedules of the Company (filed as part of this Annual Report on Form 10-K) | ||||
1. | Consolidated Statements of Operations for fiscal years ended September 30, 2015, 2014 and 2013 | ||||
Consolidated Statements of Comprehensive Income (Loss) for fiscal years ended September 30, 2015, 2014 and 2013 | |||||
Consolidated Balance Sheets as of September 30, 2015 and 2014 | |||||
Consolidated Statements of Cash Flows for fiscal years ended September 30, 2015, 2014 and 2013 | |||||
Consolidated Statements of Stockholders’ Equity for fiscal years ended September 30, 2015, 2014 and 2013 | |||||
Notes to Consolidated Financial Statements | |||||
2. | Schedule of Valuation and Qualifying Accounts | ||||
3. | Report of Independent Registered Certified Public Accounting Firm | ||||
(b) | Exhibits | ||||
Exhibit Number | Description | ||||
2 | Stock Purchase Agreement with West Monroe Partners, LLC dated as of October 23, 2015* (1) | ||||
3 | (a) | Restated Certificate of Incorporation of the Company, as amended (2) | |||
3 | (b) | Amended and Restated By-Laws of the Company (3) | |||
4 | (a) | Share Rights Agreement, dated as of April 22, 2008, between the Company and Wells Fargo Bank, N.A., as Rights Agent (4) | |||
4 | (b) | Form of Amended and Restated Certificate of Powers, Designations, Preferences and Rights of Series A Junior Participating Preferred Shares (5) | |||
10 | (a) | Digi International Inc. Stock Option Plan as Amended and Restated as of November 27, 2006** (6) | |||
10 | (a)(i) | Form of Notice of Grant of Stock Options and Option Agreement (for grants under Digi International Inc. Stock Option Plan)** (7) | |||
10 | (b) | Digi International Inc. Non-Officer Stock Option Plan, as Amended and Restated as of November 27, 2006 (8) | |||
10 | (c) | Digi International Inc. Employee Stock Purchase Plan as amended and restated as of October 29, 2013** (9) | |||
10 | (d) | Digi International Inc. 2000 Omnibus Stock Plan, as amended and restated as of December 4, 2009** (10) | |||
10 | (d)(i) | Form of Notice of Grant of Stock Options and Option Agreement (for grants under Digi International Inc. 2000 Omnibus Stock Plan before January 26, 2010)** (11) | |||
10 | (d)(ii) | Form of Notice of Grant of Stock Options and Option Agreement (amended form for grants under Digi International Inc. 2000 Omnibus Stock Plan on or after January 26, 2010 provided Addendum 1A applies only to certain grants made on and after November 22, 2011)** (12) | |||
10 | (e) | Digi International Inc. 2013 Omnibus Incentive Plan** (13) | |||
10 | (e)(i) | Form of Notice of Grant of Stock Options and Option Agreement including Addendums to Option Agreement that may apply to certain grants (for grants under Digi International Inc. 2013 Omnibus Incentive Plan)** (14) | |||
10 | (e)(ii) | Form of (Director) Restricted Stock Unit Award Agreement (for awards under Digi International Inc. 2013 Omnibus Incentive Plan)** (15) | |||
70
ITEM 15. EXHIBITS, FINANCIAL STATEMENT SCHEDULES (CONTINUED)
10 | (f) | Digi International Inc. 2014 Omnibus Incentive Plan** (16) | |||
10 | (f)(i) | Form of Notice of Grant of Stock Options and Option Agreement including Addendums to Option Agreement that may apply to certain grants (for grants under Digi International Inc. 2014 Omnibus Incentive Plan)** (17) | |||
10 | (f)(ii) | Form of (Director) Restricted Stock Unit Award Agreement (for awards under Digi International Inc. 2014 Omnibus Incentive Plan)** (18) | |||
10 | (f)(iii) | Form of (Executive) Restricted Stock Unit Award Agreement (for awards under Digi International Inc. 2014 Omnibus Incentive Plan)** (19) | |||
10 | (g) | Form of indemnification agreement with directors and officers of the Company** (20) | |||
10 | (h) | Employment Agreement between the Company and Joseph T. Dunsmore dated September 27, 2006** (21) | |||
10 | (i) | Transition Agreement between the Company and Joseph T. Dunsmore dated April 22, 2014** (22) | |||
10 | (j) | Employment Agreement between the Company and Ronald E. Konezny dated November 26, 2014** (23) | |||
10 | (k) | Agreement between the Company and Joel K. Young dated July 30, 2007** (24) | |||
10 | (l) | Offer Letter Agreement, dated as of October 28, 2010 between the Company and Steven E. Snyder** (25) | |||
10 | (m) | Agreement between the Company and Jon A. Nyland dated September 17, 2013** (26) | |||
10 | (n) | Offer Letter Agreement, dated as of April 8, 2011 between the Company and David H. Sampsell** (27) | |||
10 | (o) | Transition Agreement between the Company and Steven E. Snyder dated March 25, 2015** (28) | |||
10 | (p) | Offer letter between the Company and Michael C. Goergen dated March 6, 2015** (29) | |||
21 | Subsidiaries of the Company | ||||
23 | Consent of Independent Registered Public Accounting Firm | ||||
24 | Powers of Attorney | ||||
31 | (a) | Rule 13a-14(a)/15d-14(a) Certification of Chief Executive Officer | |||
31 | (b) | Rule 13a-14(a)/15d-14(a) Certification of Chief Financial Officer | |||
32 | Section 1350 Certification | ||||
101.INS | XBRL Instance Document | ||||
101.SCH | XBRL Taxonomy Extension Schema Document | ||||
101.CAL | XBRL Taxonomy Calculation Linkbase Document | ||||
101.DEF | XBRL Taxonomy Definition Linkbase Document | ||||
101.LAB | XBRL Taxonomy Label Linkbase Document | ||||
101.PRE | XBRL Taxonomy Presentation Linkbase Document | ||||
____________________________
Unless otherwise indicated, all documents incorporated into this Annual Report on Form 10-K by reference to a document filed with the SEC are located under SEC file number 1-34033.
** | Certain schedules and exhibits have been omitted in accordance with Item 601(b)(2) of Regulation S-K. A copy of any omitted schedule and/or exhibit will be furnished to the Securities and Exchange Commission upon request. |
* | Management compensatory contract or arrangement required to be included as an exhibit to this Annual Report on Form 10-K. |
71
ITEM 15. EXHIBITS, FINANCIAL STATEMENT SCHEDULES (CONTINUED)
(1) | Incorporated by refeerence to Exhibit 2.1 to the Company's Form 8-K filed October 29, 2015. |
(2) | Incorporated by reference to Exhibit 3(a) to the Company’s Form 10‑K for the year ended September 30, 1993 (File no. 0‑17972). |
(3) | Incorporated by reference to Exhibit 3 to the Company's Form 8-K dated January 18, 2011 (File no. 1‑34033). |
(4) | Incorporated by reference to Exhibit 4(a) to the Company’s Registration Statement on Form 8-A filed on April 25, 2008 (File no. 1‑34033). |
(5) | Incorporated by reference to Exhibit 4(b) to the Company’s Registration Statement on Form 8-A filed on April 25, 2008 (File no. 1‑34033). |
(6) | Incorporated by reference to Exhibit 10(a) to the Company’s Form 10‑K for the year ended September 30, 2006 (File no. 0‑17972). |
(7) | Incorporated by reference to Exhibit 10(a) to the Company’s Form 8-K dated September 13, 2004 (File no. 0‑17972). |
(8) | Incorporated by reference to Exhibit 10(g) to the Company’s Form 10‑K for the year ended September 30, 2006 (File no. 0‑17972). |
(9) | Incorporated by reference to Exhibit 99 to the Company’s Registration Statement on Form S-8 filed on March 12, 2014 (File no. 333‑194522). |
(10) | Incorporated by reference to Exhibit 10(a) to the Company’s Form 10‑Q for the quarter ended December 31, 2009 (File no. 1‑34033). |
(11) | Incorporated by reference to Exhibit 10(o) to the Company’s Form 10‑K for the year ended September 30, 2008 (File no. 1‑34033). |
(12) | Incorporated by reference to Exhibit 10 (e)ii to the Company’s Form 10‑Q for the year ended September 30, 2011 (File no. 1‑34033). |
(13) | Incorporated by reference to Exhibit 99 to the Company’s Registration Statement on Form S-8 filed on April 16, 2013 (File no. 333-187949). |
(14) | Incorporated by reference to Exhibit 10(a)(i) to the Company’s Form 10-Q for the quarter ended March 31, 2013 (File no. 1-34033). |
(15) | Incorporated by reference to Exhibit 10(a)(ii) to the Company’s Form 10-Q for the quarter ended March 31, 2013 (File no. 1-34033). |
(16) | Incorporated by reference to Exhibit 99 to the Company’s Registration Statement on Form S-8 filed on March 12, 2014 (File no. 333‑194518). |
(17) | Incorporated by reference to Exhibit 10(b)(i) to the Company’s Form 10-Q for the quarter ended March 31, 2014 (File no. 1-34033). |
(18) | Incorporated by reference to Exhibit 10(b)(ii) to the Company’s Form 10-Q for the quarter ended March 31, 2014 (File no. 1-34033). |
(19) | Incorporated by reference to Exhibit 10(a) to the Company’s Form 10-Q for the quarter ended June 30, 2014 (File no. 1-34033). |
(20) | Incorporated by reference to Exhibit 10 to the Company’s Form 10‑Q for the quarter ended June 30, 2010 (File no. 1‑34033). |
(21) | Incorporated by reference to Exhibit 10(d) to the Company’s Form 10‑K for the year ended September 30, 2006 (File no. 0‑17972). |
(22) | Incorporated by reference to Exhibit 10.1 to the Company's Form 8-K dated April 23, 2014 (File no. 1‑34033). |
(23) | Incorporated by reference to Exhibit 10.1 to the Company's Form 8-K dated December 3, 2014 (File no. 1-34033). |
(24) | Incorporated by reference to Exhibit 10(b) to the Company’s Form 10‑Q for the quarter ended June 30, 2007 (File no. 0‑17972). |
(25) | Incorporated by reference to Exhibit 10 to the Company’s Form 10‑Q for the quarter ended December 31, 2010 (File no. 1‑34033). |
(26) | Incorporated by reference to Exhibit 10(l) to the Company's Form 10-K for the year ended September 30, 2013 (File no. 1‑34033). |
(27) | Incorporated by reference to Exhibit 10(m) to the Company's Form 10-K for the year ended September 30, 2013 (File no. 1‑34033). |
(28) | Incorporated by reference to Exhibit 10.1 to the Company's Form 8-K filed March 26, 2015. |
(29) | Incorporated by reference to Exhibit 10.2 to the Company's Form 8-K filed March 26, 2015. |
72
SIGNATURES
Pursuant to the requirements of Section 13 or 15(d) of the Securities Exchange Act of 1934, the Registrant has duly caused this report to be signed on its behalf by the undersigned, thereunto duly authorized, on November 30, 2015.
DIGI INTERNATIONAL INC. | |
By: /s/ Ronald E. Konezny Ronald E. Konezny President, Chief Executive Officer and Director | |
Pursuant to the requirements of the Securities Exchange Act of 1934, this report has been signed below by the following persons on behalf of the Registrant and in the capacities indicated on November 30, 2015.
By: /s/ Ronald E. Konezny Ronald E. Konezny President, Chief Executive Officer and Director (Principal Executive Officer) | |
By: /s/ Michael C. Goergen Michael C. Goergen Senior Vice President, Chief Financial Officer and Treasurer (Principal Financial Officer and Principal Accounting Officer) | |
By:* Guy C. Jackson Director | |
By:* Satbir Khanuja Director | |
By:* Ahmed Nawaz Director | |
By:* William N. Priesmeyer Director | |
By:* Girish Rishi Director | |
By:* Spiro Lazarakis Director | |
* | Ronald E. Konezny, by signing his name hereto, does hereby sign this document on behalf of each of the above named directors of the Registrant pursuant to Powers of Attorney duly executed by such persons. |
By: /s/ Ronald E. Konezny Ronald E. Konezny Attorney-in-fact | |
73
SCHEDULE II - VALUATION AND QUALIFYING ACCOUNTS
DIGI INTERNATIONAL INC.
(in thousands)
Description | Balance at beginning of period | Increase (Decrease) to costs and expenses | Deductions | Balance at end of period | |||||||||||||
Valuation allowance - deferred tax assets | |||||||||||||||||
September 30, 2015 | $ | 572 | $ | 316 | $ | 26 | $ | 862 | |||||||||
September 30, 2014 | $ | 807 | $ | 174 | $ | 409 | $ | 572 | |||||||||
September 30, 2013 | $ | 887 | $ | 170 | $ | 250 | $ | 807 | |||||||||
Valuation account - doubtful accounts | |||||||||||||||||
September 30, 2015 | $ | 367 | $ | 202 | $ | 86 | (1) | $ | 483 | ||||||||
September 30, 2014 | $ | 313 | $ | 209 | $ | 155 | (1) | $ | 367 | ||||||||
September 30, 2013 | $ | 295 | $ | 309 | $ | 291 | (1) | $ | 313 | ||||||||
Reserve for future returns and pricing adjustments | |||||||||||||||||
September 30, 2015 | $ | 1,662 | $ | 7,002 | $ | 6,847 | $ | 1,817 | |||||||||
September 30, 2014 | $ | 1,770 | $ | 6,526 | $ | 6,634 | $ | 1,662 | |||||||||
September 30, 2013 | $ | 1,362 | $ | 6,973 | $ | 6,565 | $ | 1,770 | |||||||||
(1) | Uncollectible accounts charged against allowance, net of recoveries |
74
Exhibit Number | Description | Method of Filing | |||
2 | Stock Purchase Agreement with West Monroe Partners, LLC dated as of October 23, 2015 | Incorporation by Reference | |||
3 | (a) | Restated Certificate of Incorporation of the Company, as amended | Incorporation by Reference | ||
3 | (b) | Amended and Restated By-Laws of the Company | Incorporation by Reference | ||
4 | (a) | Share Rights Agreement, dated as of April 22, 2008, between the Company and Wells Fargo Bank, N.A., as Rights Agent | Incorporation by Reference | ||
4 | (b) | Form of Amended and Restated Certificate of Powers, Designations, Preferences and Rights of Series A Junior Participating Preferred Shares | Incorporation by Reference | ||
10 | (a) | Digi International Inc. Stock Option Plan as Amended and Restated as of November 27, 2006 | Incorporation by Reference | ||
10 | (a)(i) | Form of Notice of Grant of Stock Options and Option Agreement | Incorporation by Reference | ||
10 | (b) | Digi International Inc. Non-Officer Stock Option Plan, as Amended and Restated as of November 27, 2006 | Incorporation by Reference | ||
10 | (c) | Digi International Inc. Employee Stock Purchase Plan as amended and restated as of October 29, 2013 | Incorporation by Reference | ||
10 | (d) | Digi International Inc. 2000 Omnibus Stock Plan, as amended and restated as of December 4, 2009 | Incorporation by Reference | ||
10 | (d)(i) | Form of Notice of Grant of Stock Options and Option Agreement | Incorporation by Reference | ||
10 | (d)(ii) | Form of Notice of Grant of Stock Options and Option Agreement | Incorporation by Reference | ||
10 | (e) | Digi International Inc. 2013 Omnibus Incentive Plan | Incorporation by Reference | ||
10 | (e)(i) | Form of Notice of Grant of Stock Options and Option Agreement including Addendums to Option Agreement that may apply to certain grants | Incorporation by Reference | ||
10 | (e)(ii) | Form of (Director) Restricted Stock Unit Award Agreement | Incorporation by Reference | ||
10 | (f) | Digi International Inc. 2014 Omnibus Incentive Plan | Incorporation by Reference | ||
10 | (f)(i) | Form of Notice of Grant of Stock Options and Option Agreement including Addendums to Option Agreement that may apply to certain grants (for grants under Digi International Inc. 2014 Omnibus Incentive Plan) | Incorporation by Reference | ||
10 | (f)(ii) | Form of (Director) Restricted Stock Unit Award Agreement (for awards under Digi International Inc. 2014 Omnibus Incentive Plan) | Incorporation by Reference | ||
10 | (f)(iii) | Form of (Executive) Restricted Stock Unit Award Agreement (for awards under Digi International Inc. 2014 Omnibus Incentive Plan) | Incorporation by Reference | ||
10 | (g) | Form of indemnification agreement with directors and officers of the Company | Incorporation by Reference | ||
10 | (h) | Employment Agreement between the Company and Joseph T. Dunsmore dated September 27, 2006 | Incorporation by Reference | ||
10 | (i) | Transition Agreement between the Company and Joseph T. Dunsmore dated April 22, 2014 | Incorporation by Reference | ||
10 | (j) | Employment Agreement between the Company and Ronald E. Konezny dated November 26, 2014 | Incorporation by Reference | ||
75
Exhibit Number | Description | Method of Filing | |||
10 | (k) | Agreement between the Company and Joel K. Young dated July 30, 2007 | Incorporation by Reference | ||
10 | (l) | Offer Letter Agreement, dated as of October 28, 2010 between the Company and Steven E. Snyder | Incorporation by Reference | ||
10 | (m) | Agreement between the Company and Jon A. Nyland dated September 17, 2013 | Incorporation by Reference | ||
10 | (n) | Offer Letter Agreement, dated as of April 8, 2011 between the Company and David H. Sampsell | Incorporation by Reference | ||
10 | (o) | Transition Agreement between the Company and Steven E. Snyder dated March 25 ,2015 | Incorporation by Reference | ||
10 | (p) | Offer Letter between the Company and Michael C. Goergen dated March 6, 2015 | Incorporation by Reference | ||
21 | Subsidiaries of the Company | Electronically | |||
23 | Consent of Independent Registered Public Accounting Firm | Electronically | |||
24 | Powers of Attorney | Electronically | |||
31 | (a) | Rule 13a-14(a)/15d-14(a) Certification of Chief Executive Officer | Electronically | ||
31 | (b) | Rule 13a-14(a)/15d-14(a) Certification of Chief Financial Officer | Electronically | ||
32 | Section 1350 Certification | Electronically | |||
101.INS | XBRL Instance Document | Electronically | |||
101.SCH | XBRL Taxonomy Extension Schema Document | Electronically | |||
101.CAL | XBRL Taxonomy Calculation Linkbase Document | Electronically | |||
101.DEF | XBRL Taxonomy Definition Linkbase Document | Electronically | |||
101.LAB | XBRL Taxonomy Label Linkbase Document | Electronically | |||
101.PRE | XBRL Taxonomy Presentation Linkbase Document | Electronically | |||
76