Attached files
| file | filename |
|---|---|
| EX-31.2 - EXHIBIT 31.2 - Forbes Energy Services Ltd. | a2015q3fes-ex312.htm |
| EX-31.1 - EXHIBIT 31.1 - Forbes Energy Services Ltd. | a2015q3fes-ex311.htm |
| EX-32.2 - EXHIBIT 32.2 - Forbes Energy Services Ltd. | a2015q3fes-ex322.htm |
| EX-32.1 - EXHIBIT 32.1 - Forbes Energy Services Ltd. | a2015q3fes-ex321.htm |
UNITED STATES
SECURITIES AND EXCHANGE COMMISSION
WASHINGTON, D.C. 20549
__________________________________________________________
Form 10-Q
__________________________________________________________
(Mark One)
ý | QUARTERLY REPORT PURSUANT TO SECTION 13 OR 15(d) OF THE SECURITIES EXCHANGE ACT OF 1934 |
For the quarterly period ended September 30, 2015
OR
¨ | TRANSITION REPORT PURSUANT TO SECTION 13 OR 15(d) OF THE SECURITIES EXCHANGE ACT OF 1934 |
Commission file number 001-35281
__________________________________________________________
Forbes Energy Services Ltd.
(Exact name of registrant as specified in its charter)
__________________________________________________________
Texas | 98-0581100 | |
(State or other jurisdiction of incorporation or organization) | (I.R.S. Employer Identification No.) | |
3000 South Business Highway 281 Alice, Texas | 78332 | |
(Address of principal executive offices) | (Zip Code) | |
Registrant’s telephone number, including area code:
(361) 664-0549
__________________________________________________________
Indicate by check mark whether the registrant (1) has filed all reports required to be filed by Section 13 or 15(d) of the Securities Exchange Act of 1934 during the preceding 12 months (or for such shorter period that the registrant was required to file such reports), and (2) has been subject to such filing requirements for the past 90 days. x Yes ¨ No
Indicate by check mark whether the registrant has submitted electronically and posted on its corporate Web site, if any, every Interactive Data File required to be submitted and posted pursuant to Rule 405 of Regulation S-T (§232.405 of this chapter) during the preceding 12 months (or for such shorter period that the registrant was required to submit and post such files). x Yes ¨ No
Indicate by check mark whether the registrant is a large accelerated filer, an accelerated filer, a non-accelerated filer, or a smaller reporting company. See definitions of “large accelerated filer,” “accelerated filer” and “smaller reporting company” in Rule 12b-2 of the Exchange Act.
Large accelerated filer | ¨ | Accelerated filer | ¨ |
Non-accelerated filer | x (Do not check if a smaller reporting company) | Smaller reporting company | ¨ |
Indicate by check mark whether the registrant is a shell company (as defined in Exchange Act Rule 12b-2). ¨ Yes x No
Shares outstanding of each of the registrant’s classes of common stock as of November 9, 2015:
Class | Outstanding as of November 9, 2015 | ||
Common Stock, $.04 par value | 22,210,355 | ||
FORBES ENERGY SERVICES LTD.
TABLE OF CONTENTS
Page | ||
Item 1. | ||
Item 2. | ||
Item 3. | ||
Item 4. | ||
Item 1. | ||
Item 1A. | ||
Item 2. | ||
Item 3. | ||
Item 4. | ||
Item 5. | Other Information | |
Item 6. | Exhibits | |
Signature | ||
2
FORWARD-LOOKING STATEMENTS
This Quarterly Report on Form 10-Q and any oral statements made in connection with it include certain forward-looking statements within the meaning of the federal securities laws. You can generally identify forward-looking statements by the appearance in such a statement of words like “anticipate,” “believe,” “continue,” “could,” “estimate,” “expect,” “intend,” “may,” “plan,” “potential,” “predict,” “project” or “should” or other comparable words or the negative of these words. When you consider our forward-looking statements, you should keep in mind the risk factors we describe and other cautionary statements we make in this Quarterly Report on Form 10-Q. Our forward-looking statements are only predictions based on expectations that we believe are reasonable. Our actual results could differ materially from those anticipated in, or implied by, these forward-looking statements as a result of known risks and uncertainties set forth below and elsewhere in this Quarterly Report on Form 10-Q. These factors include or relate to the following:
• | oil and natural gas commodity prices; |
• | market response to global demands to curtail use of oil and natural gas; |
• | capital budgets and spending by the oil and natural gas industry; |
• | supply and demand for oilfield services and industry activity levels; |
• | our ability to maintain stable pricing; |
• | our level of indebtedness; |
• | possible impairment of our long-lived assets; |
• | potential for excess capacity; |
• | competition; |
• | substantial capital requirements; |
• | significant operating and financial restrictions under our indenture and revolving credit facility; |
• | technological obsolescence of operating equipment; |
• | dependence on certain key employees; |
• | concentration of customers; |
• | substantial additional costs of compliance with reporting obligations, the Sarbanes-Oxley Act and indenture covenants; |
• | seasonality of oilfield services activity; |
• | collection of accounts receivable; |
• | environmental and other governmental regulation, including potential climate change legislation; |
• | the potential disruption of business activities caused by the physical effects, if any, of climate change; |
• | risks inherent in our operations; |
• | ability to fully integrate future acquisitions; |
• | variation from projected operating and financial data; |
• | variation from budgeted and projected capital expenditures; |
• | volatility of global financial markets; and |
• | the other factors discussed under “Risk Factors” beginning on page 10 of the Annual Report on Form 10-K for the year ended December 31, 2014. |
We undertake no obligation to update or revise any forward-looking statements, whether as a result of new information, future events or otherwise. To the extent these risks, uncertainties and assumptions give rise to events that vary from our expectations, the forward-looking events discussed in this Quarterly Report on Form 10-Q may not occur. All forward-looking statements attributable to us are qualified in their entirety by this cautionary statement.
3
PART I—FINANCIAL INFORMATION
Item 1. Unaudited Condensed Consolidated Financial Statements
Forbes Energy Services Ltd.
Condensed Consolidated Balance Sheets (unaudited)
(in thousands, except per share amounts)
September 30, 2015 | December 31, 2014 | ||||||
Assets | |||||||
Current assets | |||||||
Cash and cash equivalents | $ | 85,482 | $ | 34,918 | |||
Accounts receivable - trade, net | 36,075 | 83,644 | |||||
Accounts receivable - related parties | 40 | 342 | |||||
Accounts receivable - other | 771 | 455 | |||||
Prepaid expenses and other | 4,832 | 10,537 | |||||
Total current assets | 127,200 | 129,896 | |||||
Property and equipment, net | 289,338 | 322,663 | |||||
Intangible assets, net | 20,147 | 22,292 | |||||
Deferred financing costs, net of accumulated amortization of $6.6 million and $5.5 million as of September 30, 2015 and December 31, 2014, respectively | 3,959 | 5,053 | |||||
Restricted cash | 452 | 1,381 | |||||
Other assets | 1,531 | 2,328 | |||||
Total assets | $ | 442,627 | $ | 483,613 | |||
Liabilities and Shareholders’ Equity | |||||||
Current liabilities | |||||||
Current portions of long-term debt | $ | 19,225 | $ | 11,204 | |||
Accounts payable - trade | 11,068 | 19,119 | |||||
Accounts payable - related parties | 106 | 186 | |||||
Accrued dividends | 61 | 61 | |||||
Accrued interest payable | 7,596 | 1,364 | |||||
Accrued expenses | 12,791 | 18,848 | |||||
Total current liabilities | 50,847 | 50,782 | |||||
Long-term debt, net of current portion | 284,023 | 286,687 | |||||
Deferred tax liability | 5,918 | 17,653 | |||||
Total liabilities | 340,788 | 355,122 | |||||
Commitments and contingencies (Note 10) | — | — | |||||
Temporary equity | |||||||
Series B senior convertible preferred shares | 14,632 | 14,602 | |||||
Shareholders’ equity | |||||||
Common stock, $.04 par value, 112,500 shares authorized, 22,157 and 21,845 shares issued and outstanding at September 30, 2015 and December 31, 2014, respectively | 886 | 874 | |||||
Additional paid-in capital | 194,702 | 194,704 | |||||
Accumulated deficit | (108,381 | ) | (81,689 | ) | |||
Total shareholders’ equity | 87,207 | 113,889 | |||||
Total liabilities and shareholders’ equity | $ | 442,627 | $ | 483,613 | |||
The accompanying notes are an integral part of these condensed consolidated financial statements.
4
Forbes Energy Services Ltd.
Condensed Consolidated Statements of Operations (unaudited)
(in thousands, except per share amounts)
Three months ended September 30, | Nine months ended September 30, | ||||||||||||||
2015 | 2014 | 2015 | 2014 | ||||||||||||
Revenues | |||||||||||||||
Well servicing | $ | 35,390 | $ | 73,940 | $ | 125,606 | $ | 213,389 | |||||||
Fluid logistics | 20,167 | 40,526 | 77,094 | 124,163 | |||||||||||
Total revenues | 55,557 | 114,466 | 202,700 | 337,552 | |||||||||||
Expenses | |||||||||||||||
Well servicing | 28,186 | 53,795 | 93,796 | 160,244 | |||||||||||
Fluid logistics | 17,477 | 33,016 | 59,513 | 94,959 | |||||||||||
General and administrative | 7,390 | 8,943 | 25,467 | 26,514 | |||||||||||
Depreciation and amortization | 13,722 | 13,810 | 41,644 | 40,616 | |||||||||||
Total expenses | 66,775 | 109,564 | 220,420 | 322,333 | |||||||||||
Operating income (loss) | (11,218 | ) | 4,902 | (17,720 | ) | 15,219 | |||||||||
Other income (expense) | |||||||||||||||
Interest income | 18 | 2 | 163 | 8 | |||||||||||
Interest expense | (7,056 | ) | (7,016 | ) | (20,837 | ) | (21,216 | ) | |||||||
Pre-tax loss | (18,256 | ) | (2,112 | ) | (38,394 | ) | (5,989 | ) | |||||||
Income tax benefit | (4,746 | ) | (569 | ) | (11,702 | ) | (1,659 | ) | |||||||
Net loss | (13,510 | ) | (1,543 | ) | (26,692 | ) | (4,330 | ) | |||||||
Preferred stock dividends | (194 | ) | (194 | ) | (582 | ) | (582 | ) | |||||||
Net loss attributable to common shareholders | $ | (13,704 | ) | $ | (1,737 | ) | $ | (27,274 | ) | $ | (4,912 | ) | |||
Loss per share of common stock | |||||||||||||||
Basic and diluted loss per share | $ | (0.62 | ) | $ | (0.08 | ) | $ | (1.24 | ) | $ | (0.23 | ) | |||
Weighted average number of shares outstanding | |||||||||||||||
Basic and diluted | 22,156 | 21,799 | 22,024 | 21,718 | |||||||||||
The accompanying notes are an integral part of these condensed consolidated financial statements.
5
Forbes Energy Services Ltd.
Condensed Consolidated Statements of Changes in Shareholders’ Equity (unaudited)
(in thousands)
Temporary Equity | |||||||||||||||||||||||||
Preferred Shares | Common Stock | Additional Paid-In Capital | Accumulated Deficit | Total Shareholders’ Equity | |||||||||||||||||||||
Shares | Amount | Shares | Amount | ||||||||||||||||||||||
Balance: December 31, 2014 | 588 | $ | 14,602 | 21,845 | $ | 874 | $ | 194,704 | $ | (81,689 | ) | $ | 113,889 | ||||||||||||
Net loss | — | — | — | — | — | (26,692 | ) | (26,692 | ) | ||||||||||||||||
Common shares issued under stock plan: | |||||||||||||||||||||||||
Share - based compensation | — | — | 312 | 12 | 580 | — | 592 | ||||||||||||||||||
Preferred shares dividends and accretion | — | 30 | — | — | (582 | ) | — | (582 | ) | ||||||||||||||||
Balance: September 30, 2015 | 588 | $ | 14,632 | 22,157 | $ | 886 | $ | 194,702 | $ | (108,381 | ) | $ | 87,207 | ||||||||||||
The accompanying notes are an integral part of these condensed consolidated financial statements.
6
Forbes Energy Services Ltd.
Condensed Consolidated Statements of Cash Flows (unaudited)
(in thousands)
Nine months ended September 30, | |||||||
2015 | 2014 | ||||||
Cash flows from operating activities: | |||||||
Net loss | $ | (26,692 | ) | $ | (4,330 | ) | |
Adjustments to reconcile net loss to net cash provided by operating activities: | |||||||
Depreciation and amortization | 41,644 | 40,616 | |||||
Share-based compensation | 778 | 2,812 | |||||
Deferred tax benefit | (11,735 | ) | (2,215 | ) | |||
Gain on disposal of assets, net | (777 | ) | (747 | ) | |||
Bad debt expense | 682 | 457 | |||||
Amortization of deferred financing cost | 1,094 | 1,442 | |||||
Changes in operating assets and liabilities: | |||||||
Accounts receivable | 46,572 | (8,828 | ) | ||||
Accounts receivable - related party | 302 | (158 | ) | ||||
Prepaid expenses and other assets | 781 | 2,659 | |||||
Accounts payable - trade | (6,574 | ) | (9,065 | ) | |||
Accounts payable - related party | (80 | ) | (323 | ) | |||
Accrued expenses | 154 | 6,255 | |||||
Net cash provided by operating activities | 46,149 | 28,575 | |||||
Cash flows from investing activities: | |||||||
Proceeds from sale of property and equipment | 1,562 | 3,904 | |||||
Purchases of property and equipment | (9,168 | ) | (18,901 | ) | |||
Insurance proceeds | 1,262 | — | |||||
Change in restricted cash | 929 | (1 | ) | ||||
Net cash used in investing activities | (5,415 | ) | (14,998 | ) | |||
Cash flows from financing activities: | |||||||
Payments of debt | (4,451 | ) | (3,756 | ) | |||
Payment of tax withholding obligations related to restricted stock | (168 | ) | (467 | ) | |||
Proceeds from revolving credit facility | 15,000 | — | |||||
Dividends paid on Series B senior convertible preferred shares | (551 | ) | (551 | ) | |||
Net cash provided by (used in) financing activities | 9,830 | (4,774 | ) | ||||
Net increase in cash and cash equivalents | 50,564 | 8,803 | |||||
Cash and cash equivalents: | |||||||
Beginning of period | 34,918 | 26,409 | |||||
End of period | $ | 85,482 | $ | 35,212 | |||
The accompanying notes are an integral part of these condensed consolidated financial statements.
7
Forbes Energy Services Ltd.
Notes to Condensed Consolidated Financial Statements
1. Organization and Nature of Operations
Nature of Business
Forbes Energy Services Ltd., or FES Ltd, is an independent oilfield services contractor that provides a wide range of well site services to oil and natural gas drilling and producing companies to help develop and enhance the production of oil and natural gas. These services include fluid hauling, fluid disposal, well maintenance, completion services, workovers and re-completions, plugging and abandonment, and tubing testing. Our operations are concentrated in the major onshore oil and natural gas producing regions of Texas, with an additional location in Pennsylvania. We believe that our broad range of services, which extends from initial drilling, through production, to eventual abandonment, is fundamental to establishing and maintaining the flow of oil and natural gas throughout the life cycle of our customers' wells. Our headquarters and executive offices are located at 3000 South Business Highway 281, Alice, Texas 78332. We can be reached by phone at (361) 664-0549.
As used in these Consolidated Financial Statements, the “Company,” the “Forbes Group,” “we,” and “our” mean FES Ltd and its direct and indirect subsidiaries, except as otherwise indicated.
2. Risk and Uncertainties
As an independent oilfield services contractor that provides a broad range of drilling-related and production-related services to oil and natural gas companies, primarily onshore in Texas, our revenue, profitability, cash flows and future rate of growth are substantially dependent on our ability to (1) maintain adequate equipment utilization, (2) maintain adequate pricing for the services we provide, and (3) maintain a trained work force. Failure to do so could adversely affect our financial position, results of operations, and cash flows.
Because our revenues are generated primarily from customers who are subject to the same factors generally impacting the oil and natural gas industry, our operations are also susceptible to market volatility resulting from economic, cyclical, weather related, or other factors related to such industry. Changes in the level of operating and capital spending in the industry, decreases in oil and natural gas prices, or industry perception about future oil and natural gas prices could materially decrease the demand for our services, adversely affecting our financial position, results of operations and cash flows.
3. Basis of Presentation
Interim Financial Information
The unaudited condensed consolidated financial statements of the Forbes Group are prepared in conformity with accounting principles generally accepted in the United States of America, or GAAP, for interim financial reporting. Certain information and footnote disclosures normally included in annual financial statements prepared in accordance with GAAP have been condensed or omitted pursuant to the rules and regulations of the Securities and Exchange Commission. Therefore, these condensed consolidated financial statements should be read along with the annual audited consolidated financial statements and notes thereto included in Forbes Group’s Annual Report on Form 10-K for the year ended December 31, 2014. In management’s opinion, all adjustments necessary for a fair statement are reflected in the interim periods presented. Interim results for the three and nine months ended September 30, 2015 may not be indicative of results that will be realized for the full year ending December 31, 2015. All significant intercompany accounts and transactions have been eliminated in consolidation.
Use of Estimates
The preparation of condensed consolidated financial statements in conformity with GAAP requires management to make estimates and assumptions that affect the reported amounts of assets and liabilities and disclosure of contingent assets and liabilities at the date of the consolidated balance sheets and the reported amounts of revenues and expenses during the reporting period. Actual results could materially differ from those estimates. Management believes that these estimates and assumptions provide a reasonable basis for the fair presentation of the condensed consolidated financial statements.
8
Recent Accounting Pronouncements
In April 2015, the Financial Accounting Standards Board, or the FASB, issued ASU 2015-03, “Simplifying the Presentation of Debt Issuance Costs.” ASU 2015-03 requires that debt issuance costs related to a recognized debt liability be presented in the balance sheet as a direct deduction from the carrying amount of that debt liability, consistent with debt discounts. ASU 2015-03 is effective for annual periods beginning after December 15, 2015, and interim periods within those annual periods. The Company is in the process of determining if this pronouncement will have a material impact on its consolidated financial statements.
In August 2015, the FASB issued ASU 2015-14, "Revenue from Contracts with Customers-Deferral of the Effective Date," which defers by one year the effective date of ASU 2014-09, "Revenue from Contracts with Customers." ASU 2015-14 is effective for annual reporting periods beginning after December 15, 2017, including interim periods within that reporting period. The Company is in the process of determining if this pronouncement will have a material impact on its consolidated financial statements.
In August 2015, the FASB issued ASU 2015-15, "Presentation and Subsequent Measurement of Debt Issuance costs Associated with Line-of-Credit Arrangements" which clarifies the treatment of debt issuance costs from line-of-credit arrangements after adoption of ASU 2015-03. ASU 2015-15 clarifies that the Securities and Exchange Commission staff would not object to an entity deferring and presenting debt issuance costs as an asset and subsequently amortizing the deferred debt issuance costs ratably over the term of the line-of-credit arrangement, regardless of whether there are any outstanding borrowings on the line-of-credit arrangement. ASU 2015-15 became effective upon issuance and the Company does not anticipate that this pronouncement will have a material impact on its consolidated financial statements.
4. Intangible Assets
Our major classes of intangible assets consist of our customer relationships, trade names, safety training program and dispatch software. The Company expenses costs associated with extensions or renewals of intangible assets. There were no such extensions or renewals in the three or nine months ended September 30, 2015 and 2014. Amortization expense is calculated using the straight-line method over the period indicated. Amortization expense for each of the three months ended September 30, 2015 and 2014 was $0.7 million and for each of the nine months ended September 30, 2015 and 2014 was $2.1 million. Estimated amortization expense for the years 2015 through 2017 is $2.9 million per year and in 2018 is $2.7 million. The weighted average amortization period remaining for intangible assets is 7.0 years.
The following sets forth the identified intangible assets by major asset class:
As of September 30, 2015 | As of December 31, 2014 | ||||||||||||||||||||||||
Useful Life (years) | Gross Carrying Value | Accumulated Amortization | Net Book Value | Gross Carrying Value | Accumulated Amortization | Net Book Value | |||||||||||||||||||
(in thousands) | |||||||||||||||||||||||||
Customer relationships | 15 | $ | 31,896 | $ | (16,480 | ) | $ | 15,416 | $ | 31,896 | $ | (14,885 | ) | $ | 17,011 | ||||||||||
Trade names | 15 | 8,050 | (4,159 | ) | 3,891 | 8,050 | (3,756 | ) | 4,294 | ||||||||||||||||
Safety training program | 15 | 1,182 | (611 | ) | 571 | 1,182 | (552 | ) | 630 | ||||||||||||||||
Dispatch software | 10 | 1,135 | (879 | ) | 256 | 1,135 | (795 | ) | 340 | ||||||||||||||||
Other | 10 | 58 | (45 | ) | 13 | 58 | (41 | ) | 17 | ||||||||||||||||
$ | 42,321 | $ | (22,174 | ) | $ | 20,147 | $ | 42,321 | $ | (20,029 | ) | $ | 22,292 | ||||||||||||
5. Share-Based Compensation
Incentive Compensation Plans
From time to time, the Company grants stock options, restricted stock units, or other awards to its employees, including executive officers, and directors. After taking into account the restricted stock units granted through September 30, 2015 (as discussed in the Restricted Stock Units paragraph below), there were 666,956 shares available for future grants under the 2012 Incentive Compensation Plan. There have been no stock option awards issued under the 2012 Plan.
Stock Options
9
The following table presents a summary of the Company’s stock option activity for the nine months ended September 30, 2015:
Shares | Weighted- Average Exercise Price | Weighted-Average Remaining Contractual Term | Aggregate Intrinsic Value | |||||||||
Options outstanding at December 31, 2014 | 1,148,625 | $ | 7.94 | 5.44 years | $ | — | ||||||
Granted | — | |||||||||||
Exercised | — | |||||||||||
Forfeited/cancelled | (534,500 | ) | 9.26 | $ | — | |||||||
Options outstanding at September 30, 2015 | 614,125 | $ | 6.80 | 5.12 years | $ | — | ||||||
Vested and expected to vest at September 30, 2015 | 614,125 | $ | 6.80 | 5.12 years | $ | — | ||||||
Exercisable at September 30, 2015 | 614,125 | $ | 6.80 | 5.12 years | $ | — | ||||||
During the three and nine months ended September 30, 2015, the Company recorded no expenses for share-based compensation expense related to stock options as all outstanding options are fully vested. During the three and nine months ended September 30, 2014, the Company recorded total share-based compensation expense related to stock options of $0.3 million and $1.2 million, respectively. There was no share-based compensation cost capitalized for the three or nine months ended September 30, 2015 or 2014. As of September 30, 2015, there was no unrecognized share-based compensation cost for stock options. During the nine months ended September 30, 2015, the Company's executive officers, and members of its board of directors canceled, and Janet Forbes forfeited, an aggregate of 534,500 stock options, which were issued in August 2011 with exercise prices of $9.32 or $9.16. No consideration was paid to the Company's executive officers or members of its board of directors with respect to the cancellation of their stock options.
Restricted Stock Units
The following table presents a summary of restricted stock unit grant activity for the nine month period ended September 30, 2015:
Number of Units | Grant Date Average Fair Value Per Unit | |||||||
Outstanding at December 31, 2014 | 637,495 | $ | 3.47 | |||||
Granted | 1,318,712 | 1.19 | ||||||
Vested | (461,379 | ) | 2.50 | |||||
Forfeited | — | |||||||
Nonvested at September 30, 2015 | 1,494,828 | $ | 1.76 | |||||
In the nine months ended September 30, 2015 and 2014, participants utilized a net withholding exercise method, in which restricted stock units were surrendered to cover payroll withholding tax. After giving effect to tax withholdings, the cumulative net shares issued to the participants were 311,859 and 228,600 out of 461,379 and 347,509 vested shares of restricted stock units for the nine months ended September 30, 2015 and 2014, respectively. The total pretax cash outflow, as included in withholding tax payments in our condensed consolidated statements of cash flows, for this net withholding exercise for the nine months ended September 30, 2015 and 2014 was $0.2 million and $0.5 million, respectively.
Share-based compensation expense for the restricted stock units granted for the three months ended September 30, 2015 and September 30, 2014 was $0.1 million and $0.5 million, respectively. Share-based compensation expense for the restricted stock units granted for the nine months ended September 30, 2015 and September 30, 2014 was $0.8 million and $1.6 million, respectively. The remaining share-based compensation expense of $1.2 million related to restricted stock units granted will be recognized over a weighted-average period of 2.09 years.
10
The following table summarizes the Company's share-based compensation expense for equity awards and liability awards (in thousands):
Three months ended September 30, | Nine months ended September 30, | ||||||||||||||
2015 | 2014 | 2015 | 2014 | ||||||||||||
Awards classified as equity: | |||||||||||||||
Restricted stock unit expense | $ | 360 | $ | 349 | $ | 760 | $ | 1,091 | |||||||
Stock option expense | — | 290 | — | 1,192 | |||||||||||
Awards classified as liability: | |||||||||||||||
Restricted stock unit expense | (211 | ) | 193 | 18 | 529 | ||||||||||
Total share-based compensation expense | $ | 149 | $ | 832 | $ | 778 | $ | 2,812 | |||||||
6. Property and Equipment
Property and equipment consisted of the following:
Estimated Life in Years | September 30, 2015 | December 31, 2014 | |||||||
(in thousands) | |||||||||
Well servicing equipment | 3-15 years | $ | 413,312 | $ | 417,561 | ||||
Autos and trucks | 5-10 years | 126,660 | 124,338 | ||||||
Disposal wells | 5-15 years | 38,789 | 38,167 | ||||||
Building and improvements | 5-30 years | 14,107 | 14,423 | ||||||
Furniture and fixtures | 3-15 years | 6,542 | 6,157 | ||||||
Land | 1,524 | 1,452 | |||||||
600,934 | 602,098 | ||||||||
Accumulated depreciation | (311,596 | ) | (279,435 | ) | |||||
$ | 289,338 | $ | 322,663 | ||||||
Depreciation expense was $13.0 million and $39.5 million for the three and nine months ended September 30, 2015, respectively, and $13.1 million and $38.5 million for the three and nine months ended September 30, 2014, respectively.
7. Long-Term Debt
Long-term debt at September 30, 2015 and December 31, 2014 consisted of the following:
September 30, 2015 | December 31, 2014 | ||||||
(in thousands) | |||||||
9% Senior Notes | $ | 280,000 | $ | 280,000 | |||
Revolving credit facility | 15,000 | — | |||||
Third party equipment notes and capital leases | 8,248 | 12,170 | |||||
Insurance notes | — | 5,721 | |||||
303,248 | 297,891 | ||||||
Less: Current portion | (19,225 | ) | (11,204 | ) | |||
$ | 284,023 | $ | 286,687 | ||||
11
9% Senior Notes
On June 7, 2011, FES Ltd issued $280.0 million in principal amount of 9% Senior Notes due 2019 (the “9% Senior Notes”). The 9% Senior Notes mature on June 15, 2019, and require semi-annual interest payments, in arrears, at an annual rate of 9% on June 15 and December 15 of each year, until maturity. No principal payments are due until maturity.
The 9% Senior Notes are guaranteed by the current domestic subsidiaries (the “Guarantor Subs”) of FES Ltd, which include Forbes Energy Services, LLC (“FES LLC”), C.C. Forbes, LLC (“CCF”), TX Energy Services, LLC (“TES”) and Forbes Energy International, LLC (“FEI LLC”). All of the Guarantor Subs are 100% owned and each guarantees the securities on a full and unconditional and joint and several basis, subject to customary release provisions which include: (i) the transfer, sale or other disposition (by merger or otherwise) of all or substantially all of the assets of the applicable Guarantor, or all of its capital stock; (ii) the proper designation of a Guarantor as an "Unrestricted Subsidiary"; (iii) the legal defeasance or satisfaction and discharge of the Indenture; and (iv) as may be provided in any intercreditor agreement entered into in connection with any current and future credit facilities, in each such case specified in clauses (i) through (iii) above in accordance with the requirements therefor set forth in the indenture governing the 9% Senior Notes (the "9% Senior Indenture"). The Forbes Group may, at its option, redeem all or part of the 9% Senior Notes from time to time at specified redemption prices and subject to certain conditions required by the 9% Senior Indenture. The Forbes Group is required to make an offer to purchase the notes and to repurchase any notes for which the offer is accepted at 101% of their principal amount, plus accrued and unpaid interest, if there is a change of control. The Forbes Group is required to make an offer to repurchase the notes and to repurchase any notes for which the offer is accepted at 100% of their principal amount, plus accrued and unpaid interest, following certain asset sales.
The Forbes Group is permitted under the terms of the 9% Senior Indenture to incur additional indebtedness in the future, provided that certain financial conditions set forth in the 9% Senior Indenture are satisfied. The Forbes Group is subject to certain covenants contained in the 9% Senior Indenture, including provisions that limit or restrict the Forbes Group's and certain future subsidiaries' abilities to incur additional debt, to create, incur or permit to exist certain liens on assets, to make certain dispositions of assets, to make payments on certain subordinated indebtedness, to pay dividends or certain other payments to equity holders, to engage in mergers, consolidations or other fundamental changes, to change the nature of its business or to engage in transactions with affiliates. Due to cross-default provisions in the 9% Senior Indenture and the loan agreement governing our revolving credit facility, with certain exceptions, a default and acceleration of outstanding debt under one debt agreement would result in the default and possible acceleration of outstanding debt under the other debt agreement. Accordingly, an event of default could result in all or a portion of our outstanding debt under our debt agreements becoming immediately due and payable. If this occurred, we might not be able to obtain waivers or secure alternative financing to satisfy all of our obligations simultaneously, which would adversely affect our business and operations.
The Company was in compliance with the covenants in the indenture governing the 9% Senior Notes at September 30, 2015.
Revolving Credit Facility
On September 9, 2011, FES Ltd. and its current domestic subsidiaries entered into a loan and security agreement with certain lenders, and Regions Bank, as agent for the secured parties, or the Agent. This loan and security agreement was amended in December 2011, July 2012 and July 2013. The loan and security agreement, as amended, provides for an asset based revolving credit facility with a maximum borrowing credit of $90.0 million, subject to borrowing base availability, any reserves established by the facility agent in its discretion, compliance with a fixed charge coverage ratio covenant if availability under the facility falls below certain thresholds and, for borrowings above $75.0 million, compliance with the debt incurrence covenant in the 9% Senior Indenture that prohibits the incurrence of debt except for certain limited exceptions, including indebtedness incurred under the permitted credit facility debt basket to the greater of $75.0 million or 18% of our Consolidated Tangible Assets (as defined in the 9% Senior Indenture) reported for the last fiscal quarter for which financial statements are available. As of September 30, 2015, 18% of our Consolidated Tangible Assets was approximately $75.3 million. Under the loan and security agreement, our borrowing base at any time is equal to (i) 85% of eligible accounts, which are determined by Agent in its reasonable discretion, plus (ii) the lesser of 85% of the appraised value, subject to certain adjustments, of our well services equipment that has been properly pledged and appraised, is in good operating condition and is located in the United States, or 100% of the net book value of such equipment, minus (iii) any reserves established by the Agent in its reasonable discretion. As of September 30, 2015, the borrowing base was $90.0 million and borrowing availability was $52.7 million.
As amended, the loan and security agreement has a stated maturity of July 26, 2018. In June 2015, the Company, for the first time since the July 2013 amendment, drew down $15.0 million under the facility, which is reflected in the current portion of long term debt since the Company plans to repay the revolving loan balance in the next twelve months. As of September 30, 2015, the facility had a revolving loan balance outstanding of $15.0 million and $7.6 million in letters of credit outstanding against the facility.
12
Borrowings bear interest at a rate equal to either (a) the LIBOR rate plus an applicable margin of between 2.00% to 2.50% based on borrowing availability or (b) a base rate plus an applicable margin of between 1.00% to 1.50% based on borrowing availability, where the base rate is equal to the greater of the prime rate established by Regions Bank, the overnight federal funds rate plus 0.5% or the LIBOR rate for a one month period plus 1%. The Company's interest rate as of September 30, 2015 was 2.625%.
In addition to paying interest on outstanding principal under the facility, a fee of 0.375% per annum will accrue on unutilized availability under the credit facility. We are required to pay a fee of between 2.25% to 2.75%, based on borrowing availability, with respect to the principal amount of any letters of credit outstanding under the facility. We are also responsible for certain other administrative fees and expenses.
FES LLC, FEI LLC, TES, and CCF are the borrowers under the loan and security agreement. Their obligations have been guaranteed by one another and by FES Ltd. Subject to certain exceptions and permitted encumbrances, including the exemption of real property interests from the collateral package, the obligations under this facility are secured by a first priority security interest in all of our assets.
We are able to voluntarily repay outstanding loans at any time without premium or penalty (subject to the fees discussed above). If at any time our outstanding loans under the credit facility exceed the availability under our borrowing base, we may be required to repay the excess. Further, we are required to use the net proceeds from certain events, including certain judgments, tax refunds or insurance awards to repay outstanding loans, however, we may reborrow following such repayments if the conditions to borrowing are met.
The loan and security agreement contains customary covenants for an asset-based credit facility, which include (i) restrictions on certain mergers, consolidations and sales of assets; (ii) restrictions on the creation or existence of liens; (iii) restrictions on making certain investments; (iv) restrictions on the incurrence or existence of indebtedness; (v) restrictions on transactions with affiliates; (vi) requirements to deliver financial statements, report and notices to the Agent and (vii) a springing requirement to maintain a consolidated Fixed Charge Coverage Ratio (which is defined in the loan and security agreement) of 1.1:1.0 in the event that our excess availability under the credit facility falls below the greater of $7.9 million or 15.0% of our maximum credit under the facility for sixty consecutive days; provided that, the restrictions described in (i)-(v) above are subject to certain exceptions and permissions limited in scope and dollar value. The loan and security agreement also contains customary representations and warranties and event of default provisions. As of September 30, 2015, we are in compliance with all applicable covenants in the loan and security agreement.
Third Party Equipment Notes and Capital Leases
The Forbes Group financed the purchase of certain vehicles and equipment through commercial loans and capital leases with aggregate principal amounts outstanding as of September 30, 2015 and December 31, 2014 of approximately $8.2 million and $12.2 million, respectively. These loans are repayable in a range of 42 to 60 monthly installments with the maturity dates ranging from October 2015 to July 2018. Interest accrues at rates ranging from 3.2% to 8.4% and is payable monthly. The loans are collateralized by equipment purchased with the proceeds of such loans. The Forbes Group paid total principal payments of approximately $1.6 million and $1.3 million for three months ended September 30, 2015 and 2014, respectively, and $4.5 million and $3.8 million for the nine months ended September 30, 2015 and 2014, respectively.
Following are required principal payments due on notes and capital leases (other than the 9% Senior Notes) existing as of September 30, 2015:
October - December 2015 | 2016 | 2017 | 2018 | 2019 | |||||||||||||||
(in thousands) | |||||||||||||||||||
Notes and capital lease principal payments | $ | 1,095 | $ | 4,073 | $ | 2,837 | $ | 243 | $ | — | |||||||||
Management currently acquires all light duty trucks (pick up trucks) through capital leases and may use capital leases or cash to purchase equipment held under operating leases that has reached the end of the lease term. See Note 10 - Commitments and Contingencies.
Insurance Notes
During October of 2014, the Forbes Group entered into promissory notes for the payment of insurance premiums at an interest rate of 2.9% with an aggregate principal amount outstanding as of September 30, 2015 and December 31, 2014 of
13
approximately $0.0 million and $5.7 million, respectively. The amount outstanding could be substantially offset by the cancellation of the related insurance coverage which is classified as prepaid insurance.
8. Fair Value of Financial Instruments
Fair value is defined as the amount that would be received to sell an asset or paid to transfer a liability in an orderly transaction between market participants at the measurement date.
The carrying amounts of cash and cash equivalents, accounts receivable-trade, accounts receivable – other, accounts payable – trade, and insurance notes, approximate fair value because of the short maturity of these instruments. The fair values of third party notes and equipment notes approximate their carrying values, based on current market rates at which the Company could borrow funds with similar maturities (Level 2 in the fair value hierarchy).
September 30, 2015 | December 31, 2014 | ||||||||||||||
Carrying Amount | Fair Value | Carrying Amount | Fair Value | ||||||||||||
(in thousands) | |||||||||||||||
9.0% Senior Notes | $ | 280,000 | $ | 185,500 | $ | 280,000 | $ | 165,200 | |||||||
The fair value of our 9% Senior Notes is a Level 1 input within the fair value hierarchy and is based on the dealer quoted market prices at September 30, 2015 and December 31, 2014, respectively.
14
9. Related Party Transactions
The Forbes Group enters into transactions with related parties in the normal course of conducting business. The following tables represent related party transactions.
As of | ||||||||||||||||
September 30, 2015 | December 31, 2014 | |||||||||||||||
(in thousands) | ||||||||||||||||
Related parties cash and cash equivalents balances: | ||||||||||||||||
Balance at Texas Champion Bank (1) | $ | 1,269 | $ | 1,040 | ||||||||||||
Balance at Brush Country Bank (2) | 498 | 644 | ||||||||||||||
Related parties receivable: | ||||||||||||||||
Dorsal Services, Inc. (3) | 40 | 60 | ||||||||||||||
Wolverine Construction, Inc. (4) | — | 282 | ||||||||||||||
$ | 40 | $ | 342 | |||||||||||||
Related parties payable: | ||||||||||||||||
Alice Environmental Services, LP/Alice Environmental Holding LLC (5) | $ | 76 | $ | 83 | ||||||||||||
Dorsal Services, Inc. (3) | 2 | 25 | ||||||||||||||
Tasco Tool Service Ltd. (6) | 12 | 59 | ||||||||||||||
Texas Quality Gate Guard Services, LLC (7) | 16 | 11 | ||||||||||||||
Texas Water Disposal Services, LLC (8) | — | 8 | ||||||||||||||
$ | 106 | $ | 186 | |||||||||||||
Three months ended September 30, | Nine months ended September 30, | |||||||||||||||
2015 | 2014 | 2015 | 2014 | |||||||||||||
(in thousands) | ||||||||||||||||
Related parties capital expenditures: | ||||||||||||||||
Alice Environmental West Texas, LLC (5) | $ | — | $ | — | $ | 455 | $ | — | ||||||||
$ | — | $ | — | $ | 455 | $ | — | |||||||||
Related parties revenue activity: | ||||||||||||||||
Alice Environmental Services, LP/Alice Environmental Holding LLC (5) | $ | — | $ | — | $ | — | $ | 1 | ||||||||
Dorsal Services, Inc. (3) | — | — | — | 1 | ||||||||||||
Tasco Tool Service Ltd. (6) | — | — | 1 | 1 | ||||||||||||
Wolverine Construction, Inc. (4) | — | 1 | — | 309 | ||||||||||||
Texas Water Disposal Services, LLC (8) | — | 2 | — | 59 | ||||||||||||
$ | — | $ | 3 | $ | 1 | $ | 371 | |||||||||
Related parties expense activity: | ||||||||||||||||
Alice Environmental Services, LP/Alice Environmental Holding LLC (5) | $ | 383 | $ | 672 | $ | 1,518 | $ | 1,638 | ||||||||
CJ Petroleum Service LLC (13) | — | 4 | — | 4 | ||||||||||||
Dorsal Services, Inc. (3) | 2 | 162 | 21 | 468 | ||||||||||||
Tasco Tool Service Ltd. (6) | 31 | 44 | 166 | 182 | ||||||||||||
FCJ Management, LLC (9) | 1 | 9 | 15 | 27 | ||||||||||||
JITSU Services, LLC (10) | — | 91 | — | 243 | ||||||||||||
Texas Quality Gate Guard Services, LLC (7) | 47 | 146 | 160 | 146 | ||||||||||||
Animas Holdings, LLC (11) | 43 | 74 | 184 | 277 | ||||||||||||
Texas Water Disposal Services, LLC (8) | — | — | — | 3 | ||||||||||||
CJW Group, LLC (12) | 9 | — | 28 | — | ||||||||||||
$ | 516 | $ | 1,202 | $ | 2,092 | $ | 2,988 | |||||||||
15
(1)The Company has a deposit relationship with Texas Champion Bank. Travis Burris, one of the directors of FES Ltd., is also the President, Chief Executive Officer, and director of Texas Champion Bank. Mr. Crisp, our President and Chief Executive Officer, serves on the board of directors.
(2)Messrs. Crisp and Forbes are directors and shareholders of Brush Country Bank, an institution with which the Company conducts business and has deposits.
(3)Dorsal Services, Inc. is a trucking service company. Mr. Crisp is a partial owner of Dorsal Services, Inc. The company uses Dorsal Services from time to time.
(4)Wolverine Construction, Inc., or Wolverine, is an entity that was owned by two sons and a brother of Mr. Crisp, an executive officer and director of FES Ltd., and a son of Mr. Forbes, an executive officer and director of FES Ltd. Wolverine provided construction and site preparation services to certain customers of the Company.
(5)Messrs. John E. Crisp and Charles C. Forbes, Jr., executive officers and directors of FES Ltd., are also owners and managers of Alice Environmental Holdings, LLC, or AEH, and indirect owners and managers of Alice Environmental Services, LP, or AES and Alice Environmental West Texas, LLC, or AEWT. The Company leases or rents land and buildings, and aircraft from AES. During 2015, the Company purchased land from AEWT for an additional operating location. The aircraft leases were terminated in July of 2015.
(6)Tasco Tool Service Ltd. is a down-hole tool company that is partially owned and managed by a company that is owned by Mr. Forbes, both an executive officer and director of FES Ltd., along with Robert Jenkins a manager of one of the subsidiaries of FES Ltd. Tasco rents and sells tools to the Company from time to time.
(7)Texas Quality Gate Guard Services, LLC, or Texas Quality Gate Guard Services, is an entity owned by Messrs. Crisp and Forbes, executive officers and directors of FES Ltd, and a son of Mr. Crisp. Texas Quality Gate Guard Services has provided security services to the Company.
(8) Texas Water Disposal Services, LLC, or TWDS, is partially owned by a brother of Mr. Crisp, an executive officer and director of FES Ltd. TWDS is a company that owns a salt water disposal well that has been used by the Company. There has been no activity with TWDS since March 2014.
(9) FCJ Management, LLC, or FCJ, is an entity that leases land and facilities to the Company and is owned by Messrs. Crisp and Forbes, and Robert Jenkins, a manager of one of the subsidiaries of FES Ltd. The lease with FCJ was terminated in July of 2015.
(10)JITSU Services, LLC, or JITSU, is a financial leasing company owned by Janet Forbes and Mr. Crisp, an executive officer and director of FES Ltd. The Company previously leased ten vacuum trucks from JITSU. This lease was terminated November 2014.
(11)Animas Holdings, LLC, or Animas, is owned by the two sons of Mr. Crisp and three children of Mr. and Ms. Forbes. Animas owns land and property that it leases to the Company. Messrs. Crisp and Forbes are executive officers and directors of FES Ltd. and Ms. Forbes served as a director of FES Ltd. until June 11, 2014.
(12) CJW Group, LLC is an entity that leases office space to the Company and is partially owned by Messrs. Crisp and Forbes, executive officers and directors of FES Ltd.
(13) CJ Petroleum Service, LLC, or CJ Petroleum, is a company that owns salt water disposal wells and is owned by Messrs. Crisp and Forbes, Janet Forbes, a former director of FES Ltd., and two sons of Mr. Crisp.
10. Commitments and Contingencies
Concentrations of Credit Risk
FDIC insurance coverage is currently $250,000 per depositor at each financial institution, and our non-interest bearing cash balances typically exceed federally insured limits. The Company restricts investment of temporary cash investments to financial institutions with high credit standings. The Company's customer base consists primarily of multi-national and independent oil and natural gas producers. The Company does not require collateral on its trade receivables. For the three months ended September 30, 2015, the Company's largest customer, five largest customers, and ten largest customers constituted 18.4%, 54.8%, and 72.4% of consolidated revenues, respectively. For the nine months ended September 30, 2015 the Company's largest customer, five largest customers, and ten largest customers constituted 17.0%, 47.5%, and 63.7% of consolidated revenues, respectively. The loss of any one of our top five customers would have a materially adverse effect on the revenues and profits of the Company. Further, our trade accounts receivable are from companies within the oil and natural gas industry and as such the Company is exposed to normal industry credit risks. As of September 30, 2015, the Company's largest customer, five largest customers, and ten largest customers constituted 13.0%, 46.1%, and 63.0% of accounts receivable, respectively. The Company continually evaluates its reserves for potential credit losses and establishes reserves for such losses.
Self-Insurance
The Company is self-insured under its Employee Group Medical Plan for the first $0.3 million per individual. The Company is also self-insured for the first $0.5 million and $1.0 million under its insurance policies for auto liability and general liability, respectively. The Company has an additional premium payable under its excess liability policy of 25% of paid claims in excess of $0.9 million up to total claims of $9.15 million. Such additional premium will become payable at the time when a loss is paid and will be payable over a period agreed by insurers. The Company has accrued a liability of approximately $6.0 million and $5.8 million as of September 30, 2015 and December 31, 2014, respectively, for the projected additional premium and self-insured portion of these insurance claims as of the financial statement dates. This accrual includes claims made as well as an estimate for claims incurred but not reported as of the financial statement dates.
16
Litigation
The Company is subject to various other claims and legal actions that arise in the ordinary course of business. We do not believe that any of these claims and actions, separately or in the aggregate, will have a material adverse effect on our business, financial condition, results of operations, or cash flows, although we cannot guarantee that a material adverse effect will not occur.
Off-Balance Sheet Arrangements
We are often party to certain transactions that require off-balance sheet arrangements such as performance bonds, guarantees, operating leases for equipment, and bank guarantees that are not reflected in our condensed consolidated balance sheets. These arrangements are made in our normal course of business and they are not reasonably likely to have a current or future material adverse effect on our financial condition, results of operations, liquidity or cash flows.
Following are future lease payments on operating leases existing as of September 30, 2015:
October - December 2015 | 2016 | 2017 | 2018 | 2019 | |||||||||||||||
(in thousands) | |||||||||||||||||||
Lease payments | $ | 2,241 | $ | 4,533 | $ | 296 | $ | — | $ | — | |||||||||
11. Supplemental Cash Flow Information
Nine months ended September 30, | |||||||
2015 | 2014 | ||||||
(in thousands) | |||||||
Cash paid for | |||||||
Interest | $ | 13,250 | $ | 13,360 | |||
Income tax | 182 | 70 | |||||
Supplemental schedule of non-cash investing and financing activities | |||||||
Changes in accounts payable related to capital expenditures | $ | (1,519 | ) | $ | 7,737 | ||
Capital leases on equipment | 529 | 1,320 | |||||
Preferred stock dividends and accretion costs | 31 | 31 | |||||
12. Earnings per Share
Basic earnings (loss) per share (“EPS”) is computed by dividing net income (loss) available to common shareholders by the weighted average common stock outstanding during the period. Diluted earnings (loss) per share takes into account the potential dilution that could occur if securities or other contracts to issue common stock, such as options and convertible preferred stock, were exercised and converted into common stock. Potential common stock equivalents that have been issued by the Forbes Group relate to outstanding stock options and unvested restricted stock units which are determined using the treasury stock method, and the Series B Senior Convertible Preferred Stock (the "Series B Preferred Stock"), which are determined using the "if-converted" method. In applying the if-converted method, conversion is not assumed for purposes of computing diluted EPS if the effect would be antidilutive. As of September 30, 2015 and September 30, 2014, there were 614,125 and 1,148,625 options to purchase common stock outstanding, respectively, and 588,059 Series B Preferred Stock. The Series B Preferred Stock is convertible at a rate of nine shares of common stock to one share of Series B Preferred Stock, or 5,292,531 shares of common stock.
The shares of Series B Preferred Stock are participating securities as they participate in undistributed earnings with common stock, whether that participation is conditioned upon the occurrence of a specified event or not. A participating security is included in the computation of basic EPS using the two-class method. Under the two-class method, basic EPS for the Company’s common stock is computed by dividing net income applicable to common shares by the weighted-average
17
common stock outstanding during the period. Under the certificate of designation for our Series B Preferred Stock (the “Series B Certificate of Designation”), if at any time the Company declares a dividend in cash which is greater in value than five percent on a cumulative basis over the previous twelve month period of the then current “Common Share Fair Market Value,” as that term is defined in the Series B Certificate of Designation, the Series B Preferred Stock will be entitled to receive a dividend payable in cash equal to the amount in excess of five percent of the then Common Share Fair Market Value per common share they would have received if all outstanding Series B Preferred Stock had been converted into common shares. There were no earnings allocated to the Series B Preferred Stock for the quarters ended September 30, 2015 and 2014 since there was a net loss for those periods and earnings for the quarter were not in excess of amounts prescribed by the Series B Certificate of Designation for our Series B Preferred Stock. Diluted EPS for the Company’s common stock is computed using the more dilutive of the two-class method or the if-converted method. The following table sets forth the reconciliation of weighted average shares outstanding and diluted weighted average shares outstanding:
Three months ended September 30, | Nine months ended September 30, | ||||||||||
2015 | 2014 | 2015 | 2014 | ||||||||
(in thousands) | (in thousands) | ||||||||||
Weighted average shares outstanding | 22,156 | 21,799 | 22,024 | 21,718 | |||||||
Dilutive effect of stock options and restricted stock | — | — | — | — | |||||||
Dilutive effect of preferred stock | — | — | — | — | |||||||
Diluted weighted average shares outstanding | 22,156 | 21,799 | 22,024 | 21,718 | |||||||
There were 614,125 stock options, 1,494,828 units of unvested restricted stock, and 5,292,531 shares of common stock equivalents underlying the Series B Preferred Stock outstanding as of September 30, 2015 that were not included in the calculation of diluted EPS for the nine months ended September 30, 2015 because their effect would have been antidilutive. There were 1,148,625 stock options, 642,895 units of unvested restricted stock, and 5,292,531 shares of common stock equivalents underlying the Series B Preferred Stock outstanding as of September 30, 2014 that were not included in the calculation of diluted EPS for the nine months ending September 30, 2014 because their effect would have been antidilutive.
The following table sets forth the computation of basic and diluted loss per share:
Three months ended September 30, | Nine months ended September 30, | ||||||||||||||
2015 | 2014 | 2015 | 2014 | ||||||||||||
(in thousands, except per share amounts) | |||||||||||||||
Basic and diluted: | |||||||||||||||
Net loss | $ | (13,510 | ) | (1,543 | ) | $ | (26,692 | ) | $ | (4,330 | ) | ||||
Preferred stock dividends and accretion | (194 | ) | (194 | ) | (582 | ) | (582 | ) | |||||||
Net loss attributable to common shareholders | $ | (13,704 | ) | $ | (1,737 | ) | $ | (27,274 | ) | $ | (4,912 | ) | |||
Weighted-average common shares | 22,156 | 21,799 | 22,024 | 21,718 | |||||||||||
Basic and diluted net loss per share | $ | (0.62 | ) | $ | (0.08 | ) | $ | (1.24 | ) | $ | (0.23 | ) | |||
13. Income Taxes
The Company’s tax benefit from application of the effective tax rate for the nine months ended September 30, 2015 was estimated to be 30.5% based on pre-tax loss of $38.4 million. For the nine months ended September 30, 2014, the Company's effective tax rate was a benefit of 27.7%. The difference between the effective rate and 35.0% statutory rate is mainly due to Texas Margins Tax and non-deductible expenses.
14. Business Segment Information
The Forbes Group has determined that it has two reportable segments organized based on its products and services—well servicing and fluid logistics. The accounting policies of the segments are the same as those described in the summary of significant accounting policies.
Well Servicing
At September 30, 2015, our well servicing segment utilized our fleet of 173 well servicing rigs, which was comprised of 159 workover rigs and 14 swabbing rigs, as well as six coiled tubing spreads, nine tubing testing units, four electromagnetic scan trucks and related assets and equipment. These assets are used to provide (i) well maintenance, including remedial repairs
18
and removal and replacement of downhole production equipment, (ii) well workovers, including significant downhole repairs, re-completions and re-perforations, (iii) completion and swabbing activities, (iv) plugging and abandonment services, and (v) pressure testing of oil and natural gas production tubing and scanning tubing for pitting and wall thickness using tubing testing units.
Fluid Logistics
The fluid logistics segment utilizes our fleet of owned or leased fluid transport trucks and related assets, including specialized vacuum, high pressure pump and tank trucks, frac tanks, salt water disposal wells and facilities, and related equipment. These assets are used to provide transport, store and dispose of a variety of drilling and produced fluids used in and generated by oil and natural gas production activities. These services are required in most workover and completion projects and are routinely used in the daily operation of producing wells.
The following tables set forth certain financial information with respect to the Company’s reportable segments for the three and nine months ended September 30, 2015 and September 30, 2014:
Three months ended September 30, | Nine months ended September 30, | ||||||||||||||||||||||
Well Servicing | Fluid Logistics | Consolidated | Well Servicing | Fluid Logistics | Consolidated | ||||||||||||||||||
2015 | (in thousands) | (in thousands) | |||||||||||||||||||||
Operating revenues | $ | 35,390 | $ | 20,167 | $ | 55,557 | $ | 125,606 | $ | 77,094 | $ | 202,700 | |||||||||||
Direct operating costs | 28,186 | 17,477 | 45,663 | 93,796 | 59,513 | 153,309 | |||||||||||||||||
Segment profits | $ | 7,204 | $ | 2,690 | $ | 9,894 | $ | 31,810 | $ | 17,581 | $ | 49,391 | |||||||||||
Depreciation and amortization | $ | 6,488 | $ | 7,234 | $ | 13,722 | $ | 19,422 | $ | 22,222 | $ | 41,644 | |||||||||||
Capital expenditures | 655 | 93 | 748 | 4,681 | 3,497 | 8,178 | |||||||||||||||||
Total assets | 662,457 | 474,496 | 1,136,953 | 662,457 | 474,496 | 1,136,953 | |||||||||||||||||
Long lived assets | 171,775 | 117,563 | 289,338 | 171,775 | 117,563 | 289,338 | |||||||||||||||||
2014 | |||||||||||||||||||||||
Operating revenues | $ | 73,940 | $ | 40,526 | $ | 114,466 | $ | 213,389 | $ | 124,163 | $ | 337,552 | |||||||||||
Direct operating costs | 53,795 | 33,016 | 86,811 | 160,244 | 94,959 | 255,203 | |||||||||||||||||
Segment profits | $ | 20,145 | $ | 7,510 | $ | 27,655 | $ | 53,145 | $ | 29,204 | $ | 82,349 | |||||||||||
Depreciation and amortization | $ | 6,127 | $ | 7,683 | $ | 13,810 | $ | 18,082 | $ | 22,534 | $ | 40,616 | |||||||||||
Capital expenditures | 5,263 | 4,801 | 10,064 | 14,177 | 13,781 | 27,958 | |||||||||||||||||
Total assets | 629,575 | 486,384 | 1,115,959 | 629,575 | 486,384 | 1,115,959 | |||||||||||||||||
Long lived assets | 192,121 | 135,210 | 327,331 | 192,121 | 135,210 | 327,331 | |||||||||||||||||
Three months ended September 30, | Nine months ended September 30, | ||||||||||||||
2015 | 2014 | 2015 | 2014 | ||||||||||||
Reconciliation of the Forbes Group Operating Income (Loss) As Reported: | (in thousands) | (in thousands) | |||||||||||||
Segment profits | $ | 9,894 | $ | 27,655 | $ | 49,391 | $ | 82,349 | |||||||
General and administrative expense | 7,390 | 8,943 | 25,467 | 26,514 | |||||||||||
Depreciation and amortization | 13,722 | 13,810 | 41,644 | 40,616 | |||||||||||
Operating income (loss) | (11,218 | ) | 4,902 | (17,720 | ) | 15,219 | |||||||||
Other income and expenses, net | (7,038 | ) | (7,014 | ) | (20,674 | ) | (21,208 | ) | |||||||
Pre-tax loss | $ | (18,256 | ) | $ | (2,112 | ) | $ | (38,394 | ) | $ | (5,989 | ) | |||
19
September 30, 2015 | December 31, 2014 | ||||||
Reconciliation of the Forbes Group Assets As Reported: | (in thousands) | ||||||
Total reportable segments | $ | 1,136,953 | $ | 1,132,856 | |||
Elimination of internal transactions | (1,853,923 | ) | (1,784,404 | ) | |||
Parent | 1,159,597 | 1,135,161 | |||||
Total assets | $ | 442,627 | $ | 483,613 | |||
15. Equity Securities
Common Stock
Holders of common stock have no pre-emptive, redemption, conversion, or sinking fund rights. Holders of common stock are entitled to one vote per share on all matters submitted to a vote of holders of common stock. Unless a different majority is required by law or by the bylaws, resolutions to be approved by holders of common stock require approval by a simple majority of votes cast at a meeting at which a quorum is present. In the event of the liquidation, dissolution, or winding up of the Company, the holders of common stock are entitled to share equally and ratably in the Company's assets, if any, remaining after the payment of all of its debts and liabilities, subject to any liquidation preference on any issued and outstanding preferred stock.
Series B Preferred Stock
Under our Series B Certificate of Designation, we are authorized to issue 825,000 shares of Series B Preferred Stock, par value $0.01 per share. On May 28, 2010, the Company completed a private placement of 580,800 shares of Series B Preferred Stock at a price per share of CAD $26.37 for an aggregate purchase price in the amount of approximately USD $14.5 million based on the exchange rate between U.S. dollars and Canadian dollars then in effect of $1.00 to CDN $1.0547. The Company received net proceeds of USD $13.8 million after closing fee paid to investors of USD $0.3 million and legal fees and other offering costs of USD $0.4 million. This is presented as temporary equity on the balance sheet. The common stock into which the Series B Preferred Stock is convertible has certain demand and “piggyback” registration rights.
The value of the Series B Preferred Stock, for accounting purposes, is being accreted up to redemption value from the date of issuance to the earliest redemption date of the instrument using the effective interest rate method. If the Series B Preferred Stock had been redeemed as of September 30, 2015 and December 31, 2014, the redemption amount applicable at each date would have been approximately $14.6 million.
Dividends
The Series B Preferred Stock is entitled to receive preferential dividends equal to five percent (5.0%) per annum of the original issue price per share, payable quarterly in February, May, August and November of each year. Such dividends may be paid by the Company in cash or in kind (in the form of additional shares of Series B Preferred Stock). As shares of the Series B Preferred Stock are convertible into shares of our common stock, any dividend paid in kind would have a dilutive effect on our shares of common stock.
Preferred stock dividends are recorded at their fair value. If paid in cash, the amount paid represents fair value. If paid in kind, the fair value of the preferred stock dividends would be determined using valuation techniques that include a component representing the intrinsic value of the dividends (which represents the fair value of the common stock into which the preferred stock could be converted) and an option component (which is determined using a Black-Scholes Option Pricing Model). Dividends and accretion for the three and nine months ended September 30, 2015 and September 30, 2014 was $0.2 million and $0.6 million in each period, respectively. The Company has paid in cash all required quarterly dividends on the Series B Preferred Stock through September 30, 2015.
20
Item 2. | Management’s Discussion and Analysis of Financial Condition and Results of Operations |
The following discussion and analysis of our financial condition and results of operations should be read in conjunction with the accompanying condensed consolidated financial statements and related notes included elsewhere in this Quarterly Report on Form 10-Q and with the audited consolidated financial statements for the year ended December 31, 2014 included in our Annual Report on Form 10-K. Any forward-looking statements made by or on our behalf are made pursuant to the safe harbor provisions of the Private Securities Litigation Reform Act of 1995. Readers are cautioned that such forward-looking statements involve risks and uncertainties in that the actual results may differ materially from those projected in the forward-looking statements. Important factors that could cause actual results to differ include risks set forth in the Risk Factors in our Annual Report on Form 10-K for the year ended December 31, 2014.
Overview
Forbes Energy Services Ltd., or FES Ltd., is an independent oilfield services contractor that provides a wide range of well site services to oil and natural gas drilling and producing companies to help develop and enhance the production of oil and natural gas. These services include fluid hauling, fluid disposal, well maintenance, completion services, workovers and re-completions, plugging and abandonment, and tubing testing. Our operations are concentrated in the major onshore oil and natural gas producing regions of Texas, plus one location in Pennsylvania. We believe that our broad range of services, which extends from initial drilling, through production, to eventual abandonment, is fundamental to establishing and maintaining the flow of oil and natural gas throughout the life cycle of our customers’ wells. Our headquarters and executive offices are located at 3000 South Business Highway 281, Alice, Texas 78332. We can be reached by phone at (361) 664-0549.
As used in this Quarterly Report on Form 10-Q, the “Company,” the “Forbes Group,” “we,” and “our” mean FES Ltd. and its subsidiaries, except as otherwise indicated.
We currently provide a wide range of services to a diverse group of companies. Through the nine months ended September 30, 2015, we provided services to over 700 companies. Our blue-chip customer base includes Anadarko Petroleum Corporation, ConocoPhillips Company, and Pioneer Natural Resources Company, among others. John E. Crisp, Charles C. Forbes, Jr. and our senior management team, have cultivated deep and ongoing relationships with these customers during their average of over 38 years of experience in the oilfield services industry. For the three and nine months ended September 30, 2015, we generated consolidated revenues of approximately $55.6 million and $202.7 million, respectively.
We currently conduct our operations through the following two business segments:
• | Well Servicing. Our well servicing segment comprised 63.7% and 62.0% of consolidated revenues for the three and nine months ended September 30, 2015. At September 30, 2015, our well servicing segment utilized our modern fleet of 173 well servicing rigs, which was comprised of 159 workover rigs and 14 swabbing rigs, as well as six coiled tubing spreads, nine tubing testing units, four electromagnetic scan units, and related assets and equipment. These assets are used to provide (i) well maintenance, including remedial repairs and removal and replacement of downhole production equipment, (ii) well workovers, including significant downhole repairs, re-completions and re-perforations, (iii) completion and swabbing activities, (iv) plugging and abandonment services, and (v) pressure testing of oil and natural gas production tubing and scanning tubing for pitting and wall thickness using tubing testing units. |
• | Fluid Logistics. Our fluid logistics segment comprised 36.3% and 38.0% of consolidated revenues for the three and nine months ended September 30, 2015. Our fluid logistics segment utilized our fleet of owned or leased fluid transport trucks and related assets, including specialized vacuum, high-pressure pump and tank trucks, hot oil trucks, frac tanks, fluid mixing tanks, salt water disposal wells and facilities, and related equipment. These assets are used to provide, transport, store, and dispose of a variety of drilling and produced fluids used in, and generated by, oil and natural gas production. These services are required in most workover and completion projects and are routinely used in daily operations of producing wells. |
We believe that our two business segments are complementary and create synergies in terms of selling opportunities. Our multiple lines of service are designed to capitalize on our existing customer base to grow it within existing markets, generate more business from existing customers, and increase our operating performance. By offering our customers the ability to reduce the number of vendors they use, we believe that we help improve our customers’ efficiency. This is demonstrated by the fact that 81.1% and 78.7% of our revenues for both the three and nine months ended September 30, 2015, respectively, were from customers that utilized services of both of our business segments. Further, by having multiple service offerings that span
21
the life cycle of the well, we believe that we have a competitive advantage over smaller competitors offering more limited services.
Factors Affecting Results of Operations
Market Conditions
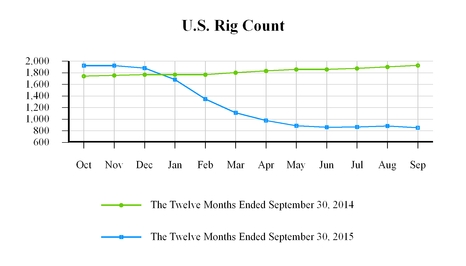
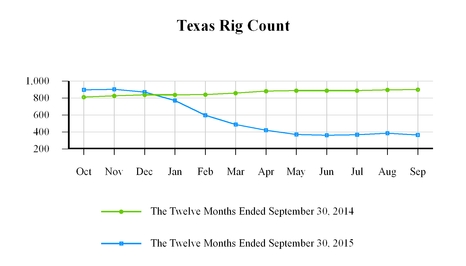
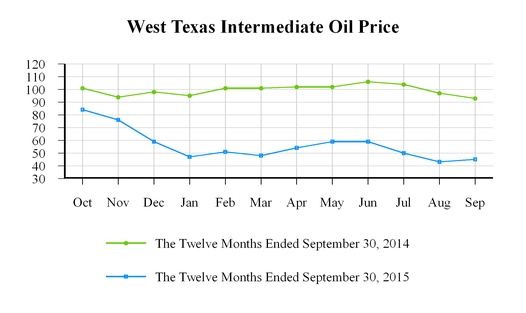
The oil and gas industry has experienced a significant decline in oil exploration and production activity that began in the fourth quarter of 2014 and has continued through the third quarter of 2015. The price of West Texas Intermediate (“WTI”) oil has fallen from a price of $93 per barrel as of September 30, 2014 to a price of $45 per barrel as of September 30, 2015, a decrease of approximately 51.6%. As of November 9, 2015, the price of WTI was approximately $45 per barrel. In response to this precipitous drop in WTI oil prices, exploration and production companies decreased the number of U.S. drilling rigs from 1,930 as of September 30, 2014 to 854 as of September 30, 2015, a decrease of 55.8%. During this period, Texas drilling rig count dropped from an average of 900 in September 2014 to an average of 367 in September 2015, a decrease of 59.2%.
Below are three charts that provide total U.S. rig counts, total Texas rig counts and WTI oil price trends for the twelve months ended September 30, 2014 and 2015.
22
The declines in oil and natural gas prices and oil and exploration activity have created a more challenging market for the provision of our services. In response to the current market conditions, the Company has implemented certain cost reduction measures and will continue to analyze cost reduction opportunities while ensuring that appropriate functions and capacity are preserved to allow the Company to be opportunistic as market conditions improve. Cost reductions, which began in the fourth quarter of 2014 and continued through 2015, include reductions in headcount, labor rates, bonuses, over-time, travel and entertainment, vendor pricing, and other cost controls that contribute to earnings. The Company has also consolidated locations where levels of activity dictate greater efficiencies with operations performed out of a single location. Additionally, the Company has delayed completion of one salt water disposal well until customer demand justifies its expenditure. Capital spending has largely been limited to capital commitments incurred before the market downturn, the replacement of existing equipment with new equipment, purchases of more efficient equipment in order to improve margins, and the purchase of equipment under operating leases nearing the end of their term.
As the Company expects pricing for its services to remain very competitive through the remainder of 2015 and utilization to remain challenging, costs and structure will continually be evaluated based on the changing market conditions with a focus on continuous process improvements.
Oil and Natural Gas Prices
Demand for well servicing and fluid logistics services is generally a function of the willingness of oil and natural gas companies to make operating and capital expenditures to explore for, develop and produce oil and natural gas, which in turn is affected by current and anticipated levels of oil and natural gas prices. Exploration and production spending is generally categorized as either operating expenditures or capital expenditures. Activities by oil and natural gas companies designed to add oil and natural gas reserves are classified as capital expenditures, and those associated with maintaining or accelerating production, such as workover and fluid logistics services, are categorized as operating expenditures. Operating expenditures are typically more stable than capital expenditures and are less sensitive to oil and natural gas price volatility. In contrast, capital expenditures by oil and natural gas companies for drilling are more directly influenced by current and expected oil and natural gas prices and generally reflect the volatility of commodity prices including the precipitous decline in oil prices in late 2014 and 2015.
Workover Rig Rates
Our well servicing segment revenues are dependent on the prevailing market rates for workover rigs. Composite rates dropped by 6.5% for the three months ended September 30, 2015 compared to the same period in 2014 due to the current market decline.
23
Fluid Logistics Rates
Our fluid logistics segment revenues are dependent on the prevailing market rates for fluid transport trucks and the related assets, including specialized vacuum, high-pressure pump and tank trucks, hot oil trucks, frac tanks, fluid mixing tanks and salt water disposal wells. Pricing and utilization decreased through 2014 and continued to decrease through the nine months ended September 30, 2015 in response to changing market conditions.
Operating Expenses
During 2015, operating expenses have decreased comparable with the reduction in revenues in both the well servicing and fluid logistics segments. The expense decline was driven by reductions in headcount, along with cost reduction measures. Future earnings and cash flows will be dependent on our ability to manage our overall cost structure as well as continued efforts to maintain or increase rates to customers and reduce costs with outside vendors.
Equipment rental and lease costs continue to be a significant component of our operating expenses. During the third quarter of 2015, we did not enter into any additional operating leases.
Capital Expenditures
During 2015, we received swabbing rigs, specialty fluid mixing tanks, and other well servicing equipment and incurred the associated costs of placing this equipment in service. In the second quarter of 2015, the Company purchased vacuum trucks, winch trucks, and trailers that had previously been on operating leases and were at the end of their respective terms. One swabbing rig was delivered in the third quarter of 2015 that had been ordered in the fourth quarter of 2014.
Results of Operations
The following discussion, as well as the discussion found under "Liquidity and Capital Resources," compares our consolidated financial information for the three months ended September 30, 2015 to the three months ended September 30, 2014.
Three Months Ended September 30, 2015 Compared to Three Months Ended September 30, 2014
The following table compares our operating results for the three months ended September 30, 2015 and 2014 (in thousands, except percentages). Operating expenses exclude general and administrative expenses, depreciation, and amortization.
Revenue | Operating Expenses, excluding depreciation and amortization | |||||||||||||||||||||||||||
2015 | 2014 | 2015 | % of revenues | 2014 | % of revenue | Change | % Change | |||||||||||||||||||||
Well Servicing | $ | 35,390 | $ | 73,940 | $ | 28,186 | 79.6 | % | $ | 53,795 | 72.8 | % | $ | (25,609 | ) | (47.6 | )% | |||||||||||
Fluid Logistics | 20,167 | 40,526 | 17,477 | 86.7 | % | 33,016 | 81.5 | % | (15,539 | ) | (47.1 | )% | ||||||||||||||||
Total | $ | 55,557 | $ | 114,466 | $ | 45,663 | 82.2 | % | $ | 86,811 | 75.8 | % | $ | (41,148 | ) | (47.4 | )% | |||||||||||
The following table compares segment profits for the three months ended September 30, 2015 and 2014 (in thousands, except percentages).
2015 | 2014 | ||||||||||||
Amount | Gross margin % (1) | Amount | Gross margin % (1) | ||||||||||
Well servicing | $ | 7,204 | 20.4 | % | $ | 20,145 | 27.2 | % | |||||
Fluid logistics | 2,690 | 13.3 | % | 7,510 | 18.5 | % | |||||||
Total | $ | 9,894 | 17.8 | % | $ | 27,655 | 24.2 | % | |||||
(1) Excluding depreciation and amortization
Consolidated Revenues. The decrease in consolidated revenues is a result of decreased activity in the well servicing and fluid logistics segments in the third quarter of 2015 as compared to the same period in 2014 due to the current market decline as
24
described more fully under "Market Conditions" above. These decreases in revenues were driven by price concessions granted to almost all customers and a drop in billable hours for both our well servicing and fluid logistics segments.
Well Servicing. Our well servicing segment revenues are dependent on the prevailing market rates and utilization of our workover rigs, coiled tubing units and tubing testing units. Pricing and utilization decreased through 2014 and continued to decrease through the nine months ended September 30, 2015 in response to changing market conditions.
Fluid Logistics. The current market decline resulted in revenues from the fluid logistics segment decreasing due to a decrease in trucking hours, price reductions, and decreased frac tank rentals for the three months ended September 30, 2015 when compared to the same period ending September 30, 2014. Billable trucking hours decreased during the three months ended September 30, 2015 by approximately 41.6% when compared to the three months ended September 30, 2014. Skim oil revenues declined with lower activity and skim oil sales prices. Our principal fluid logistics assets at September 30, 2015 and September 30, 2014 were as follows:
September 30, | |||||
2015 | 2014 | ||||
Fluid logistics segment: | |||||
Vacuum trucks (1) | 453 | 462 | |||
Other heavy trucks (1) | 144 | 141 | |||
Frac tanks | 3,060 | 3,307 | |||
Salt water disposal wells (2) | 23 | 23 | |||
(1) At September 30, 2015, 121 vacuum trucks and 21 other heavy trucks, included in the above equipment counts were leased.
(2) At September 30, 2015, 17 salt water disposal wells, included in the above well counts, were subject to ground leases or other operating arrangements to third parties. One of these wells is currently permitted and drilled, but has not been completed.
Consolidated Operating Expenses. The decrease in direct operating expenses for the three months ended September 30, 2015 as compared to the same period in the prior year was attributable to lower operating hours related to the industry down-turn. The increase in consolidated operating expenses as a percentage of revenue was primarily due to increase insurance claims activity for the three months ended September 30, 2015.
Well Servicing. Direct operating costs as a percentage of revenues were 79.6% and 72.8% for the three months ending September 30, 2015 and 2014, respectively, an increase of 6.8%. This increase was primarily due to increased insurance claims activity for the three months ended September 30, 2015.
Fluid Logistics. Direct operating costs as a percentage of revenues were 86.7% and 81.5% for the three months ending September 30, 2015 and 2014, respectively, an increase of 5.2%. This increase was due primarily due to increased insurance claims activity for the three months ended September 30, 2015.
General and Administrative Expenses. General and administrative expenses decreased by approximately $1.6 million to $7.4 million for the three months ended September 30, 2015 as compared to the same period in 2014. General and administrative expense as a percentage of revenues was 13.3% and 7.8% for the three months ended September 30, 2015 and September 30, 2014, respectively. The increase in expense as a percentage of revenue was due to the decrease in revenues for the quarter, relative to the decrease in general and administrative costs which include certain expenses that are fixed in nature.
Depreciation and Amortization. Depreciation and amortization expenses decreased by $0.1million, or 0.6%, to $13.7 million for the three months ended September 30, 2015 as compared to the same period in 2014. The decrease was due to assets reaching their estimated useful lives in 2015.
Interest and Other Expenses. Interest and other expenses were comparable for the three months ended September 30, 2015 as compared to the same period in the prior year.
Income Taxes. We recognized an income tax benefit of $4.7 million and $0.6 million for the three months ended September 30, 2015 and September 30, 2014, respectively. Our effective tax rate for the three months ended September 30, 2015 is 26.0% compared to 26.9% for the same period in the prior year. The difference in the tax rate is due to the Texas Margins Tax, other non-deductible expenses, and a change in Texas Margins Tax Rate enacted in the current quarter.
25
Nine Months Ended September 30, 2015 Compared to Nine Months Ended September 30, 2014
The following table compares our operating results for the nine months ended September 30, 2015 and 2014 (in thousands, except percentages). Operating expenses exclude general and administrative expenses, depreciation, and amortization.
Revenue | Operating Expenses, excluding depreciation and amortization | |||||||||||||||||||||||||||
2015 | 2014 | 2015 | % of revenues | 2014 | % of revenue | Change | % Change | |||||||||||||||||||||
Well Servicing | $ | 125,606 | $ | 213,389 | $ | 93,796 | 74.7 | % | $ | 160,244 | 75.1 | % | $ | (66,448 | ) | (41.5 | )% | |||||||||||
Fluid Logistics | 77,094 | 124,163 | 59,513 | 77.2 | % | 94,959 | 76.5 | % | (35,446 | ) | (37.3 | )% | ||||||||||||||||
Total | $ | 202,700 | $ | 337,552 | $ | 153,309 | 75.6 | % | $ | 255,203 | 75.6 | % | $ | (101,894 | ) | (39.9 | )% | |||||||||||
The following table compares segment profits for the nine months ended September 30, 2015 and 2014 (in thousands, except percentages).
2015 | 2014 | ||||||||||||
Amount | Gross margin % (1) | Amount | Gross margin % (1) | ||||||||||
Well servicing | $ | 31,810 | 25.3 | % | $ | 53,145 | 24.9 | % | |||||
Fluid logistics | 17,581 | 22.8 | % | 29,204 | 23.5 | % | |||||||
Total | $ | 49,391 | 24.4 | % | $ | 82,349 | 24.4 | % | |||||
(1) Excluding depreciation and amortization
Consolidated Revenues. The decrease in consolidated revenues is a result of decreased activity in the well servicing and fluid logistics segments for the nine months ended September 30, 2015 as compared to the same period in 2014 due to the current decrease in spending by our customers during this period of low oil and gas prices.
Well Servicing. Revenues from the well servicing segment decreased due to the current market downturn. We owned 173 and 169 well service rigs as of September 30, 2015 and 2014, respectively, and owned or leased six coiled tubing spreads in both periods ending September 30, 2015 and 2014.
Fluid Logistics. Revenues from the fluid logistics segment decreased due to a decrease in trucking hours and price reductions in addition to a decrease in frac tank rentals for the nine months ended September 30, 2015 when compared to the same period ending September 30, 2014. Billable trucking hours decreased during the nine months ended September 30, 2015 approximately 26.9% when compared to the nine months ended September 30, 2014. Utilization and rate decreases resulted from the current market down-turn. Skim oil revenues declined with lower activity and skim oil sales prices.
Consolidated Operating Expenses. The decrease in direct operating expenses for the nine months ended September 30, 2015 as compared to the same period in the prior year was attributable to lower operating hours related to the industry down-turn. Improvements in consolidated operating expenses as a percentage of revenues resulted from a reduction in head count, wage rate reductions, control of over-time hours, close monitoring of billable hours, lower price of fuel, and more aggressive cost management in areas such repairs and maintenance, travel, and meals and entertainment. In addition, we requested price reductions from the majority of our vendors, with most vendors granting reductions at some level.
Well Servicing. Direct operating costs as a percentage of revenues were 74.7% and 75.1% for the nine months ending September 30, 2015 and 2014, respectively, a slight decrease of 0.4%. This reduction resulted for the reasons stated above under Consolidated Operating Expenses. Specifically, we benefited from a reduction in headcount in this segment that decreased by 601 from 1,306 in September 2014 to 705 as of September 30, 2015, which was partially offset by additional insurance costs.
Fluid Logistics. Direct operating costs as a percentage of revenues were 77.2% and 76.5% for the nine months ending September 30, 2015 and 2014, respectively, a slight increase of 0.7%. This difference reflects increased insurance costs offset by reductions in other expenses.
General and Administrative Expenses. General and administrative expenses decreased by approximately $1.0 million to $25.5 million for the nine months ended September 30, 2015 as compared to the same period in 2014. General and administrative expenses as a percentage of revenues was 12.6% and 7.9% for the nine months ended September 30, 2015 and September 30, 2014, respectively. The primary reasons for the increase in expenses, as a percentage of revenue, were higher
26
insurance expense and an increase in legal and other professional fees. These increases were offset by a reduction in other expenses due to the cost containment actions.
Depreciation and Amortization. Depreciation and amortization expenses increased by $1.0 million, or 2.5%, to $41.6 million for the nine months ended September 30, 2015 as compared to the same period in 2014. The increase in depreciation expense was due to equipment purchases made later in 2014, which resulted in more depreciation on those assets in 2015.
Interest and Other Expenses. Interest and other expenses decreased approximately $0.5 million for the nine months ended September 30, 2015 as compared to the same period in the prior year.
Income Taxes. We recognized an income tax benefit of $11.7 million and $1.7 million for the nine months ended September 30, 2015 and September 30, 2014, respectively. Our effective tax rate for the nine months ended September 30, 2015 is 30.5% compared to 27.7% for the same period in the prior year. The difference in the tax rate is due to the Texas Margins Tax, other non-deductible expenses, and a change in Texas Margins Tax Rate enacted in the current quarter.
Liquidity and Capital Resources
Overview
During the last twenty-four months, we have funded our operations, including capital expenditures, through our cash flow from operations and a draw on our revolving credit facility, except for light duty trucks that were leased. Prior to this time, we had historically funded our operations and capital expenditures with bank borrowings, vendor financings, cash flow from operations, the issuance of senior notes and the proceeds from our public and private equity offerings.
As of September 30, 2015, we had $85.5 million in cash and cash equivalents, $303.2 million in contractual debt and capital leases and $0.2 million of accounts payable related to equipment. Also, as of September 30, 2015, we had 588,059 outstanding shares of Series B Preferred Stock, which is reflected in the balance sheet as temporary equity in the amount of $14.6 million. During periods when the Company's common stock maintains a five day volume weighted average trading price above $3.33 per share, the Series B Preferred Stock is redeemable, in whole or in part, at the Company's option for a price of $25 per share, plus accrued and unpaid dividends. Nevertheless, if the Company elects to redeem the Series B Preferred Stock, the holders thereof would have the opportunity prior to redemption to convert each share of the Series B Preferred Stock into nine shares of common stock. In May 2017, the Company is required to redeem the Series B Preferred Stock at 95% of the fair market value of the common stock as determined in accordance with the certificate of designation of the Series B Preferred Stock.
The $303.2 million in contractual debt was comprised of $280.0 million in senior notes, $8.2 million in equipment notes and $15.0 million drawn on our revolving credit facility. Of our total debt, $284.0 million of the outstanding contractual debt was classified as long-term debt and $19.2 million was short-term debt outstanding or the current portion of long-term debt. In addition, we have $0.2 million of non-interest bearing short-term equipment vendor financings for well servicing rigs and other equipment included in accounts payable. We incurred $0.8 million and $7.0 million for capital equipment acquisitions during the three and nine months ended September 30, 2015, respectively, compared to $10.1 million and $28.0 million for the three and nine months ended September 30, 2014, respectively.
On September 9, 2011, we entered into a loan and security agreement with certain lenders and Regions Bank, as agent for the secured parties, or the Agent. This loan and security agreement was amended, in December 2011, July 2012 and July 2013. The loan and security agreement, as amended, provides for an asset based revolving credit facility with a maximum borrowing credit of $90.0 million subject to borrowing base availability, any reserves established by the facility agent in its discretion, compliance with a fixed coverage charge ratio covenant if availability under the facility falls below certain thresholds and, for borrowings above $75.0 million, compliance with the debt incurrence covenant in the indenture governing the 9% Senior Notes that prohibits the incurrence of debt except for certain limited exceptions, including indebtedness incurred under the permitted credit facility debt basket to the greater of $75.0 million or 18% of our Consolidated Tangible Assets (as defined in the indenture governing the 9% Senior Notes) reported for the last fiscal quarter for which financial statements are available. Under the indenture governing the 9% Senior Notes, Consolidated Tangible Assets is defined as our total assets, determined on a consolidated basis in accordance with GAAP, excluding unamortized debt discount and expenses and other unamortized deferred charges, to the extent such items are non-cash expenses or charges, goodwill, patents, trademarks, service marks, trade names, copyrights and other items properly classified as intangibles in accordance with GAAP. As of September 30, 2015, 18% of our Consolidated Tangible Assets was approximately $75.3 million. Under the loan and security agreement, our borrowing base at any time is equal to (i) 85% of eligible accounts, which are determined by Agent in its reasonable discretion, plus (ii) the lesser of 85% of the appraised value, subject to certain adjustments, of our well servicing equipment that has been properly pledged and appraised, is in good operating condition and is located in the United States, or 100% of the net book value of such equipment, minus(iii) any reserves established by the Agent in its reasonable discretion. As of September 30, 2015, borrowing
27
base was $90 million and borrowing availability was $52.7 million. As amended, the loan and security agreement has a stated maturity of July 26, 2018.
The loan and security agreement contains customary covenants for an asset-based credit facility, which include (i) restrictions on certain mergers, consolidations and sales of assets; (ii) restrictions on the creation or existence of liens; (iii) restrictions on making certain investments; (iv) restrictions on the incurrence or existence of indebtedness; (v) restrictions on transactions with affiliates; (vi) requirements to deliver financial statements, report and notices to the Agent and (vii) a springing requirement to maintain a consolidated Fixed Charge Coverage Ratio (which is defined in the loan and security agreement) of 1.1:1.0 in the event that our excess availability under the credit facility falls below the greater of $7.9 million or 15.0% of our maximum credit under the facility for sixty consecutive days; provided that, the restrictions described in (i)-(v) above are subject to certain exceptions and permissions limited in scope and dollar value. The loan and security agreement also contains customary representations and warranties and event of default provisions. As of September 30, 2015, we were in compliance with all applicable covenants in the loan and security agreement.
Borrowings under the loan and security agreement bear interest at a rate equal to either (a) the LIBOR rate plus an applicable margin of between 2.00% to 2.50% based on borrowing availability or (b) a base rate plus an applicable margin of between 1.00% to 1.50% based on borrowing availability, where the base rate is equal to the greater of the prime rate established by Regions Bank, the overnight federal funds rate plus 0.50% or the LIBOR rate for a one month period plus 1.00%. The Company's interest rate as of September 30, 2015 was 2.625%.
As of September 30, 2015, there was $15.0 million drawn at an effective interest rate of 2.25% and $7.6 million in outstanding letters of credit outstanding against the facility.
In June 2011, we issued $280.0 million aggregate principal amount of 9% Senior Notes due 2019. The indenture governing the 9% Senior Notes, or the 9% Senior Indenture, and the loan agreement governing our senior secured revolving credit facility impose significant restrictions on us and increase our vulnerability to adverse economic and industry conditions that could limit our ability to obtain additional or replacement financing. For example, the 9% Senior Indenture only allows us to incur indebtedness, other than certain specific types of permitted indebtedness, if such indebtedness is unsecured and if the Fixed Charge Coverage Ratio (as defined in the 9% Senior Indenture) for the most recently completed four full fiscal quarters is at least 2.0 to 1.0. We are currently able to incur indebtedness under this ratio. Our credit facility only allows us to incur specific types of permitted indebtedness, which includes a $40.0 million basket of permitted indebtedness for capital leases, mortgage financings or purchase money obligations incurred for the purpose of installation or improvement of property, plant or equipment.
Should we fail to satisfy our obligations under the 9% Senior Indenture, the loan agreement governing our credit facility and any future debt agreements we may enter into could constitute an event of default under one or more of such agreements. Further, due to cross-default provisions in our debt agreements, a default and acceleration of our outstanding debt under one debt agreement may result in the default and acceleration of outstanding debt under the other debt agreements. Accordingly, an event of default could result in all or a portion of our outstanding debt becoming immediately due and payable. If this should occur, we might not be able to obtain waivers or secure alternative financing to satisfy all of our obligations simultaneously. Our ability to access the capital markets or to consummate any asset sales might be restricted at a time when we would like or need to raise capital. These events could have a material adverse effect on our business, financial position, results of operations and cash flows and our ability to satisfy our obligations.
The Forbes Group is permitted under the terms of the 9% Senior Indenture to incur additional indebtedness in the future, provided that certain financial conditions set forth in the 9% Senior Indenture are satisfied. The Forbes Group is subject to certain covenants contained in the 9% Senior Indenture, including provisions that limit or restrict the Forbes Group's and certain future subsidiaries' abilities to incur additional debt, to create, incur or permit to exist certain liens on assets, to make certain dispositions of assets, to make payments on certain subordinated indebtedness, to pay dividends or certain other payments to equity holders, to engage in mergers, consolidations or other fundamental changes, to change the nature of its business or to engage in transactions with affiliates. Due to cross-default provisions in the 9% Senior Indenture and the loan agreement governing our revolving credit facility, with certain exceptions, a default and acceleration of outstanding debt under one debt agreement would result in the default and possible acceleration of outstanding debt under the other debt agreement. Accordingly, an event of default could result in all or a portion of our outstanding debt under our debt agreements becoming immediately due and payable. If this occurred, we might not be able to obtain waivers or secure alternative financing to satisfy all of our obligations simultaneously, which would adversely affect our business and operations.
A downturn could require us to seek funding to meet working capital requirements. Further, should management elect to incur capital expenditures in excess of the levels projected for 2015 or to pursue other capital intensive activities, additional capital may be required to fund these activities. Within certain constraints, we can conserve capital by reducing or delaying
28
capital expenditures, deferring non-regulatory maintenance expenditures and further reducing operating and administrative costs. The Company believes it has sufficient liquidity for the next twelve months.
Cash Flows
Our cash flows depend, to a large degree, on the level of spending by oil and gas companies' development and production activities. Sustained increases or decreases in the price of natural gas or oil could have a material impact on these activities, and could also materially affect our cash flows. Certain sources and uses of cash, such as the level of discretionary capital expenditures, purchases and sales of investments, issuances and repurchases of debt and of our common stock are within our control and are adjusted as necessary based on market conditions.
Cash Flows from Operating Activities
Net cash provided by operating activities totaled $46.1 million for the nine months ended September 30, 2015, compared to $28.6 million for the nine months ended September 30, 2014. The increase in cash provided by operating activities of $17.5 million was primarily due to a decrease in accounts receivable, reflective of our decreased activity levels, which was partially offset by a decrease in accounts payable generating a net increase in cash flow of $40.0 million for the nine months ended September 30, 2015.
Cash Flows from Investing Activities
Cash flows used in investing activities was $5.4 million for the nine months ending September 30, 2015 compared to $15.0 million for the same period in 2014. The change was primarily related to a reduction in the purchase of property and equipment which decreased from $18.9 million for the nine months ended September 30, 2014 compared to $9.2 million for the current period.
Capital expenditures for the first nine months of 2015 were comprised of additions to our fluid logistics segment of approximately $3.5 million and additions to our well servicing segment of approximately $4.7 million. Additions to the fluid logistics segment were primarily specialized frac tanks and the purchase of vacuum trucks, trailers, and winch trucks which were previously on operating leases and at the end of their respective terms. Additions to the well servicing segment included swab rigs, vehicles, and other ancillary equipment. We also have certain operating leases that mature in the fourth quarter of 2015. We anticipate purchasing the equipment we were formerly leasing. We have an option of purchasing the equipment for cash or we believe we may be able to finance the purchase price through installment notes with the lessors, although there can be no assurance such financing will be available on terms acceptable by the Company. We estimate the purchase price for leased equipment we may purchase through the remainder of 2015 will be approximately $1.5 million.
Cash Flows from Financing Activities
Cash flows provided by financing activities was $9.8 million compared to cash flows used in financing activities of $4.8 million for the nine months ended September 30, 2015 and September 30, 2014, respectively, a difference of approximately $14.6 million, primarily due to proceeds drawn on our revolving credit facility.
Off-Balance Sheet Arrangements
We are often party to certain transactions that require off-balance sheet arrangements such as performance bonds, guarantees, operating leases for equipment, and bank guarantees that are not reflected in our condensed consolidated balance sheets. These arrangements are made in our normal course of business and they are not reasonably likely to have a current or future material adverse effect on our financial condition, results of operations, liquidity or cash flows. See Note 10 - Commitment and Contingencies.
Contractual Obligations and Financing
In May 2017, the Company is required to redeem any of its shares of Series B Preferred Stock then outstanding. Such mandatory redemption may, at the Company’s election, be paid in cash or common stock (valued for such purpose at 95% of the then fair market value of the common stock). As of September 30, 2015, we had 588,059 shares of Series B Preferred Stock outstanding.
Seasonality
29
Our operations are impacted by seasonal factors. Historically, our business has been negatively impacted during the winter months due to inclement weather, fewer daylight hours, and holidays. Our well servicing rigs are mobile, and we operate a significant number of oilfield vehicles. During periods of heavy snow, ice or rain, we may not be able to move our equipment between locations, thereby reducing our ability to generate rig or truck hours. In addition, the majority of our well servicing rigs work only during daylight hours. In the winter months as daylight time becomes shorter, the amount of time that the well servicing rigs work is shortened, which has a negative impact on total hours worked. Finally, during the fourth quarter, we historically have experienced significant slowdowns during the Thanksgiving and Christmas holiday seasons.
Critical Accounting Policies and Estimates
The preparation of our condensed consolidated financial statements in accordance with GAAP requires management to make estimates and assumptions that affect the reported amounts of assets and liabilities and the disclosure of contingent assets and liabilities as of the dates of the financial statements and the reported amounts of revenue and expenses during the applicable reporting periods. On an ongoing basis, management reviews its estimates, particularly those related to depreciation and amortization methods, useful lives and impairment of long-lived assets, and asset retirement obligations, using currently available information. Changes in facts and circumstances may result in revised estimates, and actual results could differ from those estimates. There have been no material changes to the critical accounting policies and estimates set forth in Item 7 in our Annual Report on Form 10-K for the year ended December 31, 2014.
30
Item 3. Quantitative and Qualitative Disclosures About Market Risk
There have been no material changes to the market risk disclosures set forth in Item 7A in our Annual Report on Form 10-K for the year ended December 31, 2014.
Item 4. | Controls and Procedures |
Evaluation of Disclosure Controls and Procedures
Our management, with the participation of our chief executive officer and chief financial officer, evaluated the effectiveness of our disclosure controls and procedures as of September 30, 2015. The term “disclosure controls and procedures,” as defined in Rules 13a-15(e) and 15d-15(e) under the Securities Exchange Act of 1934, as amended or the Exchange Act, means controls and other procedures of a company that are designed to ensure that information required to be disclosed by a company in the reports that it files or submits under the Exchange Act is recorded, processed, summarized and reported, within the time periods specified in the SEC's rules and forms. Disclosure controls and procedures include, without limitation, controls and procedures designed to ensure that information required to be disclosed by a company in the reports that it files or submits under the Exchange Act is accumulated and communicated to the company's management, including its principal executive and principal financial officers, as appropriate to allow timely decisions regarding required disclosure. Management recognizes that any controls and procedures, no matter how well designed and operated, can provide only reasonable assurance of achieving their objectives and management necessarily applies its judgment in evaluating the cost-benefit relationship of possible controls and procedures. Based on the evaluation of our disclosure controls and procedures as of September 30, 2015, our chief executive officer and chief financial officer concluded that, as of such date, our disclosure controls and procedures over financial reporting were effective.
Changes in Internal Control over Financial Reporting
There was no change in our internal control over financial reporting (as defined in Rules 13-a-15(f) and 15d-15(f) under the Exchange Act) during the fiscal quarter ended September 30, 2015 that has materially affected, or is reasonably likely to materially affect, our internal control over financial reporting.
31
PART II—OTHER INFORMATION
Item 1. | Legal Proceedings |
There are no pending material legal proceedings, and the Forbes Group is not aware of any material threatened legal proceedings, to which the Forbes Group is a party or to which its property is subject.
Item 1A. | Risk Factors |
On September 30, 2015, the Company received a letter, or the Notification Letter, from The NASDAQ Stock Market LLC, or the NASDAQ, stating that the Company’s common stock for the last 30 consecutive business days had closed below the minimum $1.00 per share requirement for continued listing on The NASDAQ Global Market under NASDAQ Listing Rule 5450(a)(1), or the Minimum Bid Price Requirement. The notification of noncompliance has no immediate effect on the listing or trading of the Company’s common stock on the NASDAQ Global Market.
The Notification Letter states that the Company will be afforded 180 calendar days, or until March 28, 2016, to regain compliance with the Minimum Bid Price Requirement. In accordance with NASDAQ Listing Rule 5810(c)(3)(A), the Company can regain compliance if the closing bid price of the Company’s common stock is at least $1.00 for a minimum of ten consecutive business days, and that if the Company’s common stock regains compliance with the Minimum Bid Price Requirement for continued listing, the NASDAQ staff will provide the Company with written notification that the Company has achieved compliance with the Minimum Bid Price Requirement for continued listing and the matter will be closed. The Notification Letter also states that if the Company chooses to implement a reverse stock split to achieve compliance, the Company must complete such reverse stock split no later than ten business days prior to March 28, 2016.
If the Company does not achieve compliance with the Minimum Bid Price Requirement by March 28, 2016, the Company may be eligible for an additional 180 calendar day compliance period if it elects to transfer to the Nasdaq Capital Market. To qualify, the Company will be required to meet the continued listing requirement for market value of publicly held shares and all other initial listing standards for the Nasdaq Capital Market, with the exception of the bid price requirement, and will need to provide written notice of its intention to cure the deficiency during the second compliance period by effecting a reverse stock split, if necessary. However, if the NASDAQ staff concludes that the Company will not be able to cure the deficiency, or if the Company is otherwise not eligible, the NASDAQ staff will notify the Company that its securities will be subject to delisting. In the event of such notification, the Company may appeal the NASDAQ staff’s determination to delist its securities, but there can be no assurance the NASDAQ staff will grant the Company’s request for continued listing.
The Company intends to monitor its common stock’s closing bid price and may, if appropriate, consider implementing available options to regain compliance with the Minimum Bid Price Requirement under the NASDAQ Listing Rules.
There were no other material changes from the risk factors previously disclosed in the Company’s Annual Report on Form 10-K for the year ended December 31, 2014.
Item 2. | Unregistered Sales of Equity Securities and Use of Proceeds |
None.
Item 3. | Default Upon Senior Securities |
None.
Item 4. | Mine Safety Disclosures |
Not applicable.
Item 5. Other Information
On July 30, 2015, the Company entered into a First Amendment to Employment Agreement with each of John E. Crisp, Charles C. Forbes, Jr. and L. Melvin Cooper for the purpose of clarifying the confidentiality and non-disclosure obligations under his employment agreement with the Company. Copies of the First Amendment to Employment Agreement for each of John E. Crisp, Charles C. Forbes, Jr. and L. Melvin Cooper are attached hereto as Exhibit 10.1, Exhibit 10.2 and Exhibit 10.3, respectively.
32
Item 6. Exhibits
Number | Description of Exhibits | |||
3.1 | — | Certificate of Formation of Forbes Energy Services Ltd. (including the certificates of designation for the Company’s Series A Preferred Stock and Series B Preferred Stock attached as appendices thereto) (incorporated by reference to Exhibit 3.1 to the Company’s Registration Statement on Form 8-A filed August 12, 2011). | ||
3.2 | — | Amended and Restated Bylaws of Forbes Energy Services Ltd. (incorporated by reference to Exhibit 3.2 to the Company’s Registration Statement on Form 8-A filed August 12, 2011). | ||
3.3 | — | Certificate of Correction to Certificate of Conversion as filed with the Secretary of the State of the State of Texas, effective May 14, 2014 (incorporated by reference to Exhibit 3.3 to the Company's Quarterly Report on Form 10-Q for the quarter ended March 31, 2014 filed May 14, 2014). | ||
4.1 | — | Rights Agreement dated as of May 19, 2008 between Forbes Energy Services Ltd. and CIBC Mellon Trust Company, as Rights Agent, which includes as Exhibit A the Certificate of Designations of Series A Junior Participating Preferred Shares, as Exhibit B the form of Right Certificate and as Exhibit C the form of Summary of Rights to Purchase Shares (incorporated by reference to Exhibit 4.8 to the Company’s Registration Statement on Form S-4/A filed June 27, 2008, Registration No. 333-150853). | ||
4.2 | — | Amendment to Rights Agreement dated as of July 8, 2013 between Forbes Energy Services Ltd. and CIBC Mellon Trust Company, as Rights Agent (incorporated by reference to Exhibit 4.1 to the Company's Current Report on Form 8-K dated July 8, 2013). | ||
4.3 | — | Indenture, dated June 7, 2011 among Forbes Energy Services Ltd., as issuer, the guarantors party thereto and Wells Fargo Bank, N.A., as trustee (incorporated by reference to Exhibit 4.1 to the Company’s Current Report on Form 8-K dated June 7, 2011). | ||
4.4 | — | Amended and Restated Certificate of Designation of the Series B Senior Convertible Preferred Shares (incorporated by reference to Exhibit 4.1 to the Company’s Current Report on Form 8-K filed January 25, 2011). | ||
4.5 | — | Specimen Certificate for the Company’s common stock, $0.04 par value (incorporated by reference to Exhibit 4.2 to the Company’s Registration Statement on Form 8-A filed August 12, 2011). | ||
10.1* | — | First Amendment to the Employment Agreement made effective July 30, 2015 by and between Forbes Energy Services Ltd. and John E. Crisp. | ||
10.2* | — | First Amendment to the Employment Agreement made effective July 30, 2015 by and between Forbes Energy Services Ltd. and Charles C. Forbes, Jr. | ||
10.3* | — | First Amendment to the Employment Agreement made effective July 30, 2015 by and between Forbes Energy Services Ltd. and L. Melvin Cooper. | ||
31.1* | — | Certification of Chief Executive Officer pursuant to Rule 13a-14(a)/15d-14(a). | ||
31.2* | — | Certification of Chief Financial Officer pursuant to Rule 13a-14(a)/15d-14(a). | ||
32.1* | — | Certification of Chief Executive Officer Pursuant to Section 18 U.S.C. Section 1350, as Adopted Pursuant to Section 906 of the Sarbanes-Oxley Act of 2002. | ||
32.2* | — | Certification of Chief Financial Officer Pursuant to Section 18 U.S.C. Section 1350, as Adopted Pursuant to Section 906 of the Sarbanes-Oxley Act of 2002. | ||
101* | — | Interactive Data Files | ||
_________________________
* | Filed herewith. |
33
SIGNATURES
Pursuant to the requirements of the Securities Exchange Act of 1934, as amended, the registrant has duly caused this report to be signed on its behalf by the undersigned, thereunto duly authorized.
FORBES ENERGY SERVICES LTD. | ||||
November 13, 2015 | By: | /s/ JOHN E. CRISP | ||
John E. Crisp Chairman, Chief Executive Officer and President (Principal Executive Officer) | ||||
November 13, 2015 | By: | /S/ L. MELVIN COOPER | ||
L. Melvin Cooper Senior Vice President, Chief Financial Officer and Assistant Secretary (Principal Financial and Accounting Officer) | ||||
34
EXHIBIT INDEX
Number | Description of Exhibits | ||||
3.1 | — | Certificate of Formation of Forbes Energy Services Ltd. (including the certificates of designation for the Company’s Series A Preferred Stock and Series B Preferred Stock attached as appendices thereto) (incorporated by reference to Exhibit 3.1 to the Company’s Registration Statement on Form 8-A filed August 12, 2011). | |||
3.2 | — | Amended and Restated Bylaws of Forbes Energy Services Ltd. (incorporated by reference to Exhibit 3.2 to the Company’s Registration Statement on Form 8-A filed August 12, 2011). | |||
3.3 | — | Certificate of Correction to Certificate of Conversion, as filed with the Secretary of State of the State of Texas, effective May 14, 2014 (incorporated by reference to Exhibit 3.3 to the Company's Quarterly Report on Form 10-Q for the quarter ended March 31, 2014 filed May 14, 2014). | |||
4.1 | — | Rights Agreement dated as of May 19, 2008 between Forbes Energy Services Ltd. and CIBC Mellon Trust Company, as Rights Agent, which includes as Exhibit A the Certificate of Designations of Series A Junior Participating Preferred Shares, as Exhibit B the form of Right Certificate and as Exhibit C the form of Summary of Rights to Purchase Shares (incorporated by reference to Exhibit 4.8 to the Company’s Registration Statement on Form S-4/A filed June 27, 2008, Registration No. 333-150853). | |||
4.2 | — | Amendment to Rights Agreement dated as of July 8, 2013 between Forbes Energy Services Ltd. and CIBC Mellon Trust Company, as Rights Agent (incorporated by reference to Exhibit 4.1 to the Company's Current Report on Form 8-K dated July 8, 2013). | |||
4.3 | — | Indenture, dated June 7, 2011 among Forbes Energy Services Ltd., as issuer, the guarantors party thereto and Wells Fargo Bank, N.A., as trustee (incorporated by reference to Exhibit 4.1 to the Company’s Current Report on Form 8-K dated June 7, 2011). | |||
4.4 | — | Amended and Restated Certificate of Designation of the Series B Senior Convertible Preferred Shares (incorporated by reference to Exhibit 4.1 to the Company’s Current Report on Form 8-K filed January 25, 2011). | |||
4.5 | — | Specimen Certificate for the Company’s common stock, $0.04 par value (incorporated by reference to Exhibit 4.2 to the Company’s Registration Statement on Form 8-A filed August 12, 2011). | |||
10.1* | — | First Amendment to the Employment Agreement made effective July 30, 2015 by and between Forbes Energy Services Ltd. and John E. Crisp. | |||
10.2* | — | First Amendment to the Employment Agreement made effective July 30, 2015 by and between Forbes Energy Services Ltd. and Charles C. Forbes, Jr. | |||
10.3* | — | First Amendment to the Employment Agreement made effective July 30, 2015 by and between Forbes Energy Services Ltd. and L. Melvin Cooper. | |||
31.1* | — | Certification of Chief Executive Officer pursuant to Rule 13a-14(a)/15d-14(a). | |||
31.2* | — | Certification of Chief Financial Officer pursuant to Rule 13a-14(a)/15d-14(a). | |||
32.1* | — | Certification of Chief Executive Officer Pursuant to Section 18 U.S.C. Section 1350, as Adopted Pursuant to Section 906 of the Sarbanes-Oxley Act of 2002. | |||
32.2* | — | Certification of Chief Financial Officer Pursuant to Section 18 U.S.C. Section 1350, as Adopted Pursuant to Section 906 of the Sarbanes-Oxley Act of 2002. | |||
101* | — | Interactive Data Files | |||
_________________________
* | Filed herewith. |
35