Attached files
| file | filename |
|---|---|
| EX-32.2 - EXHIBIT 32.2 - SCANDIUM INTERNATIONAL MINING CORP. | exhibit32-2.htm |
| EX-32.1 - EXHIBIT 32.1 - SCANDIUM INTERNATIONAL MINING CORP. | exhibit32-1.htm |
| EX-31.2 - EXHIBIT 31.2 - SCANDIUM INTERNATIONAL MINING CORP. | exhibit31-2.htm |
| EX-31.1 - EXHIBIT 31.1 - SCANDIUM INTERNATIONAL MINING CORP. | exhibit31-1.htm |
UNITED
STATES
SECURITIES AND EXCHANGE
COMMISSION
Washington, D.C. 20549
FORM 10-Q
[X] QUARTERLY REPORT UNDER SECTION 13 OR 15(d) OF THE SECURITIES EXCHANGE ACT OF 1934
For the quarterly period ended September 30, 2015
[ ] TRANSITION REPORT UNDER SECTION 13 OR 15 (d) OF THE EXCHANGE ACT
For the transition period from _________to
__________________
000-54416
(Commission File Number)
SCANDIUM INTERNATIONAL MINING
CORP.
(Exact name of registrant as specified in its
charter)
| British Columbia, Canada | 98-1009717 |
| (State or other jurisdiction | (IRS Employer |
| of incorporation or organization) | Identification No.) |
1430 Greg Street, Suite 501, Sparks, Nevada
89431
(Address of principal executive offices) (Zip Code)
(775) 355-9500
(Registrant’s telephone
number, including area code)
N/A
(Former name, former address and
former fiscal year, if changed since last report)
Indicate by check mark whether the registrant (1) filed all
reports required to be filed by sections 13 or 15(d) of the Securities and
Exchange Act of 1934 during the preceding 12 months (or for such shorter period
that the registrant was required to file such reports), and (2) has been subject
to such filing requirements for the past 90 days.
Yes
[X] No [ ]
Indicate by check mark whether the registrant has submitted
electronically and posted on its corporate Web site, if any, every Interactive
Data File required to be submitted and posted pursuant to Rule 405 of Regulation
S-T (§232.405 of this chapter) during the preceding 12 months (or for such
shorter period that the registrant was required to submit and post such files).
Yes [X] No [ ]
Indicate by check mark whether the registrant is a large
accelerated filer, an accelerated filer, a non-accelerated filer, or a smaller
reporting company.
Large accelerated filer [ ]
Accelerated filer [ ] Non-accelerated filed
[ ] Smaller reporting company [X]
Indicate by check mark whether the registrant is a shell
company, as defined in Rule 12b-2 of the Exchange Act.
Yes [
] No [X]
Indicate the number of shares outstanding of each of the
registrant’s classes of common stock, as of the latest practicable date:
As of November 12, 2015, the registrant’s outstanding common stock
consisted of 225,047,200 shares.
PART I. FINANCIAL INFORMATION
| Item 1. | Financial Statements |
![]()
UNAUDITED CONDENSED CONSOLIDATED FINANCIAL STATEMENTS
NINE MONTHS AND QUARTER ENDED SEPTEMBER 30, 2015
| Scandium International Mining Corp. |
| CONDENSED CONSOLIDATED BALANCE SHEETS |
| (Expressed in US Dollars) (Unaudited) |
| As at: | September 30, 2015 | December 31, 2014 | ||||
| ASSETS | ||||||
| Current | ||||||
| Cash | $ | 1,153,151 | $ | 417,386 | ||
| Prepaid expenses and receivables | 15,420 | 57,433 | ||||
| Total Current Assets | 1,168,571 | 474,819 | ||||
| Equipment (Note 3) | 3,569 | 6,444 | ||||
| Mineral interests (Note 4) | 3,012,723 | 3,012,723 | ||||
| Total Assets | $ | 4,184,863 | $ | 3,493,986 | ||
| LIABILITIES AND STOCKHOLDERS’ EQUITY | ||||||
| Current | ||||||
| Accounts payable and accrued liabilities | $ | 44,555 | $ | 51,343 | ||
| Accounts payable with related parties | 5,265 | 21,902 | ||||
| Promissory notes payable (Note 6) | - | 2,500,000 | ||||
| Total Liabilities | 49,820 | 2,573,245 | ||||
| Stockholders’ Equity | ||||||
| Capital stock (Note 8)
(Authorized: Unlimited number of shares with no par value; Issued and outstanding: 225,047,200 (2014 – 198,604,790)) |
91,142,335 |
89,186,471 |
||||
| Treasury stock (Note 9) (1,033,333 common shares) | (1,264,194 | ) | (1,264,194 | ) | ||
| Additional paid in capital (Note 8) | 5,284,762 | 2,419,615 | ||||
| Accumulated other comprehensive loss | (853,400 | ) | (853,400 | ) | ||
| Deficit | (90,174,460 | ) | (88,567,751 | ) | ||
| Total Stockholders’ Equity | 4,135,043 | 920,741 | ||||
| Total Liabilities and Stockholders’ Equity | $ | 4,184,863 | $ | 3,493,986 |
Nature and continuance of operations (Note 1)
Subsequent
events (Note 12)
The accompanying notes are an integral part of these condensed consolidated financial statements.
F-2
| Scandium International Mining Corp. |
| CONDENSED CONSOLIDATED STATEMENTS OF |
| OPERATIONS AND COMPREHENSIVE LOSS |
| (Expressed in US Dollars) (Unaudited) |
| Nine months | Nine months | |||||||||||
| Quarter ended | Quarter ended | ended | ended | |||||||||
| September 30, | September 30, | September 30, | September 30, | |||||||||
| 2015 | 2014 | 2015 | 2014 | |||||||||
| EXPENSES | ||||||||||||
| Amortization (Note 3) | $ | 959 | $ | 958 | $ | 2,875 | $ | 2,875 | ||||
| Consulting | 25,500 | 17,000 | 79,000 | 25,500 | ||||||||
| Exploration | 139,946 | 239,372 | 327,758 | 292,763 | ||||||||
| General and administrative | 33,613 | (6,009 | ) | 123,973 | 81,101 | |||||||
| Insurance | 7,351 | 7,604 | 12,396 | 14,052 | ||||||||
| Professional fees | 24,805 | 36,435 | 74,614 | 120,248 | ||||||||
| Salaries and benefits | 114,890 | 128,273 | 347,256 | 315,042 | ||||||||
| Stock-based compensation (Note 8) | 52,851 | 271,126 | 375,864 | 272,292 | ||||||||
| Travel and entertainment | 16,719 | 11,018 | 32,987 | 23,460 | ||||||||
| Loss before other items | (416,634 | ) | (705,777 | ) | (1,376,723 | ) | (1,147,333 | ) | ||||
| OTHER ITEMS | ||||||||||||
| Foreign exchange gain (loss) | 8,727 | (50,240 | ) | (3,844 | ) | (46,116 | ) | |||||
| Interest expense | (95,450 | ) | (23,367 | ) | (226,142 | ) | (79,033 | ) | ||||
| (86,723 | ) | (73,607 | ) | (229,986 | ) | (125,149 | ) | |||||
| Loss and comprehensive loss for the period | $ | (503,357 | ) | $ | (779,384 | ) | $ | (1,606,709 | ) | $ | (1,272,482 | ) |
| Basic and diluted loss per common share | $ | (0.00 | ) | $ | (0.00 | ) | $ | (0.01 | ) | $ | (0.01 | ) |
| Weighted average number of common shares outstanding – basic and diluted | 209,225,377 | 196,207,792 | 202,316,308 | 179,578,362 |
The accompanying notes are an integral part of these condensed consolidated financial statements.
F-3
| Scandium International Mining Corp. |
| CONDENSED CONSOLIDATED STATEMENTS OF CASH FLOWS |
| (Expressed in US Dollars) (Unaudited) |
| Nine months | Nine months | |||||
| ended | ended | |||||
| September 30, | September 30, | |||||
| 2015 | 2014 | |||||
| CASH FLOWS FROM OPERATING ACTIVITIES | ||||||
| Loss for the period | $ | (1,606,709 | ) | $ | (1,272,482 | ) |
| Items not affecting cash: | ||||||
| Amortization | 2,875 | 2,875 | ||||
| Stock-based compensation | 375,864 | 272,292 | ||||
| Changes in non-cash working capital items: | ||||||
| Decrease in prepaids and receivables | 42,013 | 94,740 | ||||
|
Increase (decrease) in accounts payable and accrued liabilities and accounts payable with related parties |
145,837 | (41,959 | ) | |||
| (1,040,120 | ) | (944,534 | ) | |||
| CASH FLOWS FROM INVESTING ACTIVITIES | ||||||
| Restricted cash | - | 149,868 | ||||
| Additions to unproven mineral interests | - | (1,364,031 | ) | |||
| - | (1,214,163 | ) | ||||
| CASH FLOWS FROM FINANCING ACTIVITIES | ||||||
| Common shares issued | 1,812,047 | 1,909,345 | ||||
| Share issuance costs | (60,000 | ) | (33,582 | ) | ||
| Stock options exercised | 23,838 | - | ||||
| Receipt of promissory note | - | 2,500,000 | ||||
| Payment of promissory note and convertible debenture | - | (1,854,875 | ) | |||
| 1,775,885 | 2,520,888 | |||||
| Change in cash during the period | 735,765 | 362,191 | ||||
| Cash, beginning of period | 417,386 | 785,075 | ||||
| Cash, end of period | $ | 1,153,151 | $ | 1,147,266 |
Supplemental disclosure with respect to cash flows (Note 11)
The accompanying notes are an integral part of these condensed consolidated financial statements.
F-4
| Scandium International Mining Corp. |
| CONDENSED CONSOLIDATED STATEMENTS OF CHANGES IN STOCKHOLDERS’ EQUITY |
| (Expressed in US Dollars) (Unaudited) |
| Capital Stock | |||||||||||||||||||||
| Accumulated | |||||||||||||||||||||
| Other | |||||||||||||||||||||
| Comprehensive | |||||||||||||||||||||
| Additional | Loss (Foreign | ||||||||||||||||||||
| Number of | Paid in | Treasury | Currency | ||||||||||||||||||
| Shares | Amount | Capital | Stock | Translation) | Deficit | Total | |||||||||||||||
| $ | $ | $ | $ | $ | $ | ||||||||||||||||
| Balance, December 31, 2013 | 165,358,337 | 87,310,708 | 2,108,327 | (1,264,194 | ) | (853,400 | ) | (86,718,095 | ) | 583,346 | |||||||||||
| Private placements | 33,246,453 | 1,909,345 | - | - | - | - | 1,909,345 | ||||||||||||||
| Share issue costs | - | (33,582 | ) | - | - | - | - | (33,582 | ) | ||||||||||||
| Stock-based compensation | - | - | 311,288 | - | - | - | 311,288 | ||||||||||||||
| Loss for the year | - | - | - | - | - | (1,849,656 | ) | (1,849,656 | ) | ||||||||||||
| Balance, December 31, 2014 | 198,604,790 | 89,186,471 | 2,419,615 | (1,264,194 | ) | (853,400 | ) | (88,567,751 | ) | 920,741 | |||||||||||
| Private placements | 23,654,930 | 1,812,047 | - | - | - | - | 1,812,047 | ||||||||||||||
| Shares issued in settlement of debt | 2,237,480 | 169,262 | - | - | - | - | 169,262 | ||||||||||||||
| Share issue costs | - | (60,000 | ) | - | - | - | - | (60,000 | ) | ||||||||||||
| Stock options exercised | 550,000 | 34,555 | (10,717 | ) | - | - | - | 23,838 | |||||||||||||
| Stock-based compensation | - | - | 375,864 | - | - | - | 375,864 | ||||||||||||||
| Sale of 20% of Australian subsidiary | - | - | 2,500,000 | - | - | - | 2,500,000 | ||||||||||||||
| Loss for the period | - | - | - | - | - | (1,606,709 | ) | (1,606,709 | ) | ||||||||||||
| Balance, September 30, 2015 | 225,047,200 | 91,142,335 | 5,284,762 | (1,264,194 | ) | (853,400 | ) | (90,174,460 | ) | 4,135,043 | |||||||||||
The accompanying notes are an integral part of these condensed consolidated financial statements.
F-5
| Scandium International Mining Corp. |
| NOTES TO THE CONDENSED CONSOLIDATED FINANCIAL STATEMENTS |
| September 30, 2015 |
| (Expressed in US Dollars) |
| 1. | NATURE AND CONTINUANCE OF OPERATIONS |
Scandium International Mining Corp. (the “Company”) is a specialty metals and alloys company focusing on scandium and other specialty metals.
The Company was incorporated under the laws of the Province of British Columbia, Canada in 2006. The Company currently trades on the Toronto Stock Exchange under the symbol “SCY”.
The Company’s focus is on the exploration and evaluation of its specialty metals assets, specifically the Nyngan scandium deposit located in New South Wales, Australia and the Tørdal scandium/rare earth minerals deposit in Norway. In June 2014, the Company made the final installment payment to acquire the Nyngan property. The Company is an exploration stage company and anticipates incurring significant additional expenditures prior to production at any and all of its properties.
In Q3 2015, the Company exchanged a $2,500,000 loan for a 20% interest in its Australian subsidiary which holds the Nyngan and Honeybugle properties. Accordingly, the Company holds an 80% interest in its Australian subsidiary as at period end. The full $2,500,000 has been reflected in additional paid in capital.
These condensed consolidated financial statements have been prepared on a going concern basis that contemplates the realization of assets and discharge of liabilities at their carrying values in the normal course of business for the foreseeable future. These financial statements do not reflect any adjustments that may be necessary if the Company is unable to continue as a going concern.
The Company currently earns no operating revenues and will require additional capital in order to advance both the Nyngan and Tørdal properties. The Company’s ability to continue as a going concern is uncertain and is dependent upon the generation of profits from mineral properties, obtaining additional financing and maintaining continued support from its shareholders and creditors. These are material uncertainties that raise substantial doubt about the Company’s ability to continue as a going concern. In the event that additional financial support is not received or operating profits are not generated, the carrying values of the Company’s assets may be adversely affected.
| 2. | BASIS OF PRESENTATION |
Basis of presentation
The accompanying unaudited interim condensed consolidated financial statements have been prepared in accordance with the rules and regulations of the Securities and Exchange Commission (“SEC”). The interim condensed consolidated financial statements include the consolidated accounts of the Company and its wholly-owned subsidiaries with all significant intercompany transactions eliminated. In the opinion of management, all adjustments necessary for a fair statement of the consolidated financial position, results of operations and cash flows for the interim periods have been made. Certain information and footnote disclosures normally included in the consolidated financial statements prepared in accordance with generally accepted accounting principles of the United States of America (“US GAAP”) have been condensed or omitted pursuant to such SEC rules and regulations. These interim condensed consolidated financial statements should be read in conjunction with the audited consolidated financial statements for the year ended December 31, 2014 and with our Annual Report on Form 10-K filed with the SEC on February 27, 2015. Operating results for the nine month period ended September 30, 2015 may not necessarily be indicative of the results for the year ending December 31, 2015.
Use of estimates
The preparation of interim condensed consolidated financial statements in conformity with US GAAP requires management to make estimates and assumptions that affect the reported amounts of assets and liabilities and the disclosure of contingent assets and liabilities at the date of the financial statements and the reported amounts of expenses during the reporting period. The Company regularly evaluates estimates and assumptions related to the deferred income tax asset valuations, asset impairment, stock-based compensation and loss contingencies. The Company bases its estimates and assumptions on current facts, historical experience and various other factors that it believes to be reasonable under the circumstances, the results of which form the basis for making judgments about the other sources. The actual results experienced by the Company may differ materially and adversely from the Company’s estimates. To the extent there are material differences between estimates and the actual results, future results of operations will be affected.
Fair value of financial assets and liabilities
The Company measures the fair value of financial assets and liabilities based on US GAAP guidance which defines fair value, establishes a framework for measuring fair value, and expands disclosures about fair value measurements.
The Company classifies financial assets and liabilities as held-for-trading, available-for-sale, held-to-maturity, loans and receivables or other financial liabilities depending on their nature. Financial assets and financial liabilities are recognized at fair value on their initial recognition, except for those arising from certain related party transactions which are accounted for at the transferor’s carrying amount or exchange amount.
Financial assets and liabilities classified as held-for-trading are measured at fair value, with gains and losses recognized in net income. Financial assets classified as held-to-maturity, loans and receivables, and financial liabilities other than those classified as held-for-trading are measured at amortized cost, using the effective interest method of amortization. Financial assets classified as available-for-sale are measured at fair value, with unrealized gains and losses being recognized as other comprehensive income until realized, or if an unrealized loss is considered other than temporary, the unrealized loss is recorded in income.
F-6
| Scandium International Mining Corp. |
| NOTES TO THE CONDENSED CONSOLIDATED FINANCIAL STATEMENTS |
| September 30, 2015 |
| (Expressed in US Dollars) |
| 2. | BASIS OF PRESENTATION (cont’d…) |
Financial instruments, including receivables, accounts payable and accrued liabilities, accounts payable with related parties, convertible debentures and promissory notes payable are carried at amortized cost, which management believes approximates fair value due to the short term nature of these instruments.
The following table presents information about the assets that are measured at fair value on a recurring basis as at September 30, 2015, and indicates the fair value hierarchy of the valuation techniques the Company utilized to determine such fair value. In general, fair values determined by Level 1 inputs utilize quoted prices (unadjusted) in active markets for identical assets. Fair values determined by Level 2 inputs utilize data points that are observable such as quoted prices, interest rates and yield curves. Fair values determined by Level 3 inputs are unobservable data points for the asset or liability, and included situations where there is little, if any, market activity for the asset:
| Quoted Prices | Significant Other | Significant | |||||||||||
| September 30, | in Active Markets | Observable Inputs | Unobservable Inputs | ||||||||||
| 2015 | (Level 1) | (Level 2) | (Level 3) | ||||||||||
| Assets: | |||||||||||||
| Cash | $ | 1,153,151 | $ | 1,153,151 | $ | — | $ | — | |||||
| Total | $ | 1,153,151 | $ | 1,153,151 | $ | — | $ | — |
The fair values of cash are determined through market, observable and corroborated sources.
Recently Issued Accounting Standards
Accounting Standards Update 2014-15 – Presentation of Financial Statements – Going Concern (Subtopic 205-40). This accounting pronouncement provides guidance in GAAP about management’s responsibility to evaluate whether there is substantial doubt about an entity’s ability to continue as a going concern and to provide related footnote disclosures. In doing so, the amendments should reduce diversity in the timing and content of footnote disclosures. The policy is effective December 15, 2016. The Company is evaluating this guidance and believes it will have little impact on the presentation of its financial statements.
Accounting Standards Update 2015-01 - Income Statement—Extraordinary and Unusual Items (Subtopic 225-20). This Update is part of an initiative to reduce complexity in accounting standards (the Simplification Initiative). This Update eliminates from GAAP the concept of extraordinary items. The amendments in this Update are effective for fiscal years, and interim periods within those fiscal years, beginning after December 15, 2015. The Company is evaluating this guidance and believes it will have little impact on the presentation of its financial statements.
Accounting Standards Update 2015-02 - Consolidation (Topic 810) - Amendments to the Consolidation Analysis. This update provides guidance with respect to the analysis that a reporting entity must perform to determine whether it should consolidate certain types of legal entities. The amendments in this Update are effective for public business entities for fiscal years, and for interim periods within those fiscal years, beginning after December 15, 2015. The Company is evaluating this guidance and believes it will have little impact on the presentation of its financial statements.
| 3. | EQUIPMENT |
| December 31, | Additions | September 30, | |||||||||||
| 2014 Net Book | (disposals) | Amortization | 2015 Net Book | ||||||||||
| Value | (write-offs) | Value | |||||||||||
| Computer equipment | $ | 1,696 | $ | - | $ | (508 | ) | $ | 1,188 | ||||
| Office equipment | 4,748 | - | (2,367 | ) | 2,381 | ||||||||
| Equipment | $ | 6,444 | $ | - | $ | (2,875 | ) | $ | 3,569 |
| December 31, | Additions | December 31, | |||||||||||
| 2013 Net Book | (disposals) | 2014 Net Book | |||||||||||
| Value | (write-offs) | Amortization | Value | ||||||||||
| Computer equipment | $ | 2,375 | $ | - | $ | (679 | ) | $ | 1,696 | ||||
| Office equipment | 7,903 | - | (3,155 | ) | 4,748 | ||||||||
| Equipment | $ | 10,278 | $ | - | $ | (3,834 | ) | $ | 6,444 |
F-7
| Scandium International Mining Corp. |
| NOTES TO THE CONDENSED CONSOLIDATED FINANCIAL STATEMENTS |
| September 30, 2015 |
| (Expressed in US Dollars) |
| 4. | MINERAL INTERESTS |
| Scandium and | |||
| other | |||
| Acquisition costs | |||
| Balance, December 31, 2013 | $ | 1,613,203 | |
| Additions | 1,399,520 | ||
| Balance December 31, 2014 and September 30, 2015 | $ | 3,012,723 |
Title to mineral property interests involves certain inherent risks due to the difficulties of determining the validity of certain claims as well as the potential for problems arising from the frequently ambiguous conveyancing history characteristic of many mineral property interests. The Company has investigated title to all of its mineral property interests and, to the best of its knowledge, title to all of its properties is in good standing.
SCANDIUM PROPERTIES
Nyngan, New South Wales Property
On February 5, 2010, the Company entered in to an earn-in agreement with Jervois Mining Limited (“Jervois”), whereby it would acquire a 50% interest in the Nyngan Scandium property (the “Nyngan Project”) located in New South Wales, Australia. The JV Agreement, as amended, gave the Company the right to earn a 50% interest in a joint venture with Jervois, for the purpose of holding and developing the Nyngan Project. On June 22, 2012, the Company received notice of a lawsuit filed against the Company with regard to the achievement of certain milestones required under the JV Agreement. On February 6, 2013, the Company announced agreement of an out of court settlement to the dispute with Jervois. The terms of the settlement transferred 100% ownership and control of the Nyngan Project to the Company, in return for AUD$2.6 million cash payments and a percentage royalty payable to Jervois on sales of product from the project. A total of $1,108,484 (AUD$1.2 million) was paid in June 2013 as part of the settlement. A total of $1,364,031 (AUD$1.4 million) was paid in June 2014 to fulfill the obligations under the settlement agreement which gives 100% of the property to the Company. During Q3 2015, the Company exchanged a $2,500,000 loan for a 20% interest in its Australian subsidiary which holds title to both the Nyngan and Honeybugle properties. The subsidiary has had no transactions in the past or during the period ended September 30, 2015 and therefore has $Nil shareholders’ equity. Accordingly there is $Nil non-controlling interest associated with the disposal on the date of the exchange and as at September 30, 2015.
Royalties attached to the Nyngan property include a 1.5% Net Profits Interest royalty to private parties involved with the early exploration on the property, and a 1.7% Net Smelter Returns royalty payable to Jervois for 12 years after production commences, subject to terms in the settlement agreement. Another revenue royalty is payable to private interests of 0.2%, subject to a $370,000 cap. A NSW minerals royalty will also be levied on the project, subject to negotiation, currently 4% on revenue.
Honeybugle property, Australia
In April of 2014 the Company also acquired an exploration license referred to as the Honeybugle property, a prospective scandium exploration property located 24 kilometers from the Nyngan Project. As described in the previous Nyngan Property section, during Q3 2015, the Company exchanged a $2,500,000 loan for a 20% interest in its Australian subsidiary which holds title to both the Nyngan and Honeybugle properties.
Tørdal and Evje-Iveland properties, Norway
During 2012 the Company entered into an option agreement with REE Mining AS (“REE”) to earn up to a 100% interest in the Tørdal and Evje-Iveland properties pursuant to which the Company paid $130,000 and issued 1,000,000 common shares valued at $40,000. To earn its interest, the original agreement required the Company to pay REE an additional $500,000, incur $250,000 of exploration work and issue 250,000 common shares upon releasing the second of two full feasibility studies on the two properties. The Company subsequently renegotiated the payments required to earn the interest and the Evje-Iveland property was removed from the option agreement. Pursuant to the amendment, the Company earned a 100% interest in the Tørdal property by paying an additional $35,000 and granting a 1% Net Smelter Return (“NSR”) payable to REE.
| 5. | CONVERTIBLE DEBENTURES |
On February 22, 2013, the Company completed a $650,000 loan financing consisting of convertible debentures. The convertible debenture had a maturity date of February 22, 2014 and bore interest at 10% per annum. The lenders had the option to convert the loan into 13,000,000 common shares of the Company. This financing was repaid in full in February 2014.
F-8
| Scandium International Mining Corp. |
| NOTES TO THE CONDENSED CONSOLIDATED FINANCIAL STATEMENTS |
| September 30, 2015 |
| (Expressed in US Dollars) |
| 6. | PROMISSORY NOTES PAYABLE |
| September | December 31, | |||||||
| 30, 2015 | 2014 | |||||||
| On June 24, 2014, the Company completed a $2,500,000 loan financing which includes a convertible feature. The loan had a maturity date of December 24, 2015 and bore loan interest that increases in quarterly increments from 4% to a maximum of 12% with a 5% interest rate penalty should the Company not pay on due dates. The full loan was converted into a 20% interest in the Company’s Australian subsidiary in August of 2015. This conversion feature converted at the lender’s option or once the Company raised $3,000,000 in equity. The minority shareholder now has a carried interest until the Company meets two milestones: (1) filing a feasibility study on SEDAR, and (2) receiving a mining license on either the Nyngan or Honeybugle property. The minority shareholder becomes fully participating on development and build costs thereafter. The minority shareholder has an option to convert their 20% non-controlling interest into equivalent value of the Company’s shares, at market prices, rather than participate in construction. The minority shareholder’s option to convert its project interest to the Company’s shares is a one-time option, at such time the partner becomes fully participating on project costs. | $ | Nil | $ | 2,500,000 | ||||
| On June 24, 2013 the Company completed a $1,204,875 financing consisting of a series of insider and non-insider loans. The loans had a maturity date in June 2014 and bore interest at 10% per annum. This financing was paid in full in June 2014. | $ | Nil | $ | Nil | ||||
| $ | - | $ | 2,500,000 |
| 7. | RELATED PARTY TRANSACTIONS |
The loan financing completed on February 22, 2013, of which $350,000 was contributed from directors and officers was repaid in the three months ending March 31, 2014. |
|
During the nine month period ended September 30, 2015, the Company incurred a consulting fee of $79,000 from one of its directors. During the nine month period ended September 30, 2014, the Company incurred a consulting fee of $25,500 from one of its directors. |
|
Of the $79,033 interest expensed in the nine month period ended September 30, 2014, $14,375 was payable to a director of the Company. There was no interest paid to related parties in the nine month period ended September 30, 2015. |
|
During the nine month period ended September 30, 2015, the Company expensed $235,972 for stock-based compensation for stock options issued to Company directors. During the nine month period ended September 30, 2014, the Company expensed $211,999 for stock options issued to Company directors. |
|
| 8. | CAPITAL STOCK AND ADDITIONAL PAID IN CAPITAL |
On September 1, 2015, the Company issued 1,982,850 common shares at a value of C$0.10 per common share for total proceeds of C$198,285 ($150,000). |
|
On August 31, 2015, the Company issued 2,237,480 common shares at a value of C$0.10 per common share for in settlement of interest payable on the promissory note (Note 6) with a fair value of C$223,748 ($169,262). |
|
On August 24, 2015, the Company issued 21,672,080 common shares at a value of C$0.10 per common share for total proceeds of C$2,167,208 ($1,662,047). The Company paid $60,000 in share issuance costs with regard to this common share issue. |
|
On August 26, 2014, the Company issued 5,534,411 common shares at a value of C$0.085 per common share for total proceeds of C$470,425 ($429,900). |
|
On July 11, 2014, the Company issued 4,641,236 common shares at a value of C$0.085 per common share for total proceeds of C$394,505 ($368,325). |
|
On June 26, 2014, the Company issued 10,415,396 common shares at a value of C$0.085 per common share for total proceeds of C$885,309 ($825,433). |
|
On April 24, 2014, the Company issued 4,122,150 common shares at a value of C$0.025 per common share for total proceeds of C$103,053 ($93,687). |
F-9
| Scandium International Mining Corp. |
| NOTES TO THE CONDENSED CONSOLIDATED FINANCIAL STATEMENTS |
| September 30, 2015 |
| (Expressed in US Dollars) |
On March 25, 2014, the Company issued 8,533,260 common shares at a value of C$0.025 per common share for total proceeds of C$213,332 ($192,000).
During the year ended December 31, 2014, the Company incurred $33,582 in share issuance costs.
| 8. | CAPITAL STOCK AND ADDITIONAL PAID IN CAPITAL (cont’d…) |
Stock Options and Warrants
The Company established a stock option plan (the “Plan”) under which it is authorized to grant options to executive officers and directors, employees and consultants and the number of options granted under the Plan shall not exceed 15% of the shares outstanding. Under the Plan, the exercise period of the options may not exceed five years from the date of grant and vesting is determined by the Board of Directors.
Stock option and share purchase warrant transactions are summarized as follows:
| Warrants | Stock Options | ||||||||||||
| Weighted | |||||||||||||
| average exercise | Weighted average | ||||||||||||
| price in | exercise price in | ||||||||||||
| Number | Canadian $ | Number | Canadian $ | ||||||||||
| Outstanding, December 31, 2013 | 3,750,000 | $ | 0.20 | 14,168,750 | $ | 0.12 | |||||||
| Granted | - | - | 3,725,000 | 0.12 | |||||||||
| Cancelled | (3,750,000 | ) | 0.20 | (2,515,000 | ) | 0.17 | |||||||
| Exercised | - | - | - | - | |||||||||
| Outstanding, December 31, 2014 | - | - | 15,378,750 | 0.11 | |||||||||
| Granted | - | - | 5,350,000 | 0.14 | |||||||||
| Cancelled | - | - | (2,068,750 | ) | 0.17 | ||||||||
| Exercised | - | - | (550,000 | ) | 0.05 | ||||||||
| Outstanding, September 30, 2015 | - | $ | - | 18,110,000 | $ | 0.12 | |||||||
| Number currently exercisable | - | $ | - | 16,860,000 | $ | 0.11 | |||||||
As at September 30, 2015, incentive stock options were outstanding as follows:
| Exercise | ||||||||||
| Number of | Price in | |||||||||
| options | Canadian $ | Expiry Date | ||||||||
| Options | ||||||||||
| 4,800,000 | 0.100 | November 5, 2015 (Note 12) | ||||||||
| 250,000 | 0.315 | May 4, 2016 | ||||||||
| 500,000 | 0.250 | May 16, 2016 | ||||||||
| 300,000 | 0.155 | September 15, 2016 | ||||||||
| 2,285,000 | 0.080 | April 24, 2017 | ||||||||
| 150,000 | 0.120 | July 25, 2017 | ||||||||
| 1,400,000 | 0.070 | August 8, 2017 | ||||||||
| 1,000,000 | 0.100 | May 9, 2018 | ||||||||
| 3,375,000 | 0.120 | July 25, 2019 | ||||||||
| 200,000 | 0.100 | December 30, 2019 | ||||||||
| 3,450,000 | 0.140 | April 17, 2020 | ||||||||
| 400,000 | 0.115 | August 28, 2020 | ||||||||
| 18,110,000 |
As at September 30, 2015 the Company’s outstanding and exercisable stock options have an aggregate intrinsic value of $524,946 (December 31, 2014 - $106,501).
As at September 30, 2015, there were no warrants outstanding.
Stock-based compensation
During the nine months ended September 30, 2015, the Company recognized stock-based compensation of $375,864 (September 30, 2014 - $272,292) in the statement of operations and comprehensive loss as a result of incentive stock options granted and vested in the current period. There were 5,350,000 stock options granted during the nine months ended September 30, 2015 (September 30, 2014 – 3,525,000).
F-10
| Scandium International Mining Corp. |
| NOTES TO THE CONDENSED CONSOLIDATED FINANCIAL STATEMENTS |
| September 30, 2015 |
| (Expressed in US Dollars) |
The weighted average fair value of the options granted in the period was C$0.14 (2014 - C$0.11) .
| 8. | CAPITAL STOCK AND ADDITIONAL PAID IN CAPITAL (cont’d…) |
The fair value of all compensatory options and warrants granted is estimated on grant date using the Black-Scholes option pricing model. The weighted average assumptions used in calculating the fair values are as follows:
| 2015 | 2014 | |||||
| Risk-free interest rate | 1.02% | 0.86% | ||||
| Expected life | 5 years | 4.9 years | ||||
| Volatility | 145.72% | 148.81% | ||||
| Forfeiture rate | N/A | N/A | ||||
| Dividend rate | N/A | N/A |
| 9. | TREASURY STOCK |
| Number | Amount | ||||||
| Treasury shares, September 30, 2015 and December 31 2014 | 1,033,333 | $ | 1,264,194 | ||||
| 1,033,333 | $ | 1,264,194 |
Treasury shares comprise shares of the Company which cannot be sold without the prior approval of the TSX.
| 10. | SEGMENTED INFORMATION |
The Company’s mineral properties are located in Norway and Australia. The Company’s capital assets’ geographic information is as follows:
| September 30, 2015 | Norway | Australia | United States | Total | |||||||||
| Equipment | $ | - | $ | - | $ | 3,569 | $ | 3,569 | |||||
| Mineral interests | 238,670 | 2,774,053 | - | 3,012,723 | |||||||||
| $ | 238,670 | $ | 2,774,053 | $ | 3,569 | $ | 3,016,292 | ||||||
| December 31, 2014 | Norway | Australia | United States | Total | |||||||||
| Equipment | $ | - | $ | - | $ | 6,444 | $ | 6,444 | |||||
| Mineral interests | 238,670 | 2,774,053 | - | 3,012,723 | |||||||||
| $ | 238,670 | $ | 2,774,053 | $ | 6,444 | $ | 3,019,167 |
| 11. | SUPPLEMENTAL DISCLOSURE WITH RESPECT TO CASH FLOWS |
| 2015 | 2014 | ||||||
| Cash paid during the first nine months for interest | $ | 56,250 | $ | 79,033 | |||
| Cash paid during the first nine months for income taxes | $ | - | $ | - |
In the nine months ending September 30, 2015 the Company exchanged a loan of $2,500,000 for a 20% interest in its Australian subsidiary which hold both the Nyngan and Honeybugle properties. The Company issued 2,237,480 common shares at a value of $169,262 in settlement of accounts payable and accrued liabilities. In the nine month period ending September 30, 2014 there were no significant non-cash transactions.
F-11
| Scandium International Mining Corp. |
| NOTES TO THE CONDENSED CONSOLIDATED FINANCIAL STATEMENTS |
| September 30, 2015 |
| (Expressed in US Dollars) |
| 12. | SUBSEQUENT EVENTS |
On October 14, 2015, the Company announced that it has received US$2.07M (C$2.7M) from a private investor in return for the granting of a 0.7% royalty on gross mineral sales from both the Nyngan property and the Honeybugle property, in NSW, Australia. |
-
Royalty Highlights:
- US$2.07M cash proceeds received from sale of royalty
- The royalty consists of a 0.7% gross sales royalty on both the Nyngan and adjacent Honeybugle properties, payable quarterly,
- The royalty covers all minerals produced and sold from both properties, with no caps, minimums, term limits or early buyout provisions, and
- The Company has retained all rights to commence and operate mining projects on both properties, and adjust land holdings, on a commercial basis as defined by management, consistent with other existing private and State royalties on the properties.
At the Company’s Annual General Meeting held on October 28, 2015, the shareholder’s approved a motion to extend the 4,800,000 C$0.10 options set to expire on November 5, 2015 to November 5, 2020.
F-12
| Item 2. | Management’s Discussion and Analysis of Financial Condition and Results of Operations |
The following discussion of the operating results, corporate activities and financial condition of Scandium International Mining Corp. (hereinafter referred to as “we”, “us”, “SCY”, “Scandium”, “Scandium International” or the “Company”) and its subsidiaries provides an analysis of the operating and financial results for the three and nine month periods ended September 30, 2015 and should be read in conjunction with our unaudited interim consolidated financial statements and the notes thereto for the nine month period ended September 30, 2015, and with the Company’s audited consolidated financial statements and the notes thereto for the year ended December 31, 2014 (the “Annual Statements”).
The interim statements have been prepared in accordance with US Generally Accepted Accounting Principles (“US GAAP”) as required under U.S. federal securities laws applicable to the Company, and as permitted under applicable Canadian securities laws. The Company is a reporting company under applicable securities laws in Canada and the United States. The reporting currency used in our financial statements is the United States Dollar.
The information contained within this report is current as of November 12, 2015 unless otherwise noted. Additional information relevant to the Company’s activities can be found on SEDAR at www.sedar.com and on EDGAR at www.sec.gov.
Technical information in this MD&A has been reviewed and approved by Willem Duyvesteyn, a Qualified Person as defined by Canadian National Instrument 43-101 (“NI 43-101”). Mr. Duyvesteyn is a director and consultant of Scandium International.
Scandium International Corporate Overview
Scandium International is a specialty metals and alloys company focusing on scandium and other specialty metals. The Company intends to utilize its knowhow and, in certain instances, patented technologies to maximize opportunities in scandium and other specialty metals.
The Company was formed in 2006, under the name Golden Predator Mines Inc. As part of a reorganization and spin-out of the Company’s precious metals portfolio in March 2009, the Company changed its name to EMC Metals Corp. In order to reflect our emphasis on mining for scandium minerals, effective November 19, 2014, we changed our name to Scandium International Mining Corp. The Company currently trades on the Toronto Stock Exchange (the “TSX”) under the symbol “SCY”.
Our focus of operations is the exploration and development of the Nyngan scandium deposit located in New South Wales (“NSW”), Australia. We also hold an exploration stage property in Norway, known as the Tørdal scandium/rare earth minerals property.
On February 5, 2010, the Company entered into a Joint Venture Agreement (“JV Agreement”) with Jervois Mining Limited of Melbourne, Australia (ASX: JRV) (“Jervois”) to develop the Nyngan scandium property in NSW, Australia (“Nyngan”). The JV Agreement, came into dispute in February 2012, and was settled by the parties in February of 2013. That settlement provided for Scandium International to acquire 100% of the Nyngan project for A$2.6 million cash, in two installments. We have met the total payment obligation and now own 100% of the project.
During the first three quarters of 2015, we focused on Nyngan project activities including scandium marketing arrangements, refining our Nyngan project process flowsheet, analysis of Nyngan project site drilling performed during the fourth quarter of 2014, and processing the selection of a qualified engineering firm to perform a feasibility study during 2015.
During Q3 of 2015, the Company converted a $2,500,000 loan into a 20% minority interest in its Australian subsidiary.
Principal Properties Review
Nyngan Scandium Project (NSW, Australia)
On February 5, 2010, SCY entered into the JV Agreement with Jervois to co-develop Nyngan. The JV Agreement gave SCY the right to earn a 50% interest in a joint venture with Jervois for the purpose of holding and developing Nyngan, provided SCY met certain technical and financial milestones. SCY met all financial requirements and delivered evidence of technical milestone achievement to Jervois on February 24, 2012.
On February 27, 2012, Jervois formally rejected SCY’s claim to have met the earn-in conditions specified in the JV. The parties discussed and successfully reached an agreed settlement in February 2013 that resolved all issues in dispute. The terms of the binding settlement provided for the transfer of 100% ownership and control of Nyngan, including the relevant exploration tenements and surface (freehold) land holdings, to the Company, in return for A$2.6 million in future cash payments. The settlement agreement also applied a production royalty on the Nyngan project of 1.7% of sales for products produced from the site, payable to Jervois. The royalty has a 12 year term from first production date, and a minimum royalty calculated on the basis of sales in that year of 10 tonnes of scandium oxide.
In June of 2014, the Company completed the second of two settlement payments required under its agreement with Jervois. Formal transfer of the Nyngan exploration licenses to SCY’s Australian subsidiary has been completed.
With regard to the payoff of Jervois settlement payments, on June 24, 2014, SCY entered into a $2.5 million loan facility with Scandium Investments LLC (“SIL”), a company owned by a US private investor group (the “2014 Loan”). The proceeds of the 2014 Loan were applied to pay an A$1.3 million final payment to Jervois in order for SCY to acquire a 100% interest in Nyngan (pursuant to the terms of a settlement agreement with Jervois entered into in February of 2013). The balance of the proceeds of the 2014 Loan was applied to repay $1.2 million in maturing debt. The 2014 Loan had a maturity date of December 24, 2015.
In accordance with the terms of the 2014 Loan, the outstanding principal and interest automatically convert into an effective 20% joint venture interest in both our Nyngan and Honeybugle scandium projects at the time the Company meets a funding milestone (defined as raising $3.0 million in equity). The funding milestone was met on August 24, 2015 and the 2014 Loan has converted into an effective 20% joint venture interest in the Nyngan and Honeybugle scandium projects. The joint venture partner, SIL, now has a carried interest in the project until the Company meets two development milestones: (1) filing a feasibility study on SEDAR, and (2) receiving a mining license on either joint venture property. At such time as the two development milestones are met, the joint venture partner becomes fully participating on project costs thereafter.
Completion of the development milestones by the Company, as described above, activates a second onetime, limited period option for the joint venture partner to elect to convert the fair market value of its 20% joint venture interest in the Nyngan and Honeybugle scandium projects into an equivalent value of the Company’s common shares, at then prevailing market prices, rather than continue with ownership at the project level.
Substantial Nyngan project metallurgical test work has been completed, and additional work in this area is planned for 2015. The Company has engaged the engineering firm Lycopodium Minerals Pty Ltd, of Brisbane, QLD, Australia, to prepare a Definitive Feasibility Study ("DFS") on the project. The work is expected to be completed in the first quarter of 2016. The DFS will include all elements of project description and design to generate an economic report suitable for seeking project construction financing in 2016.
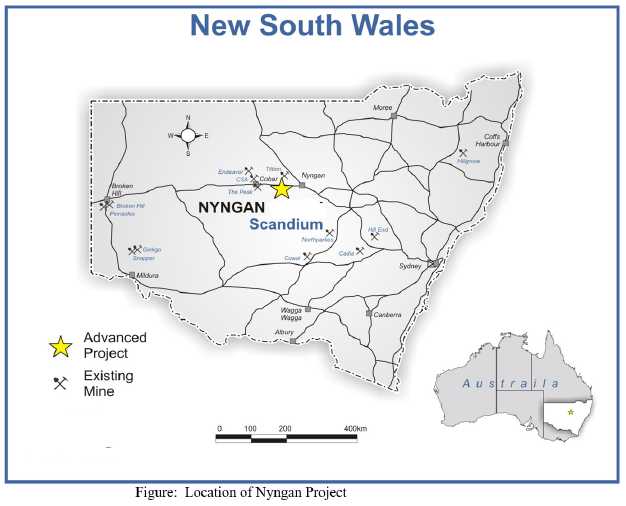
Nyngan Property Description and Location
The Nyngan project site is located approximately 450 kilometres northwest of Sydney, NSW, Australia and approximately 20 kilometres due west of the town of Nyngan, a rural town of approximately 2900 people. The deposit is located 5 kilometres south of Miandetta, off the Barrier Highway that connects the town of Nyngan to the town of Cobar. The license area can be reached via the paved Barrier Highway, which allows year-round access, but final access to the site itself is reached by clay farm tracks. The general area can be characterized as flat countryside and is classified as agricultural land, used predominantly for wheat farming and livestock grazing. Infrastructure in the area is good, with available water and electric power in close proximity to the property boundaries.
The Nyngan property is classified as an Australia Property for purposes of financial statement segment information.
The scandium resource is hosted within the lateritic zone of the Gilgai Intrusion, one of several Alaskan-type mafic and ultramafic bodies that intrude Cambrian-Ordovician metasediments collectively called the Girilambone Group. The laterite zone, locally up to 40 meters thick, is layered with hematitic clay at the surface followed by limonitic clay, saprolitic clay, weathered bedrock and finally fresh bedrock. The scandium mineralization is concentrated within the hematitic, limonitic, and saprolitic zones with values up to 350 ppm scandium.
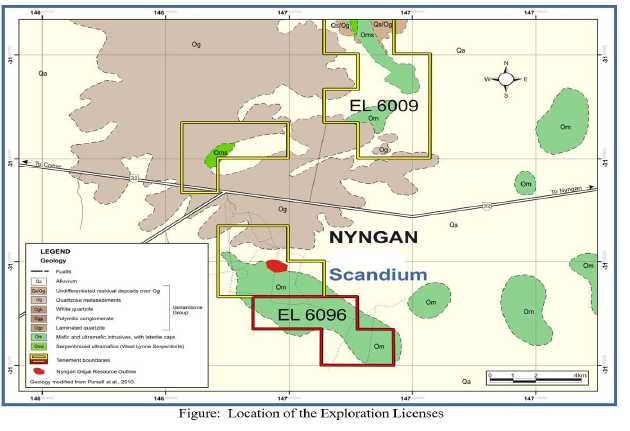
The specific location of the exploration licenses that we may earn an interest in are provided in Figure 2 below.
Nyngan Project Metallurgy Development
The first work phase of the metallurgy development program consisted of detailed metallurgical bench scale testing, and was intended to refine and enhance the Company’s existing material process flow sheet to extract scandium from the resource material. This existing flow sheet, developed by Jervois and external consultants, formed the basis of a preliminary, conceptual engineering report for the processing elements of the project that was completed by Roberts & Schaefer of Salt Lake City, Utah, specifically for use by SCY management.
The Roberts & Schaefer report included capital and operating cost estimates, based on process flow sheets and technical reports previously done for Jervois or SCY on various metallurgical aspects of the resource. These technical/process reports included work done by METCON, the CSIRO, and by others, proprietary to or sourced by Jervois or SCY. The bulk of the process applied by Roberts & Schaefer in their Report was defined by bench scale as well as small scale pilot plant work results compiled by others, and a preliminary flow sheet complied by the CSIRO.
This early stage Roberts & Schaefer Report was carried forward into the later metallurgical test work subsequently conducted by Hazen Research, Inc., of Golden, Colorado, USA and the design work utilized in the SNC- Lavalin economic study presented to management in 2012.
In January 2011, SCY announced results of initial lab test work, independently prepared by Hazen Research. These results defined general results involving conventional contained acid leach systems and suggested recoveries from resources of up to 75%. No secondary recoveries were considered in these initial bench-scale tests.
The second phase of the Hazen test work program continued through July 2011and involved continuous pilot plant testing of the acid leach systems, solvent extraction systems and product finish systems identified by earlier CSIRO work. The overall objectives of the test work program were to define and optimize a process or series of processes that achieves an 80% scandium recovery, lowest possible capital and operating costs, and most benign environmental impact, using standard and accepted processes.
On January 19, 2012 we announced receipt of an independent metallurgical test-work report titled "Purification of Scandium Extracted from Laterite Ore", outlining the results of a number of pilot-scale tests on Nyngan resource material and estimated recoveries and grades of scandium oxide product. The report was independently prepared by Hazen and is the final report in a series of three phases of semi-continuous pilot plant scale test-work completed by Hazen during 2011. Work was finalized in late November.
Highlights of the 2011 Hazen semi-continuous pilot plant test-work are as follows:
|
• |
Results of conventional contained sulfuric acid bake and water leach systems, at atmospheric pressure, demonstrated scandium recoveries averaging 75%, | |
|
• |
Results of conventional solvent extraction ("SX") on the pregnant leach solution, demonstrated scandium recoveries exceeding 99%, | |
|
• |
Results on final stage precipitation of scandium oxide, focused on highest combined purity and recovery, demonstrated scandium recoveries of 97.5%, at purity levels of 97.5% Sc2O3. Higher purity levels were achieved at lower recoveries, | |
|
|
• |
Overall recovery results were 70% to 80%, based on ore type (limonite or saprolite), and |
|
• |
All process assumptions were based on standard and accepted techniques for ore preparation, leaching, solvent extraction and final product preparation. |
In late 2011, the Company commissioned test work on high pressure acid leach (“HPAL”) processes, with both Hazen and SGS-Lakefield (Ontario, Canada). The initial HPAL work was applied to residue from the acid bake process sourced from the earlier Hazen test work, specifically to determine if additional scandium could be effectively recovered in a second pass with a pressure system. Those results were encouraging, and led to later test work in 2012-13 that applied HPAL techniques directly on the laterite resource material. No HPAL research results were included in the report and findings compiled for management by SNC-Lavalin in early 2012. However, the work that subsequently continued on HPAL, after that SNC Report was completed, has been incorporated into current engineering studies and flow sheet strategies for the Nyngan project. Existing HPAL work results were done to bench scale, and not to pilot scale, and are currently being followed up with further test work.
The Company is continuing test work on metallurgy to increase recoveries and final product grades.
In February of 2011, we announced results of a series of laboratory-scale tests investigating the production of scandium-aluminum (“Sc-Al”) alloys directly from aluminum oxide and scandium oxide feed materials, prepared by the CSIRO. The overall objective of this research was to demonstrate and commercialize the production of Sc-Al master alloy using impure scandium oxide as the scandium source, potentially significantly improving the economics of scandium aluminum master alloy production.
Environmental Permitting Work
In April of 2011, SCY announced a general progress report on the project which outlined a series of environmental work steps designed to advance the Environmental Impact Study (“EIS”). Work steps included both ground and surface water assessments, along with other assessments of Aboriginal, ecology, traffic, noise and air quality matters.
All of this work has subsequently been completed, including eight water bores with ongoing test monitoring equipment, and reports on the various other targeted assessments, without material issues in any area. An aerial photography and contour mapping program was also completed, to support feasibility study work regarding location of site facilities.
On January 18, 2012 SCY announced that that key elements of environmental site work on the Nyngan Scandium Project have been completed and a Conceptual Project Development Plan (CPDP) submitted to the NSW, Australia state regulators. The CPDP submission forms the basis for an Environmental Impact Study ("EIS"), the foundation environmental document required for a mining permit in the state.
Specific EIS and property work, contained in the CPDP, completed by year end 2011 were as follows:
|
|
• |
Draft ground water assessment study finalized and submitted to regulators, |
|
|
• |
Surface water assessment results favorable, State review ongoing, |
|
|
• |
Aboriginal heritage study finalized, no areas of significance, |
|
|
• |
Soils study finalized, no issues, and |
|
|
• |
Property aerial photography and contour mapping completed, location of site facilities defined. |
Continuing EIS work underway:
|
• |
Six license applications for access to groundwater as generated from property water bores have been submitted, | |
|
|
• |
Flora and fauna studies are ongoing; to date no significant issues have arisen, and |
|
|
• |
Traffic, noise and air quality baseline monitoring are ongoing. |
The environmental work was performed under direction from R. W. Corkery & Co., (Orange, NSW, Australia), and formed part of the SNC-Lavalin Nyngan economic study.
Nyngan Preliminary Economic Assessment
On October 14, 2014, the Company announced completion of a report on a Preliminary Economic Assessment of the Nyngan project entitled, NI 43-101F1 Technical Report on the Feasibility of the Nyngan Scandium Project. As a result of a disclosure review by the British Columbia Securities Commission, an amended technical report (the “PEA”) entitled titled "Amended Technical Report and Preliminary Economic Analysis on the Nyngan Scandium Project, NSW, Australia" was completed on May 20, 2015. The effective date of the report, as amended, is October 10, 2014.
The PEA was prepared by the engineering firm of Larpro Pty Ltd, of Brisbane, Australia, and supported by Mining One of Melbourne, Australia and Rangott Mineral Exploration Pty Ltd of Orange, Australia, and confirms the technical and economic potential of the Nyngan Scandium Project (the “Project”). The PEA has been independently prepared as a technical report on the form prescribed under NI 43-101 F1 and is available for public review on the Company’s website at www.scandiummining.com
The PEA is preliminary in nature and should not be considered to be a pre-feasibility or feasibility study, as the economics and technical viability of the Project have not been demonstrated at this time. While this PEA does not consider or include any inferred mineral resources, and does include only measured and indicated resources, it remains a preliminary analysis that is not sufficient to enable resources to be categorized as mineral reserves. Furthermore, there is no certainty that the PEA will be realized.
We advise U.S. investors that while the terms “measured resources,” “indicated resources” and “inferred resources” are recognized and required by Canadian regulations, the U.S. Securities and Exchange Commission does not recognize these terms. U.S. investors are cautioned not to assume that any part or all of the material in these categories will be converted into reserves. It should not be assumed that any part of an inferred mineral resource will ever be upgraded to a higher category.
The PEA concludes that the Project has the potential to produce 35,975 kilograms of scandium oxide (scandia) per annum, at grades of 97%-99%, generating an after-tax cumulative cash flow over a 20 year Project life of $565 million, with an NPV10% of $175 million. The PEA also concludes the project can achieve this financial result with a conventional flow sheet, employing HPAL and solvent extraction (“SX”) techniques, which have been modeled and validated from METSIM modeling and bench scale/pilot scale metallurgical test work. Note that mineral resources that are not mineral reserves do not have demonstrated economic viability.
PEA Financial Highlights and Key Assumptions
The PEA concludes that the Project has the potential for positive economics, based on a capital estimate supported by conventional process designs. The overall PEA level of accuracy is +/-30%. The PEA is expressed in US dollars (US$), unless otherwise noted. A foreign exchange rate of US$0.90 (1A$=US$0.90) to one Australian dollar (A$) was applied in all conversions. No escalation for inflation was assumed in cash flows. All cash flows and discounted cash flows (NPVs and IRRs) in this PEA are shown on an after tax basis, based on a 30% tax rate.
Highlights and key assumptions are as follows:
Table 1. Nyngan PEA Financial Highlights (October 10, 2014)
| Summary | NI 43-101 |
| Nyngan Project | PEA |
| Key Project Parameters | Result |
| Capital Cost Estimate (US$ M) | $77.4 |
| Resource Grade Assumption (ppm) | 371 |
| Resource Processed (tpy) | 75,000 |
| Mill Recovery Assumption (%) | 84.3% |
| Oxide Production (kg per year) | 35,975 |
| Scandia Product Grade | 97-99.0% |
| Annual Cash Operating Cost (US$ M) | $22.9 |
| Unit Cash Cost (US$/kg Oxide) | $636 |
| Oxide Price Assumption (US$/kg) | $2,000 |
| Annual Revenue (US$ millions) | $72.0 |
| Annual EBITDA (US$ millions) | $47.7 |
| NPV (10%i) | $175.6 |
| NPV (8%i) | $217.8 |
| IRR (%) | 40.6% |
| Payback (years) | 2.5 |
The above estimates of capital and operating costs are a component of a number of factors required to complete a preliminary assessment of the economic viability of the project, and there is no guarantee that the company will achieve production from the resource at Nyngan. There are currently no established reserves on the Nyngan Project.
PEA Mineral Resource Estimate
In March of 2010, a NI 43-101 technical report which outlined a resource estimate on the Nyngan Scandium Project was completed. The report, titled, “NI 43-101 Technical Report on the Nyngan Gilgai Scandium Project, Jervois Mining Limited, Nyngan, New South Wales, Australia”, was prepared by or under the supervision of Max Rangott (BSc). The PEA does not alter the existing Nyngan Project resource estimate, established in the 2010 technical report. The NI 43-101 measured and indicated scandium resource totals 12 million tonnes at an average grade of 261ppm scandium, from both limonite and saprolite resource material. The cut-off value of 100ppm used in the initial 2010 resource was reviewed as part of the PEA. While the input assumptions to the formula calculations are different from those assumed in 2010, the overall cut-off assumption for the combined limonite and saprolite resource generated by the formula was still considered reasonable, and has not changed.
The PEA assumes that a portion of limonite-only resource, in one particular area of the overall resource, will provide a 20 year mining pit sufficient to supply the processing facility at a rate of 75,000 tpy and an average grade of 371ppm scandium. A 20 year mining pit design was developed from drill hole data in support of this assumption and included in the PEA.
The current Nyngan project scandium mineral resource as calculated in the 2010 report by Rangott and accepted in the 2015 PEA, is as follows:
Table 2. Nyngan Scandium Resource (Effective Date February 9, 2010) (1)
| Nyngan Project | Overburden | |||
| NI 43-101 Resource Summary | Tonnes | Grade | Cut-Off Sc | Ratio |
| Category | (ppm Sc) | (ppm Sc) | (t/t) | |
| Measured Resource | 2,718,000 | 274 | 100 | 0.81:1 |
| Indicated Resource | 9,294,000 | 258 | 100 | 1.40:1 |
| Total Resource | 12,012,000 | 261 | 100 | 1.10:1 |
| NI 43-101 Technical Report on the Nyngan Gilgai Scandium Project, Jervois Mining Limited, Nyngan, New South Wales, Australia, dated March 2010, (Rangott Mineral Exploration Pty Ltd). | ||||
(1) Mineral resources that are not mineral resources do not have demonstrated economic viability.
Note that the terms measured and indicated resources are not terms recognized in the United States under SEC rules and guidelines. See “Note to U.S. Investors Regarding Resource Estimates” above under “ITEM 2 – PROPERTIES”.
The cut-off level used to define the resource was established using a standard formula that considered scandium pricing, estimated costs of mining and processing, and overall recovery rates, as they pertained to markets and process understanding at the time. Processing methodology assumed acid leaching and solvent extraction systems, and mining assumed a shallow, surface mining operation consistent with drill results on the resource. Additional information on cut-off value assumptions, including pricing assumptions, is provided in the PEA, available on the Company’s website.
PEA Mining and Processing Assumptions
Mining represents a relatively minor part of the overall project activity, based on a plant feed of 240tpd or 75,000 tonnes per year requirement. Mine production is based on conventional open pit methods, strip ratios of 1.5:1 to 3:1 (overburden/resource), contract mining assumptions and mining activity in campaigns of one month, three times per year, avoiding the wet season. The plant will run continuously, fed from field and plant stockpiles of mined resource, and covered against moisture and weather.
The processing plant operations will size the input material, apply HPAL using sulfuric acid, and then recover the liberated scandium using SX, oxalate precipitation and calcination, to generate a finished scandium oxide product. The output of the plant is forecast at 35,975 kilograms of scandium per year, at grades between 97% and 99%, as Sc2O3. Product output will be refined to suitable grade for direct sales to end users, recognizing that grade varies based on application.
Plant tailings will be neutralized with lime to pH 8.5, dewatered, and stored in a permanent tailings facility which is subject to the environmental requirements of mining permits and NSW State regulators.
PEA Capital Cost Assumptions
Total capital costs for the project are estimated at $77.4M, which includes a 20% contingency. The majority (70%) of the capital cost in the PEA was Australian-sourced, and consequently, initially priced in Australian dollars, supported by direct vendor capital pricing. Concrete and steel costs have been estimated from concept drawings, and piping, electrical and instrumentation costs were estimated using standard industry factors. The capital cost estimate is considered to be +/-30% accuracy. Capital costs included in overall cash flow include $2M per year for sustaining capital items ($38M over full PEA term), and $3M in final reclamation costs in year 20. No salvage costs were assumed. On the basis that the resource is adequate for 45 years at the assumed grade, it is unlikely the project would be closed in year 20 if current assumptions remain viable.
Table 3. PEA Capital Cost Detail
| Nyngan Project | NI 43-101 PEA Result | |
| Capital Cost Summary | Capital | CapEx/Annual |
| (US$) | Cost (US$ M) | kg Oxide |
| Pre-Stripping Cost | $1.6 | n/a |
| Mining Equipment | contractor | |
| Mine Vehicles/Site Equipment | $0.4 | $10 |
| Processing Plant Equipment | ||
| Ore Preparation | $2.1 | $58 |
| HPAL | $13.7 | $381 |
| CCD, Ph Adjust | $5.9 | $164 |
| Solvent Extraction | $3.1 | $86 |
| Product Precipitation | $1.3 | $37 |
| Tailings | $1.3 | $36 |
| Reagent Storage | $2.6 | $72 |
| Water/Steam/Services | $6.6 | $183 |
| Plant Subtotal | $36.6 | $1,019 |
| Other Site Costs | ||
| Freight and First fills | $2.1 | $59 |
| Evaporation Ponds-Tailings Dam | $6.7 | $186 |
| Transformer Farm/Buildings | $2.5 | $69 |
| On/Offsite Utilities Supply | $2.2 | $62 |
| Other Costs Subtotal | $13.5 | $376 |
| Owners Costs & Working Cap. | $4.3 | $118 |
| EPCM Costs (18%) | $9.1 | $253 |
| Contingency (20%) | $11.9 | $332 |
| Total Project Capital Cost | $77.4 | $2,151 |
| Total (20 Year) Sustaining Capital | $38.0 | N/A |
PEA Operating Costs Assumptions
Operating costs were estimated based on metallurgical test work results and METSIM modelling quantities and requirements. The single most significant cost item in operating costs is sulfuric acid, which is used in quantity and requires transport to site. The second most significant cost item is staff/labor cost. Reagents in total represent approximately 57% of total operating cash costs. Quantities were established through METSIM software outputs, and were 100% vendor-priced. The level of accuracy on the operating component costing in the PEA is +/-25%.
Operating cost details in the PEA are as follows:
Table 4. PEA Operating Costs, and Unit Costs Per kg Oxide
| Nyngan Project | NI 43-101 PEA Result | |
| OpEx Mine/Process Expense | Annual | Unit Cost Per |
| (US$ millions) | US$M Cost | kg Oxide |
| Mining Costs | $1.4 | $38.78 |
| Processing Cost | ||
| Labor Cost | $3.9 | $108.13 |
| Utilities | $0.8 | $21.96 |
| Reagents | $13.0 | $361.53 |
| Lab Costs | $0.2 | $6.95 |
| Consumables | $1.0 | $27.10 |
| Total Processing Costs | $18.9 | $525.67 |
| Marketing & Insurance | $0.7 | $18.76 |
| Maintenance Spend | $1.3 | $37.02 |
| Mobile Equipment Cost | $0.6 | $15.28 |
| Annual Cash Operating Cost | $22.9 | $635.51 |
PEA Revenue Pricing Assumptions
The price assumption in the PEA is $2,000 per kilogram (kg), as an average price covering all products sold over various product grades. Current pricing is substantially above these levels, based on small unit quantities and varying grades. The pricing benchmark applied in the PEA was supported by limited current trading and pricing information, our discussions with potential customers, and the understanding that lower prices than scandium trades for today will be necessary to penetrate potential markets with significant sales tonnages in the future.
PEA Sensitivities Analysis
The project is most sensitive to changes in product pricing, and somewhat less sensitive to either operating cost or capital cost changes, as shown below.
Table 5. Profitability Sensitivities to Changes in Key Assumptions
| Sensitivity to | NPV (10%) | |
| Financial Parameters | ($US M) | IRR (%) |
| PEA RESULT | $175.6 | 40.6% |
| Operating Cost Sensitivity | ||
| Cost Increase (10%) | $163.9 | 38.6% |
| Cost Decrease (10%) | $187.4 | 42.5% |
| Price Sensitivity | ||
| Lower Realized Product Price (10%) | $139.3 | 34.5% |
| Higher Realized Product Price (10%) | $212.0 | 46.6% |
| Capital Cost Sensitivity | ||
| Higher Capital Cost (10%) | $169.6 | 37.0% |
| Lower Capital Cost (10%) | $181.6 | 44.9% |
| Fx Sensitivity | ||
| US$/A$ @ $1.00 | $162.6 | 38.3% |
| US$/A$ @ $0.80 | $188.7 | 42.8% |
PEA General Assumptions
The PEA is presented on a 100% ownership basis. As a result of the conversion of the 2014 Loan into a 20% joint venture interest at the project level in Nyngan, the Company currently holds an 80% interest in the project.
All cash flows and financial analyses have been presented on a 100% equity basis. No debt leverage has been assumed in providing capital for development. No inflation factors have been applied to future cash flows, making the discounted cash flow performance measures constant dollar figures. Had inflation been applied to future cash flow streams, the NPVs and IRRs would have been higher.
The PEA incorporated considerable metallurgical test work independently prepared for SCY over the previous four years, along with engineering, project design work and economic estimates done previously for SCY management. The PEA also utilized existing environmental and detailed mine planning work previously undertaken on the property, and previously incorporated in prior management studies. The PEA had the benefit of prior flow sheet designs, and results, but it did not compare previous designs. The batch autoclave HPAL design presented in the PEA was the only design considered.
PEA Conclusions and Recommendations
This PEA consolidates a significant amount of metallurgical test work and prior study on the Nyngan Scandium Project. The work demonstrates a viable, conventional process flow sheet utilizing the HPAL leaching process, and good metallurgical recoveries of scandium from the resource. The metallurgical assumptions are supported by various bench and pilot scale independent test work programs that are consistent with known outcomes in other laterite resources. Combined with the capital cost estimate, the Project exhibits robust financial outcomes.
The PEA recommends that project owners proceed to a full feasibility study, including additional test work to confirm certain key process variants. Those recommendations include:
|
|
• |
Consider test work to support process changes that could reduce capital/operating costs, |
|
|
• |
Conduct a comparative study between batch and continuous autoclave systems, |
|
|
• |
Consider/test certain alternative reagents/techniques in the solvent extraction area, |
|
• |
Conduct test work to develop engineering parameters around the materials handling properties of the laterite resource as it relates to optimum sizing for best leach results, and | |
|
|
• |
Conduct test work on pumping and settling properties of process slurries. |
Nyngan Scandium Project – 2014 Drilling Program
On January 29, 2015, we announced assay results from a 14-hole resource drilling program at the Nyngan Scandium Project in NSW, Australia, conducted in October 2014. The 14 hole-program totaled 655 meters in the existing resource area. The program attempted 2 additional exploration holes, which were abandoned due to difficult drilling conditions. Highlights of the fourteen drill-hole program assay results follow:
|
|
• |
Average scandium grade of 357ppm over 214 meters (200ppm cut-off), |
|
|
• |
Average scandium grade of 444ppm over 120 meters (300ppm cut-off), |
|
|
• |
Best results: 4 meters @ 795ppm, 5 meters @ 755ppm and 7 meters @ 721ppm, |
|
|
• |
Best individual 1 meter assay was 879ppm, |
|
• |
Lithium borate fusion (fusion) assay preparation demonstrated superior result to the traditional four acid method, as used on the resource estimate in 2010, and | |
|
• |
These new assay results strongly support the average grade and location selected and included in the PEA on the Nyngan project. |
Drilling Program Details
The Company conducted and completed a 14-hole drill program in October, focused on a high grade section of the Nyngan property, selected from within the area of the measured and indicated resource disclosed in the NI 43-101 technical report filed on SEDAR in March of 2010. This high grade zone of mostly indicated resource was the basis of a 20 year mine plan and scandium grade assumptions used in the PEA on the Nyngan project. This latest drill program was designed to in-fill certain areas to 50 meter centers (from 100 meter centers), and to provide better information on pit limits as defined in the PEA. The program was conducted using a conventional rotary air core drill rig, which captured over five tonnes of chip sample material, for assay, and for fresh resource material to support ongoing metallurgical test work programs. Holes were vertically drilled, so interval widths in the results table below represent true widths.
The Company assayed all 14 new holes with both four acid digestion, and also by fusion digestion techniques, followed in each case by ICP-AES metal assays. The Company notes that fusion digestion results generally deliver higher scandium assays than the four acid digestion method, traditionally used in nickel and cobalt assay work. We believe the fusion technique generates a truer assay result, because acid digestion of scandium within limonite-hosted mineralization can be incomplete, particularly at higher grades, and flux digestion by high temperature fusion produces a more homogeneous sample for analysis. We intend to rely on and utilize fusion digestion techniques going forward to support our mine planning and advanced economic and development studies.
The limonite-only assay results presented in the summary table below are based on a 200ppm scandium cut-off value, A saprolite resource underlays the limonite, is generally lower in grade, requires somewhat different processing techniques than limonite for optimal recovery, and is not planned for early extraction and processing by the Company. Each hole in the drill program was completed to bedrock, including both limonite and saprolite resource. Saprolite was present in 13 of the 14 holes drilled.
This application of a higher limonite cut-off value of 200ppm is consistent with the PEA assumptions on initial production from the top layer limonite resource. The results presentation is also consistent with the company focus on an initial pit configuration in a higher grade zone of resource. The area of this recent drill result corresponds to the area delineated by the 20 year PEA operating area, and in fact expands beyond that area.
Assay results were taken over each meter of drilling material, and only continuous intervals have been included in the summary table. Reporting intervals above cut-off were established based on fusion results, and the presentation table then applied those same intervals to both fusion and four acid assays for comparability. The generally higher fusion results generated wider resource intervals above cut-off grade, resulting in inclusion of some below cut-off grade assays into the four acid results presented in the table below.
Detail limonite-only results for each drill hole were as follows:
| Hole Number & Type | Interval | Interval | Assay Result (Sc ppm) | ||
| From-To | Total | Four Acid/ | Fusion/ | ||
| Number | Status | (meters) | (meters)* | ICP Method | ICP Method* |
| EMCG001 | (previously | 16-27 | 11 | 178 | 216 |
| reported) | 32 to 44 | 12 | 407 | 580 | |
| including | 7 | 502 | 721 | ||
| including | 4 | 581 | 795 | ||
| EMCG002 | (new result) | 19-34 | 15 | 254 | 344 |
| including | 7 | 328 | 433 | ||
| EMCG003 | (new result) | 17-54 | 37 | 246 | 303 |
| including | 10 | 350 | 401 | ||
| EMCG004 | (new result) | 14-27 | 13 | 221 | 258 |
| EMCG005 | (new result) | 21-19 | 8 | 258 | 326 |
| EMCG006 | (new result) | 17-25 | 8 | 467 | 651 |
| including | 5 | 505 | 755 | ||
| including | 1 | 515 | 879 | ||
| EMCG007 | (new result) | 17-26 | 9 | 245 | 408 |
| including | 5 | 284 | 469 | ||
| EMCG008 | (new result) | 16-31 | 15 | 205 | 302 |
| EMCG009 | (previously | 15 to 24 | 9 | 311 | 435 |
| reported) | including | 4 | 420 | 570 | |
| EMCG010 | (previously | 15 to 31 | 16 | 370 | 495 |
| reported) | including | 8 | 423 | 594 | |
| EMCG011 | (new result) | 13-20 | 7 | 225 | 295 |
| EMCG012 | (new result) | 16-20 | 4 | 143 | 220 |
| 22-25 | 3 | 246 | 335 | ||
| EMCG015 | (new result) | 25-51 | 26 | 262 | 339 |
| including | 7 | 366 | 469 | ||
| EMCG016 | (previously | 11 to 26 | 15 | 209 | 316 |
| reported) | including | 5 | 273 | 431 | |
| 38 to 44 | 6 | 269 | 315 | ||
| Total meters reported | 214 | ||||
| Weighted Average Assay Result | 266 | 357 | |||
| *NOTES: | |||||
| 1. Interval results represent true widths | |||||
| 2. Grade cut-off assumption for Fusion/ICP method is 200ppm, effectively less for Four Acid/ICP method, based on matched intervals to fusion result. | |||||
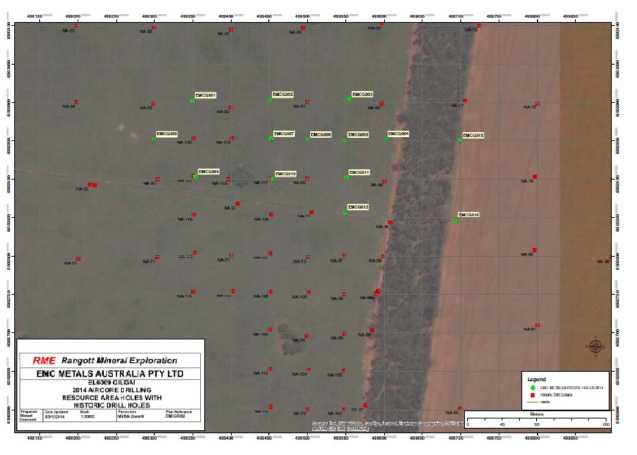
The location of the 14 hole drill program is as follows:
Drill Program QAQC standards
SCY employed an independent local geological consulting and drill supervisory team, Rangott Mineral Exploration Pty. Ltd., (“RME”) of Orange NSW, Australia, to manage the drill work on-site. Bulk samples of drill returns were collected at one meter intervals from a trailer-mounted cyclone and splitter for one reported hole - EMCG-01, and a separate RME three-tier riffle splitter was used on site for holes EMCG-09, EMCG-10 and EMCG-16, due to moisture. Assay samples ranged from 0.4 - 4.7 kg in weight. Individual sample identifiers were cross-checked during the process. The individual assay samples were double-bagged and held in RME’s possession while in the field, prior to transport and storage at RME’s office in Orange. RME personnel checked/validated the sequence of sample numbers, and submitted the samples to Australian Laboratory Services’ (“ALS”) laboratory in Orange, NSW. The remainder of bulk samples were sealed in the field in heavy polyethylene bags and transported by RME to a secure site at Orange for long-term storage or further use in metallurgical test work.
ALS/Orange dried and weighed the received assay samples, and pulverized the entire sample to 85% passing 75 microns or better (technique PUL-21). 50 g bags of the pulps were then split off and sent to the ALS laboratory at Stafford in Brisbane, Queensland for analysis. ALS/Brisbane analyzed the pulps for scandium, nickel, cobalt, chromium, iron, magnesium, manganese, aluminum and calcium, using Inductively Coupled Plasma Atomic Emission Spectroscopy (ICP-AES) after a four acid digestion (technique ME-ICP61). The 4-hole results were also repeat-tested, only for scandium, using a lithium borate fusion digestion technique, followed by similar ICP-AES assay. The lower detection limit for scandium using either technique is 1ppm. RME included one commercial standard sample and three high-grade scandium pulps from previously analyzed batches, for quality control; and also included one duplicate sample from each hole in the batch. For internal quality control, ALS/Brisbane added additional standard samples (for repeat analyses), blank samples and duplicate samples to the batch.
Patent Application Filings
On February 17, 2015 the Company announced the filing of five patent applications with the US Patent Office that correspond to novel flowsheet designs for the recovery of scandium from laterite resource material. All five of these patents are directly applicable to our Nyngan Scandium Project, although one of the five patents pertains to downstream product design.
The five patent applications are titled as follows:
|
1. |
Systems and methodologies for recovering scandium values from mixed ion solutions, | |
|
2. |
Systems and methodologies for direct acid leaching of scandium bearing laterite ores, | |
|
3. |
Solvent extraction of scandium from leach solutions, | |
|
4. |
Systems and processes for recovering scandium values from laterite ores, and | |
|
5. |
Scandium-containing master alloys and method for making the same. |
Patent Applications Discussion:
|
• |
These patent applications cover novel, unique flowsheet designs, applicable to scandium extraction, from scandiferous laterite resources, | |
|
• |
The patented designs are largely supported by test work done with Nyngan project resource material and known design parameters, | |
|
• |
The patents cover HPAL system material flows, SX, ion exchange systems (“IX”), atmospheric tank and heap leaching systems and techniques, and processes for directly making select master alloys containing scandium, | |
|
|
• |
The designs will be part of a definitive feasibility study, scheduled for 2015, and |
|
• |
The master alloy patent application uniquely integrates planned flowsheet design and downstream product development, either by SCY or with future customers. |
These five patent applications have been filed with the US Patent Office, with dates of record from September 2014 to February 2015. They protect the company's position and rights to the intellectual property (IP) contained and identified in the applications as of the date filed, within the worldwide jurisdiction limits of the US patent system. Review by the US Patent Office takes further time, but the dates of record define the basis of IP ownership claims, as is generally afforded US patent-holders.
The Company intends to utilize the IP contained in these process patents in the development of process flowsheets for recovery of scandium from its Nyngan Scandium Project.
The Company believes that patent protection of these specific, novel process designs will be granted. Many of the basic design elements contemplated in the Nyngan Project flowsheet are commonly applied to other specialty metals, particularly nickel. However, the application of these basic design elements has not been commonly applied to scandium extraction from laterite resources, and there are enough intended and required operational differences in the application to permit the Company to patent-protect IP on those differences.
These patent claims are the result of several years of metallurgical testwork with independent resource laboratories and specific design work by Willem Duyvesteyn, the Company's Chief Technology Officer, using Nyngan property resource material. This work is ongoing. Patent protection on flowsheet intellectual property will serve to limit or prevent the unauthorized use of that IP by others, without Scandium International's consent. We believe these filings are an important action to protect the ownership of a Company asset, on behalf of all SCY shareholders.
ALCERECO MOU and Offtake Agreements
On March 30, 2015, the Company announced that it had signed a memorandum of understanding (“MOU”) with ALCERECO Inc. of Kingston, Ontario, forming a strategic alliance to develop markets and applications for aluminum alloys containing scandium. To further that alliance, and to reinforce the capability of both companies to deliver product developed for Al-Sc alloy markets, Scandium International and ALCERECO also signed an offtake agreement governing sales terms of scandium oxide product (scandia) produced from the Nyngan Scandium Project. The offtake agreement specifies deliveries of scandium oxide product commencing in early 2017.
Scandium as an alloying agent in aluminum allows for aluminum metal products that are much stronger, more easily weldable and exhibit improved performance at higher temperatures than current aluminum based materials. This means lighter structures, lower manufacturing costs and improved performance in areas that aluminum alloys do not currently compete.
|
• |
The MOU covers areas of joint cooperation and development of aluminum alloys that contain and are enhanced by the addition of scandium, | |
|
• |
The MOU recognizes the specialized capabilities ALCERECO holds for the design, manufacture, and testing of Al-Sc alloy materials, | |
|
• |
The offtake agreement outlines standard sale terms on 7,500 kg of scandia per annum, for a term of three years beginning in 2017, which can be extended, and | |
|
• |
The offtake agreement contains both fixed and variable pricing components, which are subject to confidentiality. |
ALCERECO is an advanced materials development company that provides services and specialty processing capabilities to companies innovating in a diverse range of markets, including aerospace, automotive, electronics and consumer/sporting goods. ALCERECO staff work with a range of materials and processes and have the tools and knowledge to take on leading-edge projects such as development of aluminum-scandium alloys, specialty ceramics, composites and graphene enhanced materials. The company has a particular focus on lightweight materials capable of delivering greater strength, functionality and exceptional performance.
ALCERECO operates out of the Grafoid Global Technology Centre in Kingston, Ontario that was originally founded by Alcan Aluminum in the 1940s. ALCERECO is a Canadian private company, and a wholly-owned subsidiary of Ottawa-based Grafoid Inc., a graphene application development company.
Nyngan Scandium Project - Planned Activities for 2015-2016
The following steps are planned for Nyngan during the 2015 and 2016 Calendar years:
• |
Complete the transfer of legal title to the exploration licenses, and surface lands from Jervois to the Company (completed in October, 2015); |
|
• |
Complete samples analysis and reporting on in-fill exploration drilling conducted on the property in 2014 to enhance resource understanding and supply test work resource material (drilling completed in 2014 involved 657 meters of drilling over 14 drill holes at a cost of approximately $50,000; samples analysis and reporting was completed in the first quarter of 2015); |
|
• |
Progress metallurgical test work programs to finalize a project flow sheet, utilizing independent laboratory consultants, (scheduled for completion in the fourth quarter of 2015 at an estimated cost of $400,000); |
|
• |
Complete and file an environmental impact assessment (“EIS”) on the project (scheduled for completion in the fourth quarter of 2015); |
|
• |
Initiate and complete an advanced stage economic study at or better than +/- 20% accuracy level (initiated in September of 2015 and scheduled for completion during the first quarter of 2016); |
|
|
• |
Apply for mining license on property with NSW Mines Department in Q3 2015; and |
• |
Commence site construction during Q2 2016 (construction completion and operational start-up first half 2017, estimated construction cost of $77,400,000 based on the PEA). |
Other Properties Review
Tørdal Scandium/REE Property (Norway)
During 2011, we entered into two option agreements with REE Mining AS of Norway to obtain exploration rights to several properties in central and southern Norway. The Tørdal, Evje-Iveland and Hogtuva properties are classified as Norway Property for purposes of financial statement segment information.
Option agreements to acquire the Tørdal and Evje-Iveland exploration properties were entered into in April 2011, followed by an option agreement on the Hogtuva property in September 2011. Both of these agreements were subsequently renegotiated to secure 100% ownership positions for SCY. Based on exploration results and holding costs, the Evje-Iveland and Hogtuva properties were subsequently dropped and the Tørdal property holdings have been reduced from 140 sq km to 90 sq km.
Exploration rights for the Tørdal property include certain minimum expenditure requirements. The Company intends to fulfill those minimum expenditure requirements.
Tørdal Property Location
The location of the Tørdal exploration property is provided in Figure 4 below.
![]()
2012 Tørdal Field Exploration
On February 14, 2013, we announced promising results from field exploration work on the Tørdal property during the summer and fall months of 2012, focused on scandium-bearing pegmatites. The 2012 work included independent assay results of pegmatite rock samples taken from one specific property area, and also includes an extensive pegmatite mapping program covering approximately 30 sq km. The assay results indicated the presence of high levels of scandium and various rare earth elements (“REEs”), including heavy rare earth elements (“HREEs”) in particular. Field XRF readings indicated elevated scandium content in hundreds of large and small pegmatite bodies found and mapped in the reconnaissance area.
Highlights of the results of the 2012 field exploration are as follows:
|
|
• |
Tørdal 2012 assays of pegmatite rocks show presence of both scandium and REEs, |
|
|
• |
Best scandium assays exceed 1,600 ppm, |
|
|
• |
Promising HREE assay results from pegmatites with gadolinite mineralization, |
|
|
• |
Host rock mineralization points to higher grade scandium or HREE contents, |
|
|
• |
2012 summer exploration program mapped and sampled over 300 pegmatites, |
|
|
• |
A total of 1,940 Niton XRF scandium readings were taken on whole rock samples, and |
|
|
• |
Overall program results at Tørdal are very encouraging and warrant expanded exploration. |
Tørdal Assay Results (Grab Samples)
Work originally began on the property in 2011, with a summer exploration program that consisted of reconnaissance, surface soil sampling, and limited pegmatite mapping work in a relatively small area north of the village of Kleppe, in Southern Norway.
As a follow-on from that 2011 program, the company then returned to the same area and conducted a series of ‘blasts’, using small explosive charges to generate whole rock samples on select exposed pegmatites, at the locations of the best soil sample results. The exploration team conducted blasting on 5 different pegmatite bodies, from which they assembled 23 grab samples for analysis and assay by OMAC Laboratories in Ireland. Assay results on these samples were received in Q1 2012—in time to help formulate the 2012 summer/autumn season pegmatite mapping program, conducted on a much wider area.
Independent assay results on 20 of the 23 samples, covering all 5 targeted pegmatites, are shown below.
| Sample Location | Rare Earth Assay Results | Scandium | ||||
| Sample | Sample | Blast | HREE | TREE | % HREE | Sc |
| Type | ID # | ID # | ppm | ppm | ppm | |
| TD1 | 7 | 307 | 427 | 72.0% | 38 | |
| TD2 | 7 | 142 | 204 | 69.7% | 334 | |
| Whole Rock | TD3 | 3 | 104 | 138 | 75.0% | 86 |
| Samples | TD5 | 4 | 460 | 533 | 86.4% | 111 |
| TD6 | 2 | 177 | 223 | 79.3% | 67 | |
| TD7 | 9 | 180 | 219 | 82.0% | 26 | |
| TD8 | 8 | 935 | 1,028 | 90.9% | 77 | |
| TD9 | 7 | 130 | 171 | 75.8% | 568 | |
| Select | TD10 | 3 | 92 | 123 | 74.5% | 665 |
| Mica-Phase | TD11 | 9 | 159 | 191 | 82.8% | 1,459 |
| Samples | TD13 | 1 | 52 | 59 | 88.1% | 853 |
| TD15 | 3 | 724 | 883 | 81.9% | 1,690 | |
| Select | TD17 | 8 | 1,581 | 1,656 | 95.5% | 141 |
| Garnet-Phase | TD18 | 7 | 305 | 357 | 85.6% | 23 |
| Samples | TD19 | 2 | 2,443 | 2,789 | 87.6% | 246 |
| TD21 | 2 | 722 | 860 | 84.0% | 150 | |
| Select | TD14 | 1 | 227,500 | 266,430 | 85.4% | 26 |
| Gadolinite- | TD22 | 3 | 162,500 | 186,480 | 87.1% | 64 |
| Phase | TD23 | location 32 | 267,400 | 313,530 | 85.3% | <1 |
| NOTE: All blast samples taken from Kleppe area (Area 1), total of 5 unique pegmatites | ||||||
Assay results are as-reported elemental assay results from OMAC Laboratories, and are not converted to oxide equivalent (REO & Sc2O3). Heavy rare earth elements abbreviated “HREE”; and include Yttrium; Total rare earth elements abbreviated “TREE”.
The numbered assay samples were formed either by random selection of fresh (un-weathered) whole rock material broken loose from individual pegmatite bodies, or alternatively, based on selectively collecting fresh rock material that was clearly (1) garnet-laden, (2) mica-laden, or showed clear visible (3) gadolinite mineralization. Gadolinite is a beryllium and rare earth-bearing mineral with the chemical formula [(Ce,La,Nd,Y)2FeBe2Si2O10]. The intent was to determine from assay results if certain visible mineralization correlated to the presence and concentrations of target elements; specifically scandium, rare earth elements (REE’s), or other metals of interest and value.
The results in the assay table indicate that all of the selected pegmatites contain interesting levels of both REEs and scandium. In general, all of the pegmatites contained both target elements, while the mica phase appears to hold the higher scandium concentrations with small REE additions, and the gadolinite phase holds the highest REE concentrations and small scandium additions. The presence of garnet material in samples tended to generate interesting but moderate values for both REEs and scandium. Assay work was designed to identify 30 specific elements, including all 16 REE elements plus scandium, and the relative concentration of heavy REEs was of particular interest. The mica and garnet grab sample materials had generally only trace levels of thorium and uranium (average <15 ppm), while the gadolinite grab sample materials had thorium levels between 2,500-5,000 ppm, and uranium levels between 500-1,300 ppm. A full table of OMAC assay results related to these 23 sample analyses is available on the Company’s website at www.ScandiumMining.com.
Tørdal Pegmatite Mapping Program
Following on from the 2011 work and the 2012 assay results, the Company conducted an expanded 2012 summer work reconnaissance program at both Tørdal and Evje-Iveland, from July through October. The goals of the 2012 program were to develop detailed mapping of outcropping pegmatite fields over a much broader area than the 2011 program, while also conducting field sampling of scandium mineralization on those pegmatites using a hand-held Niton XRF Analyzer.
The 2012 program concentrated on five separate areas (approximately 30 sq km) as can be seen in the map below:

A total of 1,940 Niton XRF readings were logged on whole rock and pegmatite mineral separates, logged against individually mapped and numbered pegmatite bodies. The XRF readings ranged up to +6,000 ppm scandium (on a mineral separate), and averaged 661 ppm on 1,504 total logged readings above the instrument’s 20 ppm detection limit. XRF readings focused on scandium data collection only, although the team diligently noted the visible presence of gadolinite and amazonite mineralization.
The reader is cautioned that hand-held Niton XRF readings are not the same as laboratory assays, and are not NI 43-101 compliant with regard to estimating resource grades. However, the Company is confident that these data readings are highly useful in confirming and shaping the next stage of the exploration program on this property.
A summary of results by area is as follows:
|
• |
Area 1 (Kleppe); Mapped more than 50 pegmatite bodies. Best average XRF Sc readings from 1,000-1,500 ppm, some very large surface expressions. Gadolinite present. | |
|
• |
Area 2 (Heftetjern); Partially mapped more than 40 pegmatite bodies, many large surface expressions, green amazonite mineralization. Better XRF Sc readings from 500-1,500 ppm. | |
|
• |
Area 3 (Solli); Mapped numerous large and small pegmatites. Generally lower XRF Sc readings, ranging 300-700 ppm. Red feldspars, quartz and gadolinite mineralization present. | |
|
• |
Area 4 (South Kleppsvatn); Partially mapped large area containing more than 80 pegmatites, generally mica-based. Typical XRF Sc readings in the 300-900 ppm range, with some reaching 1,500 ppm Sc. | |
|
• |
Area 5 (Buvatn); Partially mapped, numerous pegmatite bodies, some very large. Typical XRF Sc readings in the 300-1,000 ppm range. Old feldspar quarries, amonizite mineralization present. |
Similar work done at Evje-Iveland (total 180 sq km) identified several interesting target areas, but scandium readings were not sufficiently attractive when compared to results at Tørdal, and led to the decision to drop the Evje-Iveland property. The exploration results of the 2012 work program also allowed us to selectively reduce property holdings at Tørdal.
Tørdal Exploration – Next Steps
SCY’s mapping and sampling work has confirmed that much of the Tørdal property is heavily populated with complex, near-surface pegmatite bodies. Based on hand-held XRF readings and mineralogy, these pegmatites show excellent promise for significant scandium enrichment, particularly within bodies containing micas, and for REE mineralization where the rare earth silicate gadolinite is present. Based on the results of 2012 exploration work, planning for future exploration work is warranted, subject to funding constraints.
Qualified Person and Quality Assurance/Quality Control
Sampling methods followed industry quality control standards. Mr. Kjell Nilsen, an independent geologist consultant currently employed by Scandium International, conducted the reconnaissance and sampling on the property. Individual whole rock grab samples were collected by hand shovel, from areas where blasted material could be seen to have come from blast points on pegmatite bodies. The assayed samples were individually bagged, sealed, logged on the grid map as to location, boxed in a container suitable for mailing, and sent by express mail to OMAC Laboratories Limited in Galway, Ireland for testing. Assay testing on the samples utilized an ICP-MS spectrometer (Inductively Coupled Plasma-Mass Spectrometry) to test for numerous elements, specifically scandium. The numerous Niton XRF (X-ray Fluorescence) readings were taken at field locations, logged and identified with individual numbered pegmatites, located on grid maps, by the field geology team. Mr. Willem Duyvesteyn, Chief Technology Officer of Scandium International, is the Qualified Person who is responsible for the design and conduct of the exploration program, and reviewed and approved the disclosure of the program results contained herein.
Honeybugle Scandium Property (NSW, Australia)
On April 2, 2014, the Company announced that it had secured a 100% interest in an exploration license (EL 7977) covering 34.7 square kilometers in New South Wales, Australia. The license area is located approximately 24 kilometers west-southwest from the Company’s Nyngan Scandium Project and approximately 36 kilometers southwest from the town of Nyngan, NSW. The license held by SCY covers only a part of the Honeybugle geologic complex.
Exploration rights for the Honeybugle property include certain minimum expenditure requirements. The Company intends to fulfill those minimum expenditure requirements.
The Honeybugle tenement contains lateritic material common to the region. The property itself is located in semi-arid broad-acre wheat farming country and is routinely planted. Farming is the largest industry in the area, although mining activity is evident, past and present.
The tenement includes four (4) distinct magnetic anomalies; Seaford, Woodlong, Yarran Park and Mallee Valley, which reflect underlying mafic to ultramafic bedrock. These areas were previously identified by groups exploring principally for platinum, nickel and cobalt in the 1980’s, but scandium was of little interest. Surface soil and rock chip sampling conducted by previous license holders and Scandium International, on each of the four areas, did detect anomalous scandium values that are well above background levels (20-30 ppm). The results of this previous soil sampling work is what led to our interest in acquiring the Honeybugle exploration tenements.
Honeybugle Drill Results
On May 7, 2014, the Company announced completion of an initial program of 30 air core (AC) drill holes on the property, specifically at the Seaford anomaly, targeting scandium (Sc). Results on 13 of these holes are shown in detail, in the table below. These holes suggest the potential for scandium mineralization on the property similar to Nyngan.
|
• |
Highlights of initial drilling program results include the following: The highest 3-meter intercept graded 572 ppm scandium (hole EHAC 11), | |
|
• |
EHAC 11 also generated two additional high grade scandium intercepts, grading 510 ppm and 415 ppm, each over 3 meters, | |
|
• |
The program identified a 13-hole cluster which was of particular interest; intercepts on these 13 holes averaged 270 ppm scandium over a total 273 meters,at an average continuous thickness of 21 meters per hole, representing a total of 57% (354 meters) of total initial program drilling, | |
|
• |
The 13 holes produced 29 individual (3-meter) intercepts over 300 ppm, representing 31% of the mineralized intercepts in the 273 meters of interest, and | |
|
• |
This initial 30-hole AC exploratory drill program generated a total of 620 meters of scandium drill/assay results, over approximately 1 square kilometer on the property. |
The detail results of 13 holes in the initial drill program are as follows:
| Honeybugle 30 Hole Drill Program - April 2014 Target-Scandium | ||||||
| Honeybugle | From | To | Intercept | Total | ||
| Drill Hole | Drill | Hole | (meter | (meter | Length | Scandium |
| Number | Area | Type | depth) | depth) | (meters) | Grade (ppm) |
| EHAC 1 | Seaford | Explore (AC) | 21 | 42 | 21 | 218 |
| including | 27 | 36 | 9 | 262 | ||
| EHAC 2 | Seaford | Explore (AC) | 0 | 12 | 12 | 300 |
| including | 0 | 9 | 9 | 333 | ||
| EHAC 3 | Seaford | Explore (AC) | 3 | 12 | 9 | 295 |
| including | 6 | 9 | 3 | 352 | ||
| EHAC 5 | Seaford | Explore (AC) | 0 | 15 | 15 | 244 |
| including | 12 | 15 | 3 | 333 | ||
| EHAC 6 | Seaford | Explore (AC) | 0 | 24 | 24 | 185 |
| including | 0 | 9 | 9 | 214 | ||
| including | 18 | 24 | 6 | 214 | ||
| EHAC 7 | Seaford | Explore (AC) | 9 | 51 | 42 | 225 |
| including | 15 | 42 | 27 | 220 | ||
| including | 42 | 51 | 9 | 252 | ||
| EHAC 9 | Seaford | Explore (AC) | 6 | 27 | 21 | 272 |
| including | 9 | 24 | 15 | 350 | ||
| EHAC 10 | Seaford | Explore (AC) | 0 | 18 | 18 | 251 |
| EHAC 11 | Seaford | Explore (AC) | 0 | 30 | 30 | 369 |
| including | 9 | 15 | 6 | 461 | ||
| including | 21 | 24 | 3 | 572 | ||
| EHAC 12 | Seaford | Explore (AC) | 0 | 21 | 21 | 177 |
| EHAC 26 | Seaford | Explore (AC) | 0 | 21 | 21 | 309 |
| Seaford | including | 3 | 18 | 15 | 343 | |
| EHAC 28 | Seaford | Explore (AC) | 0 | 18 | 18 | 344 |
| Seaford | including | 3 | 15 | 12 | 363 | |
| EHAC 29 | Seaford | Explore (AC) | 3 | 21 | 18 | 316 |
| including | 9 | 18 | 9 | 396 | ||
| Assumes 175 ppm cut-off grade | ||||||
Seaford is characterized by extensive outcrops of dry, iron-rich laterites, allowing for a particularly shallow drill program. Thirty (30) air core (AC) holes on nominal 100-meter spacing were planned, over an area of approximately 1 square kilometer. Four holes were halted in under 10 meters depth, based on thin laterite beds, low scandium grades, and shallow bedrock.
The 13 holes highlighted in the table are grouped together on either side of Coffills Lane, and represent all of the drill locations where meaningful intercept thickness generated scandium grades exceeding 175 ppm. Some of these 13 holes showed significant scandium values on the immediate surface, and alternately, other holes exhibited favorable scandium grades that began at shallow depth. The highest grade Sc sample was found in a 21-24 meter interval (572 ppm), although several holes produced better than 350 ppm Sc intercepts at depths of under 9 meters. The deepest hole (EHAC 7) was drilled to 57 meters, showing good scandium grades over a 12-meter horizon (245 ppm) near the bottom of the hole, from 39 to 51 meters depth. Higher scandium grades were associated with higher iron levels. Holes were drilled to a depth where they contacted the fresh ultramafic bedrock, which generally signaled the end of any scandium enrichment zones.
The drill plan divided Seaford into four sub-areas, 1-4, as highlighted on the map below. Area 1 was relatively higher ground and therefore the least impacted by ground moisture. Consequently this dryer area received the greatest attention, although that had been the general intention in the plan. Area 1 received 17 holes, with 13 presented in detail in the table above. Areas 2-4 were each intended as step-out areas that need to be further examined in the next program. The three step-out areas did not generate results of particular note, although hole locations were not optimal due to ground conditions and access.
| • | Area 2 received 3 holes, 60 meters total, and generated Sc grades from 45-75 ppm, | |
| • | Area 3 received 4 holes, 87 meters total, and generated Sc grades from 47-122 ppm, | |
| • | Area 4 received 5 holes, 72 meters total, and generated Sc grades from 60-101 ppm, and | |
| • | The average depth of all of these holes was 18 meters, with the deepest 30 meters. |
Initial Drill Program Map
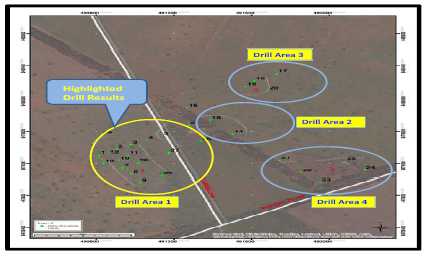
This 13-hole cluster (“Area 1”) was noted to be in a relatively thick laterite zone which was constrained to the west by contact with metasediments, to the east by fresh ultramafic bedrock, and to some extent in the north by a poor intersection result in hole 30. Area 1 remains somewhat open to the south, with the two southern-most holes (EHAC 9 and EHAC 29) generating some of the best scandium grade intercepts in the area.
The surface and near surface mineralization at this property is an advantage, both in locating areas of interest for future exploration work, and also because of extremely low overburden ratios. This particular characteristic for the Honeybugle property is different to Nyngan, where mineralization is typically covered by 10-20 meters of barren alluvium.
Further drilling at Seaford is warranted, based on the results of this introductory and modest program, specifically to the north and south of the existing Area 1 drill pattern, along with investigation and select drilling at the other three remaining anomalies on the property.
Qualified Person and Quality Assurance/Quality Control
John Thompson, B.E. (Mining); Vice President - Development at Scandium International Mining Corp is a Qualified Person as defined in NI 43-101 and has reviewed and approved the technical information on this property. The drilling, sampling, packaging and transport of the drill samples were carried out to industry standards for QA/QC. Scandium International employed an independent local geology consulting and drill supervisory team, RME to manage the drill work on-site. Bulk samples of drill returns were collected at one metre intervals from a cyclone mounted on the drilling rig, and a separate three-tier riffle splitter was used on site to obtain 2.0 -4.5kg composite samples collected over 3 metre intervals, for assay. Individual sample identifiers were cross-checked during the process. The assay samples were placed in sealed polyweave bags which remained in RME’s possession until the completion of the drilling program, at which time they were transported to RME’s office in Orange. There, the sequence of sample numbers was validated, and the assay samples were immediately submitted to ALS’s laboratory in Orange. The remnant bulk samples, which were collected in sealed polythene bags, were transported by RME to a local storage unit at Miandetta, for long-term storage.
ALS/Orange dried and weighed the samples, and pulverized the entire sample to 85% passing 75 microns or better (technique PUL-21). These 50g sample bags of pulps were then sent to the ALS laboratory at Stafford in Brisbane, Queensland for analysis. ALS/Brisbane analyzed the pulps for scandium, nickel, cobalt, chromium, iron and magnesium, using Inductively Coupled Plasma Atomic Emission Spectroscopy (ICP-AES) after a four acid (total) digestion (technique ME-ICP61). The lower detection limit for scandium using this technique is 1ppm. For their internal quality control, ALS/Brisbane added 4 standard samples (for 20 repeat analyses), 10 blank samples and 16 duplicate samples to the batch. Please see news release see news release dated May 7, 2014 and available on www.sedar.com for further information on the Honeybugle drill results.
Other Developments – Third Quarter 2015
Private Placement Financing, Debt Conversion, and Joint Venture Formation on Nyngan Scandium Project: On August 24, 2015 the Company announced that it had received C$2,167,208 pursuant to a private placement of common shares, priced at C$0.10 per share. Fees of US$60,000 were paid on the transaction.
In connection with the equity placement, Scandium Investments LLC, an unrelated private investment company, converted the US$2.5 million loan made to the Company into a 20% direct joint venture interest in the Company's Nyngan and Honeybugle scandium projects in NSW, Australia. The conversion of the loan into a joint venture interest was made pursuant to the terms of the convertible loan agreement entered into in June 2014. In addition, SIL agreed to accept outstanding loan interest (C$223,748) in Company common shares at C$0.10 per share.
On September 1, 2015, the Company announced that it had received C$198,285 pursuant to a private placement of common shares, priced at C$0.10 per share.
New Board Member: On August 24, 2015 the Company announced that Mr. Andrew C. Greig had joined the SCY Board. Mr. Greig has 35 years of experience in the mining and natural resource industry with Bechtel Group Inc., a global engineering, construction and project management company. Mr. Greig has held numerous positions with Bechtel, most recently as SVP and Global Manager of Human Resources. Mr. Greig served on the Bechtel Board as a Director and was President of the Mining and Metals Global Business Unit, centered in Brisbane, Australia for 13 years, prior to his HR role. He brings direct experience in developing minerals, resource, power, refining, and chemical projects in 20 countries across six continents. A resident of Australia, Mr. Greig earned a graduate diploma in business from Monash University, Melbourne.
Stock Option Grants: On August 28, 2015, the Company granted 400,000 stock options at an exercise price of C$0.115 per share, exercisable until August 28, 2020, to a director of the Company.
Definitive Feasibility Study: On September 10, 2015 the Company announced that it has selected the engineering firm Lycopodium Minerals Pty Ltd, of Brisbane, QLD, Australia, to prepare a Definitive Feasibility Study ("DFS") on the Nyngan Scandium Project. The work is expected to be completed in the first quarter of 2016. The DFS will include all elements of project description and design to generate an economic report suitable for seeking project construction financing in 2016. Process engineering and other project study elements will be advanced to a +/-15% accuracy level.
While Lycopodium will coordinate the overall project, significant contributions will be sourced from other engineering groups and consultants who have been a part of previous reports, including Altrius Engineering Services Pty Ltd (Brisbane, QLD), Rangott Mineral Exploration Pty Ltd (Orange, NSW), Mining One Consultants (Melbourne, Victoria) and R.W.Corkery & Co. Pty Limited (Orange, NSW).
Knight Piesold Pty Ltd (Brisbane, QLD) will contribute engineering services on tailings dams, geotechnical work, and surface water management.
The DFS will incorporate and be based on metallurgical test work independently prepared for the Company over the previous five years, along with engineering, project design work, environmental work on the property, mine planning and development work, and economic estimates done previously for management use, specifically as incorporated in the Amended Technical Report and Preliminary Economic Assessment on the Nyngan Scandium Project, NSW, Australia, effective date October 10, 2014, amended and restated issue date May 20, 2015.
The Nyngan Scandium Project DFS has been commissioned to be independently prepared in accordance with the requirements of NI 43-101 as applicable to the preparation of technical reports.
Subsequent Events
Nyngan/Honeybugle Scandium Projects Royalty: On October 14, 2015 the Company announced that it has received US$2.07M from a private investor in return for the granting of a 0.7% royalty on gross mineral sales from both the Nyngan property and the Honeybugle property. The royalty covers all minerals produced and sold from both properties, with no caps, minimums, term limits or early buyout provisions. The Company has retained all rights to commence and operate mining projects on both properties, and adjust land holdings, on a commercial basis as defined by management, consistent with other existing private and State royalties on the properties.
Extension of Options: On October 28, 2015, shareholders of the Company approved a resolution extending the expiry date of 4.3 million options held by directors and officers of the Company, from November 5, 2015 to November 5, 2020.
Operating results - Revenues and Expenses
The Company’s results reflect lower operating costs as the focus of business has turned to its scandium projects.
Summary of quarterly results (expressed in US$)
| 2015 | 2014 | 2013 | ||||||
| Q3 | Q2 | Q1 | Q4 | Q3 | Q2 | Q1 | Q4 | |
| Net Sales Net Income (Loss) Basic and diluted Net Income (Loss) per share |
- (503,357) (0.00) |
- (632,698) (0.00) |
- (470,654) (0.00) |
- (577,174) (0.00) |
- (779,384) (0.01) |
- (221,294) (0.00) |
- (271,804) (0.00) |
- (2,197,558) (0.02) |
Results of Operations for the three months ended September 30, 2015
The net loss for the quarter was $503,357, a decrease of $276,027 from $779,384 during the same period of the prior year. Details of the individual items contributing to the increased net loss are as follows:
| Q3 2015 vs. Q3 2014 - Variance Analysis | ||
| Item | Variance | |
| Favourable / | Explanation | |
| (Unfavourable) | ||
| Stock-based compensation | $218,275 | In the third quarter of 2014 3,525,000 stock options were granted of which 72% vested immediately and resulted in an expense of $271,126. In the Q3 of 2015, only 400,000 options were granted resulting in a lower charge for stock-based compensation. |
| Exploration | $99,426 | A drilling program at the Nyngan property in Q3 2014 accounted for the higher cost when compared to Q3 2015. Much less exploration work was carried out in 2015 resulting in this favourable variance. |
| Foreign exchange | $58,967 | In 2014 the Company carried higher Canadian dollar bank balances. The lowering in value of the Canadian dollar relative to the American dollar resulted in an exchange loss of $50,240 in Q3 of 2014. In Q3 of 2015 the company experienced a slight gain of $8,727 in foreign exchange transactions. |
| Salaries and benefits | $13,383 | The current quarter favorable variance when compared to one year ago is due in part to the strengthening US dollar as some salaries are paid in foreign funds as well as a reduced work load for accounting staff at head office. |
| Professional fees | $11,630 | Lower activity levels required less professional fee costs in Q3 2015 when compared to one year ago. |
| Insurance | $253 | Costs are relatively the same when compared quarter to quarter. |
| Amortization | $(1) | Costs are the same in Q3 of both 2014 and 2015. |
| Travel and entertainment | $(5,701) | Travel to Australia accounted for the increased costs in the current quarter when compared to Q3 2014. |
| Consulting | $(8,500) | Consulting payments were deferred due to low cash balances in Q3 2014 resulting in lower costs when compared to Q3 2015. |
| General and administrative | $(39,622) | In Q3 2014 the Company took a $59,500 favorable charge for certain accruals for salary in 2013 being renegotiated to much lower costs in 2014. Without this one time charge the actual G&A costs would have been higher in Q3 2014. |
| Q3 2015 vs. Q3 2014 - Variance Analysis | ||
| Item | Variance | |
| Favourable / | Explanation | |
| (Unfavourable) | ||
| Interest expense | $(72,083) | Interest on the $2,500,000 loan taken out in Q2 2014 had quarterly escalating interest rates. The interest expense in Q3 2014 was calculated at a much higher interest rate when compared to Q3, 2014. |
Results of Operations for the nine months ended September 30, 2015
The net loss for the nine month period was $1,606,709, an increase of $334,227 from $1,272,482 during the same period of the prior year. Details of the individual items contributing to the increased net loss are as follows:
| Nine months ending September 30, 2015 vs. nine months ending September 30, 2014 - | ||
| Variance Analysis | ||
| Item | Variance | |
| Favourable / | Explanation | |
| (Unfavourable) | ||
| Interest expense | $(147,109) | During the first three quarter of 2014, interest expense was lower due to the fact that the sale of the Springer mine in Q4 2013 provided enough cash that allowed the Company to defer obtaining financing until the end of Q2 2014 when a $2,500,000 loan was obtained. This loan carried quarterly escalating interest rates resulting in higher interest charges in 2015 when compared to 2014. The loan was extinguished in Q3 2015 when it was converted to a 20% carried interest in the Company’s Australian properties. |
| Stock-based compensation | $(103,572) | In the current nine month period, 5,350,000 stock options were granted with 53% of those vesting immediately. In the comparable nine month period one year ago there were 3,925,000 options issued resulting in lower expenses. |
| Consulting | $(53,500) | There was little consulting work done in the nine month period ending September 30, 2014 when the Company was making efforts to reduce costs. |
| General and administrative | $(42,872) | The higher G&A costs in the nine months ended September 30, 2015 are a result of higher patent fees, marketing costs and IT support. These costs were partially offset by lower office rent and TSX fees. |
| Nine months ending September 30, 2015 vs. nine months ending September 30, 2014 - | ||
| Variance Analysis | ||
| Item | Variance | |
| Favourable / | Explanation | |
| (Unfavourable) | ||
| Exploration | $(34,995) | Lab and metallurgical work at the Nyngan property in the current nine month period following up on the Q3 2014 drilling program resulted in this negative variance when compared with the nine month period in 2014 when a minor exploration program was carried out |
| Salaries and benefits | $(32,214) | Increased salary expenses in the current nine month period relate to the return of the CFO to a more active role in the Company. Also in the first nine months of 2014, certain management staff elected to forgo salary when there was little activity at the Company. |
| Travel and entertainment | $(9,527) | This unfavorable variance is due to travel to seek potential Company investor interest in Australia, Europe and North America. In the prior year cash conservation limited this type of expense. |
| Insurance | $1,656 | This favorable variance is the result of audit refunds on workers compensation premiums charged in the prior year. Without this adjustment, insurance charges when compared quarter to quarter would have been the same. |
| Foreign exchange | $42,272 | The company reports operations in US dollars and holds cash in both US dollar and Canadian dollar bank accounts to support operations. In Q3 2015, the Canadian dollar balances held were minimal when compared to Q3 2014. The continued weakening of the Canadian dollar in 2014 made those assets held in Canadian dollars worth less when converted to US dollars. |
| Professional fees | $45,634 | The legal fees associated with the financing obtained in Q2 2014 are not replicated in 2015, resulting in this positive variance. |
Cash flow discussion for the nine month period ended September 30, 2015 compared to September 30, 2014
The cash outflow for operating activities was $1,040,120 an increase of $95,586 (September 30, 2014 – $944,534), due to increased activity levels as described in the variance analysis.
Cash outflows for investing activities were $Nil (September 30, 2014 – $1,214,163). In 2014, the company purchased full title to the Nyngan scandium project in Australia.
Cash inflows from financing activities decreased by $745,003 to $1,775,885 (September 30, 2014 – $2,520,888), reflecting the repayment of a convertible debenture and promissory note totaling $1,854,875 in the first six months of 2014 which was offset by the issuance of a new promissory note of $2,500,000 in the first half of 2014 and by an increase in private placement funds of $97,298.
Financial Position
Cash
The Company’s cash position increased during the nine month period by $735,765 to $1,153,151 (December 31, 2014 - $417,386) due primarily to private placement proceeds.
Prepaid expenses and receivables
Prepaid expenses and accounts receivable decreased by $42,013 to $15,420 due to expensing of prepaid insurances and receipt of value added tax refunds from Australia and Canada (December 31, 2014 - $57,433).
Property, plant and equipment
Property, plant and equipment consist of office furniture and computer equipment at the Sparks, Nevada office. The decrease of $2,875 to $3,569 (December 2014 - $6,444) is due to amortization of net fixed assets.
Mineral interests
Mineral interests remained the same at $3,012,723.
Accounts payable and accrued liabilities and accounts payable with related parties
Accounts payable has decreased by $23,425 to $49,820 (December 2014 – $73,245) due to payment of accounts payable bringing payables current.
Promissory notes payable
The promissory notes payable was reduced to zero with the conversion of the $2,500,000 outstanding at December 31, 2014 to a 20% share in the Australian properties.
Capital Stock
Capital stock increased by $1,955,864 to $91,142,335 (December 31, 2014 $89,186,471) due to private placements and the exercise of stock options.
Additional paid-in capital increased by $2,865,147 to $5,284,762 (December 31, 2014 - $2,419,615) as a result of expensing of stock options and the conversion of debt to a 20% minority interest in the Company’s Australian properties, which was partially offset by the exercise of stock options.
Liquidity and Capital Resources
At September 30, 2015, the Company had working capital of $1,118,751, including cash of $1,153,151, as compared to a working capital deficit of $2,098,426, including cash of $417,386, at December 31, 2014. The increase is due to the issuance of share capital and the conversion of debt to a 20% minority interest in the Company’s Australian properties.
At September 30, 2015, the Company had a total of 18,110,000 stock options exercisable between CAD$0.07 and CAD$0.315 that have the potential upon exercise to generate a total of C$2,083,050 in cash over the next five years. There is no assurance that these securities will be exercised.
The Company’s continued development is contingent upon its ability to raise sufficient financing both in the short and long term. There are no guarantees that additional sources of funding will be available to the Company. However, management is committed to pursuing all possible sources of financing (internal and external) in order to execute its business plan.
Results of Operations
Outstanding share data
At the date of this report, the Company has 225,047,200 issued and outstanding common shares and 18,110,000 stock options currently outstanding at a weighted average exercise price of CAD$0.12.
Off-balance sheet arrangements
At September 30, 2015, the Company had no material off-balance sheet arrangements such as guarantee contracts, contingent interest in assets transferred to an entity, derivative instruments obligations or any obligations that trigger financing, liquidity, market or credit risk to the Company.
Transactions with related parties
The loan financing completed on February 22, 2013, of which $350,000 was contributed from directors and officers was repaid in the three months ending March 31, 2014.
During the nine month period ended September 30, 2015, the Company incurred a consulting fee of $79,000 for one of its directors. During the nine month period ended September 30, 2014, the Company incurred a consulting fee of $25,500 for one of its directors.
Of the $79,033 interest expensed in the nine month period ended September 30, 2014, $14,375 was payable to a director of the Company. There was no interest paid to related parties in the nine month period ended September 30, 2015.
During the nine month period ended September 30, 2015, the Company expensed $232,452 for stock-based compensation for stock options issued to Company directors. During the nine month period ended September 30, 2014, the Company expensed $211,999 for stock options issued to Company directors.
On September 30, 2014, $21,902 was payable to a related party. On September 30, 2015, $5,265 was payable to a related party.
Non-Cash Transactions
The Company converted the $2,500,000 loan it had arranged in 2014 to a 20% minority interest in its Australian subsidiary, EMC Australia Pty Ltd. and issued 2,237,480 common shares at a value of $169,262 in settlement of accounts payable and accrued liabilities.
Proposed Transactions
There are no proposed transactions outstanding other than as disclosed herein.
Critical Accounting Estimates
The preparation of financial statements in conformity with generally accepted accounting policies requires management of the Company to make estimates and assumptions that affect the reported amounts of assets and liabilities at the date of the financial statements and the reported amounts of revenues and expenses during the reporting period. These estimates are based on past experience, industry trends and known commitments and events. By their nature, these estimates are subject to measurement uncertainty and the effects on the financial statements of changes in such estimates in future periods could be significant. Actual results will likely differ from those estimates.
Stock-based compensation
The Company uses the Black-Scholes option pricing model to calculate the fair value of stock options and compensatory warrants granted. This model is subject to various assumptions. The assumptions the Company makes will likely change from time to time. At the time the fair value is determined; the methodology the Company uses is based on historical information, as well as anticipated future events. The assumptions with the greatest impact on fair value are those for estimated stock volatility and for the expected life of the instrument.
Future income taxes
The Company accounts for tax consequences of the differences in the carrying amounts of assets and liabilities and their tax bases using tax rates expected to apply when these temporary differences are expected to be settled. When the future realization of income tax assets does not meet the test of being more likely than not to occur, a valuation allowance in the amount of the potential future benefit is taken and no future income tax asset is recognized. The Company has taken a valuation allowance against all such potential tax assets.
Mineral properties and exploration and development costs
The Company capitalizes the costs of acquiring mineral rights at the date of acquisition. After acquisition, various factors can affect the recoverability of the capitalized costs. The Company’s recoverability evaluation of our mineral properties and equipment is based on market conditions for minerals, underlying mineral resources associated with the assets and future costs that may be required for ultimate realization through mining operations or by sale. The Company is in an industry that is exposed to a number of risks and uncertainties, including exploration risk, development risk, commodity price risk, operating risk, ownership and political risk, funding and currency risk, as well as environmental risk. Bearing these risks in mind, the Company has assumed recent world commodity prices will be achievable. The Company has considered the mineral resource reports by independent engineers on the Nyngan project in considering the recoverability of the carrying costs of the mineral properties. All of these assumptions are potentially subject to change, out of our control, however such changes are not determinable. Accordingly, there is always the potential for a material adjustment to the value assigned to mineral properties and equipment.
Recent Accounting Pronouncements
Accounting Standards Update 2014-15 – Presentation of Financial Statements – Going Concern (Subtopic 205-40). This accounting pronouncement provides guidance in GAAP about management’s responsibility to evaluate whether there is substantial doubt about an entity’s ability to continue as a going concern and to provide related footnote disclosures. In doing so, the amendments should reduce diversity in the timing and content of footnote disclosures. The policy is effective December 15, 2016. The Company is evaluating this guidance and believes it will have little impact on the presentation of its financial statements.
Accounting Standards Update 2015-01 - Income Statement—Extraordinary and Unusual Items (Subtopic 225-20). This Update is part of an initiative to reduce complexity in accounting standards (the Simplification Initiative). This Update eliminates from GAAP the concept of extraordinary items. The amendments in this Update are effective for fiscal years, and interim periods within those fiscal years, beginning after December 15, 2015. The Company is evaluating this guidance and believes it will have little impact on the presentation of its financial statements.
Accounting Standards Update 2015-02 - Consolidation (Topic 810) - Amendments to the Consolidation Analysis. This update provides guidance with respect to the analysis that a reporting entity must perform to determine whether it should consolidate certain types of legal entities. The amendments in this Update are effective for public business entities for fiscal years, and for interim periods within those fiscal years, beginning after December 15, 2015. The Company is evaluating this guidance and believes it will have little impact on the presentation of its financial statements.
Financial instruments and other risks
The Company’s financial instruments consist of cash, receivables, accounts payable, accounts payable with related parties, accrued liabilities and promissory notes payable. It is management's opinion that the Company is not exposed to significant interest, currency or credit risks arising from its financial instruments. The fair values of these financial instruments approximate their carrying values unless otherwise noted. The Company has its cash primarily in two commercial banks, one in Vancouver, British Columbia, Canada and in one in Chicago, Illinois.
Information Regarding Forward-Looking Statements
This Management’s Discussion and Analysis of Financial Condition and Results of Operations contain certain forward-looking statements. Forward-looking statements include but are not limited to those with respect to the prices of metals, the estimation of mineral resources and reserves, the realization of mineral reserve estimates, the timing and amount of estimated future production, costs of production, capital expenditures, costs and timing of the development of new deposits, success of exploration activities, permitting time lines, currency fluctuations, requirements for additional capital, Government regulation of mining operations, environmental risks, unanticipated reclamation expenses, title disputes or claims and limitations on insurance coverage and the timing and possible outcome of pending litigation. In certain cases, forward-looking statements can be identified by the use of words such as “plans”, “expects” or “does not expect”, “is expected”, “estimates”, “intends”, “anticipates” or “does not anticipate”, or “believes” or variations of such words and phrases, or statements that certain actions, events or results “may”, “could”, “would”, or “will” be taken, occur or be achieved. Forward-looking statements involve known and unknown risks, uncertainties and other factors which may cause the actual results, performance or achievements of Scandium International to be materially different from any future results, performance or achievements expressed or implied by the forward-looking statements. Such risks and uncertainties include, among others, the actual results of current exploration activities, conclusions or economic evaluations, changes in project parameters as plans continue to be refined, possible variations in grade and or recovery rates, failure of plant, equipment or processes to operate as anticipated, accidents, labor disputes or other risks of the mining industry, delays in obtaining government approvals or financing or incompletion of development or construction activities, risks relating to the integration of acquisitions, to international operations, and to the prices of metals. While Scandium International has attempted to identify important factors that could cause actual actions, events or results to differ materially from those described in forward-looking statements, there may be other factors that cause actions, events or results not to be as anticipated, estimated or intended. There can be no assurance that forward-looking statements will prove to be accurate, as actual results and future events could differ materially from those anticipated in such statements. Accordingly, readers should not place undue reliance on forward-looking statements. Scandium International expressly disclaims any intention or obligation to update or revise any forward-looking statements, whether as a result of new information, future events or otherwise.
| Item 3. | Quantitative and Qualitative Disclosures About Market Risk |
Not applicable.
| Item 4. | Controls and Procedures |
Disclosure controls and procedures
The Company’s management is responsible for establishing and maintaining adequate disclosure controls and procedures. The Company’s management, including our principal executive officer and our principal financial officer, evaluated the effectiveness of our disclosure controls and procedures (as defined in Exchange Act Rule 13a-15(e)) as of the end of the period covered by this report. Based on that evaluation, the principal executive officer and principal financial officer concluded that as of the end of the period covered by this report, the Company has maintained effective disclosure controls and procedures in all material respects, including those necessary to ensure that information required to be disclosed in reports filed or submitted with the SEC (i) is recorded, processed, and reported within the time periods specified by the SEC, and (ii) is accumulated and communicated to management, including the principal executive officer and principal financial officer, as appropriate to allow for timely decision regarding required disclosure.
Changes in Internal Control
There have been no changes in internal control over financial reporting that occurred during the last fiscal quarter that have materially affected, or are reasonably likely to materially affect, internal control over financial reporting.
PART II – OTHER INFORMATION
| Item 6. | Exhibits |
| 31.1 | Certification of the Principal Executive Officer, pursuant to Rule 13a-14(a) or 15d-14(a) of the U.S. Securities Exchange Act of 1934 (filed herewith) |
| 31.2 | Certification of the Principal Financial Officer, pursuant to Rule 13a-14(a) or 15d-14(a) of the U.S. Securities Exchange Act of 1934 (filed herewith) |
| 32.1 | Section 1350 Certification of the Principal Executive Officer (filed herewith) |
| 32.2 | Section 1350 Certification of the Principal Financial Officer (filed herewith) |
| 101 | Financial Statements from the Quarterly Report on Form 10-Q of the Company for the three months ended June 30, 2015, formatted in XBRL (filed herewith) |
SIGNATURES
Pursuant to the requirements of the Securities Exchange Act of 1934, the registrant has duly caused this report to be signed on its behalf by the undersigned thereunto duly authorized.
Date: November 12, 2015
| SCANDIUM INTERNATIONAL MINING CORP. | ||
| (Registrant) | ||
| By: | /s/ George Putnam | |
| George Putnam | ||
| Principal Executive Officer | ||
| By: | /s/ Edward Dickinson | |
| Edward Dickinson | ||
| Principal Financial Officer | ||