Attached files
| file | filename |
|---|---|
| EX-99.1 - EXHIBIT 99.1 - HOOPER HOLMES INC | a51223000ex99_1.htm |
| 8-K - HOOPER HOLMES, INC. 8-K - HOOPER HOLMES INC | a51223000.htm |
Exhibit 99.2
1 Hooper Holmes, Inc. November 12, 2015 Earnings Presentation Speakers: Henry Dubois, Chief Executive Officer Steven Balthazor, Chief Financial Officer

2 Safe Harbor Statement 2 This presentation contains forward‐looking statements, as such term is defined in the Private Securities Litigation Reform Act of 1995, concerning the Company’s plans, objectives, goals, strategies, future events or performances, which are not statements of historical fact and can be identified by words such as: “expect,” “continue,” “should,” “may,” “will,” “project,” “anticipate,” “believe,” “plan,” “goal,” and similar references to future periods. The forward‐looking statements contained in this presentation reflect our current beliefs and expectations. Actual results or performance may differ materially from what is expressed in the forward looking statements. Among the important factors that could cause actual results to differ materially from those expressed in, or implied by, the forward‐looking statements contained in this presentation are our ability to realize the expected benefits from the acquisition of Accountable Health Solutions and our strategic alliance with Clinical Reference Laboratory; our ability to successfully implement our business strategy and integrate Accountable Health Solutions’ business with ours; our ability to retain and grow our customer base; our ability to recognize operational efficiencies and reduce costs; uncertainty as to our working capital requirements over the next 12 to 24 months; our ability to maintain compliance with the financial covenants contained in our credit facilities; the rate of growth in the Health and Wellness market and such other factors as discussed in Part I, Item 1A, Risk Factors, and Part II, Item 7, Management’s Discussion and Analysis of Financial Conditions and Results of Operations of our Annual Report on Form 10‐K for the year ended December 31, 2014. The Company undertakes no obligation to update or release any revisions to these forward‐looking statements to reflect events or circumstances, or to reflect the occurrence of unanticipated events, after the date of this presentation, except as required by law. This presentation contains information from third‐party sources, including data from studies conducted by others and market data and industry forecasts obtained from industry publications. Although the Company believes that such information is reliable, the Company has not independently verified any of this information and the Company does not guarantee the accuracy or completeness of this information. Any references to documents not included in the presentation itself are qualified by the full text and content of those documents. During our prepared comments or responses to your questions, we may offer incremental metrics to provide greater insight into the dynamics of our business or our quarterly results, such as references to EBITDA and other measures of financial performance. Please be advised that this additional detail may be one‐time in nature and we may or may not provide an update in the future. These and other financial measures may also have been prepared on a non‐GAAP basis. For some of these measures, a reconciliation schedule showing GAAP versus non‐GAAP results has been provided in our press release that was issued after the market closed today.
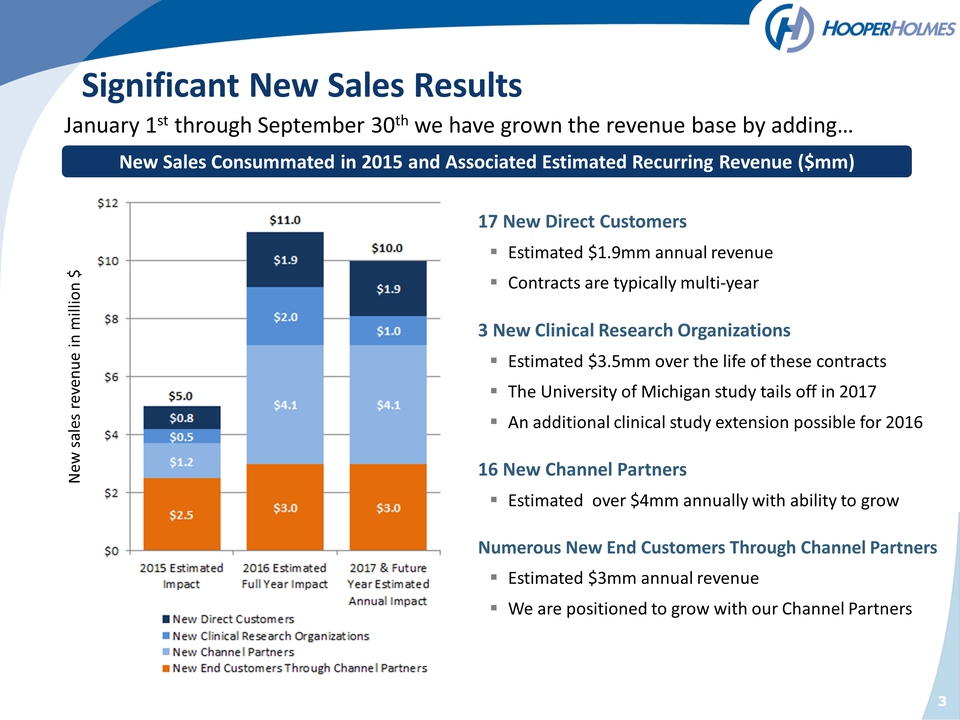
3 Significant New Sales
Results January 1st through September 30th we have grown the revenue
base by adding… New Sales Consummated in 2015 and Associated Estimated
Recurring Revenue ($mm) New sales revenue in million $ 17 New Direct
Customers Estimated $1.9mm annual revenue Contracts are typically
multi‐year 3 New Clinical Research Organizations Estimated $3.5mm over
the life of these contracts The University of Michigan study tails off
in 2017 An additional clinical study extension possible for 2016 16
New Channel Partners Estimated over $4mm annually with ability to grow
Numerous New End Customers Through Channel Partners Estimated $3mm
annual revenue We are positioned to grow with our Channel Partners
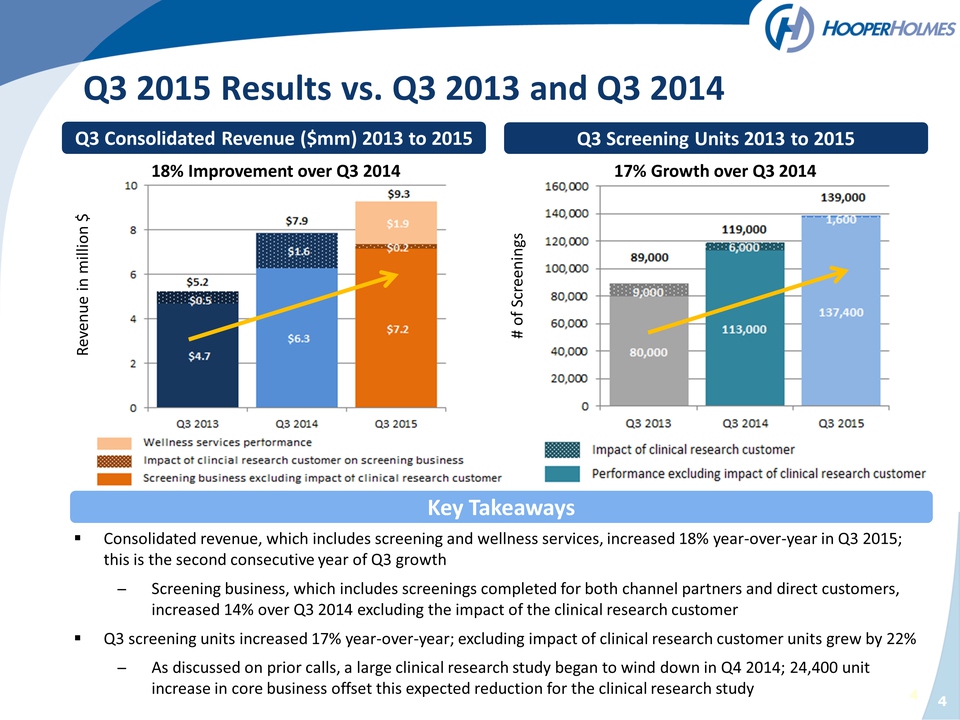
4 Q3 Consolidated Revenue
($mm) 2013 to 2015 Q3 Screening Units 2013 to 2015 Consolidated
revenue, which includes screening and wellness services, increased 18%
year‐over‐year in Q3 2015; this is the second consecutive year of Q3
growth ̶ Screening business, which includes screenings completed for
both channel partners and direct customers, increased 14% over Q3 2014
excluding the impact of the clinical research customer Q3 screening
units increased 17% year‐over‐year; excluding impact of clinical
research customer units grew by 22% ̶ As discussed on prior calls, a
large clinical research study began to wind down in Q4 2014; 24,400 unit
increase in core business offset this expected reduction for the
clinical research study Key Takeaways # of Screenings Q3 2015 Results
vs. Q3 2013 and Q3 2014 18% Improvement over Q3 2014 17% Growth over Q3
2014 Revenue in million $
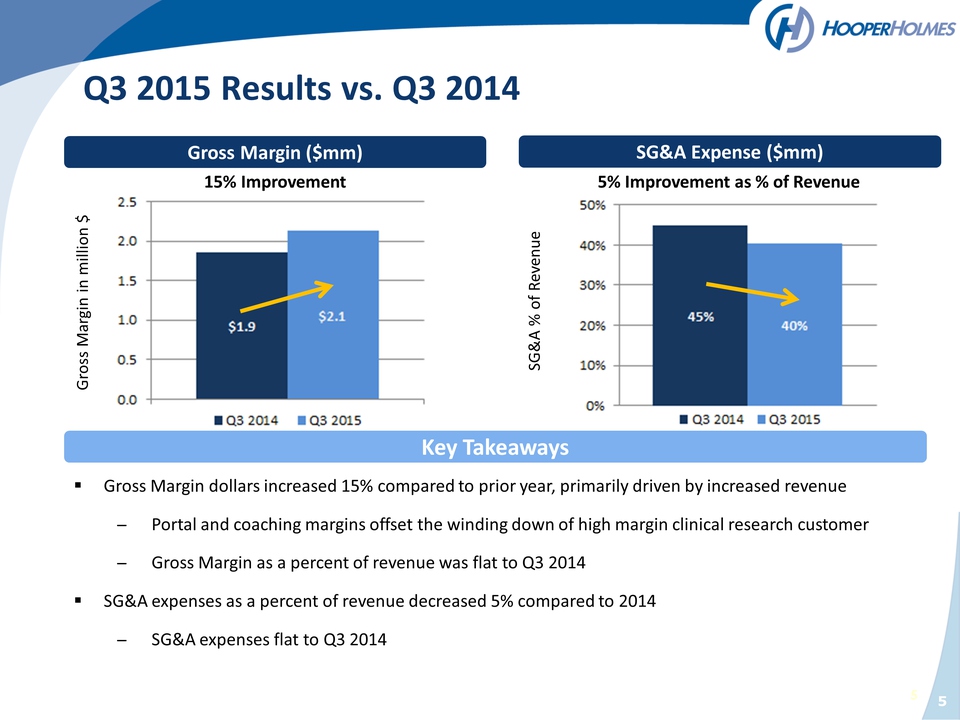
5 Gross Margin ($mm) SG&A Expense ($mm) Gross Margin dollars increased 15% compared to prior year, primarily driven by increased revenue ̶ Portal and coaching margins offset the winding down of high margin clinical research customer ̶ Gross Margin as a percent of revenue was flat to Q3 2014 SG&A expenses as a percent of revenue decreased 5% compared to 2014 ̶ SG&A expenses flat to Q3 2014 Key Takeaways Q3 2015 Results vs. Q3 2014 15% Improvement 5% Improvement as % of Revenue Gross Margin in million $ SG&A % of Revenue
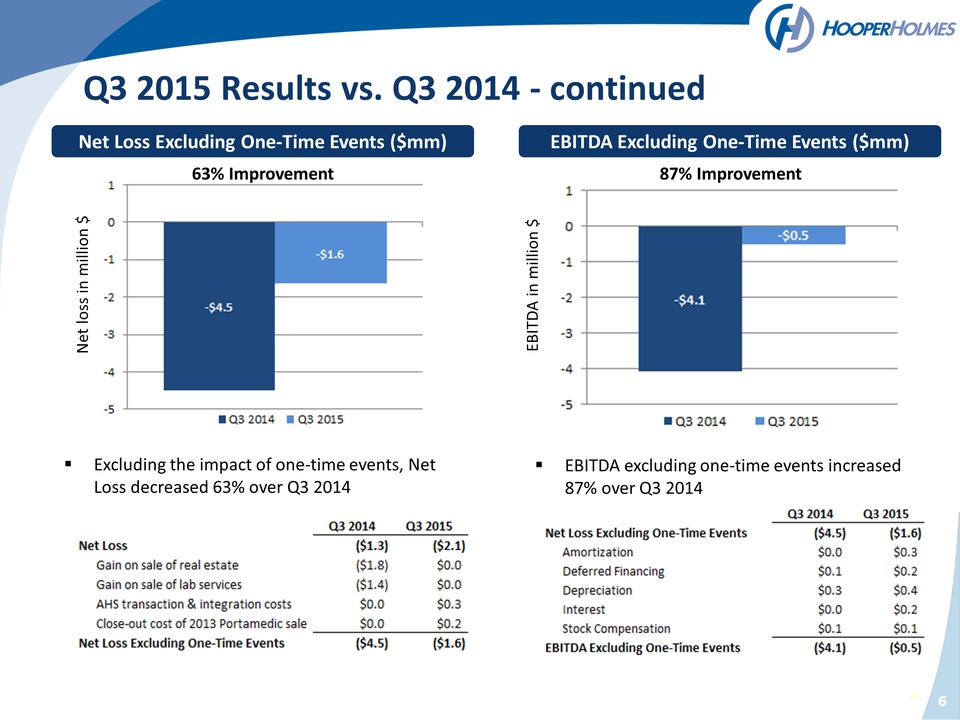
6 Net Loss Excluding
One‐Time Events ($mm) Excluding the impact of one‐time events, Net
Loss decreased 63% over Q3 2014 Q3 2015 Results vs. Q3 2014 ‐ continued
63% Improvement EBITDA Excluding One‐Time Events ($mm) 87% Improvement
EBITDA excluding one‐time events increased 87% over Q3 2014 Net loss in
million $ EBITDA in million $
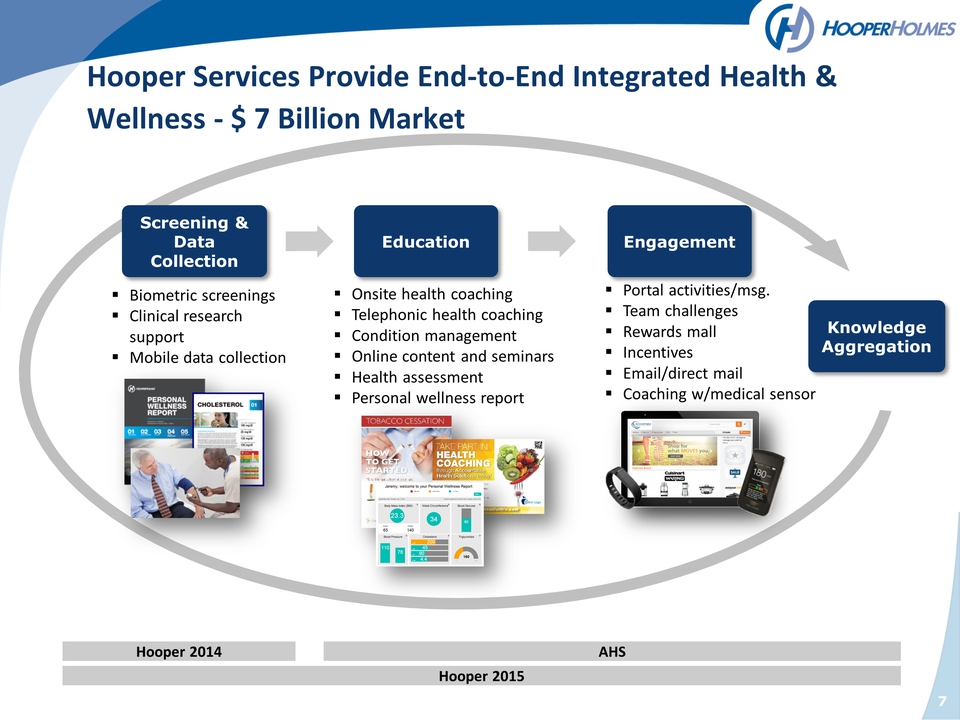
Biometric screenings Clinical research support Mobile data collection Portal activities/msg. Team challenges Rewards mall Incentives Email/direct mail Coaching w/medical sensor plans ‐ future Onsite health coaching Telephonic health coaching Condition management Online content and seminars Health assessment Personal wellness report plans ‐ future 7 Hooper Services Provide End‐to‐End Integrated Health & Wellness ‐ $ 7 Billion Market Data Collection Screening & Education Engagement Knowledge Aggregation Hooper 2015 Hooper 2014 AHS
Customer & Client
Testimonials “This has been the most well organized, and professionally
orchestrated Screening clinic in the history of our onsite program.” –
Human Resources Director of a direct customer “The Site Manager and her
group did a fantastic job working our event. They were courteous and
quick and the professionals everyone wants at their event. Thank you for
making our event a true success.” – Channel Partner customer “Thanks for
the professional company which did the screening this year – Hooper
Holmes is great. The setup was private, the process was easier,
technical, painless, and faster. The examiner was sweet and I was
relaxed while she took all of my vitals.” – Direct customer “A
participant called and wanted to personally thank the examiner she saw
the day of her screening. She said her first blood pressure reading was
extremely high. The examiner sat with her and tried to calm her down.
Since that didn’t appear to be working, she left work and went to the
doctor immediately. Her physician put her on medication and she had to
stay overnight in the hospital. They are now working together to monitor
and lower he blood pressure. She shared with us that she feels like the
examiner sincerely saved her life.” – Screening participant “Hooper
Holmes offers a user‐friendly portal design to inspire and motivate the
employee to take small steps towards better well‐being.” – Large, full
service wellness client “After the 2014 health screening I received a
phone call that I was eligible to receive health coaching. I took them
up on the offer and lost over 30 lbs. between Fall 2014 and Spring 2015.
It was just the boost I needed to make some needed health changes.” –
Health coaching participant 8
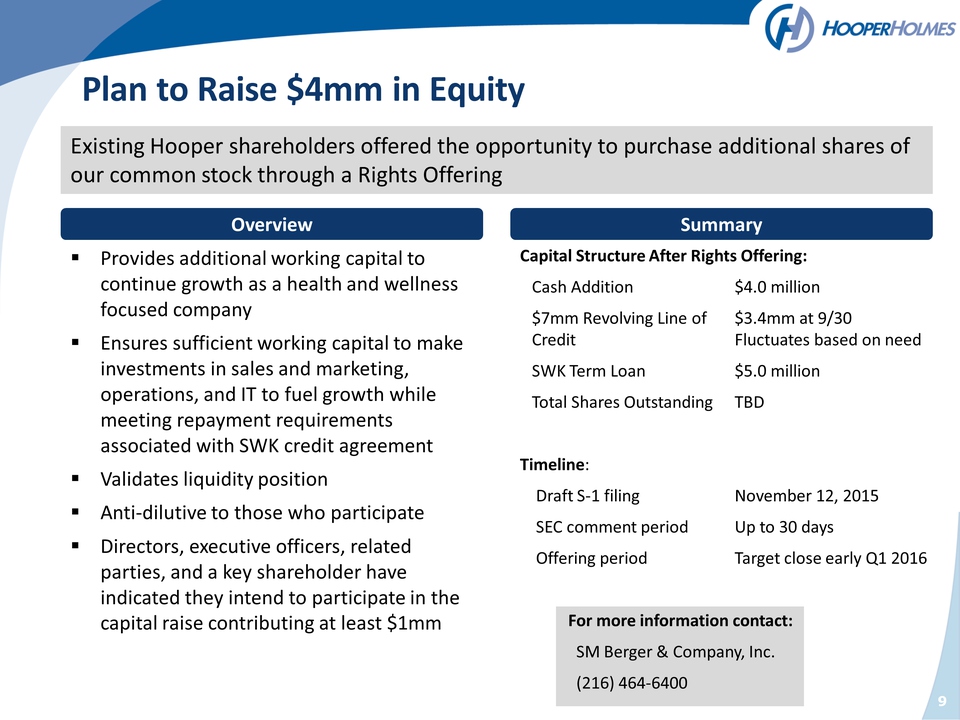
9 Plan to Raise $4mm in
Equity Existing Hooper shareholders offered the opportunity to purchase
additional shares of our common stock through a Rights Offering
Provides additional working capital to continue growth as a health and
wellness focused company Ensures sufficient working capital to make
investments in sales and marketing, operations, and IT to fuel growth
while meeting repayment requirements associated with SWK credit
agreement Validates liquidity position Anti‐dilutive to those who
participate Directors, executive officers, related parties, and a key
shareholder have indicated they intend to participate in the capital
raise contributing at least $1mm Summary Capital Structure After Rights
Offering: Cash Addition $4.0 million $7mm Revolving Line of Credit
$3.4mm at 9/30 Fluctuates based on need SWK Term Loan $5.0 million Total
Shares Outstanding TBD Timeline: Draft S‐1 filing November 12, 2015 SEC
comment period Up to 30 days Offering period Target close early Q1 2016
For more information contact: SM Berger & Company, Inc. (216) 464‐6400
Overview
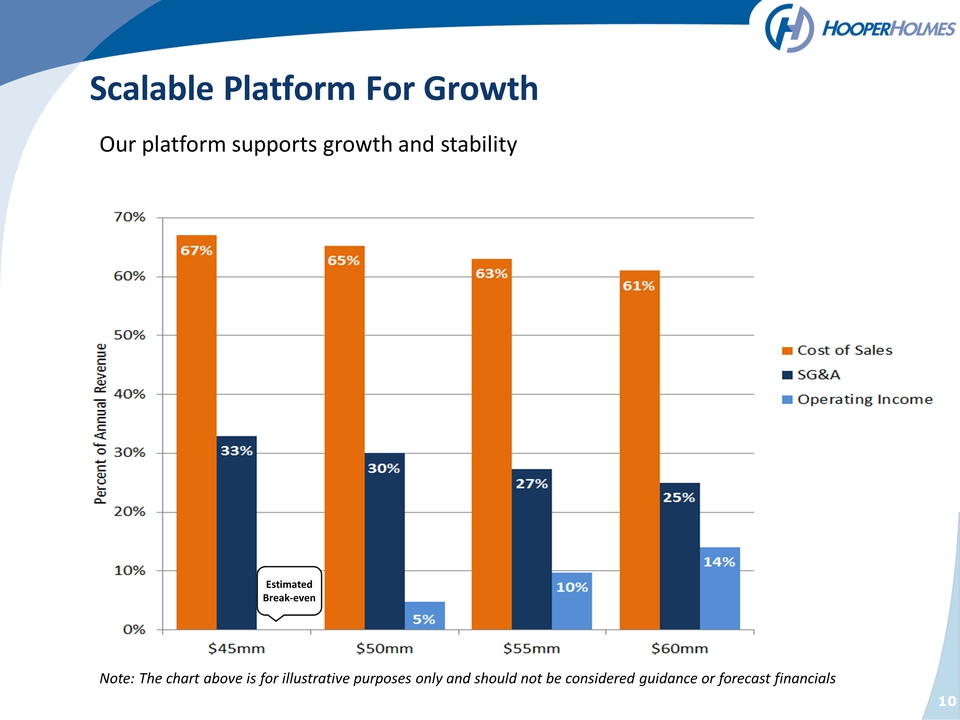
10 Scalable Platform For
Growth Our platform supports growth and stability Note: The chart above
is for illustrative purposes only and should not be considered guidance
or forecast financials Estimated Break‐even