Attached files
| file | filename |
|---|---|
| 8-K - 8-K - Thompson Creek Metals Co Inc. | a8-kq32015.htm |
| EX-99.1 - PRESS RELEASE - Thompson Creek Metals Co Inc. | pressrelease2015q3.htm |

Third Quarter 2015 Investor Conference Call November 9, 2015

2 Webcast Information Webcast: This Webcast can be accessed on the Thompson Creek Metals Company website under the Events Section: www.thompsoncreekmetals.com Q&A Instructions: If you would like to ask a question, please press star 1 on your telephone keypad. If you’re using a speakerphone, please make sure your mute function is turned off to allow your signal to reach the operator.
3 Cautionary Statement Certain statements in this news release, other than purely historical information are "forward-looking statements" within the meaning of the Private Securities Litigation Reform Act of 1995, Section 27A of the Securities Act of 1933 and Section 21E of the Securities Exchange Act of 1934, and applicable Canadian securities legislation and are intended to be covered by the safe harbor provided by these regulations. These forward-looking statements can, in some cases, be identified by the use of such terms as "believe," "project," "expect," "anticipate," "estimate," "intend," "strategy," "future," "opportunity," "plan," "may," "should," "will," "would," "will be," "will continue," "will likely result," and similar expressions. Our forward-looking statements may include, without limitation, statements with respect to: future financial or operating performance of the Company or its subsidiaries and its projects; access to existing or future financing arrangements and ability to refinance or reduce debt on favorable terms or at all; future liquidity; future inventory, production, sales, payments from customers, cash costs, capital expenditures and exploration expenditures; future earnings and operating results; expected impact of an internal corporate restructuring on utilization of tax attributes; expected concentrate and recovery grades; estimates of mineral reserves and resources, including estimated mine life and annual production; statements as to the projected ramp-up at Mount Milligan Mine, including expected achievement of design capacities, decisions regarding whether to proceed with the construction of a permanent secondary crusher, and the effects of secondary crushing; future operating plans and goals, including statements regarding Langeloth's business model; and future molybdenum, copper, gold and silver prices. Where we express an expectation or belief as to future events or results, such expectation or belief is expressed in good faith and believed to have a reasonable basis. However, our forward-looking statements are based on current expectations and assumptions that are subject to risks and uncertainties, which may cause actual results to differ materially from future results expressed, projected or implied by those forward- looking statements. Important factors that could cause actual results and events to differ from those described in such forward-looking statements can be found in the section entitled "Risk Factors" in our 2014 Form 10-K, Quarterly Reports on Form 10-Q and other documents filed on EDGAR at www.sec.gov and on SEDAR at www.sedar.com. Although we have attempted to identify those material factors that could cause actual results or events to differ from those described in such forward-looking statements, there may be other factors, currently unknown to us or deemed immaterial at the present time that could cause results or events to differ from those anticipated, estimated or intended. Many of these factors are beyond our ability to control or predict. Given these uncertainties, the reader is cautioned not to place undue reliance on our forward-looking statements. We undertake no obligation to update or revise publicly any forward-looking statements, whether as a result of new information, future events or otherwise.

4 Management in Attendance Jacques Perron President, Chief Executive Officer and Director Pam Saxton Executive Vice President and Chief Financial Officer Mark Wilson Executive Vice President and Chief Commercial Officer
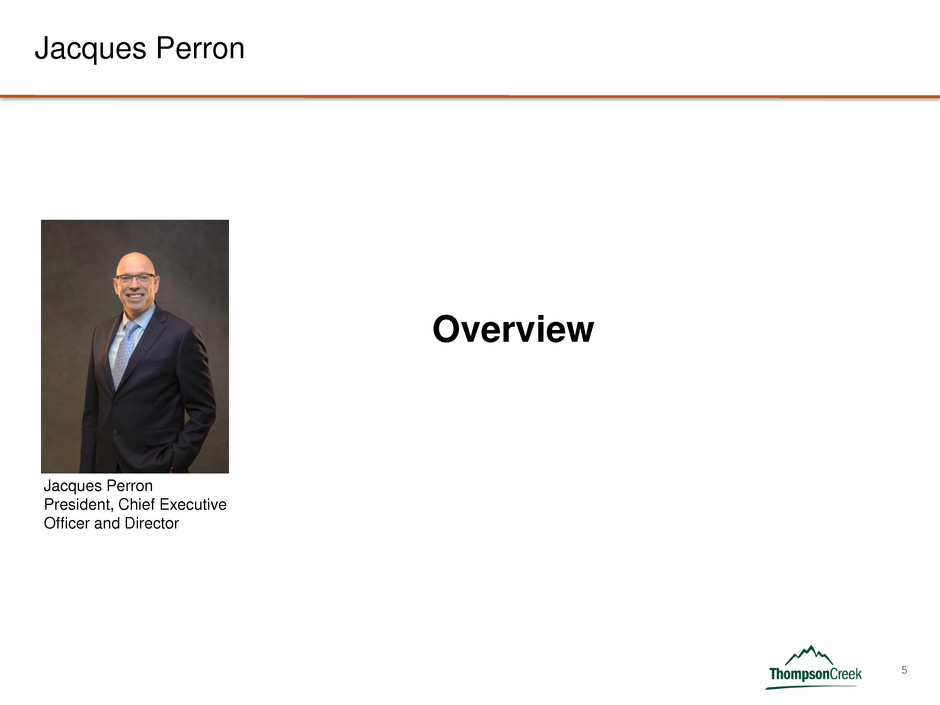
5 Jacques Perron President, Chief Executive Officer and Director Overview Jacques Perron
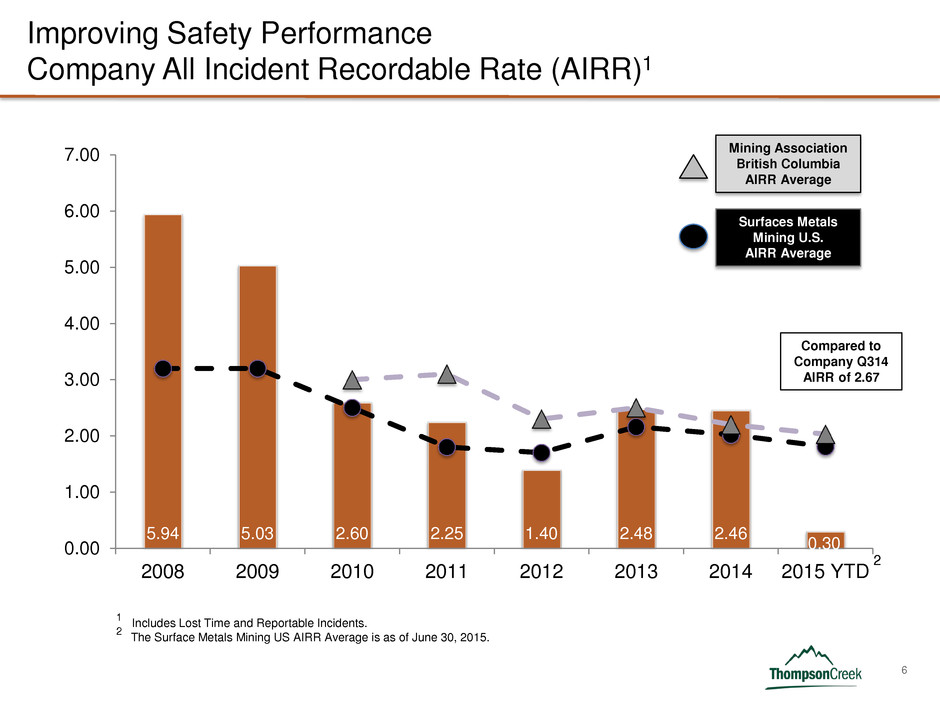
6 Improving Safety Performance Company All Incident Recordable Rate (AIRR)1 5.94 5.03 2.60 2.25 1.40 2.48 2.46 0.30 0.00 1.00 2.00 3.00 4.00 5.00 6.00 7.00 2008 2009 2010 2011 2012 2013 2014 2015 YTD Mining Association British Columbia AIRR Average Surfaces Metals Mining U.S. AIRR Average Compared to Company Q314 AIRR of 2.67 2 1 Includes Lost Time and Reportable Incidents. 2 The Surface Metals Mining US AIRR Average is as of June 30, 2015.

7 Q315 Company Highlights Ended the quarter with excellent cash position of $217 million, which includes $19 million in tax refunds received during the quarter Generated operating cash flow of $39 million Achieved copper and gold sales of $113 million Molybdenum business contributed $29 million to total revenue Molybdenum sales – $23 million Tolling, calcining and other – $6 million

8 Q315 Mount Milligan Highlights Payable production Copper – 16 million pounds Gold – 54 thousand ounces Achieved unit cash cost of negative $0.16 1 per pound of copper produced on a by- product basis net of gold credits Lowered 2015 unit cash cost guidance from $0.70 to $0.90 per pound, to $0.55 to $0.75 per pound of copper produced Completed five copper and gold concentrate shipments and recorded five sales Copper sales – $44 million Gold sales – $70 million Foreign exchange rate Averaged US$1.00 = C$1.31 in Q3; US$1.00 = C$1.26 YTD Favorably impacted cash costs compared to 2014 periods Q3 – $6 million YTD – $16 million 1 Please refer to Appendix for non-GAAP reconciliation.

9 Focused on Continuous Improvements at Mount Milligan Mine Installation of second SAG discharge screen deck completed on October 26, 2015 Commissioning of new configuration completed end of October and both screen decks operating as expected Since restarting operations following the mill shutdown, we have been experiencing gradual improvements in throughput Other than permanent secondary crushing plant, all major modifications required to achieve objectives have been successfully completed Contribution of pre-crush from temporary facility to increase from 10,000 tpd to 15,000 tpd Expect throughput to continue to increase through remainder of the year
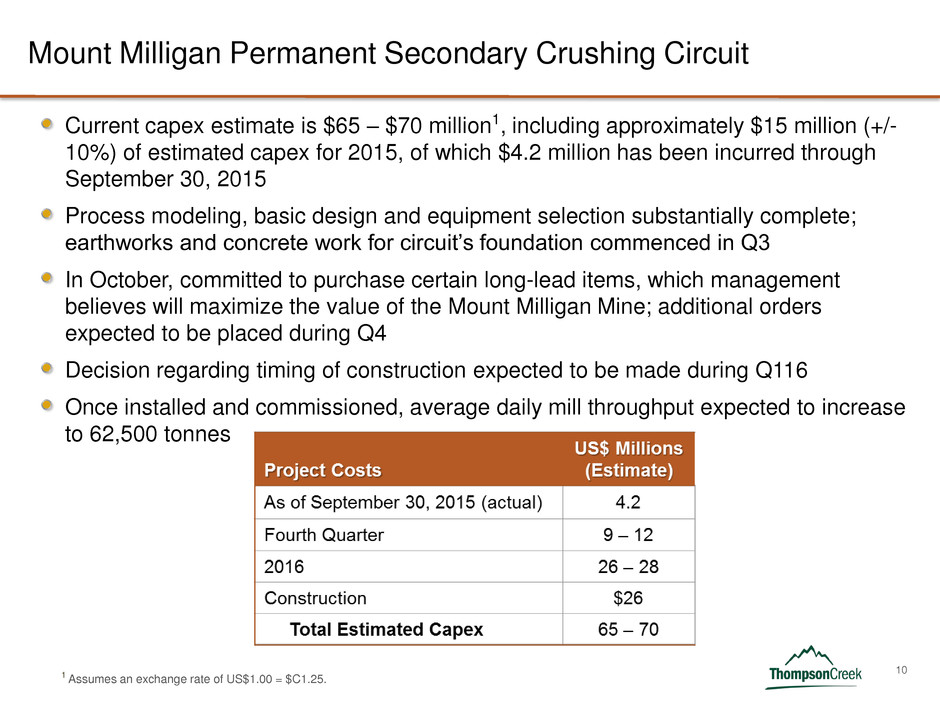
10 Mount Milligan Permanent Secondary Crushing Circuit Current capex estimate is $65 – $70 million1, including approximately $15 million (+/- 10%) of estimated capex for 2015, of which $4.2 million has been incurred through September 30, 2015 Process modeling, basic design and equipment selection substantially complete; earthworks and concrete work for circuit’s foundation commenced in Q3 In October, committed to purchase certain long-lead items, which management believes will maximize the value of the Mount Milligan Mine; additional orders expected to be placed during Q4 Decision regarding timing of construction expected to be made during Q116 Once installed and commissioned, average daily mill throughput expected to increase to 62,500 tonnes 1 Assumes an exchange rate of US$1.00 = $C1.25.

11 Reduced Debt by $127 Million over 9 Quarters Engaged Moelis & Company and BMO Capital Markets to assist the Board in evaluating strategic and financial alternatives available to the Company, including debt financing and restructuring, new capital transactions and asset sales Goal is to have solution in place in advance of debt maturity dates Since completion of Mount Milligan Mine, reduced debt by $127 million, or ≈12.5% (including net repayments of the Company’s capital leases) $1,019 $1,013 $1,004 $984 $977 $945 $939 $898 892 $800 $850 $900 $950 $1,000 $1,050 Q313 Q413 Q114 Q214 Q314 Q414 Q115 Q215 Q315 (US$ in millions)

12 Maintaining Optionality of Molybdenum Molybdenum business expected to contribute $21 to $23 million of cash flow in 2015, net of care and maintenance costs at two molybdenum mines and excluding capital expenditures The Langeloth metallurgical facility has developed a cash generating business Provides molybdenum conversion services Purchases molybdenum concentrates and upgrades for sale of finished products Langeloth has very limited exposure to the molybdenum price, as it provides conversion services and buys concentrates at a discount that is greater than its costs to upgrade the concentrate Langeloth is one of the largest independent molybdenum conversion plants in the world

13 Pam Saxton Executive Vice President and Chief Financial Officer Financial Review Pam Saxton

14 Financial Summary | Q315 vs Q314 142 229 11 64 44 91 (61) (11) (5) 38 39 83 [millions of US$] Revenue Operating Income Net Loss Adjusted Net (Loss) Income Operating Cash Flow 1 Please refer to Appendix for non-GAAP reconciliation. 1 Non-GAAP EBITDA 1 Q315 Q314

15 Financial Summary | YTD 2015 vs YTD 2014 399 639 28 134 112 221 (148) 11 (33) 65 57 150 [millions of US$] Revenue Operating Income Net (Loss) Income Adjusted Net (Loss) Income Operating Cash Flow 1 Please refer to Appendix for non-GAAP reconciliation. YTD 2015 YTD 2014 1 Non-GAAP EBITDA 1
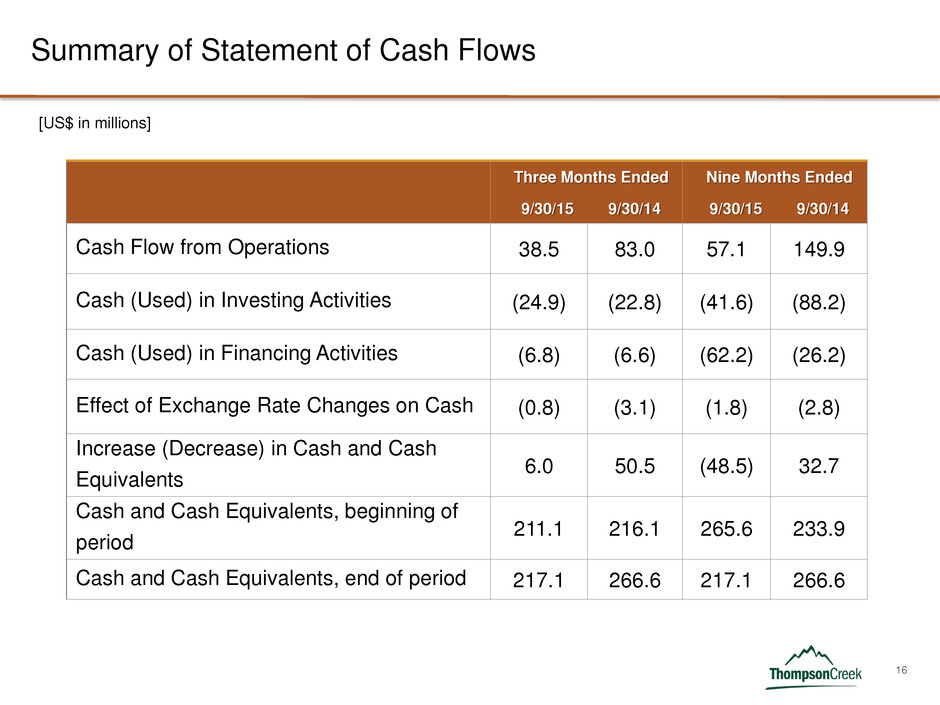
16 Three Months Ended 9/30/15 9/30/14 Nine Months Ended 9/30/15 9/30/14 Cash Flow from Operations 38.5 83.0 57.1 149.9 Cash (Used) in Investing Activities (24.9) (22.8) (41.6) (88.2) Cash (Used) in Financing Activities (6.8) (6.6) (62.2) (26.2) Effect of Exchange Rate Changes on Cash (0.8) (3.1) (1.8) (2.8) Increase (Decrease) in Cash and Cash Equivalents 6.0 50.5 (48.5) 32.7 Cash and Cash Equivalents, beginning of period 211.1 216.1 265.6 233.9 Cash and Cash Equivalents, end of period 217.1 266.6 217.1 266.6 Summary of Statement of Cash Flows [US$ in millions]

17 Updated 2015 Production and Unit Cost Guidance Year-Ended 12/31/15 (Estimate) (Updated) Year-Ended 12/31/15 (Estimate) (Previous)4 Mount Milligan Copper and Gold Concentrate production (000’s dry tonnes) 140 – 150 140 – 160 Copper payable production (millions lb) 70 – 80 70 – 90 Gold payable production (000’s oz) 210 – 220 200 – 220 Unit cash cost – By-product (US$/payable lb copper production) 1,2 $0.55 – $0.75 $0.70 – $0.90 Molybdenum Business – Cash Inflow (outflow) (US$ in millions) 2,3 Ongoing molybdenum operations – Langeloth $6 – $10 $6 – $10 Suspended molybdenum operations: Thompson Creek Mine Care and maintenance ($8 – $9) ($7 – $10) Phase 8 stripping ($3 – $4) ($4 – $5) Sale of inventory $32 – $34 $32 – $34 Endako Mine (75% share) Temporary suspension, care & maintenance and estimated severance costs ($16 – $18) ($17– $19) Sale of inventory $10 – $11 $10 – $11 Total Cash Flow from Molybdenum Operations $21 – $23 $20 – $21 1 Copper by-product unit cash cost is calculated using gold by-product credits and a gold price of $781 per ounce for the nine months of 2015 and expected gold price of $753 per ounce for the last quarter of 2015, which takes into account the contractual price of $435 per ounce un the Gold Stream Arrangement. 2 Estimates for cash costs, molybdenum cash inflow (outflow) and capital expenditure assume an average foreign exchange rate of US$1.00 = C$1.26 for the first nine months of 2015 and US$1.00 = $1.28 for the last quarter of 2015. 3 Cash flow (outflow) excludes capital expenditures. 4 Previous estimate as of August 6, 2015.

18 Current 2015 Capital Expenditure Guidance Year-Ended December 31, 2015 (Estimate) Capital Expenditures (US$ in millions) 1,2 Mount Milligan operations $22 +/- 10% Mount Milligan tailings dam $24 +/- 10% Mount Milligan secondary crusher engineering and site preparation $15 +/- 10% Mount Milligan vendor claim settlements 3 $13 Langeloth and other $7 +/- 10% Total Cash Capital Expenditures $81 +/- 10% 1 Estimates for cash capital expenditures assume an average foreign exchange rate of US$1.00 = C$1.26 for the first nine months of 2015 and US$1.00 = $1.28 for the last quarter of 2015. 2 Includes 2015 cash capital expenditures, but excludes cash capital expenditures related to 2014 accruals paid in 2015. 3 In July 2015, Terrane Metals Corp., a wholly-owned subsidiary of the Company (“Terrane”), settled outstanding claims from two contractors that provided construction and installation services for the construction of Mount Milligan. The settlement amount was a one-time payment made in the third quarter of 2015.
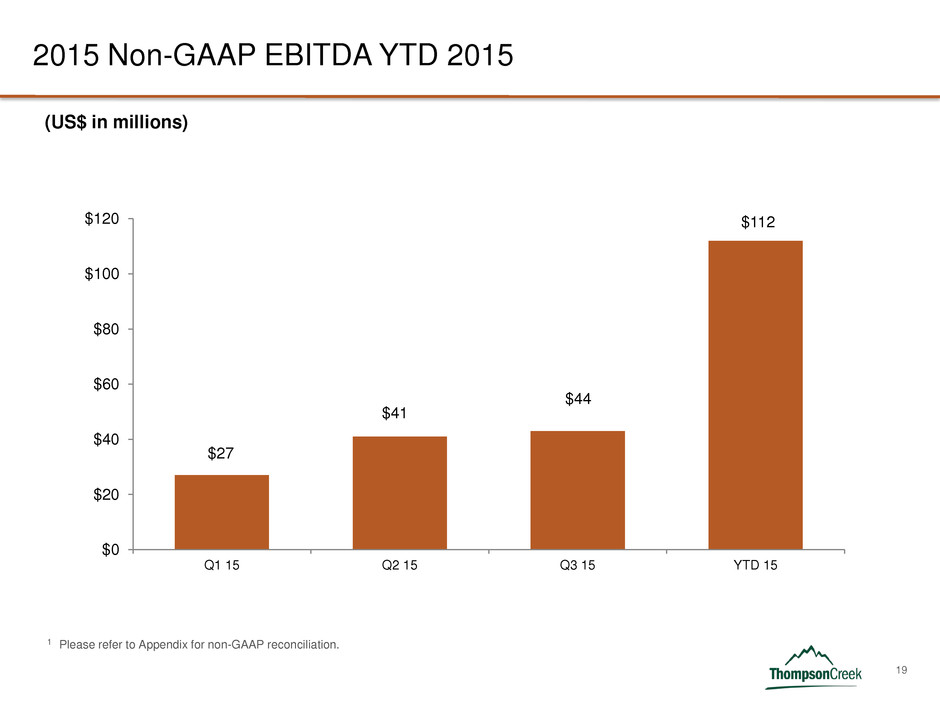
19 2015 Non-GAAP EBITDA YTD 2015 (US$ in millions) $112 $0 $20 $40 $60 $80 $100 $120 Q1 15 Q2 15 Q3 15 YTD 15 $27 $41 $44 1 Please refer to Appendix for non-GAAP reconciliation.

20 Hedging1 Quantity Sell Price Maturities Through Forward Gold Sales (oz) 17,000 $1,130 Oct 2015 – Jun 2016 Forward Copper Sales (lb) 4,409,240 $2.40-$2.45 Oct 2015 – Nov 2015 Quantity Put Price Call Price Maturities Through Gold Collars (oz) 22,500 $1,050- $1,200 $1,151 - $1,360 Oct 2015 – Aug 2016 Copper Collars (lb) 6,613,860 $2.00 $2.99 Oct 2015 – Dec 2015 1 Information is as of September 30, 2015.

21 Significant Positive Impact on Mount Milligan Margins from US$/C$ Foreign Exchange Rate Current US$/C$ exchange rate continues to have positive impact on Mount Milligan operating costs Approximately 90% of costs are in C$ The US$ to C$ average exchange rate for the first nine months of 2015 was US$1.00 = C$1.26. This exchange rate had a positive impact on Mount Milligan operating costs for the first nine months of 2015 of approximately $16 million, or a positive unit cost impact of $0.30 per pound of copper, compared to applying the average US$ to C$ exchange rate for the first nine months of 2014 of US$1.00 = C$1.10 The weakening Canadian dollar supports margins and somewhat mitigates the effects of copper and gold pricing volatility

22 Source: FactSet $2.00 $2.50 $3.00 $3.50 $4.00 31-Dec-13 31-Mar-14 30-Jun-14 30-Sep-14 31-Dec-14 31-Mar-15 30-Jun-15 30-Sep-15 Co pp er P ric e ($/ lb ) Copper Price in US$ Copper Price in C$ Copper Margins Supported by Weakening Canadian Dollar
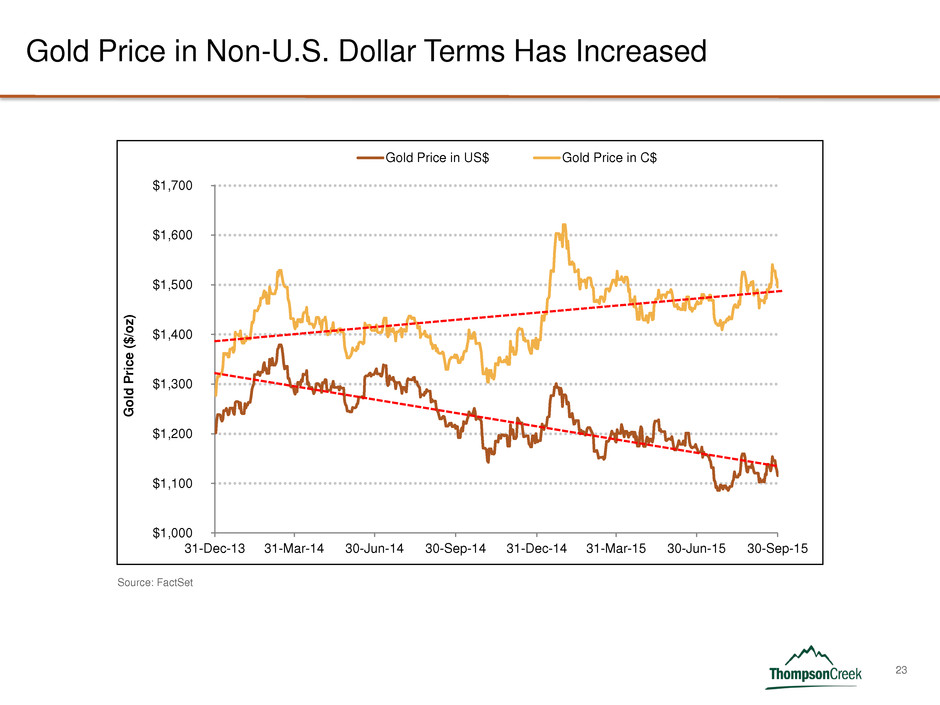
23 $1,000 $1,100 $1,200 $1,300 $1,400 $1,500 $1,600 $1,700 31-Dec-13 31-Mar-14 30-Jun-14 30-Sep-14 31-Dec-14 31-Mar-15 30-Jun-15 30-Sep-15 Go ld P ric e ($/o z) Gold Price in US$ Gold Price in C$ Gold Price in Non-U.S. Dollar Terms Has Increased Source: FactSet

24 Mark Wilson Executive Vice President and Chief Commercial Officer Sales Summary and Market Commentary Mark Wilson

25 Copper (Cu) and Gold (Au) Sales Q315 vs Q314 1 Please refer to Appendix for non-GAAP reconciliation. Cu Sales (millions lbs) Average Realized Sales Price1 (US$/lb) Au Sales (000’s oz) Average Realized Sales Price1 (US$/oz) Cu Revenue (millions US$) Au Revenue (millions US$) $2.09 $3.02 Q315 Q314 Three Months Ended September 30 Three Months Ended September 30 24.4 16.5 $43.5 $45.7 Q315 Q314 Q315 Q314 75.5 58.0 $69.5 $55.0 Q315 Q314 Q315 Q314 $926 $952 Q315 Q314

26 Copper (Cu) and Gold (Au) Sales YTD 2015 vs YTD 2014 1 Please refer to Appendix for non-GAAP reconciliation. Cu Sales (millions lbs) Average Realized Sales Price1 (US$/lb) Au Sales (000’s oz) Average Realized Sales Price1 (US$/oz) $956 $1,002 YTD 2015 YTD 2014 Cu Revenue (millions US$) Au Revenue (millions US$) Nine Months Ended September 30 Nine Months Ended September 30 170.1 133.8 $161.8 $133.5 YTD 2015 YTD 2014 YTD 2015 YTD 2014 60.4 49.2 $125.0 $140.3 YTD 2015 YTD 2014 YTD 2015 YTD 2014 $2.37 $3.10 YTD 2015 YTD 2014
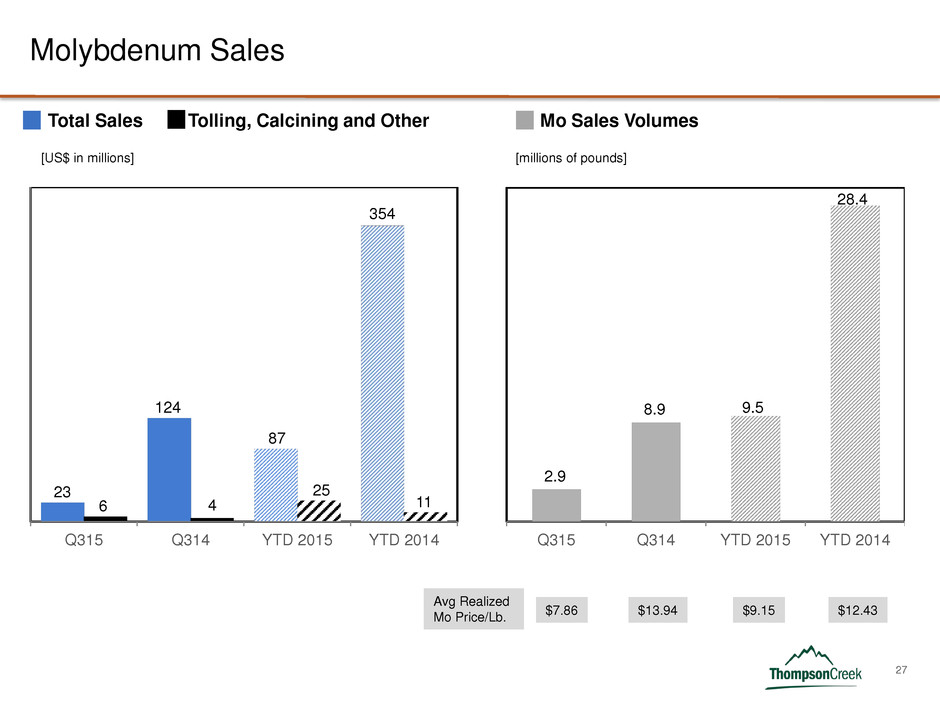
27 Molybdenum Sales Total Sales Tolling, Calcining and Other 23 124 87 354 6 4 25 11 Q315 Q314 YTD 2015 YTD 2014 2.9 8.9 9.5 28.4 Q315 Q314 YTD 2015 YTD 2014 Avg Realized Mo Price/Lb. $9.15 $12.43 Mo Sales Volumes [US$ in millions] [millions of pounds] $7.86 $13.94

28 Current Perspective for Copper Market General overcapacity for metal commodities across the board, including copper Since the consensus recognition of China’s industrial demand slowdown, only supply cutbacks can bring the copper market back into balance in the near term The 2015 price peaked in early May at $2.92 per pound and found its lowest point of the year by late August at $2.22 per pound Glencore and Freeport, among others, are leading the way with production cutbacks now pointing to a copper market supply deficit in 2016 with Chinese demand gaining traction We see price consolidation at current price levels and anticipate modest price strengthening through 2016
29 Operations Review and Closing Remarks Jacques Perron President, Chief Executive Officer and Director Jacques Perron
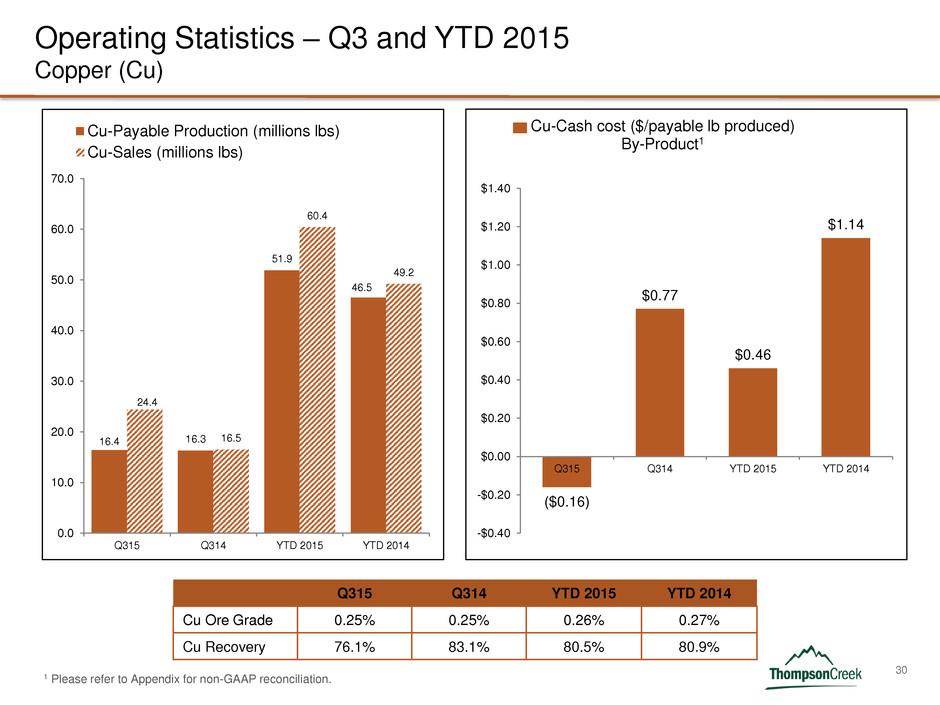
30 Operating Statistics – Q3 and YTD 2015 Copper (Cu) 16.4 16.3 51.9 46.5 24.4 16.5 60.4 49.2 0.0 10.0 20.0 30.0 40.0 50.0 60.0 70.0 Q315 Q314 YTD 2015 YTD 2014 Cu-Payable Production (millions lbs) Cu-Sales (millions lbs) ($0.16) $0.77 $0.46 $1.14 -$0.40 -$0.20 $0.00 $0.20 $0.40 $0.60 $0.80 $1.00 $1.20 $1.40 Q315 Q314 YTD 2015 YTD 2014 Cu-Cash cost ($/payable lb produced) By-Product1 Q315 Q314 YTD 2015 YTD 2014 Cu Ore Grade 0.25% 0.25% 0.26% 0.27% Cu Recovery 76.1% 83.1% 80.5% 80.9% 1 Please refer to Appendix for non-GAAP reconciliation.

31 Operating Statistics – Q3 and YTD 2015 Gold (Au) 53,791 60,366 159,827 136,639 75,451 57,974 170,121 133,831 0 20,000 40,000 60,000 80,000 100,000 120,000 140,000 160,000 180,000 Q315 Q314 YTD 2015 YTD 2014 Au-Payable Production (oz) Au-Sales (oz) $527 $477 $484 $530 $0 $100 $200 $300 $400 $500 $600 Q315 Q314 YTD 2015 YTD 2014 Au-Cash cost ($/payable oz produced) Co-Product1 Q315 Q314 YTD 2015 YTD 2014 Au Ore Grade (g/tonne) 0.64 0.79 0.64 0.67 Au Recovery 67.3% 66.6% 69.0% 63.9% 1 Please refer to Appendix for non-GAAP reconciliation.

32 Mount Milligan Ramp-up 40,445 43,781 39,569 44,940 44,077 0 10,000 20,000 30,000 40,000 50,000 60,000 Q314 Q414 Q115 Q215 Q315 Mill Throughput Design 60,000 tpd 1,958 2,002 1,890 2,054 2,037 0 500 1,000 1,500 2,000 2,500 Q314 Q414 Q115 Q215 Q315 88.7% 91.1% 87.3% 91.2% 90.2% 85% 86% 87% 88% 89% 90% 91% 92% Q314 Q414 Q115 Q215 Q315 Hourly Throughput Design 2,715 tpoh Mill Availability Design 92% 83.1% 79.0% 79.3% 85.5% 76.1% 55% 60% 65% 70% 75% 80% 85% 90% Q314 Q414 Q115 Q215 Q315 66.6% 60.8% 66.7% 72.7% 67.3% 55% 57% 59% 61% 63% 65% 67% 69% 71% 73% 75% Q314 Q414 Q115 Q215 Q315 Copper Recovery Design 84% Gold Recovery Design 71%

33 Key Messages Liquidity continues to be excellent Cash of $217 million as of September 30, 2015 Favorably positioned to withstand current volatility in commodity markets 2015 unit cash cost guidance on by-product basis estimated to be $0.55 to $0.75 per pound of copper produced Continuous improvement at Mount Milligan Maximizing value of the asset with the installation of the second SAG screen deck and ordering long-lead items for the permanent crusher With exception of permanent secondary crushing plant, all major modifications required to achieve objectives successfully completed Decision regarding time of construction of permanent crusher expected during Q116 Remain focused on addressing debt Engaged Moelis & Company and BMO Capital Markets to assist the Board in evaluating strategic and financial alternatives available to the Company, including debt financing and restructuring, new capital transactions and asset sales Goal to have a solution in place in advance of debt maturity dates

34 NYSE:TC TSX:TCM Thompson Creek Metals Company www.thompsoncreekmetals.com Pamela Solly Director, Investor Relations and Corporate Responsibility Phone (303) 762-3526 Email psolly@tcrk.com
35 Appendix
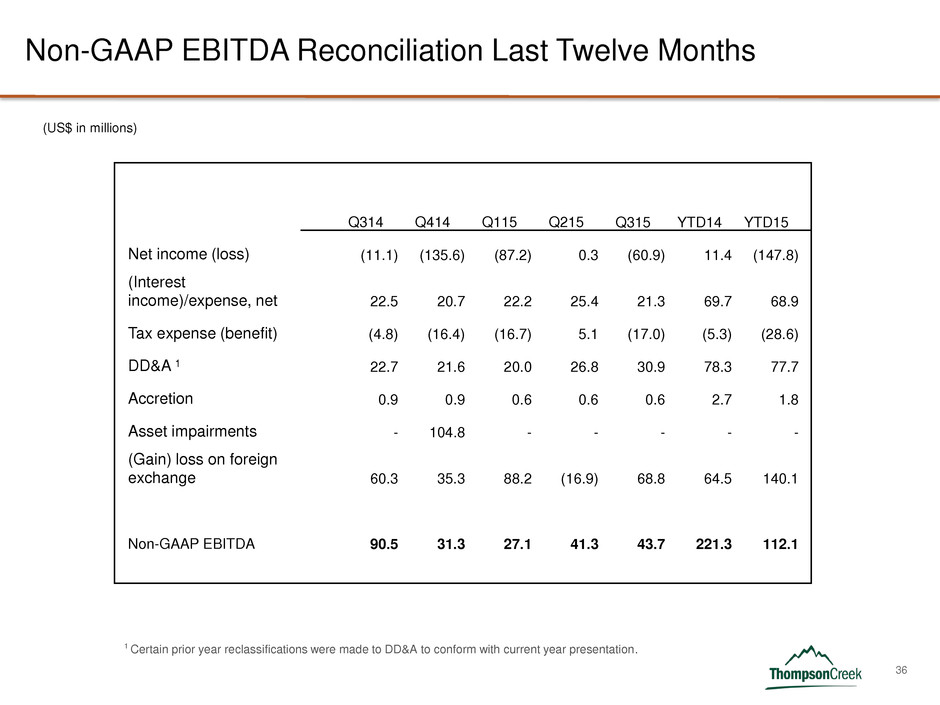
36 Non-GAAP EBITDA Reconciliation Last Twelve Months 1 Certain prior year reclassifications were made to DD&A to conform with current year presentation. (US$ in millions) Q314 Q414 Q115 Q215 Q315 YTD14 YTD15 Net income (loss) (11.1) (135.6) (87.2) 0.3 (60.9) 11.4 (147.8) (Interest income)/expense, net 22.5 20.7 22.2 25.4 21.3 69.7 68.9 Tax expense (benefit) (4.8) (16.4) (16.7) 5.1 (17.0) (5.3) (28.6) DD&A 1 22.7 21.6 20.0 26.8 30.9 78.3 77.7 Accretion 0.9 0.9 0.6 0.6 0.6 2.7 1.8 Asset impairments - 104.8 - - - - - (Gain) loss on foreign exchange 60.3 35.3 88.2 (16.9) 68.8 64.5 140.1 Non-GAAP EBITDA 90.5 31.3 27.1 41.3 43.7 221.3 112.1

37 Non-GAAP Reconciliation Adjusted Net Income (Loss) (US$ in millions, except per share amounts) (1) Included foreign exchange losses of $1.1 million and $2.4 million presented in income and mining tax expense (benefit) on the Condensed Consolidated Statements of Operations and Comprehensive Loss for the three and nine months ended September 30, 2015, respectively. Included $0.6 million of foreign exchange gains for each of the three and nine months ended September 30, 2014, which was presented in income and mining tax expense (benefit) on the Condensed Consolidated Statements of Operations and Comprehensive Loss for the three and nine months ended September 30, 2014. Three Months Ended Nine Months Ended Sep 30 2015 Sep 30 2014 Sep 30 2015 Sep 30 2014 Net (loss) income $ (60.9 ) $ (11.1 ) $ (147.8 ) $ 11.4 Add (Deduct): Loss on foreign exchange (1) 69.9 59.7 142.5 63.9 Tax expense benefit on foreign exchange loss (14.0 ) (10.3 ) (27.4 ) (10.7 ) Non-GAAP adjusted net (loss) income $ (5.0 ) $ 38.3 $ (32.7 ) $ 64.6 Net (loss) income per share Basic $ (0.28 ) $ (0.05 ) $ (0.68 ) $ 0.06 Diluted $ (0.28 ) $ (0.05 ) $ (0.68 ) $ 0.05 Adjusted net (loss) income per share Basic $ (0.02 ) $ 0.18 $ (0.15 ) $ 0.35 Diluted $ (0.02 ) $ 0.17 $ (0.15 ) $ 0.29 Weighted-average shares Basic 221.2 213.9 217.9 186.8 Diluted 221.2 220.4 217.9 220.1
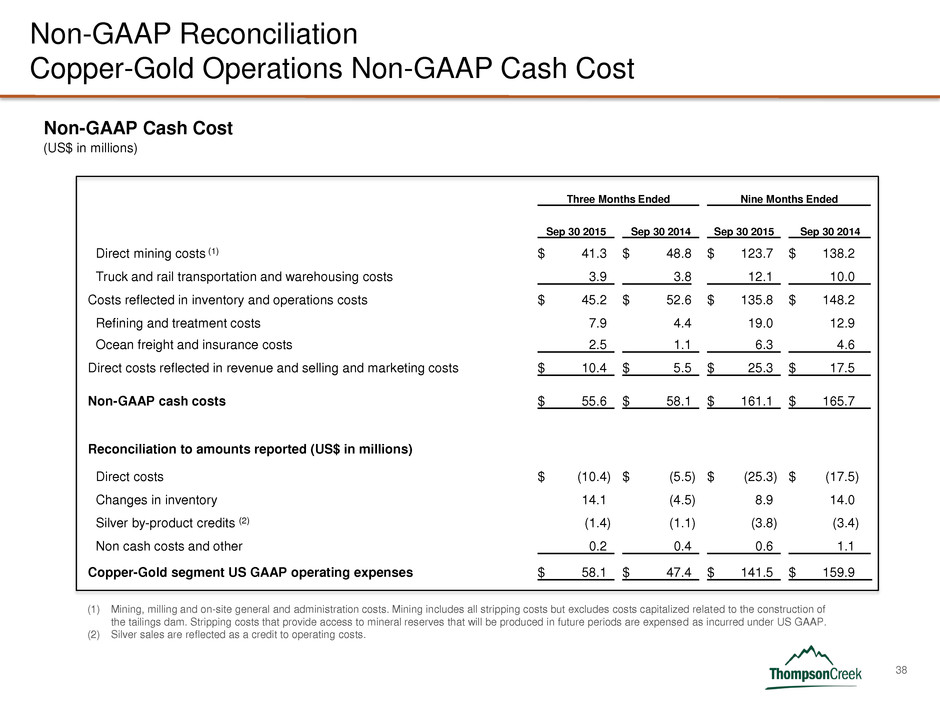
38 Non-GAAP Reconciliation Copper-Gold Operations Non-GAAP Cash Cost (US$ in millions) Non-GAAP Cash Cost (1) Mining, milling and on-site general and administration costs. Mining includes all stripping costs but excludes costs capitalized related to the construction of the tailings dam. Stripping costs that provide access to mineral reserves that will be produced in future periods are expensed as incurred under US GAAP. (2) Silver sales are reflected as a credit to operating costs. Three Months Ended Nine Months Ended Sep 30 2015 Sep 30 2014 Sep 30 2015 Sep 30 2014 Direct mining costs (1) $ 41.3 $ 48.8 $ 123.7 $ 138.2 Truck and rail transportation and warehousing costs 3.9 3.8 12.1 10.0 Costs reflected in inventory and operations costs $ 45.2 $ 52.6 $ 135.8 $ 148.2 Refining and treatment costs 7.9 4.4 19.0 12.9 Ocean freight and insurance costs 2.5 1.1 6.3 4.6 Direct costs reflected in revenue and selling and marketing costs $ 10.4 $ 5.5 $ 25.3 $ 17.5 Non-GAAP cash costs $ 55.6 $ 58.1 $ 161.1 $ 165.7 Reconciliation to amounts reported (US$ in millions) Direct costs $ (10.4 ) $ (5.5 ) $ (25.3 ) $ (17.5 ) Changes in inventory 14.1 (4.5 ) 8.9 14.0 Silver by-product credits (2) (1.4 ) (1.1 ) (3.8 ) (3.4 ) Non cash costs and other 0.2 0.4 0.6 1.1 Copper-Gold segment US GAAP operating expenses $ 58.1 $ 47.4 $ 141.5 $ 159.9
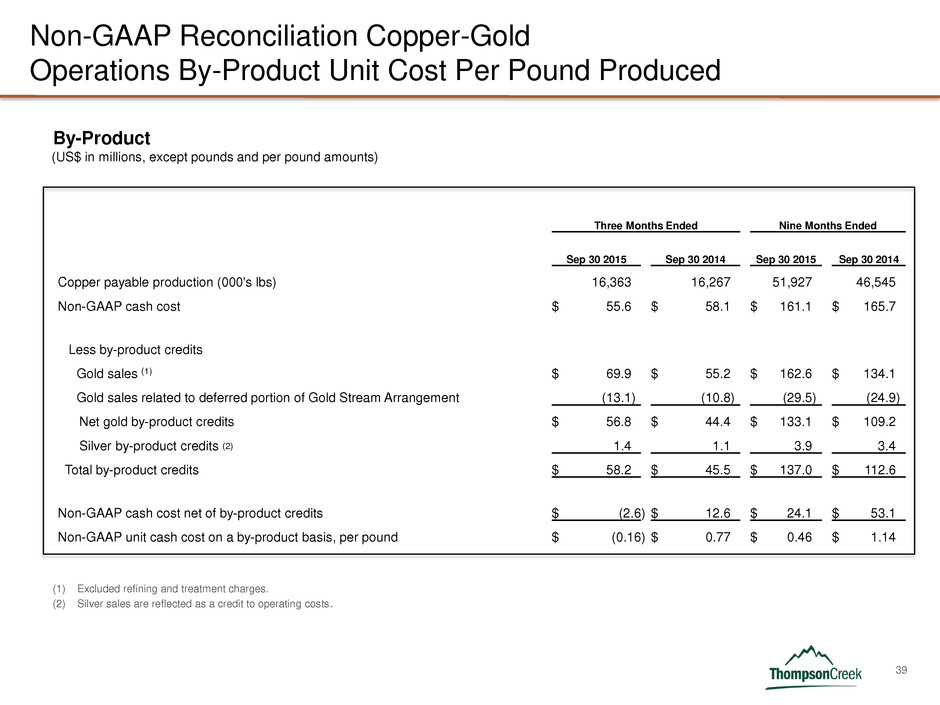
39 By-Product (US$ in millions, except pounds and per pound amounts) Non-GAAP Reconciliation Copper-Gold Operations By-Product Unit Cost Per Pound Produced (1) Excluded refining and treatment charges. (2) Silver sales are reflected as a credit to operating costs. Three Months Ended Nine Months Ended Sep 30 2015 Sep 30 2014 Sep 30 2015 Sep 30 2014 Copper payable production (000's lbs) 16,363 16,267 51,927 46,545 Non-GAAP cash cost $ 55.6 $ 58.1 $ 161.1 $ 165.7 Less by-product credits Gold sales (1) $ 69.9 $ 55.2 $ 162.6 $ 134.1 Gold sales related to deferred portion of Gold Stream Arrangement (13.1 ) (10.8 ) (29.5 ) (24.9 ) Net gold by-product credits $ 56.8 $ 44.4 $ 133.1 $ 109.2 Silver by-product credits (2) 1.4 1.1 3.9 3.4 Total by-product credits $ 58.2 $ 45.5 $ 137.0 $ 112.6 Non-GAAP cash cost net of by-product credits $ (2.6 ) $ 12.6 $ 24.1 $ 53.1 Non-GAAP unit cash cost on a by-product basis, per pound $ (0.16 ) $ 0.77 $ 0.46 $ 1.14

40 Co- Product (US$ in millions, except pounds, ounces and per unit amounts) Non-GAAP Reconciliation Copper-Gold Operations Co-Product Costs Three Months Ended Nine Months Ended Sep 30 2015 Sep 30 2014 Sep 30 2015 Sep 30 2014 Copper payable production (000’s lbs) 16,363 16,267 51,927 46,545 Gold payable production in Cu eq. (000’s lbs) (1) 17,199 15,976 48,598 36,541 Payable production (000’s lbs) 33,562 32,243 100,525 83,086 Non-GAAP cash cost allocated to Copper $ 27.2 $ 29.3 $ 83.2 $ 92.8 Non-GAAP cash cost per pound, on a co-product basis $ 1.66 $ 1.80 $ 1.61 $ 2.00 Non-GAAP cash cost allocated to Gold $ 28.4 $ 28.8 $ 77.9 $ 72.9 Gold payable production (ounces) 53,791 60,366 159,827 136,639 Non-GAAP cash cost per ounce, on a co-product basis $ 527 $ 477 $ 484 $ 530 (1) For the nine months ended September 30, 2015 gold has been converted from payable ounces to thousands of copper equivalent pounds by using the gold production for the periods presented, using a gold price of $781 and a copper price of $2.57. For the nine months ended September 30, 2014 gold has been converted from payable ounces to thousands of copper equivalent pounds by using the gold production for the periods presented, using a gold price of $842 and a copper price of $3.15. Gold has been converted from payable ounces to thousands of copper equivalent pounds by using the gold production for the periods presented, using a gold price of $764, $795, $806, $829 and $840 per ounce for the three months ended September 30, 2015, June 30, 2015, March 31, 2015, December 31, 2014 and September 30, 2014, respectively, (adjusted for the Royal Gold price of $435 per ounce) and a copper price of $2.39, $2.75, $2.64, $3.10 and $3.17 per pound for the three months ended September 30, 2015 and September 30, 2014, respectively.

41 Non-GAAP Reconciliation Copper-Gold Operations Average Realized Sales Prices (1) The average realized sales price per payable pound of copper sold and payable ounces of gold sold is impacted by any final volume and pricing adjustments and mark-to-market adjustments for shipments made in prior periods. (US$ in millions, except pounds, ounces and per unit amounts) Three Months Ended Sep 30, Nine Months Ended Sep 30, 2015 2014 2015 2014 Copper sales reconciliation ($) Copper sales, excluding adjustments $ 59.6 $ 52.6 $ 156.3 $ 155.2 Final pricing adjustments (7.1 ) 1.3 (12.8 ) (0.7 ) Mark-to-market adjustments (1.5 ) (4.0 ) (0.3 ) (1.9 ) Copper sales, net of adjustments 51.0 49.9 143.2 152.6 Less Refining and treatment costs 7.5 4.2 18.2 12.3 Copper sales $ 43.5 $ 45.7 $ 125.0 $ 140.3 Pounds of Copper sold (000's lb.) 24,427 16,482 60,413 49,214 Average realized sales price for Copper on a per pound basis Copper sales excluding adjustments $ 2.44 $ 3.19 $ 2.59 $ 3.15 Final pricing adjustments (0.29 ) 0.08 $ (0.21 ) (0.01 ) Mark-to-market adjustments (0.06 ) (0.25 ) $ (0.01) (0.04 ) Average realized Copper sales price per pound sold $ 2.09 $ 3.02 $ 2.37 $ 3.10 Continued Average Realized Sales Prices for Copper
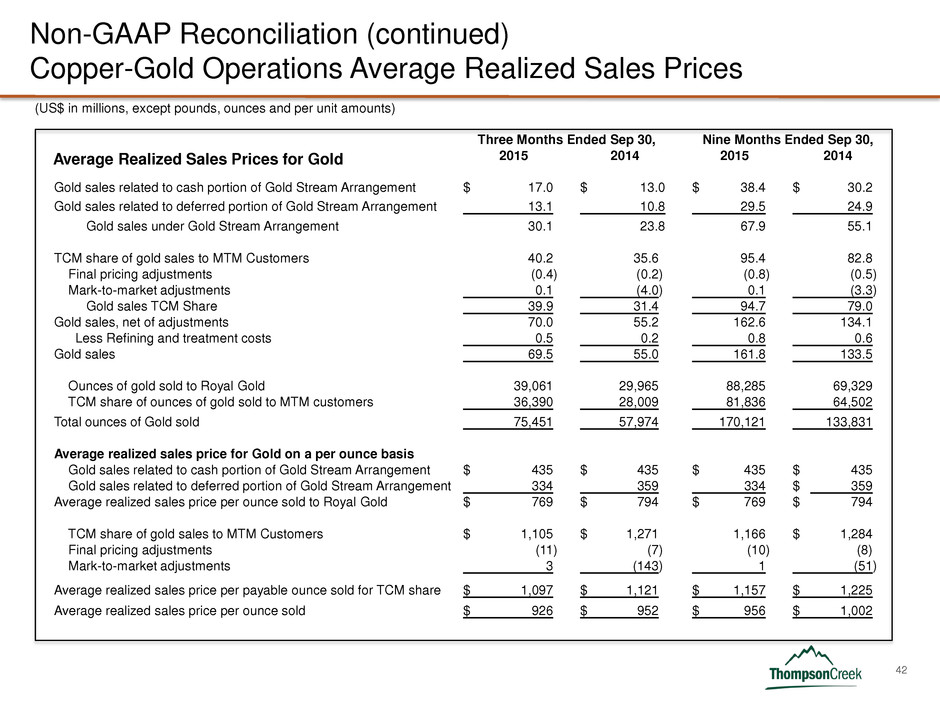
42 Non-GAAP Reconciliation (continued) Copper-Gold Operations Average Realized Sales Prices (US$ in millions, except pounds, ounces and per unit amounts) Three Months Ended Sep 30, Nine Months Ended Sep 30, 2015 2014 2015 2014 Gold sales related to cash portion of Gold Stream Arrangement $ 17.0 $ 13.0 $ 38.4 $ 30.2 Gold sales related to deferred portion of Gold Stream Arrangement 13.1 10.8 29.5 24.9 Gold sales under Gold Stream Arrangement 30.1 23.8 67.9 55.1 TCM share of gold sales to MTM Customers 40.2 35.6 95.4 82.8 Final pricing adjustments (0.4 ) (0.2 ) (0.8 ) (0.5 ) Mark-to-market adjustments 0.1 (4.0 ) 0.1 (3.3 ) Gold sales TCM Share 39.9 31.4 94.7 79.0 Gold sales, net of adjustments 70.0 55.2 162.6 134.1 Less Refining and treatment costs 0.5 0.2 0.8 0.6 Gold sales 69.5 55.0 161.8 133.5 Ounces of gold sold to Royal Gold 39,061 29,965 88,285 69,329 TCM share of ounces of gold sold to MTM customers 36,390 28,009 81,836 64,502 Total ounces of Gold sold 75,451 57,974 170,121 133,831 Average realized sales price for Gold on a per ounce basis Gold sales related to cash portion of Gold Stream Arrangement $ 435 $ 435 $ 435 $ 435 Gold sales related to deferred portion of Gold Stream Arrangement 334 359 334 $ 359 Average realized sales price per ounce sold to Royal Gold $ 769 $ 794 $ 769 $ 794 TCM share of gold sales to MTM Customers $ 1,105 $ 1,271 1,166 $ 1,284 Final pricing adjustments (11 ) (7 ) (10 ) (8) Mark-to-market adjustments 3 (143 ) 1 (51 ) Average realized sales price per payable ounce sold for TCM share $ 1,097 $ 1,121 $ 1,157 $ 1,225 Average realized sales price per ounce sold $ 926 $ 952 $ 956 $ 1,002 Average Realized Sales Prices for Gold
