Attached files
| file | filename |
|---|---|
| EX-31.01 - EX-31.01 - FBR & Co. | fbrc-ex3101_6.htm |
| EX-31.02 - EX-31.02 - FBR & Co. | fbrc-ex3102_9.htm |
| EX-32.01 - EX-32.01 - FBR & Co. | fbrc-ex3201_8.htm |
| EX-32.02 - EX-32.02 - FBR & Co. | fbrc-ex3202_7.htm |
UNITED STATES
SECURITIES AND EXCHANGE COMMISSION
Washington, D.C. 20549
FORM 10-Q
(Mark One)
|
x |
QUARTERLY REPORT PURSUANT TO SECTION 13 OR 15(d) OF THE SECURITIES EXCHANGE ACT OF 1934 |
For the quarterly period ended September 30, 2015
OR
|
¨ |
TRANSITION REPORT PURSUANT TO SECTION 13 OR 15(d) OF THE SECURITIES EXCHANGE ACT OF 1934 |
For the transition period from to
Commission file number: 001-33518
FBR & CO.
(Exact name of Registrant as specified in its charter)
|
Virginia |
20-5164223 |
|
(State or other jurisdiction of |
(I.R.S. Employer |
|
|
|
|
1300 North Seventeenth Street |
22209 |
|
(Address of principal executive offices) |
(Zip code) |
(703) 312-9500
(Registrant’s telephone number including area code)
Indicate by check mark whether the registrant (1) has filed all reports required to be filed by Section 13 or 15(d) of the Securities Exchange Act of 1934 during the preceding 12 months (or for such shorter period that the registrant was required to file such reports), and (2) has been subject to such filing requirements for the past 90 days. Yes x No ¨
Indicate by check mark whether the registrant has submitted electronically and posted on its corporate Web site, if any, every Interactive Data File required to be submitted and posted pursuant to Rule 405 of Regulation S-T (§232.405 of this chapter) during the preceding 12 months (or for such shorter period that the registrant was required to submit and post such files). Yes x No ¨
Indicate by check mark whether the registrant is a large accelerated filer, an accelerated filer, a non-accelerated filer or a smaller reporting company. See definitions of “large accelerated filer,” “accelerated filer” and “smaller reporting company” in Rule 12b-2 of the Exchange Act.
|
Large accelerated filer |
¨ |
Accelerated filer |
x |
|
|
|
|
|
|
Non-accelerated filer |
¨ |
Smaller reporting company |
¨ |
Indicate by check mark whether the registrant is a shell company (as defined in Rule 12b-2 of the Exchange Act.): Yes ¨ No x
The number of shares outstanding of the registrant’s common stock, $0.001 par value per share, as of October 30, 2015 was 7,052,085 shares.
FORM 10-Q
FOR THE QUARTER ENDED SEPTEMBER 30, 2015
INDEX
|
|
Page |
|
|
|
||
|
Item 1. |
1 |
|
|
|
Consolidated Financial Statements and Notes—(unaudited) |
|
|
|
Consolidated Balance Sheets—September 30, 2015 and December 31, 2014 |
1 |
|
|
Consolidated Statements of Operations—Three and Nine Months Ended September 30, 2015 and 2014 |
2 |
|
|
3 |
|
|
|
4 |
|
|
|
Consolidated Statements of Cash Flows—Nine Months Ended September 30, 2015 and 2014 |
5 |
|
|
6 |
|
|
Item 2. |
Management’s Discussion and Analysis of Financial Condition and Results of Operations |
27 |
|
Item 3. |
40 |
|
|
Item 4. |
44 |
|
|
|
|
|
|
|
||
|
Item 1. |
45 |
|
|
Item 1A. |
46 |
|
|
Item 2. |
46 |
|
|
Item 3. |
46 |
|
|
Item 4. |
46 |
|
|
Item 5. |
46 |
|
|
Item 6. |
47 |
|
|
|
48 |
|
FINANCIAL INFORMATION
FBR & CO.
(Dollars in thousands, except per share data)
(Unaudited)
|
|
|
September 30, |
|
|
December 31, |
|
||
|
|
|
2015 |
|
|
2014 |
|
||
|
Assets |
|
|
|
|
|
|
|
|
|
Cash and cash equivalents |
|
$ |
64,196 |
|
|
$ |
108,962 |
|
|
Receivables: |
|
|
|
|
|
|
|
|
|
Securities borrowed |
|
|
760,190 |
|
|
|
594,674 |
|
|
Due from brokers, dealers and clearing organizations |
|
|
89,256 |
|
|
|
94,489 |
|
|
Customers |
|
|
3,707 |
|
|
|
3,349 |
|
|
Other |
|
|
7,812 |
|
|
|
5,227 |
|
|
Financial instruments owned, at fair value |
|
|
115,660 |
|
|
|
166,047 |
|
|
Other investments, at cost |
|
|
7,000 |
|
|
|
7,000 |
|
|
Goodwill and intangible assets |
|
|
5,858 |
|
|
|
4,921 |
|
|
Furniture, equipment, software, and leasehold improvements, net of accumulated depreciation and amortization |
|
|
15,427 |
|
|
|
15,388 |
|
|
Deferred tax assets, net of valuation allowance |
|
|
31,654 |
|
|
|
28,648 |
|
|
Prepaid expenses and other assets |
|
|
5,161 |
|
|
|
6,392 |
|
|
Total assets |
|
$ |
1,105,921 |
|
|
$ |
1,035,097 |
|
|
|
|
|
|
|
|
|
|
|
|
Liabilities and Shareholders’ Equity |
|
|
|
|
|
|
|
|
|
Liabilities |
|
|
|
|
|
|
|
|
|
Securities loaned |
|
$ |
759,364 |
|
|
$ |
595,717 |
|
|
Securities sold but not yet purchased, at fair value |
|
|
82,553 |
|
|
|
121,310 |
|
|
Accrued compensation and benefits |
|
|
19,587 |
|
|
|
34,571 |
|
|
Accounts payable, accrued expenses and other liabilities |
|
|
21,451 |
|
|
|
23,093 |
|
|
Total liabilities |
|
|
882,955 |
|
|
|
774,691 |
|
|
|
|
|
|
|
|
|
|
|
|
Commitments and Contingencies (Note 8) |
|
|
|
|
|
|
|
|
|
Shareholders’ equity |
|
|
|
|
|
|
|
|
|
Preferred Stock, $0.001 par value 100,000,000 authorized, none issued and outstanding |
|
|
— |
|
|
|
— |
|
|
Common stock, $0.001 par value, 75,000,000 shares authorized, 7,075,767 and 8,388,697 shares issued and outstanding, respectively |
|
|
7 |
|
|
|
8 |
|
|
Additional paid-in capital |
|
|
266,918 |
|
|
|
302,720 |
|
|
Restricted stock units |
|
|
35,811 |
|
|
|
34,353 |
|
|
Accumulated other comprehensive income, net of taxes |
|
|
— |
|
|
|
44 |
|
|
Accumulated deficit |
|
|
(79,770 |
) |
|
|
(76,719 |
) |
|
Total shareholders’ equity |
|
|
222,966 |
|
|
|
260,406 |
|
|
Total liabilities and shareholders’ equity |
|
$ |
1,105,921 |
|
|
$ |
1,035,097 |
|
See notes to consolidated financial statements.
1
CONSOLIDATED STATEMENTS OF OPERATIONS
(Dollars in thousands, except per share data)
(Unaudited)
|
|
|
Three Months Ended |
|
|
Nine Months Ended |
|
||||||||||
|
|
|
September 30, |
|
|
September 30, |
|
||||||||||
|
|
|
2015 |
|
|
2014 |
|
|
2015 |
|
|
2014 |
|
||||
|
Revenues: |
|
|
|
|
|
|
|
|
|
|
|
|
|
|
|
|
|
Investment banking: |
|
|
|
|
|
|
|
|
|
|
|
|
|
|
|
|
|
Capital raising |
|
$ |
14,626 |
|
|
$ |
27,137 |
|
|
$ |
51,737 |
|
|
$ |
95,765 |
|
|
Advisory |
|
|
150 |
|
|
|
2,152 |
|
|
|
5,442 |
|
|
|
5,947 |
|
|
Institutional brokerage |
|
|
11,176 |
|
|
|
11,946 |
|
|
|
35,860 |
|
|
|
41,680 |
|
|
Net investment income |
|
|
777 |
|
|
|
3,075 |
|
|
|
7,806 |
|
|
|
16,000 |
|
|
Interest |
|
|
8,394 |
|
|
|
4,861 |
|
|
|
23,387 |
|
|
|
5,415 |
|
|
Dividends and other |
|
|
168 |
|
|
|
226 |
|
|
|
631 |
|
|
|
806 |
|
|
Total revenues |
|
|
35,291 |
|
|
|
49,397 |
|
|
|
124,863 |
|
|
|
165,613 |
|
|
Interest expense |
|
|
9,711 |
|
|
|
7,300 |
|
|
|
27,932 |
|
|
|
12,060 |
|
|
Revenues, net of interest expense |
|
|
25,580 |
|
|
|
42,097 |
|
|
|
96,931 |
|
|
|
153,553 |
|
|
|
|
|
|
|
|
|
|
|
|
|
|
|
|
|
|
|
|
Non-interest expenses: |
|
|
|
|
|
|
|
|
|
|
|
|
|
|
|
|
|
Compensation and benefits |
|
|
17,604 |
|
|
|
23,771 |
|
|
|
59,835 |
|
|
|
87,141 |
|
|
Professional services |
|
|
2,835 |
|
|
|
3,663 |
|
|
|
9,647 |
|
|
|
11,025 |
|
|
Business development |
|
|
2,293 |
|
|
|
2,764 |
|
|
|
6,824 |
|
|
|
8,189 |
|
|
Clearing and brokerage fees |
|
|
1,438 |
|
|
|
1,155 |
|
|
|
3,997 |
|
|
|
3,516 |
|
|
Occupancy and equipment |
|
|
3,169 |
|
|
|
3,067 |
|
|
|
9,330 |
|
|
|
9,222 |
|
|
Communications |
|
|
2,532 |
|
|
|
2,873 |
|
|
|
8,119 |
|
|
|
8,621 |
|
|
Other operating expenses |
|
|
2,018 |
|
|
|
1,496 |
|
|
|
4,933 |
|
|
|
4,541 |
|
|
Total non-interest expenses |
|
|
31,889 |
|
|
|
38,789 |
|
|
|
102,685 |
|
|
|
132,255 |
|
|
Income before income taxes |
|
|
(6,309 |
) |
|
|
3,308 |
|
|
|
(5,754 |
) |
|
|
21,298 |
|
|
Income tax (benefit) expense |
|
|
(2,881 |
) |
|
|
(193 |
) |
|
|
(2,703 |
) |
|
|
5,211 |
|
|
Net (loss) income |
|
$ |
(3,428 |
) |
|
$ |
3,501 |
|
|
$ |
(3,051 |
) |
|
$ |
16,087 |
|
|
|
|
|
|
|
|
|
|
|
|
|
|
|
|
|
|
|
|
(Loss) income per share: |
|
|
|
|
|
|
|
|
|
|
|
|
|
|
|
|
|
Basic (loss) income per share |
|
$ |
(0.43 |
) |
|
$ |
0.34 |
|
|
$ |
(0.37 |
) |
|
$ |
1.51 |
|
|
Diluted (loss) income per share |
|
$ |
(0.43 |
) |
|
$ |
0.31 |
|
|
$ |
(0.37 |
) |
|
$ |
1.36 |
|
|
|
|
|
|
|
|
|
|
|
|
|
|
|
|
|
|
|
|
Basic weighted average shares outstanding (in thousands) |
|
|
7,899 |
|
|
|
10,171 |
|
|
|
8,266 |
|
|
|
10,642 |
|
|
Diluted weighted average shares outstanding (in thousands) |
|
|
7,899 |
|
|
|
11,419 |
|
|
|
8,266 |
|
|
|
11,798 |
|
|
Cash dividends declared per common share |
|
$ |
— |
|
|
$ |
— |
|
|
$ |
0.20 |
|
|
$ |
— |
|
See notes to consolidated financial statements.
2
CONSOLIDATED STATEMENTS OF COMPREHENSIVE INCOME (LOSS)
(Dollars in thousands)
(Unaudited)
|
|
|
Three Months Ended |
|
|
Nine Months Ended |
|
||||||||||
|
|
|
September 30, |
|
|
September 30, |
|
||||||||||
|
|
|
2015 |
|
|
2014 |
|
|
2015 |
|
|
2014 |
|
||||
|
Net (loss) income |
|
$ |
(3,428 |
) |
|
$ |
3,501 |
|
|
$ |
(3,051 |
) |
|
$ |
16,087 |
|
|
Other comprehensive income, net of tax: |
|
|
|
|
|
|
|
|
|
|
|
|
|
|
|
|
|
Change in unrealized gain on available-for-sale investment securities, net of taxes of $0, $(13), $28 and $3, respectively |
|
|
— |
|
|
|
(20 |
) |
|
|
(44 |
) |
|
|
4 |
|
|
Comprehensive (loss) income |
|
$ |
(3,428 |
) |
|
$ |
3,481 |
|
|
$ |
(3,095 |
) |
|
$ |
16,091 |
|
See notes to consolidated financial statements.
3
CONSOLIDATED STATEMENTS OF CHANGES IN SHAREHOLDERS’ EQUITY
(Dollars and shares in thousands)
(Unaudited)
|
|
|
Common Stock Shares |
|
|
Common Stock Amount |
|
|
Additional Paid-in Capital |
|
|
Restricted Stock Units |
|
|
Accumulated Other Comprehensive Income |
|
|
Accumulated Deficit |
|
|
Total |
|
|||||||
|
Balances at December 31, 2013 |
|
|
10,545 |
|
|
$ |
11 |
|
|
$ |
362,983 |
|
|
$ |
21,487 |
|
|
$ |
34 |
|
|
$ |
(93,738 |
) |
|
$ |
290,777 |
|
|
Net income |
|
|
— |
|
|
|
— |
|
|
|
— |
|
|
|
— |
|
|
|
— |
|
|
|
17,019 |
|
|
|
17,019 |
|
|
Issuance of common stock, net of forfeitures |
|
|
295 |
|
|
|
— |
|
|
|
5,447 |
|
|
|
(3,100 |
) |
|
|
— |
|
|
|
— |
|
|
|
2,347 |
|
|
Repurchase of common stock |
|
|
(2,380 |
) |
|
|
(3 |
) |
|
|
(64,091 |
) |
|
|
— |
|
|
|
— |
|
|
|
— |
|
|
|
(64,094 |
) |
|
Repurchase of common stock for employee tax withholding |
|
|
(71 |
) |
|
|
— |
|
|
|
(1,823 |
) |
|
|
— |
|
|
|
— |
|
|
|
— |
|
|
|
(1,823 |
) |
|
Stock compensation expense for options granted to purchase common stock |
|
|
— |
|
|
|
— |
|
|
|
204 |
|
|
|
— |
|
|
|
— |
|
|
|
— |
|
|
|
204 |
|
|
Issuance of restricted stock units |
|
|
— |
|
|
|
— |
|
|
|
— |
|
|
|
15,966 |
|
|
|
— |
|
|
|
— |
|
|
|
15,966 |
|
|
Change in unrealized gain on available-for-sale investment securities, net of taxes |
|
|
— |
|
|
|
— |
|
|
|
— |
|
|
|
— |
|
|
|
10 |
|
|
|
— |
|
|
|
10 |
|
|
Balances at December 31, 2014 |
|
|
8,389 |
|
|
$ |
8 |
|
|
$ |
302,720 |
|
|
$ |
34,353 |
|
|
$ |
44 |
|
|
$ |
(76,719 |
) |
|
$ |
260,406 |
|
|
Net loss |
|
|
— |
|
|
|
— |
|
|
|
— |
|
|
|
— |
|
|
|
— |
|
|
|
(3,051 |
) |
|
|
(3,051 |
) |
|
Cash dividends declared - common stock ($0.20 per share) |
|
|
— |
|
|
|
— |
|
|
|
(1,920 |
) |
|
|
— |
|
|
|
— |
|
|
|
— |
|
|
|
(1,920 |
) |
|
Issuance of common stock, net of forfeitures |
|
|
367 |
|
|
|
— |
|
|
|
5,913 |
|
|
|
(4,386 |
) |
|
|
— |
|
|
|
— |
|
|
|
1,527 |
|
|
Repurchase of common stock |
|
|
(1,574 |
) |
|
|
(1 |
) |
|
|
(37,509 |
) |
|
|
— |
|
|
|
— |
|
|
|
— |
|
|
|
(37,510 |
) |
|
Repurchase of common stock for employee tax withholding |
|
|
(106 |
) |
|
|
— |
|
|
|
(2,458 |
) |
|
|
— |
|
|
|
— |
|
|
|
— |
|
|
|
(2,458 |
) |
|
Stock compensation expense for options granted to purchase common stock |
|
|
— |
|
|
|
— |
|
|
|
172 |
|
|
|
— |
|
|
|
— |
|
|
|
— |
|
|
|
172 |
|
|
Issuance of restricted stock units |
|
|
— |
|
|
|
— |
|
|
|
— |
|
|
|
5,844 |
|
|
|
— |
|
|
|
— |
|
|
|
5,844 |
|
|
Change in unrealized gain on available-for-sale investment securities, net of taxes |
|
|
— |
|
|
|
— |
|
|
|
— |
|
|
|
— |
|
|
|
(44 |
) |
|
|
— |
|
|
|
(44 |
) |
|
Balance at September 30, 2015 |
|
|
7,076 |
|
|
$ |
7 |
|
|
$ |
266,918 |
|
|
$ |
35,811 |
|
|
$ |
— |
|
|
$ |
(79,770 |
) |
|
$ |
222,966 |
|
See notes to consolidated financial statements.
4
CONSOLIDATED STATEMENTS OF CASH FLOWS
(Dollars in thousands)
(Unaudited)
|
|
Nine Months Ended |
|
|||||
|
|
September 30, |
|
|||||
|
|
2015 |
|
|
2014 |
|
||
|
Cash flows from operating activities |
|
|
|
|
|
|
|
|
Net (loss) income |
$ |
(3,051 |
) |
|
$ |
16,087 |
|
|
Adjustments to reconcile net (loss) income to net cash used in operating activities: |
|
|
|
|
|
|
|
|
Depreciation and amortization |
|
2,374 |
|
|
|
1,102 |
|
|
Deferred income taxes |
|
(2,978 |
) |
|
|
5,625 |
|
|
Net investment income from investments |
|
(7,806 |
) |
|
|
(16,000 |
) |
|
Stock compensation |
|
5,637 |
|
|
|
6,952 |
|
|
Other |
|
542 |
|
|
|
29 |
|
|
Changes in operating assets: |
|
|
|
|
|
|
|
|
Receivables: |
|
|
|
|
|
|
|
|
Securities borrowed |
|
(165,516 |
) |
|
|
(578,399 |
) |
|
Brokers, dealers and clearing organizations |
|
5,924 |
|
|
|
(6,583 |
) |
|
Customers |
|
272 |
|
|
|
1,059 |
|
|
Other |
|
(2,962 |
) |
|
|
(2,288 |
) |
|
Trading securities |
|
46,049 |
|
|
|
(5,312 |
) |
|
Prepaid expenses and other assets |
|
1,512 |
|
|
|
325 |
|
|
Changes in operating liabilities: |
|
|
|
|
|
|
|
|
Securities loaned |
|
163,647 |
|
|
|
581,003 |
|
|
Trading account securities sold but not yet purchased |
|
(37,409 |
) |
|
|
(833 |
) |
|
Accounts payable, accrued expenses and other liabilities |
|
(1,790 |
) |
|
|
1,092 |
|
|
Accrued compensation and benefits |
|
(15,001 |
) |
|
|
1,375 |
|
|
Brokers, dealers and clearing organizations |
|
— |
|
|
|
(8,701 |
) |
|
Net cash used in operating activities |
|
(10,556 |
) |
|
|
(3,467 |
) |
|
Cash flows from investing activities |
|
|
|
|
|
|
|
|
Purchases of investment securities and other investments |
|
(15,081 |
) |
|
|
(70,230 |
) |
|
Proceeds from sales of and distributions from investments |
|
17,789 |
|
|
|
52,834 |
|
|
Securities sold but not yet purchased |
|
217,685 |
|
|
|
301,230 |
|
|
Settlement of securities sold but not yet purchased |
|
(209,563 |
) |
|
|
— |
|
|
Due from brokers, dealers and clearing organizations |
|
1,407 |
|
|
|
(308,548 |
) |
|
Purchase of broker-dealer, net of cash acquired |
|
(2,275 |
) |
|
|
— |
|
|
Purchase of securities lending business |
|
(2,166 |
) |
|
|
(1,000 |
) |
|
Purchases of furniture, equipment, software, and leasehold improvements |
|
(1,823 |
) |
|
|
(6,748 |
) |
|
Net cash provided by (used in) investing activities |
|
5,973 |
|
|
|
(32,462 |
) |
|
Cash flows from financing activities |
|
|
|
|
|
|
|
|
Repurchases of common stock |
|
(39,968 |
) |
|
|
(51,059 |
) |
|
Proceeds from sales of common stock |
|
1,279 |
|
|
|
1,601 |
|
|
Dividends paid |
|
(1,494 |
) |
|
|
— |
|
|
Net cash used in financing activities |
|
(40,183 |
) |
|
|
(49,458 |
) |
|
Cash and cash equivalents |
|
|
|
|
|
|
|
|
Net decrease in cash and cash equivalents |
|
(44,766 |
) |
|
|
(85,387 |
) |
|
Cash and cash equivalents, beginning of period |
|
108,962 |
|
|
|
207,973 |
|
|
Cash and cash equivalents, end of period |
$ |
64,196 |
|
|
$ |
122,586 |
|
|
Supplemental cash flows disclosures |
|
|
|
|
|
|
|
|
Income tax payments |
$ |
19 |
|
|
$ |
3,269 |
|
|
Interest payments |
$ |
27,440 |
|
|
$ |
12,588 |
|
See notes to consolidated financial statements.
5
NOTES TO CONSOLIDATED FINANCIAL STATEMENTS
(Dollars in thousands, except per share data)
(Unaudited)
1. Basis of Presentation:
The consolidated financial statements of FBR & Co. and subsidiaries (collectively, the “Company”) have been prepared in accordance with accounting principles generally accepted in the United States of America for interim financial information and with the instructions to Form 10-Q. Therefore, they do not include all information required by accounting principles generally accepted in the United States of America for complete annual financial statements. The interim financial statements reflect all adjustments (consisting only of normal recurring adjustments) which are, in the opinion of management, necessary for a fair statement of the results for the periods presented. All significant intercompany accounts and transactions have been eliminated in consolidation. Certain reclassifications have been made to prior period amounts in order to conform with the current period presentation. The results of operations for the three and nine months ended September 30, 2015 and 2014 are not necessarily indicative of the results for the entire year or any subsequent interim period. These financial statements should be read in conjunction with the audited consolidated financial statements and notes thereto included in the Company’s Annual Report on Form 10-K for the fiscal year ended December 31, 2014 (“2014 Form 10-K”).
The preparation of financial statements in conformity with accounting principles generally accepted in the United States of America requires management to make estimates and assumptions affecting the reported amounts of assets and liabilities and disclosure of contingent assets and liabilities at the date of the financial statements and the reported amounts of revenues and expenses during the reporting period. Although the Company bases its estimates and assumptions on historical experience and market information (when available) and on various other factors that it believes to be reasonable under the circumstances, management exercises significant judgment in the final determination of its estimates. Actual results may differ from those estimates.
2. Financial Instruments and Long-Term Investments:
Fair Value of Financial Instruments
The Financial Accounting Standards Board’s (“FASB”) Accounting Standards Codification (“ASC”) 820 “Fair Value Measurement” (“ASC 820”) defines fair value as the price that would be received to sell an asset or paid to transfer a liability in an orderly transaction between market participants at the measurement date, not adjusted for transaction costs. ASC 820 also establishes a fair value hierarchy that prioritizes the inputs to valuation techniques used to measure fair value into three broad levels giving the highest priority to quoted prices in active markets for identical assets or liabilities (Level 1) and the lowest priority to unobservable inputs (Level 3) as described below:
|
Level 1 Inputs |
— |
Unadjusted quoted prices in active markets for identical assets or liabilities that are accessible by the Company; |
|
|
|
|
|
Level 2 Inputs |
— |
Quoted prices in markets that are not active or financial instruments for which all significant inputs are observable, either directly or indirectly; |
|
|
|
|
|
Level 3 Inputs |
— |
Unobservable inputs for the asset or liability, including significant assumptions of the Company and other market participants. |
6
The Company determines fair values for the following assets and liabilities:
Equity securities, listed options and warrants—The Company classifies marketable equity securities and listed options within Level 1 of the fair value hierarchy because quoted market prices from an exchange are used to value these securities. Non-public equity securities, which primarily include securities where the Company acted as a placement agent in an offering of equity securities and where the Company facilitates over-the-counter trading activity for the securities, are classified within Level 3 of the fair value hierarchy. In determining the fair value of these securities, the Company considers enterprise value and analyzes various financial, performance and market factors to estimate the value, including where applicable, over-the-counter market trading activity. Non-exchange traded warrants to purchase equity securities are classified as Level 3 as a Black-Scholes valuation model is used to value these securities.
U.S. government securities, convertible and fixed income debt instruments—The Company classifies U.S. government securities, including highly liquid U.S. Treasury securities within Level 1 as quoted prices are used to value these securities. Convertible and fixed income debt instruments are classified within Level 2 of the fair value hierarchy as they are valued using quoted market prices provided by a broker or dealer, or alternative pricing services that provide reasonable levels of price transparency. The Company primarily uses price quotes from one independent broker-dealer who makes markets in or is a specialist with expertise in the valuation of these financial instruments. The Company reviews broker or pricing service quotes it receives to assess the reasonableness of the values provided; such reviews include comparison to internal pricing models and, when available, prices observed for recently executed market transactions of comparable size. Based on this assessment, at each reporting date the Company will adjust price quotes it receives if such an adjustment is determined to be appropriate.
Investment Funds—The Company invests in proprietary investment funds that are valued at net asset value (“NAV”) determined by the fund administrator. For investments in non-registered investment companies (hedge funds and private equity funds), the Company classifies these investments within Level 2 or Level 3 depending on the redemption attributes of the Company’s investment. The underlying securities held by these investment companies are primarily corporate and asset-backed fixed income securities and restrictions exist on the redemption of amounts invested by the Company. As a practical expedient, the Company relies on the NAV of these investments as their fair value. The NAVs that have been provided by the fund administrators are derived from the fair values of the underlying investments as of the reporting date.
Fair Value Hierarchy
The following tables set forth, by level within the fair value hierarchy, financial instruments and long-term investments accounted for under ASC 820 as of September 30, 2015 and December 31, 2014. As required by ASC 820, assets and liabilities that are measured at fair value are classified in their entirety based on the lowest level of input that is significant to the fair value measurement.
7
Items Measured at Fair Value on a Recurring Basis
|
|
September 30, 2015 |
|
|
Level 1 |
|
|
Level 2 |
|
|
Level 3 |
|
||||
|
Financial instruments owned, at fair value: |
|
|
|
|
|
|
|
|
|
|
|
|
|
|
|
|
Financial instruments held for trading activities at broker-dealer subsidiaries: |
|
|
|
|
|
|
|
|
|
|
|
|
|
|
|
|
Marketable and non-public equity securities |
$ |
10,539 |
|
|
$ |
4,393 |
|
|
$ |
— |
|
|
$ |
6,146 |
|
|
Convertible and fixed income debt instruments |
|
1,111 |
|
|
|
— |
|
|
|
1,111 |
|
|
|
— |
|
|
|
|
11,650 |
|
|
|
4,393 |
|
|
|
1,111 |
|
|
|
6,146 |
|
|
Financial instruments held for investment activities: |
|
|
|
|
|
|
|
|
|
|
|
|
|
|
|
|
Designated as trading: |
|
|
|
|
|
|
|
|
|
|
|
|
|
|
|
|
Marketable and non-public equity securities |
|
14,792 |
|
|
|
5,584 |
|
|
|
— |
|
|
|
9,208 |
|
|
Warrants |
|
577 |
|
|
|
— |
|
|
|
— |
|
|
|
577 |
|
|
|
|
15,369 |
|
|
|
5,584 |
|
|
|
— |
|
|
|
9,785 |
|
|
Investment funds |
|
88,641 |
|
|
|
— |
|
|
|
43,065 |
|
|
|
45,576 |
|
|
Total |
$ |
115,660 |
|
|
$ |
9,977 |
|
|
$ |
44,176 |
|
|
$ |
61,507 |
|
|
Securities sold but not yet purchased, at fair value: |
|
|
|
|
|
|
|
|
|
|
|
|
|
|
|
|
U.S. Treasury securities |
$ |
78,258 |
|
|
$ |
78,258 |
|
|
$ |
— |
|
|
$ |
— |
|
|
Marketable and non-public equity securities |
|
4,295 |
|
|
|
4,295 |
|
|
|
— |
|
|
|
— |
|
|
Total |
$ |
82,553 |
|
|
$ |
82,553 |
|
|
$ |
— |
|
|
$ |
— |
|
As of September 30, 2015, financial assets measured and reported at fair value on a recurring basis and classified within Level 3 were $61,507, or 5.6% of the Company’s total assets at that date. Regarding these Level 3 financial assets, in determining fair value, the Company analyzes various financial, performance and market factors to estimate the value, including where applicable, over-the-counter market trading activity. The following table provides the valuation technique and unobservable inputs primarily used in assessing the value of these securities as of September 30, 2015:
|
Valuation Technique |
|
Fair Value |
|
|
Unobservable Input |
|
Range |
|
|
Weighted Average |
|
|||
|
Market approach |
|
$ |
15,354 |
|
|
Over-the-counter trading activity |
|
$0.43 - $17.50/share |
|
|
$12.04 |
|
||
|
Black-Scholes |
|
$ |
577 |
|
|
Volatility |
|
30% |
|
|
|
30% |
|
|
|
|
|
|
|
|
|
Dividend Yield |
|
0% |
|
|
|
0% |
|
|
|
|
|
|
|
|
|
Interest Rate |
|
|
1.7% |
|
|
|
1.7% |
|
For those non-public equity securities valued using a market approach, adverse industry market conditions or events experienced by the underlying entities could result in lower over-the-counter trading prices for the securities. Such lower trading prices would result in a decline in the estimated fair value of these assets. For warrants valued using Black-Scholes, adverse industry market conditions or events experienced by the issuer could result in a lower trading price for the underlying equity security and therefore a lower value of these warrants. A reduction in the estimated volatility would also result in a lower value of the warrants. The Company assessed the reasonableness of the fair values of the non-public equity securities noted above based on its consideration of available financial data related to these issuers as well as an assessment of the nature of any over-the-counter trading activity during the period. The Company assessed the reasonableness of the fair value of the non-exchange traded warrants valued using a Black-Scholes valuation based on its consideration of the fair values of comparable exchange-traded options.
The table above excludes $45,576 of investments in 12 non-registered investment funds that are valued at NAV as determined by the fund administrators. The underlying fund investments consist primarily of corporate and asset-backed fixed income securities. Considering the general lack of transparency necessary to conduct an independent assessment of the fair value of the securities underlying each of the NAVs provided by the fund administrators, our quarterly reporting process includes a number of assessment processes to assist the Company in the evaluation of the information provided by fund managers and fund administrators. These assessment processes include, but are not limited to, regular review and discussion of each fund’s performance with its manager and regular evaluation of performance against applicable benchmarks.
8
|
|
December 31, 2014 |
|
|
Level 1 |
|
|
Level 2 |
|
|
Level 3 |
|
||||
|
Financial instruments owned, at fair value: |
|
|
|
|
|
|
|
|
|
|
|
|
|
|
|
|
Financial instruments held for trading activities at broker-dealer subsidiary: |
|
|
|
|
|
|
|
|
|
|
|
|
|
|
|
|
Marketable and non-public equity securities |
$ |
14,832 |
|
|
$ |
14,758 |
|
|
$ |
— |
|
|
$ |
74 |
|
|
Listed options |
|
2 |
|
|
|
2 |
|
|
|
— |
|
|
|
— |
|
|
Convertible and fixed income debt instruments |
|
42,864 |
|
|
|
— |
|
|
|
42,864 |
|
|
|
— |
|
|
|
|
57,698 |
|
|
|
14,760 |
|
|
|
42,864 |
|
|
|
74 |
|
|
Financial instruments held for investment activities: |
|
|
|
|
|
|
|
|
|
|
|
|
|
|
|
|
Designated as trading: |
|
|
|
|
|
|
|
|
|
|
|
|
|
|
|
|
Marketable and non-public equity securities |
|
2,325 |
|
|
|
175 |
|
|
|
— |
|
|
|
2,150 |
|
|
Warrants |
|
964 |
|
|
|
— |
|
|
|
— |
|
|
|
964 |
|
|
Designated as available-for-sale: |
|
|
|
|
|
|
|
|
|
|
|
|
|
|
|
|
Marketable equity securities |
|
172 |
|
|
|
172 |
|
|
|
— |
|
|
|
— |
|
|
|
|
3,461 |
|
|
|
347 |
|
|
|
— |
|
|
|
3,114 |
|
|
Investment funds |
|
104,888 |
|
|
|
— |
|
|
|
58,292 |
|
|
|
46,596 |
|
|
Total |
$ |
166,047 |
|
|
$ |
15,107 |
|
|
$ |
101,156 |
|
|
$ |
49,784 |
|
|
Securities sold but not yet purchased, at fair value: |
|
|
|
|
|
|
|
|
|
|
|
|
|
|
|
|
U.S. Treasury securities |
$ |
84,950 |
|
|
$ |
84,950 |
|
|
$ |
— |
|
|
$ |
— |
|
|
Marketable and non-public equity securities |
|
34,043 |
|
|
|
34,043 |
|
|
|
— |
|
|
|
— |
|
|
Convertible and fixed income debt instruments |
|
2,317 |
|
|
|
— |
|
|
|
2,317 |
|
|
|
— |
|
|
Total |
$ |
121,310 |
|
|
$ |
118,993 |
|
|
$ |
2,317 |
|
|
$ |
— |
|
As of December 31, 2014, financial assets measured and reported at fair value on a recurring basis and classified within Level 3 were $49,784, or 4.8% of the Company’s total assets at that date. Regarding these Level 3 financial assets, in determining fair value, the Company analyzes various financial, performance and market factors to estimate the value, including where applicable, over-the-counter market trading activity. The following table provides the valuation technique and unobservable inputs primarily used in assessing the value of these securities as of December 31, 2014:
|
Valuation Technique |
|
Fair Value |
|
|
Unobservable Input |
|
Range |
|
Weighted Average |
|
||
|
Market approach |
|
$ |
2,224 |
|
|
Over-the-counter trading activity |
|
$0 - $34.00/share |
|
$11.56 |
|
|
|
Black-Scholes |
|
$ |
964 |
|
|
Volatility |
|
30% |
|
|
30% |
|
|
|
|
|
|
|
|
Dividend Yield |
|
0% |
|
|
0% |
|
|
|
|
|
|
|
|
Interest Rate |
|
2.1% |
|
2.1% |
|
|
For those non-public equity securities valued using a market approach, adverse industry market conditions or events experienced by the underlying entities could result in lower over-the-counter trading prices for the securities. Such lower trading prices would result in a decline in the estimated fair value of these assets. For warrants valued using Black-Scholes, adverse industry market conditions or events experienced by the issuer could result in a lower trading price for the underlying equity security and therefore a lower value of these warrants. A reduction in the estimated volatility would also result in a lower value of the warrants. The Company assessed the reasonableness of the fair values of the non-public equity securities noted above based on its consideration of available financial data related to these issuers as well as an assessment of the nature of any over-the-counter trading activity during the period. The Company assessed the reasonableness of the fair value of the non-exchange traded warrants valued using a Black-Scholes valuation based on its consideration of the fair values of comparable exchange-traded options.
9
The table above excludes $46,596 of investments in 10 non-registered investment funds that are valued at NAV as determined by the fund administrators. The underlying fund investments consist primarily of corporate and asset-backed fixed income securities. Considering the general lack of transparency necessary to conduct an independent assessment of the fair value of the securities underlying each of the NAVs provided by the fund administrators, our reporting process includes a number of assessment processes to assist the Company in the evaluation of the information provided by fund managers and fund administrators. These assessment processes include, but are not limited to, regular review and discussion of each fund’s performance with its manager and regular evaluation of performance against applicable benchmarks.
Level 3 Gains and Losses
The tables below set forth a summary of changes in the fair value of the Company’s Level 3 financial assets and liabilities that are measured at fair value on a recurring basis for the three months ended September 30, 2015 and 2014. As of September 30, 2015 and 2014, the Company did not have any net unrealized gains (losses) included in accumulated other comprehensive income on Level 3 financial assets.
|
|
|
Trading Securities |
|
|
Investment Funds |
|
|
Total |
|
|||
|
Beginning balance, July 1, 2015 |
|
$ |
9,248 |
|
|
$ |
51,205 |
|
|
$ |
60,453 |
|
|
Total net gains (losses) (realized/unrealized) |
|
|
|
|
|
|
|
|
|
|
|
|
|
Included in earnings |
|
|
342 |
|
|
|
(1,669 |
) |
|
|
(1,327 |
) |
|
Included in other comprehensive income |
|
|
— |
|
|
|
— |
|
|
|
— |
|
|
Purchases |
|
|
18,364 |
|
|
|
16 |
|
|
|
18,380 |
|
|
Sales/Distributions |
|
|
(12,023 |
) |
|
|
(676 |
) |
|
|
(12,699 |
) |
|
Transfers out of Level 3 |
|
|
— |
|
|
|
(3,300 |
) |
|
|
(3,300 |
) |
|
Ending balance, September 30, 2015 |
|
$ |
15,931 |
|
|
$ |
45,576 |
|
|
$ |
61,507 |
|
|
The amount of total gains or losses for the period included in earnings attributable to the change in unrealized gains or losses relating to assets and liabilities still held at the reporting date |
|
$ |
67 |
|
|
$ |
(1,053 |
) |
|
$ |
(986 |
) |
|
|
|
|
|
|
|
|
|
|
|
|
|
|
|
|
|
Trading Securities |
|
|
Investment Funds |
|
|
Total |
|
|||
|
Beginning balance, July 1, 2014 |
|
$ |
9,486 |
|
|
$ |
93,290 |
|
|
$ |
102,776 |
|
|
Total net gains (losses) (realized/unrealized) |
|
|
|
|
|
|
|
|
|
|
|
|
|
Included in earnings |
|
|
(356 |
) |
|
|
(137 |
) |
|
|
(493 |
) |
|
Included in other comprehensive income |
|
|
— |
|
|
|
— |
|
|
|
— |
|
|
Purchases |
|
|
46,241 |
|
|
|
19,057 |
|
|
|
65,298 |
|
|
Sales/Distributions |
|
|
(52,162 |
) |
|
|
(7,406 |
) |
|
|
(59,568 |
) |
|
Ending balance, September 30, 2014 |
|
$ |
3,209 |
|
|
$ |
104,804 |
|
|
$ |
108,013 |
|
|
The amount of total gains or losses for the period included in earnings attributable to the change in unrealized gains or losses relating to assets and liabilities still held at the reporting date |
|
$ |
(408 |
) |
|
$ |
(66 |
) |
|
$ |
(474 |
) |
There were two transfers out of Level 3 and into Level 2 financial assets during the three months ended September 30, 2015 for investments in non-registered investment funds which are in the process of being redeemed. There were no transfers into or out of Level 1, 2, and 3 during the three months ended September 30, 2014.
10
The tables below set forth a summary of changes in the fair value of the Company’s Level 3 financial assets and liabilities that are measured at fair value on a recurring basis for the nine months ended September 30, 2015 and 2014.
|
|
|
|
|
|
|
Trading Securities |
|
|
Investment Funds |
|
|
Total |
|
|||
|
Beginning balance, January 1, 2015 |
|
|
|
|
|
$ |
3,188 |
|
|
$ |
46,596 |
|
|
$ |
49,784 |
|
|
Total net gains (losses) (realized/unrealized) |
|
|
|
|
|
|
|
|
|
|
|
|
|
|
|
|
|
Included in earnings |
|
|
|
|
|
|
577 |
|
|
|
(1,008 |
) |
|
|
(431 |
) |
|
Included in other comprehensive income |
|
|
|
|
|
|
— |
|
|
|
— |
|
|
|
— |
|
|
Purchases |
|
|
|
|
|
|
57,461 |
|
|
|
766 |
|
|
|
58,227 |
|
|
Sales/Distributions |
|
|
|
|
|
|
(45,266 |
) |
|
|
(723 |
) |
|
|
(45,989 |
) |
|
Transfers (out of) into Level 3 |
|
|
|
|
|
|
(29 |
) |
|
|
(55 |
) |
|
|
(84 |
) |
|
Ending balance, September 30, 2015 |
|
|
|
|
|
$ |
15,931 |
|
|
$ |
45,576 |
|
|
$ |
61,507 |
|
|
The amount of total gains or losses for the period included in earnings attributable to the change in unrealized gains or losses relating to assets and liabilities still held at the reporting date |
|
|
|
|
|
$ |
302 |
|
|
$ |
(326 |
) |
|
$ |
(24 |
) |
|
|
|
|
|
|
|
|
|
|
|
|
|
|
|
|
|
|
|
|
|
Trading Securities |
|
|
Trading Securities Sold not yet Purchased |
|
|
Investment Funds |
|
|
Total |
|
||||
|
Beginning balance, January 1, 2014 |
|
$ |
11,535 |
|
|
$ |
(1,499 |
) |
|
$ |
61,197 |
|
|
$ |
71,233 |
|
|
Total net gains (losses) (realized/unrealized) |
|
|
|
|
|
|
|
|
|
|
|
|
|
|
|
|
|
Included in earnings |
|
|
(268 |
) |
|
|
(122 |
) |
|
|
3,755 |
|
|
|
3,365 |
|
|
Included in other comprehensive income |
|
|
— |
|
|
|
— |
|
|
|
— |
|
|
|
— |
|
|
Purchases |
|
|
95,020 |
|
|
|
6,043 |
|
|
|
47,544 |
|
|
|
148,607 |
|
|
Sales/Distributions |
|
|
(96,829 |
) |
|
|
(4,422 |
) |
|
|
(7,692 |
) |
|
|
(108,943 |
) |
|
Transfers out of Level 3 |
|
|
(6,249 |
) |
|
|
— |
|
|
|
— |
|
|
|
(6,249 |
) |
|
Ending balance, September 30, 2014 |
|
$ |
3,209 |
|
|
$ |
— |
|
|
$ |
104,804 |
|
|
$ |
108,013 |
|
|
The amount of total gains or losses for the period included in earnings attributable to the change in unrealized gains or losses relating to assets and liabilities still held at the reporting date |
|
$ |
311 |
|
|
$ |
— |
|
|
$ |
4,190 |
|
|
$ |
4,501 |
|
During the nine months ended September 30, 2015, there was one transfer into Level 3 financial assets and out of Level 2 and one transfer out of Level 3 and into Level 1 for an equity security that was previously a non-public equity security and during the applicable period became publicly traded. In addition, during the nine months ended September 30, 2015, there were two transfers out of Level 3 and into Level 2 financial assets for investments in non-registered investment funds which are in the process of being redeemed. Two transfers were made out of Level 3 and into Level 1 during the nine months ended September 30, 2014, for equity securities that were previously non-public equity securities and during the applicable period became publicly traded.
11
Gains and losses from Level 3 financial assets that are measured at fair value on a recurring basis, that are included in earnings for the three and nine months ended September 30, 2015 and 2014, are reported in the following line descriptions on the Company’s consolidated statements of operations:
|
|
Three Months Ended |
|
|
Nine Months Ended |
|
||||||||||
|
|
September 30, |
|
|
September 30, |
|
||||||||||
|
|
2015 |
|
|
2014 |
|
|
2015 |
|
|
2014 |
|
||||
|
Total gains and losses included in earnings for the period: |
|
|
|
|
|
|
|
|
|
|
|
|
|
|
|
|
Institutional brokerage |
$ |
279 |
|
|
$ |
(4 |
) |
|
$ |
416 |
|
|
$ |
(1 |
) |
|
Net investment income |
|
(1,606 |
) |
|
|
(489 |
) |
|
|
(847 |
) |
|
|
3,366 |
|
|
Change in unrealized gains or losses relating to assets still held at the end of the respective period: |
|
|
|
|
|
|
|
|
|
|
|
|
|
|
|
|
Institutional brokerage |
$ |
4 |
|
|
$ |
9 |
|
|
$ |
141 |
|
|
$ |
(20 |
) |
|
Net investment income |
|
(990 |
) |
|
|
(483 |
) |
|
|
(165 |
) |
|
|
4,521 |
|
Items Measured at Fair Value on a Non-Recurring Basis
The Company also measures certain financial assets and liabilities and other assets at fair value on a non-recurring basis including items such as intangibles, fixed assets and estimated contingent consideration payable. Adjustments to the fair value of these assets and liabilities usually result from the application of lower-of-cost-or-market accounting or impairments of individual assets. Adjustments to the fair value of contingent consideration payable would result from differences between the underlying forecasted securities lending results and actual results (see Note 3). Due to the nature of these assets, unobservable inputs are used to value these assets and liabilities. In determining the fair value, the Company analyzes various financial, performance, and market factors to estimate the fair value, including where applicable, market activity. As a result, these assets and liabilities are classified within Level 3 of the fair value hierarchy.
During the three and nine months ended September 30, 2015, except for the impact of the scheduled partial payment of contingent consideration payable, there were no assets or liabilities measured at fair value on a non-recurring basis for which there was a change in carrying value. During the year ended December 31, 2014, there were no assets or liabilities measured at fair value on a non-recurring basis for which there was a change in carrying value.
12
Financial Instruments Held for Investment—Designated as Trading
As of September 30, 2015, and December 31, 2014, the Company had certain investments in marketable equity securities held by other than its broker-dealer subsidiaries that are classified as trading securities. In addition, as of September 30, 2015 and December 31, 2014, the Company had short positions in U.S. Treasury securities held by other than its broker-dealer subsidiaries that are classified as trading securities. These investments are designated as trading based on the Company’s intent at the time of designation. In accordance with ASC 320, “Investments—Debt and Equity Securities” (“ASC 320”), these securities are carried at fair value with resulting realized and unrealized gains and losses reflected as net investment income (loss) in the consolidated statements of operations. In addition, pursuant to ASC 825, “Financial Instruments” (“ASC 825”), from time-to-time the Company may elect to account for non-public equity securities acquired by other than the Company’s broker-dealer subsidiaries as part of its trading portfolio at fair value with resulting realized and unrealized gains and losses reflected as net investment income (loss) in the consolidated statements of operations. During the three months ended September 30, 2015, the Company elected to account for one non-public equity security, purchased at a cost of $2,511, at fair value. During the nine months ended September 30, 2015, the Company elected to account for two non-public equity securities, purchased at a cost of $6,510, at fair value. Net gains and losses on such trading securities as of the dates indicated were as follows:
|
|
|
Three Months Ended |
|
|
Nine Months Ended |
|
||||||||||
|
|
|
September 30, |
|
|
September 30, |
|
||||||||||
|
|
|
2015 |
|
|
2014 |
|
|
2015 |
|
|
2014 |
|
||||
|
Net gains recognized on trading securities |
|
$ |
2,433 |
|
|
$ |
3,578 |
|
|
$ |
8,841 |
|
|
$ |
11,628 |
|
|
Less: Net (gains) losses recognized on trading securities sold during the period |
|
|
(1,343 |
) |
|
|
169 |
|
|
|
(4,972 |
) |
|
|
(872 |
) |
|
Unrealized gains recognized on trading securities still held at the reporting date |
|
$ |
1,090 |
|
|
$ |
3,747 |
|
|
$ |
3,869 |
|
|
$ |
10,756 |
|
As part of the Company’s investing activities, during the nine months ended September 30, 2015, the Company entered into two short sales, totaling $200,000 face value, of 4.625% U.S. Treasury securities maturing in November 2016. These two short sales were settled in the third quarter of 2015. During the nine months ended September 30, 2014, the Company entered into one short-sale of a $75,000 face value 7.25% U.S. Treasury security maturing in May 2016, and two short-sales of $100,000 face value each, 4.50% U.S. Treasury securities. These two securities which mature in November 2015 and February 2016, respectively, were settled in the fourth quarter of 2014. The $75,000 face value position was open at September 30, 2015 and December 31, 2014 and is included in securities sold but not yet purchased on the Company’s consolidated balance sheets. Proceeds from open short-sales, as well as related margin requirements, are held in a collateral account and are included in due from brokers, dealers and clearing organizations in the Company’s consolidated balance sheets. Such amounts are not available for withdrawal and are subject to closure of the open short positions. During the three months ended September 30, 2015 and 2014, the Company incurred $3,456 and $3,668, respectively, of interest expense related to these transactions. During the nine months ended September 30, 2015 and 2014, the Company incurred $10,365 and $8,428, respectively, of interest expense related to these transactions. The Company is obligated to fund the fixed-rate coupon interest on these securities while the short-positions are outstanding.
13
Fair Value of the Investments Valued at NAV
As of September 30, 2015 and December 31, 2014, the Company had $88,641 and $104,888, respectively, of investments that are valued at NAV. The following table presents information about the Company’s investments in hedge funds and private equity funds measured at fair value based on NAV at September 30, 2015 and December 31, 2014:
|
|
|
September 30, 2015 |
|
|
December 31, 2014 |
|
||||||||||
|
|
|
Fair Value |
|
|
Unfunded Commitment |
|
|
Fair Value |
|
|
Unfunded Commitment |
|
||||
|
Hedge funds: |
|
|
|
|
|
|
|
|
|
|
|
|
|
|
|
|
|
Fixed income/credit-related |
|
$ |
47,862 |
|
|
$ |
— |
|
|
$ |
57,532 |
|
|
$ |
— |
|
|
Multi-strategy |
|
|
30,622 |
|
|
|
— |
|
|
|
37,890 |
|
|
|
— |
|
|
Private equity funds |
|
|
10,157 |
|
|
|
245 |
|
|
|
9,466 |
|
|
|
2,586 |
|
|
Total |
|
$ |
88,641 |
|
|
$ |
245 |
|
|
$ |
104,888 |
|
|
$ |
2,586 |
|
Investments in hedge funds may be subject to lock-up restrictions or gates. A hedge fund lockup provision is a provision that provides that an investor may not make a withdrawal from the fund or may be subject to withdrawal fees. The purpose of a gate is to restrict the level of redemptions that an investor in a particular hedge fund can demand at any redemption date. All of the Company’s hedge fund investments have the ability to impose redemption gates. As of September 30, 2015, 49% of the fair value of the Company’s fund investments, or $43,065 of the hedge funds, was redeemable on either a monthly or quarterly basis with notice periods of 60 days or less, 31% of the fair value, or $27,390 of the hedge funds, was redeemable on a quarterly basis with notice periods of between 90 days and 180 days. In addition, 9% of the fair value, or $8,029 of the hedge funds, was subject to lockup provisions 22% of which will expire during 2015.
The Company’s fixed income and credit-related hedge fund investments include funds that primarily employ long-short or relative value strategies in order to benefit from investments in undervalued or overvalued securities that are primarily debt or credit related. The Company’s multi-strategy fund investments include funds that pursue a variety of fixed income, credit and asset-backed strategies to realize short and long term gains. Management of these hedge funds has the ability to overweight or underweight different strategies to best capitalize on current investment opportunities.
The Company’s private equity fund investments include funds that pursue multiple strategies including direct lending, asset securitization and real estate development. These investments by the Company are generally not redeemable with the funds. The nature of these fund investments is that distributions are received through the liquidation of the underlying assets of the fund. At September 30, 2015 it was estimated that these funds will be liquidated in the next three years.
Financial Instruments Held for Investment—Designated as Available-for-Sale
From time-to-time, the Company may have investments in marketable equity securities held by other than the Company’s broker-dealer subsidiaries that are classified as available-for-sale securities. These investments are designated as available-for-sale due to the Company’s intent at the time of designation to hold these securities for investment purposes over an extended period, however, they are available to be sold should economic conditions warrant such a transaction. In accordance with ASC 320, these securities are carried at fair value with resulting unrealized gains and losses reflected as other comprehensive income or loss. As of September 30, 2015, the Company did not have any marketable equity securities classified as available-for-sale. Gross unrealized gains and losses on available-for-sale securities as of December 31, 2014 were as follows:
|
|
|
December 31, 2014 |
|
|||||||||||||
|
|
|
|
|
|
|
Unrealized |
|
|
|
|
|
|||||
|
|
|
Cost Basis |
|
|
Gains |
|
|
Losses |
|
|
Fair Value |
|
||||
|
Marketable equity securities |
|
$ |
100 |
|
|
$ |
72 |
|
|
$ |
— |
|
|
$ |
172 |
|
14
The Company evaluates its portfolio of marketable equity securities for impairment as of each reporting date. For the securities with unrealized losses, the Company will review the underlying cause for the impairments, as well as the severity and duration of the impairments. If the impairment is determined to be other-than-temporary, the Company will recognize an other-than-temporary impairment loss in its consolidated statement of operations. The Company did not recognize any other-than-temporary impairment losses during the three and nine months ended September 30, 2015 and 2014. As of September 30, 2014, the Company did not hold any marketable equity securities that were in an unrealized loss position.
There were no sales of marketable equity securities classified as available-for-sale during the three months ended September 30, 2015. During the nine months ended September 30, 2015, the Company sold its remaining marketable equity security classified as available-for-sale and received proceeds of $191 resulting in a gross gain of $91. There were no sales of marketable equity securities during the three and nine months ended September 30, 2014.
Other Comprehensive Income
The following tables set forth the changes in the Company’s accumulated other comprehensive income by component for the period indicated along with detail regarding reclassifications from other comprehensive income. All such reclassifications from other comprehensive income are included in net investment income in the Company’s consolidated statements of operations.
|
|
Three Months Ended September 30, |
|
|
Nine Months Ended September 30, |
|
||||||||||
|
|
2015 |
|
|
2014 |
|
|
2015 |
|
|
2014 |
|
||||
|
Accumulated other comprehensive income, beginning balance |
$ |
— |
|
|
$ |
58 |
|
|
$ |
44 |
|
|
$ |
34 |
|
|
Other comprehensive income before reclassifications |
|
— |
|
|
|
(20 |
) |
|
|
— |
|
|
|
4 |
|
|
Amounts reclassified from other comprehensive income |
|
— |
|
|
|
— |
|
|
|
(44 |
) |
|
|
— |
|
|
Accumulated other comprehensive income, at period end |
$ |
— |
|
|
$ |
38 |
|
|
$ |
— |
|
|
$ |
38 |
|
|
|
|
|
|
|
|
|
|
|
|
|
|
|
|
|
|
|
|
|
|
|
|
|
|
|
|
|
|
|
|
|
|
|
|
|
Three Months Ended September 30, |
|
|
Nine Months Ended September 30, |
|
||||||||||
|
|
2015 |
|
|
2014 |
|
|
2015 |
|
|
2014 |
|
||||
|
Reclassifications from other comprehensive income: |
|
|
|
|
|
|
|
|
|
|
|
|
|
|
|
|
Realized gains on sale of securities |
$ |
— |
|
|
$ |
— |
|
|
$ |
44 |
|
|
$ |
— |
|
Other Investments, at Cost
Other investments consisted of the following as of the dates indicated:
|
|
September 30, 2015 |
|
|
December 31, 2014 |
|
||
|
Non-public equity securities |
$ |
7,000 |
|
|
$ |
7,000 |
|
The Company evaluates its non-public equity securities, carried at cost, for impairment as of each reporting date. This evaluation includes consideration of the operating performance of the respective companies, their financial condition and their near-term and long-term prospects. Based on its evaluations of these investments, the Company recorded no impairment losses during the three and nine months ended September 30, 2015 and 2014.
During the three and nine months ended September 30, 2015, there were no sales of investments carried at cost. During the three and nine months ended September 30, 2014, the Company received proceeds of $1,428 from the sale of a non-public equity security resulting in a gross gain of $1,176. During the nine months ended September 30, 2014, the Company received $5,000 reflecting the full repayment at its maturity of a corporate debt investment that was carried at cost.
15
3. Securities Lending:
On March 27, 2014, the Company entered into a Transaction Agreement with Lazard Capital Markets LLC (“LCM”) pursuant to which FBR Capital Markets & Co. (“FBRCM”) agreed to purchase LCM’s securities lending business (the “Transaction Agreement”) and on August 4, 2014, the Company completed its purchase of this business. As a result of this acquisition, the Company has an active securities borrowed and loaned business in which it borrows securities from one party and lends them to another. Pursuant to the terms of the Transaction Agreement, the Company made an initial cash payment of $1,000 at closing and is obligated to make additional payments that are contingent on the performance of the business over the 18 month period subsequent to the closing. During the three and nine months ended September 30, 2015, the Company made such additional payments of $1,065 and $2,166, respectively. As of September 30, 2015, the Company has estimated its aggregate remaining contingent payments to be $1,904. This estimated contingent obligation is included in accounts payable, accrued expenses and other liabilities on the consolidated balance sheets. The Company will continue to assess the value of this contingent consideration at each reporting date until its obligations are satisfied.
As a result of this purchase, the Company recorded goodwill of $2,570 and a finite-lived intangible asset related to acquired customer relationships initially valued at $2,500. The goodwill and intangible asset balances are included in the Company’s capital markets segment and these balances are expected to be deductible for tax purposes. The customer relationship intangible assets will be amortized over their estimated useful life of seven years on a straight-line basis. During the three and nine months ended September 30, 2015, the Company recorded $89 and $268, respectively, of amortization expense related to this intangible asset that is included in other operating expenses in the Company’s consolidated statements of operations. The following tables presents the contractual gross and net securities borrowing and lending balances and the related offsetting amount as of September 30, 2015 and December 31, 2014:
|
|
As of September 30, 2015 |
|
|||||||||||||||||
|
|
Gross amounts recognized |
|
|
Gross amounts offset in the consolidated balance sheets (1) |
|
|
Net amounts included in the consolidated balance sheets |
|
|
Amounts not offset in the balance sheet but eligible for offsetting upon counterparty default (2) |
|
|
Net amounts |
|
|||||
|
Securities borrowed |
$ |
760,190 |
|
|
$ |
— |
|
|
$ |
760,190 |
|
|
$ |
760,190 |
|
|
$ |
— |
|
|
Securities loaned |
$ |
759,364 |
|
|
$ |
— |
|
|
$ |
759,364 |
|
|
$ |
759,364 |
|
|
$ |
— |
|
|
|
|
|
|
|
|
|
|
|
|
|
|
|
|
|
|
|
|
|
|
|
|
As of December 31, 2014 |
|
|||||||||||||||||
|
|
Gross amounts recognized |
|
|
Gross amounts offset in the consolidated balance sheets (1) |
|
|
Net amounts included in the consolidated balance sheets |
|
|
Amounts not offset in the balance sheet but eligible for offsetting upon counterparty default (2) |
|
|
Net amounts |
|
|||||
|
Securities borrowed |
$ |
594,674 |
|
|
$ |
— |
|
|
$ |
594,674 |
|
|
$ |
594,674 |
|
|
$ |
— |
|
|
Securities loaned |
$ |
595,717 |
|
|
$ |
— |
|
|
$ |
595,717 |
|
|
$ |
595,717 |
|
|
$ |
— |
|
_________________
|
(1) |
Includes financial instruments subject to enforceable master netting provisions that are permitted to be offset to the extent an event of default has occurred. |
|
(2) |
Includes the amount of cash collateral held/posted. |
16
On September 1, 2015, the Company completed the purchase of MLV & Co. LLC (“MLV”), an investment banking and brokerage firm focused on equity capital markets and a leading provider of At-the-Market (“ATM”) offerings. As a result of this acquisition, the Company added approximately 20 client-facing employees, primarily in investment banking and research. Pursuant to the terms of the transaction agreement related to this acquisition, the Company made a cash payment of $3,250 to acquire 100% of the stock of MLV. While the Company is in the process of completing its asset and liability appraisals related to this acquisition, based on its preliminary estimates of the fair value of the assets acquired and liabilities assumed, $1,205 of the purchase price has been allocated to goodwill and intangible assets as of September 30, 2015.
The Company accounted for its acquisition of MLV in accordance with ASC 805, “Business Combinations” (“ASC 805”), using the acquisition method of accounting which requires, among other things, that assets acquired and liabilities assumed be recognized at their estimated fair values as of the acquisition date. The Company’s estimates of fair value included in the financial statements, in conformity with ASC 820, represent the Company’s best estimates and valuations. These estimates and underlying assumptions are inherently subject to significant uncertainties and contingencies beyond the control of the Company. Accordingly, the Company cannot provide assurance that the estimates, assumptions, and values reflected in its valuations will be realized, and actual results could vary materially. The table below summarizes the preliminary estimates of the fair value of the assets acquired and liabilities assumed as of the acquisition date.
|
Purchase Price: |
|
|
|
|
|
Cash paid |
|
$ |
3,250 |
|
|
Fair Value of Assets Acquired: |
|
|
|
|
|
Cash |
|
|
975 |
|
|
Due from brokers, dealers and clearing organizations |
|
|
2,098 |
|
|
Investment banking receivables |
|
|
1,310 |
|
|
Other |
|
|
606 |
|
|
Total |
|
$ |
4,989 |
|
|
Fair Value of Liabilities Assumed: |
|
|
|
|
|
Accounts payable, accrued expenses and other liabilities |
|
$ |
2,944 |
|
|
Net assets acquired |
|
$ |
2,045 |
|
|
Purchase price to be allocated to goodwill and intangible assets |
|
$ |
1,205 |
|
The goodwill and intangible asset balances are included in the Company’s capital markets segment and this entire balance is expected to be deductible for tax purposes. The Company is in the process of completing its asset and liability appraisals related to this acquisition. In accordance with ASC 805, if additional information is obtained about these assets and liabilities within the measurement period (not to exceed one year from the date of acquisition), including finalization of asset and liability appraisals, the Company will refine its estimates of fair value to allocate the purchase price more accurately.
17
During the three and nine months ended September 30, 2015, the Company recorded tax benefits of $2,881 and $2,703, respectively. The Company’s quarterly tax provision is determined pursuant to ASC 740, “Income Taxes” (“ASC 740”). For the three and nine months ended September 30, 2015, the Company’s tax benefits are based on the actual year-to-date effective rate, as this is the Company’s best estimate of its annual effective tax rate for the full fiscal year. The computation of the annual effective tax rate includes a forecast of our estimated “ordinary” income, which is the Company’s annual income from operations before tax, excluding unusual or infrequently occurring items. Significant management judgment is required in the projection of ordinary income in order to determine the estimated annual effective tax rate. The level of income projected for fiscal 2015 and the impact of the valuation allowance release causes an unusual relationship between income and income tax expense (benefit), with small changes resulting in: (i) a potential significant impact on the rate and, (ii) potentially unreliable estimates. As a result, the Company computed the provision for income taxes for the three and nine months ended September 30, 2015 by applying the actual effective tax rate to the year-to-date loss as permitted by ASC 740. The Company’s effective tax rates for the three and nine months ended September 30, 2015 were 45.7% and 47.0%, respectively. These tax rates differed from statutory tax rates primarily due to the effects of capital loss carryforwards subject to a valuation allowance that were projected to be utilized during the year.
Based on forecasted taxable income for the full year 2014 and its use of an estimated annual effective rate, during the three and nine months ended September 30, 2014, the Company recorded a tax benefit of $193 and a tax provision of $5,211, respectively. The Company’s effective tax rates for the three and nine months ended September 30, 2014 were (5.8)% and 24.5%, respectively. These tax rates differed from statutory tax rates primarily due to the effects of capital loss carryforwards subject to a valuation allowance that were projected to be utilized during the year.
At December 31, 2014, the Company’s net deferred tax assets totaled $32,183 and were partially offset by a valuation allowance of $3,535. This valuation allowance related to capital loss carryforwards and was determined based on the Company’s application of the guidance in ASC 740 and its conclusion that it was more likely than not that the benefits of these assets would not be realized in the future. Based on its assessment as of September 30, 2015, the Company determined that it was more likely than not that the capital loss carryforwards subject to the valuation allowance would be utilized in 2015. The Company’s projected utilization of the capital loss carryforward deferred tax asset and corresponding release of the remaining valuation allowance is reflected in the calculation of the Company’s actual year-to-date effective tax rate.
6. Regulatory Capital Requirements:
FBRCM and MLV, the Company’s broker-dealer subsidiaries, are registered with the Securities and Exchange Commission (“SEC”) and are members of the Financial Industry Regulatory Authority, Inc. (“FINRA”). As such, they are subject to the minimum net capital requirements promulgated by the SEC. As of September 30, 2015, FBRCM had net capital of $33,308, which was $30,889 in excess of its required net capital of $2,419. In addition, MLV had net capital of $856, which was $606 in excess of its required net capital of $250.
18
Basic earnings per share includes no dilution and is computed by dividing net income or loss available to common shareholders by the weighted average number of common shares outstanding for the period, including restricted stock units (“RSUs”) that are not subject to forfeiture. Diluted earnings per share includes the impact of dilutive securities such as stock options, unvested shares of restricted stock and RSUs, that are subject to forfeiture. Due to the Company’s reported net loss for the three and nine months ended September 30, 2015, all stock options, unvested shares of restricted stock and unvested RSUs were considered anti-dilutive for these periods. The following tables present the computations of basic and diluted income per share for the periods indicated:
|
|
|
Three Months Ended |
|
|
Three Months Ended |
|
||||||||||
|
|
|
September 30, 2015 |
|
|
September 30, 2014 |
|
||||||||||
|
|
|
Basic |
|
|
Diluted |
|
|
Basic |
|
|
Diluted |
|
||||
|
Weighted average shares outstanding: |
|
|
|
|
|
|
|
|
|
|
|
|
|
|
|
|
|
Common stock (in thousands) |
|
|
7,899 |
|
|
|
7,899 |
|
|
|
10,171 |
|
|
|
10,171 |
|
|
Stock options, unvested restricted stock and RSUs (in thousands) |
|
|
— |
|
|
|
— |
|
|
|
— |
|
|
|
1,248 |
|
|
Weighted average common and common equivalent shares outstanding (in thousands) |
|
|
7,899 |
|
|
|
7,899 |
|
|
|
10,171 |
|
|
|
11,419 |
|
|
Net (loss) income applicable to common stock |
|
$ |
(3,428 |
) |
|
$ |
(3,428 |
) |
|
$ |
3,501 |
|
|
$ |
3,501 |
|
|
Net (loss) income per common share |
|
$ |
(0.43 |
) |
|
$ |
(0.43 |
) |
|
$ |
0.34 |
|
|
$ |
0.31 |
|
|
|
|
|
|
|
|
|
|
|
|
|
|
|
|
|
|
|
|
|
|
Nine Months Ended |
|
|
Nine Months Ended |
|
||||||||||
|
|
|
September 30, 2015 |
|
|
September 30, 2014 |
|
||||||||||
|
|
|
Basic |
|
|
Diluted |
|
|
Basic |
|
|
Diluted |
|
||||
|
Weighted average shares outstanding: |
|
|
|
|
|
|
|
|
|
|
|
|
|
|
|
|
|
Common stock (in thousands) |
|
|
8,266 |
|
|
|
8,266 |
|
|
|
10,642 |
|
|
|
10,642 |
|
|
Stock options, unvested restricted stock and RSUs (in thousands) |
|
|
— |
|
|
|
— |
|
|
|
— |
|
|
|
1,156 |
|
|
Weighted average common and common equivalent shares outstanding (in thousands) |
|
|
8,266 |
|
|
|
8,266 |
|
|
|
10,642 |
|
|
|
11,798 |
|
|
Net (loss) income applicable to common stock |
|
$ |
(3,051 |
) |
|
$ |
(3,051 |
) |
|
$ |
16,087 |
|
|
$ |
16,087 |
|
|
Net (loss) income per common share |
|
$ |
(0.37 |
) |
|
$ |
(0.37 |
) |
|
$ |
1.51 |
|
|
$ |
1.36 |
|
The following table presents the number of anti-dilutive stock options, unvested restricted stock and unvested RSUs for the periods indicated (in thousands):
|
|
Three Months Ended September 30, |
|
|
Nine Months Ended September 30, |
|
||||||||||
|
|
2015 |
|
|
2014 |
|
|
2015 |
|
|
2014 |
|
||||
|
Stock Options—Employees and directors |
|
565 |
|
|
|
694 |
|
|
|
565 |
|
|
|
720 |
|
|
Stock Options—Non-employee |
|
32 |
|
|
|
26 |
|
|
|
32 |
|
|
|
27 |
|
|
Restricted Stock, unvested |
|
17 |
|
|
|
9 |
|
|
|
17 |
|
|
|
10 |
|
|
Restricted Stock Units, unvested |
|
2,025 |
|
|
|
1,048 |
|
|
|
2,025 |
|
|
|
1,113 |
|
|
Total |
|
2,639 |
|
|
|
1,777 |
|
|
|
2,639 |
|
|
|
1,870 |
|
19
8. Commitments and Contingencies:
Litigation
As of September 30, 2015, except as described below, the Company was neither a defendant nor plaintiff in any lawsuits or arbitrations nor involved in any governmental or self-regulatory organization matters that are expected to have a material adverse effect on its financial condition, results of operations, or liquidity. The Company has been named as a defendant in a small number of civil lawsuits relating to its various businesses. In addition, the Company is subject to various reviews, examinations, investigations and other inquiries by governmental agencies and self regulatory organizations. There can be no assurance that these matters individually or in aggregate will not have a material adverse effect on the Company’s financial condition, results of operations, or liquidity in a future period. However, based on management’s review with counsel, resolution of these matters is not expected to have a material adverse effect on the Company’s financial condition, results of operations or liquidity.
Many aspects of the Company’s business involve substantial risks of liability and litigation. Underwriters, broker-dealers and investment advisers are exposed to liability under federal and state securities laws, other federal and state laws and court decisions, including decisions with respect to underwriters’ liability and limitations on indemnification, as well as with respect to the handling of customer accounts. For example, underwriters may be held liable for material misstatements or omissions of fact in a prospectus used in connection with the securities being offered and broker-dealers may be held liable for statements made by their securities analysts or other personnel. In the past, FBRCM has been named as a defendant in a small number of securities claims involving investment banking clients of FBRCM as a result of FBRCM’s role as an underwriter. In these cases, the underwriting agreement provides, subject to certain conditions, that the investment banking client is required to indemnify FBRCM against certain claims or liabilities, including claims or liabilities under the Securities Act of 1933, as amended (the “Securities Act”), or contribute to payments which FBRCM is required to make as a result of the litigation. There can be no assurance that such indemnification or contribution will ultimately be available to the Company or that an investment banking client will be able to satisfy its indemnity or contribution obligations when due.
FBRCM has been named a defendant in the putative class action lawsuit Waterford Township Police & Fire, Retirement System, vs. Regional Management Corp. et al., pending in the United States District Court for the Southern District of New York. The amended complaint, filed on November 24, 2014 (the “Amended Complaint”), names FBRCM as a co-managing underwriter of offerings in September 2013 and December 2013. Plaintiffs allege that the Registration Statement and Prospectus used in connection with these offerings were negligently prepared and, as a result, contained untrue statements of material fact and omitted to state other facts necessary to make the statements made not misleading. The Amended Complaint asserts claims against all the underwriters under Sections 11 and 12 of the Securities Act. Regional Management has agreed to indemnify all the underwriters, including FBRCM, pursuant to the operative underwriting agreement. In response to the defendants’ motions to dismiss, filed on January 23, 2015, the putative class plaintiffs filed a second amended complaint (the “Second Amended Complaint”), which shall serve as the operative complaint. The underwriter defendants have moved to dismiss the Second Amended Complaint and the briefing was completed in July 2015.
In accordance with applicable accounting guidance, the Company establishes an accrued liability for litigation and regulatory matters when those matters present loss contingencies that are both probable and estimable. In such cases, there may be an exposure to loss in excess of any amounts accrued. When a loss contingency is not both probable and estimable, the Company does not establish an accrued liability. As a litigation or regulatory matter develops, management, in conjunction with counsel, evaluates on an ongoing basis whether such matter presents a loss contingency that is probable and estimable. The pending case discussed above involving FBRCM is at a preliminary stage, and based on management’s review with counsel and present information known by management, a loss contingency for this matter was not probable and estimable as of September 30, 2015.
20
In certain circumstances, broker-dealers and asset managers may also be held liable by customers and clients for losses sustained on investments. In recent years, there has been an increasing incidence of litigation and actions by government agencies and self regulatory organizations involving the securities industry, including class actions that seek substantial damages. The Company is also subject to the risk of litigation, including litigation that may be without merit. As the Company intends to actively defend any such litigation, significant legal expenses could be incurred. An adverse resolution of any future litigation against the Company could materially affect its financial condition, operating results and liquidity.
9. Shareholders’ Equity:
Share Repurchases
During the three and nine months ended September 30, 2015, the Company repurchased 482,976 shares and 1,573,640 shares, respectively, of its common stock in open market or privately negotiated transactions at weighted average share prices of $22.51 per share and $23.84 per share, respectively, for a total cost of $10,873 and $37,511, respectively. During the three and nine months ended September 30, 2014, the Company repurchased 1,201,897 shares and 1,863,909 shares, respectively, of its common stock in open market or privately negotiated transactions at weighted average share prices of $28.06 per share and $27.39 per share, respectively, for a total cost of $33,730 and $51,060, respectively. As of September 30, 2015, the Company had remaining authority to repurchase 132,156 additional shares. See note 12. Subsequent Events for information regarding an increase to the Company’s share repurchase authorization.
The Company also purchases shares of its common stock from recipients of stock-based compensation awards upon the vesting of RSU and restricted stock awards, and the exercise of options to purchase stock, as recipients sell shares to meet their tax obligations. During the three and nine months ended September 30, 2015, the Company purchased 6,695 shares and 106,322 shares, respectively, of common stock at weighted average share prices of $22.71 per share and $23.20 per share, respectively, for a total cost of $159 and $2,458, respectively, for this purpose. During the year ended December 31, 2014, the Company purchased 71,000 shares of common stock at a weighted average share price of $25.68 per share for a total cost of $1,823 for this purpose.
Dividends
On June 16, 2015, the Company announced that its Board of Directors approved the declaration of a quarterly cash dividend of $0.20 per common share to be paid on August 28, 2015 to shareholders of record as of the close of business on July 31, 2015. See note 12. Subsequent Events for information regarding dividends declared subsequent to the balance sheet date.
Unvested RSUs and restricted shares carry dividend rights in which dividends are payable as the RSUs and restricted shares vest in accordance with the respective underlying grants. As of September 30, 2015, the Company had $426 of dividends payable related to such unvested RSUs and restricted shares. Note that with respect to RSUs that vest based on both individual service requirements and the Company’s achievement of specific performance goals, the Company’s dividend payable is consistent with the Company’s assessment of the rate at which these awards would vest.
Employee Stock Purchase Plan
Under the Company’s Employee Stock Purchase Plan (the “Purchase Plan”), eligible employees may purchase common stock through payroll deductions at a price that is 85% of the lower of the market value of the common stock on the first day of the offering period or the last day of the offering period. In accordance with the provisions of ASC 718, “Compensation—Stock Compensation,” the Company is required to recognize compensation expense relating to shares offered under the Purchase Plan. For the three and nine months ended September 30, 2015, the Company recognized compensation expense of $26 and $166, respectively, related to the Purchase Plan. For the three and nine months ended September 30, 2014, the Company recognized compensation expense of $32 and $220, respectively, related to the Purchase Plan.
21
FBR & Co. Amended 2006 Long-Term Incentive Plan (“FBR & Co. Long-Term Incentive Plan”)
Under the FBR & Co. Long-Term Incentive Plan, as amended, the Company may grant options to purchase stock, stock appreciation rights, performance awards, restricted and unrestricted stock and RSUs for up to an aggregate of 7,217,496 shares of common stock, subject to increase under certain provisions of the plan, to eligible participants. Participants include employees, officers and directors of the Company and its subsidiaries. The plan’s termination date is October 22, 2023 unless it is terminated sooner by the Company’s Board of Directors. The FBR & Co. Long-Term Incentive Plan has a term of 10 years and options granted may have an exercise period of up to 10 years. Options may be incentive stock options, as defined by Section 422 of the Internal Revenue Code, or nonqualified stock options.
The Company grants options to purchase stock, restricted shares of common stock and RSUs to employees that vest based on meeting specified service conditions of three to five years and in certain cases achievement of specified market conditions or performance goals. The following table presents compensation expense related to these awards for the periods indicated:
|
|
Three Months Ended September 30, |
|
|
Nine Months Ended September 30, |
|
||||||||||
|
|
2015 |
|
|
2014 |
|
|
2015 |
|
|
2014 |
|
||||
|
Stock Options |
$ |
— |
|
|
$ |
21 |
|
|
$ |
7 |
|
|
$ |
(64 |
) |
|
Restricted shares |
|
97 |
|
|
|
80 |
|
|
|
249 |
|
|
|
216 |
|
|
RSUs |
|
2,159 |
|
|
|
2,373 |
|
|
|
5,215 |
|
|
|
6,581 |
|
The following table presents issuance activity related to grants of these awards for the period indicated:
|
|
Three Months Ended |
|
|
Nine Months Ended |
|
||||||||||||||||||
|
|
September 30, 2015 |
|
|
September 30, 2015 |
|
||||||||||||||||||
|
|
Stock Options |
|
|
Restricted Shares |
|
|
RSUs |
|
|
Stock Options |
|
|
Restricted Shares |
|
|
RSUs |
|
||||||
|
Stock-based award issuances |
|
— |
|
|
|
— |
|
|
|
11,477 |
|
|
|
— |
|
|
|
17,184 |
|
|
|
364,443 |
|
|
Grant date fair value per share |
$ |
— |
|
|
$ |
— |
|
|
$ |
23.24 |
|
|
$ |
— |
|
|
$ |
22.55 |
|
|
$ |
23.47 |
|
For all RSU awards that vest based on individual service requirements and the Company’s achievement of specified performance goals, the Company assesses the probability of achieving these goals at each reporting date.
Included in the RSUs granted during the nine months ended September 30, 2015 were 230,258 RSU awards that will vest based on both individual service requirements and the Company’s achievement of a specified performance goal. For awards granted in 2015, the performance goal will be met at (1) a 50% rate if the tangible book value of the Company as adjusted to exclude the impact of any dividends declared or paid during the measurement period, measured on a per share basis (“TBV”), has increased by an amount equal to a 6% compound annual growth rate over the three-year period beginning on January 1, 2015 (the “2015 performance period”); (2) a 100% rate if the TBV of the Company has increased by an amount equal to a 9% compound annual growth rate over the 2015 performance period; and (3) a proportional rate between 50% and 100% in the event the TBV of the Company has increased by an amount between a 6% and a 9% compound annual growth rate over the 2015 performance period. In the event the TBV of the Company has not increased by an amount equal to a 6% compound annual growth rate over the 2015 performance period, no performance share units will be earned and the award will be forfeited. During the three and nine months ended September 30, 2015, compensation expense was recognized based on the Company’s assessment that the awards would vest at a 50% rate.
22
Regarding 277,405 RSU awards granted in 2014 that include performance goals, the performance goal will be met at (1) a 50% rate if the TBV of the Company has increased by an amount equal to a 6% compound annual growth rate over the three-year period beginning on January 1, 2014 (the “2014 performance period”); (2) a 100% rate if the TBV of the Company has increased by an amount equal to a 9% compound annual growth rate over the 2014 performance period; and (3) a proportional rate between 50% and 100% in the event the TBV of the Company has increased by an amount between a 6% and a 9% compound annual growth rate over the 2014 performance period. In the event the TBV of the Company has not increased by an amount equal to a 6% compound annual growth rate over the 2014 performance period, no performance share units will be earned and the award will be forfeited. During the three and nine months ended September 30, 2015, compensation expense was recognized based on the Company’s assessment that the minimum performance threshold will not be met. As a result of this assessment, $1,042 of stock compensation expense recognized during the year ended December 31, 2014 was reversed during the nine months ended September 30, 2015.
Regarding 375,000 RSU awards granted in 2013 that include performance goals, the performance goal will be met at (1) a 100% rate if the combined net worth of the Company, measured on a per share basis, has increased by an amount equal to a 7% compound annual growth rate over the three-year period beginning on April 1, 2013 (the “2013 performance period”); (2) a 50% rate if the combined net worth of the Company, measured on a per share basis, has increased by an amount equal to a 4% compound annual growth rate over the 2013 performance period; and (3) a proportional rate between 50% and 100% in the event the net worth of the Company, measured on a per share basis has increased by an amount between a 4% and 7% compound annual growth over the 2013 performance period. For purposes of these calculations the combined net worth of the Company excludes any intangible assets and is adjusted to exclude the impact of any dividends declared or paid during the 2013 performance period. During the three and nine months ended September 30, 2015, compensation expense was recognized based on the Company’s assessment that the awards would vest at a 100% rate.
The following table presents the unrecognized compensation related to unvested options to purchase stock, restricted shares of common stock, and RSUs and the weighted average vesting period in which the expense will be recognized:
|
|
|
As of September 30, 2015 |
|
|||||||||||||
|
|
|
Stock Options |
|
|
Restricted Shares |
|
|
RSUs |
|
|
Performance Condition RSUs (1) |
|
||||
|
Unrecognized compensation |
|
$ |
— |
|
|
$ |
272 |
|
|
$ |
3,893 |
|
|
$ |
3,109 |
|
|
Unvested awards |
|
|
— |
|
|
|
17,184 |
|
|
|
1,092,300 |
|
|
|
490,129 |
|
|
Weighted average vesting period |
|
|
— |
|
|
0.71 years |
|
|
0.52 years |
|
|
1.23 years |
|
|||
|
(1) |
The unvested Performance Condition RSUs and unrecognized compensation amounts specified are based on the Company’s assessment of the rate at which the performance conditions will be met and the related percentage of awards that will vest. The total unvested awards that include a performance condition and related unrecognized compensation are 882,663 and $12,471, respectively. This total compensation would only be recognized if all of the applicable awards with performance conditions vested at a 100% rate. |
In addition, as part of the Company’s satisfaction of incentive compensation earned for past service under the Company’s variable compensation programs, employees may receive RSUs in lieu of cash payments. These RSUs are issued to an irrevocable trust for the benefit of the employees and are not returnable to the Company. In settlement of such accrued incentive compensation, for the nine months ended September 30, 2015, the Company granted 26,549 such RSUs with an aggregate fair value upon grant date of $630. For the nine months ended September 30, 2014, the Company granted 294,843 comparable RSUs with an aggregate fair value upon grant date of $7,317.
23
The Company considers its capital markets and principal investing operations to be separate reportable segments. The capital markets segment includes the Company’s investment banking and institutional sales, trading and research operations. These businesses operate as a single integrated unit to deliver capital raising, advisory and sales and trading services to corporate and institutional clients. Principal investing includes investments in investment funds, merchant banking and other equity investments, and corporate debt investments.
The Company has developed systems and methodologies to allocate overhead costs to its business units and, accordingly, presents segment information consistent with internal management reporting. Revenue generating transactions between the individual segments are included in the net revenue and pre-tax income of each segment.
The following tables illustrate the financial information for the Company’s segments for the periods indicated:
|
|
Three Months Ended |
|
|||||||||||||||||||||
|
|
September 30, 2015 |
|
|
September 30, 2014 |
|
||||||||||||||||||
|
|
Capital Markets |
|
|
Principal Investing |
|
|
Total |
|
|
Capital Markets |
|
|
Principal Investing |
|
|
Total |
|
||||||
|
Revenues, net of interest expense: |
|
|
|
|
|
|
|
|
|
|
|
|
|
|
|
|
|
|
|
|
|
|
|
|
Investment banking |
$ |
14,776 |
|
|
$ |
— |
|
|
$ |
14,776 |
|
|
$ |
29,289 |
|
|
$ |
— |
|
|
$ |
29,289 |
|
|
Institutional brokerage |
|
11,176 |
|
|
|
— |
|
|
|
11,176 |
|
|
|
11,946 |
|
|
|
— |
|
|
|
11,946 |
|
|
Net investment income |
|
— |
|
|
|
777 |
|
|
|
777 |
|
|
|
— |
|
|
|
3,075 |
|
|
|
3,075 |
|
|
Interest |
|
8,391 |
|
|
|
3 |
|
|
|
8,394 |
|
|
|
4,857 |
|
|
|
4 |
|
|
|
4,861 |
|
|
Dividends and other |
|
40 |
|
|
|
128 |
|
|
|
168 |
|
|
|
131 |
|
|
|
95 |
|
|
|
226 |
|
|
Total revenues |
|
34,383 |
|
|
|
908 |
|
|
|
35,291 |
|
|
|
46,223 |
|
|
|
3,174 |
|
|
|
49,397 |
|
|
Interest expense |
|
6,255 |
|
|
|
3,456 |
|
|
|
9,711 |
|
|
|
3,632 |
|
|
|
3,668 |
|
|
|
7,300 |
|
|
Revenues, net of interest expense |
|
28,128 |
|
|
|
(2,548 |
) |
|
|
25,580 |
|
|
|
42,591 |
|
|
|
(494 |
) |
|
|
42,097 |
|
|
Operating expenses: |
|
|
|
|
|
|
|
|
|
|
|
|
|
|
|
|
|
|
|
|
|
|
|
|
Variable |
|
5,680 |
|
|
|
32 |
|
|
|
5,712 |
|
|
|
13,627 |
|
|
|
(413 |
) |
|
|
13,214 |
|
|
Fixed |
|
25,636 |
|
|
|
541 |
|
|
|
26,177 |
|
|
|
25,043 |
|
|
|
532 |
|
|
|
25,575 |
|
|
Total |
|
31,316 |
|
|
|
573 |
|
|
|
31,889 |
|
|
|
38,670 |
|
|
|
119 |
|
|
|
38,789 |
|
|
Pre-tax income (loss) |
$ |
(3,188 |
) |
|
$ |
(3,121 |
) |
|
$ |
(6,309 |
) |
|
$ |
3,921 |
|
|
$ |
(613 |
) |
|
$ |
3,308 |
|
|
Compensation and benefits: |
|
|
|
|
|
|
|
|
|
|
|
|
|
|
|
|
|
|
|
|
|
|
|
|
Variable |
$ |
1,978 |
|
|
$ |
— |
|
|
$ |
1,978 |
|
|
$ |
8,617 |
|
|
$ |
(416 |
) |
|
$ |
8,201 |
|
|
Fixed |
|
15,194 |
|
|
|
432 |
|
|
|
15,626 |
|
|
|
15,192 |
|
|
|
378 |
|
|
|
15,570 |
|
|
Total |
$ |
17,172 |
|
|
$ |
432 |
|
|
$ |
17,604 |
|
|
$ |
23,809 |
|
|
$ |
(38 |
) |
|
$ |
23,771 |
|
|
Total assets |
$ |
905,600 |
|
|
$ |
200,321 |
|
|
$ |
1,105,921 |
|
|
$ |
830,096 |
|
|
$ |
426,310 |
|
|
$ |
1,256,406 |
|
24
|
Nine Months Ended |
|
||||||||||||||||||||||
|
|
September 30, 2015 |
|
|
September 30, 2014 |
|
||||||||||||||||||
|
|
Capital Markets |
|
|
Principal Investing |
|
|
Total |
|
|
Capital Markets |
|
|
Principal Investing |
|
|
Total |
|
||||||
|
Revenues, net of interest expense: |
|
|
|
|
|
|
|
|
|
|
|
|
|
|
|
|
|
|
|
|
|
|
|
|
Investment banking |
$ |
57,179 |
|
|
$ |
— |
|
|
$ |
57,179 |
|
|
$ |
101,712 |
|
|
$ |
— |
|
|
$ |
101,712 |
|
|
Institutional brokerage |
|
35,860 |
|
|
|
— |
|
|
|
35,860 |
|
|
|
41,680 |
|
|
|
— |
|
|
|
41,680 |
|
|
Net investment income |
|
— |
|
|
|
7,806 |
|
|
|
7,806 |
|
|
|
— |
|
|
|
16,000 |
|
|
|
16,000 |
|
|
Interest |
|
23,382 |
|
|
|
5 |
|
|
|
23,387 |
|
|
|
5,293 |
|
|
|
122 |
|
|
|
5,415 |
|
|
Dividends and other |
|
251 |
|
|
|
380 |
|
|
|
631 |
|
|
|
428 |
|
|
|
378 |
|
|
|
806 |
|
|
Total revenues |
|
116,672 |
|
|
|
8,191 |
|
|
|
124,863 |
|
|
|
149,113 |
|
|
|
16,500 |
|
|
|
165,613 |
|
|
Interest expense |
|
17,567 |
|
|
|
10,365 |
|
|
|
27,932 |
|
|
|
3,632 |
|
|
|
8,428 |
|
|
|
12,060 |
|
|
Revenues, net of interest expense |
|
99,105 |
|
|
|
(2,174 |
) |
|
|
96,931 |
|
|
|
145,481 |
|
|
|
8,072 |
|
|
|
153,553 |
|
|
Operating expenses: |
|
|
|
|
|
|
|
|
|
|
|
|
|
|
|
|
|
|
|
|
|
|
|
|
Variable |
|
28,183 |
|
|
|
37 |
|
|
|
28,220 |
|
|
|
54,311 |
|
|
|
945 |
|
|
|
55,256 |
|
|
Fixed |
|
72,704 |
|
|
|
1,761 |
|
|
|
74,465 |
|
|
|
75,044 |
|
|
|
1,955 |
|
|
|
76,999 |
|
|
Total |
|
100,887 |
|
|
|
1,798 |
|
|
|
102,685 |
|
|
|
129,355 |
|
|
|
2,900 |
|
|
|
132,255 |
|
|
Pre-tax income (loss) |
$ |
(1,782 |
) |
|
$ |
(3,972 |
) |
|
$ |
(5,754 |
) |
|
$ |
16,126 |
|
|
$ |
5,172 |
|
|
$ |
21,298 |
|
|
Compensation and benefits: |
|
|
|
|
|
|
|
|
|
|
|
|
|
|
|
|
|
|
|
|
|
|
|
|
Variable |
$ |
15,588 |
|
|
$ |
— |
|
|
$ |
15,588 |
|
|
$ |
40,738 |
|
|
$ |
936 |
|
|
$ |
41,674 |
|
|
Fixed |
|
43,087 |
|
|
|
1,160 |
|
|
|
44,247 |
|
|
|
44,380 |
|
|
|
1,087 |
|
|
|
45,467 |
|
|
Total |
$ |
58,675 |
|
|
$ |
1,160 |
|
|
$ |
59,835 |
|
|
$ |
85,118 |
|
|
$ |
2,023 |
|
|
$ |
87,141 |
|
|
Total assets |
$ |
905,600 |
|
|
$ |
200,321 |
|
|
$ |
1,105,921 |
|
|
$ |
830,096 |
|
|
$ |
426,310 |
|
|
$ |
1,256,406 |
|
11. Recent Accounting Pronouncements:
In May 2014, the FASB issued ASU 2014-09, “Revenue from Contracts with Customers” (“ASU 2014-09”), which supersedes nearly all existing revenue recognition guidance under U.S. GAAP. The core principle of ASU 2014-09 is to recognize revenues when promised goods or services are transferred to customers in an amount that reflects the consideration to which an entity expects to be entitled for those goods or services. ASU 2014-09 defines a five step process to achieve this core principle and, in doing so, more judgment and estimates may be required within the revenue recognition process than are required under existing U.S. GAAP. The standard is effective for annual periods beginning after December 15, 2017, and interim periods therein, using either of the following transition methods: (i) a full retrospective approach reflecting the application of the standard in each prior reporting period with the option to elect certain practical expedients, or (ii) a retrospective approach with the cumulative effect of initially adopting ASU 2014-09 recognized at the date of adoption (which includes additional footnote disclosures). The Company is currently evaluating the impact of its pending adoption of ASU 2014-09 on its consolidated financial statements and has not yet determined the method by which it will adopt the standard in 2018.
In August 2014, the FASB issued ASU 2014-15, “Presentation of Financial Statements – Going Concern (Subtopic 205-40): Disclosure of Uncertainties about an Entity’s Ability to Continue as a Going Concern,” (“ASU 2014-15”). ASU 2014-15 introduces an explicit requirement for management to assess and provide certain disclosures if there is substantial doubt about an entity’s ability to continue as a going concern. ASU 2014-15 is effective for the annual period ending after December 15, 2016. The Company does not anticipate that the adoption of ASU 2014-15 will have a material impact on its consolidated financial statements or disclosures.
25
In January 2015, the FASB issued ASU 2015-01, “Income Statement – Extraordinary and Unusual items (Subtopic 225-20): Simplifying Income Statement Presentation by Eliminating the Concept of Extraordinary Items,” (“ASU 2015-01”). The main objective of ASU 2015-01 is to eliminate from U.S. GAAP the concept of extraordinary items; however, the requirement to disclose unusual and infrequent items still exists. Under this guidance, an entity will no longer segregate extraordinary items from the results of ordinary operations; separately present an extraordinary item on its income statement, net of tax, after income from continuing operations; or disclose income taxes and earnings-per-share data applicable to an extraordinary item. The ASU affects the reporting and disclosure requirements for an event that is unusual in nature or that occurs infrequently. ASU 2015-01 is effective for annual periods and interim reporting periods within those annual periods beginning after December 15, 2015. Early adoption is permitted if guidance is applied as of the beginning of the annual period of adoption. The Company does not anticipate that the adoption of ASU 2015-01 will have a material impact on its consolidated financial statements or disclosures.
In April 2015, the FASB issued ASU 2015-05, “Intangibles – Goodwill and Other Internal-Use Software (Subtopic 350-40): Customer’s Accounting for Fees Paid in a Cloud Computing Arrangement,” (“ASU 2015-05”). This ASU provides guidance to customers about whether a cloud computing arrangement includes a software license. If a cloud computing arrangement includes a software license, the customer should account for the software license element of the arrangement consistent with the acquisition of other software licenses. If a cloud computing arrangement does not include a software license, the customer should account for the arrangement as a service contract. The new guidance does not change the accounting for a customer’s accounting for service contracts. ASU 2015-05 is effective for interim and annual reporting periods beginning after December 15, 2015. The Company does not anticipate that the adoption of ASU 2015-05 will have a material impact on its consolidated financial statements.
In May 2015, the FASB issued ASU 2015-07, “Fair Value Measurement (Topic 820): Disclosures for Investments in Certain Entities That Calculate Net Asset Value per Share (or Its Equivalent),” (“ASU 2015-07”). This ASU provides guidance for eliminating the requirement to categorize within the fair value hierarchy all investments for which fair value is measured using the NAV per share as a practical expedient for fair value. Removing investments measured using the practical expedient from the fair value hierarchy is intended to eliminate the diversity in practice that currently exists with respect to the categorization of these investments. Although classification within the fair value hierarchy is no longer required, an entity must disclose the amount of investments measured using the NAV in order to permit reconciliation of the fair value of investments in the hierarchy to the corresponding line items in the balance sheet. ASU 2015-07 is effective for interim and annual reporting periods beginning after December 15, 2015. The Company does not anticipate that the adoption of ASU 2015-07 will have a material impact on its consolidated financial statements or disclosures.
12. Subsequent Events:
Share Repurchase Program
On October 19, 2015, the Company’s Board of Directors approved an increase in the Company’s repurchase authorization to an aggregate of 1,000,000 shares.
Dividend Declaration
On October 19, 2015, the Company’s Board of Directors declared a quarterly cash dividend of $0.20 per common share to be paid on November 27, 2015 to shareholders of record as of the close of business on November 2, 2015.
26
Item 2.Management’s Discussion and Analysis of Financial Condition and Results of Operations
The following discussion and analysis of the consolidated financial condition and results of operations of FBR & Co. and its subsidiaries (collectively, “we”, “us”, “our” or the “Company”) should be read in conjunction with the unaudited consolidated financial statements and the notes thereto appearing elsewhere in this report on Form 10-Q and the audited consolidated financial statements and notes thereto appearing in the Company’s Annual Report on Form 10-K for the fiscal year ended December 31, 2014.
The discussion of the Company’s consolidated financial condition and results of operations below may contain forward-looking statements. These statements, which reflect management’s beliefs and expectations, are subject to risks and uncertainties that may cause actual results to differ materially. For a discussion of the risks and uncertainties that may affect the Company’s future results, please see “Forward-Looking Statements” immediately preceding Part I of, and other items throughout, the Company’s Annual Report on Form 10-K for the fiscal year ended December 31, 2014. Please also see “Risk Factors” in Part I, Item 1A of the Company’s Annual Report on Form 10-K for the fiscal year ended December 31, 2014.
Business Environment
After reaching new highs in the second quarter of 2015, U.S. equity markets declined more than 6% in the third quarter. A slowing Chinese economy along with uncertainty regarding U.S. interest rates contributed to both the market decline and increased volatility in the period. During the first nine months of 2015 there were 126 IPOs completed in the U.S. raising over $26.7 billion compared to 175 IPOs for $41.7 billion in the first nine months of 2014, a decrease of 28% by number and 36% by dollar volume. Total domestic equity issuance was $167.6 billion in the first nine months of 2015, compared to $160.6 billion in the first nine months of last year.
Competition in our business remains intense. Large banks continue to tie lending activity to capital markets mandates and electronic or high-frequency trading continues to capture a significant share of trading volume. Both of these dynamics put pressure on high-touch, idea-driven firms like FBR. Institutional investors continue to narrow the list of broker-dealers with whom they maintain trading relationships, leading to consolidation of smaller firms and to the need for mid-size firms to work intensely to demonstrate relevance through quality and scale of research offerings in order to grow relationships.
New issue activity has been narrow with healthcare and technology making up a high percentage of IPO deal volume in the first nine months of 2015. While the Federal Reserve has ended its bond purchase programs, the market continues to benefit from historically low interest rates. We have observed a cautious stance from equity investors as a result of higher volatility, elevated market multiples, revenue headwinds from the impact of the increasing value of the dollar, and concerns around the anticipated impact of the Fed beginning a tightening cycle.
Executive Summary
For the third quarter of 2015 our revenues, net of interest expense, were $25.6 million, our pre-tax loss was $6.3 million and our net loss was $3.4 million. This compares to third quarter 2014 revenues, net of interest expense, of $42.1 million, pre-tax income of $3.3 million, and net income of $3.5 million.
The difference in our third quarter 2015 operating results, compared to third quarter 2014, was primarily due to a $16.5 million reduction in revenues, net of interest expense. As a result of diminished market activity and our completion of fewer investment banking transactions, our third quarter 2015 investment banking revenue decreased $14.5 million to $14.8 million from $29.3 million in 2014. Additionally, our net revenues from principal investing in the third quarter of 2015 decreased $2.0 million to a net loss of $2.5 million from a net loss of $0.5 million in 2014. Our third quarter 2015 institutional brokerage and securities lending revenues increased slightly to $13.2 million from $13.1 million in 2014. The impact of these lower revenues in the third quarter of 2015 was partially offset by decreased expenses in 2015 compared to 2014.
27
Our total non-interest expenses in the third quarter of 2015 declined to $31.9 million, compared to $38.8 million in 2014, as a result of the reduction in revenues mentioned above which generated lower compensation expense. Within our total expenses, non-compensation fixed expenses, including $0.7 million of non-recurring expenses related to our acquisition of MLV & Co. LLC (“MLV”) (see discussion below), were $10.6 million in the third quarter of 2015 compared to $10.0 million in 2014. As a result of reduced revenues in 2015, our compensation and benefits expense as a percentage of net revenues was 69% in the third quarter of 2015 compared to 56% in the third quarter of 2014.
On September 1, 2015, we completed the purchase of MLV, an investment banking and brokerage firm focused on equity capital markets and a leading provider of At-the-Market (“ATM”) offerings. As a result of this acquisition, we added approximately 20 client-facing employees, primarily in investment banking and research. Pursuant to the terms of the transaction agreement related to this acquisition, we made a cash payment of $3.25 million to acquire 100% of the stock of MLV. While we are in the process of completing our intangible asset appraisals related to this acquisition, based on our preliminary estimates of the fair value of the assets acquired and liabilities assumed, $1.2 million of the purchase price has been allocated to goodwill and intangible assets as of September 30, 2015.
For the nine months ended September 30, 2015, our revenues, net of interest expense, were $96.9 million, our pre-tax loss was $5.8 million and our net loss was $3.1 million, compared to revenue, net of interest expense, of $153.6 million, pre-tax income of $21.3 million, and net income of $16.1 million for the nine months ended September 30, 2014.
The difference in our results for the nine months ended September 30, 2015, compared to the nine months ended September 30, 2014, was primarily due to a $56.6 million reduction in revenues, net of interest expense. In particular, as a result of diminished market activity, specifically IPOs and 144A equity private placements in our areas of historic strength, during the nine months ended September 30, 2015 investment banking revenue decreased $44.5 million to $57.2 million, from $101.7 million in 2014. Additionally, during the first nine months of 2015, due to reduced returns from our investment fund positions, as well as a reduction in gains from equity security investments, our net revenues from principal investing decreased $10.3 million to a net loss $2.2 million, from $8.1 million of net revenues in 2014. Our institutional brokerage and securities lending revenues during the nine months ended September 30, 2015 decreased slightly to $41.2 million, from $42.9 million in 2014. The impact of these lower revenues in the first nine months of 2015 was partially offset by decreased expenses in 2015 compared to 2014.
Our total non-interest expenses during the first nine months of 2015 declined to $102.7 million, compared to $132.3 million in 2014, as a result of the reduction in revenues mentioned above which generated lower compensation expense. Within our total expenses, non-compensation fixed expenses were $30.2 million during the first nine months of 2015, compared to $31.5 million in 2014. In addition, as a result of lower revenue in the first nine months of 2015, our compensation and benefits expense as a percentage of net revenues was 62%, compared to 57% in the first nine months of 2014.
The following is an analysis of our operating results by segment for the three and nine months ended September 30, 2015 and 2014:
Capital Markets
Our capital markets segment includes investment banking and institutional sales, trading and research. These business units operate as a single integrated segment to deliver capital raising, advisory and sales and trading services to corporate and institutional clients. Our investment banking and institutional brokerage businesses are focused on the consumer, energy and natural resources, financial institutions, healthcare, industrials, insurance, real estate and TMT sectors. Additionally, beginning in August 2014, we provide securities lending services to a broad group of banks and broker-dealers. These services include facilitating the sourcing, borrowing and lending of equity and fixed income securities. By their nature, our capital markets business activities are highly competitive and are subject to market conditions as well as to the conditions affecting the companies and markets in our areas of focus. As a result, our capital markets revenues and profits are subject to significant volatility from period to period.
28
The following table provides a summary of results within the capital markets segment (dollars in thousands):
|
|
|
For the Three Months Ended September 30, |
|
|||||
|
|
|
2015 |
|
|
2014 |
|
||
|
Revenues, net of interest expense: |
|
|
|
|
|
|
|
|
|
Investment banking |
|
$ |
14,776 |
|
|
$ |
29,289 |
|
|
Institutional brokerage |
|
|
11,176 |
|
|
|
11,946 |
|
|
Interest |
|
|
8,391 |
|
|
|
4,857 |
|
|
Dividends and other |
|
|
40 |
|
|
|
131 |
|
|
Total revenues |
|
|
34,383 |
|
|
|
46,223 |
|
|
Interest expense |
|
|
6,255 |
|
|
|
3,632 |
|
|
Revenues, net of interest expense |
|
|
28,128 |
|
|
|
42,591 |
|
|
Operating expenses: |
|
|
|
|
|
|
|
|
|
Variable |
|
|
5,680 |
|
|
|
13,627 |
|
|
Fixed |
|
|
25,636 |
|
|
|
25,043 |
|
|
Total(1) |
|
|
31,316 |
|
|
|
38,670 |
|
|
Pre-tax (loss) income |
|
$ |
(3,188 |
) |
|
$ |
3,921 |
|
|
(1) |
For the three months ended September 30, 2015 and 2014, total operating expenses includes the allocation of corporate overhead costs of $5,526 and $5,558, respectively. |
Our capital markets segment had a pre-tax loss of $3.2 million for the third quarter of 2015, compared to pre-tax income of $3.9 million for the third quarter of 2014. The difference in our third quarter 2015 results, compared to 2014, was primarily due to a $14.5 million reduction in investment banking revenues compared to 2014. The impact of the reduction in revenues was partially offset by a $7.9 million decrease in variable expenses in the third quarter of 2015 compared to 2014. Fixed expenses were $25.6 million in the third quarter of 2015 including $0.7 million of non-recurring costs related to the acquisition of MLV, compared to $25.0 million in 2014. As a result of the reduction in revenues during 2015, our total compensation and benefits costs as a percentage of revenues in this segment was 61% in the third quarter of 2015 compared to 56% in 2014.
Investment banking revenues decreased $14.5 million to $14.8 million during the third quarter of 2015 from $29.3 million for the third quarter of 2014. Our investment banking revenue in 2015 was generated from nine client transactions representing $1.2 billion in transaction volume including one large sole-managed institutional private placement transaction representing $9.9 million in capital raising revenue and $144.0 million in transaction volume. In comparison, our investment banking revenue in the third quarter of 2014 was generated from 13 client transactions representing $3.0 billion in transaction volume. Included in those transactions and representing $24.3 million of our capital raising revenue were two sole-managed institutional private placements.
The following table provides detail regarding the components of our institutional brokerage revenues (dollars in thousands):
|
|
|
For the Three Months Ended September 30, |
|
|||||
|
|
|
2015 |
|
|
2014 |
|
||
|
Agency commissions |
|
$ |
6,361 |
|
|
$ |
6,918 |
|
|
Principal transactions |
|
|
4,280 |
|
|
|
4,214 |
|
|
Commissions for equity research |
|
|
535 |
|
|
|
814 |
|
|
Total |
|
$ |
11,176 |
|
|
$ |
11,946 |
|
Our institutional brokerage revenues decreased $0.7 million to $11.2 million for the third quarter of 2015 from $11.9 million for the third quarter of 2014. The decrease in revenue in 2015 reflects reduced revenues from each of our convertibles, credit and equity trading desks during the period. These decreases were primarily due to market conditions during 2015, including reductions in our trading volumes.
As a result of our August 2014 acquisition of a securities lending business, we have an active securities borrowed and loaned business in which we borrow securities from one party and lend them to another. Securities borrowed and securities loaned are recorded based upon the amount of cash advanced or received. Securities
29
borrowed transactions facilitate the settlement process and require us to deposit cash or other collateral with the lender. With respect to securities loaned, we receive collateral in the form of cash. The amount of collateral required to be deposited for securities borrowed, or received for securities loaned, is an amount generally in excess of the market value of the applicable securities borrowed or loaned. We monitor the market value of the securities borrowed and loaned on a daily basis, with additional collateral obtained, or excess collateral recalled, when deemed appropriate. In addition to the institutional brokerage revenues noted above, during the third quarter of 2015, we generated net revenue of $2.0 million from securities lending, compared to $1.1 million in the third quarter of 2014.
The following table provides a summary of our results within the capital markets segment (dollars in thousands):
|
|
|
For the Nine Months Ended September 30, |
|
|||||
|
|
|
2015 |
|
|
2014 |
|
||
|
Revenues, net of interest expense: |
|
|
|
|
|
|
|
|
|
Investment banking |
|
$ |
57,179 |
|
|
$ |
101,712 |
|
|
Institutional brokerage |
|
|
35,860 |
|
|
|
41,680 |
|
|
Interest |
|
|
23,382 |
|
|
|
5,293 |
|
|
Dividends and other |
|
|
251 |
|
|
|
428 |
|
|
Total revenues |
|
|
116,672 |
|
|
|
149,113 |
|
|
Interest expense |
|
|
17,567 |
|
|
|
3,632 |
|
|
Revenues, net of interest expense |
|
|
99,105 |
|
|
|
145,481 |
|
|
Operating expenses: |
|
|
|
|
|
|
|
|
|
Variable |
|
|
28,183 |
|
|
|
54,311 |
|
|
Fixed |
|
|
72,704 |
|
|
|
75,044 |
|
|
Total(1) |
|
|
100,887 |
|
|
|
129,355 |
|
|
Pre-tax (loss) income |
|
$ |
(1,782 |
) |
|
$ |
16,126 |
|
|
(1) |
For the nine months ended September 30, 2015 and 2014, total operating expenses includes the allocation of corporate overhead costs of $15,269 and $17,097, respectively. |
Our capital markets segment had a pre-tax loss of $1.8 million for the nine months ended September 30, 2015, compared to pre-tax income of $16.1 million for the nine months ended September 30, 2014. The difference in our results for the first nine months of 2015 compared to the first nine months of 2014, was primarily due to a $44.5 million reduction in investment banking revenues. The impact of lower revenues was partially offset by a $26.1 million decrease in variable expenses and a $2.3 million decrease in fixed expenses. Specifically, variable expenses decreased to $28.2 million in 2015, from $54.3 million in 2014, as a result of the decrease in revenues which generated lower compensation expense. The decrease in fixed expenses reflects a reduction in stock compensation as well as cost reductions in professional services, business development and communications expenses. Our total compensation and benefits costs as a percentage of revenues in this segment was 59% in both 2015 and 2014.
Investment banking revenues decreased $44.5 million to $57.2 million during the first nine months of 2015, from $101.7 million during 2014. Our investment banking revenue in 2015 was generated from 35 client transactions representing $7.5 billion in transaction volume. Included in those transactions and representing $31.2 million of our capital raising revenue were two sole-managed institutional private placements. In comparison, our investment banking revenue in the first nine months of 2014 was generated from 44 client transactions representing $9.8 billion in transaction volume. Included in those transactions and representing $83.2 million of our capital raising revenue were seven sole-managed institutional private placements.
30
The following table provides detail regarding the components of our institutional brokerage revenues (dollars in thousands):
|
|
|
For the Nine Months Ended September 30, |
|
|||||
|
|
|
2015 |
|
|
2014 |
|
||
|
Agency commissions |
|
$ |
18,876 |
|
|
$ |
21,603 |
|
|
Principal transactions |
|
|
14,827 |
|
|
|
17,430 |
|
|
Commissions for equity research |
|
|
2,157 |
|
|
|
2,647 |
|
|
Total |
|
$ |
35,860 |
|
|
$ |
41,680 |
|
Our institutional brokerage revenues decreased $5.8 million to $35.9 million for the nine months ended September 30, 2015 from $41.7 million for the nine months ended September 30, 2014. The decrease in revenue in 2015 reflects reduced revenues from each of our convertibles, credit and equity trading desks during the period. These decreases were primarily due to market conditions in 2015, including reductions in our trading volumes.
As a result of our August 2014 acquisition of a securities lending business we have an active securities borrowed and loaned business in which we borrow securities from one party and lend them to another. In addition to the institutional brokerage revenues noted above, during the first nine months of 2015, we generated net revenue of $5.4 million from securities lending compared to $1.1 million in 2014.
Principal Investing
As of September 30, 2015, our principal investing activity consists of investments in non-registered investment funds, marketable equity securities, non-public equity securities and short-sales of U.S. Treasury securities. The following table provides a summary of our results within the principal investing segment (dollars in thousands):
|
|
|
For the Three Months Ended September 30, |
|
|||||
|
|
|
2015 |
|
|
2014 |
|
||
|
Revenues, net of interest expense: |
|
|
|
|
|
|
|
|
|
Net investment income |
|
$ |
777 |
|
|
$ |
3,075 |
|
|
Interest |
|
|
3 |
|
|
|
4 |
|
|
Dividends and other |
|
|
128 |
|
|
|
95 |
|
|
Total revenues |
|
|
908 |
|
|
|
3,174 |
|
|
Interest expense |
|
|
3,456 |
|
|
|
3,668 |
|
|
Revenues, net of interest expense |
|
|
(2,548 |
) |
|
|
(494 |
) |
|
Operating expenses: |
|
|
|
|
|
|
|
|
|
Variable |
|
|
32 |
|
|
|
(413 |
) |
|
Fixed |
|
|
541 |
|
|
|
532 |
|
|
Total(1) |
|
|
573 |
|
|
|
119 |
|
|
Pre-tax (loss) income |
|
$ |
(3,121 |
) |
|
$ |
(613 |
) |
|
(1) |
For the three months ended September 30, 2015 and 2014, total operating expenses includes the allocation of corporate overhead costs of $107 and $108, respectively. |
Our principal investing segment had a pre-tax loss of $3.1 million for the third quarter of 2015 compared to a pre-tax loss of $0.6 million in the third quarter of 2014. The increase in our pre-tax loss in the third quarter of 2015 was due primarily to negative returns from investment funds, as well as losses from equity and other trading securities as a result of market conditions during the period.
31
Net investment income for the third quarter of 2015 includes $3.2 million of realized and unrealized gains from short-sales of U.S. Treasury securities, partially offset by $1.5 million of net losses from investment funds, and $0.9 million of net realized and unrealized losses from equity and other trading securities held for investment purposes. Total revenues in the third quarter of 2015 were offset by $3.5 million of interest expense related to short-sales of U.S. Treasury securities. Net investment income for the third quarter of 2014 includes $3.4 million of unrealized gains from short-sales of U.S. Treasury securities, $0.2 million of net realized and unrealized losses from equity and other trading securities held for investment purposes, and $0.1 million of net losses from investment funds. Total revenues in the third quarter of 2014 were offset by $3.7 million of interest expense related to short-sales of U.S. Treasury securities.
The following table provides a summary of our results within the principal investing segment (dollars in thousands):
|
|
|
For the Nine Months Ended September 30, |
|
|||||
|
|
|
2015 |
|
|
2014 |
|
||
|
Revenues, net of interest expense: |
|
|
|
|
|
|
|
|
|
Net investment income |
|
$ |
7,806 |
|
|
$ |
16,000 |
|
|
Interest |
|
|
5 |
|
|
|
122 |
|
|
Dividends and other |
|
|
380 |
|
|
|
378 |
|
|
Total revenues |
|
|
8,191 |
|
|
|
16,500 |
|
|
Interest expense |
|
|
10,365 |
|
|
|
8,428 |
|
|
Revenues, net of interest expense |
|
|
(2,174 |
) |
|
|
8,072 |
|
|
Operating expenses: |
|
|
|
|
|
|
|
|
|
Variable |
|
|
37 |
|
|
|
945 |
|
|
Fixed |
|
|
1,761 |
|
|
|
1,955 |
|
|
Total(1) |
|
|
1,798 |
|
|
|
2,900 |
|
|
Pre-tax (loss) income |
|
$ |
(3,972 |
) |
|
$ |
5,172 |
|
|
|
(1) |
For the nine months ended September 30, 2015 and 2014, total operating expenses includes the allocation of corporate overhead costs of $296 and $331, respectively. |
Our principal investing segment had a pre-tax loss of $4.0 million for the nine months ended September 30, 2015, compared to pre-tax income of $5.2 million in the nine months ended September 30, 2014. While the size of our overall investment portfolio was comparable in 2015 and 2014, the difference in our results in 2015, compared to 2014, was due to the negative returns from investment funds, as well as net losses from equity and other trading securities in 2015. For the nine months ended September 30, 2015, we recognized net losses of $0.8 million from investment funds and $0.6 million from equity and other trading securities compared to $3.7 million of income from investment funds and $4.9 million of income from equity and other trading securities during the comparable 2014 period.
Net investment income for the nine months ended September 30, 2015 includes $9.2 million of realized and unrealized gains from short-sales of U.S. Treasury securities, $0.8 million of net unrealized losses from investment funds, and $0.6 million of net realized and unrealized losses from equity and other trading securities held for investment purposes. Total revenues for the nine months ended September 30, 2015 were offset by $10.4 million of interest expense related to short-sales of U.S. Treasury securities. Net investment income for the nine months ended September 30, 2014 includes $7.4 million of unrealized gains from short-sales of U.S. Treasury securities, $3.7 million of net gains from investment funds and $4.9 million of net realized and unrealized gains from equity and other trading securities held for investment purposes. Total revenues for the nine months ended September 30, 2014 were partially offset by $8.4 million of interest expense related to short-sales of U.S. Treasury securities.
32
The total value of our principal investments was $111.0 million as of September 30, 2015. Of this total, $88.6 million were held in non-registered investment funds that primarily invest in fixed income securities, $15.4 million were held in marketable and non-public equity securities and warrants, at fair value, and $7.0 million were held in non-public investments recorded at cost. The following table provides additional detail regarding our principal investments as of September 30, 2015 (dollars in thousands):
|
|
|
Carrying Value/ Fair Value |
|
|
|
Investments, at fair value: |
|
|
|
|
|
Fixed income/credit-related hedge funds |
|
$ |
47,862 |
|
|
Multi-strategy hedge funds |
|
|
30,622 |
|
|
Private equity funds |
|
|
10,157 |
|
|
Total investment funds, at fair value |
|
|
88,641 |
|
|
Marketable and non-public equity securities and warrants, at fair value |
|
|
15,369 |
|
|
Total investments, at fair value |
|
|
104,010 |
|
|
Investments, at cost |
|
|
7,000 |
|
|
Total investments |
|
$ |
111,010 |
|
As of September 30, 2015, the $88.6 million of investment funds reflected investments in 18 non-registered investment funds that are valued at net asset value (“NAV”) as determined by the fund administrators. The Company classifies these investments within Level 2 or Level 3 of the fair value hierarchy depending on the redemption provisions of our investment. The underlying securities held by these investment companies are primarily corporate and asset-backed fixed income securities and restrictions exist on the redemption of amounts invested by the Company. As a practical expedient, the Company relies on the NAV of these investments as their fair value. The NAVs that have been provided by fund administrators are derived from the fair values of the underlying investments as of the reporting date. Considering the general lack of transparency necessary to conduct an independent assessment of the fair value of the securities underlying each of the NAVs provided by the fund administrators, our quarterly reporting process includes a number of assessment processes to assist the Company in the evaluation of the information provided by fund managers and fund administrators. These assessment processes include, but are not limited to regular review and discussion of each fund’s performance with its manager and regular evaluation of performance against applicable benchmarks.
In addition to these assets, during the first nine months of 2015, as part of the Company’s investing activities, the Company entered into two short sales totaling $200 million face value, of 4.625% U.S. Treasury securities maturing in November 2016. These two short sales were closed out during the third quarter of 2015. A short sale of a $75 million face value, 7.25% U.S. Treasury security, is included in securities sold but not yet purchased on the Company’s consolidated balance sheets as of September 30, 2015 and matures in May 2016. Proceeds from this short-sale, as well as related margin requirements, are held in a collateral account and are included in due from brokers, dealers and clearing organizations on the Company’s consolidated balance sheets at September 30, 2015. The Company is obligated to fund the fixed-rate coupon interest on this security while the short-position is outstanding.
Results of Operations
Three months ended September 30, 2015 compared to three months ended September 30, 2014
During the third quarter of 2015, our net loss was $3.4 million, compared to net income of $3.5 million in the third quarter of 2014. The difference in our third quarter 2015 results, compared to third quarter 2014, was primarily due to both a $14.5 million decrease in net revenues from capital markets and a $2.0 million decrease in net revenues from principal investing. The impact of these lower revenues in the third quarter of 2015 was partially offset by decreased expenses in 2015, compared to 2014. Our net loss for the third quarter of 2015 includes a $2.9 million tax benefit, compared to a $0.2 million tax benefit in the third quarter of 2014.
33
Our capital markets segment had a pre-tax loss of $3.2 million during the third quarter of 2015 compared to pre-tax income of $3.9 million during the third quarter of 2014. The difference in our third quarter 2015 capital markets results compared to 2014 was primarily due to a $14.5 million decrease in investment banking revenue in the third quarter of 2015 compared to 2014. As a result of negative returns from investment funds and losses from equity and other trading securities, our principal investing segment had a pre-tax loss of $3.1 million in the third quarter of 2015 compared to a pre-tax loss of $0.6 million in 2014.
Revenues, net of Interest Expense
Our revenues, net of interest expense, decreased 39.2% to $25.6 million during the third quarter of 2015 from $42.1 million during the third quarter of 2014 due to the changes in revenues and interest expense discussed below.
Capital raising revenues decreased 46.1% to $14.6 million in the third quarter of 2015 from $27.1 million in the third quarter of 2014. In the third quarter of 2015, we completed nine client transactions, including one sole-managed institutional private placement that generated $9.9 million of revenue in the period. In the third quarter of 2014, we completed 10 client transactions, including two sole-managed private placements that generated $24.3 million of revenue in the period.
Advisory revenues decreased to $0.2 million in the third quarter of 2015 from $2.2 million in the third quarter of 2014. We did not complete any significant M&A or advisory assignments in the third quarter of 2015, in comparison, we completed three M&A and advisory assignments in the third quarter of 2014.
Institutional brokerage revenues decreased 5.9% to $11.2 million in the third quarter of 2015 from $11.9 million in the third quarter of 2014. The decrease in revenue in 2015 reflects reduced revenues from each of our convertibles, credit and equity trading desks during the period. These decreases were primarily due to market conditions in 2015, including reductions in our trading volumes.
Net investment income decreased 74.2% to $0.8 million in the third quarter of 2015 compared to $3.1 million in the third quarter of 2014 as a result of negative returns from investment funds and net losses from equity and other trading securities. Net investment income for the third quarter of 2015 includes $3.2 million of realized and unrealized gains from short-sales of U.S. Treasury securities, partially offset by $1.5 million of net losses from investment funds, and $0.9 million of net realized and unrealized losses from equity and other trading securities held for investment purposes. These 2015 revenues were offset by $3.5 million of interest expense related to short-sales of U.S. Treasury securities. Net investment income for the third quarter of 2014 includes $3.4 million of unrealized gains from short-sales of U.S. Treasury securities, $0.2 million of net realized and unrealized losses from equity and other trading securities held for investment purposes, and $0.1 million of net losses from investment funds. These 2014 revenues were offset by $3.7 million of interest expense related to short-sales of U.S. Treasury securities.
Interest income increased to $8.4 million in the third quarter of 2015 from $4.9 million in the third quarter of 2014. The increase in interest income is due to our purchase of a securities lending business in August 2014. Subsequent to this acquisition, we have had an active securities borrowed and loaned business in which we borrow securities from one party and lend them to another. The increase in interest income in 2015 was due to our maintaining higher average balances in the third quarter of 2015 compared to 2014, due in part to the timing our securities lending acquisition in August 2014.
Dividends and other revenues totaled $0.2 million in the third quarter of both 2015 and 2014. These revenues primarily include dividends generated from our investing activities.
During the third quarter of 2015, we incurred total interest expense of $9.7 million, including $6.2 million related to securities lending and $3.5 million related to short-sales of U.S. Treasury securities. During the third quarter of 2014, we incurred $7.3 million of interest expense, including $3.7 million related to short-sales of U.S. Treasury securities and $3.6 million related to securities lending. The increase in interest expense related to securities lending in the third quarter of 2015 was the result of maintaining higher average balances in 2015 compared to 2014, due in part to the timing of our securities lending acquisition in August 2014.
Non-Interest Expenses
Total non-interest expenses decreased 17.8% to $31.9 million in the third quarter of 2015 from $38.8 million in the third quarter of 2014. The decrease was caused by the changes in non-interest expenses discussed below.
34
Compensation and benefits expenses decreased 26.1% to $17.6 million in the third quarter of 2015 from $23.8 million in the third quarter of 2014 primarily as a result of a $6.2 million decrease in variable compensation. The reduction in variable compensation was due to the $16.5 million reduction in revenues, net of interest expense, in 2015 compared to the prior year. As a result of the reduction in revenues during 2015, our compensation and benefits expense as a percentage of net revenues was 69% in the third quarter of 2015 compared to 56% in the third quarter of 2014.
Professional services expenses decreased 24.3% to $2.8 million in the third quarter of 2015 from $3.7 million in the third quarter of 2014. This decrease was primarily due to a $1.5 million decrease in costs related to investment banking transactions as well as reductions in fixed professional services costs, partially offset by $0.7 million of non-recurring costs related to our acquisition of MLV.
Business development expenses decreased 17.9% to $2.3 million in the third quarter of 2015 from $2.8 million in the third quarter of 2014. This decrease was primarily due to a decrease in travel costs related to business promotion and investment banking transactions.
Clearing and brokerage fees increased 16.7% to $1.4 million in the third quarter of 2015 from $1.2 million in the third quarter of 2014. Our third quarter 2015 clearing and brokerage fees reflect increased costs related to securities lending offset by a reduction in costs related to equity trading.
Occupancy and equipment expenses increased 3.2% to $3.2 million in the third quarter of 2015 from $3.1 million in the third quarter of 2014. The small increase in occupancy costs was primarily the result of increases in software maintenance and license expenses and depreciation of leasehold improvements and office equipment. These increases were offset partially by reductions in rent and operating expenses related to our new corporate headquarters in Arlington, Virginia that we began occupying in the fourth quarter of 2014.
Communications expenses decreased 13.8% to $2.5 million in the third quarter of 2015 from $2.9 million in the third quarter of 2014. The decrease in these expenses was primarily due to decreased costs related to data network and connectivity costs.
Other operating expenses increased 33.3% to $2.0 million in the third quarter of 2015 from $1.5 million in the third quarter of 2014. The increase in these expenses was primarily due to the recognition of $0.5 million of bad debt expenses in the third quarter of 2015; there were no comparable expenses recognized in 2014.
We recognized a tax benefit of $2.9 million in the third quarter of 2015, compared to a $0.2 million tax benefit in the third quarter of 2014. Our quarterly tax provision is determined pursuant to ASC 740, which for the third quarter of 2015 is based on the actual year-to-date effective rate, as this is our best estimate of our annual effective tax rate for the full year. Our third quarter 2014 tax provision was determined using an estimated annual effective rate based on forecasted taxable income for the full year. Our effective tax rates for the third quarters of 2015 and 2014 were 45.7% and (5.8)%, respectively. Our 2015 and 2014 tax rates differed from statutory tax rates primarily due to capital loss carryforwards subject to a valuation allowance that were projected to be utilized in the respective years.
At December 31, 2014, our net deferred tax assets totaled $32.2 million and were partially offset by a valuation allowance of $3.5 million. This valuation allowance related to capital loss carryforwards and was determined based on our application of the guidance in ASC 740 and our conclusion that it was more likely than not that the benefits of these assets would not be realized in the future. Based on our assessment as of September 30, 2015, we determined that it was more likely than not that the capital loss carryforwards subject to the valuation allowance would be utilized during 2015. Our projected utilization of the capital loss carryforward deferred tax asset and corresponding release of the remaining valuation allowance is reflected in the calculation of our actual year-to-date effective tax rate.
We believe there is potential for volatility in our 2015 effective tax rate from quarter-to-quarter due to the impact of any prospective changes in our forecasted earnings and capital gains for the year.
35
Nine months ended September 30, 2015 compared to nine months ended September 30, 2014
During the first nine months of 2015, our net loss was $3.1 million, compared to net income of $16.1 million in the first nine months of 2014. The difference in our results for the nine months ended September 30, 2015 compared to the nine months ended September 30, 2014 was primarily the result of both a $46.4 million decrease in net revenues from capital markets and a $10.3 million decrease in net revenues from principal investing in 2015 compared to 2014. The impact of these lower revenues in 2015 was partially offset by decreased expenses in 2015 compared to 2014. Our net loss for the first nine months of 2015 includes a $2.7 million tax benefit compared to a $5.2 million tax provision in the first nine months of 2014.
Our capital markets segment had a pre-tax loss of $1.8 million during the first nine months of 2015, compared to pre-tax income of $16.1 million during the first nine months of 2014. The difference in our 2015 capital markets results compared to 2014 was primarily due to a $44.5 million decrease in investment banking revenue during the first nine months of 2015 compared to 2014. As a result of negative returns from investment funds and losses from equity and other trading securities, our principal investing segment had a pre-tax loss of $4.0 million during the first nine months 2015 compared to pre-tax income of $5.2 million in 2014.
Revenues, net of Interest Expense
Our revenues, net of interest expense, decreased 36.9% to $96.9 million during the first nine months of 2015 from $153.6 million during the first nine months of 2014 due to the changes in revenues and interest expense discussed below.
Capital raising revenues decreased 46.0% to $51.7 million in the first nine months of 2015 from $95.8 million in the first nine months of 2014. In the first nine months of 2015, we completed 27 client transactions, including two sole-managed institutional private placements that generated $31.2 million of revenue in the period. In the first nine months of 2014, we completed 34 client transactions, including seven sole-managed institutional private placements that generated $83.2 million of revenue in the period.
Advisory revenues decreased 8.5% to $5.4 million in the first nine months of 2015 from $5.9 million in the first nine months of 2014. We completed eight M&A and advisory assignments in the first nine months of 2015 compared to 10 assignments in the first nine months of 2014.
Institutional brokerage revenues decreased 13.9% to $35.9 million in the first nine months of 2015 from $41.7 million in the first nine months of 2014. The decrease in revenue in 2015 reflects reduced revenues from each of our convertibles, credit and equity trading desks during the period. These decreases were primarily due to market conditions in 2015, including reductions in our trading volumes.
Net investment income decreased 51.3% to $7.8 million in the first nine months of 2015 compared to $16.0 million in the first nine months of 2014 as a result of negative returns from investment funds and net losses from equity and other trading. Net investment income for the first nine months of 2015 includes $9.2 million of realized and unrealized gains from short-sales of U.S. Treasury securities, partially offset by $0.8 million of net losses from investment funds, and $0.6 million of net realized and unrealized losses from equity and other trading securities held for investment purposes. These 2015 revenues were offset by $10.4 million of interest expense related to short-sales of U.S. Treasury securities. Net investment income for the first nine months of 2014 includes $7.4 million of unrealized gains from short-sales of U.S. Treasury securities, $3.7 million of net gains from investment funds, and $4.9 million of net realized and unrealized gains from equity and other trading securities held for investment purposes. These 2014 revenues were partially offset by $8.5 million of interest expense related to short-sales of U.S. Treasury securities.
Interest income increased $18.0 million to $23.4 million in the first nine months of 2015 from $5.4 million in the first nine months of 2014. The increase in interest income was due to our purchase of a securities lending business in August 2014. Subsequent to this acquisition, we have an active securities borrowed and loaned business in which we borrow securities from one party and lend them to another.
Dividends and other revenues decreased $0.2 million to $0.6 million in the first nine months of 2015 from $0.8 million in the first nine months of 2014. These revenues primarily include dividends generated from our investing activities.
36
During the first nine months of 2015, we incurred total interest expense of $27.9 million, including $17.5 million related to securities lending and $10.4 million related to short-sales of U.S. Treasury securities. During the first nine months of 2014, we incurred $12.1 million of interest expense, including $8.5 million related to short-sales of U.S. Treasury securities, and $3.6 million related to securities lending. The increase in interest expense related to securities lending in 2015 was the result of maintaining higher average balances in 2015 compared to 2014, due primarily to the timing of our securities lending acquisition in August 2014. The increase in interest expense related to short-sales of U.S. Treasury securities in the first nine months of 2015 was due to maintaining higher average balances in 2015 compared to 2014.
Non-Interest Expenses
Total non-interest expenses decreased 22.4% to $102.7 million in the first nine months of 2015 from $132.3 million in the first nine months of 2014. The decrease was caused by the changes in non-interest expenses discussed below.
Compensation and benefits expenses decreased 31.3% to $59.8 million in the first nine months of 2015 from $87.1 million in the first nine months of 2014 primarily as a result of a $26.1 million decrease in variable compensation. The reduction in variable compensation was due to the $56.6 million reduction in revenues, net of interest expense, in 2015 compared to the prior year. This decrease was also due to a $1.2 million decrease in fixed compensation in 2015 compared to 2014 reflecting reduced stock compensation and the impact of lower average headcount in 2015 compared to 2014. As a result of the reduction in revenues during 2015, our compensation and benefits expense as a percentage of net revenues was 62% in the first nine months of 2015 compared to 57% in the first nine months of 2014.
Professional services expenses decreased 12.7% to $9.6 million in the first nine months of 2015 from $11.0 million in the first nine months of 2014. This decrease was primarily due to a $1.2 million decrease in costs related to investment banking transactions as well as reductions in fixed professional services costs, partially offset by $0.7 million of non-recurring costs related to our acquisition of MLV.
Business development expenses decreased 17.1% to $6.8 million in the first nine months of 2015 from $8.2 million in the first nine months of 2014. This decrease is primarily due to a decrease in travel costs related to business promotion and investment banking transactions.
Clearing and brokerage fees increased 14.3% to $4.0 million in the first nine months of 2015 from $3.5 million in the first nine months of 2014. Our first nine months 2015 clearing and brokerage fees reflect increased costs related to securities lending offset by a reduction in costs related to equity trading.
Occupancy and equipment expenses increased 1.1% to $9.3 million in the first nine months of 2015 from $9.2 million in the first nine months of 2014. The small increase in occupancy costs was primarily the result of increases in software maintenance and license expenses and depreciation of leasehold improvements and office equipment. These increases were offset partially by reductions in rent and operating expenses related to our new corporate headquarters in Arlington, Virginia that we began occupying in the fourth quarter of 2014.
Communications expenses decreased 5.8% to $8.1 million in the first nine months of 2015 from $8.6 million in the first nine months of 2014. The decrease in these expenses was primarily due to decreased costs related to data network and connectivity costs.
Other operating expenses increased 8.9% to $4.9 million in the first nine months of 2015 from $4.5 million in the first nine months of 2014. The increase in these expenses was primarily due to the recognition of $0.5 million of bad debt expenses in 2015; there were no comparable expenses recognized in 2014.
We recognized a tax benefit of $2.7 million in the first nine months of 2015 compared to a $5.2 million tax provision in the first nine months of 2014. Our quarterly tax provision is determined pursuant to ASC 740, which for the nine months ended September 30, 2015 is based on the actual year-to-date effective rate, as this is our best estimate of our annual effective tax rate for the full year. Our 2014 tax provision was determined using an estimated annual effective rate based on forecasted taxable income for the full year. Our effective tax rates for the first nine months of 2015 and 2014 were 47.0% and 24.5%, respectively. Our 2015 and 2014 tax rates differed from statutory tax rates primarily due to capital loss carryforwards subject to a valuation allowance that were projected to be utilized in the respective years.
37
At December 31, 2014, our net deferred tax assets totaled $32.2 million and were partially offset by a valuation allowance of $3.5 million. This valuation allowance related to capital loss carryforwards and was determined based on our application of the guidance in ASC 740 and our conclusion that it was more likely than not that the benefits of these assets would not be realized in the future. Based on our assessment as of September 30, 2015, we determined that it was more likely than not that the capital loss carryforwards subject to the valuation allowance would be utilized during 2015. Our projected utilization of the capital loss carryforward deferred tax asset and corresponding release of the remaining valuation allowance is reflected in the calculation of our actual year-to-date effective tax rate.
We believe there is potential for volatility in our 2015 effective tax rate from quarter-to-quarter due to the impact of any prospective changes in our forecasted earnings and capital gains for the year.
Liquidity and Capital Resources
Liquidity is a measurement of our ability to meet potential cash requirements, including ongoing funding for investments, and for other general business purposes. Regulatory requirements applicable to our broker-dealer subsidiaries require minimum capital levels. The primary sources of funds for liquidity consist of existing cash balances (i.e., available liquid capital not invested in our operating businesses), proceeds from sales of securities, internally generated funds, dividends on equity securities that we own, and credit provided by margin accounts, banks, clearing brokers, and affiliates of our principal clearing broker. Potential future sources of liquidity for us include internally generated funds, borrowing capacity through margin accounts, corporate lines of credit and other credit facilities which we may enter into in the future, and future issuances of common stock, preferred stock or debt securities.
Cash Flows
As of September 30, 2015, our cash and cash equivalents totaled $64.2 million representing a net decrease of $44.8 million for the first nine months of 2015. The decrease is attributable to cash used in financing activities of $40.2 million, cash used in operating activities of $10.6 million, offset by $6.0 million of cash provided by investing activities. Due to the cyclical nature of our industry and the industries in which we provide services, we maintain liquid capital to cover potential cash outflows in periods of decreased revenues and earnings.
Net cash used in operating activities of $10.6 million during the first nine months of 2015, compares to $3.5 million of cash used in operating activities during the first nine months of 2014. The decrease in operating cash flows in the first nine months of 2015 compared to 2014 was primarily due to the reductions in net income and accrued compensation and benefits. This cash used in operating activities during the first nine months of 2015 primarily reflects our net operating loss for the period and $15.0 million of cash used to reduce accrued compensation. The cash used in operating activities of $3.5 million during the first nine months of 2014 resulted primarily from increases in trading securities, receivables from brokers, dealers and clearing organizations and decreases in payables during the period.
Net cash provided by investing activities of $6.0 million during the first nine months of 2015 compares to net cash used in investing activities of $32.5 million during the first nine months of 2014. The $6.0 million provided in the first nine months of 2015 reflects sales and distributions from principal investments during the period of $17.8 million offset partially by investment purchases, including $15.1 million of investment funds and $9.5 million related to short-sales of U.S. Treasury securities. In addition, during the first nine months of 2015 we made $2.2 million of payments against the contingent consideration liability for the acquisition of the securities lending business. The $32.5 million used in the first nine months of 2014 reflects principal investments purchased during the period, including $47.5 million of investment funds and $22.7 million of trading securities, as well as $7.3 million related to short-sales of U.S. Treasury securities. These items were partially offset by $52.8 million of proceeds from investments sold during the first nine months of 2014.
Net cash used in financing activities of $40.2 million during the first nine months of 2015 compares to $49.4 million used during the first nine months of 2014. The 2015 activity reflects the repurchase of 1.6 million shares of our common stock for $37.5 million partially offset by proceeds from stock options exercised. The 2014 activity primarily reflects the repurchase of 1.9 million shares of our common stock for $51.1 million.
38
We believe that our existing cash and cash equivalents balances (totaling $64.2 million at September 30, 2015) comprised primarily of investments in money market funds investing in short-term U.S. Treasury securities, cash flows from operations, borrowing capacity, other sources of liquidity and execution of our financing strategies will be sufficient to meet our cash requirements. We have obtained, and believe we will be able to continue to obtain, short-term financing, such as margin financing and temporary subordinated financing, in amounts and at interest rates consistent with our financing objectives. We may, however, seek debt or equity financings, in public or private transactions, to provide capital for corporate purposes and/or strategic business opportunities, including possible acquisitions, joint ventures, alliances or other business arrangements which could require substantial capital outlays. Our policy is to evaluate strategic business opportunities, including acquisitions and divestitures, as they arise. There can be no assurance that we will be able to generate sufficient funds from future operations, or raise sufficient debt or equity on acceptable terms, to take advantage of investment opportunities that become available. Should our needs ever exceed these sources of liquidity, we believe that many of our investments could be sold, in most circumstances, to provide cash.
We monitor and manage our leverage and liquidity risk through various committees and processes we have established. We assess our leverage and liquidity risk based on considerations and assumptions of market factors, as well as factors specific to us, including the amount of our available liquid capital (i.e., the amount of our cash and cash equivalents not invested in our operating business).
Assets and Liabilities
As of September 30, 2015, our principal assets consisted of cash and cash equivalents, financial instruments at fair value, receivables and investments carried at cost. As of September 30, 2015 and December 31, 2014, our liquid assets consisted primarily of cash and cash equivalents of $64.2 million and $109.0 million, respectively.
The increase in our total assets to $1.1 billion as of September 30, 2015, compared to $1.0 billion as of December 31, 2014, was primarily the result of a $165.5 million increase in securities borrowed, partially offset by a $50.4 million decrease in financial instruments owned, at fair value and the $44.8 million decrease in cash noted above.
Regarding securities lending and our securities borrowed and securities loaned balances, we completed the acquisition of a securities lending business in the third quarter of 2014 and as a result of this acquisition, we have an active business in which we borrow securities from one party and lend them to another. Securities borrowed and securities loaned are recorded based upon the amount of cash advanced or received. Securities borrowed transactions facilitate the settlement process and require us to deposit cash or other collateral with the lender. With respect to securities loaned, we receive collateral in the form of cash. The amount of collateral required to be deposited for securities borrowed, or received for securities loaned, is an amount generally in excess of the market value of the applicable securities borrowed or loaned. We monitor the market value of the securities borrowed and loaned on a daily basis, with additional collateral obtained, or excess collateral recalled, when deemed appropriate.
Regarding our due from brokers, dealers and clearing organizations balances, during 2015 and 2014, as part of the Company’s investing activities, the Company entered into short-sales of U.S. Treasury Securities. Proceeds from a short-sale position, as well as related margin requirements, totaling $81.8 million, are held in a collateral account and are included in due from brokers, dealers and clearing organizations on our consolidated balance sheets at September 30, 2015. The remainder of our due from and to brokers, dealers, and clearing organizations balances primarily represent unsettled banking and securities trades as well as cash on deposit related to securities lending.
As of September 30, 2015, our $111.0 million of investments primarily consisted of investments in non-registered investment funds, marketable equity securities, and non-public equity securities. These investments are funded in cash and are not financed with debt. The Company expects to reduce its overall investment balances by approximately $40 million over the next two quarters and reallocate net capital for other purposes.
The increase in our total liabilities to $883.0 million as of September 30, 2015 compared to $774.7 million as of December 31, 2014 was primarily the result of a $163.6 million increase in securities loaned. This increase was partially offset by a $38.8 million decrease in securities sold but not yet purchased, a $15.0 million decrease in accrued compensation and benefits, and a $1.6 million decrease in accounts payable, accrued expenses and other liabilities.
39
FBR Capital Markets & Co. (“FBRCM”) and MLV, our broker-dealer subsidiaries, are registered with the Securities and Exchange Commission (“SEC”) and are members of the Financial Industry Regulatory Authority, Inc. (“FINRA”). As such, they are subject to the minimum net capital requirements promulgated by the SEC. As of September 30, 2015, FBRCM had total regulatory net capital of $33.3 million, which exceeded its required net capital of $2.4 million by $30.9 million. MLV had total regulatory capital of $856 thousand, which exceeded its required net capital of $250 thousand by $606 thousand. Regulatory net capital requirements increase when the broker-dealer is involved in underwriting activities based upon a percentage of the amount being underwritten.
Share Repurchases
During the nine months ended September 30, 2015, we repurchased 1.6 million shares of our common stock in open market or privately negotiated transactions at a weighted average share price of $23.84 per share, for a total cost of $37.5 million. As of September 30, 2015, we had a remaining authority to repurchase up to 132 thousand additional shares. On October 19, 2015, the Company’s Board of Directors approved an increase in the Company’s repurchase authorization to an aggregate of 1 million shares.
We also purchase shares of our common stock from recipients of stock-based compensation awards upon the vesting of RSU and restricted stock awards, and the exercise of options to purchase stock, as recipients sell shares to meet their tax obligations. During the nine months ended September 30, 2015, we purchased 106 thousand shares of common stock at a weighted average share price of $23.20 per share for a total cost of $2.5 million for this purpose.
Dividends
On October 19, 2015, our Board of Directors declared a quarterly cash dividend of $0.20 per common share to be paid on November 27, 2015 to shareholders of record as of the close of business on November 2, 2015.
Off-Balance Sheet Arrangements
Institutional Brokerage
Through indemnification provisions in agreements with clearing organizations, customer activities may expose us to off-balance sheet credit risk. Financial instruments may have to be purchased or sold at prevailing market prices in the event a customer fails to settle on a trade on its original terms or in the event cash and securities in customer margin accounts are not sufficient to fully cover customer obligations. We seek to manage the risks associated with customer activities through customer screening and selection procedures as well as through requirements on customers to maintain margin collateral in compliance with various regulations and clearing organization policies.
Item 3.Quantitative and Qualitative Disclosures about Market Risk
Overall Risk Management
The audit committee of our board of directors has oversight of our risk management framework, and reports to the full board on a quarterly basis regarding our risk management profile. The audit committee regularly meets with our director of risk management to review our risk profile, our policies regarding market and credit risk limits and operations, and our risk tolerance levels and capital limits. Our board of directors has established risk limits applicable to our trading and investment businesses that we monitor daily. In the event risk levels approach the limits, management is required to notify the audit committee, and audit committee approval is required to make any change to the limit levels. The audit committee also regularly meets with our general counsel to discuss legal and regulatory risk issues. In addition, the compensation committee of our board of directors considers the risk associated with overall compensation and how effective our compensation policies are in linking pay to performance and aligning the interest of our executives and shareholders.
40
We monitor market and business risk, including credit risk, operations, liquidity, compliance, legal, and reputational risk through a number of control procedures designed to identify and evaluate the various risks to which our business and investments are exposed. We have established various committees and processes to assess and to manage risk associated with our investment banking, institutional brokerage, and principal investing activities. We review, among other things, business and transactional risks associated with potential investment banking clients and engagements as well as our capital subjected to risk through our trading activities. We seek to manage the transactional and reputational risks associated with our investment banking and principal investing activities by review and approval of transactions by our management-level commitment committee and investment committee, respectively, prior to accepting an engagement or pursuing a material investment transaction. Our management risk committee oversees our institutional brokerage and investment risk management practices, including identifying risk that could expose us to loss, approving risk limits and policies to control for those risks. As a management oversight and monitoring tool, our management risk committee has set more extensive and lower risk limits applicable to our trading activities than the board-level limits discussed above. These management risk limits cannot be exceeded without obtaining exception approval by senior management.
Our risk management function is designed to monitor and understand the risk profile of each of our trading areas and of our principal investing activities, to consolidate risk and liquidity monitoring company-wide, to assist in implementing effective hedging strategies, and to ensure accurate fair values of our financial instruments. In addition, the risk management function is responsible for bringing elevated-risk situations to the attention of senior management, such as the initiation of a large trading position, the granting of exceptions to position or market access limits, or significant changes in the level of our value at risk exposure.
Market Risk
Market risk is the risk that a change in the level of one or more market prices, rates, indices, or other market factors, such as market liquidity, will result in losses for a position or portfolio. Our activities as an underwriter, market maker and principal investor, as well as our activities in securities lending and as a financial intermediary in customer trading transactions, expose us to market risk.
Market risk in our securities lending business arises when the market value of securities borrowed declines relative to the cash we post as collateral with the lender; and when the market value of the securities we have loaned increases relative to the cash we have received as collateral from the borrower. Market value fluctuations in our securities lending business are measured daily and any exposure versus cash received or posted is settled daily with counterparties.
We use a number of quantitative measures to manage our exposure to market risk in our trading businesses. These measures include:
Inventory position limits—we establish inventory position limits on gross and net positions, at both the trading desk and individual position level, and we monitor exposures against limits on a daily basis.
Scenario analysis—we apply stress tests and scenario analysis to estimate the potential impact on our trading revenues of highly stressful market environments in both the credit and equity markets.
Value at Risk—we utilize a statistical measure of potential trading loss, called Value at Risk (“VaR”), to estimate the potential loss from adverse market moves in an ordinary market environment. We also establish VaR limits, as appropriate.
41
Value at Risk. We calculate VaR for our trading businesses using a parametric model that estimates VaR from the standard deviation of portfolio returns. This approach, which captures both the linear and non-linear risks from our trading positions, requires individual positions to be expressed as individual risk factors, then the volatilities and correlations for these risk factors are calculated directly based on data from the previous twelve months. The resulting VaR is expressed over a one-day time horizon and at a 95% confidence level. A 95% confidence level implies that, on average, we anticipate that 5% of the time we may realize trading losses in excess of our VaR amount. The table below presents the Company’s 95%/one-day VaR for the nine months ended September 30, 2015 and 2014 (dollars in thousands):
|
95% / One-Day VaR |
|
|||||||||||||||||||||||||||||
|
For the Nine Months Ended September 30, |
|
|||||||||||||||||||||||||||||
|
2015 |
|
|
2014 |
|
||||||||||||||||||||||||||
|
Period End |
|
|
Average |
|
|
High |
|
|
Low |
|
|
Period End |
|
|
Average |
|
|
High |
|
|
Low |
|
||||||||
|
|
|
|||||||||||||||||||||||||||||
|
$ |
73 |
|
|
$ |
149 |
|
|
$ |
270 |
|
|
$ |
57 |
|
|
$ |
166 |
|
|
$ |
234 |
|
|
$ |
371 |
|
|
$ |
157 |
|
The Company’s VaR of $73 thousand at September 30, 2015 is 0.03% of our shareholders’ equity as of that date and the change in period end VaR from year to year shows a decrease of $93 thousand. The low, stable level of VaR reflects the low amount of inventory held in trading businesses as well as the Company’s use of hedging transactions, whenever feasible, to reduce market risk. The chart below reflects our daily VaR over the last four quarters:
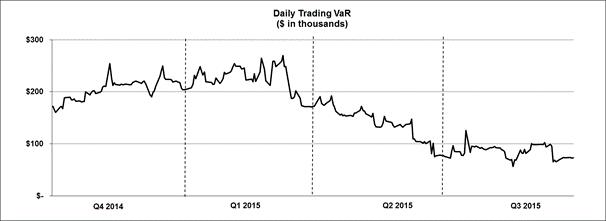
VaR is a model that quantifies potential losses using historical data. We could incur losses greater than the reported VaR because the historical market prices used may not be an accurate measure of future market events and conditions, especially in highly stressful market environments. In addition, the VaR model measures the risk of the current net trading positions and does not take into account future position changes arising from transaction and/or hedging activity. It also includes the market risk associated with securities sold but not yet purchased on our trading desks. Our VaR includes positions actively managed and held by our trading desks and does not include positions associated with investment banking transactions that may be held on our trading desk in order to facilitate distribution if the underlying stock has not yet commenced trading on a national securities exchange. In most instances, these positions are held only for a short period and sold at or above our costs. Such positions totaled $6.1 million at September 30, 2015. To the extent we hold these positions on a long-term basis, they are reflected as long-term investments and risk related to these positions are discussed below under the section Equity Price Risk.
The primary method used to test the reasonableness of VaR measure is to compare actual daily trading revenue fluctuations with the daily VaR estimate. If the lowest 5th percentile of daily trading revenues in the revenue fluctuations analysis are less than the loss predicted by the 95th percentile VaR estimate, then the VaR estimate is considered a reasonable predictor of actual trading results. In performing this comparison, the Company’s definition of trading revenues and losses includes commissions, sales credits, net interest income, and gains and losses from intraday trading in the Company’s market-making trading businesses. It does not include the activities of investments in equity that are described in detail in the section Equity Price Risk below.
42
The following table provides the actual daily trading revenue fluctuations during the nine months ended September 30, 2015. Over this nine month period, the lowest 5th percentile of all trading days is represented by the first, second and third columns from the left in the table below, which reflect the nine lowest days of daily trading revenue. Although not specifically shown in the table, during this nine-day period, the average daily trading revenues were net gains of $32 thousand and the lowest one-day trading revenue was a net loss of $175 thousand.
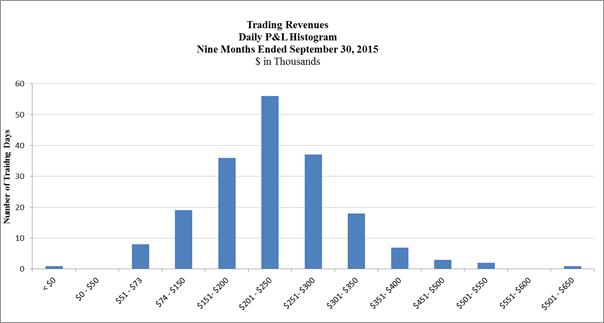
Equity Price Risk. Equity price risk represents the potential loss in value of a position due to adverse changes in the level or volatility of equity prices. We generally attempt to limit exposure to equity price risk on securities held as a result of our daily equity trading activities by limiting our intra-day and overnight inventory of trading securities to that needed to provide the appropriate level of liquidity in the securities for which we are a market maker. We also seek to manage these risks by diversifying exposures, controlling position sizes, and establishing economic hedges in related securities, principally through short sale transactions.
While it is impossible to project exactly what factors may affect the prices of equity securities and how much the effect might be, the impact of a ten percent increase and a ten percent decrease in the price of equities held by us would be as follows as of September 30, 2015. The fair value of the $10.5 million of trading equity securities held at our broker-dealer subsidiaries would increase or decrease to $11.6 million and $9.5 million, respectively, and the fair value of the $21.8 million of other equity investments would increase or decrease to $24.0 million and $19.6 million, respectively.
Except to the extent that we sell our cost method equity investments, or a decrease in their fair value is deemed to be other-than-temporary, an increase or decrease in the fair value of those assets will not directly affect our earnings. However, an increase or decrease in the value of trading securities held by our broker-dealer subsidiaries, investment securities designated as trading, or investment funds will directly affect our earnings.
43
Credit Risk. Our broker-dealer subsidiaries clear all of their securities transactions through clearing brokers on a fully disclosed basis. Pursuant to the terms of the agreements between our broker-dealer subsidiaries and the clearing brokers, the clearing brokers have the right to charge us for losses that result from a counterparty’s failure to fulfill its contractual obligations. As the right to charge us has no maximum amount and applies to all trades executed through the clearing brokers, we believe there is no maximum amount assignable to this right. At September 30, 2015 and December 31, 2014, we have recorded no liabilities with regard to this right. During the nine months ended September 30, 2015 and 2014, amounts paid to the clearing brokers related to these guarantees have been immaterial. In addition, we have the right to pursue collection of performance from the counterparties who do not perform under their contractual obligations. We monitor the credit standing of the clearing brokers and all counterparties with which we conduct business. We attempt to limit our credit spread risk by offsetting long or short positions in various related securities.
Credit risk from our securities lending operations arises if a lender or borrower defaults on an outstanding loan or borrow transaction and the cash or securities we are holding is insufficient to cover the amount they owe us for that receivable. We assign credit limits and collateral posting thresholds for each counterparty and these limits and thresholds are reviewed periodically.
The securities industry is subject to numerous risks, including the risk of loss associated with the underwriting, ownership, and trading of securities, and the risk of reduced revenues in periods of reduced demand for security offerings and activity in secondary trading markets. Changing economic and market trends may negatively impact the liquidity and value of our investments and the level of security offerings underwritten by us, which may adversely affect our revenues and profitability.
Our equity and debt investments include non-investment grade securities of privately held issuers with no ready markets. The concentration and illiquidity of these investments expose us to a higher degree of risk than associated with readily marketable securities.
Interest Rate Risk. Interest rate risk represents the potential loss in value of a position or portfolio from adverse changes in market interest rates. We are exposed to interest rate risk through our trading activities in convertible and fixed income securities as well as U.S. Treasury securities, however, based on our daily monitoring of this risk, we believe we currently have limited exposure to interest rate risk in these activities.
Item 4.Controls and Procedures
Conclusion Regarding the Effectiveness of Disclosure Controls and Procedures
As of the end of the period covered by this report on Form 10-Q, our management carried out an evaluation, with the participation of our Chief Executive Officer, Richard J. Hendrix, and our Chief Financial Officer, Bradley J. Wright, of the effectiveness of our disclosure controls and procedures (as defined under Rule 13a-15(e) of the Securities Exchange Act of 1934 (the “Exchange Act”)) pursuant to Rule 13a-15(b) under the Exchange Act. Based upon that evaluation, our Chief Executive Officer and our Chief Financial Officer concluded that our disclosure controls and procedures, as of September 30, 2015, are effective to ensure that information required to be disclosed by us in the reports that we file or submit under the Exchange Act is recorded, processed, summarized and reported, within the time periods specified in the SEC’s rules and forms, and that such information is accumulated and communicated to our management, including our Chief Executive Officer and Chief Financial Officer, as appropriate, to allow timely decisions regarding disclosure.
Changes in Internal Controls over Financial Reporting
During the three months ended September 30, 2015, we have not made any changes that have materially affected, or are reasonably likely to materially affect, our internal control over financial reporting (as defined in Rule 13a-15(f) under the Exchange Act).
44
OTHER INFORMATION
As of September 30, 2015, except as described below, we were neither a defendant nor plaintiff in any lawsuits or arbitrations nor involved in any governmental or self-regulatory organization matters that are expected to have a material adverse effect on our financial condition, results of operations or liquidity. We have been named as a defendant in a small number of civil lawsuits relating to our various businesses. In addition, we are subject to various reviews, examinations, investigations and other inquiries by governmental agencies and self regulatory organizations. There can be no assurance that these matters individually or in aggregate will not have a material adverse effect on our financial condition, results of operations, or liquidity in a future period. However, based on management’s review with counsel, resolution of these matters is not expected to have a material adverse effect on our financial condition, results of operations or liquidity.
Many aspects of our business involve substantial risks of liability and litigation. Underwriters, broker-dealers and investment advisers are exposed to liability under federal and state securities laws, other federal and state laws and court decisions, including decisions with respect to underwriters’ liability and limitations on indemnification, as well as with respect to the handling of customer accounts. For example, underwriters may be held liable for material misstatements or omissions of fact in a prospectus used in connection with the securities being offered and broker-dealers may be held liable for statements made by their securities analysts or other personnel. In the past, FBRCM has been named as a defendant in a small number of securities claims involving investment banking clients of FBRCM as a result of FBRCM’s role as an underwriter. In these cases, the underwriting agreement provides, subject to certain conditions, that the investment banking client is required to indemnify FBRCM against certain claims or liabilities, including claims or liabilities under the Securities Act, of 1933, as amended (the “Securities Act”), or contribute to payments which FBRCM is required to make as a result of the litigation. There can be no assurance that such indemnification or contribution will ultimately be available to us or that an investment banking client will be able to satisfy its indemnity or contribution obligations when due.
FBRCM has been named a defendant in the putative class action lawsuit Waterford Township Police & Fire, Retirement System, vs. Regional Management Corp. et al., pending in the United States District Court for the Southern District of New York. The amended complaint, filed on November 24, 2014, (the “Amended Complaint”), names FBRCM as a co-managing underwriter of offerings in September 2013 and December 2013. Plaintiffs allege that the Registration Statement and Prospectus used in connection with these offerings were negligently prepared and, as a result, contained untrue statements of material fact and omitted to state other facts necessary to make the statements made not misleading. The Amended Complaint asserts claims against all the underwriters under Sections 11 and 12 of the Securities Act. Regional Management has agreed to indemnify all the underwriters, including FBRCM, pursuant to the operative underwriting agreement. In response to the defendants’ motions to dismiss, filed on January 23, 2015, the putative class plaintiffs filed a second amended complaint (the “Second Amended Complaint”), which shall serve as the operative complaint. The underwriter defendants have moved to dismiss the Second Amended Complaint and the briefing was completed in July 2015.
In accordance with applicable accounting guidance, we establish an accrued liability for litigation and regulatory matters when those matters present loss contingencies that are both probable and estimable. In such cases, there may be an exposure to loss in excess of any amounts accrued. When a loss contingency is not both probable and estimable, we do not establish an accrued liability. As a litigation or regulatory matter develops, management, in conjunction with counsel, evaluates on an ongoing basis whether such matter presents a loss contingency that is probable and estimable. The pending case discussed above involving FBRCM is at a preliminary stage, and based on management’s review with counsel and present information known by management, a loss contingency for this matter was not probable and estimable as of September 30, 2015.
45
In certain circumstances, broker-dealers and asset managers may also be held liable by customers and clients for losses sustained on investments. In recent years, there has been an increasing incidence of litigation and actions by government agencies and self regulatory organizations involving the securities industry, including class actions that seek substantial damages. We are also subject to the risk of litigation, including litigation that may be without merit. As we intend to actively defend any such litigation, significant legal expenses could be incurred. An adverse resolution of any future litigation against us could materially affect our financial condition, operating results and liquidity.
As of September 30, 2015, there have been no material changes to our risk factors as previously disclosed in Item 1A of Part I of the Company’s Annual Report on Form 10-K for the fiscal year ended December 31, 2014.
Item 2.Unregistered Sales of Equity Securities and Use of Proceeds
The following table provides information on the Company’s share repurchases during the third quarter of 2015:
|
|
|
Total Number of Shares Purchased |
|
|
Average Price Paid per Share |
|
|
Total Number of Shares purchased as Part of Publicly announced Plans or Programs (1) |
|
|
Maximum Number of Shares That May Yet Be Purchased Under the Plans or Programs (1) |
|
|
||||
|
July 1 to July 31, 2015 |
|
|
82,834 |
|
|
$ |
23.21 |
|
|
|
82,834 |
|
|
|
532,298 |
|
|
|
August 1 to August 31, 2015 |
|
|
162,085 |
|
|
|
22.93 |
|
|
|
162,085 |
|
|
|
370,213 |
|
|
|
September 1 to September 30, 2015 |
|
|
238,057 |
|
|
|
21.99 |
|
|
|
238,057 |
|
|
|
132,156 |
|
|
|
Total |
|
|
482,976 |
|
|
$ |
22.51 |
|
|
|
482,976 |
|
|
|
132,156 |
|
|
|
|
(1) |
On October 19, 2015, the Board of Directors of the Company approved an increase in the Company’s repurchase authorization to an aggregate of 1,000,000 shares. |
Item 3.Defaults Upon Senior Securities
Not applicable.
Item 4.Mine Safety Disclosures
Not applicable.
Not applicable.
46
|
Exhibit Number |
|
Exhibit Title |
|
3.1 |
|
Amended And Restated Bylaws of FBR & Co. (incorporated by reference to Exhibit 3.1 to the Company’s Current Report on Form 8-K, filed on October 6, 2015) |
|
|
|
|
|
31.01 |
|
Certification of Chief Executive Officer pursuant to Rule 13a-14(a) under the Securities Exchange Act of 1934, as amended, adopted pursuant to Section 302 of the Sarbanes-Oxley Act of 2002. |
|
|
|
|
|
31.02 |
|
Certification of Chief Financial Officer pursuant to Rule 13a-14(a) under the Securities Exchange Act of 1934, as amended, adopted pursuant to Section 302 of the Sarbanes-Oxley Act of 2002. |
|
|
|
|
|
32.01 |
|
Certification of Chief Executive Officer pursuant to 18 U.S.C. Section 1350, as adopted pursuant to Section 906 of the Sarbanes-Oxley Act of 2002. |
|
|
|
|
|
32.02 |
|
Certification of Chief Financial Officer pursuant to 18 U.S.C. Section 1350, as adopted pursuant to Section 906 of the Sarbanes-Oxley Act of 2002. |
|
|
|
|
|
101 |
|
The following financial information from the Quarterly Report on Form 10-Q for the quarter ended September 30, 2015, formatted in XBRL (Extensible Business Reporting Language): (i) the Consolidated Balance Sheets, (ii) the Consolidated Statements of Operations, (iii) the Consolidated Statements of Comprehensive Income (Loss), (iv) the Consolidated Statements of Changes in Shareholders’ Equity, (v) the Consolidated Statements of Cash Flows, and (vi) the Notes to the Consolidated Financial Statements. |
|
|
||
47
Pursuant to the requirements of the Securities Exchange Act of 1934, the registrant has duly caused this report to be signed on its behalf by the undersigned, thereunto duly authorized.
|
|
|
FBR & Co. |
||
|
|
|
|
|
|
|
Date: November 9, 2015 |
|
By: |
|
/s/ Bradley j. Wright |
|
|
|
|
|
Bradley J. Wright |
|
|
|
|
|
Executive Vice President, Chief Financial Officer |
|
|
|
|
|
(Principal Financial Officer) |
|
|
|
|
|
|
|
Date: November 9, 2015 |
|
By: |
|
/s/ Robert J. Kiernan |
|
|
|
|
|
Robert J. Kiernan |
|
|
|
|
|
Senior Vice President, Controller and |
|
|
|
|
|
Chief Accounting Officer |
|
|
|
|
|
(Principal Accounting Officer) |
48