Attached files
| file | filename |
|---|---|
| 8-K - CURRENT REPORT ON FORM 8-K - PNMAC Holdings, Inc. | pfsi_8k.htm |
| EX-99.1 - PRESS RELEASE - PNMAC Holdings, Inc. | pfsi_8k-ex9901.htm |
Exhibit 99.2

Third Quarter 2015 Earnings Report

Forward - Looking Statements 2 This presentation contains forward - looking statements within the meaning of Section 21 E of the Securities Exchange Act of 1934 , as amended, regarding management’s beliefs, estimates, projections and assumptions with respect to, among other things, the Company’s financial results, future operations, business plans and investment strategies, as well as industry and market conditions, all of which are subject to change . Words like “believe,” “expect,” “anticipate,” “promise,” “plan,” and other expressions or words of similar meanings, as well as future or conditional verbs such as “will,” “would,” “should,” “could,” or “may” are generally intended to identify forward - looking statements . Actual results and operations for any future period may vary materially from those projected herein, from past results discussed herein, or from illustrative examples provided herein . Factors which could cause actual results to differ materially from historical results or those anticipated include, but are not limited to : changes in federal, state and local laws and regulations applicable to the highly regulated industry in which we operate ; lawsuits or governmental actions if we do not comply with the laws and regulations applicable to our businesses ; the creation of the Consumer Financial Protection Bureau, or CFPB, and enforcement of its rules ; changes in existing U . S . government - sponsored entities, their current roles or their guarantees or guidelines ; changes to government mortgage modification programs ; the licensing and operational requirements of states and other jurisdictions applicable to our businesses, to which our bank competitors are not subject ; foreclosure delays and changes in foreclosure practices ; certain banking regulations that may limit our business activities ; changes in macroeconomic and U . S . residential real estate market conditions ; difficulties in growing loan production volume ; changes in prevailing interest rates ; increases in loan delinquencies and defaults ; our reliance on PennyMac Mortgage Investment Trust as a significant source of financing for, and revenue related to, our correspondent lending business and purchased mortgage servicing rights ; availability of required additional capital and liquidity to support business growth ; our obligation to indemnify third - party purchasers or repurchase loans that we originate, acquire or assist in with fulfillment ; our obligation to indemnify advised entities or investment funds to meet certain criteria or characteristics or under other circumstances ; decreases in the historical returns on the assets that we select and manage for our clients, and our resulting management and incentive fees ; regulation applicable to our investment management segment ; conflicts of interest in allocating our services and investment opportunities among ourselves and our advised entities ; the potential damage to our reputation and adverse impact to our business resulting from ongoing negative publicity ; and our rapid growth . You should not place undue reliance on any forward - looking statement and should consider all of the uncertainties and risks described above, as well as those more fully discussed in reports and other documents filed by the Company with the Securities and Exchange Commission from time to time . The Company undertakes no obligation to publicly update or revise any forward - looking statements or any other information contained herein, and the statements made in this presentation are current as of the date of this presentation only .

Third Quarter Highlights 3 ▪ Pretax income of $73.9 million ; diluted earnings per common share of $0.58 – Segment pretax earnings: Production: $77.7 million; Servicing: $(6.1) million; Investment Management: $2.2 million – Servicing results impacted by a $47.9 million reduction in the mortgage servicing right (MSR) value partially offset by gains of $30.5 million related to hedges and $10.3 million resulting from a reduction in the excess servicing spread (ESS) liability; net impact of $(7.2) million ▪ Loan production totaled $15.5 billion in unpaid principal balance (UPB), up 19% from 2Q15, driven by market share gains in correspondent which led to record quarterly funding volume – Correspondent production was $14.4 billion, up 21% from 2Q15; consumer direct originations were $1.0 billion, down 8% from 2Q15 – Record production segment revenue of $135.2 million ▪ Servicing portfolio grew to $154.8 billion in UPB, up 14% from June 30, 2015 – Continued organic growth results from loan production, supplemented by the completion of previously announced bulk MSR acquisitions and flow acquisitions totaling $10.0 billion in UPB – Servicing operating revenue was $106.2 million; pretax servicing operating income was $15.8 million – Servicing segment revenue was $46.1 million, down 21% from 2Q15 driven by the reduction in MSR value net of hedge gains and reduction in the ESS liability ▪ Net assets under management were $1.8 billion, down 5% from June 30, 2015 – Revenue of $ 7.8 million, up 13% from 2Q15 due to higher carried interest

3.0% 3.5% 4.0% 4.5% 5.0% Hundreds $0 $20 $40 $60 $80 $100 $120 $140 1Q14 2Q14 3Q14 4Q14 1Q15 2Q15 3Q15 Current Market Environment and Outlook 4 New MBS Issuance by Agency (2) ($ in billions) • Volatility in global markets has led to U.S. interest rates and mortgage rates remaining low • Home price appreciation has moderated, but housing fundamentals appear stable • Agency loans continue to dominate the mortgage market, including government loan programs – Ginnie Mae share of new MBS issuance reached an all - time high and exceeded both Fannie Mae and Freddie Mac in 3Q15 – FHA and VA streamlined refinance programs allow consumers to benefit from lower interest rates – Government loans and new Fannie Mae and Freddie Mac initiatives are designed to meet the needs of new homebuyers, e.g., smaller down payments • Regulatory changes continue to underscore the importance of effective governance, compliance, and operating systems – TILA - RESPA Integrated Disclosure (TRID) rule went into effect in early October, changing the new loan origination process – FHA and the GSEs are making efforts to clarify lender liability (1) Freddie Mac Primary Mortgage Market Survey. 3.76% as of 10/29/2015 (2) Inside Mortgage Finance Ŷ Non - Agency (Jumbo) Ŷ Freddie Mac Ŷ Fannie Mae Ŷ Ginnie Mae Average 30 - year fixed rate mortgage (1) 4.08% 3.86%
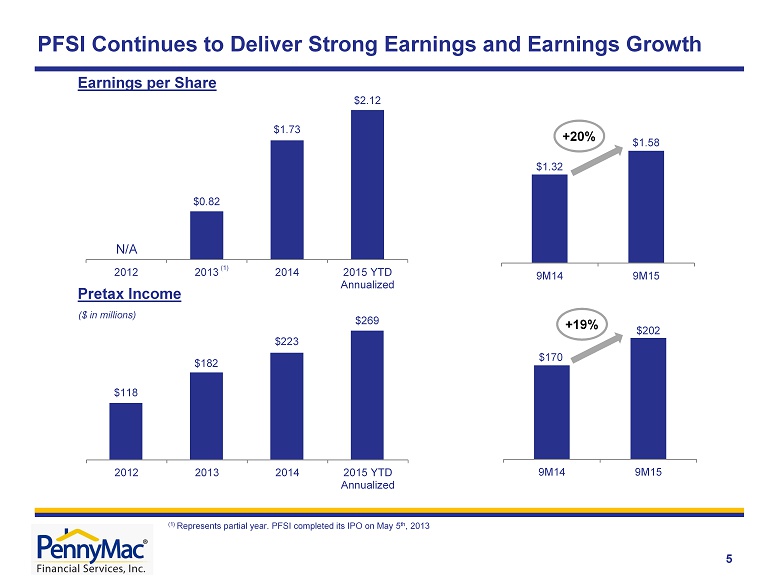
$1.32 $1.58 9M14 9M15 $0.82 $1.73 $2.12 2012 2013 2014 2015 YTD Annualized $118 $182 $223 $269 2012 2013 2014 2015 YTD Annualized $170 $202 9M14 9M15 +19% +20% PFSI Continues to Deliver Strong Earnings and Earnings Growth Pretax Income ($ in millions) 5 Earnings per Share (1) Represents partial year. PFSI completed its IPO on May 5 th , 2013 (1) N/A
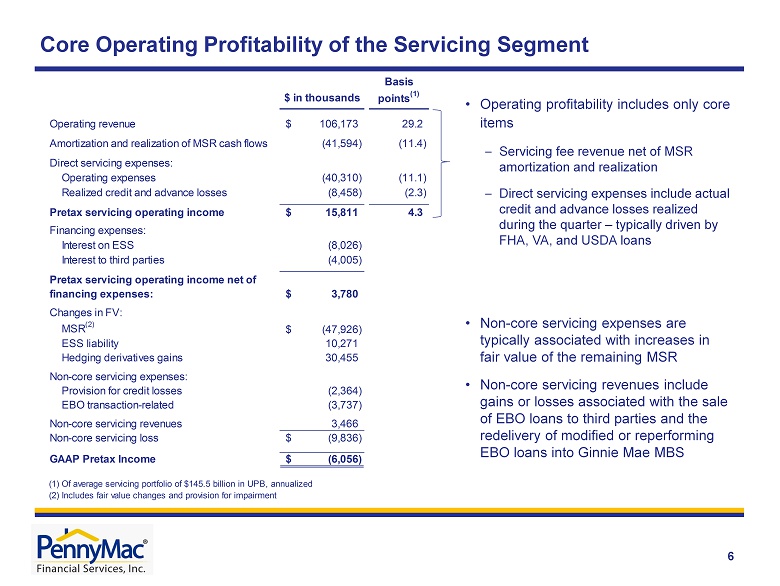
$ in thousands Basis points (1) Operating revenue 106,173$ 29.2 Amortization and realization of MSR cash flows (41,594) (11.4) - Direct servicing expenses: Operating expenses (40,310) (11.1) Realized credit and advance losses (8,458) (2.3) Pretax servicing operating income 15,811$ 4.3 Financing expenses: Interest on ESS (8,026) Interest to third parties (4,005) Pretax servicing operating income net of financing expenses: 3,780$ Changes in FV: MSR (2) (47,926)$ ESS liability 10,271 Hedging derivatives gains 30,455 Non-core servicing expenses: Provision for credit losses (2,364) EBO transaction-related (3,737) Non-core servicing revenues 3,466 Non-core servicing loss (9,836)$ GAAP Pretax Income (6,056)$ (1) Of average servicing portfolio of $145.5 billion in UPB, annualized (2) Includes fair value changes and provision for impairment Core Operating Profitability of the Servicing Segment 6 • Operating profitability includes only core items – Servicing fee revenue net of MSR amortization and realization – Direct servicing expenses include actual credit and advance losses realized during the quarter – typically driven by FHA, VA, and USDA loans • Non - core servicing expenses are typically associated with increases in fair value of the remaining MSR • Non - core servicing revenues include gains or losses associated with the sale of EBO loans to third parties and the redelivery of modified or reperforming EBO loans into Ginnie Mae MBS

Hedging Approach Moderates the MSR Value Loss Due to Interest Rates 7 ▪ The mortgage banking business is inherently sensitive to changes in interest rates ▪ PFSI seeks to moderate the impact of interest rate changes through a comprehensive hedge approach that considers the company - wide effect on revenue opportunities ▪ The company employs financial hedge instruments to offset a portion of the change in value of the MSR asset resulting from interest rate changes ▪ PFSI’s net exposure favors a rising rate environment and is designed to capture MSR fair value gains in excess of related hedge costs ▪ Interest rate declines result in immediate loss in fair value of the MSR net of hedge gains, which is expected to be offset by increases in production - related income that are realized over time

PFSI Continues to Distinguish Its Operational Platform with Technology 8 Leading Technology in Place and in Development • Management team’s substantial operating expertise combined with unique capabilities integrating technology creates a distinctive competitive edge for PFSI • Operational platform built from the ground up incorporates robust systems for compliance, quality control, and risk management Correspondent Production • Unique systems allow for highly automated and scalable correspondent fulfillment process • Proprietary technologies include use of optical character recognition to improve accuracy and operational efficiency • Pricing and margin management systems to optimize the business opportunity and profitability Consumer Direct Lending • Leading technology already in place includes web tools for loan origination, electronic document signing and transfer, and lead management systems for servicing recapture and non - portfolio leads • Further enhancing our systems for consumer direct origination by leveraging tools developed in the Company’s Mortgage Fulfillment Division • Developing web and mobile technology to extend to more of the mortgage transaction including loan processing status and borrower communication/interaction Loan Servicing • Many customized and proprietary applications in place which include workflow management, loss mitigation alternatives, default process tracking, electronic document storage and rendering, and front - end borrower interaction • Ongoing development and investment in tools to further automate workflows, capture efficiencies and enhance the productivity of PennyMac’s servicing operations • Systems designed to augment the capabilities of the core loan servicing system

8.37% 10.93% 0% 2% 4% 6% 8% 10% 12% 3Q13 4Q13 1Q14 2Q14 3Q14 4Q14 1Q15 2Q15 3Q15 Trends in PennyMac Financial’s Businesses Correspondent Production (1) Market Share 0.39% 0.38% 0.00% 0.10% 0.20% 0.30% 0.40% 0.50% 3Q13 4Q13 1Q14 2Q14 3Q14 4Q14 1Q15 2Q15 3Q15 Market Share Consumer Direct Production (1 ) $1.84 $1.75 $0.0 $0.5 $1.0 $1.5 $2.0 $2.5 3Q13 4Q13 1Q14 2Q14 3Q14 4Q14 1Q15 2Q15 3Q15 1.38% 1.57% 0.0% 0.3% 0.6% 0.9% 1.2% 1.5% 1.8% 3Q13 4Q13 1Q14 2Q14 3Q14 4Q14 1Q15 2Q15 3Q15 Loan Servicing (1) Market Share Investment Management AUM (billions) 9 (1) Source : Inside Mortgage Finance and company estimates. Inside Mortgage Finance estimates total 3Q15 origination market of $445 billion. Correspondent production share estimate is based on PFSI and PMT acquisition volume of $15.5 billion divided by $132 billion for the correspondent market (estimated to be 29% of total origination market). Consumer direct production share is based on PFSI originations of $1.0 billion divided by $273 billion for the retail market (estimated to be 60% of total origination market). Loan servicing ma rket share is based on PFSI’s servicing UPB of $154.8 billion divided by $9.84 trillion in mortgage debt outstanding as of June 30, 2015.
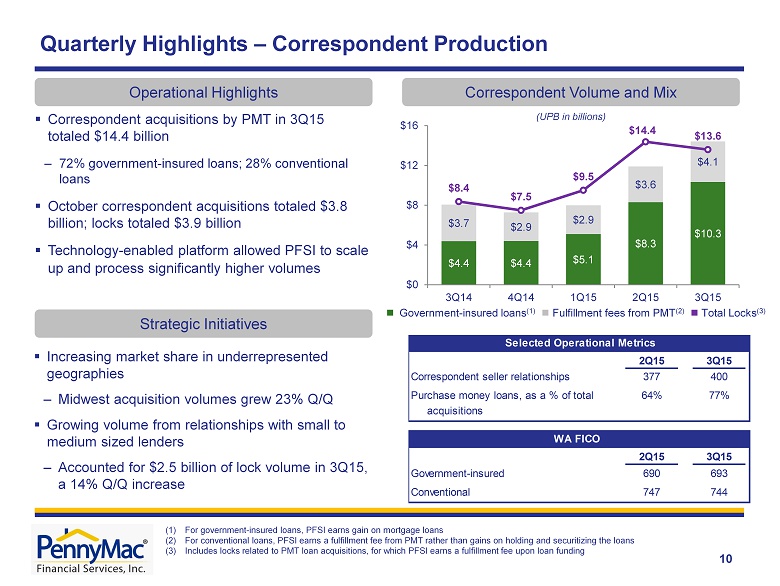
10 $4.4 $4.4 $5.1 $8.3 $10.3 $3.7 $2.9 $2.9 $3.6 $4.1 $8.4 $7.5 $9.5 $14.4 $13.6 $0 $4 $8 $12 $16 3Q14 4Q14 1Q15 2Q15 3Q15 (UPB in billions) Quarterly Highlights – Correspondent Production (1) For government - insured loans, PFSI earns gain on mortgage loans (2) For conventional loans, PFSI earns a fulfillment fee from PMT rather than gains on holding and securitizing the loans (3) Includes locks related to PMT loan acquisitions, for which PFSI earns a fulfillment fee upon loan funding Correspondent Volume and Mix Operational Highlights Ŷ Government - insured loans (1) Ŷ Fulfillment fees from PMT (2) Ŷ Total Locks (3) Strategic Initiatives ▪ Increasing market share in underrepresented geographies – Midwest acquisition volumes grew 23% Q/Q ▪ Growing volume from relationships with small to medium sized lenders – Accounted for $2.5 billion of lock volume in 3Q15, a 14% Q/Q increase ▪ Correspondent acquisitions by PMT in 3Q15 totaled $14.4 billion – 72% government - insured loans ; 28% conventional loans ▪ October correspondent acquisitions totaled $3.8 billion; locks totaled $3.9 billion ▪ Technology - enabled platform allowed PFSI to scale up and process significantly higher volumes 2Q15 3Q15 Correspondent seller relationships 377 400 Purchase money loans, as a % of total 64% 77% acquisitions 2Q15 3Q15 Government-insured 690 693 Conventional 747 744 Selected Operational Metrics WA FICO

(UPB in millions ) ▪ Consumer direct production totaled $1.0 billion in 3Q15, down 8% from 2Q15 – Loans funded totaled 4,226 in 3Q15, up 8% from 2Q15; focus on lower balance loans ▪ Consumer direct locks totaled $1.8 billion, up 6% from 2Q15 ▪ October consumer direct production totaled $357 million ; locks totaled $682 million – $628 million committed pipeline at October 31, 2015 (1) Quarterly Highlights – Consumer Direct Production Consumer Direct Production Volume Operational Highlights Strategic Initiatives Ŷ Portfolio - sourced fundings Ŷ Non - portfolio fundings Ŷ Committed pipeline (1) (1) C ommitments to purchase or originate mortgage loans at specified terms at period end (2 ) Includes conforming and jumbo loan originations . ▪ Building additional operational capacity for higher levels of production, including increases in consumer direct sales resources ▪ Executing on expanded recapture opportunities from recent MSR acquisitions 11 $527 $682 $897 $1,138 $1,042 $370 $585 $713 $504 $550 $0 $200 $400 $600 $800 $1,000 $1,200 3Q14 4Q14 1Q15 2Q15 3Q15 2Q15 3Q15 Government-insured 691 684 Conventional (2) 751 744 WA FICO

2Q15 3Q15 Loans serviced (in thousands) 695 803 60+ day delinquency rate 3.0% 2.8% Actual CPR - owned portfolio 23.1% 15.8% Actual CPR - sub-serviced (2) 13.7% 9.6% Completed modifications 887 1,063 EBO transactions (in millions) (3) $385 $377 Selected Operational Metrics $136.2 $154.8 at 6/30/15 Runoff Additions from loan production MSR acquisitions At 9/30/15 (UPB in billions ) ▪ Servicing portfolio totaled $154.8 billion in UPB at quarter end, up 14% from 2Q15 ▪ Bulk, mini - bulk and flow MSR acquisitions totaled $10.0 billion in UPB during 3Q15 – Completed the previously announced acquisition of $8.5 billion in UPB of bulk MSRs ▪ Both Fort Worth, TX and Moorpark, CA are now fully developed servicing centers Quarterly Highlights – Loan Servicing Loan Servicing Portfolio Composition Operational Highlights Ŷ Prime owned Ŷ Prime subserviced Ŷ Special Net Portfolio Growth ($6.8) $15.5 $10.0 (UPB in billions ) (1) 12 (1) Includes consumer direct production, government correspondent acquisitions, and conventional conforming and jumbo loan acquisitions subserviced for PMT (2) For PMT’s MSR portfolio only (3) Early buyouts of delinquent loans from Ginnie Mae pools during the period Additions From loan p roduction (1) From MSR acquisitions $100 $106 $115 $136 $155 $0 $40 $80 $120 $160 3Q14 4Q14 1Q15 2Q15 3Q15

$13.3 $10.4 $10.0 $6.9 $7.8 $0 $3 $6 $9 $12 $15 3Q14 4Q14 1Q15 2Q15 3Q15 Carried interest & incentive fees Base management fees & other revenue 13 ($ in millions) ▪ Net assets under management were $1.8 billion at September 30, 2015 ▪ PMT’s book value grew to $20.52 at quarter end versus $20.39 at June 30, 2015 ▪ PMT completed its first GSE risk transfer transaction and entered into a second with Fannie Mae ▪ Improved investment fund performance in 3Q15 Quarterly Highlights – Investment Management Investment Management Revenues Operational Highlights Strategic Initiatives ▪ Opportunities to grow PMT over time and manage additional capital for mortgage - related investments: – Distressed whole loans – MSRs resulting from correspondent acquisitions – Excess servicing spread on MSRs – Investments in prime non - Agency loans – Agency and non - Agency MBS – GSE risk transfers on PMT’s production – Small balance CRE loans and securitization interests ▪ Investment management revenues were $7.8 million, up 13% from 2Q15 – Carried interest from the private investment funds increased to $1.5 million from $0.2 million in 2Q15 – No incentive fees received in 3Q15 as a result of PMT’s return on equity over the four - quarter period for which incentive fees are calculated
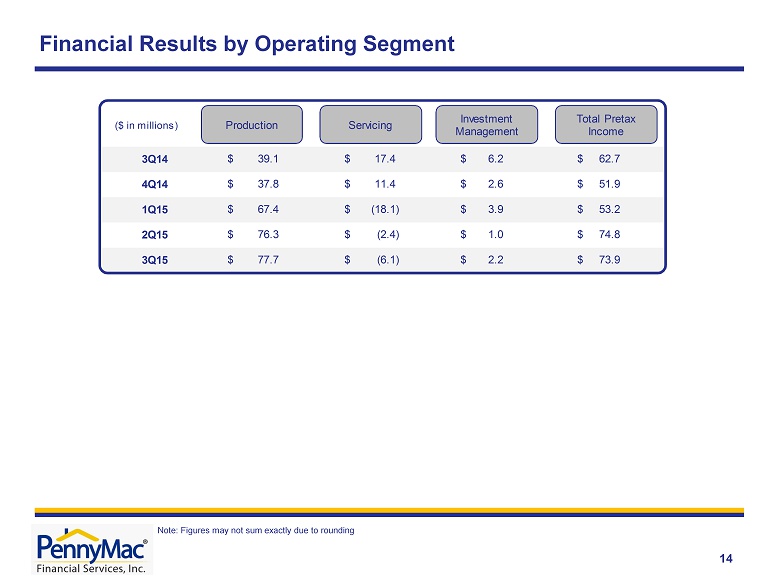
Financial Results by Operating Segment 14 Note: Figures may not sum exactly due to rounding 3Q14 39.1$ 17.4$ 6.2$ 62.7$ 4Q14 37.8$ 11.4$ 2.6$ 51.9$ 1Q15 67.4$ (18.1)$ 3.9$ 53.2$ 2Q15 76.3$ (2.4)$ 1.0$ 74.8$ 3Q15 77.7$ (6.1)$ 2.2$ 73.9$ ($ in millions) Production Servicing Investment Management Total Pretax Income

Net gains on mortgage loans held for sale at fair value 81,005$ 86,377$ Loan origination fees 29,448 24,421 Fulfillment fees from PennyMac Mortgage Investment Trust 17,553 15,333 Net interest income 6,938 5,000 Other 272 235 135,216 131,366 57,477 55,085 Pretax income 77,739$ 76,281$ Net gains on mortgage loans 81,005$ 86,377$ As % of IRLCs 0.72% 0.75% Loan origination fees 29,448$ 24,421$ As % of PFSI fundings 0.26% 0.26% Fulfillment fees from PMT 17,553$ 15,333$ Average fulfillment fee 43 bps 43 bps Production Segment Metrics Unaudited ($ in thousands) Expenses Production Segment Unaudited ($ in thousands) Revenue Quarter ended September 30 , 2015 Quarter ended June 30 , 2015 Quarter ended September 30, 2015 Quarter ended June 30 , 2015 15 Mortgage Banking – Production Segment Results ( 1 ) Fulfillment fees paid by PMT divided by unpaid principal balance of loans fulfilled for PMT during the quarter (2) Includes revenues from net gains on mortgage loans held for sale, loan origination fees and net interest income; adjusted for 43% expected fallout of consumer direct lock commitments (1) ▪ Production gains (net gains on mortgage loans held for sale, loan origination fees, and net interest income) increased 3% Q/Q – Fallout - adjusted margin on consumer direct originations was approximately 271 bps (2) in 3Q15 – Loan origination fees increased 21% Q/Q due to a 24% increase in government correspondent acquisitions ▪ Weighted average fulfillment fee rate was 43 basis points, unchanged from 2Q15

Revenue Net loan servicing fees 57,258$ 68,549$ Net interest expense (12,889) (8,165) Net gains on mortgage loans held for sale at fair value 1,641 (2,422) Other 121 101 46,131 58,063 Expenses 52,187 60,508 Pretax income (6,056)$ (2,445)$ Servicing Segment Unaudited ($ in thousands) Quarter ended September 30 , 2015 Quarter ended June 30 , 2015 Mortgage Banking – Servicing Segment Results (1) Includes contractually - specified servicing fees 16 ▪ Net servicing fee revenue decreased 21% Q/Q, primarily driven by a $7.2 million fair value loss in the MSR carrying value net of gains from hedge and ESS liability fair value – MSR valuation losses resulted from declining interest rates and higher expectations for prepayments – Partially offset by a 16% Q/Q increase in servicing fees from a growing portfolio • Servicing segment expenses decreased 14% Q/Q – EBO - related expenses declined 46% Q/Q – Loss claims to the government agencies declined from elevated levels in 2Q15 Unaudited ($ in thousands) Net loan servicing fees: Loan servicing fees (1) 106,052$ 91,006$ Effect of MSRs: Amortization and realization of cash flows (41,594) (31,385) Change in fair value and provision for impairment of MSRs carried at lower of amortized cost or fair value (47,926) 44,378 Change in fair value of excess servicing spread financing 10,271 (7,133) Hedging gains (losses) 30,455 (28,317) Total amortization, impairment and change in fair value of MSRs (48,794) (22,457) Net loan servicing fees 57,258$ 68,549$ Net Loan Servicing Fees Quarter ended September 30 , 2015 Quarter ended June 30 , 2015
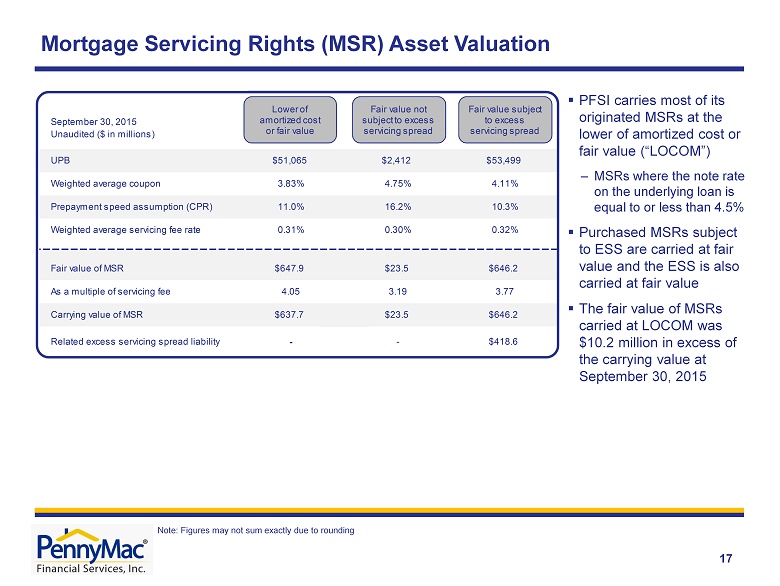
Mortgage Servicing Rights (MSR) Asset Valuation 17 ▪ PFSI carries most of its originated MSRs at the lower of amortized cost or fair value (“LOCOM”) – MSRs where the note rate on the underlying loan is equal to or less than 4.5 % ▪ Purchased MSRs subject to ESS are carried at fair value and the ESS is also carried at fair value ▪ The fair value of MSRs carried at LOCOM was $10.2 million in excess of the carrying value at September 30, 2015 Note: Figures may not sum exactly due to rounding UPB $51,065 $2,412 $53,499 Weighted average coupon 3.83% 4.75% 4.11% Prepayment speed assumption (CPR) 11.0% 16.2% 10.3% Weighted average servicing fee rate 0.31% 0.30% 0.32% Fair value of MSR $647.9 $23.5 $646.2 As a multiple of servicing fee 4.05 3.19 3.77 Carrying value of MSR $637.7 $23.5 $646.2 Related excess servicing spread liability - - $418.6 September 30, 2015 Unaudited ($ in millions) Lower of amortized cost or fair value Fair value not subject to excess servicing spread Fair value subject to excess servicing spread

Investment Management Segment Results 18 (1) 2 Q15 segment results were updated to reflect a change in the amount of incentive compensation allocated to each segment in measuring pretax income. Incentive compensation for executives and shared services is now charged to a segment based on its contribution to earnings rather than on usage of such executives and shared services. ▪ Segment revenue increased 13% Q/Q to $7.8 million Management fees: From PennyMac Mortgage Investment Trust 5,742$ 5,779$ From Investment Funds 714 1,184 6,456 6,963 Carried Interest from Investment Funds 1,483 182 Other (141) (223) 7,798 6,922 5,618 5,959 Pretax income 2,180$ 963$ Expenses Unaudited – (in thousands) Revenue Quarter ended September 30 , 2015 Quarter ended June 30 , 2015

Appendix

PennyMac Financial’s Business Model Is Well Positioned for Growth • Complex and highly regulated mortgage industry requires effective governance, compliance, and operating systems • PFSI’s platform has been developed organically and is highly scalable • Commitment to strong corporate governance, compliance, and risk management since inception • PFSI is well positioned for continued growth in this market and regulatory environment Loan Production Loan Servicing Investment Management • Servicing for owned MSRs and subservicing for Advised Entities • Major loan servicer for Fannie Mae, Freddie Mac and Ginnie Mae • Industry - leading capabilities in special servicing • Organic growth results from loan production, supplemented by MSR acquisitions and PMT investment activity • Serve as external manager for investment vehicles focused on investing in mortgage - related assets: – Distressed whole loans – MSRs and ESS – Investments in prime non - Agency loans – MBS and ABS – GSE risk transfers – Commercial real estate loans and securitization interests • Synergistic partnership with PMT • Correspondent aggregation of newly originated loans from third - party sellers – PFSI earns gains on government - insured loans – Fulfillment fees for PMT’s conventional and jumbo loans • Consumer - direct origination of conventional, government - insured and jumb o loans • Newly launched commercial mortgage origination business 20
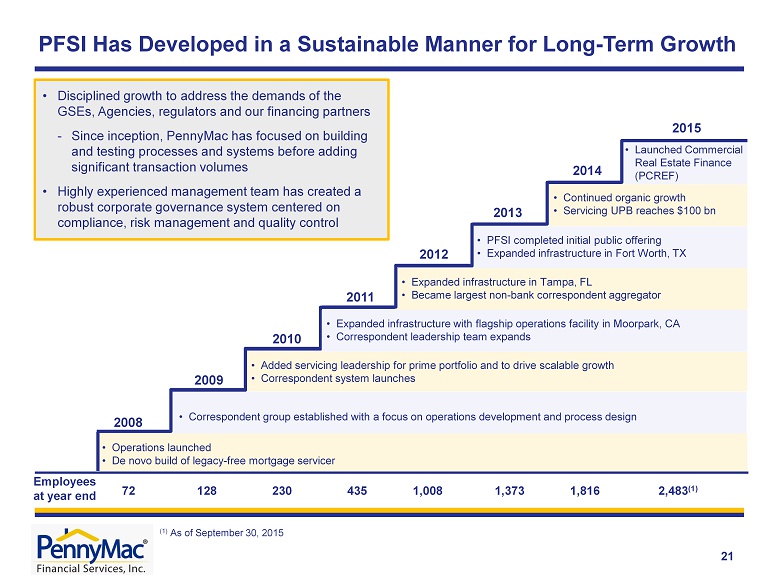
PFSI Has Developed in a Sustainable Manner for Long - Term Growth 72 128 230 435 1,008 1, 373 1,816 2,483 (1) • Operations launched • De novo build of legacy - free mortgage servicer 2008 E mployees at year end 21 2009 2010 2011 2012 2013 2014 2015 • Correspondent group established with a focus on operations development and process design • Added servicing leadership for prime portfolio and to drive scalable growth • Correspondent system launches • Expanded infrastructure with flagship operations facility in Moorpark, CA • Correspondent leadership team expands • Expanded infrastructure in Tampa, FL • Became largest non - bank correspondent aggregator • PFSI completed initial public offering • Expanded infrastructure in Fort Worth, TX • Continued organic growth • Servicing UPB reaches $100 bn • Launched Commercial Real Estate Finance (PCREF) • Disciplined growth to address the demands of the GSEs, Agencies, regulators and our financing partners - Since inception, PennyMac has focused on building and testing processes and systems before adding significant transaction volumes • Highly experienced management team has created a robust corporate governance system centered on compliance, risk management and quality control (1) As of September 30, 2015

22 PennyMac Financial Is in a Unique Position Among Mortgage Specialists Industry - leading platform built organically – not through acquisitions • Not distracted by legacy/regulatory issues • Disciplined, sustainable growth for more than 7 years • Focused on building and testing processes and systems before large transaction volumes Distinctive expertise and full range of capabilities across mortgage banking and investment management Loan production , e.g., loan fulfillment systems and operations, correspondent counterparty review and management Credit , e.g., loan program development, underwriting and quality control Capital markets , e.g., pooling and securitization, hedging/interest rate risk management Servicing , e.g., customer service, default management, investor accounting Corporate functions , e.g., enterprise risk management, internal audit, treasury, finance and accounting, legal, IT infrastructure and development • Over 2,400 employees • Highly experienced management team – 60 senior - most executives have on average 25 years of relevant industry experience Strong governance and compliance culture • Led by distinguished board which includes seven independent Directors • Robust management governance structure with 10 committees that oversee key risks and controls • External oversight by regulators, business partners and other third parties Desired structure in place to compete effectively as a non - bank • Synergistic partnership with PMT, a leading residential mortgage REIT and long - term investment vehicle • Provides access to efficient capital and reduces balance sheet constraints on growth

Opportunity for PFSI and PMT in MSR Acquisitions 23 Why Are MSR Sales Occurring? How Do MSRs Come to Market? • Large servicers may sell MSRs due to continuing operational pressures, higher regulatory capital requirements for banks (treatment under Basel III) and a re - focus on core customers/businesses • Independent mortgage banks sell MSRs from time to time due to a need for capital • Intermittent large bulk portfolio sales ($10+ billion in UPB) – Require considerable coordination with selling institutions and Agencies • Mini - bulk sales (typically $500 million to $5 billion in UPB) – Increased activity as originators sell MSRs retained in 2012 and 2013 • Flow/co - issue MSR transactions (monthly commitments, typically $20 - 100 million in UPB) – Alternative delivery method typically from larger independent originators Which MSR Transactions Are Attractive? • GSE and Ginnie Mae servicing in which PFSI has distinctive expertise • MSRs sold and operational servicing transferred to PFSI (not subserviced by a third party) • Measurable rep and warranty liability for PFSI PFSI is uniquely positioned to be a successful acquirer of MSRs • Proven track record of complex MSR and distressed loan transfers • Operational platform that addresses the demands of the Agencies, regulators, and financing partners • Physical capacity in place to service over $200 billion in UPB • Co - investment opportunity for PMT in the excess servicing spread
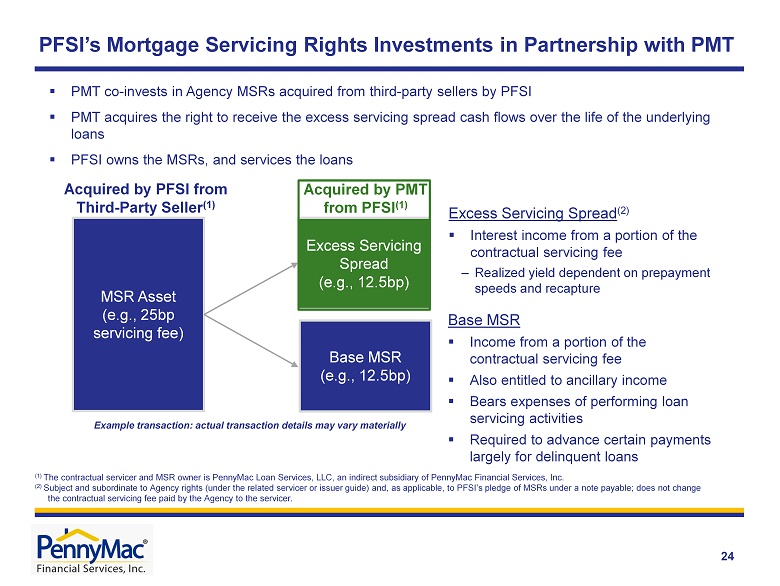
24 PFSI’s Mortgage Servicing Rights Investments in Partnership with PMT Excess Servicing Spread (e.g., 12.5bp) MSR Asset (e.g., 25bp servicing fee) Acquired by PFSI from Third - Party Seller (1) ▪ PMT co - invests in Agency MSRs acquired from third - party sellers by PFSI ▪ PMT acquires the right to receive the excess servicing spread cash flows over the life of the underlying loans ▪ PFSI owns the MSRs, and services the loans (1) The contractual servicer and MSR owner is PennyMac Loan Services, LLC, an indirect subsidiary of PennyMac Financial Services, Inc. (2) Subject and subordinate to Agency rights (under the related servicer or issuer guide ) and, as applicable, to PFSI’s pledge of MSRs under a note payable; does not change the contractual servicing fee paid by the Agency to the servicer. Excess Servicing Spread (2) ▪ Interest income from a portion of the contractual servicing fee – Realized yield dependent on prepayment speeds and recapture Base MSR ▪ Income from a portion of the contractual servicing fee ▪ Also entitled to ancillary income ▪ Bears expenses of performing loan servicing activities ▪ Required to advance certain payments largely for delinquent loans Base MSR (e.g., 12.5bp) Acquired by PMT from PFSI (1) Example transaction: actual transaction details may vary materially

Acquisitions, Originations, and Locks by Product 25 Note: Figures may not sum exactly due to rounding Unaudited ($ in millions) Correspondent Acquisitions Conventional 3,509$ 2,772$ 2,831$ 3,553$ 4,055$ Government 4,378 4,389 5,106 8,316 10,348 Jumbo 169 116 59 26 19 Total 8,056$ 7,276$ 7,996$ 11,895$ 14,422$ Correspondent Locks Conventional 3,554$ 2,844$ 3,433$ 4,404$ 4,085$ Government 4,621 4,473 6,010 9,936 9,483 Jumbo 199 172 70 41 32 Total 8,373$ 7,489$ 9,512$ 14,381$ 13,599$ Consumer Direct Originations Conventional 180$ 232$ 274$ 256$ 163$ Government 342 444 620 880 877 Jumbo 5 7 3 2 1 Total 527$ 682$ 897$ 1,138$ 1,042$ Consumer Direct Locks Conventional 446$ 621$ 630$ 348$ 390$ Government 567 800 1,147 1,300 1,363 Jumbo 11 14 7 5 2 Total 1,024$ 1,435$ 1,784$ 1,652$ 1,755$ Total acquisitions/originations 8,582$ 7,958$ 8,893$ 13,033$ 15,464$ Total locks 9,397$ 8,924$ 11,296$ 16,034$ 15,354$ UPB of loans fulfilled for PMT 4,073$ 3,579$ 2,890$ 2,887$ 3,678$ 3Q14 4Q14 1Q15 2Q15 3Q15