Attached files
| file | filename |
|---|---|
| 8-K - 8-K - Matador Resources Co | mtdr-20150930er8xk.htm |
| EX-99.1 - EXHIBIT 99.1 - Matador Resources Co | mtdr-20150930er8kxexhibit9.htm |
November 4, 2015 Third Quarter 2015 Earnings Release NYSE: MTDR Exhibit 99.2
Disclosure Statements 2 Safe Harbor Statement – This presentation and statements made by representatives of Matador Resources Company (“Matador” or the “Company”) during the course of this presentation include “forward-looking statements” within the meaning of Section 27A of the Securities Act of 1933, as amended, and Section 21E of the Securities Exchange Act of 1934, as amended. “Forward-looking statements” are statements related to future, not past, events. Forward-looking statements are based on current expectations and include any statement that does not directly relate to a current or historical fact. In this context, forward-looking statements often address expected future business and financial performance, and often contain words such as “could,” “believe,” “would,” “anticipate,” “intend,” “estimate,” “expect,” “may,” “should,” “continue,” “plan,” “predict,” “potential,” “project” and similar expressions that are intended to identify forward-looking statements, although not all forward- looking statements contain such identifying words. Actual results and future events could differ materially from those anticipated in such statements, and such forward-looking statements may not prove to be accurate. These forward-looking statements involve certain risks and uncertainties, including, but not limited to, the following risks related to Matador’s financial and operational performance: general economic conditions; Matador’s ability to execute its business plan, including whether Matador’s drilling program is successful; changes in oil, natural gas and natural gas liquids prices and the demand for oil, natural gas and natural gas liquids; Matador’s ability to replace reserves and efficiently develop its current reserves; Matador’s costs of operations, delays and other difficulties related to producing oil, natural gas and natural gas liquids; Matador’s ability to integrate the assets, employees and operations of Harvey E. Yates Company following its merger with one of Matador’s wholly-owned subsidiaries on February 27, 2015; Matador’s ability to make other acquisitions on economically acceptable terms; availability of sufficient capital to execute Matador’s business plan, including from its future cash flows, increases in Matador’s borrowing base and otherwise; weather and environmental conditions; and other important factors which could cause actual results to differ materially from those anticipated or implied in the forward-looking statements. For further discussions of risks and uncertainties, you should refer to Matador’s SEC filings, including the “Risk Factors” section of Matador’s most recent Annual Report on Form 10-K and any subsequent Quarterly Reports on Form 10-Q. Matador undertakes no obligation and does not intend to update these forward-looking statements to reflect events or circumstances occurring after the date of this presentation, except as required by law, including the securities laws of the United States and the rules and regulations of the SEC. You are cautioned not to place undue reliance on these forward-looking statements, which speak only as of the date of this presentation. All forward-looking statements are qualified in their entirety by this cautionary statement. Cautionary Note – The Securities and Exchange Commission (SEC) permits oil and gas companies, in their filings with the SEC, to disclose only proved, probable and possible reserves. Potential resources are not proved, probable or possible reserves. The SEC’s guidelines prohibit Matador from including such information in filings with the SEC. Definitions – Proved oil and natural gas reserves are the estimated quantities of oil and natural gas that geological and engineering data demonstrate with reasonable certainty to be recoverable in future years from known reservoirs under existing economic and operating conditions. Matador’s production and proved reserves are reported in two streams: oil and natural gas, including both dry and liquids-rich natural gas. Where Matador produces liquids-rich natural gas, the economic value of the natural gas liquids associated with the natural gas is included in the estimated wellhead natural gas price on those properties where the natural gas liquids are extracted and sold. Estimated ultimate recovery (EUR) is a measure that by its nature is more speculative than estimates of proved reserves prepared in accordance with SEC definitions and guidelines and is accordingly less certain.
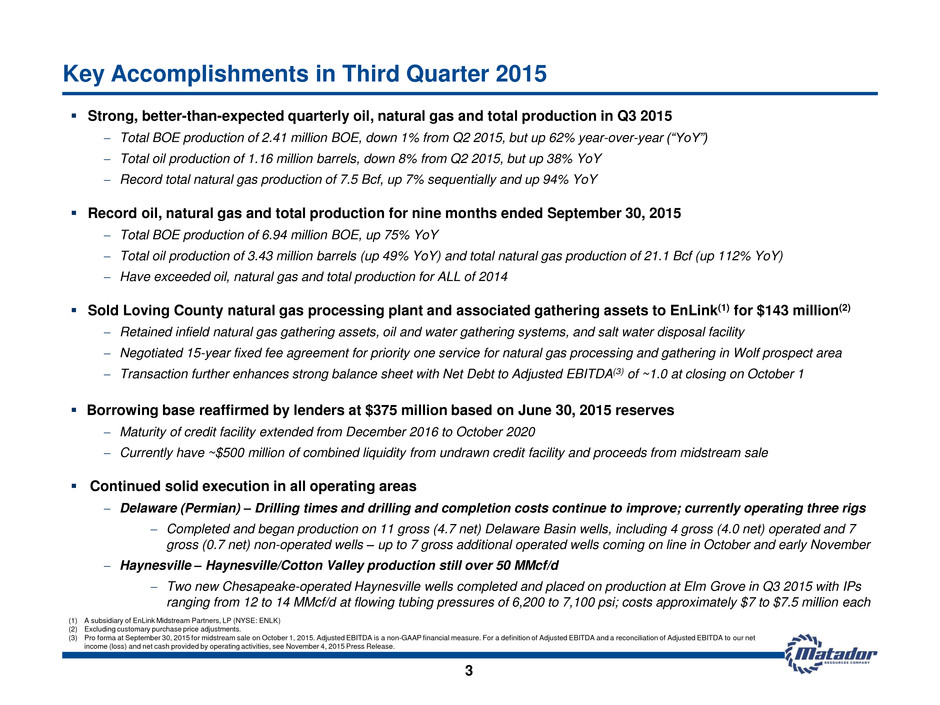
Key Accomplishments in Third Quarter 2015 3 Strong, better-than-expected quarterly oil, natural gas and total production in Q3 2015 Total BOE production of 2.41 million BOE, down 1% from Q2 2015, but up 62% year-over-year (“YoY”) Total oil production of 1.16 million barrels, down 8% from Q2 2015, but up 38% YoY Record total natural gas production of 7.5 Bcf, up 7% sequentially and up 94% YoY Record oil, natural gas and total production for nine months ended September 30, 2015 Total BOE production of 6.94 million BOE, up 75% YoY Total oil production of 3.43 million barrels (up 49% YoY) and total natural gas production of 21.1 Bcf (up 112% YoY) Have exceeded oil, natural gas and total production for ALL of 2014 Sold Loving County natural gas processing plant and associated gathering assets to EnLink(1) for $143 million(2) Retained infield natural gas gathering assets, oil and water gathering systems, and salt water disposal facility Negotiated 15-year fixed fee agreement for priority one service for natural gas processing and gathering in Wolf prospect area Transaction further enhances strong balance sheet with Net Debt to Adjusted EBITDA(3) of ~1.0 at closing on October 1 Borrowing base reaffirmed by lenders at $375 million based on June 30, 2015 reserves Maturity of credit facility extended from December 2016 to October 2020 Currently have ~$500 million of combined liquidity from undrawn credit facility and proceeds from midstream sale Continued solid execution in all operating areas Delaware (Permian) – Drilling times and drilling and completion costs continue to improve; currently operating three rigs Completed and began production on 11 gross (4.7 net) Delaware Basin wells, including 4 gross (4.0 net) operated and 7 gross (0.7 net) non-operated wells – up to 7 gross additional operated wells coming on line in October and early November Haynesville – Haynesville/Cotton Valley production still over 50 MMcf/d Two new Chesapeake-operated Haynesville wells completed and placed on production at Elm Grove in Q3 2015 with IPs ranging from 12 to 14 MMcf/d at flowing tubing pressures of 6,200 to 7,100 psi; costs approximately $7 to $7.5 million each (1) A subsidiary of EnLink Midstream Partners, LP (NYSE: ENLK) (2) Excluding customary purchase price adjustments. (3) Pro forma at September 30, 2015 for midstream sale on October 1, 2015. Adjusted EBITDA is a non-GAAP financial measure. For a definition of Adjusted EBITDA and a reconciliation of Adjusted EBITDA to our net income (loss) and net cash provided by operating activities, see November 4, 2015 Press Release.
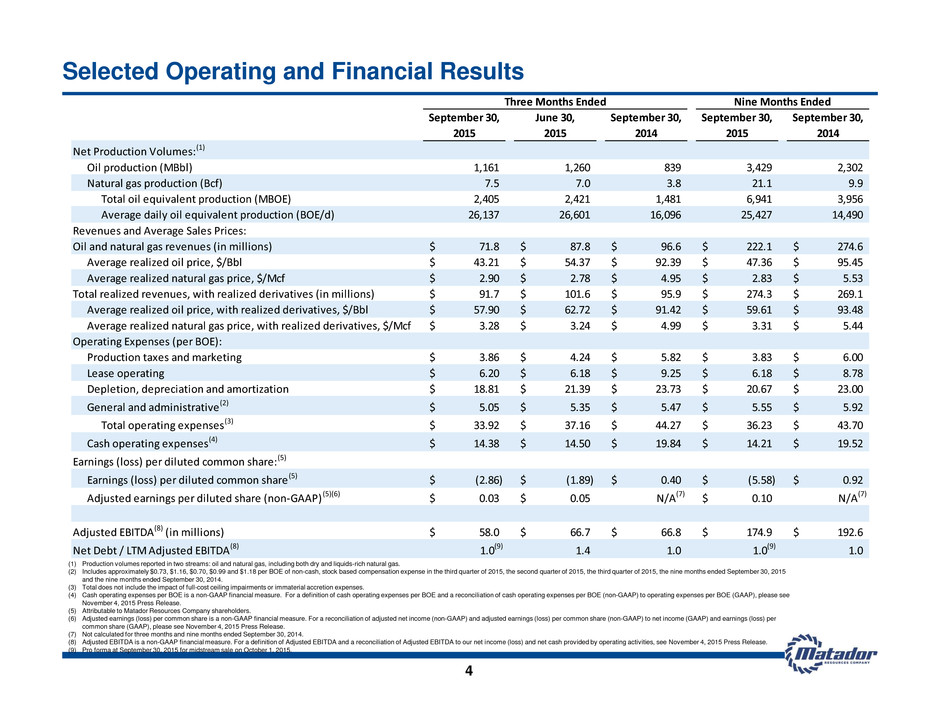
September 30, June 30, September 30, September 30, September 30, 2015 2015 2014 2015 2014 Net Production Volumes:(1) Oil production (MBbl) 1,161 1,260 839 3,429 2,302 Natural gas production (Bcf) 7.5 7.0 3.8 21.1 9.9 Total oil equivalent production (MBOE) 2,405 2,421 1,481 6,941 3,956 Average daily oil equivalent production (BOE/d) 26,137 26,601 16,096 25,427 14,490 Revenues and Average Sales Prices: Oil and natural gas revenues (in millions) 71.8$ 87.8$ 96.6$ 222.1$ 274.6$ Average realized oil price, $/Bbl 43.21$ 54.37$ 92.39$ 47.36$ 95.45$ Average realized natural gas price, $/Mcf 2.90$ 2.78$ 4.95$ 2.83$ 5.53$ Total realized revenues, with realized derivatives (in millions) 91.7$ 101.6$ 95.9$ 274.3$ 269.1$ Average realized oil price, with realized derivatives, $/Bbl 57.90$ 62.72$ 91.42$ 59.61$ 93.48$ Average realized natural gas price, with realized derivatives, $/Mcf 3.28$ 3.24$ 4.99$ 3.31$ 5.44$ Operating Expenses (per BOE): Production taxes and marketing 3.86$ 4.24$ 5.82$ 3.83$ 6.00$ Lease operating 6.20$ 6.18$ 9.25$ 6.18$ 8.78$ Depletion, depreciation and amortization 18.81$ 21.39$ 23.73$ 20.67$ 23.00$ General and administrative(2) 5.05$ 5.35$ 5.47$ 5.55$ 5.92$ Total operating expenses(3) 33.92$ 37.16$ 44.27$ 36.23$ 43.70$ Cash operating expenses(4) 14.38$ 14.50$ 19.84$ 14.21$ 19.52$ Earnings (loss) per diluted common share:(5) Earnings (loss) per diluted common share (5) (2.86)$ (1.89)$ 0.40$ (5.58)$ 0.92$ Adjusted earnings per diluted share (non-GAAP) (5)(6) 0.03$ 0.05$ N/A(7) 0.10$ N/A(7) Adjusted EBITDA(8) (in millions) 58.0$ 66.7$ 66.8$ 174.9$ 192.6$ Net Debt / LTM Adjusted EBITDA(8) 1.0(9) 1.4 1.0 1.0(9) 1.0 Three Months Ended Nine Months Ended Selected Operating and Financial Results 4 (1) Production volumes reported in two streams: oil and natural gas, including both dry and liquids-rich natural gas. (2) Includes approximately $0.73, $1.16, $0.70, $0.99 and $1.18 per BOE of non-cash, stock based compensation expense in the third quarter of 2015, the second quarter of 2015, the third quarter of 2015, the nine months ended September 30, 2015 and the nine months ended September 30, 2014. (3) Total does not include the impact of full-cost ceiling impairments or immaterial accretion expenses. (4) Cash operating expenses per BOE is a non-GAAP financial measure. For a definition of cash operating expenses per BOE and a reconciliation of cash operating expenses per BOE (non-GAAP) to operating expenses per BOE (GAAP), please see November 4, 2015 Press Release. (5) Attributable to Matador Resources Company shareholders. (6) Adjusted earnings (loss) per common share is a non-GAAP financial measure. For a reconciliation of adjusted net income (non-GAAP) and adjusted earnings (loss) per common share (non-GAAP) to net income (GAAP) and earnings (loss) per common share (GAAP), please see November 4, 2015 Press Release. (7) Not calculated for three months and nine months ended September 30, 2014. (8) Adjusted EBITDA is a non-GAAP financial measure. For a definition of Adjusted EBITDA and a reconciliation of Adjusted EBITDA to our net income (loss) and net cash provided by operating activities, see November 4, 2015 Press Release. (9) Pro forma at September 30, 2015 for midstream sale on October 1, 2015.
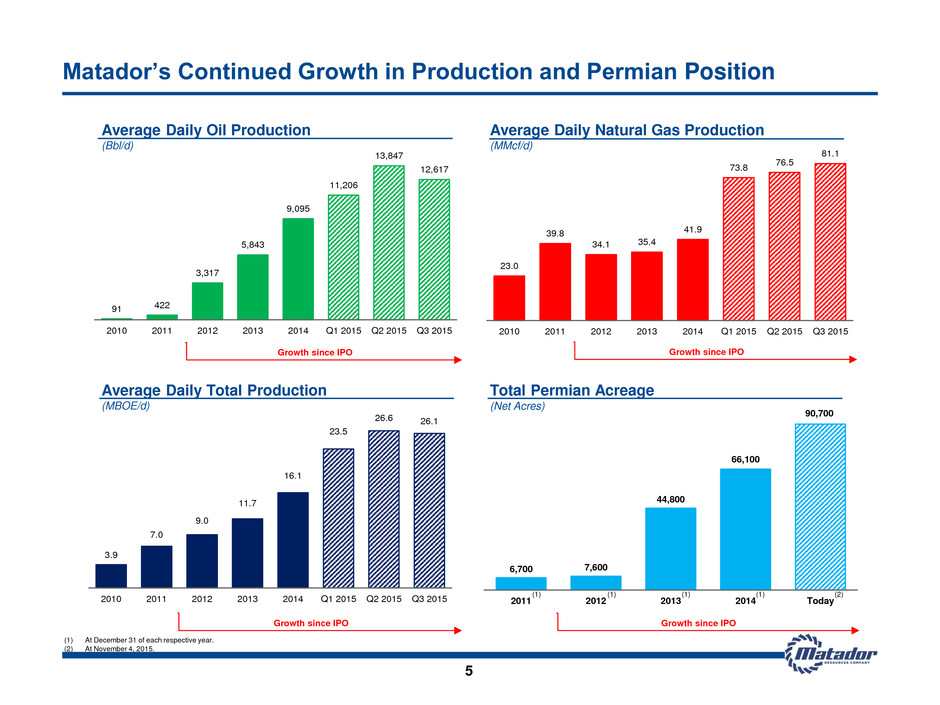
Matador’s Continued Growth in Production and Permian Position Average Daily Oil Production (Bbl/d) Average Daily Natural Gas Production (MMcf/d) Average Daily Total Production (MBOE/d) Total Permian Acreage (Net Acres) Growth since IPO Growth since IPO Growth since IPO Growth since IPO 3.9 7.0 9.0 11.7 16.1 23.5 26.6 26.1 2010 2011 2012 2013 2014 Q1 2015 Q2 2015 Q3 2015 91 422 3,317 5,843 9,095 11,206 13,847 12,617 2010 2011 2012 2013 2014 Q1 2015 Q2 2015 Q3 2015 23.0 39.8 34.1 35.4 41.9 73.8 76.5 81.1 2010 1 2 2013 2014 Q1 2015 Q2 2015 Q3 2015 6,700 7,600 44,800 66,100 90,700 2011 2 2013 2014 Today (1) (1) (1) (1) (2) (1) At December 31 of each respective year. (2) At November 4, 2015. 5
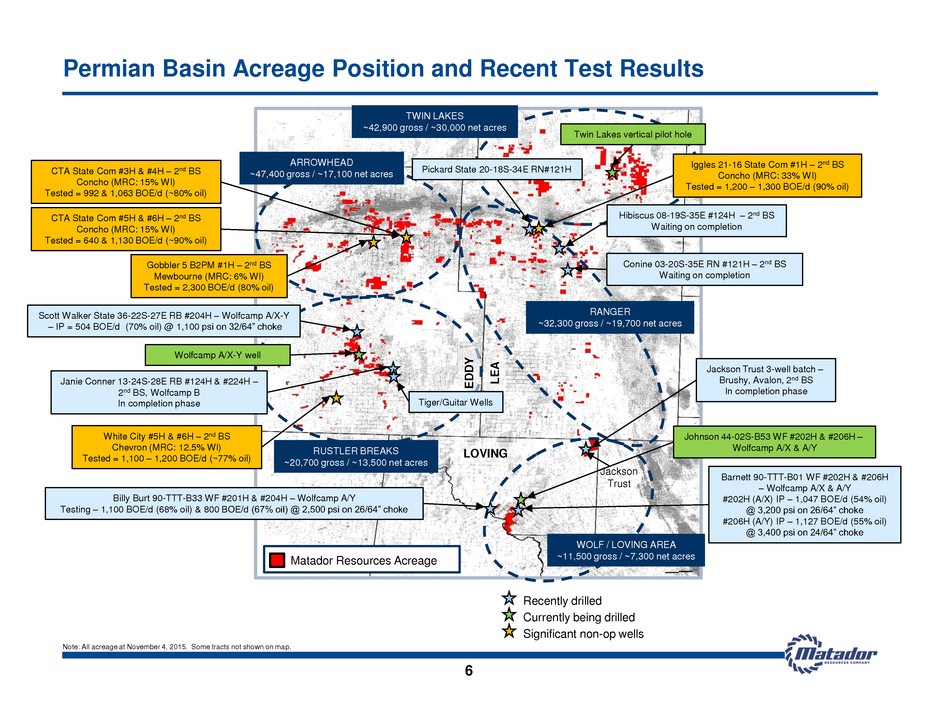
Permian Basin Acreage Position and Recent Test Results Note: All acreage at November 4, 2015. Some tracts not shown on map. 6 L E A LOVING WARD Matador Resources Acreage TWIN LAKES ~42,900 gross / ~30,000 net acres WOLF / LOVING AREA ~11,500 gross / ~7,300 net acres Jackson Trust RANGER ~32,300 gross / ~19,700 net acres ARROWHEAD ~47,400 gross / ~17,100 net acres E D D Y RUSTLER BREAKS ~20,700 gross / ~13,500 net acres Tiger/Guitar Wells Jackson Trust 3-well batch – Brushy, Avalon, 2nd BS In completion phase Hibiscus 08-19S-35E #124H – 2nd BS Waiting on completion Conine 03-20S-35E RN #121H – 2nd BS Waiting on completion Johnson 44-02S-B53 WF #202H & #206H – Wolfcamp A/X & A/Y Recently drilled Currently being drilled Significant non-op wells CTA State Com #3H & #4H – 2nd BS Concho (MRC: 15% WI) Tested = 992 & 1,063 BOE/d (~80% oil) White City #5H & #6H – 2nd BS Chevron (MRC: 12.5% WI) Tested = 1,100 – 1,200 BOE/d (~77% oil) 1 2 3 4 5 6 7 8 9 10 11 12 13 14 15 16 19 20 17 18 Iggles 21-16 State Com #1H – 2nd BS Concho (MRC: 33% WI) Tested = 1,200 – 1,300 BOE/d (90% oil) Gobbler 5 B2PM #1H – 2nd BS Mewbourne (MRC: 6% WI) Tested = 2,300 BOE/d (80% oil) Scott Walker State 36-22S-27E RB #204H – Wolfcamp A/X-Y – IP = 504 BOE/d (70% oil) @ 1,100 psi on 32/64” choke Janie Conner 13-24S-28E RB #124H & #224H – 2nd BS, Wolfcamp B In completion phase CTA State Com #5H & #6H – 2nd BS Concho (MRC: 15% WI) Tested = 640 & 1,130 BOE/d (~90% oil) Billy Burt 90-TTT-B33 WF #201H & #204H – Wolfcamp A/Y Testing – 1,100 BOE/d (68% oil) & 800 BOE/d (67% oil) @ 2,500 psi on 26/64” choke Barnett 90-TTT-B01 WF #202H & #206H – Wolfcamp A/X & A/Y #202H (A/X) IP – 1,047 BOE/d (54% oil) @ 3,200 psi on 26/64” choke #206H (A/Y) IP – 1,127 BOE/d (55% oil) @ 3,400 psi on 24/64” choke Twin Lakes vertical pilot hole Wolfcamp A/X-Y well Pickard State 20-18S-34E RN#121H
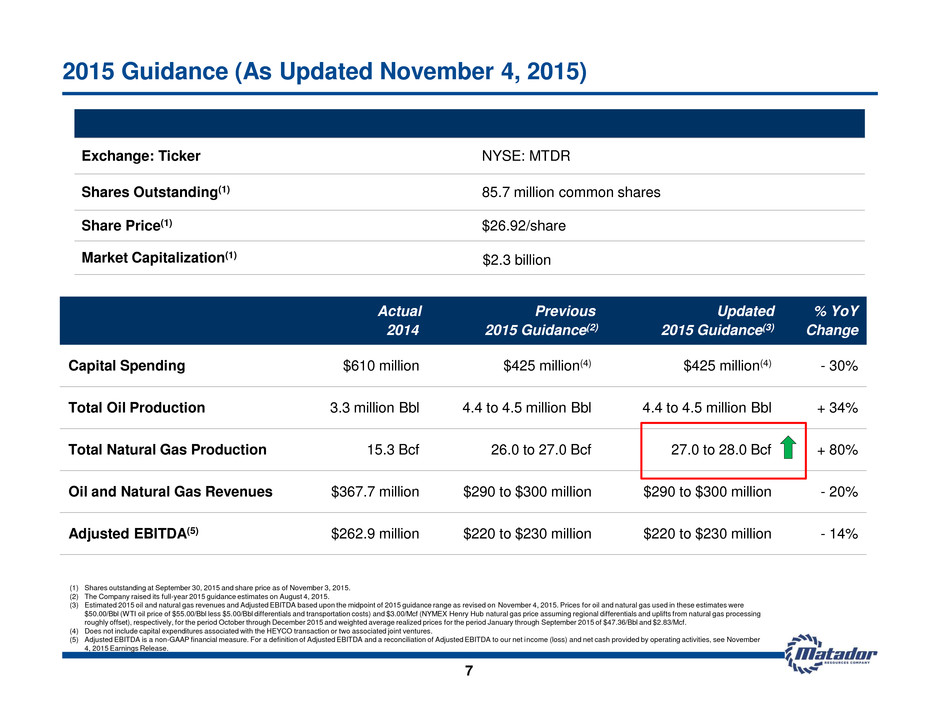
Actual Previous Updated % YoY 2014 2015 Guidance(2) 2015 Guidance(3) Change Capital Spending $610 million $425 million(4) $425 million(4) - 30% Total Oil Production 3.3 million Bbl 4.4 to 4.5 million Bbl 4.4 to 4.5 million Bbl + 34% Total Natural Gas Production 15.3 Bcf 26.0 to 27.0 Bcf 27.0 to 28.0 Bcf + 80% Oil and Natural Gas Revenues $367.7 million $290 to $300 million $290 to $300 million - 20% Adjusted EBITDA(5) $262.9 million $220 to $230 million $220 to $230 million - 14% 7 2015 Guidance (As Updated November 4, 2015) (1) Shares outstanding at September 30, 2015 and share price as of November 3, 2015. (2) The Company raised its full-year 2015 guidance estimates on August 4, 2015. (3) Estimated 2015 oil and natural gas revenues and Adjusted EBITDA based upon the midpoint of 2015 guidance range as revised on November 4, 2015. Prices for oil and natural gas used in these estimates were $50.00/Bbl (WTI oil price of $55.00/Bbl less $5.00/Bbl differentials and transportation costs) and $3.00/Mcf (NYMEX Henry Hub natural gas price assuming regional differentials and uplifts from natural gas processing roughly offset), respectively, for the period October through December 2015 and weighted average realized prices for the period January through September 2015 of $47.36/Bbl and $2.83/Mcf. (4) Does not include capital expenditures associated with the HEYCO transaction or two associated joint ventures. (5) Adjusted EBITDA is a non-GAAP financial measure. For a definition of Adjusted EBITDA and a reconciliation of Adjusted EBITDA to our net income (loss) and net cash provided by operating activities, see November 4, 2015 Earnings Release. Exchange: Ticker NYSE: MTDR Shares Outstanding(1) 85.7 million common shares Share Price(1) $26.92/share Market Capitalization(1) $2.3 billion
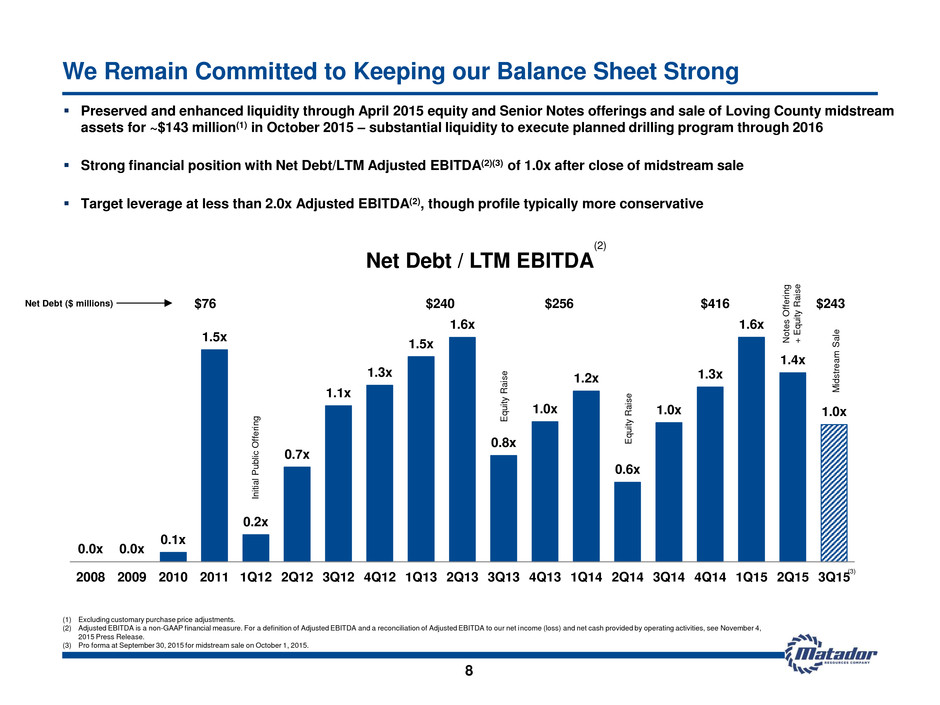
0.0x 0.0x 0.1x 1.5x 0.2x 0.7x 1.1x 1.3x 1.5x 1.6x 0.8x 1.0x 1.2x 0.6x 1.0x 1.3x 1.6x 1.4x 1.0x 2008 2009 2010 2011 1Q12 2Q12 3Q12 4Q12 1Q13 2Q13 3Q13 4Q13 1Q14 2Q14 3Q14 4Q14 1Q15 2Q15 3Q15 Net Debt / LTM EBITDA $76 $240 $256 $416 $243 In itial P u b lic O ff e rin g Preserved and enhanced liquidity through April 2015 equity and Senior Notes offerings and sale of Loving County midstream assets for ~$143 million(1) in October 2015 – substantial liquidity to execute planned drilling program through 2016 Strong financial position with Net Debt/LTM Adjusted EBITDA(2)(3) of 1.0x after close of midstream sale Target leverage at less than 2.0x Adjusted EBITDA(2), though profile typically more conservative We Remain Committed to Keeping our Balance Sheet Strong 8 (1) Excluding customary purchase price adjustments. (2) Adjusted EBITDA is a non-GAAP financial measure. For a definition of Adjusted EBITDA and a reconciliation of Adjusted EBITDA to our net income (loss) and net cash provided by operating activities, see November 4, 2015 Press Release. (3) Pro forma at September 30, 2015 for midstream sale on October 1, 2015. E q u it y Rais e E q u it y Rais e No te s O ff e rin g + E q u it y Rais e (2) Net Debt ($ millions) (3) M ids tr e a m S a le
