Attached files
| file | filename |
|---|---|
| 8-K - FORM 8-K - Four Corners Property Trust, Inc. | fcptoct30slides8-k.htm |
| FOUR CORNERS PROPERTY TRUST | OCTOBER 2015 1 INVESTOR PRESENTATION | OCTOBER 2015 www.fourcornerspropertytrust . com FOUR CORNERS PROPERTY TRUST N YS E : F C P T
| FOUR CORNERS PROPERTY TRUST | OCTOBER 2015 2 FORWARD LOOKING STATEMENTS AND DISCLAIMERS Forward Looking Statements This presentation contains forward-looking statements regarding the Company’s expected future financial condition, results of operations, cash flows, funds from operations, business strategies, operating metrics, competitive positions, which are made under the Safe Harbor provisions of the Private Securities Litigation Reform Act of 1995, growth opportunities and other matters. The words “believe”, “expect”, “anticipate”, “intend”, “may”, “could”, “should”, “will”, and other similar expressions, generally identify such forward- looking statements, which speak only as of the date of this presentation. Financial information presented on an “annualized” basis also constitute forward-looking statements. The matters discussed in these forward-looking statements are subject to various risks, uncertainties and other factors that could cause actual results to differ materially from those projected, anticipated or implied in the forward-looking statements. Where, in any forward-looking statement, an expectation or belief as to future results or events is expressed, such expectation or belief is based on the current plans and expectations of Company management and expressed in good faith and believed to have a reasonable basis, but there can be no assurance that the expectation or belief will result or be achieved or accomplished. In addition, “annualized” financial information may not reflect our actual results, which may vary to a material extent. Factors that could cause actual results or events to differ materially from those anticipated are described in the Company’s Information Statement which forms part of the Company’s Registration Statement on Form 10 under the heading “Risk Factors.” There is no assurance that the Spin-Off transaction described herein and in the Information Statement which forms part of the Company’s Form 10 will be completed, and there are a number of risks and uncertainties that could cause actual results to differ materially from the forward-looking statements made herein relating to the Spin-Off transaction. These risks and uncertainties include, but are not limited to: • The ability to achieve some or all the benefits that we expect to achieve from the Spin-Off; • The ability and willingness of Darden Restaurants, Inc. (“Darden”) to meet and/or perform its obligations under any contractual arrangements that are entered into with us in connection with the Spin-Off, including the Leases and any of its obligations to indemnify, defend and hold us harmless from and against various claims, litigation and liabilities; • The ability of Darden to comply with laws, rules and regulations in the operation of the Four Corners Properties we will lease to Darden following the Spin-Off; • The ability and willingness of our tenants, including Darden, to perform under the Leases and to renew the leases with us upon their expiration, and the ability to reposition our properties on the same or better terms in the event of nonrenewal or in the event we replace an existing tenant, and obligations, including indemnification obligations, we may incur in connection with the replacement of an existing tenant; • The availability of and the ability to identify suitable acquisition opportunities and the ability to diversify by acquiring and leasing the additional properties on favorable terms; • The ability to generate sufficient cash flows to service our outstanding indebtedness; • Access to debt and equity capital markets; • Fluctuating interest rates; • The ability to retain our key management personnel; • The ability to qualify or maintain our status as a REIT; • Changes in the U.S. tax law and other state, federal or local laws, whether or not specific to REITs; and • Other risks inherent in the Four Corners Property Trust, including illiquidity of real estate investments. Forward-looking statements speak only as of the date of this presentation. Except in the normal course of our public disclosure obligations, we expressly disclaim any obligation to publicly release any updates or revisions to any forward-looking statements to reflect any change in our expectations or any change in events, conditions or circumstances on which any statement is based. Non GAAP Information The information in this communication includes financial information determined by methods other than in accordance with accounting principles generally accepted in the United States of America (“GAAP”), such as adjusted net earnings per diluted share from continuing operations. The Company’s management uses these non-GAAP measures in its analysis of the Company’s performance. The Company believes that the presentation of certain non-GAAP measures provides useful supplemental information that is essential to a proper understanding of the operating results of the Company’s businesses. These non-GAAP disclosures should not be viewed as a substitute for operating results determined in accordance with GAAP, nor are they necessarily comparable to non-GAAP performance measures that may be presented by other companies.
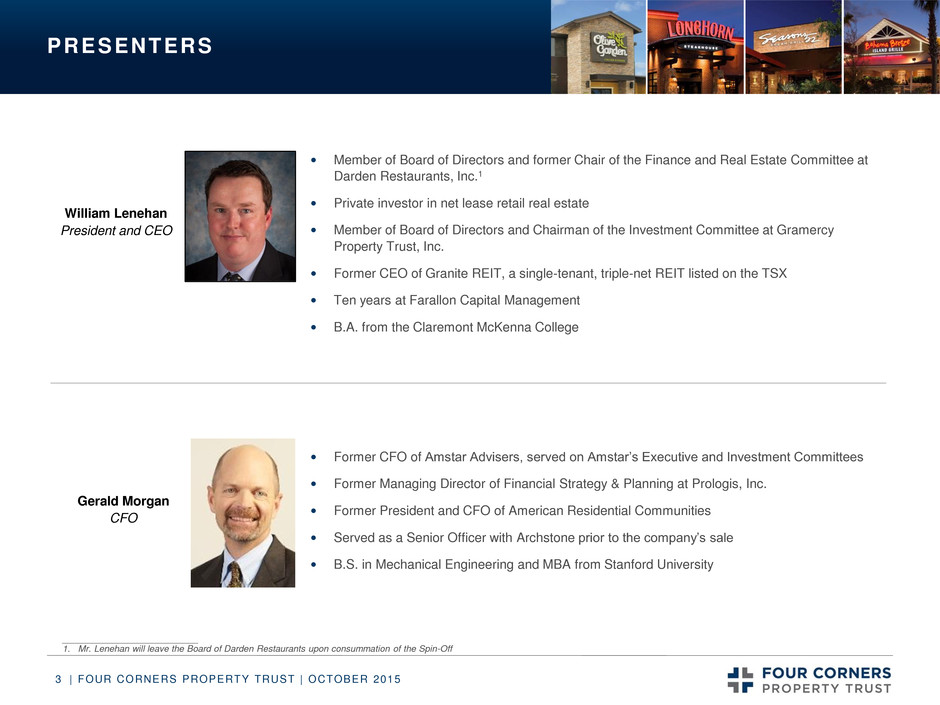
| FOUR CORNERS PROPERTY TRUST | OCTOBER 2015 3 PRESENTERS William Lenehan President and CEO Gerald Morgan CFO Member of Board of Directors and former Chair of the Finance and Real Estate Committee at Darden Restaurants, Inc.1 Private investor in net lease retail real estate Member of Board of Directors and Chairman of the Investment Committee at Gramercy Property Trust, Inc. Former CEO of Granite REIT, a single-tenant, triple-net REIT listed on the TSX Ten years at Farallon Capital Management B.A. from the Claremont McKenna College Former CFO of Amstar Advisers, served on Amstar’s Executive and Investment Committees Former Managing Director of Financial Strategy & Planning at Prologis, Inc. Former President and CFO of American Residential Communities Served as a Senior Officer with Archstone prior to the company’s sale B.S. in Mechanical Engineering and MBA from Stanford University ___________________________ 1. Mr. Lenehan will leave the Board of Darden Restaurants upon consummation of the Spin-Off
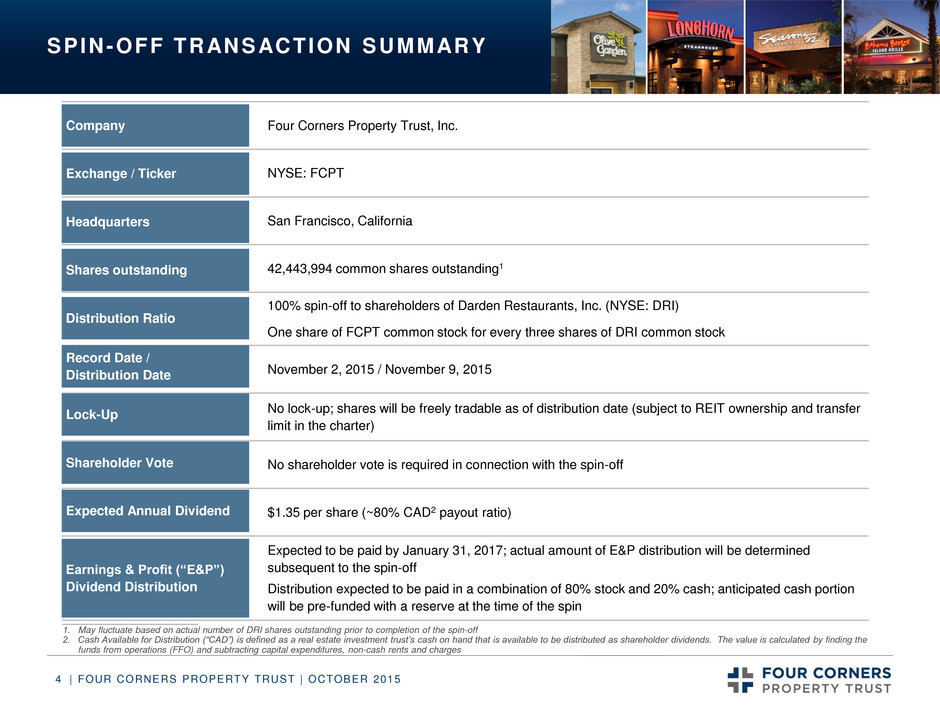
| FOUR CORNERS PROPERTY TRUST | OCTOBER 2015 4 `` Four Corners Property Trust, Inc. NYSE: FCPT San Francisco, California 42,443,994 common shares outstanding1 100% spin-off to shareholders of Darden Restaurants, Inc. (NYSE: DRI) One share of FCPT common stock for every three shares of DRI common stock November 2, 2015 / November 9, 2015 No lock-up; shares will be freely tradable as of distribution date (subject to REIT ownership and transfer limit in the charter) No shareholder vote is required in connection with the spin-off $1.35 per share (~80% CAD2 payout ratio) Expected to be paid by January 31, 2017; actual amount of E&P distribution will be determined subsequent to the spin-off Distribution expected to be paid in a combination of 80% stock and 20% cash; anticipated cash portion will be pre-funded with a reserve at the time of the spin SPIN-OFF TRANSACTION SUMMARY Company Headquarters Distribution Ratio Record Date / Distribution Date Lock-Up Shareholder Vote Expected Annual Dividend Exchange / Ticker ___________________________ 1. May fluctuate based on actual number of DRI shares outstanding prior to completion of the spin-off 2. Cash Available for Distribution (“CAD”) is defined as a real estate investment trust’s cash on hand that is available to be distributed as shareholder dividends. The value is calculated by finding the funds from operations (FFO) and subtracting capital expenditures, non-cash rents and charges Earnings & Profit (“E&P”) Dividend Distribution Shares outstanding Impacted by revolver size
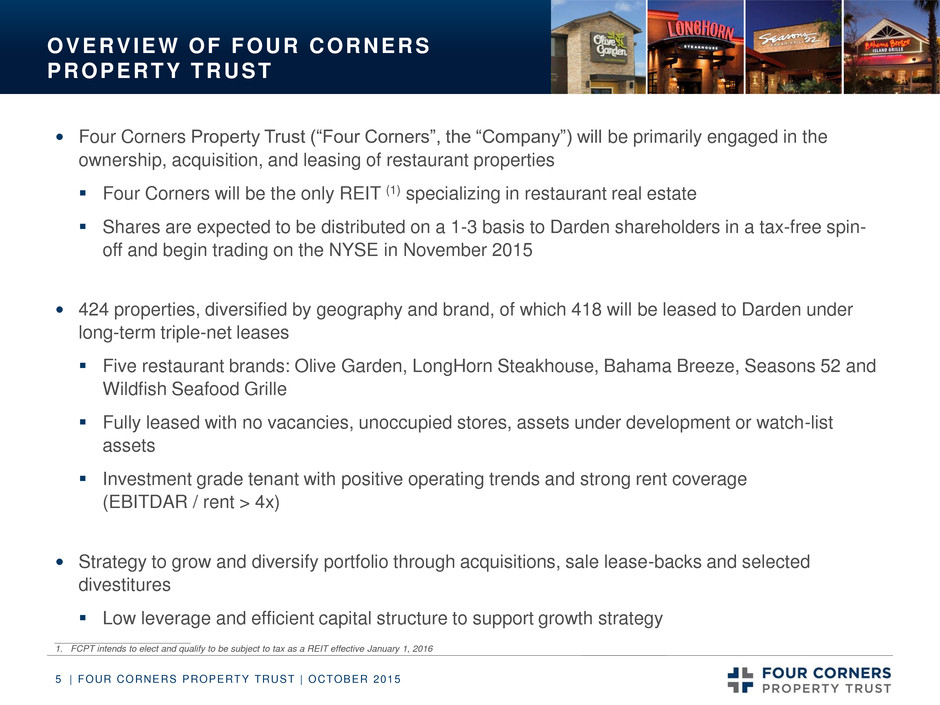
| FOUR CORNERS PROPERTY TRUST | OCTOBER 2015 5 OVERVIEW OF FOUR CORNERS PROPERTY TRUST Four Corners Property Trust (“Four Corners”, the “Company”) will be primarily engaged in the ownership, acquisition, and leasing of restaurant properties Four Corners will be the only REIT (1) specializing in restaurant real estate Shares are expected to be distributed on a 1-3 basis to Darden shareholders in a tax-free spin- off and begin trading on the NYSE in November 2015 424 properties, diversified by geography and brand, of which 418 will be leased to Darden under long-term triple-net leases Five restaurant brands: Olive Garden, LongHorn Steakhouse, Bahama Breeze, Seasons 52 and Wildfish Seafood Grille Fully leased with no vacancies, unoccupied stores, assets under development or watch-list assets Investment grade tenant with positive operating trends and strong rent coverage (EBITDAR / rent > 4x) Strategy to grow and diversify portfolio through acquisitions, sale lease-backs and selected divestitures Low leverage and efficient capital structure to support growth strategy ___________________________ 1. FCPT intends to elect and qualify to be subject to tax as a REIT effective January 1, 2016
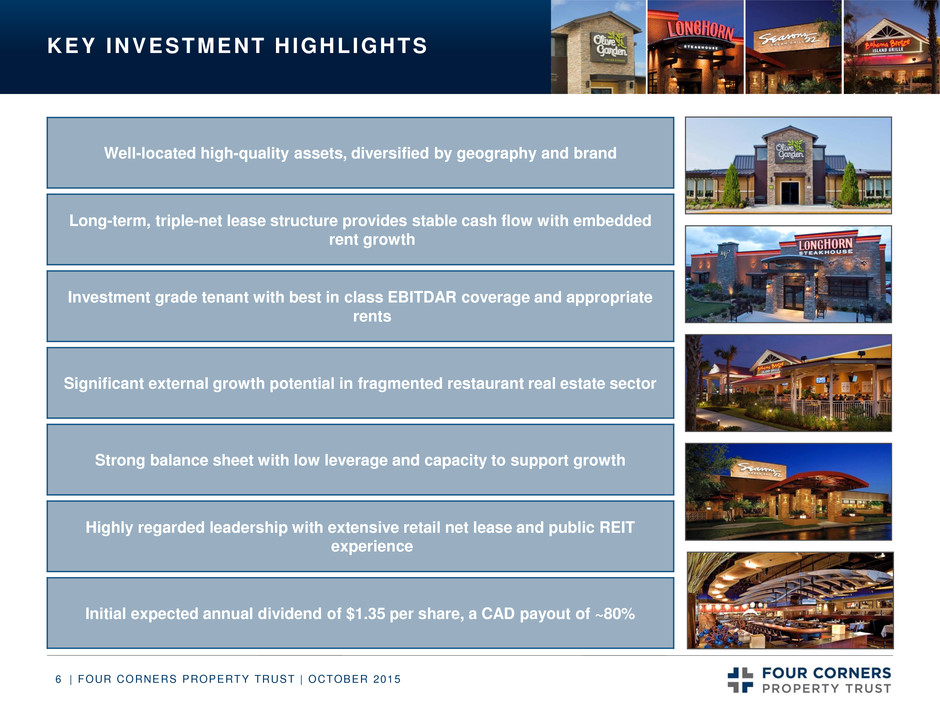
| FOUR CORNERS PROPERTY TRUST | OCTOBER 2015 6 Well-located high-quality assets, diversified by geography and brand KEY INVESTMENT HIGHLIGHTS Long-term, triple-net lease structure provides stable cash flow with embedded rent growth Investment grade tenant with best in class EBITDAR coverage and appropriate rents Strong balance sheet with low leverage and capacity to support growth Highly regarded leadership with extensive retail net lease and public REIT experience Significant external growth potential in fragmented restaurant real estate sector Initial expected annual dividend of $1.35 per share, a CAD payout of ~80% Impacted by revolver size
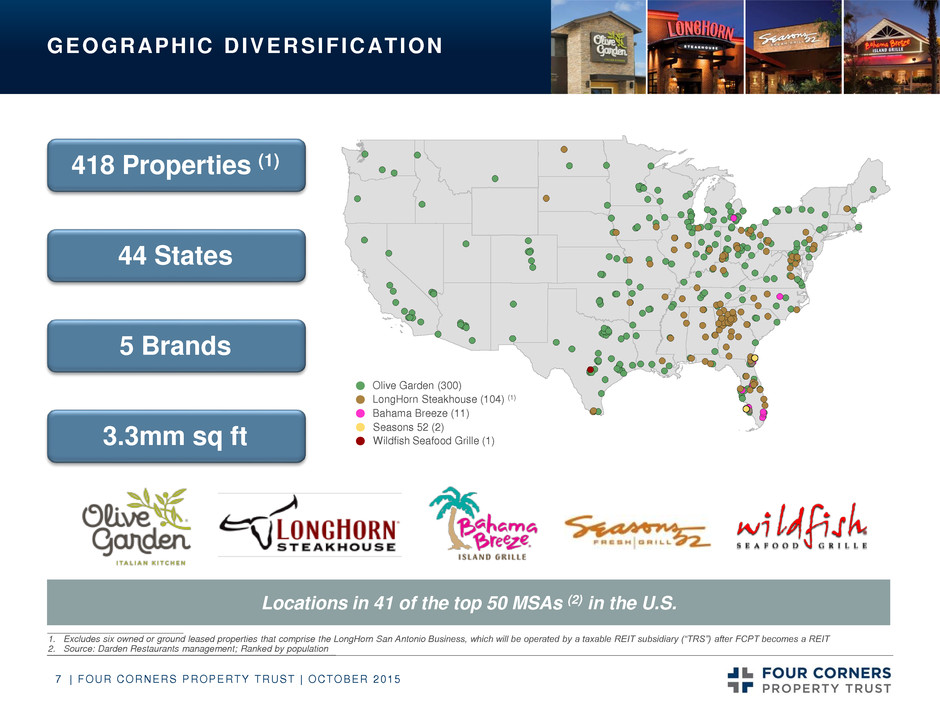
| FOUR CORNERS PROPERTY TRUST | OCTOBER 2015 7 GEOGRAPHIC DIVERSIF ICATION Seasons 52 (2) Olive Garden (300) LongHorn Steakhouse (104) (1) Bahama Breeze (11) Wildfish Seafood Grille (1) ___________________________ 1. Excludes six owned or ground leased properties that comprise the LongHorn San Antonio Business, which will be operated by a taxable REIT subsidiary (“TRS”) after FCPT becomes a REIT 2. Source: Darden Restaurants management; Ranked by population 418 Properties (1) 44 States 5 Brands *PLEASE DO NOT DELETE THIS TEXT BOX* This map was created using MapInfo. Updates and edits can be easily done using the MapInfo program, contact PPS to make edits. NOTE: If the map is ungrouped the formatting and cropping can be lost. This map is saved in Dealworks folder 1923289- 002 3.3mm sq ft Locations in 41 of the top 50 MSAs (2) in the U.S.
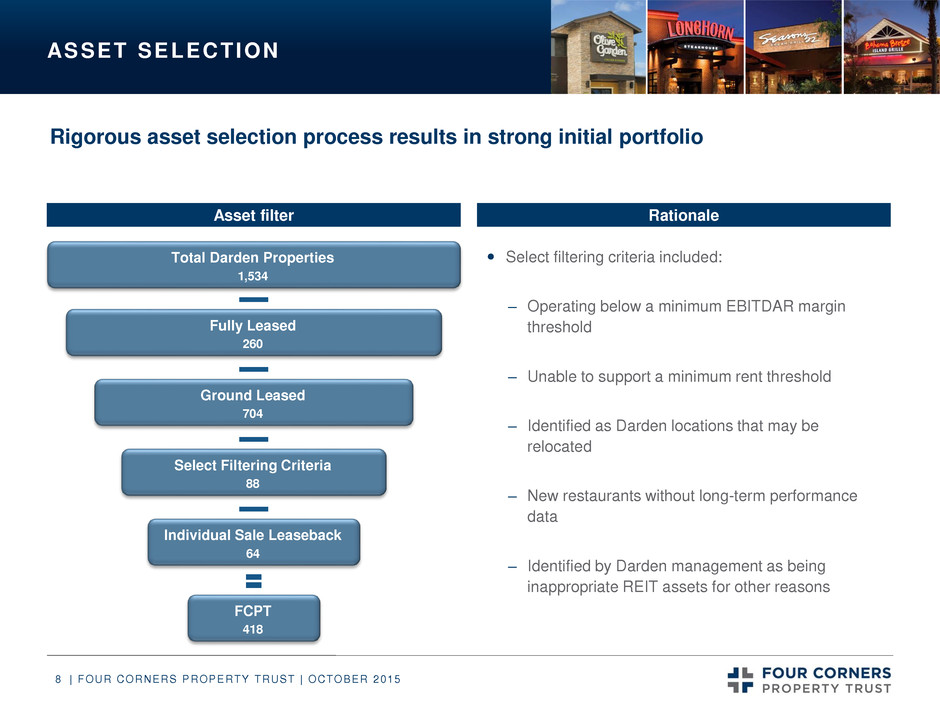
| FOUR CORNERS PROPERTY TRUST | OCTOBER 2015 8 ASSET SELECTION Asset filter Rationale Rigorous asset selection process results in strong initial portfolio Select filtering criteria included: – Operating below a minimum EBITDAR margin threshold – Unable to support a minimum rent threshold – Identified as Darden locations that may be relocated – New restaurants without long-term performance data – Identified by Darden management as being inappropriate REIT assets for other reasons Total Darden Properties 1,534 Fully Leased 260 Ground Leased 704 Select Filtering Criteria 88 Individual Sale Leaseback 64 FCPT 418
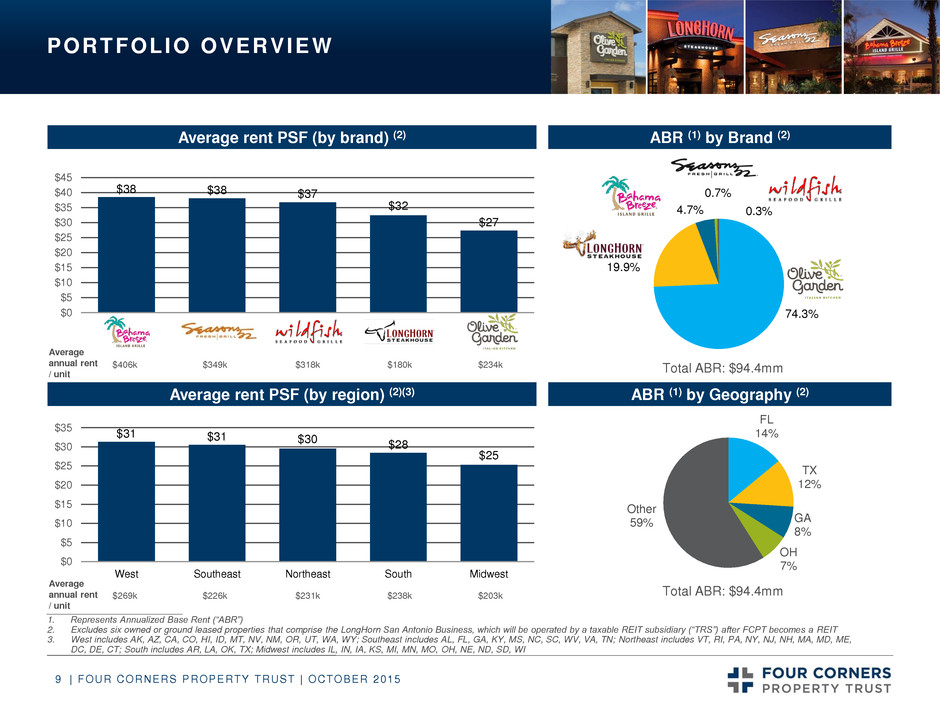
| FOUR CORNERS PROPERTY TRUST | OCTOBER 2015 9 PORTFOLIO OVERVIEW ABR (1) by Brand (2) ABR (1) by Geography (2) 74.3% 19.9% 4.7% 0.7% 0.3% ___________________________ 1. Represents Annualized Base Rent (“ABR”) 2. Excludes six owned or ground leased properties that comprise the LongHorn San Antonio Business, which will be operated by a taxable REIT subsidiary (“TRS”) after FCPT becomes a REIT 3. West includes AK, AZ, CA, CO, HI, ID, MT, NV, NM, OR, UT, WA, WY; Southeast includes AL, FL, GA, KY, MS, NC, SC, WV, VA, TN; Northeast includes VT, RI, PA, NY, NJ, NH, MA, MD, ME, DC, DE, CT; South includes AR, LA, OK, TX; Midwest includes IL, IN, IA, KS, MI, MN, MO, OH, NE, ND, SD, WI Average rent PSF (by brand) (2) FL 14% TX 12% GA 8% OH 7% Other 59% $38 $38 $37 $32 $27 $0 $5 $10 $15 $20 $25 $30 $35 $40 $45 Average rent PSF (by region) (2)(3) $31 $31 $30 $28 $25 $0 $5 $10 $15 $20 $25 $30 $35 West Southeast Northeast South Midwest Total ABR: $94.4mm Total ABR: $94.4mm $406k $349k $318k $180k $234k $269k $226k $231k $238k $203k Average annual rent / unit Average annual rent / unit
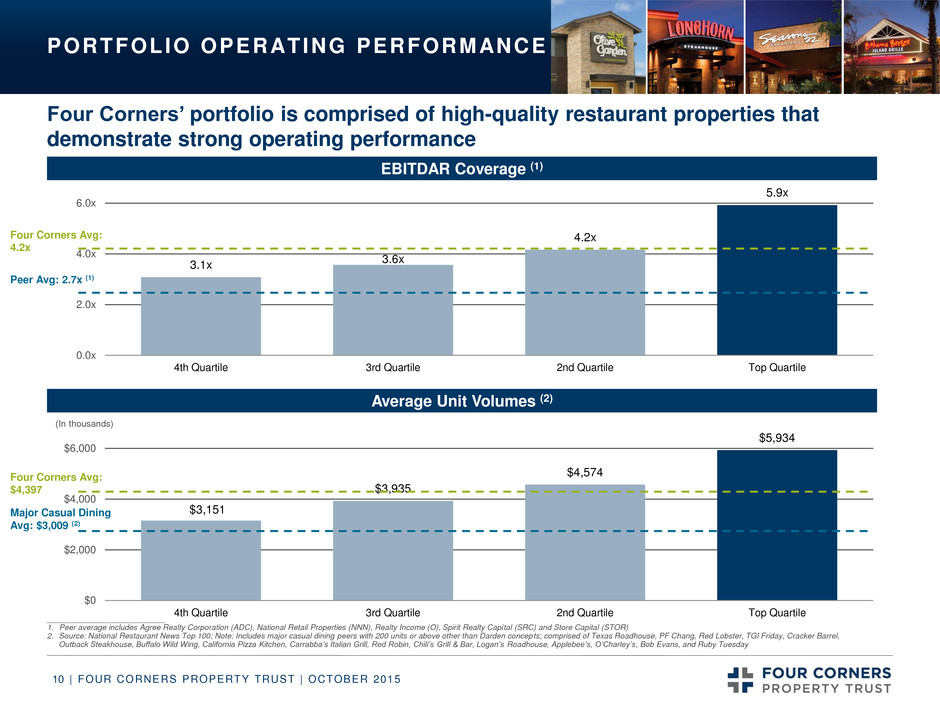
| FOUR CORNERS PROPERTY TRUST | OCTOBER 2015 10 PORTFOLIO OPERATING PERFORMANCE 3.1x 3.6x 4.2x 5.9x 0.0x 2.0x 4.0x 6.0x 4th Quartile 3rd Quartile 2nd Quartile Top Quartile EBITDAR Coverage (1) Average Unit Volumes (2) $3,151 $3,935 $4,574 $5,934 $0 $2,000 $4,000 $6,000 4th Quartile 3rd Quartile 2nd Quartile Top Quartile (In thousands) Four Corners Avg: 4.2x Four Corners Avg: $4,397 Four Corners’ portfolio is comprised of high-quality restaurant properties that demonstrate strong operating performance Peer Avg: 2.7x (1) ___________________________ 1. Peer average includes Agree Realty Corporation (ADC), National Retail Properties (NNN), Realty Income (O), Spirit Realty Capital (SRC) and Store Capital (STOR) 2. Source: National Restaurant News Top 100; Note: Includes major casual dining peers with 200 units or above other than Darden concepts; comprised of Texas Roadhouse, PF Chang, Red Lobster, TGI Friday, Cracker Barrel, Outback Steakhouse, Buffalo Wild Wing, California Pizza Kitchen, Carrabba’s Italian Grill, Red Robin, Chili’s Grill & Bar, Logan’s Roadhouse, Applebee’s, O’Charley’s, Bob Evans, and Ruby Tuesday Major Casual Dining Avg: $3,009 (2)
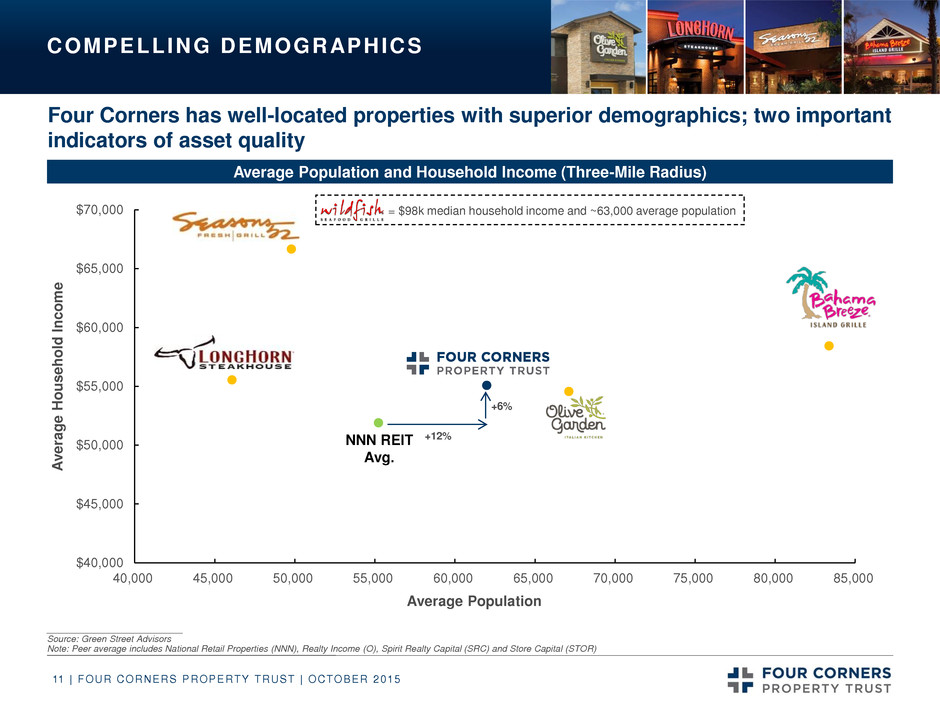
| FOUR CORNERS PROPERTY TRUST | OCTOBER 2015 11 $40,000 $45,000 $50,000 $55,000 $60,000 $65,000 $70,000 40,000 45,000 50,000 55,000 60,000 65,000 70,000 75,000 80,000 85,000 A v era g e H o u s e h old I n c om e Average Population NNN REIT Avg. = $98k median household income and ~63,000 average population COMPELLING DEMOGRAPHICS Four Corners has well-located properties with superior demographics; two important indicators of asset quality Average Population and Household Income (Three-Mile Radius) ___________________________ Source: Green Street Advisors Note: Peer average includes National Retail Properties (NNN), Realty Income (O), Spirit Realty Capital (SRC) and Store Capital (STOR) +6% +12%
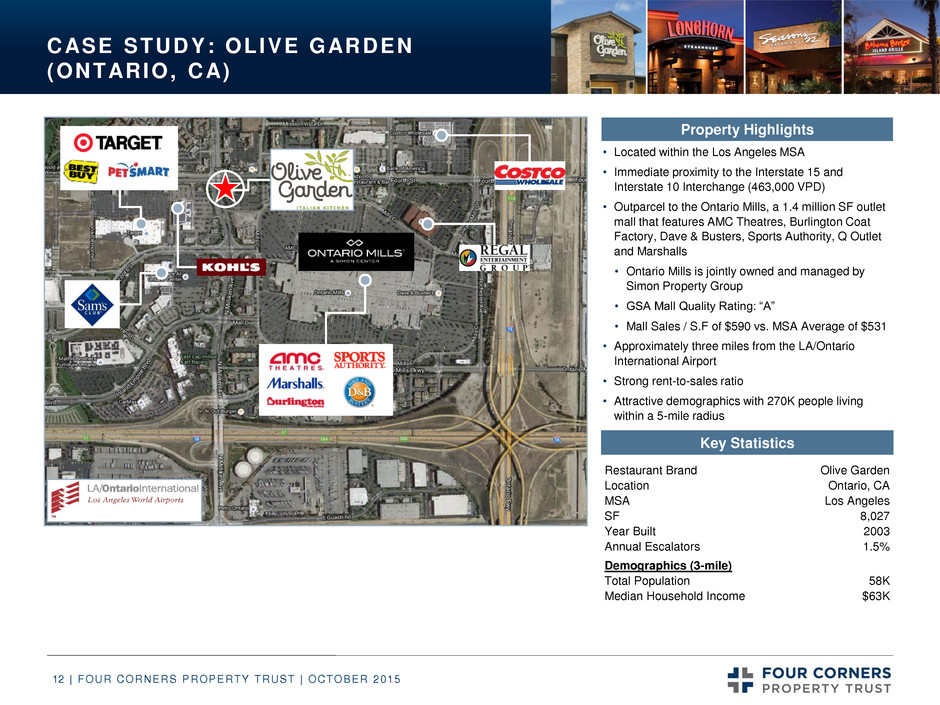
| FOUR CORNERS PROPERTY TRUST | OCTOBER 2015 12 CASE STUDY: OLIVE GARDEN (ONTARIO, CA) • Located within the Los Angeles MSA • Immediate proximity to the Interstate 15 and Interstate 10 Interchange (463,000 VPD) • Outparcel to the Ontario Mills, a 1.4 million SF outlet mall that features AMC Theatres, Burlington Coat Factory, Dave & Busters, Sports Authority, Q Outlet and Marshalls • Ontario Mills is jointly owned and managed by Simon Property Group • GSA Mall Quality Rating: “A” • Mall Sales / S.F of $590 vs. MSA Average of $531 • Approximately three miles from the LA/Ontario International Airport • Strong rent-to-sales ratio • Attractive demographics with 270K people living within a 5-mile radius Key Statistics Property Highlights Restaurant Bra d Olive Garden Location Ontario, CA MSA Los Angeles SF 8,027 Year Built 2003 Annual Escalators 1.5% Demographics (3-mile) Total Population 58K Median Household Income $63K
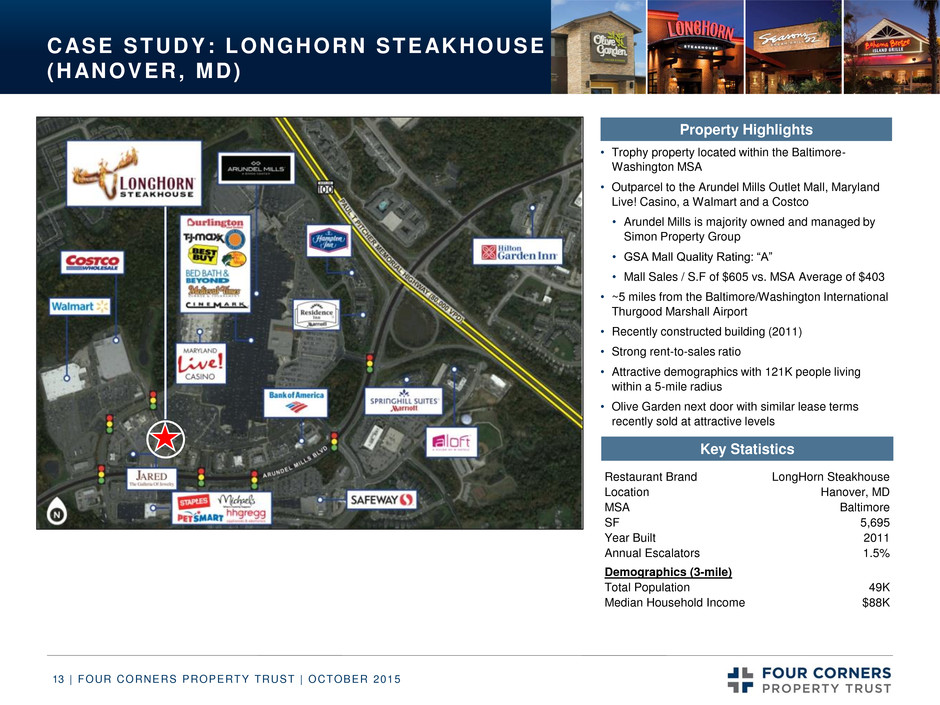
| FOUR CORNERS PROPERTY TRUST | OCTOBER 2015 13 CASE STUDY: LONGHORN STEAKHOUSE (HANOVER, MD) Key Statistics • Trophy property located within the Baltimore- Washington MSA • Outparcel to the Arundel Mills Outlet Mall, Maryland Live! Casino, a Walmart and a Costco • Arundel Mills is majority owned and managed by Simon Property Group • GSA Mall Quality Rating: “A” • Mall Sales / S.F of $605 vs. MSA Average of $403 • ~5 miles from the Baltimore/Washington International Thurgood Marshall Airport • Recently constructed building (2011) • Strong rent-to-sales ratio • Attractive demographics with 121K people living within a 5-mile radius • Olive Garden next door with similar lease terms recently sold at attractive levels Property Highlights Restau ant Brand LongHorn Steakhouse Location Hanover, MD MSA Baltimore SF 5,695 Year Built 2011 Annual Escalators 1.5% Demographics (3-mile) Total Population 49K Median Household Income $88K
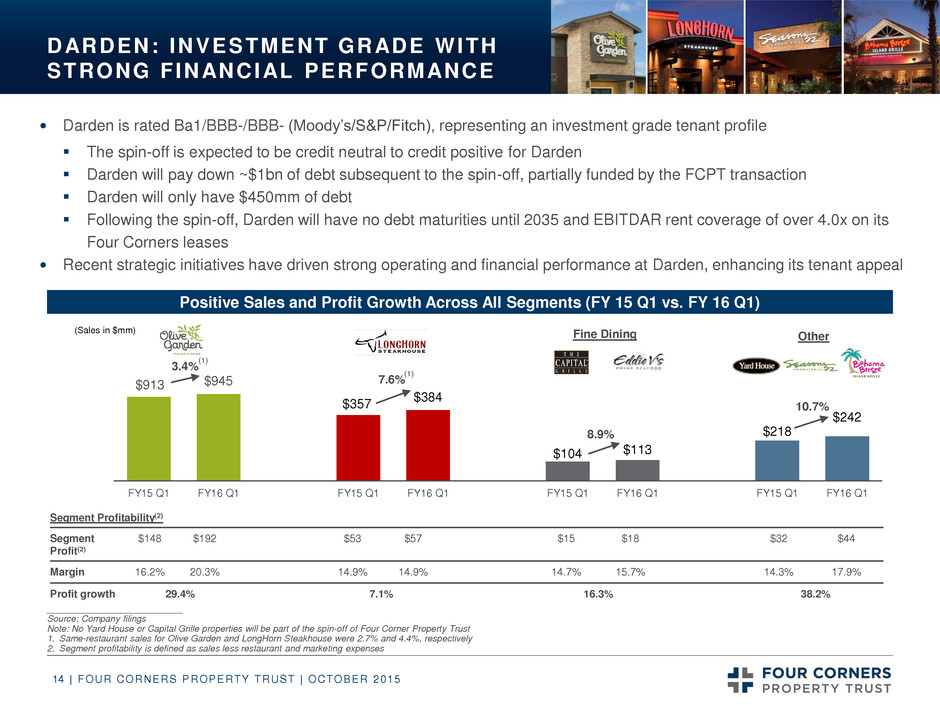
| FOUR CORNERS PROPERTY TRUST | OCTOBER 2015 14 Segment Profitability(2) Segment Profit(2) $148 $192 $53 $57 $15 $18 $32 $44 Margin 16.2% 20.3% 14.9% 14.9% 14.7% 15.7% 14.3% 17.9% Profit growth 29.4% 7.1% 16.3% 38.2% DARDEN: INVESTMENT GRADE WITH STRONG FINANCIAL PERFORMANCE Darden is rated Ba1/BBB-/BBB- (Moody’s/S&P/Fitch), representing an investment grade tenant profile The spin-off is expected to be credit neutral to credit positive for Darden Darden will pay down ~$1bn of debt subsequent to the spin-off, partially funded by the FCPT transaction Darden will only have $450mm of debt Following the spin-off, Darden will have no debt maturities until 2035 and EBITDAR rent coverage of over 4.0x on its Four Corners leases Recent strategic initiatives have driven strong operating and financial performance at Darden, enhancing its tenant appeal ___________________________ Source: Company filings Note: No Yard House or Capital Grille properties will be part of the spin-off of Four Corner Property Trust 1. Same-restaurant sales for Olive Garden and LongHorn Steakhouse were 2.7% and 4.4%, respectively 2. Segment profitability is defined as sales less restaurant and marketing expenses $913 $945 $357 $384 $104 $113 $218 $242 FY15 Q1 FY16 Q1 FY15 Q1 FY16 Q1 FY15 Q1 FY16 Q1 FY15 Q1 FY16 Q1 (Sales in $mm) Positive Sales and Profit Growth Across All Segments (FY 15 Q1 vs. FY 16 Q1) 3.4% 7.6% 8.9% 10.7% Fine Dining Other (1) (1)
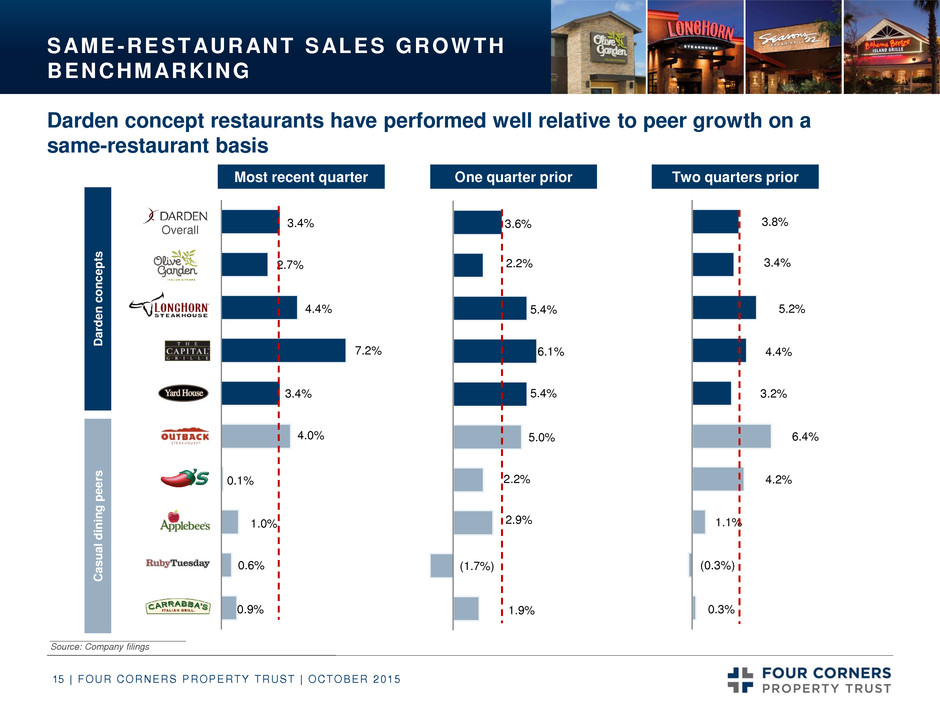
| FOUR CORNERS PROPERTY TRUST | OCTOBER 2015 15 1.9% (1.7%) 2.9% 2.2% 5.0% 5.4% 6.1% 5.4% 2.2% 3.6% SAME-RESTAURANT SALES GROWTH BENCHMARKING Dard e n c o n c e pt s Ca s u a l d in in g p e e rs Most recent quarter One quarter prior Two quarters prior 0.9% 0.6% 1.0% 0.1% 4.0% 3.4% 7.2% 4.4% 2.7% 3.4% 0.3% (0.3%) 1.1% 4.2% 6.4% 3.2% 4.4% 5.2% 3.4% 3.8% Overall ___________________________ Source: Company filings Darden concept restaurants have performed well relative to peer growth on a same-restaurant basis
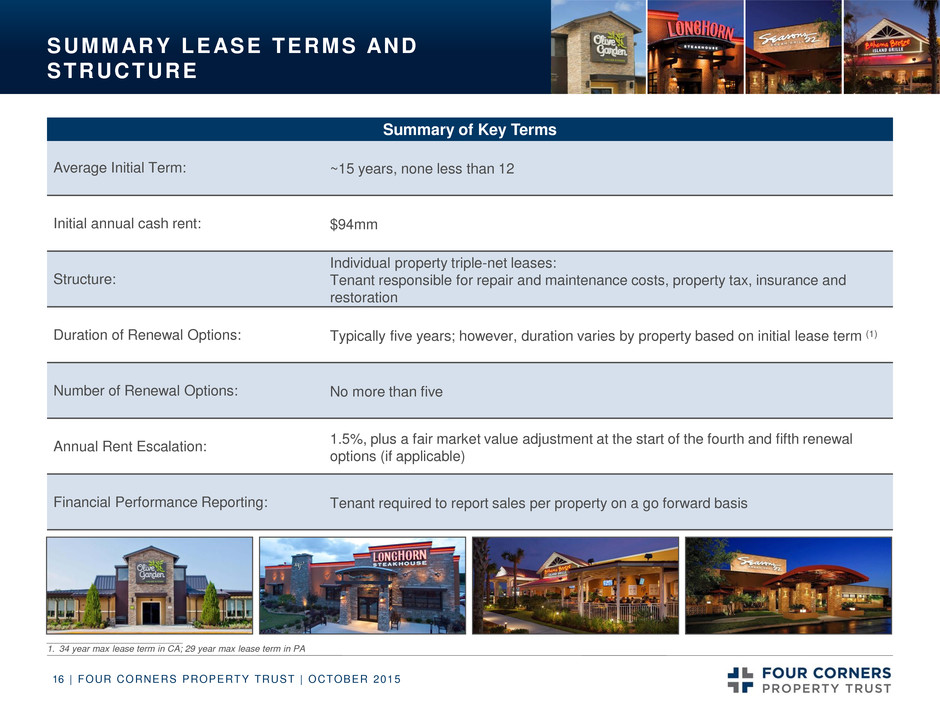
| FOUR CORNERS PROPERTY TRUST | OCTOBER 2015 16 SUMMARY LEASE TERMS AND STRUCTURE Average Initial Term: ~15 years, none less than 12 Initial annual cash rent: $94mm Structure: Individual property triple-net leases: Tenant responsible for repair and maintenance costs, property tax, insurance and restoration Duration of Renewal Options: Typically five years; however, duration varies by property based on initial lease term (1) Number of Renewal Options: No more than five Annual Rent Escalation: 1.5%, plus a fair market value adjustment at the start of the fourth and fifth renewal options (if applicable) Financial Performance Reporting: Tenant required to report sales per property on a go forward basis Summary of Key Terms ___________________________ 1. 34 year max lease term in CA; 29 year max lease term in PA
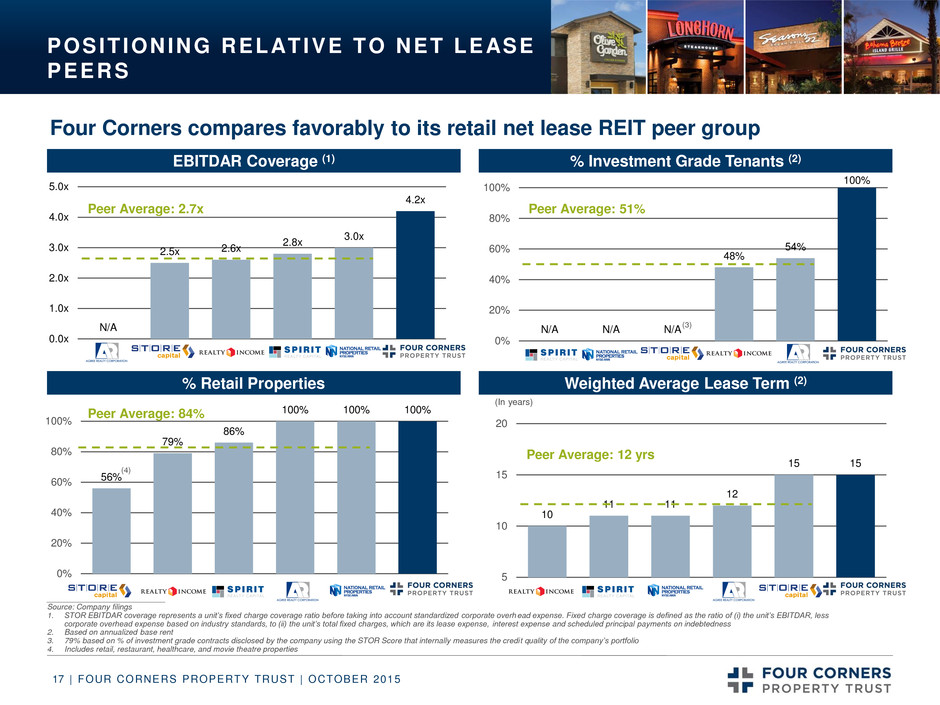
| FOUR CORNERS PROPERTY TRUST | OCTOBER 2015 17 POSIT IONING RELATIVE TO NET LEASE PEERS Four Corners compares favorably to its retail net lease REIT peer group ___________________________ Source: Company filings 1. STOR EBITDAR coverage represents a unit’s fixed charge coverage ratio before taking into account standardized corporate overhead expense. Fixed charge coverage is defined as the ratio of (i) the unit’s EBITDAR, less corporate overhead expense based on industry standards, to (ii) the unit’s total fixed charges, which are its lease expense, interest expense and scheduled principal payments on indebtedness 2. Based on annualized base rent 3. 79% based on % of investment grade contracts disclosed by the company using the STOR Score that internally measures the credit quality of the company’s portfolio 4. Includes retail, restaurant, healthcare, and movie theatre properties N/A 2.5x 2.6x 2.8x 3.0x 4.2x 0.0x 1.0x 2.0x 3.0x 4.0x 5.0x EBITDAR Coverage (1) % Investment Grade Tenants (2) Weighted Average Lease Term (2) % Retail Properties N/A N/A N/A 48% 54% 100% 0% 20% 40% 60% 80% 100% 56% 79% 86% 100% 100% 100% 0% 20% 40% 60% 80% 100% 10 11 11 12 15 15 5 10 15 20 (In years) (3) Peer Average: 2.7x Peer Average: 84% Peer Average: 51% Peer Average: 12 yrs (4)
| FOUR CORNERS PROPERTY TRUST | OCTOBER 2015 18 BUSINESS PLAN AND GROWTH STRATEGY Four Corners has a core portfolio that provides stable cash flow, as well as a strong balance sheet to support external growth and diversification Harvest organic cash flow growth from initial portfolio of triple-net leases − Individual leases allow for maximum flexibility in resetting rent levels and laddering expiration dates − Built-in 1.5% rent escalators and fair market value adjustments provide organic growth Capitalize on robust market opportunity in the highly-fragmented restaurant real estate industry with a trend towards “asset-light” business model for operators − “Sharpshooter” advantage as the only REIT specializing in restaurant real estate with in-house operations team Acquire additional complementary real estate assets to diversify tenant base − Develop new tenant relationships − Finance franchisee expansion − Expand into ownership of other retail real estate in related areas Maintain growth-friendly balance sheet − Low leveraged balance sheet with substantial liquidity to support growth strategy − Unencumbered properties allows for efficient purchases and sales − UPREIT structure provides opportunity to issue OP units as acquisition currency Achieve accretive growth through active capital recycling − Seek opportunity for accretive diversification
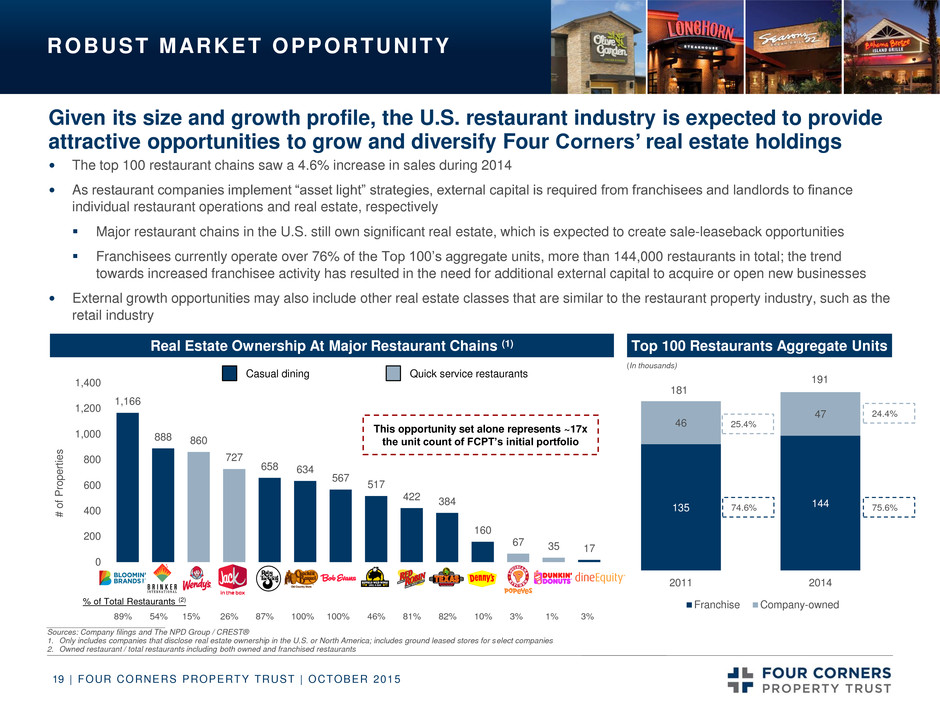
| FOUR CORNERS PROPERTY TRUST | OCTOBER 2015 19 % of Total Restaurants (2) 89% 54% 15% 26% 87% 100% 100% 46% 81% 82% 10% 3% 1% 3% ROBUST MARKET OPPORTUNITY Given its size and growth profile, the U.S. restaurant industry is expected to provide attractive opportunities to grow and diversify Four Corners’ real estate holdings The top 100 restaurant chains saw a 4.6% increase in sales during 2014 As restaurant companies implement “asset light” strategies, external capital is required from franchisees and landlords to finance individual restaurant operations and real estate, respectively Major restaurant chains in the U.S. still own significant real estate, which is expected to create sale-leaseback opportunities Franchisees currently operate over 76% of the Top 100’s aggregate units, more than 144,000 restaurants in total; the trend towards increased franchisee activity has resulted in the need for additional external capital to acquire or open new businesses External growth opportunities may also include other real estate classes that are similar to the restaurant property industry, such as the retail industry ___________________________ Sources: Company filings and The NPD Group / CREST® 1. Only includes companies that disclose real estate ownership in the U.S. or North America; includes ground leased stores for select companies 2. Owned restaurant / total restaurants including both owned and franchised restaurants Real Estate Ownership At Major Restaurant Chains (1) Top 100 Restaurants Aggregate Units 135 144 46 47 2011 2014 (In thousands) Franchise Company-owned 25.4% 74.6% 24.4% 75.6% 191 181 1,166 888 860 727 658 634 567 517 422 384 160 67 35 17 0 200 400 600 800 1,000 1,200 1,400 Casual dining Quick service restaurants # o f P ro p e rt ie s This opportunity set alone represents ~17x the unit count of FCPT’s initial portfolio
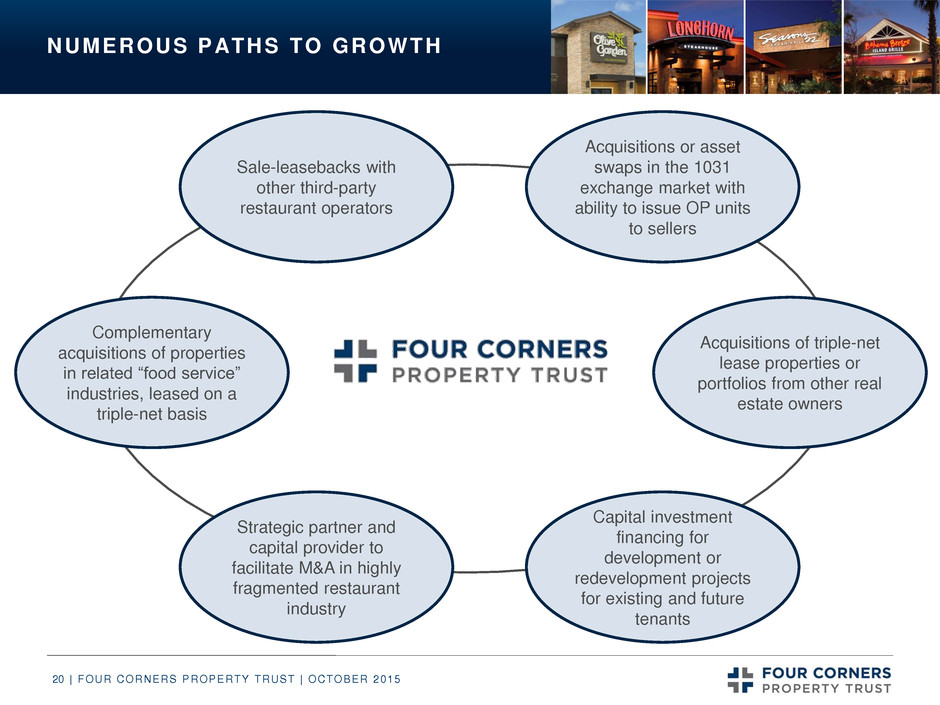
| FOUR CORNERS PROPERTY TRUST | OCTOBER 2015 20 NUMEROUS PATHS TO GROWTH Sale-leasebacks with other third-party restaurant operators Acquisitions or asset swaps in the 1031 exchange market with ability to issue OP units to sellers Acquisitions of triple-net lease properties or portfolios from other real estate owners Capital investment financing for development or redevelopment projects for existing and future tenants Strategic partner and capital provider to facilitate M&A in highly fragmented restaurant industry Complementary acquisitions of properties in related “food service” industries, leased on a triple-net basis
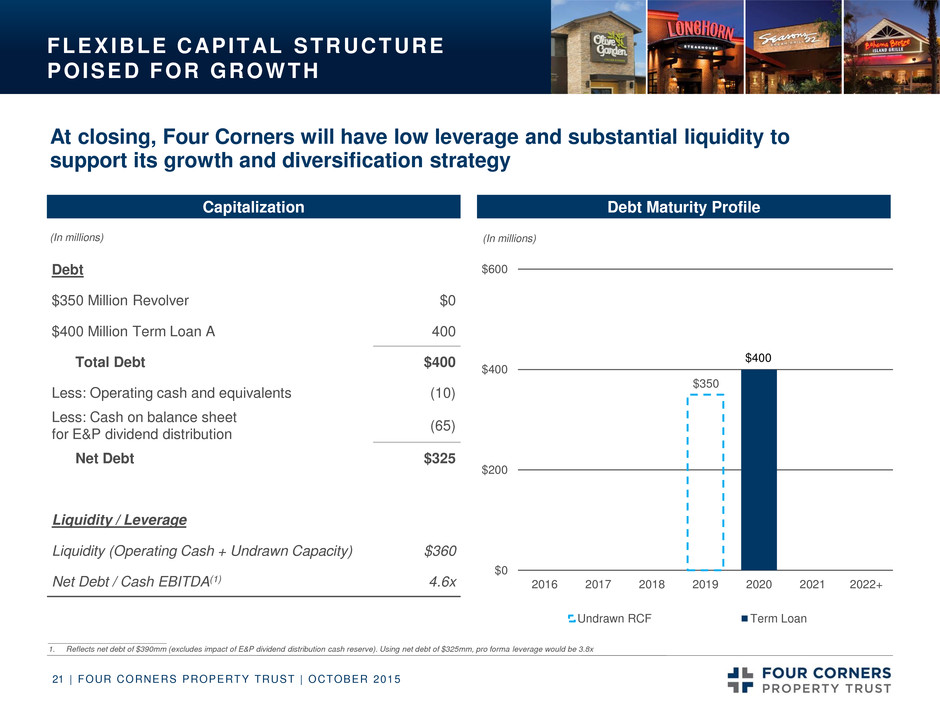
| FOUR CORNERS PROPERTY TRUST | OCTOBER 2015 21 FLEXIBLE CAPITAL STRUCTURE POISED FOR GROWTH Capitalization $350 $400 $0 $200 $400 $600 2016 2017 2018 2019 2020 2021 2022+ (In millions) Undrawn RCF Term Loan Debt Maturity Profile At closing, Four Corners will have low leverage and substantial liquidity to support its growth and diversification strategy Debt $350 Million Revolver $0 $400 Million Term Loan A 400 Total Debt $400 Less: Operating cash and equivalents (10) Less: Cash on balance sheet for E&P dividend distribution (65) Net Debt $325 Liquidity / Leverage Liquidity (Operating Cash + Undrawn Capacity) $360 Net Debt / Cash EBITDA(1) 4.6x (In millions) ___________________________ 1. Reflects net debt of $390mm (excludes impact of E&P dividend distribution cash reserve). Using net debt of $325mm, pro forma leverage would be 3.8x Impacted by revolver size
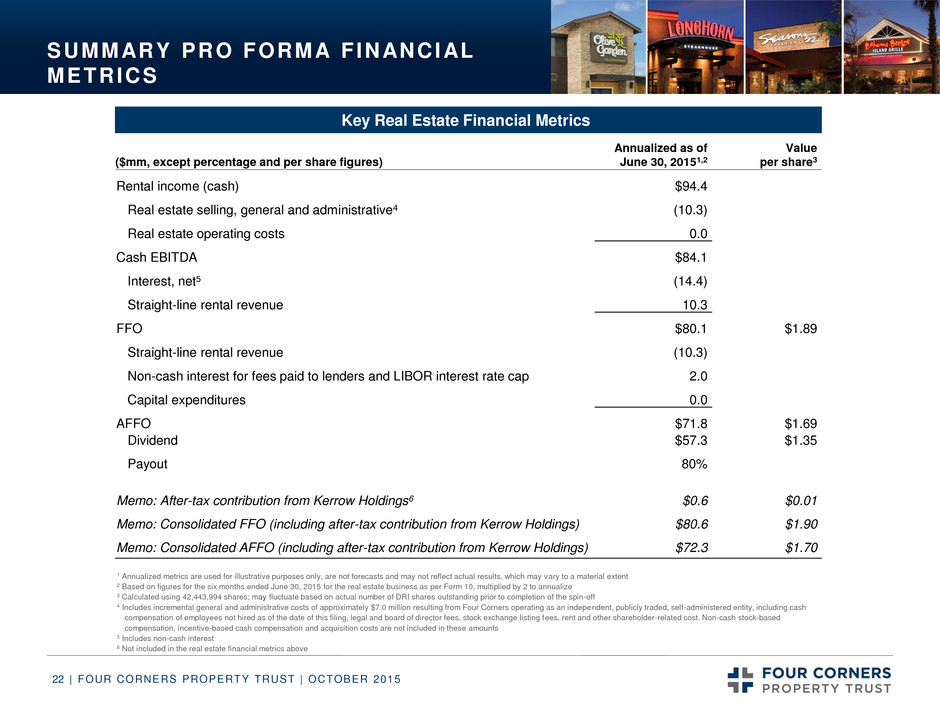
| FOUR CORNERS PROPERTY TRUST | OCTOBER 2015 22 SUMMARY PRO FORMA FINANCIAL METRICS Key Real Estate Financial Metrics ($mm, except percentage and per share figures) Annualized as of June 30, 20151,2 Value per share3 Rental income (cash) $94.4 Real estate selling, general and administrative4 (10.3) Real estate operating costs 0.0 Cash EBITDA $84.1 Interest, net5 (14.4) Straight-line rental revenue 10.3 FFO $80.1 $1.89 Straight-line rental revenue (10.3) Non-cash interest for fees paid to lenders and LIBOR interest rate cap 2.0 Capital expenditures 0.0 AFFO $71.8 $1.69 Dividend $57.3 $1.35 Payout 80% Memo: After-tax contribution from Kerrow Holdings6 $0.6 $0.01 Memo: Consolidated FFO (including after-tax contribution from Kerrow Holdings) $80.6 $1.90 Memo: Consolidated AFFO (including after-tax contribution from Kerrow Holdings) $72.3 $1.70 1 Annualized metrics are used for illustrative purposes only, are not forecasts and may not reflect actual results, which may vary to a material extent 2 Based on figures for the six months ended June 30, 2015 for the real estate business as per Form 10, multiplied by 2 to annualize 3 Calculated using 42,443,994 shares; may fluctuate based on actual number of DRI shares outstanding prior to completion of the spin-off 4 Includes incremental general and administrative costs of approximately $7.0 million resulting from Four Corners operating as an independent, publicly traded, self-administered entity, including cash compensation of employees not hired as of the date of this filing, legal and board of director fees, stock exchange listing fees, rent and other shareholder-related cost. Non-cash stock-based compensation, incentive-based cash compensation and acquisition costs are not included in these amounts 5 Includes non-cash interest 6 Not included in the real estate financial metrics above
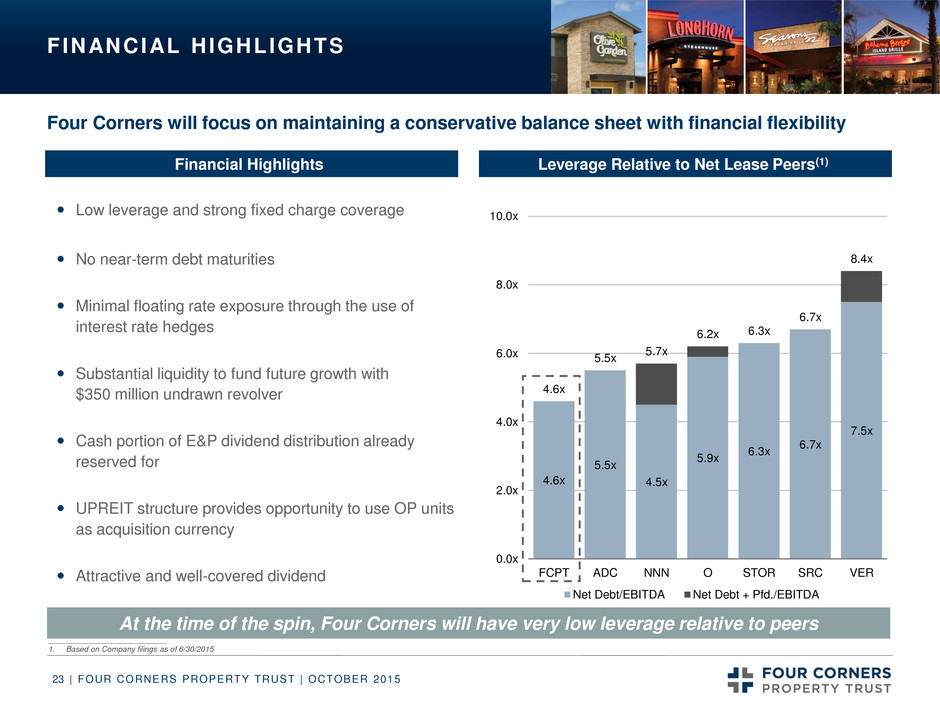
| FOUR CORNERS PROPERTY TRUST | OCTOBER 2015 23 FINANCIAL HIGHLIGHTS Four Corners will focus on maintaining a conservative balance sheet with financial flexibility Financial Highlights Leverage Relative to Net Lease Peers(1) 4.6x 5.5x 4.5x 5.9x 6.3x 6.7x 7.5x 4.6x 5.5x 5.7x 6.2x 6.3x 6.7x 8.4x 0.0x 2.0x 4.0x 6.0x 8.0x 10.0x FCPT ADC NNN O STOR SRC VER Net Debt/EBITDA Net Debt + Pfd./EBITDA Low leverage and strong fixed charge coverage No near-term debt maturities Minimal floating rate exposure through the use of interest rate hedges Substantial liquidity to fund future growth with $350 million undrawn revolver Cash portion of E&P dividend distribution already reserved for UPREIT structure provides opportunity to use OP units as acquisition currency Attractive and well-covered dividend At the time of the spin, Four Corners will have very low leverage relative to peers ___________________________ 1. Based on Company filings as of 6/30/2015 Impacted by revolver size
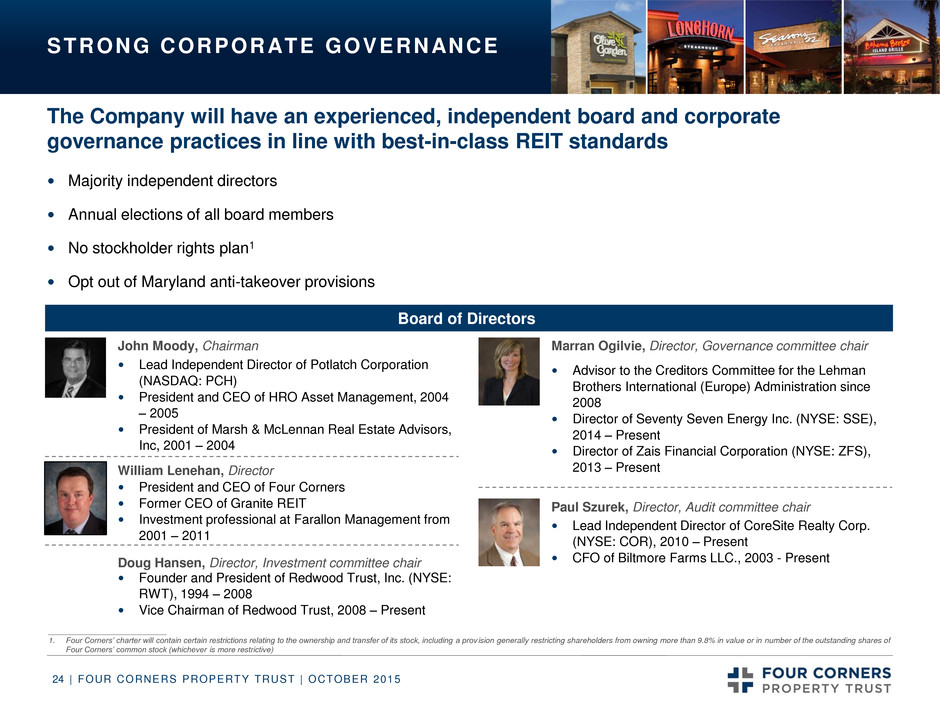
| FOUR CORNERS PROPERTY TRUST | OCTOBER 2015 24 STRONG CORPORATE GOVERNANCE The Company will have an experienced, independent board and corporate governance practices in line with best-in-class REIT standards Majority independent directors Annual elections of all board members No stockholder rights plan1 Opt out of Maryland anti-takeover provisions Board of Directors Lead Independent Director of Potlatch Corporation (NASDAQ: PCH) President and CEO of HRO Asset Management, 2004 – 2005 President of Marsh & McLennan Real Estate Advisors, Inc, 2001 – 2004 John Moody, Chairman Founder and President of Redwood Trust, Inc. (NYSE: RWT), 1994 – 2008 Vice Chairman of Redwood Trust, 2008 – Present Doug Hansen, Director, Investment committee chair Advisor to the Creditors Committee for the Lehman Brothers International (Europe) Administration since 2008 Director of Seventy Seven Energy Inc. (NYSE: SSE), 2014 – Present Director of Zais Financial Corporation (NYSE: ZFS), 2013 – Present Marran Ogilvie, Director, Governance committee chair Lead Independent Director of CoreSite Realty Corp. (NYSE: COR), 2010 – Present CFO of Biltmore Farms LLC., 2003 - Present Paul Szurek, Director, Audit committee chair President and CEO of Four Corners Former CEO of Granite REIT Investment professional at Farallon Management from 2001 – 2011 William Lenehan, Director ___________________________ 1. Four Corners’ charter will contain certain restrictions relating to the ownership and transfer of its stock, including a prov ision generally restricting shareholders from owning more than 9.8% in value or in number of the outstanding shares of Four Corners’ common stock (whichever is more restrictive)
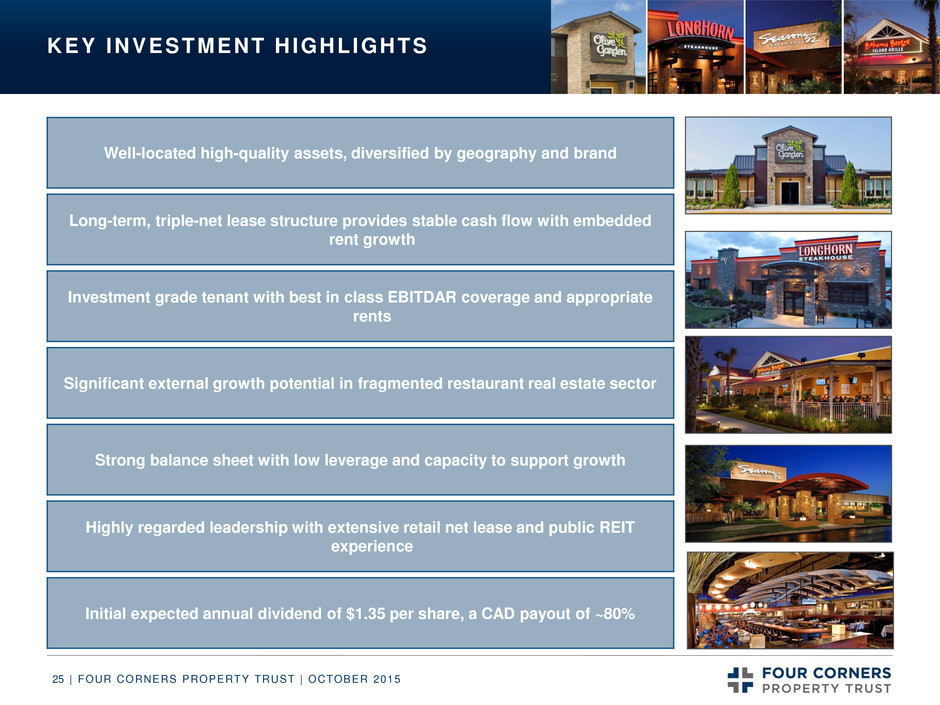
| FOUR CORNERS PROPERTY TRUST | OCTOBER 2015 25 Well-located high-quality assets, diversified by geography and brand KEY INVESTMENT HIGHLIGHTS Long-term, triple-net lease structure provides stable cash flow with embedded rent growth Investment grade tenant with best in class EBITDAR coverage and appropriate rents Strong balance sheet with low leverage and capacity to support growth Highly regarded leadership with extensive retail net lease and public REIT experience Significant external growth potential in fragmented restaurant real estate sector Initial expected annual dividend of $1.35 per share, a CAD payout of ~80% Impacted by revolver size
COMPANY OVERVIEW APPENDIX
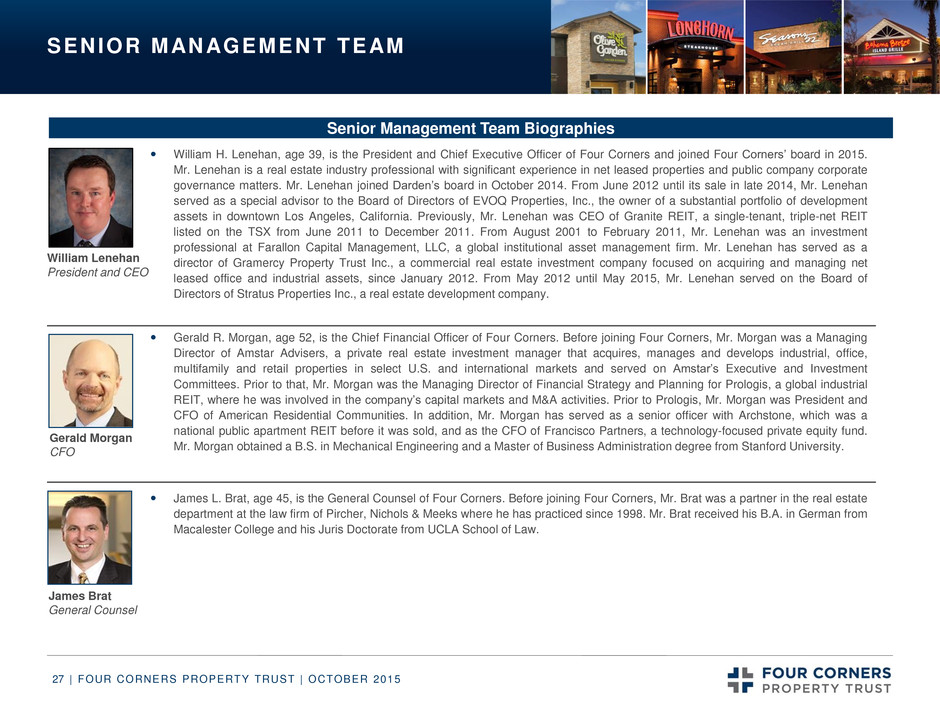
| FOUR CORNERS PROPERTY TRUST | OCTOBER 2015 27 William H. Lenehan, age 39, is the President and Chief Executive Officer of Four Corners and joined Four Corners’ board in 2015. Mr. Lenehan is a real estate industry professional with significant experience in net leased properties and public company corporate governance matters. Mr. Lenehan joined Darden’s board in October 2014. From June 2012 until its sale in late 2014, Mr. Lenehan served as a special advisor to the Board of Directors of EVOQ Properties, Inc., the owner of a substantial portfolio of development assets in downtown Los Angeles, California. Previously, Mr. Lenehan was CEO of Granite REIT, a single-tenant, triple-net REIT listed on the TSX from June 2011 to December 2011. From August 2001 to February 2011, Mr. Lenehan was an investment professional at Farallon Capital Management, LLC, a global institutional asset management firm. Mr. Lenehan has served as a director of Gramercy Property Trust Inc., a commercial real estate investment company focused on acquiring and managing net leased office and industrial assets, since January 2012. From May 2012 until May 2015, Mr. Lenehan served on the Board of Directors of Stratus Properties Inc., a real estate development company. Gerald R. Morgan, age 52, is the Chief Financial Officer of Four Corners. Before joining Four Corners, Mr. Morgan was a Managing Director of Amstar Advisers, a private real estate investment manager that acquires, manages and develops industrial, office, multifamily and retail properties in select U.S. and international markets and served on Amstar’s Executive and Investment Committees. Prior to that, Mr. Morgan was the Managing Director of Financial Strategy and Planning for Prologis, a global industrial REIT, where he was involved in the company’s capital markets and M&A activities. Prior to Prologis, Mr. Morgan was President and CFO of American Residential Communities. In addition, Mr. Morgan has served as a senior officer with Archstone, which was a national public apartment REIT before it was sold, and as the CFO of Francisco Partners, a technology-focused private equity fund. Mr. Morgan obtained a B.S. in Mechanical Engineering and a Master of Business Administration degree from Stanford University. James L. Brat, age 45, is the General Counsel of Four Corners. Before joining Four Corners, Mr. Brat was a partner in the real estate department at the law firm of Pircher, Nichols & Meeks where he has practiced since 1998. Mr. Brat received his B.A. in German from Macalester College and his Juris Doctorate from UCLA School of Law. SENIOR MANAGEMENT TEAM Gerald Morgan CFO James Brat General Counsel Senior Management Team Biographies William Lenehan President and CEO
| FOUR CORNERS PROPERTY TRUST | OCTOBER 2015 28 STRATEGIC RATIONALE FOR SPIN TRANSACTION On June 23, 2015, Darden announced its plan to separate its business into two separate and independent publicly traded companies Darden will continue to own, operate and franchise a broad range of restaurant brands Four Corners will become an independent, publicly traded REIT with 418 restaurant properties leased to Darden Opportunity to prudently grow and diversify the Four Corners portfolio given new management team focus on opportunities within restaurant real estate and an independent balance sheet Enables management teams to fully devote their time and attention to their respective businesses Enhance ability of Four Corners to attract and retain qualified management team Allow for valuation of the Four Corner properties within a publicly traded REIT structure Position both Four Corners and Darden to pursue respective business strategies Enable Darden to maintain a strong post-spin credit profile while deploying more capital
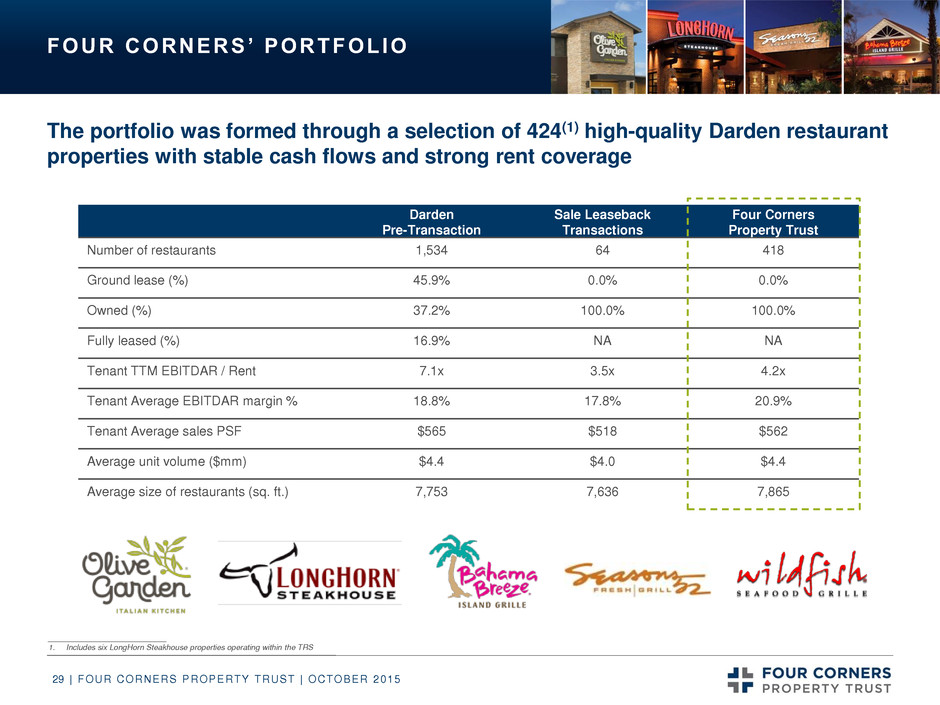
| FOUR CORNERS PROPERTY TRUST | OCTOBER 2015 29 Darden Pre-Transaction Sale Leaseback Transactions Four Corners Property Trust Number of restaurants 1,534 64 418 Ground lease (%) 45.9% 0.0% 0.0% Owned (%) 37.2% 100.0% 100.0% Fully leased (%) 16.9% NA NA Tenant TTM EBITDAR / Rent 7.1x 3.5x 4.2x Tenant Average EBITDAR margin % 18.8% 17.8% 20.9% Tenant Average sales PSF $565 $518 $562 Average unit volume ($mm) $4.4 $4.0 $4.4 Average size of restaurants (sq. ft.) 7,753 7,636 7,865 FOUR CORNERS’ PORTFOLIO The portfolio was formed through a selection of 424(1) high-quality Darden restaurant properties with stable cash flows and strong rent coverage ___________________________ 1. Includes six LongHorn Steakhouse properties operating within the TRS
| FOUR CORNERS PROPERTY TRUST | OCTOBER 2015 30 E&P DISTRIBUTION Following a conversion from a C-corporation into a REIT, the REIT must distribute by the end of its first REIT year all earnings and profits (“E&P”) accumulated during non-REIT years By December 31, 2016, Four Corners will be required to declare a distribution to its shareholders of the E&P that is allocated to it from Darden, as well as Four Corners' 2015 E&P. The distribution must be paid by January 31, 2017 The allocation of Darden's E&P will be based upon the relative equity values of Four Corners and Darden immediately after the spin-off Estimated range of E&P dividend is $300mm to $400mm The dividend is taxable and is expected to be paid in a combination of 80% stock and 20% cash Four Corners will have sufficient cash on balance sheet at spin for this need Impact of stock portion of dividend on share price will be essentially the same as a stock split Four Corners shareholders will make an election to receive cash or stock, subject to pro-ration Four Corners’ dividend per share will be adjusted to account for increased share count resulting from stock portion of E&P distribution
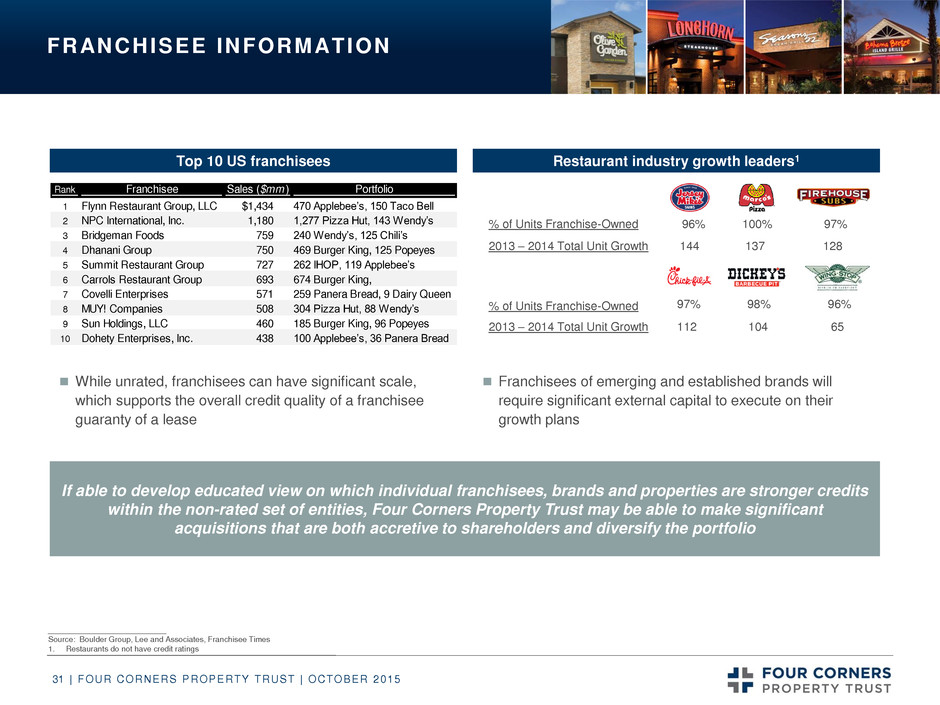
| FOUR CORNERS PROPERTY TRUST | OCTOBER 2015 31 FRANCHISEE INFORMATION Top 10 US franchisees Restaurant industry growth leaders1 If able to develop educated view on which individual franchisees, brands and properties are stronger credits within the non-rated set of entities, Four Corners Property Trust may be able to make significant acquisitions that are both accretive to shareholders and diversify the portfolio While unrated, franchisees can have significant scale, which supports the overall credit quality of a franchisee guaranty of a lease Franchisees of emerging and established brands will require significant external capital to execute on their growth plans Rank Franchisee Sales ($mm ) Portfolio 1 Flynn Restaurant Group, LLC $1,434 470 Applebee’s, 150 Taco Bell 2 PC International, Inc. 1,180 1,277 Pizza Hut, 143 Wendy’s 3 Bridgeman Foods 759 240 Wendy’s, 125 Chili’s 4 Dhanani Group 750 469 Burger King, 125 Popeyes 5 ummit Res au ant Group 727 262 IHOP, 119 Applebee’s 6 Carrols Restaurant Group 693 674 Burger King, 7 Covelli Enterprises 571 259 Panera Bread, 9 Dairy Queen 8 MUY! Companies 508 304 Pizza Hut, 88 Wendy’s 9 Sun Holdings, LLC 460 185 Burger King, 96 Popeyes 10 Dohety Enterprises, Inc. 438 100 Applebee’s, 36 Panera Bread % of Units Franchise-Owned 2013 – 2014 Total Unit Growth 100% 98% 137 104 112 % of Units Franchise-Owned 2013 – 2014 Total Unit Growth 97% 96% 128 65 144 96% 97% ___________________________ Source: Boulder Group, Lee and Associates, Franchisee Times 1. Restaurants do not have credit ratings
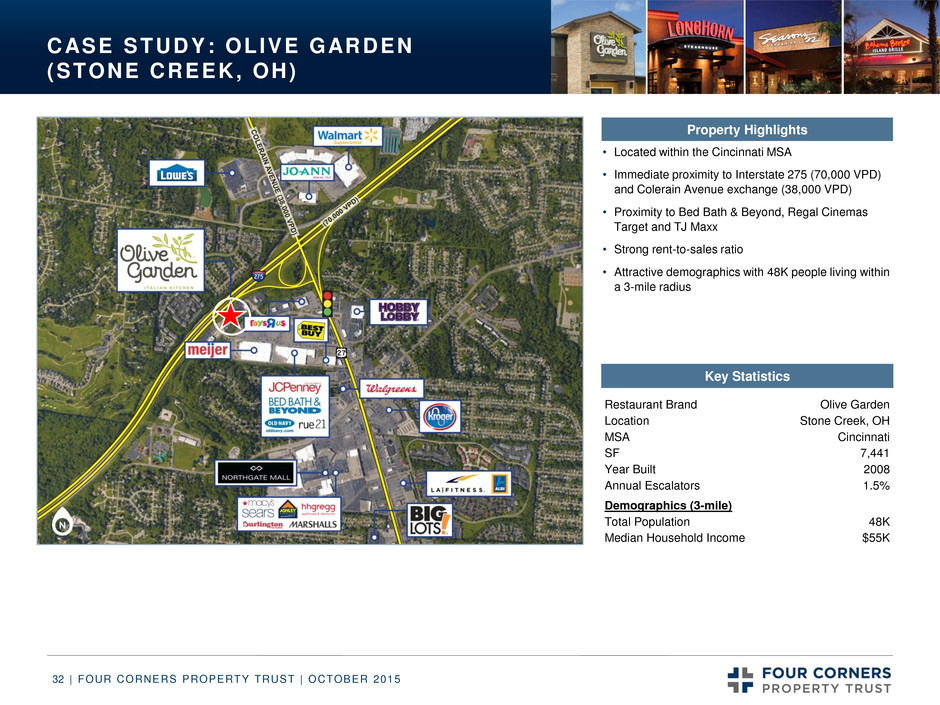
| FOUR CORNERS PROPERTY TRUST | OCTOBER 2015 32 CASE STUDY: OLIVE GARDEN (STONE CREEK, OH) • Located within the Cincinnati MSA • Immediate proximity to Interstate 275 (70,000 VPD) and Colerain Avenue exchange (38,000 VPD) • Proximity to Bed Bath & Beyond, Regal Cinemas Target and TJ Maxx • Strong rent-to-sales ratio • Attractive demographics with 48K people living within a 3-mile radius Key Statistics Property Highlights Restaurant Brand Olive Garden Location Stone Creek, OH MSA Cincinnati SF 7,441 Year Built 2008 Annual Escalators 1.5% Demographics (3-mile) Total Population 48K Median Household Income $55K
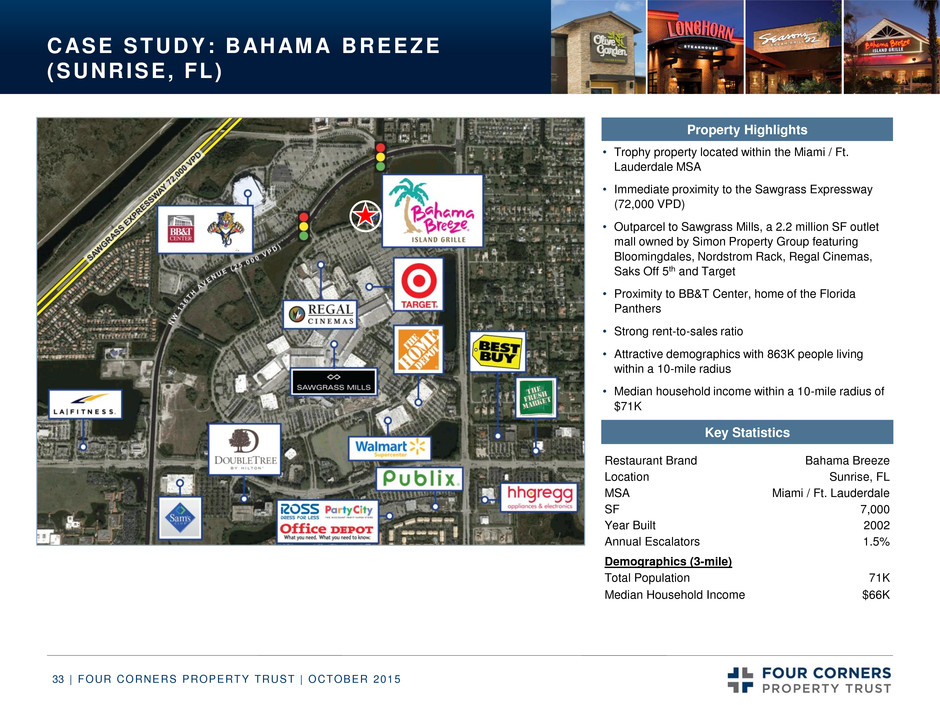
| FOUR CORNERS PROPERTY TRUST | OCTOBER 2015 33 CASE STUDY: BAHAMA BREEZE (SUNRISE, FL) • Trophy property located within the Miami / Ft. Lauderdale MSA • Immediate proximity to the Sawgrass Expressway (72,000 VPD) • Outparcel to Sawgrass Mills, a 2.2 million SF outlet mall owned by Simon Property Group featuring Bloomingdales, Nordstrom Rack, Regal Cinemas, Saks Off 5th and Target • Proximity to BB&T Center, home of the Florida Panthers • Strong rent-to-sales ratio • Attractive demographics with 863K people living within a 10-mile radius • Median household income within a 10-mile radius of $71K Key Statistics Property Highlights Restaurant Brand Bahama Breeze Location Sunrise, FL MSA Miami / Ft. Lauderdale SF 7,000 Year Built 2002 Annual Escalators 1.5% Demographics (3-mile) Total Population 71K Median Household Income $66K
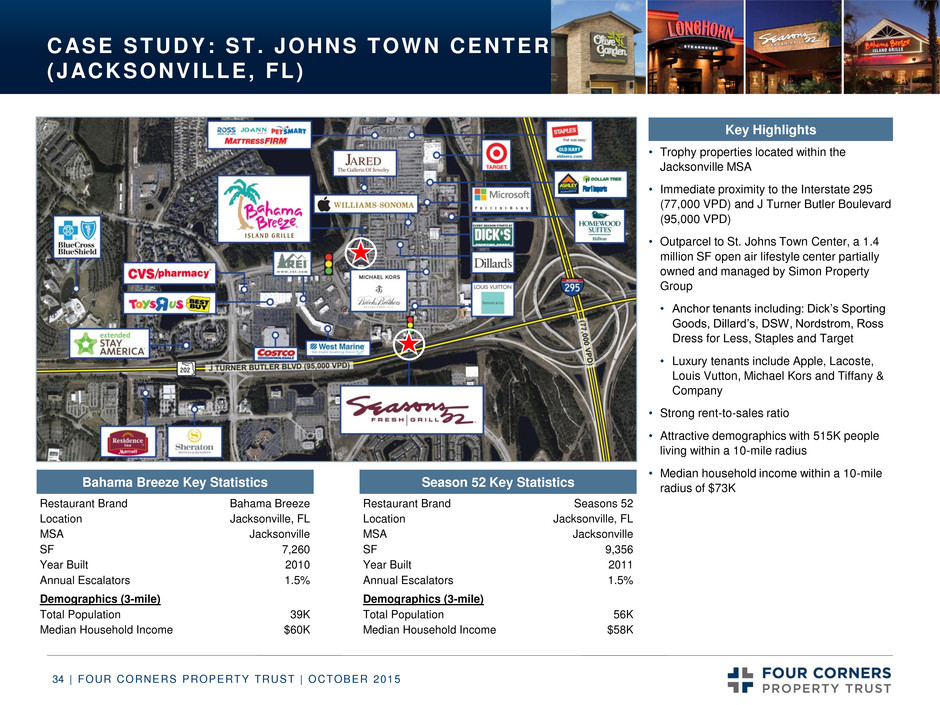
| FOUR CORNERS PROPERTY TRUST | OCTOBER 2015 34 CASE STUDY: ST. JOHNS TOWN CENTER (JACKSONVILLE, FL) Bahama Breeze Key Statistics Season 52 Key Statistics Key Highlights • Trophy properties located within the Jacksonville MSA • Immediate proximity to the Interstate 295 (77,000 VPD) and J Turner Butler Boulevard (95,000 VPD) • Outparcel to St. Johns Town Center, a 1.4 million SF open air lifestyle center partially owned and managed by Simon Property Group • Anchor tenants including: Dick’s Sporting Goods, Dillard’s, DSW, Nordstrom, Ross Dress for Less, Staples and Target • Luxury tenants include Apple, Lacoste, Louis Vutton, Michael Kors and Tiffany & Company • Strong rent-to-sales ratio • Attractive demographics with 515K people living within a 10-mile radius • Median household income within a 10-mile radius of $73K Restaurant Brand Bahama Breeze Location Jacksonville, FL MSA Jacksonville SF 7,260 Year Built 2010 Annual Escalators 1.5% Demographics (3-mile) Total Population 39K Median Household Income $60K Restaurant Brand Seasons 52 Location Jacksonville, FL MSA Jacksonville SF 9,356 Year Built 2011 Annual Escalators 1.5% Demographics (3-mile) Total Population 56K Median Household Income $58K
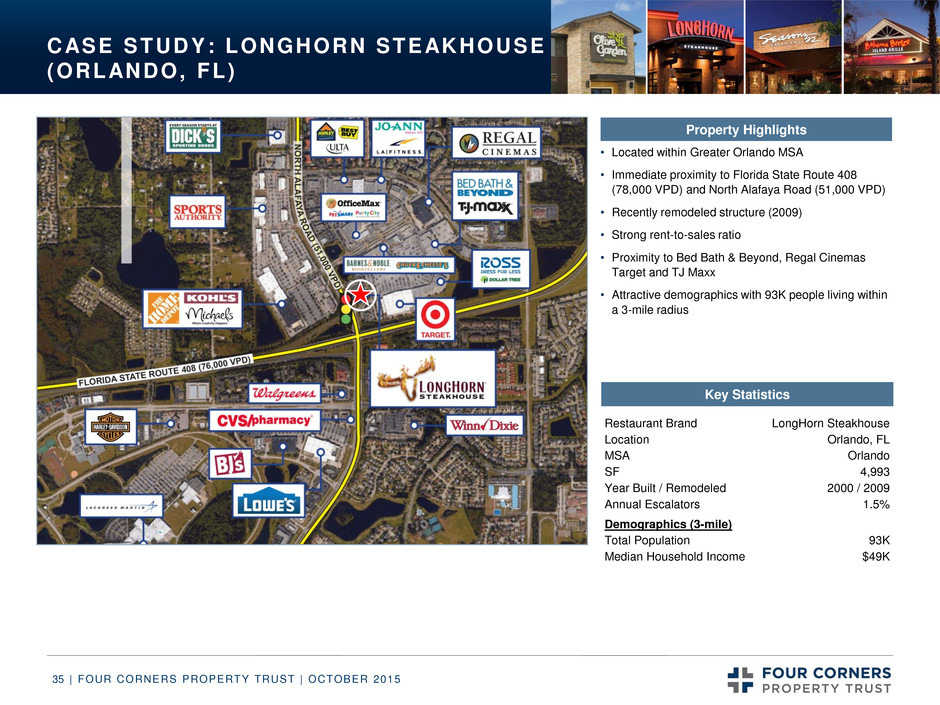
| FOUR CORNERS PROPERTY TRUST | OCTOBER 2015 35 CASE STUDY: LONGHORN STEAKHOUSE (ORLANDO, FL) Key Statistics • Located within Greater Orlando MSA • Immediate proximity to Florida State Route 408 (78,000 VPD) and North Alafaya Road (51,000 VPD) • Recently remodeled structure (2009) • Strong rent-to-sales ratio • Proximity to Bed Bath & Beyond, Regal Cinemas Target and TJ Maxx • Attractive demographics with 93K people living within a 3-mile radius Property Highlights Restaurant Brand LongHorn Steakhouse Location Orlando, FL MSA Orlando SF 4,993 Year Built / Remodeled 2000 / 2009 Annual Escalators 1.5% Demographics (3-mile) Total Population 93K Median Household Income $49K
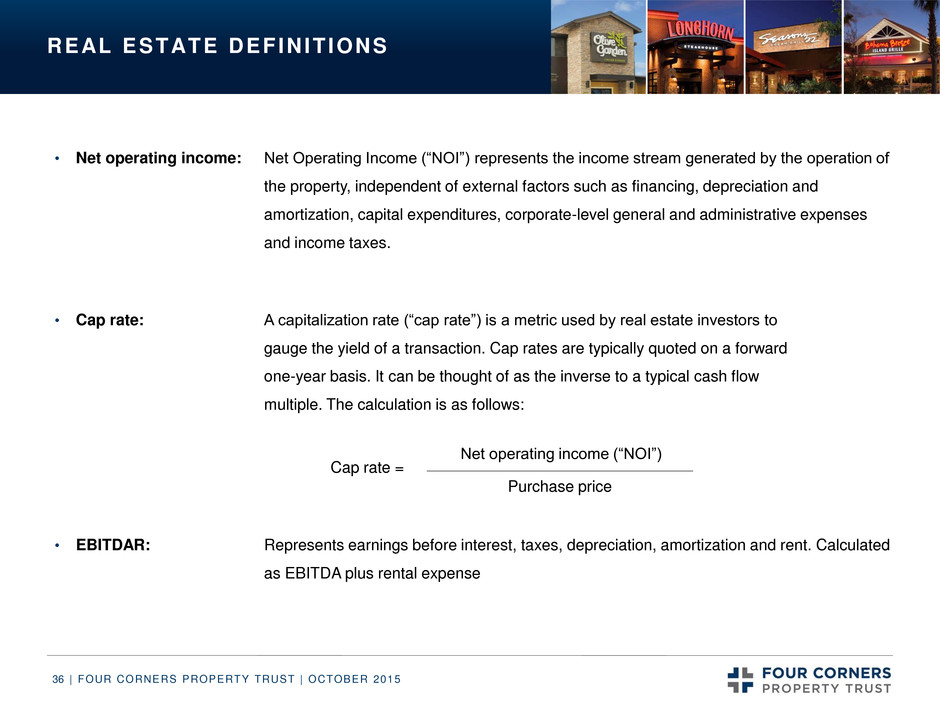
| FOUR CORNERS PROPERTY TRUST | OCTOBER 2015 36 REAL ESTATE DEFINIT IONS • Net operating income: Net Operating Income (“NOI”) represents the income stream generated by the operation of the property, independent of external factors such as financing, depreciation and amortization, capital expenditures, corporate-level general and administrative expenses and income taxes. • Cap rate: A capitalization rate (“cap rate”) is a metric used by real estate investors to gauge the yield of a transaction. Cap rates are typically quoted on a forward one-year basis. It can be thought of as the inverse to a typical cash flow multiple. The calculation is as follows: • EBITDAR: Represents earnings before interest, taxes, depreciation, amortization and rent. Calculated as EBITDA plus rental expense Cap rate = Net operating income (“NOI”) Purchase price
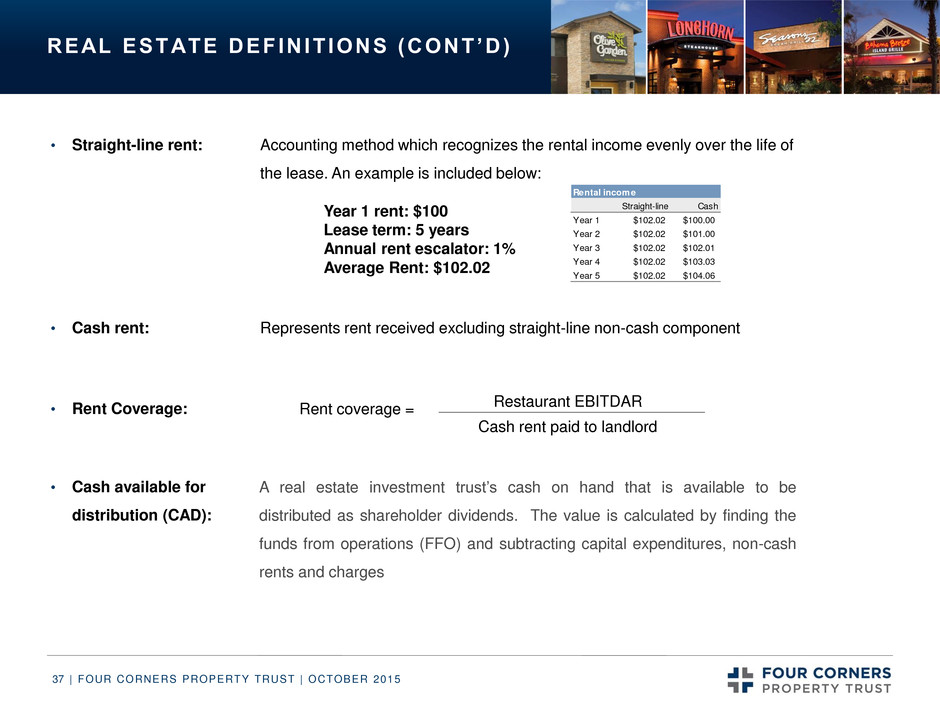
| FOUR CORNERS PROPERTY TRUST | OCTOBER 2015 37 REAL ESTATE DEFINIT IONS (CONT’D) • Straight-line rent: Accounting method which recognizes the rental income evenly over the life of the lease. An example is included below: • Cash rent: Represents rent received excluding straight-line non-cash component • Rent Coverage: • Cash available for distribution (CAD): Year 1 rent: $100 Lease term: 5 years Annual rent escalator: 1% Average Rent: $102.02 Rental income Straight-line Cash Year 1 $102.02 $100.00 Year 2 $102.02 $101.00 Year 3 $102.02 $102.01 Year 4 $102.02 $103.03 Year 5 $102.02 $104.06 Rent coverage = Restaurant EBITDAR Cash rent paid to landlord A real estate investment trust’s cash on hand that is available to be distributed as shareholder dividends. The value is calculated by finding the funds from operations (FFO) and subtracting capital expenditures, non-cash rents and charges
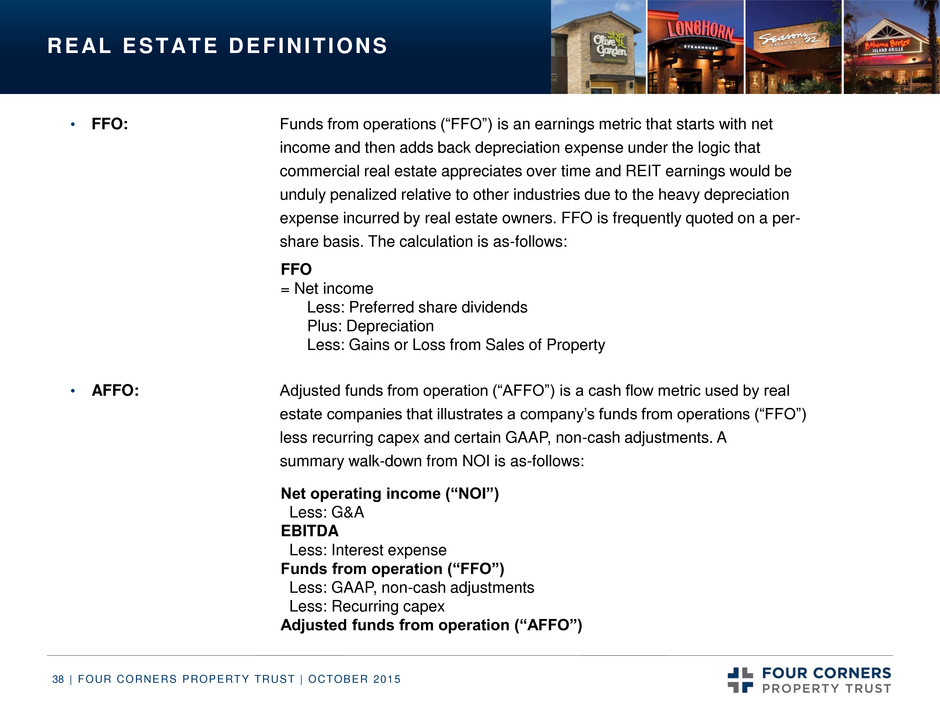
| FOUR CORNERS PROPERTY TRUST | OCTOBER 2015 38 REAL ESTATE DEFINIT IONS • FFO: Funds from operations (“FFO”) is an earnings metric that starts with net income and then adds back depreciation expense under the logic that commercial real estate appreciates over time and REIT earnings would be unduly penalized relative to other industries due to the heavy depreciation expense incurred by real estate owners. FFO is frequently quoted on a per- share basis. The calculation is as-follows: FFO = Net income Less: Preferred share dividends Plus: Depreciation Less: Gains or Loss from Sales of Property • AFFO: Adjusted funds from operation (“AFFO”) is a cash flow metric used by real estate companies that illustrates a company’s funds from operations (“FFO”) less recurring capex and certain GAAP, non-cash adjustments. A summary walk-down from NOI is as-follows: Net operating income (“NOI”) Less: G&A EBITDA Less: Interest expense Funds from operation (“FFO”) Less: GAAP, non-cash adjustments Less: Recurring capex Adjusted funds from operation (“AFFO”)
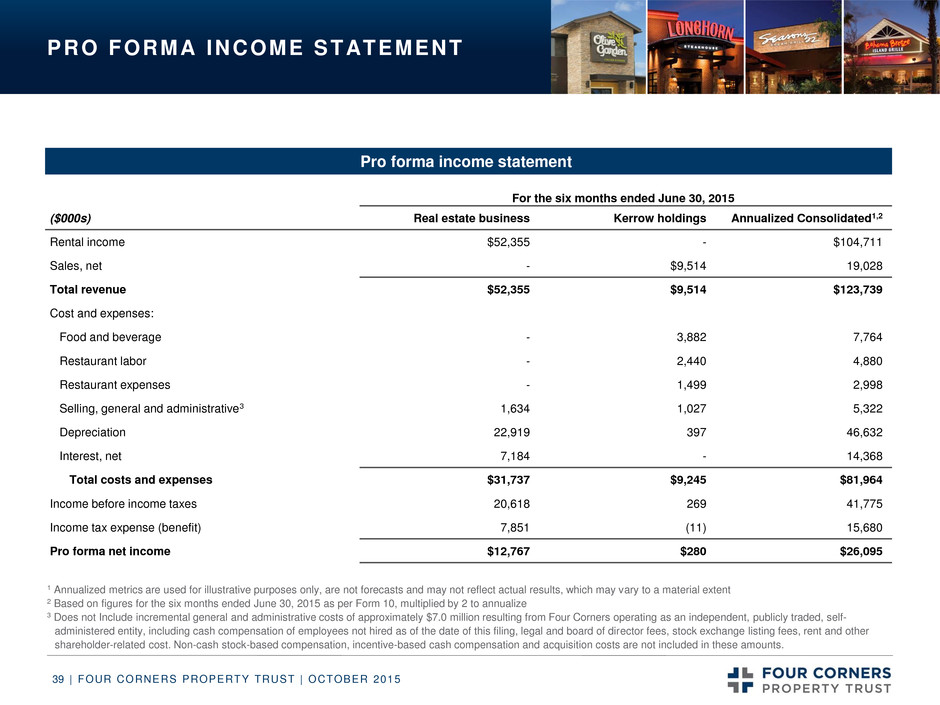
| FOUR CORNERS PROPERTY TRUST | OCTOBER 2015 39 PRO FORMA INCOME STATEMENT For the six months ended June 30, 2015 ($000s) Real estate business Kerrow holdings Annualized Consolidated1,2 Rental income $52,355 - $104,711 Sales, net - $9,514 19,028 Total revenue $52,355 $9,514 $123,739 Cost and expenses: Food and beverage - 3,882 7,764 Restaurant labor - 2,440 4,880 Restaurant expenses - 1,499 2,998 Selling, general and administrative3 1,634 1,027 5,322 Depreciation 22,919 397 46,632 Interest, net 7,184 - 14,368 Total costs and expenses $31,737 $9,245 $81,964 Income before income taxes 20,618 269 41,775 Income tax expense (benefit) 7,851 (11) 15,680 Pro forma net income $12,767 $280 $26,095 Pro forma income statement Impacted by revolver size 1 Annualized metrics are used for illustrative purposes only, are not forecasts and may not reflect actual results, which may vary to a material extent 2 Based on figures for the six months ended June 30, 2015 as per Form 10, multiplied by 2 to annualize 3 Does not Include incremental general and administrative costs of approximately $7.0 million resulting from Four Corners operating as an independent, publicly traded, self- administered entity, including cash compensation of employees not hired as of the date of this filing, legal and board of director fees, stock exchange listing fees, rent and other shareholder-related cost. Non-cash stock-based compensation, incentive-based cash compensation and acquisition costs are not included in these amounts.
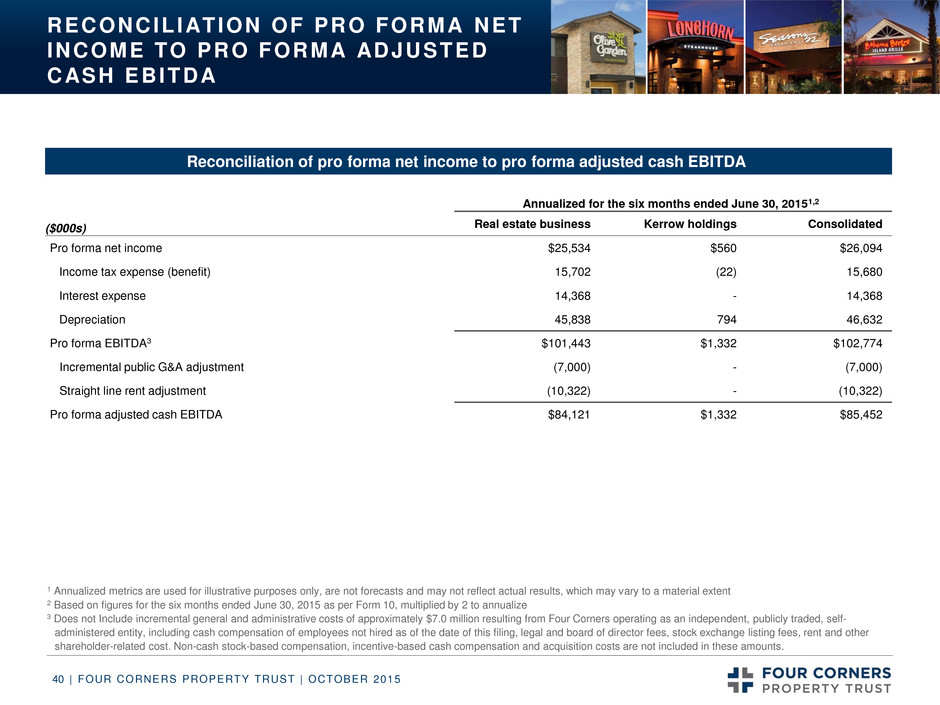
| FOUR CORNERS PROPERTY TRUST | OCTOBER 2015 40 RECONCILIATION OF PRO FORMA NET INCOME TO PRO FORMA ADJUSTED CASH EBITDA Annualized for the six months ended June 30, 20151,2 ($000s) Real estate business Kerrow holdings Consolidated Pro forma net income $25,534 $560 $26,094 Income tax expense (benefit) 15,702 (22) 15,680 Interest expense 14,368 - 14,368 Depreciation 45,838 794 46,632 Pro forma EBITDA3 $101,443 $1,332 $102,774 Incremental public G&A adjustment (7,000) - (7,000) Straight line rent adjustment (10,322) - (10,322) Pro forma adjusted cash EBITDA $84,121 $1,332 $85,452 Reconciliation of pro forma net income to pro forma adjusted cash EBITDA Impacted by revolver size 1 Annualized metrics are used for illustrative purposes only, are not forecasts and may not reflect actual results, which may vary to a material extent 2 Based on figures for the six months ended June 30, 2015 as per Form 10, multiplied by 2 to annualize 3 Does not Include incremental general and administrative costs of approximately $7.0 million resulting from Four Corners operating as an independent, publicly traded, self- administered entity, including cash compensation of employees not hired as of the date of this filing, legal and board of director fees, stock exchange listing fees, rent and other shareholder-related cost. Non-cash stock-based compensation, incentive-based cash compensation and acquisition costs are not included in these amounts.
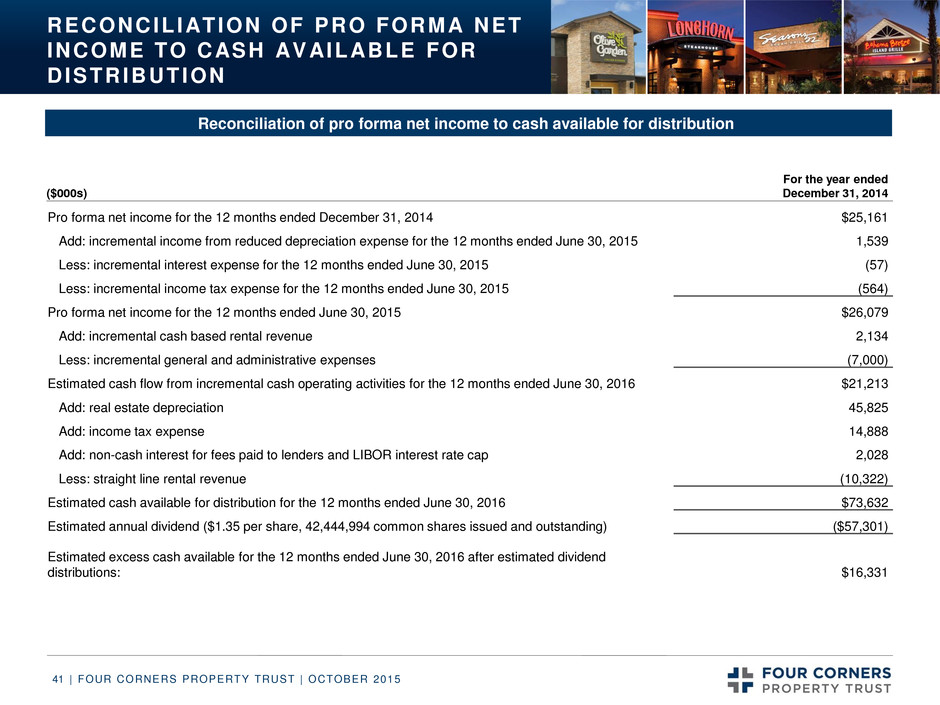
| FOUR CORNERS PROPERTY TRUST | OCTOBER 2015 41 RECONCILIATION OF PRO FORMA NET INCOME TO CASH AVAILABLE FOR DISTRIBUTION Reconciliation of pro forma net income to cash available for distribution ($000s) For the year ended December 31, 2014 Pro forma net income for the 12 months ended December 31, 2014 $25,161 Add: incremental income from reduced depreciation expense for the 12 months ended June 30, 2015 1,539 Less: incremental interest expense for the 12 months ended June 30, 2015 (57) Less: incremental income tax expense for the 12 months ended June 30, 2015 (564) Pro forma net income for the 12 months ended June 30, 2015 $26,079 Add: incremental cash based rental revenue 2,134 Less: incremental general and administrative expenses (7,000) Estimated cash flow from incremental cash operating activities for the 12 months ended June 30, 2016 $21,213 Add: real estate depreciation 45,825 Add: income tax expense 14,888 Add: non-cash interest for fees paid to lenders and LIBOR interest rate cap 2,028 Less: straight line rental revenue (10,322) Estimated cash available for distribution for the 12 months ended June 30, 2016 $73,632 Estimated annual dividend ($1.35 per share, 42,444,994 common shares issued and outstanding) ($57,301) Estimated excess cash available for the 12 months ended June 30, 2016 after estimated dividend distributions: $16,331 Impacted by revolver size
