Attached files
UNITED STATES
SECURITIES AND EXCHANGE COMMISSION
Washington, D.C. 20549
FORM 10-K |
(Mark One)
x ANNUAL REPORT PURSUANT TO SECTION 13 OR 15(D) OF THE SECURITIES EXCHANGE ACT OF 1934 for the fiscal year ended August 29, 2015; or
o TRANSITION REPORT PURSUANT TO SECTION 13 OR 15(D) OF THE SECURITIES EXCHANGE ACT OF 1934 for the transition period from ___________________ to _______________________
Commission File Number 001‑06403

WINNEBAGO INDUSTRIES, INC.
(Exact name of registrant as specified in its charter)
Iowa | 42-0802678 | |
(State or other jurisdiction of | (I.R.S. Employer Identification No.) | |
incorporation or organization) | ||
P.O. Box 152, Forest City, Iowa | 50436 | |
(Address of principal executive offices) | (Zip Code) | |
Registrant's telephone number, including area code: (641) 585‑3535
Securities registered pursuant to Section 12(b) of the Act:
Title of each class | Name of each exchange on which registered | |
Common Stock ($.50 par value) | The New York Stock Exchange, Inc. | |
Chicago Stock Exchange, Inc. | ||
Securities registered pursuant to Section 12(g) of the Act: None
Indicate by check mark if the registrant is a well-known seasoned issuer, as defined in Rule 405 of the Securities Act. Yes o No x
Indicate by check mark whether the registrant is not required to file reports pursuant to Section 13 or Section 15(d) of the Act. Yes o No x
Indicate by check mark whether the registrant (1) has filed all reports required to be filed by Section 13 or 15(d) of the Securities Exchange Act of 1934 during the preceding 12 months (or for such shorter period that the registrant was required to file such reports), and (2) has been subject to such filing requirements for the past 90 days. Yes x No o
Indicate by check mark whether the registrant has submitted electronically and posted on its corporate Web Site, if any, every Interactive Data File required to be submitted and posted pursuant to Rule 405 of Regulation S-T (§232.405 of this chapter) during the preceding 12 months (or for such shorter period that the registrant was required to submit and post such files). Yes x No o
Indicate by check mark if disclosure of delinquent filers pursuant to Item 405 of Regulation S-K (§229.405 of this chapter) is not contained herein, and will not be contained, to the best of the registrant's knowledge, in definitive proxy or information statements incorporated by reference in Part III of this Form 10-K or any amendment to this Form 10-K x.
Indicate by check mark whether the registrant is a large accelerated filer, an accelerated filer, a non-accelerated filer or a smaller reporting company. See the definitions of "large accelerated filer," "accelerated filer," and "smaller reporting company" in Rule 12b-2 of the Exchange Act.
Large Accelerated Filer o Accelerated Filer x Non-accelerated filer o Smaller Reporting Company o
Indicate by check mark whether the registrant is a shell company (as defined in Rule 12b-2 of the Act). Yes o No x
Aggregate market value of the common stock held by non-affiliates of the registrant: $621,119,096 (26,760,840 shares at the closing price on the New York Stock Exchange of $23.21 on February 27, 2015).
Common stock outstanding on October 13, 2015: 26,982,249 shares.
DOCUMENTS INCORPORATED BY REFERENCE
Portions of the registrant's Proxy Statement relating to the registrant's December 2015 Annual Meeting of Shareholders, scheduled to be held December 15, 2015, are incorporated by reference into Part II and Part III of this Annual Report on Form 10-K where indicated.
Winnebago Industries, Inc.
2015 Form 10-K Annual Report
Table of Contents
Item 1. | ||
Item 1A. | ||
Item 1B. | ||
Item 2. | ||
Item 3. | ||
Item 4. | ||
Item 5. | ||
Item 6. | ||
Item 7. | ||
Item 7A. | ||
Item 8. | ||
Item 9. | ||
Item 9A. | ||
Item 9B. | ||
Item 10. | ||
Item 11. | ||
Item 12. | ||
Item 13. | ||
Item 14. | ||
Item 15. | ||
ii
Glossary
The following terms and abbreviations appear in the text of this report and are defined as follows:
AOCI | Accumulated Other Comprehensive Income (Loss) |
Apollo | Apollo Motorhome Holidays, LLC |
Amended Credit Agreement | Credit Agreement dated as of May 28, 2014 by and between Winnebago Industries, Inc and Winnebago of Indiana, LLC, as Borrowers, and General Electric Capital Corporation, as Agent |
ARS | Auction Rate Securities |
ASC | Accounting Standards Codification |
ASP | Average Sales Price |
ASU | Accounting Standards Update |
COLI | Company Owned Life Insurance |
Credit Agreement | Credit Agreement dated as of October 31, 2012 by and between Winnebago Industries, Inc. and Winnebago of Indiana, LLC, as Borrowers, and General Electric Capital Corporation, as Agent (as amended May 28, 2014) |
EPS | Earnings Per Share |
ERP | Enterprise Resource Planning |
FASB | Financial Accounting Standards Board |
FIFO | First In, First Out |
GAAP | Generally Accepted Accounting Principles |
GECC | General Electric Capital Corporation |
IRS | Internal Revenue Service |
IT | Information Technology |
LIBOR | London Interbank Offered Rate |
LIFO | Last In, First Out |
MVA | Motor Vehicle Act |
NMF | Non-Meaningful Figure |
NOL | Net Operating Loss |
NYSE | New York Stock Exchange |
OCI | Other Comprehensive Income |
OEM | Original Equipment Manufacturing |
OSHA | Occupational Safety and Health Administration |
ROE | Return on Equity |
ROIC | Return on Invested Capital |
RV | Recreation Vehicle |
RVIA | Recreation Vehicle Industry Association |
SEC | U.S. Securities and Exchange Commission |
SERP | Supplemental Executive Retirement Plan |
SIR | Self-Insured Retention |
Stat Surveys | Statistical Surveys, Inc. |
SunnyBrook | SunnyBrook RV, Inc. |
Towables | Winnebago of Indiana, LLC, a wholly-owned subsidiary of Winnebago Industries, Inc. |
US | United States of America |
XBRL | eXtensible Business Reporting Language |
YTD | Year to Date |
iii
WINNEBAGO INDUSTRIES, INC.
FORM 10‑K
Report for the Fiscal Year Ended August 29, 2015
Forward-Looking Information
Certain of the matters discussed in this Annual Report on Form 10-K are "forward-looking statements" within the meaning of Section 27A of the Securities Act of 1933, as amended, and Section 21E of the Securities Exchange Act of 1934, as amended, which involve risks and uncertainties. A number of factors could cause actual results to differ materially from these statements, including, but not limited to, increases in interest rates, availability of credit, low consumer confidence, availability of labor, significant increase in repurchase obligations, inadequate liquidity or capital resources, availability and price of fuel, a slowdown in the economy, increased material and component costs, availability of chassis and other key component parts, sales order cancellations, slower than anticipated sales of new or existing products, new product introductions by competitors, the effect of global tensions, integration of operations relating to mergers and acquisitions activities, business interruptions, any unexpected expenses related to ERP and strategic sourcing projects, and other factors which may be disclosed throughout this Annual Report on Form 10-K. Although we believe that the expectations reflected in the "forward-looking statements" are reasonable, we cannot guarantee future results, levels of activity, performance or achievements. Undue reliance should not be placed on these "forward-looking statements," which speak only as of the date of this report. We undertake no obligation to publicly update or revise any "forward-looking statements," whether as a result of new information, future events or otherwise, except as required by law or the rules of the NYSE. We advise you, however, to consult any further disclosures made on related subjects in future quarterly reports on Form 10-Q and current reports on Form 8-K that are filed or furnished with the SEC.
PART I
Item 1. Business
General
The "Company," "Winnebago Industries," "we," "our" and "us" are used interchangeably to refer to Winnebago Industries, Inc. and its subsidiary, Winnebago of Indiana, LLC, as appropriate in the context.
Winnebago Industries, Inc., headquartered in Forest City, Iowa, is a leading United States manufacturer of RVs used primarily in leisure travel and outdoor recreation activities.
As a result of our motorhome manufacturing capabilities, equipment and facilities, we use our incremental capacity to manufacture product for outside customers. Other products manufactured by us consist primarily of OEM parts, including extruded aluminum and other component products for other manufacturers and commercial vehicles.
We own facilities in Middlebury, Indiana, where we manufacture travel trailers and fifth wheel RVs.
We were incorporated under the laws of the state of Iowa on February 12, 1958, and adopted our present name on February 28, 1961. Our executive offices are located at 605 West Crystal Lake Road in Forest City, Iowa. Our telephone number is (641) 585-3535.
Available Information
Our website, located at www.wgo.net, provides additional information about us. On our website, you can obtain, free of charge, this and prior year Annual Reports on Form 10-K, Quarterly Reports on Form 10-Q, Current Reports on Form 8-K and all of our other filings with the SEC. Our recent press releases are also available on our website. Our website also contains important information regarding our corporate governance practices. Information contained on our website is not incorporated into this Annual Report on Form 10-K. You may also read and copy any materials that we file with the SEC at the SEC's Public Reference Room at 100 F Street, NE, Room 1580, Washington, D.C. 20549. You may obtain information on the Public Reference Room by calling the SEC at 1-800-SEC-0330. In addition, the SEC maintains a website that contains reports, proxy statements and other information that is filed electronically with the SEC. The website can be accessed at www.sec.gov.
1
Principal Products
We have one reportable segment, the RV market. We design, develop, manufacture and market motorized and towable recreation products along with supporting products and services. Net revenues by major product classes were as follows:
Year Ended (1) | |||||||||||||||||||||||||||||
(In thousands) | August 29, 2015 | August 30, 2014 | August 31, 2013 | August 25, 2012 | August 27, 2011 | ||||||||||||||||||||||||
Motorhomes (2) | $ | 872,915 | 89.4 | % | $ | 853,488 | 90.3 | % | $ | 718,580 | 89.5 | % | $ | 496,193 | 85.3 | % | $ | 456,337 | 91.9 | % | |||||||||
Towables (3) | 71,684 | 7.3 | % | 58,123 | 6.1 | % | 54,683 | 6.8 | % | 56,784 | 9.8 | % | 16,712 | 3.4 | % | ||||||||||||||
Other manufactured products | 31,906 | 3.3 | % | 33,552 | 3.6 | % | 29,902 | 3.7 | % | 28,702 | 4.9 | % | 23,369 | 4.7 | % | ||||||||||||||
Total net revenues | $ | 976,505 | 100.0 | % | $ | 945,163 | 100.0 | % | $ | 803,165 | 100.0 | % | $ | 581,679 | 100.0 | % | $ | 496,418 | 100.0 | % | |||||||||
(1) | The fiscal year ended August 31, 2013 contained 53 weeks; all other fiscal years contained 52 weeks. |
(2) | Includes motorhome units, parts and services |
(3) | Includes towable units and parts. |
Motorhomes, parts and service. A motorhome is a self-propelled mobile dwelling used primarily as temporary living quarters during vacation and camping trips, or to support some other active lifestyle. The RVIA classifies motorhomes into three types, all of which we manufacture and sell under the Winnebago brand name, which are defined as follows:
Type | Description | Winnebago products offerings |
Class A | Conventional motorhomes constructed directly on medium- and heavy-duty truck chassis, which include the engine and drivetrain components. The living area and driver's compartment are designed and produced by the motorhome manufacturer. | Gas: Adventurer, Brave, Sightseer, Suncruiser, Sunova, Sunstar, Sunstar LX, Tribute, Vista, Vista LX |
Diesel: Ellipse, Ellipse Ultra, Forza, Grand Tour, Journey, Meridian, Reyo, Solei, Tour, Via | ||
Class B (gas and diesel) | Panel-type vans to which sleeping, kitchen, and/or toilet facilities are added. These models may also have a top extension to provide more headroom. | Winnebago Touring Coach (Era, Travato) |
Class C (gas and diesel) | Motorhomes built on van-type chassis onto which the motorhome manufacturer constructs a living area with access to the driver's compartment. | Aspect, Cambria, Minnie Winnie, Navion, Spirit, Trend, View, Viva! |
Motorhomes generally provide living accommodations for up to seven people and include kitchen, dining, sleeping and bath areas, and in some models, a lounge. Optional equipment accessories include, among other items, generators, home theater systems, king-size beds, and UltraLeatherTM upholstery and a wide selection of interior equipment. With the purchase of any new motorhome, we offer a comprehensive 12-month/15,000-mile warranty on the coach and, for Class A and C motorhomes, a 3-year/36,000-mile structural warranty on sidewalls and floors.
Our Class A, B and C motorhomes are sold by dealers in the retail market with manufacturer's suggested retail prices ranging from approximately $70,000 to $430,000, depending on size and model, plus optional equipment and delivery charges. Our motorhomes range in length from 21 to 43 feet.
Unit sales of our motorhomes for the last five fiscal years were as follows:
Year Ended (1)(2) | ||||||||||||||||||||||||
Units | August 29, 2015 | August 30, 2014 | August 31, 2013 | August 25, 2012 | August 27, 2011 | |||||||||||||||||||
Class A | 3,442 | 37.8 | % | 4,466 | 51.0 | % | 3,761 | 55.1 | % | 2,579 | 55.6 | % | 2,436 | 55.4 | % | |||||||||
Class B | 991 | 10.9 | % | 751 | 8.6 | % | 372 | 5.5 | % | 319 | 6.9 | % | 103 | 2.3 | % | |||||||||
Class C | 4,664 | 51.3 | % | 3,538 | 40.4 | % | 2,688 | 39.4 | % | 1,744 | 37.6 | % | 1,856 | 42.2 | % | |||||||||
Total motorhomes | 9,097 | 100.0 | % | 8,755 | 100.0 | % | 6,821 | 100.0 | % | 4,642 | 100.0 | % | 4,395 | 100.0 | % | |||||||||
(1) | The fiscal year ended August 31, 2013 contained 53 weeks; all other fiscal years contained 52 weeks. |
(2) | Percentages may not add due to rounding differences. |
Motorhome parts and service activities represent revenues generated by service work we perform for retail customers at our Forest City, Iowa facility as well as revenues from sales of RV parts. As of August 29, 2015, our parts inventory was approximately $3.0 million and is located in a 450,000-square foot warehouse with what we believe to be among the most sophisticated distribution and tracking systems in the industry. Our competitive strategy is to provide proprietary manufactured parts through our dealer network, which we believe increases customer satisfaction and the value of our motorhomes.
2
Towables. A towable is a non-motorized vehicle that is designed to be towed by passenger automobiles, pickup trucks, SUVs or vans and is used as temporary living quarters for recreational travel. The RVIA classifies towables in four types: conventional travel trailers, fifth wheels, folding campers trailers and truck campers; we manufacture and sell conventional travel trailers and fifth wheels under the Winnebago brand name, which are defined as follows:
Type | Description | Winnebago product offerings |
Travel trailer | Conventional travel trailers are towed by means of a hitch attached to the frame of the vehicle. | Minnie, Micro Minnie, Ultralite, Spyder |
Fifth wheel | Fifth wheel trailers are constructed with a raised forward section that is connected to the vehicle with a special fifth wheel hitch. | Voyage, Latitude, Destination, Scorpion |
Unit sales of our towables for the last five fiscal years were as follows:
Year Ended (1)(2) | ||||||||||||||||||||||||
Units | August 29, 2015 | August 30, 2014 | August 31, 2013 | August 25, 2012 | August 27, 2011 | |||||||||||||||||||
Travel trailer | 2,182 | 81.7 | % | 2,052 | 81.8 | % | 2,038 | 80.4 | % | 1,372 | 58.7 | % | 575 | 74.8 | % | |||||||||
Fifth wheel | 488 | 18.3 | % | 457 | 18.2 | % | 497 | 19.6 | % | 966 | 41.3 | % | 194 | 25.2 | % | |||||||||
Total towables | 2,670 | 100.0 | % | 2,509 | 100.0 | % | 2,535 | 100.0 | % | 2,338 | 100.0 | % | 769 | 100.0 | % | |||||||||
(1) | The fiscal year ended August 31, 2013 contained 53 weeks; all other fiscal years contained 52 weeks. |
(2) | Percentages may not add due to rounding differences. |
Other Manufactured Products. As a result of our motorhome manufacturing capabilities, equipment and facilities, we use our incremental capacity to manufacture product for outside customers. Notably, we manufacture aluminum extrusions which are sold to approximately 75 customers. To a limited extent, we manufacture other component parts sold to outside manufacturers. We also manufacture commercial vehicles which are motorhome shells, primarily custom designed for the buyer's special needs and requirements, such as law enforcement command centers, mobile medical clinics and mobile office space. These commercial vehicles are sold through our dealer network. In addition, we also provide commercial vehicles as bare shells to third-party upfitters for conversion at their facilities. We are a manufacturer of commercial transit buses that are sold to both public and private transportation agencies for use in community based transit programs, para transit applications, hospitality shuttles, car rental shuttles, airport shuttles, and other various applications. Our transit buses are marketed under the trade name Metro, Metro Link, and Metro Connect and distributed to a nationwide dealer network through our exclusive distribution partner, Metro Worldwide. In Fiscal 2016 we plan to exit our bus and aluminum extrusion operations and focus our efforts on our higher margin motorhome business, which we believe will both add production capacity and improve profitability.
Production
We generally produce motorhomes and towables to order from dealers. We have some ability to increase our capacity by scheduling overtime and/or hiring additional production employees or to decrease our capacity through the use of shortened workweeks and/or reducing head count. We have long been known as an industry leader in innovation as each year we introduce new or redesigned products. These changes generally include new floor plans and sizes as well as design and decor modifications.
Our motorhomes are produced in the state of Iowa at four different campuses. Our Forest City facilities are vertically integrated and provide mechanized assembly line manufacturing for Class A and C motorhomes. We assemble Class B motorhomes in our Lake Mills facilities. Hardwood cabinet, countertop and compartment door products are manufactured at our Charles City campus. Wire harness fabrication is in the process of being transferred to our recently acquired facility in Waverly. Our motorhome bodies are made from various materials and structural components which are typically laminated into rigid, lightweight panels. Body designs are developed with computer aided design and manufacturing and subjected to a variety of tests and evaluations to meet our standards and requirements. We manufacture a number of components utilized in our motorhomes, with the principal exceptions being chassis, engines, generators and appliances.
Most of our raw materials such as steel, aluminum, fiberglass and wood products are obtainable from numerous sources. Certain parts, especially motorhome chassis, are available from a small group of suppliers. We are currently purchasing Class A and C chassis from Ford Motor Company, Mercedes-Benz USA (a Daimler company) and Mercedes-Benz Canada (a Daimler company) and Class A chassis from Freightliner Custom Chassis Corporation (a Daimler company). Class B chassis are purchased from Mercedes-Benz USA, Mercedes-Benz Canada, FCA US, LLC and FCA Canada, Inc.. Class C chassis are also purchased from FCA US, LLC and FCA Canada, Inc. In Fiscal 2015, only two vendors, Ford Motor Company and Mercedes-Benz (USA and Canada) individually accounted for more than 10% of our raw material purchases and approximating 33% in the aggregate.
Our towables are produced at an assembly plant located in Middlebury, Indiana. The majority of components are comprised of frames, appliances and furniture and are purchased from suppliers.
3
Backlog
The approximate revenue of our motorhome backlog was $156.4 million and $172.6 million as of August 29, 2015 and August 30, 2014, respectively. The approximate revenue of our towable backlog was $6.2 million and $3.8 million as of August 29, 2015 and August 30, 2014, respectively. A more detailed description of our motorhome and towable order backlog is included in Item 7, "Management's Discussion and Analysis of Financial Condition and Results of Operations."
Distribution and Financing
We market our RVs on a wholesale basis to a diversified independent dealer network located throughout the US and, to a limited extent, in Canada. Foreign sales, including Canada, were 8% or less of net revenues during each of the past three fiscal years. See Note 14 to our Financial Statements of this Annual Report on Form 10-K.
As of August 29, 2015, our RV dealer network in the US and Canada included 292 motorized and 136 towable physical dealer locations, 123 of these locations carried both Winnebago motorized and towable product. With respect to product line points of distribution (number of product lines offered at each dealer location) as of August 29, 2015 there were 2,626 motorized points of distribution and 774 towable product line points of distribution.
One of our dealer organizations accounted for 17.9% of our net revenue for Fiscal 2015, as this dealer sold our products in 75 of their dealership locations across 28 US states. A second dealer organization accounted for 15.0% of our net revenue for Fiscal 2015, as this dealer sold our products in 11 dealership locations across 4 US states.
We have sales and service agreements with dealers which are subject to annual review. Many of the dealers are also engaged in other areas of business, including the sale of automobiles, trailers or boats, and many dealers carry one or more competitive lines of RVs. We continue to place high emphasis on the capability of our dealers to provide complete service for our RVs. Dealers are obligated to provide full service for owners of our RVs or, in lieu thereof, to secure such service from other authorized providers.
We advertise and promote our products through national RV magazines, the distribution of product brochures, the Go RVing national advertising campaign sponsored by RVIA, direct-mail advertising campaigns, various national promotional opportunities and on a local basis through trade shows, television, radio and newspapers, primarily in connection with area dealers.
RV sales to dealers are made on cash terms. Most dealers are financed on a "floorplan" basis under which a bank or finance company lends the dealer all, or substantially all, of the purchase price, collateralized by a security interest in the merchandise purchased. As is customary in the RV industry, we typically enter into a repurchase agreement with a lending institution financing a dealer's purchase of our product upon the lending institution's request and after completion of a credit check of the dealer involved. Our repurchase agreements provide that for up to 18 months after a unit is financed, in the event of default by the dealer on the agreement to pay the lending institution and repossession of the unit(s) by the lending institution, we will repurchase the financed merchandise. Our maximum exposure for repurchases varies significantly from time to time, depending upon general economic conditions, seasonal shipments, competition, dealer organization, gasoline availability and access to and the cost of financing. See Note 10.
Competition
The RV market is highly competitive with many other manufacturers selling products which compete directly with our products. Some of our competitors are much larger than us, most notably in the towable RV market, which may provide these competitors additional purchasing power. The competition in the RV industry is based upon design, price, quality and service of the products. We believe our principal competitive advantages are our brand strength, product quality and our service after the sale. We also believe that our motorhome products have historically commanded a price premium as a result of these competitive advantages.
Seasonality
The primary use of RVs for leisure travel and outdoor recreation has historically led to a peak retail selling season concentrated in the spring and summer months and lower sales during winter months. Our sales of RVs are generally influenced by this pattern in retail sales, but sales can also be affected by the level of dealer inventory. As a result, RV sales are historically lowest during our second fiscal quarter, which ends in February.
Regulations and Trademarks
We are subject to a variety of federal, state and local laws and regulations, including the MVA, under which the National Highway Traffic Safety Administration may require manufacturers to recall RVs that contain safety-related defects, and numerous state consumer protection laws and regulations relating to the operation of motor vehicles, including so-called "Lemon Laws." We are also subject to regulations established by OSHA. Our facilities are periodically inspected by federal and state agencies, such as OSHA. We are a member of RVIA, a voluntary association of RV manufacturers which promulgates RV safety standards. We place an RVIA seal on each of our RVs to certify that the RVIA standards have been met. We believe that our products and facilities comply in all material respects with the applicable vehicle safety, consumer protection, RVIA and OSHA regulations and standards.
4
Our operations are subject to a variety of federal and state environmental laws and regulations relating to the use, generation, storage, treatment, emission, labeling, and disposal of hazardous materials and wastes and noise pollution. We believe that we currently are in compliance with applicable environmental laws and regulations in all material aspects.
We have several registered trademarks associated with our motorhomes and towable products which include: Winnebago, Adventurer, Aspect, Brave, Cambria, Chalet, Destination, Ellipse, Era, Forza, Fuse, Itasca, Journey, Latitude, Meridian, Micro Minnie, Minnie, Minnie Winnie, Navion, Outlook, Reyo, Scorpion, Sightseer, Solei, Spirit, Spyder, Suncruiser, Sunova, Sunstar, Tour, Travato, Trend, Tribute, Via, View, Vista, Viva!, Voyage, and Winnebago Touring Coach. We believe that our trademarks and trade names are significant to our business and we have in the past and will in the future vigorously protect them against infringement by third parties. We are not dependent upon any patents or technology licenses of others for the conduct of our business.
Research and Development
Research and development expenditures are expensed as incurred. During Fiscal 2015, 2014 and 2013, we spent approximately $3.9 million, $4.3 million and $3.4 million, respectively on research and development activities.
Human Resources
At the end of Fiscal 2015, 2014 and 2013, we employed approximately 2,900, 2,850 and 2,680 persons, respectively. None of our employees are covered under a collective bargaining agreement. We believe our relations with our employees are good.
Executive Officers of the Registrant
Name | Office (Year First Elected an Officer) | Age |
Robert J. Olson | Interim Chief Executive Officer (August 6 - September 24, 2015) | 64 |
Lawrence A. Erickson | Chairman of the Board, Interim Chief Executive Officer (2015) | 66 |
S. Scott Degnan | Vice President, Sales and Product Management (2012) | 50 |
Steven R. Dummett | Vice President, Product Development (2015) | 60 |
Scott C. Folkers | Vice President, General Counsel & Secretary (2012) | 53 |
Daryl W. Krieger | Vice President, Manufacturing (2010) | 52 |
Sarah N. Nielsen | Vice President, Chief Financial Officer (2005) | 42 |
Bret A. Woodson | Vice President, Administration (2015) | 45 |
Donald L. Heidemann | Treasurer and Director of Finance (2007) | 43 |
Officers are elected annually by the Board of Directors. There are no family relationships between or among any of the Corporate Officers or Directors of the Company.
Mr. Olson was appointed Interim CEO in August 2015 and separated from service on September 24, 2015. Most recently, he served on our Board of Directors until December of 2014. He had been employed by Winnebago for over 40 years, retiring in 2012. During his employment, he served in various management positions within Winnebago including general manager of fabrication, vice president of manufacturing and senior vice president of operations. He served as CEO and President of the Company from 2007 to 2011, and Chairman of the Board from 2008 to 2012.
Mr. Erickson, was elected Chairman of the Board in August 2015 and was appointed Interim CEO on September 25, 2015. Mr Erickson, a retired business executive, is a former Senior Vice President and CFO of Rockwell Collins. He has served as a Lead Director of our Board since 2011.
Mr. Degnan joined Winnebago Industries in May 2012, as Vice President of Sales and Product Management. Prior to joining Winnebago Industries, Mr. Degnan served as vice president of sales for Riverside, California's MVP RV from 2010 to 2012. He also previously served in management and sales positions with Coachmen RV from 2008 to 2010, with National RV from 2007 to 2008, and Fleetwood Enterprises from 1987 to 2007.
Mr. Dummett has over 30 years of experience with Winnebago Industries. He was elected to the position of Vice President, Product Development in January, 2015. Prior to that time, he served as Design Engineering Manager from 2010 to 2015, and as Project Engineering Coordinator and Product Designer.
Mr. Folkers joined Winnebago Industries in August 2010, as assistant general counsel. He was elected to the position of Vice President, General Counsel and Secretary in June 2012. Prior to joining Winnebago Industries, Mr. Folkers was employed as in‑house counsel for John Morrell & Co., in Sioux Falls, SD from 1998 to 2010. Mr. Folkers is a member of the Iowa Bar Association.
5
Mr. Krieger has over 30 years of experience with Winnebago Industries. He has been Vice President, Manufacturing since May 2010. Prior to that time, he served as Director of Manufacturing from November 2009 to May 2010 and General Manager - Fabrication from February 2002 to November 2009.
Ms. Nielsen has ten years of experience with Winnebago Industries. She has been Vice President and Chief Financial Officer since November 2005. Ms. Nielsen joined the Company in August 2005 as Director of Special Projects and Training. Prior to joining Winnebago Industries, she was employed as a senior audit manager at Deloitte & Touche LLP, where she worked from 1995 to 2005. Ms. Nielsen is a Certified Public Accountant.
Mr. Woodson joined Winnebago Industries in January 2015 as Vice President, Administration. Prior to joining Winnebago Industries, Mr. Woodson had been employed by Corbion from 2007 to 2014 and Sara Lee from 1999 to 2007 and has over 22 years of business and human resources experience.
Mr. Heidemann has eight years of experience with Winnebago Industries. He was elected to the position of Treasurer in August 2007 and added Director of Finance responsibilities in August 2011. Prior to joining Winnebago Industries, Mr. Heidemann served in various treasury positions for Select Comfort Corporation from 2003 to July 2007 and served in various treasury positions for Rent-A-Center Incorporated from 1998 to 2003.
Item 1A. Risk Factors
The following risk factors should be considered carefully in addition to the other information contained in this Annual Report on Form 10-K. The risks and uncertainties described below are not the only ones we face, but represent the most significant risk factors that we believe may adversely affect the RV industry and our business, operations or financial position. The risks and uncertainties discussed in this report are not exclusive and other risk factors that we may consider immaterial or do not anticipate may emerge as significant risks and uncertainties.
Risks Related to Our Business
Competition
The market for RVs is very competitive. Competition in this industry is based upon price, design, value, quality and service. There can be no assurance that existing or new competitors will not develop products that are superior to our RVs or that achieve better consumer acceptance, thereby adversely affecting our market share, sales volume and profit margins. Some of our competitors are much larger than us, most notably in the towable RV market, which may provide them additional purchasing power. These competitive pressures may continue to have a material adverse effect on our results of operations.
Hiring Constraints
Our operations are dependent upon attracting and retaining skilled employees. Our motorhome operation is located in northern Iowa, a largely rural area. If we are unable to hire enough skilled employees to meet production demands or are unable to hire, motivate, retain and promote skilled personnel in all levels of our organization, we may be unable to develop and distribute products as effectively as might otherwise be achieved.
General Economic Conditions and Certain Other External Factors
Companies within the RV industry are subject to volatility in operating results due primarily to general economic conditions because the purchase of an RV is often viewed as a consumer luxury purchase. Specific factors affecting the RV industry include:
• | overall consumer confidence and the level of discretionary consumer spending; |
• | employment trends; |
• | the adverse impact of global tensions on consumer spending and travel-related activities; and |
• | adverse impact on margins of increases in raw material costs which we are unable to pass on to customers without negatively affecting sales. |
Dependence on Credit Availability and Interest Rates to Dealers and Retail Purchasers
Our business is affected by the availability and terms of the financing to dealers. Generally, RV dealers finance their purchases of inventory with financing provided by lending institutions. Three financial flooring institutions held 67% of our total financed dealer inventory dollars that were outstanding at August 29, 2015. In the event that any of these lending institutions limit or discontinue dealer financing, we could experience a material adverse effect on our results of operations. In April 2015, General Electric (“GE”), announced its intention to sell the majority of GE Capital, including GE Commercial Distribution Finance, a major provider of floorplan financing for RV dealers. The ultimate outcome and impact of a sale or divestiture of GE Capital by GE is currently unknown.
Our business is also affected by the availability and terms of financing to retail purchasers. Retail buyers purchasing a motorhome or towable may elect to finance their purchase through the dealership or a financial institution of their choice. Substantial increases in interest rates or decreases in the general availability of credit for our dealers or for the retail purchaser may have an adverse impact upon our business and results of operations.
6
Cyclicality and Seasonality
The RV industry has been characterized by cycles of growth and contraction in consumer demand, reflecting prevailing economic and demographic conditions, which affect disposable income for leisure-time activities. Consequently, the results for any prior period may not be indicative of results for any future period.
Seasonal factors, over which we have no control, also have an effect on the demand for our products. Demand in the RV industry generally declines over the winter season, while sales are generally highest during the spring and summer months. Also, unusually severe weather conditions in some markets may impact demand. Our business also does well when the US housing market is strong and our business weakens when the US housing market weakens.
Potential Loss of a Large Dealer Organization
One of our dealer organizations accounted for 17.9% of our net revenue for Fiscal 2015, as they sold our products in 75 of their dealership locations across 28 US states. A second dealer organization accounted for 15.0% of our net revenue for Fiscal 2015, as they sold products in 11 of their dealership locations across 4 US states. The loss of either or both of these dealer organizations could have a significant adverse effect on our business. In addition, deterioration in the liquidity or creditworthiness of either or both of these dealers could negatively impact our sales and could trigger repurchase obligations under our repurchase agreements.
Potential Repurchase Liabilities
In accordance with customary practice in the RV industry, upon request we enter into formal repurchase agreements with lending institutions financing a dealer's purchase of our products. In these repurchase agreements we agree, in the event of a default by an independent dealer in its obligation to a lender and repossession of the unit(s) by the lending institution, to repurchase units at declining prices over the term of the agreements, which can last up to 18 months. The difference between the gross repurchase price and the price at which the repurchased product can then be resold, which is typically at a discount to the gross repurchase price, represents a potential expense to us. In certain instances, we also repurchase inventory from our dealers due to state law or regulatory requirements that govern voluntary or involuntary terminations. We also have agreed to repurchase certain units that we sell to a rental company. If we are obligated to repurchase a substantially larger number of RVs in the future, this would increase our costs and could have a material adverse effect on our results of operations, financial condition, and cash flows.
Fuel Availability and Price Volatility
Gasoline or diesel fuel is required for the operation of motorized RVs. There can be no assurance that the supply of these petroleum products will continue uninterrupted or that the price or tax on these petroleum products will not significantly increase in the future. RVs, however, are not generally purchased for fuel efficiency. Fuel shortages and substantial increases in fuel prices have had a material adverse effect on the RV industry as a whole in the past and could have a material adverse effect on us in the future.
Dependence on Suppliers
Most of our RV components are readily available from numerous sources. However, a few of our components are produced by a small group of suppliers. In the case of motorhome chassis, Ford Motor Company, Freightliner Custom Chassis Corporation, Mercedes-Benz (USA and Canada) and FCA (US and Canada) are our major suppliers. Our relationship with our chassis suppliers is similar to our other supplier relationships in that no special contractual commitments are engaged in by either party. This means that we do not have minimum purchase requirements and our chassis suppliers do not have minimum supply requirements. Our chassis suppliers also supply to our competitors. Historically, chassis suppliers resort to an industry-wide allocation system during periods when supply is restricted. These allocations have been based on the volume of chassis previously purchased. Sales of motorhomes rely on chassis supply and are affected by shortages from time to time. Decisions by our suppliers to decrease production, production delays, or work stoppages by the employees of such suppliers, or price increases could have a material adverse effect on our ability to produce motorhomes and ultimately, on our results of operations, financial condition and cash flows.
Warranty Claims
We receive warranty claims from our dealers in the ordinary course of our business. Although we maintain reserves for such claims, which to date have been adequate, there can be no assurance that warranty expense levels will remain at current levels or that such reserves will continue to be adequate. A significant increase in warranty claims exceeding our current warranty expense levels could have a material adverse effect on our results of operations, financial condition and cash flows.
In addition to the costs associated with the contractual warranty coverage provided on our products, we also occasionally incur costs as a result of additional service actions not covered by our warranties, including product recalls and customer satisfaction actions. Although we estimate and reserve for the cost of these service actions, there can be no assurance that expense levels will remain at current levels or such reserves will continue to be adequate.
7
Protection of our Brand
We believe that one of the strengths of our business is our brand which is widely known around the world. We vigorously defend our brand and our other intellectual property rights against third parties on a global basis. We have, from time to time, had to bring claims against third parties to protect or prevent unauthorized use of our brand. If we are unable to protect and defend our brand or other intellectual property, it could have a material adverse affect on our results or financial condition.
Product Liability
We are subject, in the ordinary course of business, to litigation including a variety of warranty, "Lemon Law" and product liability claims typical in the RV industry. Although we have an insurance policy with a $35 million limit covering product liability, we are self-insured for the first $2.5 million of product liability claims on a per occurrence basis, with a $6.0 million aggregate. We cannot be certain that our insurance coverage will be sufficient to cover all future claims against us, which may have a material adverse effect on our results of operations and financial condition. Any increase in the frequency and size of these claims, as compared to our experience in prior years, may cause the premium that we are required to pay for insurance to rise significantly. Product liability claims may also cause us to pay punitive damages, not all of which are covered by our insurance. In addition, if product liability claims rise to a level of frequency or size that are significantly higher than similar claims made against our competitors, our reputation and business may be harmed.
Information Systems and Web Applications
We rely on our information systems and web applications to support our business operations, including but not limited to procurement, supply chain, manufacturing, distribution, warranty administration, invoicing and collection of payments. We use information systems to report and audit our operational results. Additionally, we rely upon information systems in our sales, marketing, human resources and communication efforts. Due to our reliance on our information systems, our business processes may be negatively impacted in the event of substantial disruption of service. Further, misuse, leakage or falsification of information could result in a violation of privacy laws and damage our reputation which could, in turn, have a negative impact on our results.
Data Security
We have security systems in place with the intent of maintaining the physical security of our facilities and protecting our customers', clients' and suppliers' confidential information and information related to identifiable individuals against unauthorized access through our information systems or by other electronic transmission or through the misdirection, theft or loss of physical media. These include, for example, the appropriate encryption of information. Despite such efforts, we are subject to breach of security systems which may result in unauthorized access to our facilities or the information we are trying to protect. Because the technologies used to obtain unauthorized access are constantly changing and becoming increasingly more sophisticated and often are not recognized until launched against a target, we may be unable to anticipate these techniques or implement sufficient preventative measures. If unauthorized parties gain physical access to one of our facilities or electronic access to our information systems or such information is misdirected, lost or stolen during transmission or transport, any theft or misuse of such information could result in, among other things, unfavorable publicity, governmental inquiry and oversight, difficulty in marketing our services, allegations by our customers and clients that we have not performed our contractual obligations, litigation by affected parties and possible financial obligations for damages related to the theft or misuse of such information, any of which could have a material adverse effect on our business.
Government Regulation
We are subject to numerous federal, state and local regulations. Some regulations govern the manufacture and sale of our products, including the provisions of the MVA, and the safety standards for RVs and components which have been established under the Motor Vehicle Act by the Department of Transportation. The MVA authorizes the National Highway Traffic Safety Administration to require a manufacturer to recall and repair vehicles which contain certain hazards or defects. Any major recalls of our vehicles, voluntary or involuntary, could have a material adverse effect on our results of operations, financial condition and cash flows. While we believe we are substantially in compliance with the foregoing laws and regulations as they currently exist, amendments to any of these regulations or the implementation of new regulations could significantly increase the cost of manufacturing, purchasing, operating or selling our products and could have a material adverse effect on our results of operations, financial condition, and cash flows. In addition, our failure to comply with present or future regulations could result in fines being imposed on us, potential civil and criminal liability, suspension of sales or production or cessation of operations.
We are also subject to federal and numerous state consumer protection and unfair trade practice laws and regulations relating to the sale, transportation and marketing of motor vehicles, including so-called "Lemon Laws." Federal and state laws and regulations also impose upon vehicle operators various restrictions on the weight, length and width of motor vehicles, including motorhomes that may be operated in certain jurisdictions or on certain roadways. Certain jurisdictions also prohibit the sale of vehicles exceeding length restrictions.
Failure to comply with NYSE and SEC laws or regulations could have an adverse impact on our business. Additionally, amendments to these regulations and the implementation of new regulations could increase the cost of manufacturing, purchasing, operating or selling our products and therefore could have an adverse impact on our business.
8
The SEC adopted rules pursuant to Section 1502 of the Dodd-Frank Wall Street Reform and Consumer Protection Act setting forth new disclosure requirements concerning the use or potential use of certain minerals, deemed conflict minerals (tantalum, tin, gold and tungsten), that are mined from the Democratic Republic of Congo and adjoining countries. These requirements necessitate due diligence efforts on our part to assess whether such minerals are used in our products in order to make the relevant required disclosures that began in May 2014. We incurred costs and diverted internal resource to comply with these new disclosure requirements, including for diligence to determine the sources of those minerals that may be used or necessary to the production of our products. Compliance costs may increase in future periods. We may face reputational challenges that could impact future sales if we determine that certain of our products contain minerals not determined to be conflict free or if we are unable to sufficiently verify the origins for all conflict minerals used in our products.
Finally, federal and state authorities also have various environmental control standards relating to air, water, noise pollution and hazardous waste generation and disposal which affect us and our operations. Failure by us to comply with present or future laws and regulations could result in fines being imposed on us, potential civil and criminal liability, suspension of production or operations, alterations to the manufacturing process, or costly cleanup or capital expenditures, any or all of which could have a material adverse effect on our results of operations.
Risks Related to Our Company
Anti-takeover Effect
Provisions of our articles of incorporation, by-laws, the Iowa Business Corporation Act and provisions in our credit facilities and certain of our compensation programs that we may enter into from time to time could make it more difficult for a third party to acquire us, even if doing so would be perceived to be beneficial by our shareholders. The combination of these provisions effectively inhibits a non-negotiated merger or other business combination, which, in turn, could adversely affect the market price of our common stock.
Item 1B. Unresolved Staff Comments
None.
Item 2. Properties
Our principal manufacturing, maintenance and service operations are conducted in multi-building complexes owned or leased by us. The following sets forth our material facilities as of August 29, 2015:
Location | Facility Type/Use | # of Buildings | Owned or Leased | Square Footage | ||
Forest City, Iowa | Manufacturing, maintenance, service and office | 32 | Owned | 1,546,000 | ||
Forest City, Iowa | Warehouse | 3 | Owned | 459,000 | ||
Charles City, Iowa | Manufacturing | 2 | Owned | 161,000 | ||
Waverly, Iowa | Manufacturing | 1 | Owned | 33,000 | ||
Middlebury, Indiana | Manufacturing and office | 4 | Owned | 277,000 | ||
Lake Mills, Iowa | Manufacturing | 1 | Leased | 96,000 | ||
43 | 2,572,000 | |||||
The facilities that we own in Forest City and Charles City are located on a total of approximately 310 acres of land. Most of our buildings are of steel or steel and concrete construction and are protected from fire with high‑pressure sprinkler systems, dust collector systems, automatic fire doors and alarm systems. We believe that our facilities and equipment are well maintained, in excellent condition and suitable for the purposes for which they are intended.
In May 2015, we purchased a building and approximately 9 acres of land in Waverly, Iowa. This plant is being utilized for wire harness fabrication.
In April 2015, we purchased facilities consisting of four buildings and approximately 30 acres of land located in Middlebury, Indiana. Prior to purchase we had leased this facility. The buildings are being utilized to assemble towables.
In November 2013, we entered into a five-year lease with the city of Lake Mills, IA for a manufacturing plant with two options to renew for five years each. This plant is being utilized to assemble Class B product.
Under terms of our credit facility, as further described in Note 7, we have encumbered substantially all of our real property for the benefit of the lender under such facility.
9
Item 3. Legal Proceedings
We are involved in various legal proceedings which are ordinary and routine litigation incidental to our business, some of which are covered in whole or in part by insurance. We believe, while the final resolution of any such litigation may have an impact on our results for a particular reporting period, the ultimate disposition of such litigation will not have any material adverse effect on our financial position, results of operations, or liquidity.
Item 4. Mine Safety Disclosure
Not Applicable.
PART II
Item 5. Market for the Registrant's Common Equity, Related Stockholder Matters and Issuer Purchases of Equity Securities
Market Information
Our common stock is listed on the New York and Chicago Stock Exchanges with the ticker symbol of WGO.
Below are the New York Stock Exchange high, low and closing prices of Winnebago Industries, Inc. common stock for each quarter of Fiscal 2015 and Fiscal 2014:
Fiscal 2015 | High | Low | Close | Fiscal 2014 | High | Low | Close | |||||||||||||
First Quarter | $ | 25.79 | $ | 20.25 | $ | 25.18 | First Quarter | $ | 31.80 | $ | 21.26 | $ | 30.96 | |||||||
Second Quarter | 26.44 | 18.82 | 23.21 | Second Quarter | 32.41 | 23.18 | 26.66 | |||||||||||||
Third Quarter | 24.26 | 20.00 | 21.73 | Third Quarter | 28.85 | 22.68 | 24.76 | |||||||||||||
Fourth Quarter | 24.73 | 18.98 | 20.42 | Fourth Quarter | 26.69 | 22.80 | 24.73 | |||||||||||||
Holders
Shareholders of record as of October 13, 2015: 2,989
Dividends Paid Per Share
Date Paid | Amount | |||
November 26, 2014 | $ | 0.09 | ||
February 4, 2015 | 0.09 | |||
May 6, 2015 | 0.09 | |||
August 5, 2015 | 0.09 | |||
Total | $ | 0.36 | ||
On October 14, 2015, our Board of Directors declared a cash dividend of $0.10 per outstanding share of common stock. The Board currently intends to continue to pay quarterly cash dividends payments in the future; however, declaration of future dividends, if any, will be based on several factors including our financial performance, outlook and liquidity.
Our credit facility, as further described in Note 7, contains covenants that limit our ability to pay certain cash dividends without impacting financial ratio covenants.
Issuer Purchases of Equity Securities
Our credit facility, as further described in Note 7, contains covenants that limits our ability, among other things, except for limited purchases of our common stock from employees, to make distributions or payments with respect to or purchases of our common stock without consent of the lenders.
On December 19, 2007, the Board of Directors authorized the repurchase of outstanding shares of our common stock, depending on market conditions, for an aggregate consideration of up to $60 million. There is no time restriction on this authorization. During Fiscal 2015, approximately 300,000 shares were repurchased under the authorization, at an aggregate cost of approximately $6.5 million, or $21.75 per share. Approximately 90,000 of these shares were repurchased from employees who vested in Winnebago Industries shares during the fiscal year and elected to pay their payroll tax via delivery of common stock as opposed to cash. As of August 29, 2015, there was approximately $7.1 million remaining under this authorization.
10
This table provides information with respect to purchases by us of shares of our common stock during each fiscal month of the fourth quarter of Fiscal 2015:
Period | Total Number of Shares Purchased | Average Price Paid per Share | Number of Shares Purchased as Part of Publicly Announced Plans or Programs | Approximate Dollar Value of Shares That May Yet Be Purchased Under the Plans or Programs | |||||||||
05/31/15 - 07/04/15 | — | $ | — | — | $ | 7,417,000 | |||||||
07/05/15 - 08/01/15 | — | $ | — | — | $ | 7,417,000 | |||||||
08/02/15 - 08/29/15 | 16,815 | $ | 21.05 | 16,815 | $ | 7,063,000 | |||||||
Total | 16,815 | $ | 21.05 | 16,815 | $ | 7,063,000 | |||||||
Equity Compensation Plan Information
The following table provides information as of August 29, 2015 with respect to shares of our common stock that may be issued under our existing equity compensation plans:
(a) | (b) | (c) | |||||||
Plan Category | Number of Securities to be Issued Upon Exercise of Outstanding Options, Warrants and Rights | Weighted Average Exercise Price of Outstanding Options, Warrants and Rights | Number of Securities Remaining Available for Future Issuance Under Equity Compensation Plans (Excluding Securities Reflected in (a)) | ||||||
Equity compensation plans approved by shareholders - 2004 Plan (1) | 167,394 | $ | 28.30 | — | |||||
Equity compensation plans approved by shareholders - 2004 Plan (2) | 95,020 | $ | 20.04 | — | |||||
Equity compensation plans approved by shareholders - 2014 Plan | 68,400 | (3) | $ | 21.93 | 3,185,937 | (4) | |||
Equity compensation plans not approved by shareholders (5) | 96,611 | (6) | $ | 13.81 | — | (7) | |||
Total | 427,425 | $ | 22.17 | 3,185,937 | |||||
(1) | This number represents stock options granted under the 2004 Incentive Compensation Plan, as amended ("2004 Plan") which will continue to be exercisable in accordance with their original terms and conditions. No new grants may be made under the 2004 Plan. |
(2) | This number represents unvested share awards granted under the 2004 Plan. No new grants may be made under the 2004 Plan. |
(3) This number represents unvested stock awards granted under the 2014 Omnibus Equity, Performance Award, and Incentive Compensation Plan, as amended ("2014 Plan"). The 2014 Plan replaced the 2004 Plan effective January 1, 2014.
(4) | This number represents stock options available for grant under the 2014 Plan as of August 29, 2015. |
(5) | Our sole equity compensation plan not previously submitted to our shareholders for approval is the Directors' Deferred Compensation Plan, as amended ("Directors' Plan"). The Board of Directors may terminate the Directors' Plan at any time. If not terminated earlier, the Directors' Plan will automatically terminate on June 30, 2023. For a description of the key provisions of the Directors' Plan, see the information in our Proxy Statement for the Annual Meeting of Shareholders scheduled to be held December 15, 2015 under the caption "Director Compensation," which information is incorporated by reference herein. |
(6) | Represents shares of common stock issued to a trust which underlie stock units, payable on a one-for-one basis, credited to stock unit accounts as of August 29, 2015 under the Directors' Plan. |
(7) | The table does not reflect a specific number of stock units which may be distributed pursuant to the Directors' Plan. The Directors' Plan does not limit the number of stock units issuable thereunder. The number of stock units to be distributed pursuant to the Directors' Plan will be based on the amount of the director's compensation deferred and the per share price of our common stock at the time of deferral. |
11
Performance Graph
The following graph compares our five-year cumulative total shareholder return (including reinvestment of dividends) with the cumulative total return on the Standard & Poor's 500 Index and a peer group. The peer group companies consisting of Thor Industries, Inc., Polaris Industries, Inc. and Brunswick Corporation were selected by us as they also manufacture recreation products. It is assumed in the graph that $100 was invested in our common stock, in the Standard & Poor's 500 Index and in the stocks of the peer group companies on August 28, 2010 and that all dividends received within a quarter were reinvested in that quarter. In accordance with the guidelines of the SEC, the shareholder return for each entity in the peer group index has been weighted on the basis of market capitalization as of each annual measurement date set forth in the graph. 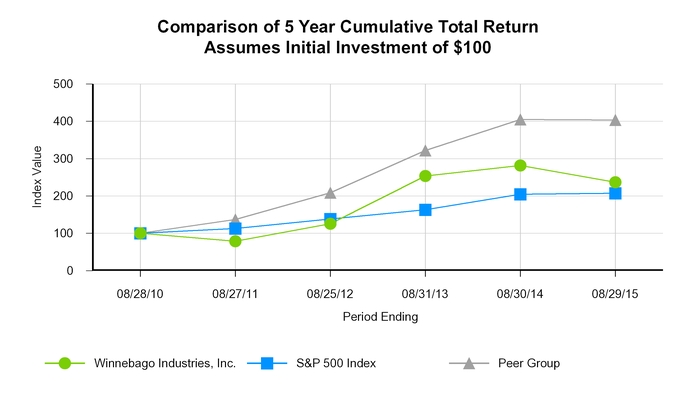
Base Period | ||||||||||||||||
Company/Index | 8/28/10 | 8/27/11 | 8/25/12 | 8/31/13 | 8/30/14 | 8/29/15 | ||||||||||
Winnebago Industries, Inc. | 100.00 | 78.90 | 125.41 | 253.68 | 281.70 | 236.56 | ||||||||||
S&P 500 Index | 100.00 | 112.74 | 138.07 | 163.44 | 204.71 | 207.40 | ||||||||||
Peer Group | 100.00 | 137.27 | 208.57 | 321.74 | 404.75 | 403.90 | ||||||||||
Item 6. Selected Financial Data
Fiscal Years Ended | |||||||||||||||||||
(In thousands, except EPS) | 8/29/15 | 8/30/14 | 8/31/13 | 8/25/12 (1) | 8/27/11 | ||||||||||||||
Income statement data: | |||||||||||||||||||
Net revenues | $ | 976,505 | $ | 945,163 | $ | 803,165 | $ | 581,679 | $ | 496,418 | |||||||||
Net income | 41,210 | 45,053 | 31,953 | 44,972 | 11,843 | ||||||||||||||
Per share data: | |||||||||||||||||||
Net income - basic | 1.53 | 1.64 | 1.14 | 1.54 | 0.41 | ||||||||||||||
Net income - diluted | 1.52 | 1.64 | 1.13 | 1.54 | 0.41 | ||||||||||||||
Dividends declared and paid per common share | 0.36 | — | — | — | — | ||||||||||||||
Balance sheet data: | |||||||||||||||||||
Total assets | 362,174 | 358,302 | 309,145 | 286,072 | 239,927 | ||||||||||||||
(1) In Fiscal 2012 we recorded a non-cash tax benefit of $37.7 million through the reduction of our Fiscal 2009 deferred tax asset valuation allowance.
Item 7. Management's Discussion and Analysis of Financial Condition and Results of Operations
12
Management's Discussion and Analysis of Financial Condition and Results of Operations (MD&A) is intended to provide a reader of our financial statements with a narrative from the perspective of our management on our financial condition, results of operations, liquidity and certain other factors that may affect our future results. Our MD&A is presented in eight sections:
• |
• |
• |
• |
• |
• |
• |
• |
Our MD&A should be read in conjunction with the Financial Statements and related Notes included in Item 8, Financial Statements and Supplementary Data, of this Annual Report on Form 10-K.
Executive Overview
Winnebago Industries, Inc. is a leading US manufacturer of RVs with a proud history of manufacturing RV products for more than 50 years. We produce all of our motorhomes in vertically integrated manufacturing facilities in Iowa and we produce all travel trailer and fifth wheel trailers in Indiana. We distribute our products primarily through independent dealers throughout the US and Canada, who then retail the products to the end consumer.
Our retail unit market share, as reported by Stat Surveys based on state records, is illustrated below. Note that this data is subject to adjustment and is continuously updated.
Rolling 12 Months Through July | Calendar Year | |||||||||||
US and Canada | 2015 | 2014 | 2014 | 2013 | 2012 | |||||||
Motorized A, B, C | 20.8 | % | 20.7 | % | 20.7 | % | 18.6 | % | 19.8 | % | ||
Travel trailer and fifth wheels | 0.9 | % | 0.9 | % | 0.8 | % | 1.0 | % | 0.9 | % | ||
Presented in fiscal quarters, certain key metrics are shown below:
Class A, B & C Motorhomes | Travel Trailers & Fifth Wheels | |||||||||||||||||
As of Quarter End | As of Quarter End | |||||||||||||||||
Wholesale | Retail | Dealer | Order | Wholesale | Retail | Dealer | Order | |||||||||||
(In units) | Deliveries | Registrations | Inventory | Backlog | Deliveries | Registrations | Inventory | Backlog | ||||||||||
Q1 | 2,005 | 1,524 | 3,135 | 3,534 | 484 | 504 | 1,591 | 151 | ||||||||||
Q2 | 2,055 | 1,283 | 3,907 | 2,900 | 575 | 394 | 1,772 | 206 | ||||||||||
Q3 (1) | 2,331 | 2,783 | 3,798 | 2,357 | 727 | 724 | 1,775 | 303 | ||||||||||
Q4 | 2,364 | 2,183 | 3,979 | 1,899 | 723 | 777 | 1,721 | 163 | ||||||||||
Fiscal 2014 | 8,755 | 7,773 | 2,509 | 2,399 | ||||||||||||||
Q1 | 2,031 | 1,818 | 4,192 | 2,122 | 546 | 585 | 1,682 | 154 | ||||||||||
Q2 | 2,104 | 1,518 | 4,778 | 2,275 | 605 | 410 | 1,877 | 130 | ||||||||||
Q3 | 2,596 | 2,873 | 4,501 | 2,279 | 742 | 796 | 1,823 | 179 | ||||||||||
Q4 | 2,366 | 2,795 | 4,072 | 1,754 | 777 | 937 | 1,663 | 248 | ||||||||||
Fiscal 2015 | 9,097 | 9,004 | 2,670 | 2,728 | ||||||||||||||
Unit change | 342 | 1,231 | 93 | 161 | 329 | (58 | ) | |||||||||||
Percentage change | 3.9 | % | 15.8 | % | 2.3 | % | 6.4 | % | 13.7 | % | (3.4 | )% | ||||||
(1) | An additional 343 units were delivered but not included in wholesale deliveries as presented in the table above as the units were subject to repurchase option. These units were included as retail registrations, not in dealer inventory, as the units were immediately placed into rental service once delivered. See Note 4 to the financial statements. |
13
Highlights of Fiscal 2015:
Consolidated revenues, gross profit, and operating income were comparable for Fiscal 2015 as compared to Fiscal 2014. Quarterly results for the past two fiscal years are illustrated as follows:
(In thousands) | Revenues | Gross Profit | Gross Margin | Operating Income | Operating Margin | |||||||||||||||||||||||||
2015 | 2014 | 2015 | 2014 | 2015 | 2014 | 2015 | 2014 | 2015 | 2014 | |||||||||||||||||||||
Q1 | $ | 224,403 | 222,670 | $ | 24,386 | $ | 25,962 | 10.9 | % | 11.7 | % | $ | 14,442 | $ | 16,006 | 6.4 | % | 7.2 | % | |||||||||||
Q2 | 234,543 | 228,811 | 24,258 | 22,845 | 10.3 | % | 10.0 | % | 11,948 | 14,036 | 5.1 | % | 6.1 | % | ||||||||||||||||
Q3 | 266,510 | 247,747 | 28,183 | 26,481 | 10.6 | % | 10.7 | % | 16,118 | 15,589 | 6.0 | % | 6.3 | % | ||||||||||||||||
Q4 | 251,049 | 245,935 | 28,053 | 28,709 | 11.2 | % | 11.7 | % | 16,911 | 18,278 | 6.7 | % | 7.4 | % | ||||||||||||||||
Total | $ | 976,505 | $ | 945,163 | $ | 104,880 | $ | 103,997 | 10.7 | % | 11.0 | % | $ | 59,419 | $ | 63,909 | 6.1 | % | 6.8 | % | ||||||||||
Operational and financial performance:
• | Our motorized wholesale deliveries increased by approximately 4% in Fiscal 2015 as compared to Fiscal 2014. In recent years we have sold more units to dealers than our dealer network could sell to the public as dealers restocked their inventories to meet the growing retail demand. Dealer inventory remained relatively flat when comparing Fiscal 2015 to Fiscal 2014 as we believe we have now reached equilibrium where dealers will accept one new wholesale for each unit retailed. |
• | Our Towables operations generated operating income of $2.6 million in Fiscal 2015 compared to operating income of $1.3 million in Fiscal 2014. Towable net revenue experienced growth of approximately 23%, this was a significant driver in the doubling of the operating income. Net revenue growth was enhanced in part by the introduction of our Toy Hauler products along with the increase in our dealer network. The growth in operating income was aided by the operating leverage within the business model and a reduction in our raw materials. |
• | The continued strong financial performance of our business has allowed us to make substantial investments in Fiscal 2015 related to two strategic initiatives to support our operations and strengthen our foundation for success for the future. These initiatives are discussed in more detail in the Company Outlook section. |
Industry Outlook
Key statistics for the motorhome industry are as follows:
US and Canada Industry Class A, B & C Motorhomes | |||||||||||||||||||||
Wholesale Shipments(1) | Retail Registrations(2) | ||||||||||||||||||||
Calendar Year | Calendar Year | ||||||||||||||||||||
(In units) | 2014 | 2013 | Increase | Change | 2014 | 2013 | Increase | Change | |||||||||||||
Q1 | 11,125 | 8,500 | 2,625 | 30.9 | % | 8,076 | 7,147 | 929 | 13.0 | % | |||||||||||
Q2 | 12,203 | 10,972 | 1,231 | 11.2 | % | 12,511 | 10,909 | 1,602 | 14.7 | % | |||||||||||
Q3 | 10,704 | 9,469 | 1,235 | 13.0 | % | 10,740 | 9,125 | 1,615 | 17.7 | % | |||||||||||
Q4 | 9,919 | 9,391 | 528 | 5.6 | % | 7,605 | 6,281 | 1,324 | 21.1 | % | |||||||||||
Total | 43,951 | 38,332 | 5,619 | 14.7 | % | 38,932 | 33,462 | 5,470 | 16.3 | % | |||||||||||
(In units) | 2015 | 2014 | Increase (Decrease) | Change | 2015 | 2014 | Increase (Decrease) | Change | |||||||||||||
Q1 | 11,963 | 1 | 11,125 | 838 | 7.5 | % | 9,128 | 8,076 | 1,052 | 13.0 | % | ||||||||||
Q2 | 12,751 | 12,203 | 548 | 4.5 | % | 14,011 | 12,511 | 1,500 | 12.0 | % | |||||||||||
July | 3,172 | 3,201 | (29 | ) | (.9 | )% | 4,194 | 4,300 | (106 | ) | (2.5 | )% | |||||||||
August | 3,904 | 3,964 | (60 | ) | (1.5 | )% | (4 | ) | 4,149 | ||||||||||||
September | 3,764 | (3) | 3,539 | 225 | 6.4 | % | (4 | ) | 4,062 | ||||||||||||
Q3 | 10,840 | (3) | 10,704 | 136 | 1.3 | % | (4 | ) | 10,740 | ||||||||||||
Q4 | 10,400 | (3) | 9,919 | 481 | 4.8 | % | (4 | ) | 7,605 | ||||||||||||
Total | 45,954 | (3) | 43,951 | 2,003 | 4.6 | % | 38,932 | ||||||||||||||
July YTD growth | 27,886 | 26,529 | 1,357 | 5.1 | % | 27,333 | 24,887 | 2,446 | 9.8 | % | |||||||||||
(1) | Class A, B and C wholesale shipments as reported by RVIA. |
(2) | Class A, B and C retail registrations as reported by Stat Surveys for the US and Canada combined. |
(3) | Monthly and quarterly 2015 Class A, B and C wholesale shipments are based upon the forecast prepared by Dr. Richard Curtin of the University of Michigan Consumer Survey Research Center for RVIA and reported in the RV RoadSigns Fall 2015 Industry Forecast Issue. The revised RVIA annual 2015 wholesale shipment forecast is 47,000 and the annual forecast for 2016 is 48,600, an increase of 3.4%. |
(4) | Stat Surveys has not issued a projection for 2015 retail demand for this period. |
14
Key statistics for the towable industry are as follows:
US and Canada Travel Trailer & Fifth Wheel Industry | |||||||||||||||||||||
Wholesale Shipments(1) | Retail Registrations(2) | ||||||||||||||||||||
Calendar Year | Calendar Year | ||||||||||||||||||||
(In units) | 2014 | 2013 | Increase | Change | 2014 | 2013 | Increase | Change | |||||||||||||
Q1 | 75,458 | 66,745 | 8,713 | 13.1 | % | 46,140 | 42,987 | 3,153 | 7.3 | % | |||||||||||
Q2 | 85,648 | 79,935 | 5,713 | 7.1 | % | 100,168 | 94,717 | 5,451 | 5.8 | % | |||||||||||
Q3 | 65,543 | 61,251 | 4,292 | 7.0 | % | 87,872 | 79,805 | 8,067 | 10.1 | % | |||||||||||
Q4 | 72,289 | 60,104 | 12,185 | 20.3 | % | 42,838 | 37,054 | 5,784 | 15.6 | % | |||||||||||
Total | 298,938 | 268,035 | 30,903 | 11.5 | % | 277,018 | 254,563 | 22,455 | 8.8 | % | |||||||||||
(In units) | 2015 | 2014 | Increase (Decrease) | Change | 2015 | 2014 | Increase | Change | |||||||||||||
Q1 | 81,759 | 75,458 | 6,301 | 8.4 | % | 54,157 | 46,140 | 8,017 | 17.4 | % | |||||||||||
Q2 | 88,988 | 85,648 | 3,340 | 3.9 | % | 110,725 | 100,168 | 10,557 | 10.5 | % | |||||||||||
July | 22,937 | 23,691 | (754 | ) | (3.2 | )% | 35,948 | 29,707 | 6,241 | 21.0 | % | ||||||||||
August | 22,584 | 21,370 | 1,214 | 5.7 | % | (4 | ) | 35,827 | |||||||||||||
September | 21,417 | (3 | ) | 20,482 | 935 | 4.6 | % | (4 | ) | 34,634 | |||||||||||
Q3 | 66,938 | (3 | ) | 65,543 | 1,395 | 2.1 | % | (4 | ) | 87,872 | |||||||||||
Q4 | 69,800 | (3 | ) | 72,289 | (2,489 | ) | (3.4 | )% | (4 | ) | 42,838 | ` | |||||||||
Total | 307,485 | (3 | ) | 298,938 | 8,547 | 2.9 | % | 277,018 | |||||||||||||
July YTD growth | 193,684 | 184,797 | 8,887 | 4.8 | % | 200,830 | 176,015 | 24,815 | 14.1 | % | |||||||||||
(1) | Towable wholesale shipments as reported by RVIA. |
(2) | Towable retail registrations as reported by Stat Surveys for the US and Canada combined. |
(3) | Monthly and quarterly 2015 towable wholesale shipments are based upon the forecast prepared by Dr. Richard Curtin of the University of Michigan Consumer Survey Research Center for RVIA and reported in the RV RoadSigns Fall 2015 Industry Forecast Issue. The revised annual 2015 wholesale shipment forecast is 314,200 and the annual forecast for 2016 is 322,300, an increase of 2.6%. |
(4) | Stat Surveys has not issued a projection for 2015 retail demand for this period. |
Company Outlook
Based on our profitable operating results in recent years, we believe that we have demonstrated our ability to maintain our liquidity, cover operations costs, recover fixed assets, and maintain physical capacity at present levels. Now that we have entered into the towable market, we are attempting to grow revenues and earnings in a market significantly larger than the motorized market.
Our motorized production facilities are located in largely rural areas of northern Iowa. In addition, the unemployment rate in these areas is currently low. These factors limit our ability to increase motorized production volumes at a more rapid pace even if motorized demand justified increased production. To the extent that we have been able to increase the production rate, we have also incurred incremental operating expenses associated with overtime and workers compensation expense. To overcome these labor shortages we recently began expanding within the state of Iowa. In Fiscal 2014 we leased an additional manufacturing facility in Lake Mills which is now in production. In the third quarter of Fiscal 2015 we purchased a separate facility in Waverly, which will be ready for production later this calendar year. These expansions are intended to facilitate the increased production rate and to reach additional labor markets.
In addition to finding alternative locations, we are re-evaluating the manner in which we deploy labor in our Forest City facility. We are in the process of exiting our bus and aluminum extrusion operation. Both of these operations provided very low margins while consuming production labor. We have decided it is in our best interest to redeploy these labor hours to the higher margin motorized operations. We expect to have both bus and aluminum extrusion operations exited by the end of the second fiscal quarter of 2016.
Fiscal 2016 is a year in which we expect to continue investing and rebuilding for Winnebago’s future. We anticipate flat to modest motorized deliveries growth, which is in line with RVIA’s projection of 3% growth for the industry. We’ve taken steps to improve motorized labor efficiency and expect to see modest improvement in Fiscal 2016. In Towables, we anticipate building on our Fiscal 2015 results, with continued penetration of our new products and further expansion of our distribution base. We believe we can again achieve growth in excess of the overall towables market projections for Fiscal 2016.
15
Our unit order backlog was as follows:
As Of | |||||||||||||||||
(In units) | August 29, 2015 | August 30, 2014 | Increase (Decrease) | % Change | |||||||||||||
Class A gas | 400 | 22.8 | % | 338 | 17.8 | % | 62 | 18.3 | % | ||||||||
Class A diesel | 143 | 8.2 | % | 302 | 15.9 | % | (159 | ) | (52.6 | )% | |||||||
Total Class A | 543 | 31.0 | % | 640 | 33.7 | % | (97 | ) | (15.2 | )% | |||||||
Class B | 291 | 16.6 | % | 323 | 17.0 | % | (32 | ) | (9.9 | )% | |||||||
Class C | 920 | 52.5 | % | 936 | 49.3 | % | (16 | ) | (1.7 | )% | |||||||
Total motorhome backlog(1) | 1,754 | 100.0 | % | 1,899 | 100.0 | % | (145 | ) | (7.6 | )% | |||||||
Travel trailer | 236 | 95.2 | % | 134 | 82.2 | % | 102 | 76.1 | % | ||||||||
Fifth wheel | 12 | 4.8 | % | 29 | 17.8 | % | (17 | ) | (58.6 | )% | |||||||
Total towable backlog(1) | 248 | 100.0 | % | 163 | 100.0 | % | 85 | 52.1 | % | ||||||||
Approximate backlog revenue in thousands | |||||||||||||||||
Motorhome | $ | 156,353 | $ | 172,575 | $ | (16,222 | ) | (9.4 | )% | ||||||||
Towable | $ | 6,171 | $ | 3,750 | $ | 2,421 | 64.6 | % | |||||||||
(1) | We include in our backlog all accepted purchase orders from dealers to be shipped within the next six months. Orders in backlog can be canceled or postponed at the option of the dealer at any time without penalty and, therefore, backlog may not necessarily be an accurate measure of future sales. |
Our unit dealer inventory was as follows:
August 29, 2015 | August 30, 2014 | Increase (Decrease) | % Change | ||||||
Motorhomes | 4,072 | 3,979 | 93 | 2.3 | % | ||||
Towables | 1,663 | 1,721 | (58 | ) | (3.4 | )% | |||
We believe that the level of our dealer inventory at the end of Fiscal 2015 is reasonable given the improved retail demand and current sales order backlog of our product. A key metric used to evaluate dealer inventory levels is the retail turn rate (12 month retail volume/current deliver inventory). At the end of Fiscal 2015 the retail turn rate was over 2.2 turns which we feel reflects the alignment between retail demand and our dealers' inventory.
At the December 2014 Board of Directors meeting, two strategic initiatives were approved and, as a result, commenced in the second quarter of Fiscal 2015. Both of these projects represent significant investments that we believe will contribute to our future success.
• | The first strategic initiative relates to the execution of an ERP system implementation which will replace our in-house developed financial and operational systems. The new ERP platform will provide better support for our changing business needs and plans for future growth. In addition to supply chain optimization opportunities and lower overall operating costs, the new system will provide more recent and relevant data which will allow us to more quickly react to production and other business changes and in some cases, allow us to be proactive in our response to market trends and opportunities. Our current cost estimate for this project is $12 - $16 million to be completed over a three-year time frame which includes software, external implementation as assistance and increased internal staffing directly related to this initiative. We anticipate that approximately 40% of the cost will be immediately expensed over the life of the project and 60% will be capitalized. As components of the ERP are placed in service, we will amortize over a 10-year life. The following table illustrates the project costs in Fiscal 2015: |
Fiscal 2015 | |||||||||||||||
(In thousands) | Q2 | Q3 | Q4 | YTD | |||||||||||
Capitalized | $ | 537 | $ | 884 | $ | 1,870 | $ | 3,291 | |||||||
Expensed | 652 | 611 | 1,265 | 2,528 | (1) | ||||||||||
Total | $ | 1,189 | $ | 1,495 | $ | 3,135 | $ | 5,819 | |||||||
(1) Of the $2.5 million expensed in Fiscal 2015, $2.2 million was incremental and related to external implementation assistance.
We estimate that an additional $6 - $10 million in project costs will be incurred in Fiscal 2016 and Fiscal 2017, most of which will be incurred in the next 12 months.
• | The second initiative is a strategic sourcing project with the objective of obtaining long-term material cost savings through standardizing our purchasing processes, optimizing our supplier relationships and improving our current sourcing methodologies. We engaged external support with deep domain expertise to help us launch the project and incurred $1.6 million in general and administrative expenses for this assistance in Fiscal 2015, of which $370,000 was incurred in the fourth |
16
quarter. We expect to incur approximately $200,000 of incremental general and administrative expense in Fiscal 2016 related to this project, which is less than what was originally planned, as project management will be fully transitioned to internal resources in the first quarter. When all commodities have been through the strategic sourcing process (expected by June 2016), we anticipate this project will provide gross margin expansion of 30 to 50 basis points.
Impact of Inflation
Materials cost is the primary component in the cost of our products. Historically, the impact of inflation on our operations has not been significantly detrimental, as we have historically been able to adjust our prices to reflect the inflationary impact on the cost of manufacturing our products. While we have historically been able to pass on these increased costs, in the event we are unable to continue to do so due to market conditions, future increases in manufacturing costs could have a material adverse effect on our results of operations.
Results of Operations
Fiscal 2015 Compared to Fiscal 2014
The following is an analysis of changes in key items included in the statements of operations for the fiscal year ended August 29, 2015 compared to the fiscal year ended August 30, 2014:
Year Ended | |||||||||||||||
(In thousands, except percent and per share data) | August 29, 2015 | % of Revenues(1) | August 30, 2014 | % of Revenues(1) | Increase (Decrease) | % Change | |||||||||
Net revenues | $ | 976,505 | 100.0 | % | $ | 945,163 | 100.0 | % | $ | 31,342 | 3.3 | % | |||
Cost of goods sold | 871,625 | 89.3 | % | 841,166 | 89.0 | % | 30,459 | 3.6 | % | ||||||
Gross profit | 104,880 | 10.7 | % | 103,997 | 11.0 | % | 883 | 0.8 | % | ||||||
Selling | 19,161 | 2.0 | % | 18,293 | 1.9 | % | 868 | 4.7 | % | ||||||
General and administrative | 25,838 | 2.6 | % | 22,424 | 2.4 | % | 3,414 | 15.2 | % | ||||||
Impairment (gain on sale) on fixed assets | 462 | — | % | (629 | ) | (0.1 | )% | 1,091 | NMF | ||||||
Operating expenses | 45,461 | 4.7 | % | 40,088 | 4.2 | % | 5,373 | 13.4 | % | ||||||
Operating income | 59,419 | 6.1 | % | 63,909 | 6.8 | % | (4,490 | ) | (7.0 | )% | |||||
Non-operating income | 115 | — | % | 768 | 0.1 | % | (653 | ) | (85.0 | )% | |||||
Income before income taxes | 59,534 | 6.1 | % | 64,677 | 6.8 | % | (5,143 | ) | (8.0 | )% | |||||
Provision for taxes | 18,324 | 1.9 | % | 19,624 | 2.1 | % | (1,300 | ) | (6.6 | )% | |||||
Net income | $ | 41,210 | 4.2 | % | $ | 45,053 | 4.8 | % | $ | (3,843 | ) | (8.5 | )% | ||
Diluted income per share | $ | 1.52 | $ | 1.64 | $ | (0.12 | ) | (7.3 | )% | ||||||
Diluted average shares outstanding | 27,051 | 27,545 | |||||||||||||
(1) Percentages may not add due to rounding differences.
17
Motorhome unit deliveries and ASP, net of discounts, consisted of the following:
Year Ended | |||||||||||||||
August 29, 2015 | Product Mix % (1) | August 30, 2015 (2) | Product Mix % (1) | Increase (Decrease) | % Change | ||||||||||
Unit deliveries: | |||||||||||||||
Class A gas | 2,337 | 25.7 | % | 3,056 | 34.9 | % | (719 | ) | (23.5 | )% | |||||
Class A diesel | 1,105 | 12.1 | % | 1,410 | 16.1 | % | (305 | ) | (21.6 | )% | |||||
Total Class A | 3,442 | 37.8 | % | 4,466 | 51.0 | % | (1,024 | ) | (22.9 | )% | |||||
Class B | 991 | 10.9 | % | 751 | 8.6 | % | 240 | 32.0 | % | ||||||
Class C | 4,664 | 51.3 | % | 3,538 | 40.4 | % | 1,126 | 31.8 | % | ||||||
Total motorhome unit deliveries | 9,097 | 100.0 | % | 8,755 | 100.0 | % | 342 | 3.9 | % | ||||||
ASP: | |||||||||||||||
Class A gas | $ | 96,949 | $ | 94,630 | $ | 2,319 | 2.5 | % | |||||||
Class A diesel | 196,073 | 180,218 | 15,855 | 8.8 | % | ||||||||||
Total Class A | 128,771 | 121,652 | 7,119 | 5.9 | % | ||||||||||
Class B | 75,575 | 71,417 | 4,158 | 5.8 | % | ||||||||||
Class C | 73,895 | 69,920 | 3,975 | 5.7 | % | ||||||||||
Total motorhome ASP | $ | 94,841 | $ | 96,437 | $ | (1,596 | ) | (1.7 | )% | ||||||
(1) Percentages and dollars may not add due to rounding differences.
(2) An additional 343 motorhomes were delivered in Fiscal 2014 but not included in wholesale deliveries as presented in the table above as the units were subject to repurchase option. See Note 4.
Towables unit deliveries and ASP, net of discounts, consisted of the following:
Year Ended | |||||||||||||||
August 29, 2015 | Product Mix % (1) | August 30, 2014 | Product Mix % (1) | Increase (Decrease) | % Change | ||||||||||
Unit deliveries: | |||||||||||||||
Travel trailer | 2,182 | 81.7 | % | 2,052 | 81.8 | % | 130 | 6.3 | % | ||||||
Fifth wheel | 488 | 18.3 | % | 457 | 18.2 | % | 31 | 6.8 | % | ||||||
Total towable unit deliveries | 2,670 | 100.0 | % | 2,509 | 100.0 | % | 161 | 6.4 | % | ||||||
ASP: | |||||||||||||||
Travel trailer | $ | 21,781 | $ | 19,570 | $ | 2,211 | 11.3 | % | |||||||
Fifth wheel | 50,399 | 40,115 | 10,284 | 25.6 | % | ||||||||||
Total towable ASP | $ | 27,012 | $ | 23,312 | $ | 3,700 | 15.9 | % | |||||||
(1) Percentages and dollars may not add due to rounding differences.
Net revenues consisted of the following:
Year Ended | |||||||||||||||||
(In thousands) | August 29, 2015 | August 30, 2014 | Increase (Decrease) | % Change | |||||||||||||
Motorhomes (1) | $ | 872,915 | 89.4 | % | $ | 853,488 | 90.3 | % | $ | 19,427 | 2.3 | % | |||||
Towables (2) | 71,684 | 7.3 | % | 58,123 | 6.1 | % | 13,561 | 23.3 | % | ||||||||
Other manufactured products | 31,906 | 3.3 | % | 33,552 | 3.6 | % | (1,646 | ) | (4.9 | )% | |||||||
Total net revenues | $ | 976,505 | 100.0 | % | $ | 945,163 | 100.0 | % | $ | 31,342 | 3.3 | % | |||||
(1) | Includes motorhome units, parts, and services |
(2) | Includes towable units and parts |
The increase in motorhome net revenues of $19.4 million or 2.3% was primarily attributed to a 3.9% increase in unit deliveries in Fiscal 2015.
• | The increase in the incremental revenues was due to the change in our sales agreement with Apollo, a US RV rental company. During Fiscal 2015 we delivered 535 rental units to Apollo. During Fiscal 2014 we delivered 520 rental units to Apollo, of which only 177 were reported as motorhome sales; the remaining 343 were recorded as operating leases due to a repurchase obligation in Fiscal 2014. |
18
• | Total motorhome ASP decreased 1.7% in Fiscal 2015 due to a mix shift from higher priced Class A products to lower priced Class B and C unit sales in Fiscal 2015 although ASPs increased in every product category during the year. |
Towables revenues were $71.7 million in Fiscal 2015 compared to revenues of $58.1 million in Fiscal 2014. ASP increased 15.9% and towable unit deliveries increased by 6.4%.
Cost of goods sold was $871.6 million, or 89.3% of net revenues for Fiscal 2015 compared to $841.2 million, or 89.0% of net revenues for Fiscal 2014 due to the following:
• | Total variable costs (materials, direct labor, variable overhead, delivery expense and warranty), as a percent of net revenues, increased to 84.0% from 83.7% primarily due to increased warranty expense and related warranty recall reserve and higher workers compensation expense. |
• | Fixed overhead (manufacturing support labor, depreciation and facility costs) and research and development-related costs decreased to 5.2% of net revenues compared to 5.3%. |
• | All factors considered, gross profit decreased from 11.0% to 10.7% of net revenues. |
Selling expenses increased to 2.0% from 1.9% of net revenues in Fiscal 2015 and Fiscal 2014, respectively. The increase was due primarily to increased advertising and compensation expenses in Fiscal 2015.
General and administrative expenses were 2.6% and 2.4% of net revenues in Fiscal 2015 and Fiscal 2014, respectively. General and administrative expenses increased $3.4 million, or 15.2%, in Fiscal 2015. This increase was due primarily to expenses of $3.9 million in ERP and strategic sourcing projects, $1.6 million in increased legal and product liability expenses, $1.0 million in costs associated with the former CEO retirement agreement and was partially offset by $3.3 million in reduced management compensation expenses.
During Fiscal 2015, we recorded an asset impairment on our corporate plane of $462,000. In Fiscal 2014, we sold a warehouse facility in Forest City, Iowa, resulting in a gain of $629,000. See Note 5.
Non-operating income decreased $653,000 or 85.0%, in Fiscal 2015, primarily due to lower proceeds from COLI policies than we received in Fiscal 2014. See Note 12.
The overall effective income tax rate for Fiscal 2015 was 30.8% compared to 30.3% in Fiscal 2014. With a lower level of pre-tax book income being recorded in Fiscal 2015 compared to Fiscal 2014 the effective tax rate from operations was lower. However, this was offset by the lower level of tax planning initiatives recorded in Fiscal 2015 compared to Fiscal 2014 causing a slight increase in the effective tax rate year over year. Legislation for various applicable tax credits expired on December 31, 2014; therefore, similar to our Fiscal 2014, our projected benefits for these tax credits are limited to four months of our fiscal year. If the applicable credits are extended, this could potentially reduce our annual tax rate by approximately 0.60% to 0.90%. See Note 11.
Net income and diluted income per share were $41.2 million and $1.52 per share, respectively, for Fiscal 2015. In Fiscal 2014, the net income was $45.1 million and diluted income was $1.64 per share.
19
Fiscal 2014 Compared to Fiscal 2013
The following is an analysis of changes in key items included in the statements of operations for the fiscal year ended August 30, 2014 compared to the fiscal year ended August 31, 2013:
Year Ended | |||||||||||||||
(In thousands, except percent and per share data) | August 30, 2014 | % of Revenues(1) | August 31, 2013 | % of Revenues(1) | Increase (Decrease) | % Change | |||||||||
Net revenues | $ | 945,163 | 100.0 | % | $ | 803,165 | 100.0 | % | $ | 141,998 | 17.7 | % | |||
Cost of goods sold | 841,166 | 89.0 | % | 718,534 | 89.5 | % | 122,632 | 17.1 | % | ||||||
Gross profit | 103,997 | 11.0 | % | 84,631 | 10.5 | % | 19,366 | 22.9 | % | ||||||
Selling | 18,293 | 1.9 | % | 18,318 | 2.3 | % | (25 | ) | (0.1 | )% | |||||
General and administrative | 22,424 | 2.4 | % | 21,887 | 2.7 | % | 537 | 2.5 | % | ||||||
(Gain) loss on real estate | (629 | ) | (0.1 | )% | 28 | — | % | (657 | ) | NMF | |||||
Operating expenses | 40,088 | 4.2 | % | 40,233 | 5.0 | % | (145 | ) | (0.4 | )% | |||||
Operating income | 63,909 | 6.8 | % | 44,398 | 5.5 | % | 19,511 | 43.9 | % | ||||||
Non-operating income | 768 | 0.1 | % | 696 | 0.1 | % | 72 | 10.3 | % | ||||||
Income before income taxes | 64,677 | 6.8 | % | 45,094 | 5.6 | % | 19,583 | 43.4 | % | ||||||
Provision for taxes | 19,624 | 2.1 | % | 13,141 | 1.6 | % | 6,483 | 49.3 | % | ||||||
Net income | $ | 45,053 | 4.8 | % | $ | 31,953 | 4.0 | % | $ | 13,100 | 41.0 | % | |||
Diluted income per share | $ | 1.64 | $ | 1.13 | $ | 0.51 | 45.1 | % | |||||||
Diluted average shares outstanding | 27,545 | 28,170 | |||||||||||||
(1) | Percentages may not add due to rounding differences. |
Motorhome unit deliveries and ASP, net of discounts, consisted of the following:
Year Ended | |||||||||||||||
August 30, 2014 (1) | Product Mix %(2) | August 31, 2013 | Product Mix %(2) | Increase (Decrease) | % Change | ||||||||||
Unit deliveries: | |||||||||||||||
Class A gas | 3,056 | 34.9 | % | 2,446 | 35.9 | % | 610 | 24.9 | % | ||||||
Class A diesel | 1,410 | 16.1 | % | 1,315 | 19.3 | % | 95 | 7.2 | % | ||||||
Total Class A | 4,466 | 51.0 | % | 3,761 | 55.1 | % | 705 | 18.7 | % | ||||||
Class B | 751 | 8.6 | % | 372 | 5.5 | % | 379 | 101.9 | % | ||||||
Class C | 3,538 | 40.4 | % | 2,688 | 39.4 | % | 850 | 31.6 | % | ||||||
Total motorhome unit deliveries | 8,755 | 100.0 | % | 6,821 | 100.0 | % | 1,934 | 28.4 | % | ||||||
ASP: | |||||||||||||||
Class A gas | $ | 94,630 | $ | 91,079 | $ | 3,551 | 3.9 | % | |||||||
Class A diesel | 180,218 | 200,820 | (20,602 | ) | (10.3 | )% | |||||||||
Total Class A | 121,652 | 129,449 | (7,797 | ) | (6.0 | )% | |||||||||
Class B | 71,417 | 77,947 | (6,530 | ) | (8.4 | )% | |||||||||
Class C | 69,920 | 73,435 | (3,515 | ) | (4.8 | )% | |||||||||
Total motorhome ASP | $ | 96,437 | $ | 104,566 | $ | (8,129 | ) | (7.8 | )% | ||||||
(1) An additional 343 motorhomes were delivered in Fiscal 2014 but not included in wholesale deliveries as presented in the table above as the units were subject to repurchase option. See Note 4.
(2) Percentages and dollars may not add due to rounding differences.
20
Towables deliveries and ASP, net of discounts, consisted of the following:
Year Ended | |||||||||||||||
(In units) | August 30, 2014 | Product Mix %(1) | August 31, 2013 | Product Mix %(1) | Increase (Decrease) | % Change | |||||||||
Unit deliveries: | |||||||||||||||
Travel trailer | 2,052 | 81.8 | % | 2,038 | 80.4 | % | 14 | 0.7 | % | ||||||
Fifth wheel | 457 | 18.2 | % | 497 | 19.6 | % | (40 | ) | (8.0 | )% | |||||
Total towable unit deliveries | 2,509 | 100.0 | % | 2,535 | 100.0 | % | (26 | ) | (1.0 | )% | |||||
ASP: | |||||||||||||||
Travel trailer | $ | 19,570 | $ | 19,560 | $ | 10 | 0.1 | % | |||||||
Fifth wheel | 40,115 | 29,298 | 10,817 | 36.9 | % | ||||||||||
Total towable ASP | $ | 23,312 | $ | 21,469 | $ | 1,843 | 8.6 | % | |||||||
(1) | Percentages and dollars may not add due to rounding differences. |
Net revenues consisted of the following:
Year Ended | |||||||||||||||||
(In thousands) | August 30, 2014 | August 31, 2013 | Increase | % Change | |||||||||||||
Motorhomes (1) | $ | 853,488 | 90.3 | % | $ | 718,580 | 89.5 | % | $ | 134,908 | 18.8 | % | |||||
Towables (2) | 58,123 | 6.1 | % | 54,683 | 6.8 | % | 3,440 | 6.3 | % | ||||||||
Other manufactured products | 33,552 | 3.6 | % | 29,902 | 3.7 | % | 3,650 | 12.2 | % | ||||||||
Total net revenues | $ | 945,163 | 100.0 | % | $ | 803,165 | 100.0 | % | $ | 141,998 | 17.7 | % | |||||
(1) | Includes motorhome units, parts and service |
(2) | Includes towable units and parts. |
The increase in motorhome net revenues of $134.9 million or 18.8% was primarily attributed to a 28.4% increase in unit deliveries driven by higher dealer and retail consumer demand when compared to Fiscal 2013. ASP decreased 7.8% in Fiscal 2014 due to new products introduced in all classes at lower price points during the year.
Towables revenues were $58.1 million in Fiscal 2014 compared to revenues of $54.7 million in Fiscal 2013. ASP increased 8.6% and towable unit deliveries decreased by 1.0%.
One contributing factor to the increase in unit deliveries during Fiscal 2014 relates to revised shipping terms with our dealers. Effective in the first quarter of Fiscal 2014, we entered into revised dealer agreements to change our shipping terms so that title and risk of loss passes to our dealers upon acceptance of the unit by an independent transportation company for delivery which is standard industry practice. As a result of this term change, an additional $40.8 million of revenue was recognized in Fiscal 2014, which represented units in possession of the transportation company in-transit to the dealer. In Fiscal 2013, such revenues would have been recognized in the next fiscal year. Conversely, due to our 52/53 week fiscal year convention, Fiscal 2013 had an extra week in the first quarter as compared to Fiscal 2014 resulting in an additional $13.8 million of revenue recognized in the prior year first quarter. The net effect of these two timing items resulted in a positive impact of $27.0 million when comparing Fiscal 2014 to Fiscal 2013.
Cost of goods sold was $841.2 million, or 89.0% of net revenues for Fiscal 2014 compared to $718.5 million, or 89.5% of net revenues for Fiscal 2013 due to the following:
• | Total variable costs (materials, direct labor, variable overhead, delivery expense and warranty), as a percent of net revenues, were 83.7% in both years. |
• | Fixed overhead (manufacturing support labor, depreciation and facility costs) and research and development-related costs decreased to 5.3% of net revenues compared to 5.7%. The difference was due primarily to increased revenues in Fiscal 2014. |
• | All factors considered, gross profit increased from 10.5% to 11.0% of net revenues. |
Selling expenses decreased to 1.9% from 2.3% of net revenues in Fiscal 2014 and Fiscal 2013, respectively. The decrease was due primarily to increased revenues in Fiscal 2014, as selling expenses were flat year over year.
General and administrative expenses were 2.4% and 2.7% of net revenues in Fiscal 2014 and Fiscal 2013, respectively. The decrease was due primarily to increased revenues in Fiscal 2014. General and administrative expenses increased $537,000, or 2.5%, in Fiscal 2014. This increase was due primarily to a reduction of rental income as a result of the sale of one of our warehouse properties in Fiscal 2014 and was partially offset by approximately $550,000 additional amortization on our Towables intangible assets in Fiscal 2013 (see Note 6).
During Fiscal 2014, we sold a warehouse facility in Forest City, Iowa, resulting in a gain of $629,000. See Note 5.
21
Non-operating income increased $72,000 or 10.3%, in Fiscal 2014. We received proceeds from COLI policies in both Fiscal 2014 and Fiscal 2013. See Note 12.
The overall effective income tax rate for Fiscal 2014 was 30.3% compared to 29.1% in Fiscal 2013. The overall increase is primarily a result of higher level of pre-tax book income earned in Fiscal 2014 compared to Fiscal 2013, as certain permanent deductions (tax-free income from COLI) recorded during Fiscal 2014 were relatively flat in dollar value compared to the prior year and legislation for various applicable tax credits expired on December 31, 2013; therefore our projected benefits for these tax credits were limited to four months of our fiscal year. See Note 11.
Net income and diluted income per share were $45.1 million and $1.64 per share, respectively, for Fiscal 2014. In Fiscal 2013, the net income was $32.0 million and diluted income was $1.13 per share.
Analysis of Financial Condition, Liquidity and Resources
Cash and cash equivalents increased $12.4 million during Fiscal 2015 and totaled $70.2 million as of August 29, 2015. The significant liquidity events that occurred during Fiscal 2015 were:
• | Generated net income of $41.2 million |
• | Capital expenditures of $16.6 million |
• | Dividend payments of $9.8 million |
• | Stock repurchases of $6.5 million |
As noted in Note 7, through our Amended Credit Agreement with GECC, we have the ability to borrow $35.0 million through a revolving credit facility based on our eligible inventory and certain receivables. In addition, the Amended Credit Agreement also includes a framework to expand the size of the facility up to $50.0 million, based on mutually agreeable terms at the time of the expansion. The Credit Agreement's term is through May 28, 2019. As of the date of this report, we are in compliance with all terms of the Credit Agreement, and no borrowings have been made thereunder.
We filed a Registration Statement on Form S-3, which was declared effective by the SEC on May 9, 2013. Subject to market conditions, we have the ability to offer and sell up to $35.0 million of our common stock in one or more offerings pursuant to the Registration Statement. The Registration Statement will be available for use for three years from its effective date. We currently have no plans to offer and sell the common stock registered under the Registration Statement; however, it does provide another potential source of liquidity in addition to the alternatives already in place.
Working capital at August 29, 2015 and August 30, 2014 was $184.6 million and $172.0 million, respectively, an increase of $12.6 million. We currently expect cash on hand, funds generated from operations and the availability under a credit facility to be sufficient to cover both short-term and long-term operating requirements. We anticipate capital expenditures in Fiscal 2016 of $20‑$30 million. In addition to the normal $8 - $10 million of maintenance spend for our current facilities, we will continue to invest in our ERP system and we are also evaluating incremental capacity expansion investments.
On October 14, 2015, the Board of Directors approved a quarterly cash dividend of $0.10 per share of common stock, payable on November 25, 2015 to shareholders of record at the close of business on November 11, 2015. We expect this cash outflow to be approximately $2.7 million for each quarter that this dividend is paid.
Operating Activities
Cash provided by operating activities was $45.2 million for the fiscal year ended August 29, 2015 compared to $23.2 million for the fiscal year ended August 30, 2014, and $10.2 million for the fiscal year ended August 31, 2013. The combination of net income of $41.2 million in Fiscal 2015 and changes in non-cash charges (e.g., depreciation, LIFO, stock-based compensation, deferred income taxes) provided $49.0 million of operating cash compared to $50.6 million in Fiscal 2014 and $39.0 million in Fiscal 2013. In Fiscal 2015, Fiscal 2014, and Fiscal 2013, changes in assets and liabilities (primarily an decrease in receivables in Fiscal 2015, an increase in receivables in Fiscal 2014 and inventory increases in Fiscal 2013) used $3.8 million, $27.4 million, and $28.8 million, respectively, of operating cash.
Investing Activities
Cash used in investing activities of $16.5 million in Fiscal 2015 was due primarily to capital spending of $16.6 million. In Fiscal 2014, cash used in investing activities of $5.4 million was primarily due to capital spending of $10.5 million and was partially offset by proceeds from the sale of property of $2.4 million and ARS redemptions of $2.4 million. During Fiscal 2013, cash provided by ARS redemptions of $4.1 million was primarily due to proceeds of ARS redemptions of $7.3 million and was partially offset by capital spending of $4.4 million.
Financing Activities
Cash used in financing activities of $16.2 million in Fiscal 2015 was primarily due to $9.8 million for the payments of dividends and $6.5 million in repurchases of our stock. We borrowed and repaid $22.0 million in our line of credit in the second quarter of Fiscal
22
2015. Cash used in financing for the fiscal years ended August 30, 2014 and August 31, 2013 was $24.3 million and $12.7 million, respectively, and was primarily for repurchases of our stock.
Contractual Obligations and Commercial Commitments
Our principal contractual obligations and commercial commitments as of August 29, 2015 were as follows:
Payments Due By Period | |||||||||||||||
(In thousands) | Total | Fiscal 2016 | Fiscal 2017-2018 | Fiscal 2019-2020 | More than 5 Years | ||||||||||
Postretirement health care obligations (1) | $ | 34,535 | $ | 980 | $ | 910 | $ | 866 | $ | 31,779 | |||||
Deferred compensation obligations (1) | 19,807 | 2,801 | 5,286 | 4,853 | 6,867 | ||||||||||
Executive share option obligations (1) | 4,788 | 880 | 2,728 | 1,180 | — | ||||||||||
Supplemental executive retirement plan benefit obligations (1) | 2,649 | 291 | 617 | 588 | 1,153 | ||||||||||
Operating leases (2) | 321 | 113 | 83 | 125 | — | ||||||||||
Contracted services | 93 | 93 | — | — | — | ||||||||||
Unrecognized tax benefits (3) | 2,511 | — | — | — | — | ||||||||||
Total contractual cash obligations | $ | 64,704 | $ | 5,158 | $ | 9,624 | $ | 7,612 | $ | 39,799 | |||||
Expiration By Period | |||||||||||||||
(In thousands) | Total | Fiscal 2016 | Fiscal 2017-2018 | Fiscal 2019-2020 | More than 5 Years | ||||||||||
Contingent repurchase obligations (2) | $ | 385,958 | $ | 16,354 | $ | 369,604 | $ | — | $ | — | |||||
(1) | See Note 9. |
(2) | See Note 10. |
(3) | We are not able to reasonably estimate in which future periods these amounts will ultimately be settled. |
Critical Accounting Policies
Our financial statements are prepared in accordance with GAAP. In connection with the preparation of our financial statements, we are required to make assumptions and estimates about future events and apply judgments that affect the reported amounts of assets, liabilities, revenue, expenses and the related disclosures. We base our assumptions, estimates and judgments on historical experience, current trends and other factors that we believe to be relevant at the time our financial statements are prepared. On a regular basis, we review the accounting policies, assumptions, estimates and judgments to ensure that our financial statements are presented fairly and in accordance with GAAP. However, because future events and their effects cannot be determined with certainty, actual results could differ from our assumptions and estimates and such differences could be material.
Our significant accounting policies are discussed in Note 1. We believe that the following accounting estimates and policies are the most critical to aid in fully understanding and evaluating our reported financial results and they require our most difficult, subjective or complex judgments, resulting from the need to make estimates about the effect of matters that are inherently uncertain. We have reviewed these critical accounting estimates and related disclosures with the Audit Committee of our Board of Directors.
Revenue Recognition
Generally, revenues for our RVs are recorded when the following conditions are met:
• | an order for a product has been received from a dealer |
• | written or verbal approval for payment has been received from the dealer's floorplan financing institution (if applicable) |
• | an independent transportation company has accepted responsibility for the product as agent for the dealer; and |
• | the product is removed from the Company's property for delivery to the dealer. |
These conditions are generally met when title passes, which is when RVs are shipped to dealers in accordance with shipping terms, which are primarily FOB shipping point. Products are not sold on consignment except for the rental program described in the next paragraph, dealers do not have the right to return products and dealers are typically responsible for interest costs to floor plan lenders.
In Fiscal 2014 we began to sell RVs to a rental company that were subject to our obligation to repurchase at the end of the rental term. These transactions were accounted for as operating leases. At the time of sale, the proceeds were recorded as deferred revenue in other current liabilities. The difference between the proceeds and the repurchase amount was recognized in net revenues over the term which the rental company holds the vehicle, using a straight-line method. The cost of the vehicles was recorded in net investment in operating leases and the difference between the cost of the vehicle and the estimated resale value was depreciated in net revenue over the term of the lease. Net proceeds or losses from the sale of the vehicle at resale were recognized in net revenue at the time of sale. Under the terms of our 2015 sales agreement, this order did not include any repurchase obligation, thus these units were not recorded as operating leases.
23
Revenues of our OEM components and RV related parts are recorded as the products are shipped from our location. The title of ownership transfers on these products as they leave our location due to the freight terms of FOB shipping point.
Sales Promotions and Incentives
We accrue for sales promotions and incentive expenses, which are recognized as a reduction to revenues, at the time of sale to the dealer or when the sales incentive is offered to the dealer or retail customer. Examples of sales promotions and incentive programs include dealer and consumer rebates, volume discounts, retail financing programs and dealer sales associate incentives. Sales promotion and incentive expenses are estimated based upon current program parameters, such as unit or retail volume, and historical rates. Actual results may differ from these estimates if market conditions dictate the need to enhance or reduce sales promotion and incentive programs or if the retail customer usage rate varies from historical trends. Historically, sales promotion and incentive expenses have been within our expectations and differences have not been material.
Repurchase Commitments
It is customary practice for manufacturers in the RV industry to enter into repurchase agreements with financing institutions that provide financing to their dealers, upon their request. Our repurchase agreements generally provide that, in the event of a default by a dealer in its obligation to these lenders, we will repurchase vehicles sold to the dealer that have not been resold to retail customers. The terms of these agreements, which can last up to 18 months, provide that our liability will be the lesser of remaining principal owed by the dealer or dealer invoice less periodic reductions based on the time since the date of the original invoice. Our liability cannot exceed 100% of the dealer invoice. In certain instances, we also repurchase inventory from our dealers due to state law or regulatory requirements that govern voluntary or involuntary relationship terminations.
Based on these repurchase agreements, we establish an associated loss reserve which is disclosed separately in the balance sheets. Repurchased sales are not recorded as a revenue transaction, but the net difference between the original repurchase price and the resale price are recorded against the loss reserve, which is a deduction from gross revenue. Our loss reserve for repurchase commitments contains uncertainties because the calculation requires management to make assumptions and apply judgment regarding a number of factors. There are two significant assumptions associated with establishing our loss reserve for repurchase commitments: (1) the percentage of dealer inventory that we will be required to repurchase as a result of defaults by the dealer, and (2) the loss that will be incurred, if any, when repurchased inventory is resold. These key assumptions are affected by a number of factors, such as macro-market conditions, current retail demand for our product, age of product in dealer inventory, physical condition of the product, location of the dealer, and the financing source. To the extent that dealers are increasing or decreasing their inventories, our overall exposure under repurchase agreements is likewise impacted. The percentage of dealer inventory we estimate we will repurchase (which has ranged in the past five years from 4 to 8% on a weighted average basis) and the associated estimated loss (which has ranged in the past five years from 5 to 12% on a weighted average basis) is based on historical information, current trends and an analysis of dealer inventory aging for all dealers with inventory subject to this obligation. In periods where there is increasing retail demand for our product at our dealerships, the lower end of our estimated range of assumptions will be more appropriate and in periods of decreasing retail demand, the opposite will be true.
While there can be no assurance that dealer and economic conditions will not adversely change, we currently do not believe there is a reasonable likelihood that there will be a material change in the future estimates or assumptions we use to calculate our loss reserve for repurchase commitments. A hypothetical change of a 10% increase or decrease in our significant repurchase commitment assumptions as of August 29, 2015 would have affected net income by approximately $280,000.
Warranty
We provide, with the purchase of any new motorhome, a comprehensive 12-month/15,000-mile warranty on Class A, B and C motorhomes and a 3-year/36,000-mile warranty on Class A and C sidewalls and floors. We provide a comprehensive 12-month warranty on all towable products. Estimated costs related to product warranty are accrued at the time of sale, based upon past warranty claims and unit sales history. Accruals are adjusted as needed to reflect actual costs incurred, as information becomes available. A significant increase in dealership labor rates, the cost of parts or the frequency of claims could have a material adverse impact on our operating results for the period or periods in which such claims or additional costs materialize.
In addition to the costs associated with the contractual warranty coverage provided on our products, we also occasionally incur costs as a result of additional service actions not covered by our warranties, including product recalls and customer satisfaction actions. Although we estimate and reserve for the cost of these service actions, there can be no assurance that expense levels will remain at current levels or such reserves will continue to be adequate.
While there can be no assurance that warranty expense will not adversely change, we currently do not believe there is a reasonable likelihood that there will be a material change in the future estimates or assumptions we use to calculate our warranty reserve. A hypothetical change of a 10% increase or decrease in our significant warranty commitment assumptions as of August 29, 2015 would have affected net income by approximately $619,000. Further discussion of our warranty costs and associated accruals is included in Note 8.
Income Taxes
We account for income taxes in accordance with ASC 740, Income Taxes. In preparing our financial statements, we are required to estimate our income taxes in each of the jurisdictions in which we operate. Significant judgment is required in determining our provision for income taxes, our deferred tax assets and liabilities and any valuation allowance recorded against our deferred tax
24
assets. We will continue to assess the likelihood that our deferred tax assets will be realizable at each reporting period and will be adjusted accordingly, which could materially impact our financial position and results of operations. As of August 29, 2015 , we have determined that our deferred tax assets are realizable, and therefore, no valuation allowance has been recorded.
Postretirement Benefits, Obligations and Costs
We provide certain health care and other benefits for retired employees hired before April 1, 2001, who have fulfilled eligibility requirements at age 55 with 15 years of continuous service. Postretirement benefit liabilities are determined by actuaries using assumptions about the discount rate and health care cost-trend rates. Assumed health care cost trend rates do not have a significant effect on the amounts reported for retiree health care benefits due to the fact that we have established maximum amounts ("dollar caps") on the amount we will pay for postretirement health care benefits per retiree on an annual basis. However, a significant increase or decrease in interest rates could have a significant impact on our operating results. Further discussion of our postretirement benefit plan and related assumptions is included in Note 9.
New Accounting Pronouncements
See Note 1 for a summary of new accounting pronouncements which summary is incorporated by reference herein.
Item 7A. Quantitative and Qualitative Disclosures About Market Risk
The assets we maintain to fund deferred compensation have market risk, but we maintain a corresponding liability for these assets. The market risk is therefore borne by the participants in the deferred compensation program.
We could incur financial market risk in the form of interest rate risk. Risk can be quantified by measuring the financial impact of a near-term adverse increase in short-term interest rates. At August 29, 2015, we had a $50.0 million credit facility with GECC. The interest rates applicable to this agreement are based on LIBOR plus 2.0%. We currently have no borrowings under this credit facility.
Item 8. Financial Statements and Supplementary Data
Index to Financial Statements | Page |
25
MANAGEMENT'S REPORT ON INTERNAL CONTROL OVER FINANCIAL REPORTING
We, the management of Winnebago Industries, Inc. (the "Company") are responsible for establishing and maintaining effective internal control over financial reporting and for the assessment of the effectiveness of internal control over financial reporting. The Company's internal control over financial reporting is a process designed, as defined in Rule 13a-15(f) under the Securities Exchange Act of 1934, as amended, to provide reasonable assurance regarding the reliability of financial reporting and the preparation of financial statements for external purposes in accordance with generally accepted accounting principles.
The Company's internal control over financial reporting is supported by written policies and procedures that:
1. | pertain to the maintenance of records that, in reasonable detail, accurately and fairly reflect the transactions and dispositions of the Company's assets; |
2. | provide reasonable assurance that transactions are recorded as necessary to permit preparation of financial statements in accordance with generally accepted accounting principles and that receipts and expenditures of the Company are being made only in accordance with authorizations of the Company's management and directors; and |
3. | provide reasonable assurance regarding prevention or timely detection of unauthorized acquisition, use or disposition of the Company's assets that could have a material effect on the financial statements. |
In addition, the Audit Committee of the Board of Directors, consisting solely of independent directors, meets periodically with Management, the internal auditors and the independent registered public accounting firm to review internal accounting controls, audit results and accounting principles and practices and annually selects the independent registered public accounting firm.
Because of its inherent limitations, internal control over financial reporting may not prevent or detect misstatements. Projections of any evaluation of effectiveness to future periods are subject to the risk that controls may become inadequate because of changes in conditions or that the degree of compliance with the policies or procedures may deteriorate.
In connection with the preparation of the Company's annual financial statements, management of the Company has undertaken an assessment of the effectiveness of the Company's internal control over financial reporting based on criteria established in Internal Control - Integrated Framework (2013) issued by the Committee of Sponsoring Organizations of the Treadway Commission (COSO). Management's assessment included an evaluation of the design of the Company's internal control over financial reporting and testing of the operational effectiveness of the Company's internal control over financial reporting.
Based on this assessment, management has concluded that the Company's internal control over financial reporting was effective as of August 29, 2015.
Deloitte & Touche LLP, the independent registered public accounting firm that audited the Company's financial statements included in this Annual Report on Form 10-K, has issued a report included herein, which expressed an unqualified opinion on the Company's internal control over financial reporting.
/s/ Lawrence A. Erickson | /s/ Sarah N. Nielsen | |
Lawrence A. Erickson | Sarah N. Nielsen | |
Chief Executive Officer | Vice President, Chief Financial Officer | |
October 27, 2015 | October 27, 2015 | |
26
REPORT OF INDEPENDENT REGISTERED PUBLIC ACCOUNTING FIRM
To the Board of Directors and Stockholders of
Winnebago Industries, Inc.
Forest City, Iowa
We have audited the internal control over financial reporting of Winnebago Industries, Inc. and subsidiaries (the "Company") as of August 29, 2015, based on criteria established in Internal Control - Integrated Framework (2013) issued by the Committee of Sponsoring Organizations of the Treadway Commission. The Company's management is responsible for maintaining effective internal control over financial reporting and for its assessment of the effectiveness of internal control over financial reporting, included in the accompanying Management's Report on Internal Control Over Financial Reporting. Our responsibility is to express an opinion on the Company's internal control over financial reporting based on our audit.
We conducted our audit in accordance with the standards of the Public Company Accounting Oversight Board (United States). Those standards require that we plan and perform the audit to obtain reasonable assurance about whether effective internal control over financial reporting was maintained in all material respects. Our audit included obtaining an understanding of internal control over financial reporting, assessing the risk that a material weakness exists, testing and evaluating the design and operating effectiveness of internal control based on the assessed risk, and performing such other procedures as we considered necessary in the circumstances. We believe that our audit provides a reasonable basis for our opinion.
A company's internal control over financial reporting is a process designed by, or under the supervision of, the company's principal executive and principal financial officers, or persons performing similar functions, and effected by the company's board of directors, management, and other personnel to provide reasonable assurance regarding the reliability of financial reporting and the preparation of financial statements for external purposes in accordance with generally accepted accounting principles. A company's internal control over financial reporting includes those policies and procedures that (1) pertain to the maintenance of records that, in reasonable detail, accurately and fairly reflect the transactions and dispositions of the assets of the company; (2) provide reasonable assurance that transactions are recorded as necessary to permit preparation of financial statements in accordance with generally accepted accounting principles, and that receipts and expenditures of the company are being made only in accordance with authorizations of management and directors of the company; and (3) provide reasonable assurance regarding prevention or timely detection of unauthorized acquisition, use, or disposition of the company's assets that could have a material effect on the financial statements.
Because of the inherent limitations of internal control over financial reporting, including the possibility of collusion or improper management override of controls, material misstatements due to error or fraud may not be prevented or detected on a timely basis. Also, projections of any evaluation of the effectiveness of the internal control over financial reporting to future periods are subject to the risk that the controls may become inadequate because of changes in conditions, or that the degree of compliance with the policies or procedures may deteriorate.
In our opinion, the Company maintained, in all material respects, effective internal control over financial reporting as of August 29, 2015, based on the criteria established in Internal Control - Integrated Framework (2013) issued by the Committee of Sponsoring Organizations of the Treadway Commission.
We have also audited, in accordance with the standards of the Public Company Accounting Oversight Board (United States), the consolidated financial statements as of and for the year ended August 29, 2015 of the Company and our report dated October 27, 2015 expressed an unqualified opinion on those financial statements.
/s/ Deloitte & Touche
Minneapolis, Minnesota
October 27, 2015
27
REPORT OF INDEPENDENT REGISTERED PUBLIC ACCOUNTING FIRM
To the Board of Directors and Stockholders of
Winnebago Industries, Inc.
Forest City, Iowa
We have audited the accompanying consolidated balance sheets of Winnebago Industries, Inc. and subsidiaries (the "Company") as of August 29, 2015 and August 30, 2014, and the related consolidated statements of income and comprehensive income, changes in stockholders' equity, and cash flows for each of the three years in the period ended August 29, 2015. These financial statements are the responsibility of the Company's management. Our responsibility is to express an opinion on the financial statements based on our audits.
We conducted our audits in accordance with the standards of the Public Company Accounting Oversight Board (United States). Those standards require that we plan and perform the audit to obtain reasonable assurance about whether the financial statements are free of material misstatement. An audit includes examining, on a test basis, evidence supporting the amounts and disclosures in the financial statements. An audit also includes assessing the accounting principles used and significant estimates made by management, as well as evaluating the overall financial statement presentation. We believe that our audits provide a reasonable basis for our opinion.
In our opinion, such consolidated financial statements present fairly, in all material respects, the financial position of Winnebago Industries, Inc. and subsidiaries at August 29, 2015 and August 30, 2014, and the results of their operations and their cash flows for each of the three years in the period ended August 29, 2015, in conformity with accounting principles generally accepted in the United States of America.
We have also audited, in accordance with the standards of the Public Company Accounting Oversight Board (United States), the Company's internal control over financial reporting as of August 29, 2015, based on the criteria established in Internal Control-Integrated Framework (2013) issued by the Committee of Sponsoring Organizations of the Treadway Commission and our report dated October 27, 2015 expressed an unqualified opinion on the Company's internal control over financial reporting.
/s/ Deloitte & Touche
Minneapolis, Minnesota
October 27, 2015
28
Winnebago Industries, Inc.
Consolidated Statements of Income and Comprehensive Income
Year Ended | |||||||||||
(In thousands, except per share data) | August 29, 2015 | August 30, 2014 | August 31, 2013 | ||||||||
Net revenues | $ | 976,505 | $ | 945,163 | $ | 803,165 | |||||
Cost of goods sold | 871,625 | 841,166 | 718,534 | ||||||||
Gross profit | 104,880 | 103,997 | 84,631 | ||||||||
Operating expenses: | |||||||||||
Selling | 19,161 | 18,293 | 18,318 | ||||||||
General and administrative | 25,838 | 22,424 | 21,887 | ||||||||
Impairment (gain on sale) of fixed assets | 462 | (629 | ) | 28 | |||||||
Total operating expenses | 45,461 | 40,088 | 40,233 | ||||||||
Operating income | 59,419 | 63,909 | 44,398 | ||||||||
Non-operating income | 115 | 768 | 696 | ||||||||
Income before income taxes | 59,534 | 64,677 | 45,094 | ||||||||
Provision for taxes | 18,324 | 19,624 | 13,141 | ||||||||
Net income | $ | 41,210 | $ | 45,053 | $ | 31,953 | |||||
Income per common share: | |||||||||||
Basic | $ | 1.53 | $ | 1.64 | $ | 1.14 | |||||
Diluted | $ | 1.52 | $ | 1.64 | $ | 1.13 | |||||
Weighted average common shares outstanding: | |||||||||||
Basic | 26,941 | 27,430 | 28,075 | ||||||||
Diluted | 27,051 | 27,545 | 28,170 | ||||||||
Net income | $ | 41,210 | $ | 45,053 | $ | 31,953 | |||||
Other comprehensive income (loss): | |||||||||||
Amortization of prior service credit (net of tax of $2,110, $2,068, and $1,944) | (3,428 | ) | (3,582 | ) | (3,226 | ) | |||||
Amortization of net actuarial loss (net of tax of $565, $337, and $361) | 918 | 749 | 1,264 | ||||||||
(Increase) decrease in actuarial loss (net of tax of $250, $1,348, and $2,177) | (407 | ) | (2,191 | ) | 3,612 | ||||||
Plan amendment (net of tax of $1,509, $1,364, and $1,613) | 2,451 | 2,216 | 2,676 | ||||||||
Unrealized appreciation of investments (net of tax of $0, $91, and $125) | — | 151 | 209 | ||||||||
Total other comprehensive (loss) income | (466 | ) | (2,657 | ) | 4,535 | ||||||
Comprehensive income | $ | 40,744 | $ | 42,396 | $ | 36,488 | |||||
See notes to consolidated financial statements.
29
Winnebago Industries, Inc.
Consolidated Balance Sheets
(In thousands, except per share data) | August 29, 2015 | August 30, 2014 | |||||
Assets | |||||||
Current assets: | |||||||
Cash and cash equivalents | $ | 70,239 | $ | 57,804 | |||
Receivables, less allowance for doubtful accounts ($120 and $127, respectively) | 66,936 | 69,699 | |||||
Inventories | 112,165 | 112,848 | |||||
Investment in operating leases | — | 15,978 | |||||
Prepaid expenses and other assets | 6,882 | 5,723 | |||||
Deferred income taxes | 9,995 | 9,641 | |||||
Total current assets | 266,217 | 271,693 | |||||
Property, plant and equipment, net | 37,250 | 25,135 | |||||
Investment in life insurance | 26,172 | 25,126 | |||||
Deferred income taxes | 21,994 | 24,029 | |||||
Goodwill | 1,228 | 1,228 | |||||
Other assets | 9,313 | 11,091 | |||||
Total assets | $ | 362,174 | $ | 358,302 | |||
Liabilities and Stockholders' Equity | |||||||
Current liabilities: | |||||||
Accounts payable | $ | 33,158 | $ | 33,111 | |||
Income taxes payable | 2,314 | 2,927 | |||||
Accrued expenses: | |||||||
Accrued compensation | 18,346 | 20,763 | |||||
Operating lease repurchase obligations | — | 16,050 | |||||
Product warranties | 11,254 | 9,501 | |||||
Self-insurance | 6,242 | 4,941 | |||||
Accrued loss on repurchases | 1,329 | 2,212 | |||||
Promotional | 3,149 | 3,205 | |||||
Other | 5,818 | 7,009 | |||||
Total current liabilities | 81,610 | 99,719 | |||||
Total long-term liabilities: | |||||||
Unrecognized tax benefits | 2,511 | 3,024 | |||||
Postretirement health care and deferred compensations benefits | 57,090 | 62,811 | |||||
Total long-term liabilities | 59,601 | 65,835 | |||||
Contingent liabilities and commitments | |||||||
Stockholders' equity: | |||||||
Capital stock common, par value $0.50; authorized 60,000 shares, issued 51,776 shares | 25,888 | 25,888 | |||||
Additional paid-in capital | 32,018 | 31,672 | |||||
Retained earnings | 585,941 | 554,496 | |||||
Accumulated other comprehensive loss | (2,274 | ) | (1,808 | ) | |||
Treasury stock, at cost (24,825 and 24,727 shares, respectively) | (420,610 | ) | (417,500 | ) | |||
Total stockholders' equity | 220,963 | 192,748 | |||||
Total liabilities and stockholders' equity | $ | 362,174 | $ | 358,302 | |||
See notes to consolidated financial statements.
30
Winnebago Industries, Inc.
Consolidated Statements of Changes in Stockholders' Equity
Common Shares | Additional Paid-In Capital (APIC) | Retained Earnings | Accum- ulated Other Compre- hensive Income | Treasury Stock | Total Stock- holders' Equity | |||||||||||||||||
(In thousands, except per share data) | Number | Amount | Number | Amount | ||||||||||||||||||
Balance, August 25, 2012 | 51,776 | $ | 25,888 | $ | 28,496 | $ | 477,490 | $ | (3,686 | ) | (23,122 | ) | $ | (383,497 | ) | $ | 144,691 | |||||
Stock option exercises | — | — | 9 | — | — | 4 | 66 | 75 | ||||||||||||||
Creation/(utilization) of APIC pool due to stock award | — | — | 86 | — | — | — | — | 86 | ||||||||||||||
Issuance of restricted stock | — | — | (729 | ) | — | — | 71 | 1,167 | 438 | |||||||||||||
Vesting of directors' stock units | — | — | 158 | — | — | — | — | 158 | ||||||||||||||
Stock-based compensation, net of forfeitures | — | — | 1,314 | — | — | 12 | 197 | 1,511 | ||||||||||||||
Payments for the purchase of common stock | — | — | — | — | — | (882 | ) | (12,718 | ) | (12,718 | ) | |||||||||||
Prior service cost and actuarial loss, net of $594 tax | — | — | — | — | 1,650 | — | — | 1,650 | ||||||||||||||
Plan amendment, net of $1,613 tax | — | — | — | — | 2,676 | — | — | 2,676 | ||||||||||||||
Unrealized appreciation of investments, net of $125 tax | — | — | — | — | 209 | — | — | 209 | ||||||||||||||
Net income | — | — | — | 31,953 | — | — | — | 31,953 | ||||||||||||||
Balance, August 31, 2013 | 51,776 | $ | 25,888 | $ | 29,334 | $ | 509,443 | $ | 849 | (23,917 | ) | $ | (394,785 | ) | $ | 170,729 | ||||||
Stock option exercises | — | — | 771 | — | — | 78 | 1,286 | 2,057 | ||||||||||||||
Creation/(utilization) of APIC pool due to stock award | — | — | 441 | — | — | — | — | 441 | ||||||||||||||
Issuance of restricted stock | — | — | (779 | ) | — | — | 137 | 2,279 | 1,500 | |||||||||||||
Stock-based compensation, net of forfeitures | — | — | 1,905 | — | — | 3 | 60 | 1,965 | ||||||||||||||
Payments for the purchase of common stock | — | — | — | — | — | (1,028 | ) | (26,340 | ) | (26,340 | ) | |||||||||||
Prior service cost and actuarial loss, net of $3,079 tax | — | — | — | — | (5,024 | ) | — | — | (5,024 | ) | ||||||||||||
Plan amendment, net of $1,364 tax | — | — | — | — | 2,216 | — | — | 2,216 | ||||||||||||||
Unrealized appreciation of investments, net of $91 tax | — | — | — | — | 151 | — | — | 151 | ||||||||||||||
Net income | — | — | — | 45,053 | — | — | — | 45,053 | ||||||||||||||
Balance, August 30, 2014 | 51,776 | $ | 25,888 | $ | 31,672 | $ | 554,496 | $ | (1,808 | ) | (24,727 | ) | $ | (417,500 | ) | $ | 192,748 | |||||
Creation/(utilization) of APIC pool due to stock award | — | — | 124 | — | — | — | — | 124 | ||||||||||||||
Issuance of restricted stock | — | — | (1,950 | ) | — | — | 199 | 3,360 | 1,410 | |||||||||||||
Stock-based compensation, net of forfeitures | — | — | 2,172 | — | — | 3 | 49 | 2,221 | ||||||||||||||
Payments for the purchase of common stock | — | — | — | — | — | (300 | ) | (6,519 | ) | (6,519 | ) | |||||||||||
Cash dividends paid and accrued on common stock-$0.36 per share | — | — | — | (9,765 | ) | — | — | — | (9,765 | ) | ||||||||||||
Prior service cost and actuarial loss, net of $1,795 tax | — | — | — | — | (2,917 | ) | — | — | (2,917 | ) | ||||||||||||
Plan amendment, net of $1,509 tax | — | — | — | — | 2,451 | — | — | 2,451 | ||||||||||||||
Net income | — | — | — | 41,210 | — | — | — | 41,210 | ||||||||||||||
Balance, August 29, 2015 | 51,776 | $ | 25,888 | $ | 32,018 | $ | 585,941 | $ | (2,274 | ) | (24,825 | ) | $ | (420,610 | ) | $ | 220,963 | |||||
See notes to consolidated financial statements.
31
Winnebago Industries, Inc.
Consolidated Statements of Cash Flows
Year Ended | |||||||||||
(In thousands) | August 29, 2015 | August 30, 2014 | August 31, 2013 | ||||||||
Operating activities: | |||||||||||
Net income | $ | 41,210 | $ | 45,053 | $ | 31,953 | |||||
Adjustments to reconcile net income to net cash provided by operating activities: | |||||||||||
Depreciation and amortization | 4,513 | 3,997 | 4,764 | ||||||||
LIFO expense (income) | 1,244 | 1,456 | (1,180 | ) | |||||||
Asset impairment | 462 | — | — | ||||||||
Stock-based compensation | 3,097 | 3,386 | 3,009 | ||||||||
Deferred income taxes including valuation allowance | 215 | (48 | ) | 1,790 | |||||||
Postretirement benefit income and deferred compensation expense | (843 | ) | (979 | ) | 245 | ||||||
(Benefit) provision for doubtful accounts | (1 | ) | (19 | ) | 25 | ||||||
Gain on disposal of property | (14 | ) | (691 | ) | (95 | ) | |||||
Gain on life insurance | (11 | ) | (726 | ) | (536 | ) | |||||
Loss on sale of investments | — | — | 45 | ||||||||
Increase in cash surrender value of life insurance policies | (883 | ) | (805 | ) | (1,030 | ) | |||||
Change in assets and liabilities: | |||||||||||
Inventories | (561 | ) | (1,763 | ) | (24,267 | ) | |||||
Receivables, prepaid and other assets | 2,458 | (38,233 | ) | (8,908 | ) | ||||||
Investment in operating leases, net of repurchase obligations | (72 | ) | 72 | — | |||||||
Income taxes and unrecognized tax benefits | 408 | 5,625 | (194 | ) | |||||||
Accounts payable and accrued expenses | (1,880 | ) | 10,919 | 8,939 | |||||||
Postretirement and deferred compensation benefits | (4,159 | ) | (4,008 | ) | (4,322 | ) | |||||
Net cash provided by operating activities | 45,183 | 23,236 | 10,238 | ||||||||
Investing activities: | |||||||||||
Proceeds from the sale of investments | — | 2,350 | 7,300 | ||||||||
Proceeds from life insurance | 43 | 1,737 | 1,004 | ||||||||
Purchases of property and equipment | (16,573 | ) | (10,476 | ) | (4,422 | ) | |||||
Proceeds from the sale of property | 65 | 2,423 | 734 | ||||||||
Payments of COLI borrowings | — | — | (1,371 | ) | |||||||
Other | (52 | ) | (1,402 | ) | 822 | ||||||
Net cash (used in) provided by investing activities | (16,517 | ) | (5,368 | ) | 4,067 | ||||||
Financing activities: | |||||||||||
Payments for purchases of common stock | (6,519 | ) | (26,340 | ) | (12,718 | ) | |||||
Payments of cash dividends | (9,765 | ) | — | — | |||||||
Proceeds from exercise of stock options | — | 2,080 | 75 | ||||||||
Borrowings on loans | 22,000 | — | — | ||||||||
Repayments on loans | (22,000 | ) | — | — | |||||||
Other | 53 | (81 | ) | (68 | ) | ||||||
Net cash used in financing activities | (16,231 | ) | (24,341 | ) | (12,711 | ) | |||||
Net increase (decrease) in cash and cash equivalents | 12,435 | (6,473 | ) | 1,594 | |||||||
Cash and cash equivalents at beginning of year | 57,804 | 64,277 | 62,683 | ||||||||
Cash and cash equivalents at end of year | $ | 70,239 | $ | 57,804 | $ | 64,277 | |||||
Supplement cash flow disclosure: | |||||||||||
Income taxes paid, net | $ | 17,658 | $ | 14,061 | $ | 11,500 | |||||
Interest paid | 10 | — | — | ||||||||
See notes to consolidated financial statements. | |||||||||||
32
Winnebago Industries, Inc.
Notes to Consolidated Financial Statements
Note 1: Summary of Significant Accounting Policies
Nature of Operations
Winnebago Industries, Inc., founded in 1958 and headquartered in Forest City, Iowa, is one of the leading manufacturers of RVs which we sell through independent dealers, primarily throughout the United States and Canada. Other products manufactured by us consist primarily of original equipment manufacturing parts, including extruded aluminum and other component products for other manufacturers, commercial vehicles and commercial transit buses.
Principles of Consolidation
The consolidated financial statements for Fiscal 2015 include the parent company and our wholly-owned subsidiary, Winnebago of Indiana, LLC. All material intercompany balances and transactions with our subsidiary have been eliminated.
Fiscal Period
We follow a 52-/53-week fiscal year, ending the last Saturday in August. Fiscal 2015 and Fiscal 2014 were 52-week fiscal periods. Fiscal 2013 was a 53-week fiscal year; the first quarter ending December 1, 2012 was a 14-week quarter.
Use of Estimates
The preparation of financial statements in conformity with accounting principles generally accepted in the US requires management to make estimates and assumptions that affect the reported amounts of assets and liabilities and disclosure of contingent assets and liabilities at the date of the financial statements and the reported amounts of revenues and expenses during the reporting periods. Actual results could differ from those estimates.
Cash and Cash Equivalents
Cash and cash equivalents consist primarily of highly liquid investments with an original maturity of three months or less. The carrying amount approximates fair value due to the short maturity of the investments.
Fair Value Disclosures of Financial Instruments
All financial instruments are carried at amounts believed to approximate fair value.
Derivative Instruments and Hedging Activities
All contracts that contain provisions meeting the definition of a derivative also meet the requirements of, and have been designated as, normal purchases or sales. Our policy is to not enter into contracts with terms that cannot be designated as normal purchases or sales.
Allowance for Doubtful Accounts
The allowance for doubtful accounts is based on historical loss experience and any specific customer collection issues identified. Additional amounts are provided through charges to income as we believe necessary after evaluation of receivables and current economic conditions. Amounts which are considered to be uncollectible are written off and recoveries of amounts previously written off are credited to the allowance upon recovery.
Inventories
Substantially, all inventories are stated at the lower of cost or market, determined on the LIFO basis. Manufacturing cost includes materials, labor and manufacturing overhead. Unallocated overhead and abnormal costs are expensed as incurred.
Property and Equipment
Depreciation of property and equipment is computed using the straight‑line method on the cost of the assets, less allowance for salvage value where appropriate, at rates based upon their estimated service lives as follows:
Asset Class | Asset Life |
Buildings | 10-30 years |
Machinery and equipment | 3-15 years |
Software | 3-10 years |
Transportation equipment | 4-6 years |
We review our long-lived depreciable assets for impairment annually or whenever events or changes in circumstances indicate that the carrying value of an asset may not be recoverable from future cash flows. If the carrying value of a long-lived asset is impaired, an impairment charge is recorded for the amount by which the carrying value of the long-lived asset exceeds its fair value. We assess the potential impairment of long-lived assets in accordance with ASC 360 Property, Plant and Equipment. We also reviewed all other long-lived depreciable assets for impairment, noting no impairment.
Goodwill and Amortizable Intangible Assets
Goodwill represents costs in excess of the fair value of net tangible and identifiable net intangible assets acquired in a business combination. Goodwill assets were reviewed for impairment as of August 29, 2015 by applying a fair-value based test on an
33
annual basis, or more frequently if circumstances indicate a potential impairment. Amortizable intangible assets consisted of dealer network, trademarks and non-compete agreements and are fully amortized.
Self-Insurance
Generally, we self-insure for a portion of product liability claims and workers' compensation. Under these plans, liabilities are recognized for claims incurred, including those incurred but not reported. We determined the liability for product liability and workers' compensation claims with the assistance of a third party administrator and actuary using various state statutes and historical claims experience. We have a $35 million insurance policy that includes an SIR for product liability of $2.5 million per occurrence and $6.0 million in aggregate per policy year. In the event that the annual aggregate of the SIR is exhausted by payment of claims and defense expenses, an SIR of $1.0 million, excluding defense expenses, is applicable to each claim covered under this policy. We maintain excess liability insurance with outside insurance carriers to minimize our risks related to catastrophic claims in excess of our self-insured positions for product liability and personal injury matters. Any material change in the aforementioned factors could have an adverse impact on our operating results. Our product liability and workers' compensation accrual is included within accrued self-insurance on our balance sheet.
Income Taxes
In preparing our financial statements, we are required to estimate our income taxes in each of the jurisdictions in which we operate. This process involves estimating our current tax exposure together with assessing temporary differences resulting from differing treatment of items for tax and accounting purposes. These temporary differences result in deferred tax assets and liabilities, which are included within our balance sheet. We then assess the likelihood that our deferred tax assets will be realized based on future taxable income and, to the extent we believe that recovery is not likely, we establish a valuation allowance. To the extent we establish a valuation allowance or change this allowance in a period, we include an expense or a benefit within the tax provision in our Statements of Income.
Legal
Our accounting policy regarding litigation expense is to accrue for probable exposure including estimated defense costs if we are able to estimate the financial impact.
Revenue Recognition
Generally, revenues for our RVs are recorded when the following conditions are met:
• | an order for a product has been received from a dealer |
• | written or verbal approval for payment has been received from the dealer's floorplan financing institution (if applicable) |
• | an independent transportation company has accepted responsibility for the product as agent for the dealer; and |
• | the product is removed from the Company's property for delivery to the dealer. |
These conditions are generally met when title passes, which is when RVs are shipped to dealers in accordance with shipping terms, which are primarily FOB shipping point. Products are not sold on consignment except for the rental program described below, dealers do not have the right to return products and dealers are typically responsible for interest costs to floor plan lenders.
In Fiscal 2014 we began to sell RVs to a rental company. These units were subject to our obligation to repurchase at the end of the lease term. These transactions were accounted for as operating leases. At the time of sale, the proceeds were recorded as deferred revenue in other current liabilities. The difference between the proceeds and the repurchase amount was recognized in net revenues over the term which the rental company held the vehicle, using a straight-line method. The cost of the vehicles was recorded in net investment in operating leases and the difference between the cost of the vehicle and the estimated resale value was depreciated in net revenue over the term of the lease. Net proceeds or losses from the sale of the vehicle at resale were recognized in net revenue at the time of sale. Under the terms of our 2015 sales agreement, this order did not include any repurchase obligation, thus no units were recorded as operating leases in 2015.
Revenues of our OEM components and RV related parts are recorded as the products are shipped from our location. The title of ownership transfers on these products as they leave our location due to the freight terms of FOB shipping point.
Delivery Revenues and Expenses
Delivery revenues for products delivered are included within net sales, while delivery expenses are included within cost of goods sold.
Concentration of Risk
One of our dealer organizations accounted for 17.9%, 19.7%, and 26.5% of our consolidated net revenue in Fiscal 2015, 2014 and 2013, respectively. In Fiscal 2015 this dealer sold our products in 75 of their dealership locations across 28 US states. A second dealer organization accounted for 15% and 12.3% of our net revenue for Fiscal 2015 and Fiscal 2014, respectively. In Fiscal 2015 this dealer sold products in 11 of their dealership locations across 4 US states. The loss of either or both of these dealer organizations could have a significant adverse effect on our business. In addition, deterioration in the liquidity or creditworthiness of either or both of these dealers could negatively impact our sales and could trigger repurchase obligations under our repurchase agreements.
34
Sales Promotions and Incentives
We accrue for sales promotions and incentive expenses, which are recognized as a reduction to revenues, at the time of sale to the dealer or when the sales incentive is offered to the dealer or retail customer. Examples of sales promotions and incentive programs include dealer and consumer rebates, volume discounts, retail financing programs and dealer sales associate incentives. Sales promotion and incentive expenses are estimated based upon then current program parameters, such as unit or retail volume and historical rates. Actual results may differ from these estimates if market conditions dictate the need to enhance or reduce sales promotion and incentive programs or if the retail customer usage rate varies from historical trends. Historically, sales promotion and incentive accruals have been within our expectations and differences have not been material.
Repurchase Commitments
It is customary practice for manufacturers in the recreation vehicle industry to enter into repurchase agreements with financing institutions that provide financing to their dealers. Our repurchase agreements generally provide that, in the event of a default by a dealer in its obligation to these lenders, we will repurchase vehicles sold to the dealer that have not been resold to retail customers. The terms of these agreements, which can last up to 18 months, provide that our liability will be the lesser of remaining principal owed by the dealer or dealer invoice less periodic reductions based on the time since the date of the original invoice. Our liability cannot exceed 100% of the dealer invoice. In certain instances, we also repurchase inventory from our dealers due to state law or regulatory requirements that govern voluntary or involuntary relationship terminations.
Based on these repurchase agreements, we establish an associated loss reserve which is disclosed separately as "Accrued loss on repurchases" in the consolidated balance sheets. Repurchased sales are not recorded as a revenue transaction, but the net difference between the original repurchase price and the resale price are recorded against the loss reserve, which is a deduction from gross revenue. Our loss reserve for repurchase commitments contains uncertainties because the calculation requires management to make assumptions and apply judgment regarding a number of factors. See Note 10.
Reporting Segment
We have one reportable segment, the RV market. We design, develop, manufacture and market motorized and towable recreation products along with supporting products and services.
Research and Development
Research and development expenditures are included within cost of goods sold and are expensed as incurred. A portion of these expenditures qualify for state and federal tax benefits. Development activities generally relate to creating new products and improving or creating variations of existing products to meet new applications. During Fiscal 2015, 2014 and 2013, we spent approximately $3.9 million, $4.3 million and $3.8 million, respectively, on research and development activities.
Advertising
Advertising costs, which consist primarily of literature and trade shows, were $5.5 million, $5.1 million, and $4.7 million in Fiscal 2015, 2014 and 2013, respectively. Advertising costs are included in selling expense and are expensed as incurred with the exception of trade shows which are expensed in the period in which the show occurs.
Earnings Per Common Share
Basic income per common share is computed by dividing net income by the weighted average common shares outstanding during the period.
Diluted income per common share is computed by dividing net income by the weighted average common shares outstanding plus the incremental shares that would have been outstanding upon the assumed exercise of dilutive stock awards and options (see Note 15).
Subsequent Events
We evaluated events occurring between the end of our most recent fiscal year and the date the financial statements were issued. There were no material subsequent events, except those described in Note 9, Note 13 and Note 18.
New Accounting Pronouncements
In May 2014, the FASB issued ASU 2014-09, Revenue from Contracts with Customers (Topic 606), which specifies how and when to recognize revenue as well as providing informative, relevant disclosures. In August 2015, the FASB deferred the effective date of this standard by one year, which would become effective for fiscal years beginning after December 15, 2017 (our Fiscal 2019). We are currently evaluating the impact on our consolidated financial statements.
In August 2014, the FASB issued ASU 2014-15, Going Concern (Subtopic 205-40), which provides guidance on management's responsibility in evaluating whether there is substantial doubt about a company's ability to continue as a going concern and related footnote disclosures. ASU 2012-15 will become effective for years ending after December 15, 2016 (our Fiscal 2017). We are currently evaluating the impact on our consolidated financial statements.
In July 2015, the FASB issued ASU 2015-11, Inventory (Topic 330), which requires inventory measured using any method other than last-in, first-out (“LIFO”) or the retail inventory method to be subsequently measured at the lower of cost or net realizable value, rather than at the lower of cost or market. Under this ASU, subsequent measurement of inventory using the LIFO and retail
35
inventory method is unchanged. ASU 2015-11 will become effective prospectively for fiscal years beginning after December 15, 2016 (our Fiscal 2018). We are currently evaluating the impact on our consolidated financial statements.
Note 2: Investments and Fair Value Measurements
Fair value is defined as the price that would be received to sell an asset or paid to transfer a liability (an exit price) in the principal or most advantageous market for the asset or liability in an orderly transaction between market participants on the measurement date. The fair value hierarchy contains three levels as follows:
Level 1 - Unadjusted quoted prices that are available in active markets for the identical assets or liabilities at the measurement date.
Level 2 - Other observable inputs available at the measurement date, other than quoted prices included in Level 1, either directly or indirectly, including:
• | Quoted prices for similar assets or liabilities in active markets; |
• | Quoted prices for identical or similar assets in nonactive markets; |
• | Inputs other than quoted prices that are observable for the asset or liability; and |
• | Inputs that are derived principally from or corroborated by other observable market data. |
Level 3 - Unobservable inputs that cannot be corroborated by observable market data and reflect the use of significant management judgment. These values are generally determined using pricing models for which the assumptions utilize management’s estimates of market participant assumptions.
Assets and Liabilities that are Measured at Fair Value on a Recurring Basis. We account for fair value measurements in accordance with ASC 820, Fair Value Measurements and Disclosures, which defines fair value, establishes a framework for measurement and expands disclosure about fair value measurement. The fair value hierarchy requires the use of observable market data when available. In instances in which the inputs used to measure fair value fall into different levels of the fair value hierarchy, the fair value measurement has been determined based on the lowest level input that is significant to the fair value measurement in its entirety. Our assessment of the significance of a particular item to the fair value measurement in its entirety requires judgment, including the consideration of inputs specific to the asset or liability.
The following tables set forth by level within the fair value hierarchy our financial assets that were accounted for at fair value on a recurring basis at August 29, 2015 and August 30, 2014 according to the valuation techniques we used to determine their fair values:
Fair Value at August 29, 2015 | Fair Value Measurements Using Inputs Considered As | |||||||||||||||
(In thousands) | Level 1 | Level 2 | Level 3 | |||||||||||||
Assets that fund deferred compensation: | ||||||||||||||||
Domestic equity funds | $ | 4,937 | $ | 4,894 | $ | 43 | $ | — | ||||||||
International equity funds | 493 | 477 | 16 | — | ||||||||||||
Fixed income funds | 284 | 251 | 33 | — | ||||||||||||
Total assets at fair value | $ | 5,714 | $ | 5,622 | $ | 92 | $ | — | ||||||||
Fair Value at August 30, 2014 | Fair Value Measurements Using Inputs Considered As | |||||||||||||||
(In thousands) | Level 1 | Level 2 | Level 3 | |||||||||||||
Assets that fund deferred compensation: | ||||||||||||||||
Domestic equity funds | $ | 5,465 | $ | 5,465 | $ | — | $ | — | ||||||||
International equity funds | 716 | 716 | — | — | ||||||||||||
Fixed income funds | 242 | 242 | — | — | ||||||||||||
Total assets at fair value | $ | 6,423 | $ | 6,423 | $ | — | $ | — | ||||||||
The following table provides a reconciliation between the beginning and ending balances of items measured at fair value on a recurring basis in the table above that used significant unobservable inputs (Level 3):
(In thousands) | August 29, 2015 | August 30, 2014 | |||||
Balance at beginning of year | $ | — | $ | 2,108 | |||
Net realized loss included in non-operating income | — | — | |||||
Net change included in other comprehensive income | — | 242 | |||||
Sales | — | (2,350 | ) | ||||
Balance at the end of year | $ | — | $ | — | |||
36
The following methods and assumptions were used to estimate the fair value of each class of financial instrument:
Long-term investments. At August 31, 2013, we held $2.4 million (par value) of tax-exempt ARS, which were variable-rate debt securities and had a long-term maturity. Our long-term ARS investments were classified as Level 3, as quoted prices were unavailable and there was insufficient observable ARS market information available to determine the fair value of these investments. During the first quarter of Fiscal 2014, our remaining ARS holding of $2.4 million was called at par for a full redemption.
Assets that fund deferred compensation. Our assets that fund deferred compensation are marketable equity securities measured at fair value using quoted market prices and primarily consist of equity-based mutual funds. The majority of which are classified as Level 1 as they are traded in an active market for which closing stock prices are readily available. These securities fund the Executive Share Option Plan and the Executive Deferred Compensation Plan (2007) (see Note 9), deferred compensation programs. The Executive Plan assets related to those options that will expire within a year are included in prepaid expenses and other assets in the accompanying balance sheets. The remaining assets are included in other assets.
Assets and Liabilities that are measured at Fair Value on a Nonrecurring Basis. Our non-financial assets, which include goodwill and property and equipment, are not required to be measured at fair value on a recurring basis. However, if certain triggering events occur, or if an annual impairment test is required, we must evaluate the non-financial asset for impairment. If an impairment did occur, the asset is required to be recorded at the estimated fair value. Using Level 2 inputs, we recorded an impairment of $462,000 for our corporate plane during the fiscal year ended August 29, 2015. See Note 5.
Note 3: Inventories
Inventories consist of the following:
(In thousands) | August 29, 2015 | August 30, 2014 | |||||
Finished goods | $ | 12,179 | $ | 28,029 | |||
Work-in-process | 66,602 | 49,919 | |||||
Raw materials | 65,928 | 66,200 | |||||
Total | 144,709 | 144,148 | |||||
LIFO reserve | (32,544 | ) | (31,300 | ) | |||
Total inventories | $ | 112,165 | $ | 112,848 | |||
The above value of inventories, before reduction for the LIFO reserve, approximates replacement cost at the respective dates. Of the $144.7 million inventory at August 29, 2015, $135.3 million is valued on a LIFO basis and the Towables inventory of $8.4 million is valued on a FIFO basis. Of the $144.1 million inventory at August 30, 2014, $137.7 million is valued on a LIFO basis and the Towables inventory of $6.4 million is valued on a FIFO basis.
During Fiscal 2015 and Fiscal 2014 we recorded an increase to LIFO reserves of $1.2 million and $1.5 million based on increases in inflation.
Note 4: Net Investment in Operating Leases and Operating Lease Repurchase Obligation
During the third quarter of Fiscal 2014 we delivered 520 RV rental units to Apollo, a US RV rental company. Under the terms of a sales agreement with Apollo, all units were paid for upon delivery. To secure an order of this magnitude, we contractually agreed to repurchase up to 343 of the units at specified prices after one season of rental use (by no later than December 31, 2014) provided certain conditions were met. On December 29, 2014 the termination date for our repurchase obligation was extended from December 31, 2014 to February 28, 2015. The original cost of these units was depreciated down to the estimated net realizable value of the rental units during the time frame that the units were in rental use. During the first quarter of Fiscal 2015, we were released from our repurchase obligation for 124 units as Apollo sold the units in the market place. As units subject to repurchase were sold, we removed the remaining net investment in operating lease as well as the operating lease repurchase obligation. In the second quarter of Fiscal 2015, we were released from our remaining repurchase obligations and as a result, there were no associated assets or liabilities on the balance sheet at February 28, 2015 or thereafter.
Net lease revenue was recorded ratably over the rental period that Apollo held the units based upon the difference between the proceeds received and the estimated repurchase obligation less the estimated depreciation expense of the unit. We were not required to repurchase any units from Apollo, thus we did not record a gain or loss for the difference between the estimated residual value of the unit and the actual resale value as a component of net lease revenue. We recorded net lease revenue of $626,000 and $1.3 million during Fiscal 2014 and Fiscal 2015, respectively.
In March 2015, we received a rental order of similar size from Apollo. Under the terms of the sales agreement, this order did not include any repurchase obligation, thus these units were not recorded as operating leases.
37
Note 5: Property, Plant and Equipment and Assets Held for Sale
Property, plant and equipment is stated at cost, net of accumulated depreciation and consists of the following:
(In thousands) | August 29, 2015 | August 30, 2014 | ||||||
Land | $ | 1,874 | $ | 738 | ||||
Buildings and building improvements | 53,388 | 47,273 | ||||||
Machinery and equipment | 94,034 | 90,101 | ||||||
Software | 8,033 | 4,356 | ||||||
Transportation | 8,913 | 9,098 | ||||||
Total property, plant and equipment, gross | 166,242 | 151,566 | ||||||
Less accumulated depreciation | (128,992 | ) | (126,431 | ) | ||||
Total property, plant and equipment, net | $ | 37,250 | $ | 25,135 | ||||
In Fiscal 2014, a lessee exercised an option to purchase warehouse facilities that they had leased from us since 1980. Net proceeds from the sale were $2.3 million, resulting in a gain of $629,000.
On April 17, 2015 we purchased the Towables assembly facilities in Middlebury, Indiana for $5.4 million and on May 5, 2015 we purchased a facility in Waverly, Iowa for $850,000 for expansion of our subassembly operations.
Assets Held for Sale
In the third quarter of Fiscal 2015 we placed our corporate plane for sale, recorded an impairment of $462,000 and reclassified the net book value to current other assets in the consolidated balance sheets. In the fourth quarter of Fiscal 2015 we took our plane off the market and reclassified the net book value to property, plant and equipment in the consolidated balance sheets.
At August 30, 2014 and August 29, 2015, we had no assets held for sale.
Note 6: Goodwill and Amortizable Intangible Assets
Goodwill and intangible assets are the result of the acquisition of SunnyBrook during Fiscal 2011. Goodwill of $1.2 million is not subject to amortization for financial statement purposes, but is amortizable for tax return purposes. Goodwill assets are reviewed for impairment by applying a fair-value based test on an annual basis, or more frequently if circumstances indicate a potential impairment.
Amortizable intangible assets of $770,000 consisted of dealer network, trademarks and non-compete agreements and were fully amortized in Fiscal 2013 after identifying a decrease in the estimated useful lives. Amortization expense was $0, $0 and $640,000 for Fiscal 2015, Fiscal 2014, and Fiscal 2013, respectively.
Note 7: Credit Facilities
On October 31, 2012, we entered into a Credit Agreement with GECC. The Credit Agreement provides for an initial $35.0 million revolving credit facility, based on our eligible inventory and was to expire on October 31, 2015 before the amendment described below. There is no termination fee associated with the agreement.
The Credit Agreement contains no financial covenant restrictions for borrowings where we have excess borrowing availability under the facility of greater than $5.0 million. The Credit Agreement requires us to comply with a fixed charge ratio if excess borrowing availability under the facility is less than $5.0 million. In addition the Credit Agreement also includes a framework to expand the size of the facility up to $50.0 million, based on mutually agreeable terms at the time of the expansion. The initial unused line fee associated with the Credit Agreement is 0.5% per annum and has the ability to be lowered based upon facility usage.
The Credit Agreement contains typical affirmative representations and covenants for a credit agreement of this size and nature. Additionally, the Credit Agreement contains negative covenants limiting our ability, among other things, to incur debt, grant liens, make acquisitions, make certain investments, pay certain dividends and distributions, engage in mergers, consolidations or acquisitions and sell certain assets. Obligations under the Credit Agreement are secured by a security interest in all of our accounts and other receivables, chattel paper, documents, deposit accounts, instruments, equipment, inventory, investment property, leasehold interest, cash and cash equivalents, letter-of-credit rights, most real property and fixtures and certain other business assets.
On May 28, 2014, we amended this Credit Agreement (the "Amended Credit Agreement"). The Amended Credit Agreement extends the term of the credit facility from October 31, 2015 to May 28, 2019. In addition, interest on loans made under the Amended Credit Facility will be based on LIBOR plus a margin of 2.0%. The amendment also revised and added definitions of several terms including an expanded Restricted Payment Basket that now permits up to $15.0 million purchases of company stock or cash dividends to be excluded from the Fixed Charge ratio. In addition, the definition of Eligible Accounts was expanded to permit certain receivables to be included in the Borrowing Base. The Amended Credit Agreement also permits us to engage in
38
certain sale lease buyback transactions in the ordinary course of business subject to certain restrictions and increases our ability to incur capital lease obligations.
During the second quarter of Fiscal 2015 we utilized the credit facility to meet working capital needs. As of the date of this report, we are in compliance with all material terms of the Amended Credit Agreement, and no borrowings are outstanding.
Note 8: Warranty
We provide our motorhome customers a comprehensive 12-month/15,000-mile warranty on our Class A, B, and C motorhomes, and a 3-year/36,000-mile structural warranty on Class A and C sidewalls and floors. We provide a comprehensive 12-month warranty on all towable products. From time to time, we voluntarily incur costs for certain warranty-type expenses occurring after the normal warranty period to help protect the reputation of our products and the goodwill of our customers. Estimated costs related to product warranty are accrued at the time of sale and are based upon past warranty claims and unit sales history and adjusted as required to reflect actual costs incurred, as information becomes available. A significant increase in dealership labor rates, the cost of parts or the frequency of claims could have a material adverse impact on our operating results for the period or periods in which such claims or additional costs materialize.
In addition to the costs associated with the contractual warranty coverage provided on our products, we also occasionally incur costs as a result of additional service actions not covered by our warranties, including product recalls and customer satisfaction actions. Although we estimate and reserve for the cost of these service actions, there can be no assurance that expense levels will remain at current levels or such reserves will continue to be adequate.
Changes in our product warranty liability during Fiscal 2015, Fiscal 2014, and Fiscal 2013 are as follows:
(In thousands) | August 29, 2015 | August 30, 2014 | August 31, 2013 | ||||||||
Balance at beginning of year | $ | 9,501 | $ | 8,443 | $ | 6,990 | |||||
Provision | 12,892 | 10,947 | 9,075 | ||||||||
Claims paid | (11,139 | ) | (9,889 | ) | (7,622 | ) | |||||
Balance at end of year | $ | 11,254 | $ | 9,501 | $ | 8,443 | |||||
Note 9: Employee and Retiree Benefits
Postretirement health care and deferred compensation benefits are as follows:
(In thousands) | August 29, 2015 | August 30, 2014 | |||||
Postretirement health care benefit cost | $ | 34,535 | $ | 36,930 | |||
Non-qualified deferred compensation | 19,508 | 21,014 | |||||
Executive share option plan liability | 4,788 | 5,628 | |||||
SERP benefit liability | 2,649 | 2,974 | |||||
Executive deferred compensation | 299 | 213 | |||||
Officer stock-based compensation | 242 | 627 | |||||
Total postretirement health care and deferred compensation benefits | 62,021 | 67,386 | |||||
Less current portion(1) | (4,931 | ) | (4,575 | ) | |||
Long-term postretirement health care and deferred compensation benefits(2) | $ | 57,090 | $ | 62,811 | |||
(1) | Included in current liabilities in the Consolidated Balance Sheets |
(2) | Included in long-term liabilities in the Consolidated Balance Sheets |
Postretirement Health Care Benefits
We provide certain health care and other benefits for retired employees hired before April 1, 2001, who have fulfilled eligibility requirements at age 55 with 15 years of continuous service. We use a September 1 measurement date for this plan and our postretirement health care plan currently is not funded.
In Fiscal 2005, through a plan amendment, we established dollar caps on the amount that we will pay for postretirement health care benefits per retiree on an annual basis so that we were not exposed to continued medical inflation. Retirees are required to pay a monthly premium in excess of the employer dollar caps for medical coverage based on years of service and age at retirement. Each January for the past four years, the employer established dollar caps were reduced by 10% in each year through plan amendments. As a result of these amendments, our liability for postretirement health care was reduced as presented in the following table.
39
Date | Plan Amendment | Dollar Cap Reduction | Liability Reduction (in thousands) | Amortization Period (1) | |||||||
Fiscal 2005 | Established employer dollar cap | $ | 40,414 | 11.5 | years | ||||||
January 2012 | Reduced employer dollar cap | 10% | 4,598 | 7.8 | years | ||||||
January 2013 | Reduced employer dollar cap | 10% | 4,289 | 7.5 | years | ||||||
January 2014 | Reduced employer dollar cap | 10% | 3,580 | 7.3 | years | ||||||
January 2015 | Reduced employer dollar cap | 10% | 3,960 | 7.1 | years | ||||||
(1) Plan amendments are amortized on a straight-line basis over the expected remaining service period of active plan participants.
Based on actuarial evaluations, the discount rate used in determining the accumulated postretirement benefit obligation was 4.15% at August 29, 2015 and 3.89% at August 30, 2014. In Fiscal 2015, a change in the mortality table resulted in an actuarial loss, which was partially offset by an increase in the discount rate. The result of these components was an increase to the benefit obligation of $684,000, presented as an actuarial loss in the following table. Assumed health care cost trend rates do not have a significant effect in determining the accumulated postretirement benefit obligation due to employer caps established.
Changes in our postretirement health care liability are as follows:
(In thousands) | August 29, 2015 | August 30, 2014 | |||||
Balance at beginning of year | $ | 36,930 | $ | 36,244 | |||
Interest cost | 1,382 | 1,540 | |||||
Service cost | 427 | 393 | |||||
Net benefits paid | (928 | ) | (1,035 | ) | |||
Actuarial loss | 684 | 3,368 | |||||
Plan amendment | (3,960 | ) | (3,580 | ) | |||
Balance at end of year | $ | 34,535 | $ | 36,930 | |||
Net periodic postretirement benefit income for the past three fiscal years consisted of the following components:
Year Ended | |||||||||||
(In thousands) | August 29, 2015 | August 30, 2014 | August 31, 2013 | ||||||||
Interest cost | $ | 1,382 | $ | 1,540 | $ | 1,508 | |||||
Service cost | 427 | 393 | 574 | ||||||||
Amortization of prior service benefit | (5,538 | ) | (5,650 | ) | (5,170 | ) | |||||
Amortization of net actuarial loss | 1,465 | 1,077 | 1,603 | ||||||||
Net periodic postretirement benefit income | $ | (2,264 | ) | $ | (2,640 | ) | $ | (1,485 | ) | ||
For accounting purposes, we recognized net periodic postretirement income as presented in the table above, due to the amortization of prior service benefit associated with the establishment of caps on the employer portion of benefits in Fiscal 2005 and the 10% cap reductions made over the past four years.
Amounts not yet recognized in net periodic benefit cost and included in accumulated other comprehensive income (before taxes) are as follows:
(In thousands) | August 29, 2015 | August 30, 2014 | |||||
Prior service credit | $ | (13,279 | ) | $ | (14,857 | ) | |
Net actuarial loss | 16,410 | 17,190 | |||||
Accumulated other comprehensive income | $ | 3,131 | $ | 2,333 | |||
On September 28, 2015, we announced a postretirement health care plan amendment which will reduce benefits for our participants. Beginning January 1, 2016, postretirement health care benefits will be discontinued for retirees age 65 and over. We plan to fund a $700,000 health reimbursement account in calendar 2016 to assist retirees with medical expenses and provide education and assistance to help retirees through the transition. The plan amendment also includes a 10% reduction in employer paid premiums for retirees under age 65. Effective in the first quarter of Fiscal 2016, this amendment will result in a reduction in our long-term liabilities for postretirement benefits of approximately $29.0 million with a corresponding increase to accumulated other comprehensive income, net of tax. The decrease will be amortized into earnings over the average remaining service period of active plan participants of 6.9 years.
40
Taking into consideration the January 1, 2016 plan amendment, the estimated amounts that will be amortized from accumulated other comprehensive income to net periodic benefit cost in Fiscal 2016 include a prior service credit of $7.7 million and an actuarial net loss of $1.6 million.
Taking into consideration the January 1, 2016 plan amendment, expected future benefit payments for postretirement health care for the next ten years are as follows:
(In thousands) | Amount | ||||
Year: | 2016 | $ | 980 | ||
2017 | 541 | ||||
2018 | 369 | ||||
2019 | 413 | ||||
2020 | 453 | ||||
2021 - 2025 | 2,349 | ||||
Total | $ | 5,105 | |||
The expected future benefit payments have been estimated based on the same assumptions used to measure our benefit obligation as of August 29, 2015, and include benefits attached to estimated current employees' future services.
Deferred Compensation Benefits
Non-Qualified Deferred Compensation Program (1981)
We have a Non-Qualified Deferred Compensation Program which permitted key employees to annually elect to defer a portion of their compensation until their retirement. The plan has been closed to any additional deferrals since January 2001. The retirement benefit to be provided is based upon the amount of compensation deferred and the age of the individual at the time of the contracted deferral. An individual generally vests at age 55 and 5 years of participation under the plan. For deferrals prior to December 1992, vesting occurs at the later of age 55 and 5 years of service from first deferral or 20 years of service. Deferred compensation expense was $1.3 million, $1.4 million and $1.5 million in Fiscal 2015, 2014 and 2013, respectively. Total deferred compensation liabilities were $19.5 million and $21.0 million at August 29, 2015 and August 30, 2014, respectively.
Supplemental Executive Retirement Plan (SERP)
The primary purpose of this plan was to provide our officers and managers with supplemental retirement income for a period of 15 years after retirement. We have not offered this plan on a continuing basis to members of management since 1998. The plan was funded with individual whole life insurance policies (Split Dollar Program) owned by the named insured officer or manager. We initially paid the life insurance premiums on the life of the individual and the individual would receive life insurance and supplemental cash payment during the 15 years following retirement. In October 2008, the plan was amended as a result of changes in the tax and accounting regulations and rising administrative costs. Under the redesigned SERP, the underlying life insurance policies previously owned by the insured individual became COLI by a release of all interests by the participant and assignment to us as a prerequisite to participation in the SERP and transition from the Split Dollar Program. Total SERP liabilities were $2.6 million and $3.0 million at August 29, 2015 and August 30, 2014, respectively. This program remains closed to new employee participation.
To assist in funding the deferred compensation and SERP liabilities, we have invested in COLI policies. The cash surrender value of these policies is presented as investment in life insurance in the accompanying balance sheets and consists of the following:
(In thousands) | August 29, 2015 | August 30, 2014 | |||||
Cash value | $ | 58,501 | $ | 55,982 | |||
Borrowings | (32,329 | ) | (30,856 | ) | |||
Investment in life insurance | $ | 26,172 | $ | 25,126 | |||
Non-Qualified Share Option Program (2001)
The Non-Qualified Share Option Program permitted participants in the Executive Share Option Plan (the "Executive Plan") to choose to defer a portion of their salary or other eligible compensation in the form of options to purchase selected securities, primarily equity-based mutual funds. These assets are treated as trading securities and are recorded at fair value. The Executive Plan has been closed to any additional deferrals since January 2005. The Executive Plan assets related to those options that will expire within a year are included in prepaid expenses and other assets in the accompanying balance sheets. The remaining assets are included in other assets. Total assets on August 29, 2015 and August 30, 2014 were $5.4 million and $6.4 million, respectively, and the liabilities were $4.8 million and $5.6 million, respectively. The difference between the asset and liability balances represents the additional 25% we contributed at the time of the initial deferrals to aid in potential additional earnings to the participant. This contribution is required to be paid back to us when the option is exercised. A participant may exercise his or her options per the plan document, but there is a requirement that after these dollars have been invested for 15 years the participant is required to exercise such option.
41
Executive Deferred Compensation Plan (2007)
In December 2006, we adopted the Winnebago Industries, Inc. Executive Deferred Compensation Plan (the "Executive Deferred Compensation Plan"). Under the Executive Deferred Compensation Plan, corporate officers and certain key employees may annually choose to defer up to 50% of their salary and up to 100% of their cash incentive awards. The assets are presented as other assets and the liabilities are presented as postretirement health care and deferred compensation benefits in the accompanying balance sheets. Such assets on August 29, 2015 and August 30, 2014 were $297,000 and $211,000, respectively, and liabilities were $299,000 and $213,000, respectively.
Profit Sharing Plan
We have a qualified profit sharing and contributory 401(k) plan for eligible employees. The plan provides quarterly discretionary matching cash contributions as approved by our Board of Directors. Contributions to the plan for Fiscal 2015, 2014 and 2013 were $1.2 million, $1.1 million and $865,000, respectively.
Note 10: Contingent Liabilities and Commitments
Repurchase Commitments
Generally, manufacturers in the RV industry enter into repurchase agreements with lending institutions which have provided wholesale floorplan financing to dealers. Most dealers' RVs are financed on a "floorplan" basis under which a bank or finance company lends the dealer all, or substantially all, of the purchase price, collateralized by a security interest in the RVs purchased.
Our repurchase agreements provide that, in the event of default by the dealer on the agreement to pay the lending institution, we will repurchase the financed merchandise. The terms of these agreements, which generally can last up to 18 months, provide that our liability will be the lesser of remaining principal owed by the dealer or dealer invoice less periodic reductions based on the time since the date of the original invoice. Our contingent liability on these repurchase agreements was approximately $386.0 million and $363.8 million at August 29, 2015 and August 30, 2014, respectively.
In certain instances, we also repurchase inventory from our dealers due to state law or regulatory requirements that govern voluntary or involuntary relationship terminations. Although laws vary from state to state, some states have laws in place that require manufacturers of RVs to repurchase current inventory if a dealership exits the business. Incremental repurchase exposure beyond existing repurchase agreements, related to dealer inventory in states that we have had historical experience of repurchasing inventory, totaled $7.2 million and $6.8 million at August 29, 2015 and August 30, 2014, respectively.
Our risk of loss related to these repurchase commitments is significantly reduced by the potential resale value of any products that are subject to repurchase and is spread over numerous dealers and lenders. The aggregate contingent liability related to our repurchase agreements represents all financed dealer inventory at the period reporting date subject to a repurchase agreement, net of the greater of periodic reductions per the agreement or dealer principal payments. Based on the repurchase exposure as previously described, we established an associated loss reserve. Our accrued losses on repurchases were $1.3 million as of August 29, 2015 and $2.2 million as of August 30, 2014.
A summary of the activity for the fiscal years stated for repurchased units is as follows:
(Dollars in thousands) | Fiscal 2015 | Fiscal 2014 | Fiscal 2013 | |||||||||
Inventory repurchased: | ||||||||||||
Units | 62 | 21 | 20 | |||||||||
Dollars | $ | 7,472 | $ | 467 | $ | 451 | ||||||
Inventory resold: | ||||||||||||
Units | 62 | 20 | 20 | |||||||||
Cash collected | $ | 6,409 | $ | 392 | $ | 353 | ||||||
Loss recognized | $ | 1,063 | $ | 75 | $ | 98 | ||||||
Units in ending inventory | 1 | 1 | — | |||||||||
A significant number of the units repurchased in Fiscal 2015 were attributable to a single dealership for which we had established a specific repurchase loss reserve in Fiscal 2014.
Litigation
We are involved in various legal proceedings which are ordinary and routine litigation incidental to our business, some of which are covered in whole or in part by insurance. We believe while the final resolution of any such litigation may have an impact on our results for a particular reporting period, the ultimate disposition of such litigation will not have any material adverse effect on our financial position, results of operations or liquidity.
42
Lease Commitments
We have operating leases for certain land, buildings and equipment. Lease expense was $901,000 for Fiscal 2015, $1.1 million for Fiscal 2014 and $949,000 for Fiscal 2013. Minimum future lease commitments under noncancelable lease agreements in excess of one year as of August 29, 2015 are as follows:
(In thousands) | Amount | ||||
Year Ended: | 2016 | $ | 113 | ||
2017 | 83 | ||||
2018 | 71 | ||||
2019 | 54 | ||||
2020 | — | ||||
Total | $ | 321 | |||
Note 11: Income Taxes
The components of the provision for income taxes are as follows:
Year Ended | ||||||||||||
(In thousands) | August 29, 2015 | August 30, 2014 | August 31, 2013 | |||||||||
Current | ||||||||||||
Federal | $ | 15,406 | $ | 17,923 | $ | 10,958 | ||||||
State | 1,124 | (170 | ) | (680 | ) | |||||||
Total current tax provision | 16,530 | 17,753 | 10,278 | |||||||||
Deferred | ||||||||||||
Federal | 1,486 | 1,415 | 1,666 | |||||||||
State | 308 | 456 | 1,197 | |||||||||
Total deferred tax provision | 1,794 | 1,871 | 2,863 | |||||||||
Total tax provision | $ | 18,324 | $ | 19,624 | $ | 13,141 | ||||||
Current Tax Provision
The amount of current federal tax provision noted in the table above for Fiscal 2015, 2014 and 2013 represents primarily the estimated federal tax payable for those fiscal years in addition to the tax effect of tax planning initiatives recorded during the year.
The state provision recorded in Fiscal 2015 primarily represents the estimated state tax payable plus the tax effect of tax planning initiatives recorded during the year. The state benefit recorded for 2014 and 2013 is primarily a result of tax planning initiatives recorded during those years.
Deferred Tax Provision
The deferred federal and state expense recorded during Fiscal 2015, Fiscal 2014 and Fiscal 2013 is primarily a result of the utilization of deferred tax assets during the year.
The following is a reconciliation of the US statutory income tax rate to our effective tax rate:
Year Ended | |||||||||
(A percentage) | August 29, 2015 | August 30, 2014 | August 31, 2013 | ||||||
US federal statutory rate | 35.0 | % | 35.0 | % | 35.0 | % | |||
State taxes, net of federal benefit | 2.4 | % | 2.3 | % | 2.1 | % | |||
Tax-free and dividend income | (1.3 | )% | (1.5 | )% | (2.2 | )% | |||
Income tax credits | (0.3 | )% | (0.4 | )% | (1.7 | )% | |||
Domestic production activities deduction | (3.7 | )% | (2.8 | )% | (2.4 | )% | |||
Other permanent items | (0.8 | )% | (0.9 | )% | (0.8 | )% | |||
Valuation allowance | — | % | (0.4 | )% | 0.2 | % | |||
Uncertain tax positions settlements and adjustments | (0.5 | )% | (1.0 | )% | (1.1 | )% | |||
Effective tax provision rate | 30.8 | % | 30.3 | % | 29.1 | % | |||
43
Significant items comprising our net deferred tax assets are as follows:
(In thousands) | August 29, 2015 | August 30, 2014 | |||||
Current deferred income tax asset (liability) | |||||||
Warranty reserves | $ | 4,288 | $ | 3,620 | |||
Self-insurance reserve | 2,378 | 1,882 | |||||
Accrued vacation | 1,938 | 1,805 | |||||
Inventory | (2,383 | ) | (1,682 | ) | |||
Deferred compensation | 1,175 | 1,199 | |||||
Other | 2,599 | 2,817 | |||||
Total net current deferred income tax asset | 9,995 | 9,641 | |||||
Noncurrent deferred income tax asset (liability) | |||||||
Postretirement health care benefits | 12,792 | 13,634 | |||||
Deferred compensation | 9,582 | 9,565 | |||||
Tax credits and NOL carryforwards | 140 | (1) | 261 | ||||
Unrecognized tax benefit | 726 | 895 | |||||
Depreciation | (1,338 | ) | (992 | ) | |||
Other | 92 | 666 | |||||
Total net noncurrent deferred income tax asset | 21,994 | 24,029 | |||||
Total deferred income tax assets | $ | 31,989 | $ | 33,670 | |||
(1) | At August 29, 2015, NOL carryforwards included $140,000 of state NOLs that will begin to expire in Fiscal 2021. We have evaluated all the positive and negative evidence and consider it more likely than not that these carryforwards can be realized. |
Unrecognized Tax Benefits
Changes in the unrecognized tax benefits are as follows:
(In thousands) | Fiscal 2015 | Fiscal 2014 | Fiscal 2013 | |||||||||
Unrecognized tax benefits - beginning balance | $ | (1,709 | ) | $ | (2,134 | ) | $ | (5,228 | ) | |||
Gross decreases - tax positions in a prior period | 568 | 816 | 3,101 | (1) | ||||||||
Gross increases - current period tax positions | (448 | ) | (391 | ) | (7 | ) | ||||||
Unrecognized tax benefits - ending balance | (1,589 | ) | (1,709 | ) | (2,134 | ) | ||||||
Accrued interest and penalties | (922 | ) | (1,315 | ) | (1,854 | ) | ||||||
Total unrecognized tax benefits | $ | (2,511 | ) | $ | (3,024 | ) | $ | (3,988 | ) | |||
(1) | Approximately $1.3 million of the gross decreases for Fiscal 2013 includes the removal of the interest and penalties from the overall disclosed reserve balance of unrecognized tax benefits. The remaining reductions are as a result of changes in balance of positions that meet the more-likely-than-not threshold. |
We do not believe within the next twelve months there will be a significant change in the total amount of unrecognized tax benefits as of August 29, 2015.
If the remaining uncertain positions are ultimately favorably resolved, $1.9 million of unrecognized benefits could have a positive impact on our effective tax rate. It is our policy to recognize interest and penalties accrued relative to unrecognized tax benefits into tax expense.
We file tax returns in the US federal jurisdiction, as well as various international and state jurisdictions. Although certain years are no longer subject to examinations by the IRS and various state taxing authorities, NOL carryforwards generated in those years may still be adjusted upon examination by the IRS or state taxing authorities if they either have been or will be used in a future period. As of August 29, 2015, our federal returns from Fiscal 2012 to present continue to be subject to review by the IRS. As of August 29, 2015, our Fiscal 2014 Federal return is being reviewed. With few exceptions, the state returns from Fiscal 2009 to present continue to be subject to review by the taxing jurisdictions. At this time we do have one state jurisdiction that is currently reviewing our Fiscal 2012 and Fiscal 2013 returns. A number of years may elapse before an uncertain tax position is audited and finally resolved, and it is often very difficult to predict the outcome of such audits. Periodically, various state and local jurisdictions conduct audits, therefore, a variety of years are subject to state and local jurisdiction review.
44
Note 12: Non-Operating Income and Expense
Non-operating income consists of:
Year Ended | |||||||||||
August 29, 2015 | August 30, 2014 | August 31, 2013 | |||||||||
COLI appreciation | $ | 2,542 | $ | 2,425 | $ | 2,616 | |||||
COLI death benefits | 11 | 726 | 537 | ||||||||
COLI premiums | (453 | ) | (491 | ) | (487 | ) | |||||
COLI interest expense | (1,682 | ) | (1,613 | ) | (1,640 | ) | |||||
Total COLI | 418 | 1,047 | 1,026 | ||||||||
Line of credit expense | (315 | ) | (338 | ) | (339 | ) | |||||
Loss on sale of investment | — | — | (45 | ) | |||||||
Interest income | 10 | 49 | 65 | ||||||||
Gain (loss) on foreign currency transactions | 2 | 10 | (11 | ) | |||||||
Total non-operating income | $ | 115 | $ | 768 | $ | 696 | |||||
Note 13: Stock-Based Compensation Plans
We have a 2014 Omnibus Equity, Performance Award, and Incentive Compensation Plan approved by shareholders (as amended, the "Plan") in place which allows us to grant or issue non-qualified stock options, incentive stock options, share awards and other equity compensation to key employees and to non-employee directors. No more than 3.6 million shares of common stock may be issued under the Plan and no more than 3.6 million of those shares may be used for awards other than stock options or stock appreciation rights. Shares subject to awards that are forfeited or terminated, expire unexercised, are cancelled and settled in cash in lieu of common stock or are exchanged for awards that do no involve common stock, shall be added back to the limits and again immediately become available for awards.
Stock Options and Share Awards
With respect to stock options, the Plan replaced the 2004 Incentive Compensation Plan. Any stock options previously granted under the 2004 Incentive Compensation Plan continue to be exercisable in accordance with their original terms and conditions. The term of any options granted under the Plan may not exceed ten years from the date of the grant. Stock options are granted at the closing market price on the date of grant. Options issued to key employees generally vest over a three-year period in equal annual installments, beginning one year after the date of grant, with immediate vesting upon retirement or upon a change of control (as defined in the Plan), if earlier. Historically, options issued to directors vested six months after grant.
Share awards vest based either upon continued employment, beginning one year after the date of grant, with immediate vesting upon retirement for awards made prior to October 2016 or upon a change of control (collectively, "time-based") or upon attainment of established goals. Share awards that are not time-based typically vest at the end of a one year or three-year incentive period based upon the achievement of company goals ("performance-based"). The value of time-based restricted share awards is based on the number of shares granted and the closing price of our common stock on the date of grant. The value of performance-based restricted share awards is based upon the terms of the plan and an assessment of the probability of reaching the established performance targets. Historically, the terms of these plans linked the incentive payment to a percentage of base salary compensation and if the established goals are met, shares of the appropriate value are then granted.
Annual Incentive Plans
For Fiscal 2013, Fiscal 2014 and Fiscal 2015, the Human Resources Committee of our Board of Directors established annual incentive plans for the officers that were to be paid in 2/3 cash and 1/3 restricted stock (stock must be held for one year from date of grant except for shares we agree to repurchase in lieu of executives' payment of payroll taxes).
• | Certain financial performance metrics (net income and ROIC) were achieved for Fiscal 2013 under the annual incentive plan thus $3.0 million of compensation expense was accrued under this plan at the end of Fiscal 2013 of which $1.0 million was stock-based. On October 15, 2013, the Human Resources Committee of the Board of Directors approved the award of 38,139 restricted shares to the officers under the annual incentive plan. Of the shares granted, we repurchased 19,436 shares from employees who elected to pay their payroll tax via delivery of shares of common stock as opposed to cash. |
• | Certain financial performance metrics (net income and ROIC) were achieved for Fiscal 2014 under the annual incentive plan thus $2.6 million of compensation expense was accrued under this plan at the end of Fiscal 2014 of which $866,000 was stock-based. On October 14, 2014, the Human Resources Committee of the Board of Directors approved the award of 40,495 restricted shares to the officers under the annual incentive plan. Of the shares granted, we repurchased 20,638 shares from employees who elected to pay their payroll tax via delivery of shares of common stock as opposed to cash. |
• | Certain financial performance metrics (net income and ROIC) were achieved for Fiscal 2015 under the annual incentive plan thus $454,000 of compensation expense was accrued under this plan at the end of Fiscal 2015 of which $157,000 was stock-based. On October 13, 2015, the Human Resources Committee of the Board of Directors approved the award of 7,914 restricted shares to the officers under the annual incentive plan. Of the shares granted, we repurchased 3,511 shares from employees who elected to pay their payroll tax via delivery of shares of common stock as opposed to cash. |
45
Long-Term Incentive Plans
For Fiscal 2013, Fiscal 2014 and Fiscal 2015, the Human Resources Committee of our Board of Directors established three different three-year incentive compensation plans (Officers Long-Term Incentive Plan Fiscal 2013-2015, 2014-2016 and 2015-2017) to serve as an incentive to our senior management team to achieve certain ROE targets. If the ROE target is met, restricted stock will be awarded subsequent to the end of each three year period with a one-year restriction on sale upon award (except for shares we agree to repurchase in lieu of executives' payment of payroll taxes). In the event that we do not achieve the required ROE targets, no restricted stock will be granted. If it becomes probable that certain of the ROE performance targets will be achieved, the corresponding estimated cost of the grant will be recorded as stock-based compensation expense over the performance period. The probability of reaching the targets is evaluated each reporting period. If it becomes probable that certain of the target performance levels will be achieved, a cumulative adjustment will be recorded and future stock-based-compensation expense will increase based on the then projected performance levels. If we later determine that it is not probable that the minimum ROE performance threshold for the grants will be met, no further stock-based compensation cost will be recognized and any previously recognized stock-based compensation cost related to these plans will be reversed.
• | As of the end of Fiscal 2013, $444,000 of stock-based compensation expense has been accrued for these plans. Specifically, for the 2011-2013 plan, the ROE target was met, thus subsequent to year end, in October 2013 restricted stock was awarded to the officers in this plan. On October 15, 2013, the Human Resources Committee of the Board of Directors approved the award of 16,006 shares valued at $443,000 to the officers under the 2011-2013 long-term incentive plan. Of the shares granted, we repurchased 7,875 shares valued at $218,000 from employees who elected to pay their payroll tax via delivery of common stock as opposed to cash. |
• | As of the end of Fiscal 2014, $540,000 of stock-based compensation expense has been accrued for these plans. Specifically, for the 2012-2014 plan, the ROE target was met, thus subsequent to year end, in October 2014 restricted stock was awarded to the officers in this plan. On October 14, 2014, the Human Resources Committee of the Board of Directors approved the award of 25,529 shares valued at $545,000 to the officers under the 2012-2014 long-term incentive plan. Of the shares granted, we repurchased 13,011 shares valued at $278,000 from employees who elected to pay their payroll tax via delivery of common stock as opposed to cash. |
• | As of the end of Fiscal 2015, $360,000 of stock-based compensation expense has been accrued for these plans. Specifically, for the 2013-2015 plan, the ROE target was met, thus subsequent to year end, in October 2015 restricted stock was awarded to the officers in this plan. On October 13, 2015, the Human Resources Committee of the Board of Directors approved the award of 18,156 shares valued at $360,000 to the officers under the 2013-2015 long-term incentive plan. Of the shares granted, we repurchased 8,529 shares valued at $169,000 from employees who elected to pay their payroll tax via delivery of common stock as opposed to cash. |
Director's Awards
Non-employee directors may elect to receive all or part of their annual retainer and board fees in the form of Winnebago Industries stock units credited in the form of shares of our common stock instead of cash. The directors are restricted from selling these shares until their retirement. During Fiscal 2015, there were 2,907 stock units awarded to our non-employee directors in lieu of cash compensation. The aggregate intrinsic value of these awards as of August 29, 2015 was $2.0 million with 96,611 stock units outstanding.
Stock-Based Compensation
Total stock-based compensation expense for the past three fiscal years consisted of the following components:
Year Ended | |||||||||||
(In thousands) | August 29, 2015 | August 30, 2014 | August 31, 2013 | ||||||||
Share awards: | |||||||||||
Performance-based annual plan employee award expense | $ | 157 | $ | 866 | $ | 1,055 | |||||
Performance-based long-term plan employee award expense | 360 | 540 | 444 | ||||||||
Time-based employee award expense | 2,060 | 1,472 | 1,145 | ||||||||
Time-based directors award expense | 412 | 410 | 159 | ||||||||
Directors stock unit expense | 108 | 98 | 206 | ||||||||
Total stock-based compensation | $ | 3,097 | $ | 3,386 | $ | 3,009 | |||||
46
Stock Options
A summary of stock option activity for Fiscal 2015, 2014 and 2013 is as follows:
Year Ended | ||||||||||||||||||||||||
August 29, 2015 | August 30, 2014 | August 31, 2013 | ||||||||||||||||||||||
Shares | Price per Share | Wtd. Avg. Exercise Price/Share | Shares | Price per Share | Wtd. Avg. Exercise Price/Share | Shares | Price per Share | Wtd. Avg. Exercise Price/Share | ||||||||||||||||
Outstanding at beginning of year | 457,421 | $26 - $36 | $ | 30.38 | 664,994 | $26 - $36 | $ | 29.83 | 727,664 | $18 - $36 | $ | 29.08 | ||||||||||||
Options granted | — | — | — | — | — | — | — | — | — | |||||||||||||||
Options exercised | — | — | — | (77,833 | ) | $26 - $27 | 26.72 | (4,000 | ) | $19 | 18.84 | |||||||||||||
Options canceled | (290,027 | ) | $26 - $36 | 31.58 | (129,740 | ) | $26 - $35 | 29.75 | (58,670 | ) | $18 - $32 | 21.26 | ||||||||||||
Outstanding at end of year | 167,394 | $26 - $34 | $ | 28.30 | 457,421 | $26 - $36 | $ | 30.38 | 664,994 | $26 - $36 | $ | 29.83 | ||||||||||||
Exercisable at end of year | 167,394 | $26 - $34 | $ | 28.30 | 457,421 | $26 - $36 | $ | 30.38 | 664,994 | $26 - $36 | $ | 29.83 | ||||||||||||
The weighted average remaining contractual life for options outstanding and exercisable at August 29, 2015 was 0.2 years. There was no aggregate intrinsic value for the options outstanding and exercisable at August 29, 2015. Other values related to options are as follows:
(In thousands) | Fiscal 2015 | Fiscal 2014 | Fiscal 2013 | ||||||||
Aggregate intrinsic value of options exercised (1) | $ | — | $ | 173 | $ | 1 | |||||
Net cash proceeds from the exercise of stock options | — | 2,080 | 75 | ||||||||
Actual income tax benefit realized from stock option exercises | — | 63 | — | ||||||||
(1) | The amount by which the closing price of our stock on the date of exercise exceeded the exercise price. |
Share Awards
A summary of share award activity for Fiscal 2015, 2014 and 2013 is as follows:
Year Ended | |||||||||||||||||
August 29, 2015 | August 30, 2014 | August 31, 2013 | |||||||||||||||
Shares | Weighted Average Grant Date Fair Value | Shares | Weighted Average Grant Date Fair Value | Shares | Weighted Average Grant Date Fair Value | ||||||||||||
Beginning of year | 198,523 | $ | 18.98 | 190,962 | $ | 12.46 | 70,956 | $ | 13.49 | ||||||||
Granted | 165,624 | 21.70 | 138,345 | 27.44 | 190,738 | 12.25 | |||||||||||
Vested | (198,693 | ) | 19.71 | (129,817 | ) | 18.82 | (70,732 | ) | 12.93 | ||||||||
Canceled | (2,034 | ) | 20.58 | (967 | ) | 18.44 | — | — | |||||||||
End of year | 163,420 | $ | 20.83 | 198,523 | $ | 18.98 | 190,962 | $ | 12.46 | ||||||||
The aggregate intrinsic value of awards outstanding at August 29, 2015 was $3.3 million.
As of August 29, 2015, there was $1.2 million of unrecognized compensation expense related to restricted stock awards that is expected to be recognized over a weighted average period of 1.6 years. The total fair value of awards vested during Fiscal 2015, 2014 and 2013 was $4.2 million, $3.6 million and $1.1 million, respectively.
On October 13, 2015 the Human Resources Committee of the Board of Directors approved the award of grants of 162,200 shares of our restricted common stock under the Plan valued at $3.2 million to our key management group (approximately 60 employees). The Board of Directors also granted 42,000 shares of our restricted common stock valued at $834,000 to the non-management members of the Board.
The value of the restricted stock is based on the closing price of our common stock on the date of grant, which was $19.85. The fair value of this award to employees is amortized on a straight-line basis over the requisite service period of three years. Estimated non-cash stock compensation expense based on this restricted stock grant will be approximately $1.5 million for Fiscal 2016.
47
Note 14: Net Revenues Classifications
Net revenue by product class:
Year Ended | |||||||||||||||||
(In thousands) | August 29, 2015 | August 30, 2014 | August 31, 2013 | ||||||||||||||
Motorhomes, parts and service | $ | 872,915 | 89.4 | % | $ | 853,488 | 90.3 | % | $ | 718,580 | 89.5 | % | |||||
Towables and parts | 71,684 | 7.3 | % | 58,123 | 6.1 | % | 54,683 | 6.8 | % | ||||||||
Other manufactured products | 31,906 | 3.3 | % | 33,552 | 3.6 | % | 29,902 | 3.7 | % | ||||||||
Total net revenues | $ | 976,505 | 100.0 | % | $ | 945,163 | 100.0 | % | $ | 803,165 | 100.0 | % | |||||
Net revenue by geographic area:
Year Ended | |||||||||||||||||
(In thousands) | August 29, 2015 | August 30, 2014 | August 31, 2013 | ||||||||||||||
United States | $ | 920,315 | 94.2 | % | $ | 873,910 | 92.5 | % | $ | 742,798 | 92.5 | % | |||||
International | 56,190 | 5.8 | % | 71,253 | 7.5 | % | 60,367 | 7.5 | % | ||||||||
Total net revenues | $ | 976,505 | 100.0 | % | $ | 945,163 | 100.0 | % | $ | 803,165 | 100.0 | % | |||||
Note 15: Earnings Per Share
The following table reflects the calculation of basic and diluted income per share for the past three fiscal years:
Year Ended | |||||||||||
(In thousands, except per share data) | August 29, 2015 | August 30, 2014 | August 31, 2013 | ||||||||
Income per share - basic | |||||||||||
Net income | $ | 41,210 | $ | 45,053 | $ | 31,953 | |||||
Weighted average shares outstanding | 26,941 | 27,430 | 28,075 | ||||||||
Net income per share - basic | $ | 1.53 | $ | 1.64 | $ | 1.14 | |||||
Income per share - assuming dilution | |||||||||||
Net income | $ | 41,210 | $ | 45,053 | $ | 31,953 | |||||
Weighted average shares outstanding | 26,941 | 27,430 | 28,075 | ||||||||
Dilutive impact of awards and options outstanding | 110 | 115 | 95 | ||||||||
Weighted average shares and potential dilutive shares outstanding | 27,051 | 27,545 | 28,170 | ||||||||
Net income per share - assuming dilution | $ | 1.52 | $ | 1.64 | $ | 1.13 | |||||
For the fiscal years ended August 29, 2015, August 30, 2014 and August 31, 2013, there were options outstanding to purchase 167,394 shares, 457,421 shares and 664,994 shares, respectively, of common stock at an average price of $28.30, $30.38 and $29.83, respectively, which were not included in the computation of diluted income per share because they are considered anti-dilutive under the treasury stock method.
48
Note 16: Interim Financial Information (Unaudited)
Fiscal 2015 | Quarter Ended | ||||||||||||||
(In thousands, except per share data) | November 29, 2014 | February 28, 2015 | May 30, 2015 | August 29, 2015 | |||||||||||
Net revenues | $ | 224,403 | $ | 234,543 | $ | 266,510 | $ | 251,049 | |||||||
Gross profit | 24,386 | 24,258 | 28,183 | 28,053 | |||||||||||
Operating income | 14,442 | 11,948 | 16,118 | 16,911 | |||||||||||
Net income | 9,895 | 8,096 | 11,502 | 11,717 | |||||||||||
Net income per share (basic) | 0.37 | 0.30 | 0.43 | 0.43 | |||||||||||
Net income per share (diluted) | 0.37 | 0.30 | 0.43 | 0.43 | |||||||||||
Fiscal 2014 | Quarter Ended | ||||||||||||||
(In thousands, except per share data) | November 30, 2013 | March 1, 2014 | May 31, 2014 | August 30, 2014 | |||||||||||
Net revenues | $ | 222,670 | $ | 228,811 | $ | 247,747 | $ | 245,935 | |||||||
Gross profit | 25,962 | 22,845 | 26,481 | 28,709 | |||||||||||
Operating income | 16,006 | 14,036 | 15,589 | 18,278 | |||||||||||
Net income | 11,146 | 9,593 | 11,385 | 12,929 | |||||||||||
Net income per share (basic) | 0.40 | 0.35 | 0.42 | 0.48 | |||||||||||
Net income per share (diluted) | 0.40 | 0.35 | 0.42 | 0.48 | |||||||||||
Note 17: Comprehensive Income
Changes in AOCI by component, net of tax, were:
Year Ended | |||||||||||||||||||
August 29, 2015 | August 30, 2014 | ||||||||||||||||||
(In thousands) | Defined Benefit Pension Items | Unrealized Gains and Losses on Available- for-Sale Securities | Total | Defined Benefit Pension Items | Unrealized Gains and Losses on Available- for-Sale Securities | Total | |||||||||||||
Balance at beginning of year | $ | (1,808 | ) | $ | — | $ | (1,808 | ) | $ | 1,000 | $ | (151 | ) | $ | 849 | ||||
OCI before reclassifications | 2,044 | — | 2,044 | 25 | 151 | 176 | |||||||||||||
Amounts reclassified from AOCI | (2,510 | ) | — | (2,510 | ) | (2,833 | ) | — | (2,833 | ) | |||||||||
Net current-period OCI | (466 | ) | — | (466 | ) | (2,808 | ) | 151 | (2,657 | ) | |||||||||
Balance at end of year | $ | (2,274 | ) | $ | — | $ | (2,274 | ) | $ | (1,808 | ) | $ | — | $ | (1,808 | ) | |||
Reclassifications out of AOCI in net periodic benefit costs, net of tax, were:
Year Ended | ||||||||||
(In thousands) | Location on Consolidated Statements of Income and Comprehensive Income | August 29, 2015 | August 30, 2014 | |||||||
Amortization of prior service credit | Cost of goods sold | $ | (3,428 | ) | $ | (3,582 | ) | |||
Amortization of net actuarial loss | Cost of goods sold | 918 | 749 | |||||||
Total reclassifications | $ | (2,510 | ) | $ | (2,833 | ) | ||||
Note 18: Subsequent Events
On September 28, 2015 we announced a postretirement health care plan amendment, which is further discussed in Note 9.
On October 13, 2015 we sold assets related to our commercial transit bus operation, which consisted primarily of inventory and tooling, to Metro Worldwide, LLC for approximately $700,000.
On October 13, 2015 the Human Resources Committee of our Board of Directors issued shares of restricted common stock, which is further discussed in Note 13.
49
On October 14, 2015 our Board of Directors declared a cash dividend of $0.10 per outstanding share of common stock. The dividend will be paid on November 25, 2015 to all shareholders of record at the close of business on November 11, 2015.
Item 9. Changes in and Disagreements with Accountants on Accounting and Financial Disclosure
None.
Item 9A. Controls and Procedures
Evaluation of Disclosure Controls and Procedures
We maintain "disclosure controls and procedures," as such term is defined under Securities Exchange Act of 1934, as amended ("Exchange Act") Rule 13a-15(e), that are designed to ensure that information required to be disclosed in our reports filed or submitted under the Exchange Act is recorded, processed, summarized and reported within the time periods specified in the SEC rules and forms, and that such information is accumulated and communicated to our management, including our Chief Executive Officer and Chief Financial Officer, as appropriate, to allow timely decisions regarding required disclosures. Management necessarily applied its judgment in assessing the costs and benefits of such controls and procedures and believes that such controls and procedures are effective at the reasonable assurance level.
We have carried out an evaluation, under the supervision and with the participation of our management, including our Chief Executive Officer and Chief Financial Officer, of the effectiveness of the design and operation of our disclosure controls and procedures, required by Exchange Act Rule 13a-15(b), as of the end of the period covered by this Annual Report (the "Evaluation Date"). Based on this evaluation, the Chief Executive Officer and Chief Financial Officer have concluded that our disclosure controls and procedures were effective as of the Evaluation Date.
Evaluation of Internal Control Over Financial Reporting
Management's report on internal control over financial reporting as of August 29, 2015 is included within Item 8 of this Annual Report on Form 10-K and is incorporated herein by reference. The report of Deloitte & Touche LLP on the effectiveness of internal control over financial reporting is included within Item 8 of this Annual Report on Form 10-K and is incorporated herein by reference.
Changes in Internal Control Over Financial Reporting
There were no changes in our internal control over financial reporting (as defined in Exchange Act Rule 13a-15(f)) that occurred during our last fiscal quarter that have materially affected, or are reasonably likely to materially affect, our internal control over financial reporting.
Item 9B. Other Information
None.
PART III
Item 10. Directors, Executive Officers and Corporate Governance
Reference is made to the table entitled "Executive Officers of the Registrant" in Part I of this report and to the information included under the captions "Board of Directors, Committees of the Board and Corporate Governance", "Section 16(a) Beneficial Ownership Reporting Compliance", "Election of Directors" and "Fiscal Year 2016 Shareholder Proposals" in our Proxy Statement for the Annual Meeting of Shareholders scheduled to be held December 15, 2015, which information is incorporated by reference herein.
We have adopted a written code of ethics, the "Code of Ethics for CEO and Senior Financial Officers" (the "Code") which is applicable to our Chief Executive Officer, Chief Financial Officer, and Treasurer (collectively, the "Senior Officers"). In accordance with the rules and regulations of the SEC, a copy of the Code has been filed as an exhibit to this Form 10-K and is posted on our website.
We intend to disclose any changes in or waivers from the Code applicable to any Senior Officer on our website at www.winnebagoind.com or by filing a Form 8-K.
Item 11. Executive Compensation
Reference is made to the information included under the captions "Director Compensation" and "Executive Compensation" in our Proxy Statement for the Annual Meeting of Shareholders scheduled to be held December 15, 2015, which information is incorporated by reference herein.
50
Item 12. Security Ownership of Certain Beneficial Owners and Management and Related Stockholder Matters
Reference is made to the table entitled "Equity Compensation Plan Information" in Part II of this report and to the share ownership information included under the caption "Voting Securities and Principal Holders Thereof" in our Proxy Statement for the Annual Meeting of Shareholders scheduled to be held December 15, 2015, which information is incorporated by reference herein.
Item 13. Certain Relationships and Related Transactions, and Director Independence
Reference is made to the information included under the caption "Board of Directors, Committees of the Board and Corporate Governance" in our Proxy Statement for the Annual Meeting of Shareholders scheduled to be held December 15, 2015, which information is incorporated by reference herein.
Item 14. Principal Accounting Fees and Services
Reference is made to the information included under the caption "Independent Registered Public Accountants Fees and Services" in our Proxy Statement for the Annual Meeting of Shareholders scheduled to be held December 15, 2015 which information is incorporated by reference herein.
PART IV
Item 15. Exhibits, Financial Statement Schedules
1. | Our consolidated financial statements are included in Item 8 and an index to financial statements appears on page 25 of this report. |
2. | Financial Statement Schedules: Winnebago Industries, Inc. and Subsidiaries |
All schedules are omitted because of the absence of the conditions under which they are required or because the information required is shown in the consolidated financial statements or the notes thereto.
3. | Exhibits: See Exhibit Index on pages 53-55. |
SIGNATURES
Pursuant to the requirements of Section 13 or 15(d) of the Securities Exchange Act of 1934, the Registrant has duly caused this report to be signed on its behalf by the undersigned, thereunto duly authorized.
WINNEBAGO INDUSTRIES, INC. | ||
By | /s/ Lawrence A. Erickson | |
Lawrence A. Erickson | ||
Interim Chief Executive Officer | ||
(Principal Executive Officer) | ||
Date: October 27, 2015
Pursuant to the requirements of the Securities Exchange Act of 1934, this report has been signed below on, October 27, 2015, by the following persons on behalf of the Registrant and in the capacities indicated.
51
Signature | Capacity | |
/s/ Lawrence A. Erickson | ||
Lawrence A. Erickson | Chief Executive Officer, Chairman of the Board (Principal Executive Officer) | |
/s/ Sarah N. Nielsen | ||
Sarah N. Nielsen | Vice President, Chief Financial Officer (Principal Financial and Accounting Officer) | |
/s/ Irvin E. Aal | ||
Irvin E. Aal | Director | |
/s/ Robert M. Chiusano | ||
Robert M. Chiusano | Director | |
/s/ Jerry N. Currie | ||
Jerry N. Currie | Director | |
/s/ William C. Fisher | ||
William C. Fisher | Director | |
/s/ Martha T. Rodamaker | ||
Martha T. Rodamaker | Director | |
/s/ Mark T. Schroepfer | ||
Mark T. Schroepfer | Director | |
52
Exhibit Index
3a. | Articles of Incorporation previously filed with the Registrant's Quarterly Report on Form 10-Q for the quarter ended May 27, 2000 (Commission File Number 001-06403) and incorporated by reference herein. |
3b. | Amended By-Laws of the Registrant previously filed with the Registrant's Current Report on Form 8-K dated March 24, 2010 (Commission File Number 001-06403) and incorporated by reference herein. |
10a. | Winnebago Industries, Inc. Deferred Compensation Plan previously filed with the Registrant's Quarterly Report on Form 10-Q for the quarter ended March 2, 1991 (Commission File Number 001-06403), and incorporated by reference herein and the Amendment dated June 29, 1995 previously filed with the Registrant's Annual Report on Form 10-K for the fiscal year ended August 26, 1995 (Commission File Number 001-06403) and incorporated by reference herein.* |
10b. | Winnebago Industries, Inc. Executive Share Option Plan previously filed with the Registrant's Annual Report on Form 10-K for the fiscal year ended August 29, 1998 (Commission File Number 001-06403) and incorporated by reference herein, and the Amendment dated July 1, 1999 previously filed with the Registrant's Quarterly Report on Form 10-Q for the quarter ended May 29, 1999 (Commission File Number 001-06403) and incorporated by reference herein and the Amendment dated January 1, 2001 previously filed with the Registrant's Quarterly Report on Form 10-Q for the quarter ended February 24, 2001 (Commission File Number 001-06403) and incorporated by reference herein.* |
10c. | Form of Winnebago Industries, Inc. Incentive Stock Option Agreement for grants of Incentive Stock Options under the 2004 Incentive Compensation Plan previously filed with the Registrant's Current Report on Form 8-K dated October 13, 2004 (Commission File Number 001-06403) and incorporated by reference herein.* |
10d. | Form of Winnebago Industries, Inc. Non-Qualified Stock Option Agreement for grants of Non-Qualified Stock Options under the 2004 Incentive Compensation Plan previously filed with the Registrant's Report on Form 8-K dated October 13, 2004 (Commission File Number 001-06403) and incorporated by reference herein.* |
10e. | Winnebago Industries, Inc. Restricted Stock Grant Award Agreement under the 2004 Incentive Compensation Plan previously filed with the Registrant's Current Report on Form 8-K dated October 11, 2006 (Commission File Number 001-06403) and incorporated by reference herein.* |
10f. | Winnebago Industries, Inc. Executive Deferred Compensation Plan previously filed with the Registrant's Quarterly Report on Form 10-Q for the quarter ended November 25, 2006 (Commission File Number 001-06403) and incorporated by reference herein.* |
10g. | Winnebago Industries, Inc. 2004 Incentive Compensation Plan previously filed as Appendix B with the Registrant's Proxy Statement for the Annual Meeting of Shareholders held on January 13, 2004 (Commission File Number 001-06403) and incorporated by reference herein and the Amendment dated October 11, 2006 previously filed with the Registrant's Quarterly Report on Form 10-Q for the quarter ended November 25, 2006 (Commission File Number 001-06403) and incorporated by reference herein and the Amendment dated March 23, 2011 previously filed with the Registrant's Quarterly Report on Form 10-Q for the quarter ended May 28, 2011 (Commission File Number 001-06403) and incorporated by reference herein.* |
10h. | Winnebago Industries, Inc. 2014 Omnibus Equity, Performance Award, and Incentive Compensation Plan previously filed as Appendix B with the Registrant's Proxy Statement for the Annual Meeting of Shareholders held on December 17, 2013 (Commission File Number 001-06403) and incorporated by reference herein and the Supplement dated December 6, 2013 previously filed (Commission File Number 001-06403) and incorporated by reference herein.* |
10i. | Winnebago Industries, Inc. Directors' Deferred Compensation Plan previously filed with the Registrant's Annual Report on Form 10-K for the fiscal year ended August 30, 1997 (Commission File Number 001-06403), and incorporated by reference herein and the Amendment dated October 15, 2003 previously filed with the Registrant's Quarterly Report on Form 10-Q for the quarter ended November 29, 2003 (Commission File Number 001-06403) and incorporated by reference herein and the Amendment dated October 11, 2006 previously filed with the Registrant's Quarterly Report on Form 10-Q for the quarter ended November 25, 2006 (Commission File Number 001-06403) and incorporated by reference herein.* |
10j. | Winnebago Industries, Inc. Profit Sharing and Deferred Savings Investment Plan previously filed with the Registrant's Annual Report on Form 10-K for the fiscal year ended August 31, 1985 (Commission File Number 001-06403), and incorporated by reference herein, the Amendment dated July 1, 1995 previously filed with the Registrant's Annual Report on Form 10-K for the fiscal year ended August 26, 1995 (Commission File Number 001-06403) and incorporated by reference herein and the Amendment dated March 21, 2007 (Commission File Number 001-06403) and incorporated by reference herein.* |
10k. | Winnebago Industries, Inc. Officers' Long-Term Incentive Plan, fiscal three-year period 2013, 2014 and 2015 previously filed with the Registrant's Current Report on Form 8-K dated June 20, 2012 (Commission File Number 001-06403) and incorporated by reference herein.* |
53
10l. | Winnebago Industries, Inc. Officers' Long-Term Incentive Plan, fiscal three-year period 2014, 2015 and 2016 previously filed with the Registrant's Current Report on Form 8-K dated June 19, 2013 (Commission File Number 001-06403) and incorporated by reference herein.* |
10m. | Winnebago Industries, Inc. Officers' Long-Term Incentive Plan, fiscal three-year period 2015, 2016 and 2017 previously filed with the Registrant's Current Report on Form 8-K dated June 18, 2014 (Commission File Number 001-06403) and incorporated by reference herein.* |
10n. | Winnebago Industries, Inc. Officers' Long-Term Incentive Plan, fiscal three-year period 2016, 2017 and 2018 previously filed with the Registrant's Current Report on Form 8-K dated June 16, 2015 (Commission File Number 001-06403) and incorporated by reference herein.* |
10o. | Amended and Restated Executive Change of Control Agreement dated December 17, 2008 between Winnebago Industries, Inc. and Sarah N. Nielsen previously filed with the Registrant's Annual Report on Form 10-K for the fiscal year ended August 29, 2009 (Commission File Number 001-06403) and incorporated by reference herein.* |
10p. | Executive Change of Control Agreement dated May 3, 2010 between Winnebago Industries, Inc. and Daryl W. Krieger previously filed with the Registrant's Quarterly Report on Form 10-Q for the quarter ended May 29, 2010 (Commission File Number 001-06403) and incorporated by reference herein.* |
10q. | Executive Change of Control Agreement dated August 1, 2011 between Winnebago Industries, Inc. and Donald L. Heidemann previously filed with the Registrant's Annual Report on Form 10-K for the fiscal year ended August 27, 2011 (Commission File Number 001-06403) and incorporated by reference herein.* |
10r. | Executive Change of Control dated June 20, 2012 between Winnebago Industries, Inc. and Steven S. Degnan previously filed with the Registrant's Annual Report on Form 10-K for the fiscal year ended August 25, 2012 (Commission File Number 001-06403) and incorporated by reference herein.* |
10s. | Executive Change of Control dated June 20, 2012 between Winnebago Industries, Inc. and Scott C. Folkers previously filed with the Registrant's Annual Report on Form 10-K for the fiscal year ended August 25, 2012 (Commission File Number 001-06403) and incorporated by reference herein.* |
10t. | Executive Change of Control between Winnebago Industries, Inc. and Steven R. Dummett previously filed with the Registrant's Current Report on Form 8-K dated January 12, 2015 (Commission File Number 001-06403) and incorporated by reference herein.* |
10u. | Executive Change of Control between Winnebago Industries, Inc. and Bret A. Woodson previously filed with the Registrant's Current Report on Form 8-K dated January 12, 2015 (Commission File Number 001-06403) and incorporated by reference herein.* |
10v. | Winnebago Industries, Inc. Supplemental Executive Retirement Plan previously filed with the Registrant's Annual Report on Form 10-K for the fiscal year ended August 29, 2009 (Commission File Number 001-06403) and incorporated by reference herein.* |
10w. | Retirement Agreement between Winnebago Industries, Inc. and Randy J. Potts, incorporated by reference to Exhibit 10.1 to Form 8-K dated August 7, 2015. |
10x. | Employment Agreement between Winnebago Industries, Inc. and Robert J. Olson, incorporated by reference to Exhibit 10.2 to Form 8-K dated August 7, 2015. |
10y. | Winnebago Industries, Inc. Officers' Incentive Compensation Plan for Fiscal 2014 previously filed with the Registrant's Current Report on Form 8-K dated June 19, 2013 (Commission File Number 001-06403) and incorporated by reference herein.* |
10z. | Winnebago Industries, Inc. Officers' Incentive Compensation Plan for Fiscal 2015 previously filed with the Registrant's Current Report on Form 8-K dated June 18, 2014 (Commission File Number 001-06403) and incorporated by reference herein.* |
10aa. | Winnebago Industries, Inc. Officers' Incentive Compensation Plan for Fiscal 2016 previously filed with the Registrant's Current Report on Form 8-K dated June 16, 2015 (Commission File Number 001-06403) and incorporated by reference herein.* |
10ab. | Winnebago Industries, Inc. Credit Agreement with GECC previously filed with the Registrant's Current Report on Form 8-K dated October 31, 2012 and amended on Form 8-K dated May 28, 2014 (Commission File Number 001-06403) and incorporated by reference herein. |
54
10ac. | Winnebago Industries, Inc. Registration Statement previously filed on Form S-3 on April 4, 2013 (Commission File Number 333-187720) and amended on Form S-3A on April 30, 2013 (Commission File Number 333-187720) and incorporated by reference herein. |
10ad. | Winnebago Industries, Inc. Registration Statement previously filed on Form S-8 on March 28, 2014 (Commission File Number 333-194854) and incorporated by reference herein. |
14.1 | Winnebago Industries, Inc. Code of Ethics for CEO and Senior Financial Officers previously filed with the Registrant's Annual Report on Form 10-K for the fiscal year ended August 30, 2003 (Commission File Number 001-06403) and incorporated by reference herein. |
21. | List of Subsidiaries. |
23. | Consent of Independent Registered Public Accounting Firm. |
31.1 | Certification by the Chief Executive Officer pursuant to Section 302 of the Sarbanes-Oxley Act of 2002 dated October 27, 2015. |
31.2 | Certification by the Chief Financial Officer pursuant to Section 302 of the Sarbanes-Oxley Act of 2002 dated October 27, 2015. |
32.1 | Certification by the Chief Executive Officer pursuant to Section 1350, as adopted pursuant to Section 906 of the Sarbanes-Oxley Act of 2002 dated October 27, 2015. |
32.2 | Certification by the Chief Financial Officer pursuant to Section 1350, as adopted pursuant to Section 906 of the Sarbanes-Oxley Act of 2002 dated October 27, 2015. |
101.INS** | XBRL Instance Document |
101.SCH** | XBRL Taxonomy Extension Schema Document |
101.CAL** | XBRL Taxonomy Extension Calculation Linkbase Document |
101.DEF** | XBRL Taxonomy Extension Definitions Linkbase Document |
101.LAB** | XBRL Taxonomy Extension Label Linkbase Document |
101.PRE** | XBRL Taxonomy Extension Presentation Linkbase Document |
*Management contract or compensation plan or arrangement.
**Attached as Exhibit 101 to this report are the following financial statements from our Annual Report on Form 10-K for the year ended August 29, 2015 formatted in XBRL: (i) the Consolidated Balance Sheets, (ii) the Consolidated Statements of Operations, (iii) the Consolidated Statements Stockholders' Equity, (iv) the Consolidated Statement of Cash Flows, and (v) related notes to these financial statements. Such exhibits are deemed furnished and not filed pursuant to Rule 406T of Regulation S-T.
55
.
BOARD OF DIRECTORS Lawrence A. Erickson (66) ** 1,2* Chairman of the Board Winnebago Industries, Inc. Former Senior Vice President and Chief Financial Officer Rockwell Collins, Inc. Irvin E. Aal (76) 2,3* Former General Manager Case Tyler Business Unit of CNH Global Robert M. Chiusano (64) 2,4* Former Executive Vice President and Chief Operating Officer - Commercial Systems Rockwell Collins, Inc. Jerry N. Currie (70) 1,3 Former President and Chief Executive Officer CURRIES Company William C. Fisher (61) 2 Former Vice President and Chief Information Officer Polaris Industries, Inc. Martha T. Rodamaker (53) 1,2,3 President and Chief Executive Officer First Citizens National Bank Mark T. Schroepfer (68) 1* Former President and Chief Executive Officer Lincoln Industrial Corp | SHAREHOLDER INFORMATION Publications A notice of Annual Meeting of Shareholders and Proxy Statement is furnished to shareholders upon request in advance of the annual meeting. Copies of our quarterly financial earnings releases, the annual report on Form 10-K (without exhibits), the quarterly reports on Form 10-Q (without exhibits) and current reports on Form 8-K (without exhibits) as filed by us with the Securities and Exchange Commission, may be obtained without charge from the corporate offices as follows: Sam Jefson, PR Specialist Winnebago Industries, Inc. 605 W. Crystal Lake Road P.O. Box 152 Forest City, Iowa 50436-0152 Telephone: (641) 585-3535 Fax: (641) 585-6966 E-Mail: ir@wgo.net | Independent Auditors Deloitte & Touche LLP Suite 2800 50 South Sixth Street Minneapolis, Minnesota 55402-1844 (612) 397-4000 NYSE Annual CEO Certification and Sarbanes-Oxley Section 302 Certifications We submitted the annual Chief Executive Officer Certification to the New York Stock Exchange (NYSE) as required under the corporate governance rules of the NYSE. We also filed as exhibits to our 2014 Annual Report on Form 10‑K, the Chief Executive Officer and Chief Financial Officer certifications required under Section 302 of the Sarbanes-Oxley Act of 2002. Winnebago Industries is an equal opportunity employer. | ||
Board Committee/Members 1. Audit 2. Human Resources 3. Nominating and Governance 4. Business Development Advisory * Committee Chairman ** Lead Independent Director | All news releases issued by us, reports filed by us with the Securities and Exchange Commission (including exhibits) and information on our Corporate Governance Policies and Procedures may also be viewed at the Winnebago Industries' website: http://wgo.net/investor.html. Information contained on Winnebago Industries' website is not incorporated into this Annual Report or other securities filings. |  | ||
OFFICERS Robert J. Olson (64) Interim Chief Executive Officer S. Scott Degnan (50) Vice President, Sales and Product Management Steven R. Dummett (60) Vice President, Product Development Scott C. Folkers (53) Vice President, General Counsel and Secretary Donald L. Heidemann (43) Treasurer/Director of Finance Daryl W. Krieger (52) Vice President, Manufacturing Sarah N. Nielsen (42) Vice President, Chief Financial Officer Bret A. Woodson (45) Vice President, Administration | Number of Shareholders of Record As of October 13, 2015, Winnebago Industries had 2,989 shareholders of record. Dividends Paid Quarterly cash dividends of $0.09 were paid in Fiscal 2015. There were no cash dividends paid in Fiscal 2014. Shareholder Account Assistance Transfer Agent to contact for address changes, account certificates and stock holdings: Wells Fargo Shareowner Services P.O. Box 64854 St. Paul, MN 55164-0854 or 1110 Centre Pointe Curve, Suite 101 Mendota Heights, MN 55120 Telephone: (800) 468-9716 or (651) 450-4064 Inquiries: www.shareowneronline.com Annual Meeting The Annual Meeting of Shareholders is scheduled to be held on Tuesday, December 15, 2015 at 4:00 p.m. (CST) in Winnebago Industries' South Office Complex Theater, 605 W. Crystal Lake Road, Forest City, Iowa. | The Letter to Shareholders contains forward-looking statements within the meaning of the Private Securities Litigation Reform Act of 1995. Investors are cautioned that forward-looking statements are inherently uncertain. A number of factors could cause actual results to differ materially from these statements. These factors are included under “Item 1A. Risk Factors” in Part 1 of the accompanying Annual Report on Form 10-K. Other risk factors that may emerge in the future as significant risks or uncertainties to Winnebago Industries will be disclosed in a future Quarterly Report on Form 10-Q or Current Report on Form 8-K. | ||