Attached files
| file | filename |
|---|---|
| 8-K - 8-K - TANGER FACTORY OUTLET CENTERS, INC | a8kpressreleaseseptember30.htm |
| EX-99.3 - EXHIBIT 99.3 - TANGER FACTORY OUTLET CENTERS, INC | ex993pressreleasedavidbhen.htm |
| EX-99.1 - EXHIBIT 99.1 - TANGER FACTORY OUTLET CENTERS, INC | skt8kex991september302015.htm |
Exhibit 99.2

Tanger Factory Outlet Centers, Inc.
Supplemental Operating and Financial Data
September 30, 2015
1
Supplemental Operating and Financial Data for the
Quarter Ended 9/30/2015

Notice
For a more detailed discussion of the factors that affect our operating results, interested parties should review the Tanger Factory Outlet Centers, Inc. Annual Report on Form 10-K for the fiscal year ended December 31, 2014.
This Supplemental Operating and Financial Data is not an offer to sell or a solicitation to buy any securities of the Company. Any offers to sell or solicitations to buy any securities of the Company shall be made only by means of a prospectus.
2
Supplemental Operating and Financial Data for the
Quarter Ended 9/30/2015
Table of Contents
Section | |
Portfolio Data: | |
Geographic Diversification | |
Property Summary - Occupancy at End of Each Period Shown | |
Portfolio Occupancy at the End of Each Period | |
Average Tenant Sales Per Square Foot by Outlet Center Ranking | |
Major Tenants | |
Lease Expirations as of September 30, 2015 | |
Leasing Activity | |
Financial Data: | |
Consolidated Balance Sheets | |
Consolidated Statements of Operations | |
FFO and FAD Analysis | |
Unconsolidated Joint Venture Information | |
Pro Rata Balance Sheet | |
Pro Rata Statement of Operations | |
Development Summary | |
Debt Outstanding Summary | |
Future Scheduled Principal Payments | |
Senior Unsecured Notes Financial Covenants | |
Investor Information | |
3
Supplemental Operating and Financial Data for the
Quarter Ended 9/30/2015
Geographic Diversification
Consolidated Properties
As of September 30, 2015 | ||||||||
State | # of Centers | GLA | % of GLA | |||||
South Carolina | 5 | 1,593,898 | 14 | % | ||||
New York | 2 | 1,478,808 | 13 | % | ||||
Pennsylvania | 3 | 874,460 | 8 | % | ||||
Georgia | 2 | 692,478 | 6 | % | ||||
Michigan | 2 | 670,560 | 6 | % | ||||
Texas | 2 | 619,621 | 5 | % | ||||
Connecticut | 2 | 601,538 | 5 | % | ||||
Delaware | 1 | 565,707 | 5 | % | ||||
Alabama | 1 | 557,014 | 5 | % | ||||
North Carolina | 3 | 505,123 | 4 | % | ||||
New Jersey | 1 | 489,706 | 4 | % | ||||
Tennessee | 1 | 448,335 | 4 | % | ||||
Ohio | 1 | 411,776 | 3 | % | ||||
Missouri | 1 | 329,861 | 3 | % | ||||
Utah | 1 | 319,661 | 3 | % | ||||
Louisiana | 1 | 318,666 | 3 | % | ||||
Iowa | 1 | 276,331 | 2 | % | ||||
New Hampshire | 1 | 245,698 | 2 | % | ||||
Florida | 1 | 198,877 | 2 | % | ||||
Maryland | 1 | 198,840 | 2 | % | ||||
California | 1 | 171,300 | 1 | % | ||||
Total | 34 | 11,568,258 | 100 | % | ||||
Unconsolidated Joint Venture Properties
# of Centers | GLA | Ownership % | ||||||
Glendale, AZ | 1 | 413,527 | 58.00 | % | ||||
Charlotte, NC | 1 | 397,837 | 50.00 | % | ||||
Savannah, GA | 1 | 377,286 | 50.00 | % | ||||
Texas City, TX | 1 | 352,705 | 50.00 | % | ||||
National Harbor, MD | 1 | 338,786 | 50.00 | % | ||||
Cookstown, ON | 1 | 308,803 | 50.00 | % | ||||
Ottawa, ON (1) | 1 | 284,218 | 50.00 | % | ||||
Bromont, QC | 1 | 161,449 | 50.00 | % | ||||
Saint-Sauveur, QC | 1 | 115,717 | 50.00 | % | ||||
Total | 9 | 2,750,328 | ||||||
(1) | Excludes square feet to be completed and turned over to a magnet tenant at a later date. |
4
Supplemental Operating and Financial Data for the
Quarter Ended 9/30/2015
Property Summary - Occupancy at End of Each Period Shown
Consolidated properties | |||||||||||||||||
Location | Total GLA 9/30/15 | % Occupied 9/30/15 | % Occupied 6/30/15 | % Occupied 3/31/15 | % Occupied 12/31/14 | % Occupied 9/30/14 | |||||||||||
Deer Park, NY | 749,074 | 95 | % | 94 | % | 94 | % | 95 | % | 95 | % | ||||||
Riverhead, NY | 729,734 | 98 | % | 97 | % | 97 | % | 99 | % | 98 | % | ||||||
Rehoboth Beach, DE | 565,707 | 100 | % | 99 | % | 98 | % | 98 | % | 98 | % | ||||||
Foley, AL | 557,014 | 93 | % | 96 | % | 96 | % | 96 | % | 96 | % | ||||||
Atlantic City, NJ | 489,706 | 94 | % | 95 | % | 94 | % | 94 | % | 90 | % | ||||||
Sevierville, TN | 448,335 | 100 | % | 100 | % | 99 | % | 100 | % | 100 | % | ||||||
San Marcos, TX | 441,821 | 98 | % | 95 | % | 97 | % | 99 | % | 99 | % | ||||||
Myrtle Beach Hwy 501, SC | 425,247 | 97 | % | 98 | % | 96 | % | 96 | % | 98 | % | ||||||
Jeffersonville, OH | 411,776 | 99 | % | 97 | % | 98 | % | 98 | % | 97 | % | ||||||
Myrtle Beach Hwy 17, SC | 402,791 | 99 | % | 100 | % | 100 | % | 100 | % | 100 | % | ||||||
Charleston, SC | 382,117 | 99 | % | 99 | % | 99 | % | 99 | % | 99 | % | ||||||
Pittsburgh, PA | 372,958 | 100 | % | 99 | % | 99 | % | 100 | % | 100 | % | ||||||
Commerce II, GA | 371,408 | 97 | % | 96 | % | 92 | % | 99 | % | 99 | % | ||||||
Grand Rapids, MI | 350,671 | 93 | % | N/A | N/A | N/A | N/A | ||||||||||
Branson, MO | 329,861 | 100 | % | 99 | % | 98 | % | 100 | % | 100 | % | ||||||
Locust Grove, GA | 321,070 | 100 | % | 99 | % | 100 | % | 100 | % | 100 | % | ||||||
Howell, MI | 319,889 | 94 | % | 93 | % | 93 | % | 98 | % | 98 | % | ||||||
Park City, UT | 319,661 | 99 | % | 99 | % | 99 | % | 99 | % | 100 | % | ||||||
Mebane, NC | 318,910 | 95 | % | 100 | % | 97 | % | 100 | % | 99 | % | ||||||
Gonzales, LA | 318,666 | 100 | % | 100 | % | 100 | % | 100 | % | 100 | % | ||||||
Foxwoods, CT | 311,640 | 94 | % | 91 | % | N/A | N/A | N/A | |||||||||
Westbrook, CT | 289,898 | 93 | % | 95 | % | 95 | % | 96 | % | 95 | % | ||||||
Williamsburg, IA | 276,331 | 99 | % | 97 | % | 99 | % | 100 | % | 100 | % | ||||||
Lancaster, PA | 254,002 | 99 | % | 99 | % | 99 | % | 100 | % | 100 | % | ||||||
Hershey, PA | 247,500 | 98 | % | 95 | % | 100 | % | 100 | % | 100 | % | ||||||
Tilton, NH | 245,698 | 98 | % | 96 | % | 96 | % | 99 | % | 98 | % | ||||||
Hilton Head II, SC | 206,544 | 95 | % | 95 | % | 95 | % | 100 | % | 100 | % | ||||||
Fort Myers, FL | 198,877 | 90 | % | 91 | % | 93 | % | 91 | % | 90 | % | ||||||
Ocean City, MD | 198,840 | 99 | % | 99 | % | 97 | % | 98 | % | 99 | % | ||||||
Terrell, TX | 177,800 | 97 | % | 95 | % | 96 | % | 99 | % | 100 | % | ||||||
Hilton Head I, SC | 177,199 | 97 | % | 100 | % | 100 | % | 100 | % | 99 | % | ||||||
Barstow, CA | 171,300 | 100 | % | 100 | % | 100 | % | 100 | % | 100 | % | ||||||
Blowing Rock, NC | 104,052 | 100 | % | 97 | % | 97 | % | 100 | % | 97 | % | ||||||
Nags Head, NC | 82,161 | 100 | % | 100 | % | 94 | % | 100 | % | 100 | % | ||||||
Kittery I, ME(3) | N/A | N/A | 100 | % | 100 | % | 100 | % | 93 | % | |||||||
Kittery II, ME(3) | N/A | N/A | 92 | % | 100 | % | 100 | % | 100 | % | |||||||
Lincoln City, OR (2) | N/A | N/A | N/A | N/A | N/A | 98 | % | ||||||||||
Tuscola, IL(3) | N/A | N/A | 88 | % | 85 | % | 87 | % | 87 | % | |||||||
West Branch, MI(3) | N/A | N/A | 88 | % | 88 | % | 94 | % | 94 | % | |||||||
Total | 11,568,258 | 97 | % | (1),(4) | 97 | % | (1) | 97 | % | 98 | % | 98 | % | ||||
(1) | Excludes the occupancy rate at our Foxwoods, CT center and Grand Rapids, MI center which opened during the second and third quarters of 2015, respectively, and have not yet stabilized. |
(2) | Sold center in December 2014. |
(3) | Sold centers in September 2015. |
(4) | Excludes the occupancy rate at our Barstow, CA outlet center which was sold on October 5, 2015. |
5
Supplemental Operating and Financial Data for the
Quarter Ended 9/30/2015
Unconsolidated joint venture properties | |||||||||||||||||
Location | Total GLA 9/30/15 | % Occupied 9/30/15 | % Occupied 6/30/15 | % Occupied 3/31/15 | % Occupied 12/31/14 | % Occupied 9/30/14 | |||||||||||
Glendale, AZ | 413,527 | 100 | % | 99 | % | 99 | % | 97 | % | 100 | % | ||||||
Charlotte, NC (1) | 397,837 | 99 | % | 99 | % | 98 | % | 99 | % | 99 | % | ||||||
Savannah, GA (2) | 377,286 | 99 | % | 96 | % | N/A | N/A | N/A | |||||||||
Texas City, TX | 352,705 | 99 | % | 100 | % | 98 | % | 100 | % | 100 | % | ||||||
National Harbor, MD | 338,786 | 99 | % | 99 | % | 97 | % | 100 | % | 100 | % | ||||||
Cookstown, ON | 308,803 | 100 | % | 93 | % | 96 | % | 96 | % | 95 | % | ||||||
Ottawa, ON (3) (4) | 284,218 | 97 | % | 95 | % | 92 | % | 95 | % | N/A | |||||||
Bromont, QC | 161,449 | 74 | % | 74 | % | 73 | % | 81 | % | 81 | % | ||||||
Saint-Sauveur, QC | 115,717 | 97 | % | 97 | % | 92 | % | 100 | % | 100 | % | ||||||
Wisconsin Dells, WI (5) | N/A | N/A | N/A | N/A | 100 | % | 100 | % | |||||||||
Total | 2,750,328 | 97 | % | 96 | % | 95 | % | 97 | % | 98 | % | ||||||
(1) | Center opened in July 2014. |
(2) | Center opened in April 2015. |
(3) | Excludes square feet to be completed and turned over to a magnet tenant at a later date. |
(4) | Center opened in October 2014. |
(5) | Sold our equity interest in center in February 2015. |
6
Supplemental Operating and Financial Data for the
Quarter Ended 9/30/2015
Portfolio Occupancy at the End of Each Period (1)
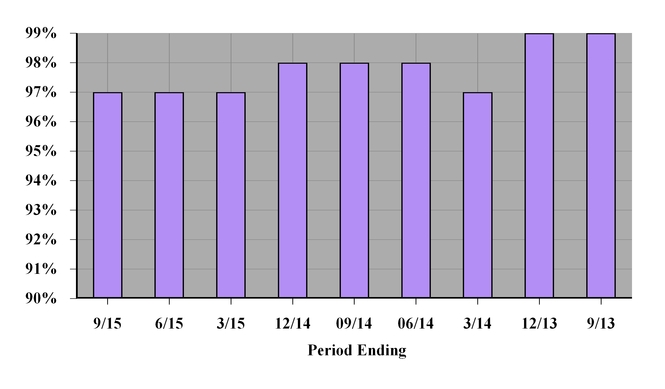
(1) Excludes unconsolidated outlet centers. See table on page 4.
7
Supplemental Operating and Financial Data for the
Quarter Ended 9/30/2015
Average Tenant Sales Per Square Foot by Outlet Center Ranking As of September 30, 2015(1)
12 Months | Period End | Sq Ft | % of | % of Portfolio | ||||||||
Ranking (2) | SPSF | Occupancy % | (in thousands) | Square Feet | NOI (3) | |||||||
Consolidated Centers | ||||||||||||
Centers 1 - 5 | $ | 525 | 97 | % | 2,328 | 22 | % | 26 | % | |||
Centers 6 - 10 | $ | 451 | 99 | % | 1,730 | 16 | % | 20 | % | |||
Centers 11 - 15 | $ | 399 | 98 | % | 1,953 | 18 | % | 19 | % | |||
Centers 16 - 20 | $ | 352 | 98 | % | 1,672 | 16 | % | 15 | % | |||
Centers 21 - 25 | $ | 310 | 96 | % | 1,664 | 15 | % | 12 | % | |||
Centers 26 - 31 | $ | 277 | 96 | % | 1,387 | 13 | % | 8 | % | |||
Cumulative | Cumulative | Cumulative | Cumulative | Cumulative | ||||||||
12 Months | Period End | Sq Ft | % of | % of Portfolio | ||||||||
Ranking (2) | SPSF | Occupancy % | (in thousands) | Square Feet | NOI (3) | |||||||
Consolidated Centers | ||||||||||||
Centers 1 - 5 | $ | 525 | 97 | % | 2,328 | 22 | % | 26 | % | |||
Centers 1 - 10 | $ | 489 | 98 | % | 4,058 | 38 | % | 46 | % | |||
Centers 1 - 15 | $ | 457 | 98 | % | 6,011 | 56 | % | 65 | % | |||
Centers 1 - 20 | $ | 433 | 98 | % | 7,683 | 72 | % | 80 | % | |||
Centers 1 - 25 | $ | 411 | 98 | % | 9,347 | 87 | % | 92 | % | |||
Centers 1 - 31 | $ | 394 | 97 | % | 10,734 | 100 | % | 100 | % | |||
Unconsolidated centers (4) | $ | 403 | 99 | % | 1,503 | n/a | n/a | |||||
(1) | Sales are based on reports by retailers leasing outlet center stores for the trailing 12 months for tenants which have occupied such stores for a minimum of 12 months. Sales per square foot are based on all tenants less then 20,000 square feet in size. Centers are ranked by sales per square foot as of September 30, 2015. | |||||||||||
(2) | Outlet centers included in each ranking group (in alphabetical order) are as follows : | |||||||||||
Centers 1 - 5: Deer Park, NY; Mebane, NC; Nags Head, NC; Riverhead, NY; Sevierville, TN | ||||||||||||
Centers 6 - 10: Branson, MO; Hilton Head I, SC; Lancaster, PA; Myrtle Beach 17, SC; Rehoboth Beach, DE | ||||||||||||
Centers 11 - 15: Atlantic City, NJ; Charleston, SC; Gonzales, LA; Locust Grove, GA; San Marcos, TX | ||||||||||||
Centers 16 - 20: Hershey, PA; Howell, MI; Jeffersonville, OH; Park City, UT; Pittsburgh, PA | ||||||||||||
Centers 21 - 25: Blowing Rock, NC; Commerce II, GA; Foley, AL; Hilton Head II, SC; Myrtle Beach 501, SC | ||||||||||||
Centers 26 - 31: Ocean City, MD; Fort Myers, FL; Terrell, TX; Tilton, NH; Westbrook, CT; Williamsburg, IA | ||||||||||||
Excludes outlet centers not open for 12 full calendar months and the Barstow, CA center sold in October 2015. | ||||||||||||
(3) | % of Portfolio NOI is based on the company’s forecast of 2015 property level net operating income which is defined as total operating revenues less property operating expenses and excludes termination fees and non-cash adjustments including straight-line rent, net above and below market rent amortization and gains or losses on sale of outparcels. The Company’s forecast is based on management’s estimates as of September 30, 2015 and may be considered a forward-looking statement which is subject to risks and uncertainties. Actual results could differ materially from those projected due to various factors including, but not limited to, the risks associated with general economic and real estate conditions. For a more detailed discussion of the factors that affect our operating results, interested parties should review the Tanger Factory Outlet Centers, Inc. Annual Report on Form 10-K for the fiscal year ended December 31, 2014. | |||||||||||
(4) | Includes domestic outlet centers open 12 full calendar months (Charlotte, NC; Glendale, AZ; National Harbor, MD; Texas City, TX). | |||||||||||
8
Supplemental Operating and Financial Data for the
Quarter Ended 9/30/2015
Major Tenants (1)
Ten Largest Tenants as of September 30, 2015 | ||||||||
Tenant | # of Stores | GLA | % of Total GLA | |||||
The Gap, Inc. | 88 | 933,215 | 8.1 | % | ||||
Ascena Retail Group, Inc. | 139 | 855,533 | 7.4 | % | ||||
PVH Corp. | 78 | 432,881 | 3.7 | % | ||||
Nike, Inc. | 37 | 405,234 | 3.5 | % | ||||
V. F. Corporation | 43 | 370,855 | 3.2 | % | ||||
Ralph Lauren Corporation | 38 | 354,946 | 3.1 | % | ||||
G-III Apparel Group, Ltd. | 70 | 334,133 | 2.9 | % | ||||
Adidas AG | 41 | 285,462 | 2.5 | % | ||||
Carter's, Inc. | 62 | 282,811 | 2.4 | % | ||||
Hanes Brands | 43 | 228,758 | 2.0 | % | ||||
Total of All Listed Above | 639 | 4,483,828 | 38.8 | % | ||||
(1) | Excludes unconsolidated outlet centers. See table on page 4. |
9
Supplemental Operating and Financial Data for the
Quarter Ended 9/30/2015
Lease Expirations as of September 30, 2015
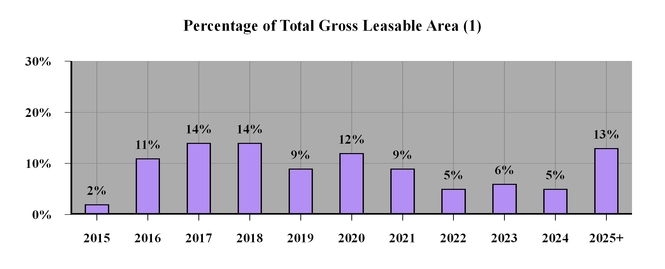

(1) Excludes unconsolidated outlet centers. See table on page 4.
10
Supplemental Operating and Financial Data for the
Quarter Ended 9/30/2015
Leasing Activity (1) (2)
3/31/2015 | 6/30/2015 | 9/30/2015 | 12/31/2015 | Year to Date | Prior Year to Date(3) | ||||||||||||||||
Re-tenanted Space : | |||||||||||||||||||||
Number of leases | 69 | 26 | 20 | 115 | 131 | ||||||||||||||||
Gross leasable area | 262,689 | 93,579 | 74,004 | 430,272 | 459,735 | ||||||||||||||||
New initial base rent per square foot | $ | 27.71 | $ | 29.98 | $ | 27.74 | $ | 28.21 | $ | 30.13 | |||||||||||
Prior expiring base rent per square foot | $ | 24.90 | $ | 24.05 | $ | 24.07 | $ | 24.57 | $ | 24.31 | |||||||||||
Percent increase | 11.3 | % | 24.7 | % | 15.3 | % | 14.8 | % | 23.9 | % | |||||||||||
New straight line base rent per square foot | $ | 31.15 | $ | 33.85 | $ | 30.60 | $ | 31.64 | $ | 32.84 | |||||||||||
Prior straight line base rent per square foot | $ | 24.67 | $ | 23.46 | $ | 23.08 | $ | 24.13 | $ | 24.15 | |||||||||||
Percent increase | 26.3 | % | 44.3 | % | 32.6 | % | 31.1 | % | 36.0 | % | |||||||||||
Renewed Space: | |||||||||||||||||||||
Number of leases | 172 | 43 | 27 | 242 | 233 | ||||||||||||||||
Gross leasable area | 833,106 | 184,777 | 113,394 | 1,131,277 | 1,097,175 | ||||||||||||||||
New initial base rent per square foot | $ | 24.94 | $ | 26.40 | $ | 24.29 | $ | 25.11 | $ | 22.22 | |||||||||||
Prior expiring base rent per square foot | $ | 22.38 | $ | 22.67 | $ | 22.09 | $ | 22.40 | $ | 20.03 | |||||||||||
Percent increase | 11.5 | % | 16.4 | % | 9.9 | % | 12.1 | % | 10.9 | % | |||||||||||
New straight line base rent per square foot | $ | 26.53 | $ | 27.58 | $ | 24.93 | $ | 26.54 | $ | 23.18 | |||||||||||
Prior straight line base rent per square foot | $ | 21.74 | $ | 22.03 | $ | 21.79 | $ | 21.79 | $ | 19.61 | |||||||||||
Percent increase | 22.0 | % | 25.3 | % | 14.4 | % | 21.8 | % | 18.2 | % | |||||||||||
Total Re-tenanted and Renewed Space (3): | |||||||||||||||||||||
Number of leases | 241 | 69 | 47 | 357 | 364 | ||||||||||||||||
Gross leasable area | 1,095,795 | 278,356 | 187,398 | 1,561,549 | 1,556,910 | ||||||||||||||||
New initial base rent per square foot | $ | 25.60 | $ | 27.60 | $ | 25.65 | $ | 25.96 | $ | 24.56 | |||||||||||
Prior expiring base rent per square foot | $ | 22.98 | $ | 23.13 | $ | 22.87 | $ | 23.00 | $ | 21.29 | |||||||||||
Percent increase | 11.4 | % | 19.3 | % | 12.2 | % | 12.9 | % | 15.4 | % | |||||||||||
New straight line base rent per square foot | $ | 27.64 | $ | 29.69 | $ | 27.17 | $ | 27.95 | $ | 26.03 | |||||||||||
Prior straight line base rent per square foot | $ | 22.44 | $ | 22.51 | $ | 22.30 | $ | 22.43 | $ | 20.95 | |||||||||||
Percent increase | 23.1 | % | 31.9 | % | 21.8 | % | 24.6 | % | 24.2 | % | |||||||||||
(1) | Excludes unconsolidated outlet centers. See table on page 4. |
(2) | All 2015 information excludes the outlet centers in Kittery I & II, ME; Tuscola, IL; and West Branch, MI, which were sold on September 30, 2015, and Barstow, CA, which was sold on October 5, 2015. |
(3) | Excludes outlet center in Lincoln City, Oregon, which was sold in December 2014. |
11
Supplemental Operating and Financial Data for the
Quarter Ended 9/30/2015
Consolidated Balance Sheets (dollars in thousands)
9/30/2015 | 6/30/2015 | 3/31/2015 | 12/31/2014 | 9/30/2014 | |||||||||||||||
ASSETS | |||||||||||||||||||
Rental property | |||||||||||||||||||
Land | $ | 225,306 | $ | 217,994 | $ | 217,994 | $ | 217,994 | $ | 230,415 | |||||||||
Buildings, improvements and fixtures | 2,173,499 | 2,078,946 | 1,950,092 | 1,947,083 | 2,043,583 | ||||||||||||||
Construction in progress | 63,445 | 95,167 | 154,328 | 98,526 | 75,000 | ||||||||||||||
2,462,250 | 2,392,107 | 2,322,414 | 2,263,603 | 2,348,998 | |||||||||||||||
Accumulated depreciation | (727,921 | ) | (699,836 | ) | (680,739 | ) | (662,236 | ) | (708,515 | ) | |||||||||
Total rental property, net | 1,734,329 | 1,692,271 | 1,641,675 | 1,601,367 | 1,640,483 | ||||||||||||||
Cash and cash equivalents | 20,661 | 16,949 | 14,661 | 16,875 | 10,824 | ||||||||||||||
Restricted cash | 42,904 | — | — | — | — | ||||||||||||||
Rental property held for sale | 19,286 | 46,862 | 46,530 | 46,005 | — | ||||||||||||||
Investments in unconsolidated joint ventures | 197,964 | 212,939 | 205,083 | 208,050 | 249,659 | ||||||||||||||
Deferred lease costs and other intangibles, net | 130,390 | 133,909 | 137,478 | 140,883 | 146,642 | ||||||||||||||
Deferred debt origination costs, net | 10,688 | 11,417 | 11,606 | 12,126 | 9,794 | ||||||||||||||
Prepaids and other assets | 74,577 | 74,393 | 71,924 | 72,354 | 82,715 | ||||||||||||||
Total assets | $ | 2,230,799 | $ | 2,188,740 | $ | 2,128,957 | $ | 2,097,660 | $ | 2,140,117 | |||||||||
LIABILITIES AND EQUITY | |||||||||||||||||||
Liabilities | |||||||||||||||||||
Debt | |||||||||||||||||||
Senior, unsecured notes, net of discounts | $ | 794,080 | $ | 793,910 | $ | 793,741 | $ | 793,574 | $ | 794,729 | |||||||||
Unsecured term loans, net of discounts | 267,378 | 267,338 | 267,298 | 267,259 | 267,219 | ||||||||||||||
Mortgages payable, including premiums | 281,966 | 276,942 | 285,068 | 271,361 | 247,240 | ||||||||||||||
Unsecured lines of credit | 195,800 | 176,300 | 115,700 | 111,000 | 139,800 | ||||||||||||||
Total debt | 1,539,224 | 1,514,490 | 1,461,807 | 1,443,194 | 1,448,988 | ||||||||||||||
Accounts payable and accruals | 90,506 | 83,787 | 80,835 | 69,558 | 79,227 | ||||||||||||||
Deferred financing obligation | 28,388 | 28,388 | 28,388 | 28,388 | 28,388 | ||||||||||||||
Other liabilities | 31,405 | 30,639 | 31,076 | 32,634 | 29,300 | ||||||||||||||
Total liabilities | 1,689,523 | 1,657,304 | 1,602,106 | 1,573,774 | 1,585,903 | ||||||||||||||
Commitments and contingencies | — | — | — | — | — | ||||||||||||||
Equity | |||||||||||||||||||
Tanger Factory Outlet Centers, Inc. | |||||||||||||||||||
Common shares | 958 | 958 | 958 | 955 | 959 | ||||||||||||||
Paid in capital | 802,638 | 798,587 | 794,652 | 791,566 | 801,363 | ||||||||||||||
Accumulated distributions in excess of net income | (256,180 | ) | (272,948 | ) | (270,124 | ) | (281,679 | ) | (276,218 | ) | |||||||||
Accumulated other comprehensive loss | (33,943 | ) | (22,470 | ) | (25,755 | ) | (14,023 | ) | (7,382 | ) | |||||||||
Equity attributable to Tanger Factory Outlet Centers, Inc. | 513,473 | 504,127 | 499,731 | 496,819 | 518,722 | ||||||||||||||
Equity attributable to noncontrolling interests | |||||||||||||||||||
Noncontrolling interests in Operating Partnership | 27,207 | 26,712 | 26,481 | 26,417 | 27,595 | ||||||||||||||
Noncontrolling interest in other consolidated partnerships | 596 | 597 | 639 | 650 | 7,897 | ||||||||||||||
Total equity | 541,276 | 531,436 | 526,851 | 523,886 | 554,214 | ||||||||||||||
Total liabilities and equity | $ | 2,230,799 | $ | 2,188,740 | $ | 2,128,957 | $ | 2,097,660 | $ | 2,140,117 | |||||||||
12
Supplemental Operating and Financial Data for the
Quarter Ended 9/30/2015
Consolidated Statements of Operations (dollars and shares in thousands)
Three Months Ended | YTD | |||||||||||||||||||||||||||
9/30/15 | 6/30/15 | 3/31/15 | 12/31/14 | 9/30/14 | 9/30/15 | 9/30/14 | ||||||||||||||||||||||
REVENUES | ||||||||||||||||||||||||||||
Base rentals | $ | 75,841 | $ | 72,329 | $ | 67,629 | $ | 69,732 | $ | 69,612 | $ | 215,799 | $ | 204,748 | ||||||||||||||
Percentage rentals | 2,625 | 2,042 | 2,229 | 3,675 | 2,634 | 6,896 | 6,632 | |||||||||||||||||||||
Expense reimbursements | 30,542 | 29,909 | 33,364 | 32,075 | 29,463 | 93,815 | 90,457 | |||||||||||||||||||||
Management, leasing and other services | 1,253 | 1,727 | 1,283 | 1,043 | 1,225 | 4,263 | 2,548 | |||||||||||||||||||||
Other income | 2,645 | 1,729 | 1,421 | 1,849 | 2,255 | 5,795 | 5,799 | |||||||||||||||||||||
Total revenues | 112,906 | 107,736 | 105,926 | 108,374 | 105,189 | 326,568 | 310,184 | |||||||||||||||||||||
EXPENSES | ||||||||||||||||||||||||||||
Property operating | 36,231 | 34,958 | 37,732 | 34,968 | 32,798 | 108,921 | 102,454 | |||||||||||||||||||||
General and administrative | 11,514 | 11,612 | 11,305 | 11,652 | 11,334 | 34,431 | 32,817 | |||||||||||||||||||||
Acquisition costs | — | — | — | — | — | — | 7 | |||||||||||||||||||||
Abandoned pre-development costs | — | — | — | 769 | — | — | 1,596 | |||||||||||||||||||||
Depreciation and amortization | 28,785 | 24,272 | 23,989 | 25,398 | 25,774 | 77,046 | 77,034 | |||||||||||||||||||||
Total expenses | 76,530 | 70,842 | 73,026 | 72,787 | 69,906 | 220,398 | 213,908 | |||||||||||||||||||||
Operating income | 36,376 | 36,894 | 32,900 | 35,587 | 35,283 | 106,170 | 96,276 | |||||||||||||||||||||
OTHER INCOME/(EXPENSE) | ||||||||||||||||||||||||||||
Interest expense | (13,933 | ) | (13,088 | ) | (13,089 | ) | (14,527 | ) | (13,902 | ) | (40,110 | ) | (43,404 | ) | ||||||||||||||
Loss on early extinguishment of debt | — | — | — | (13,140 | ) | — | — | — | ||||||||||||||||||||
Gain on sale of assets and interests in unconsolidated entities | 20,215 | — | 13,726 | 7,513 | — | 33,941 | — | |||||||||||||||||||||
Other nonoperating income (expense) | 89 | (493 | ) | 306 | 234 | 437 | (98 | ) | 560 | |||||||||||||||||||
Income before equity in earnings of unconsolidated joint ventures | 42,747 | 23,313 | 33,843 | 15,667 | 21,818 | 99,903 | 53,432 | |||||||||||||||||||||
Equity in earnings of unconsolidated joint ventures | 3,713 | 2,046 | 2,543 | 2,853 | 2,479 | 8,302 | 6,200 | |||||||||||||||||||||
Net income | 46,460 | 25,359 | 36,386 | 18,520 | 24,297 | 108,205 | 59,632 | |||||||||||||||||||||
Noncontrolling interests in Operating Partnership | (2,364 | ) | (1,313 | ) | (1,855 | ) | (954 | ) | (1,252 | ) | (5,532 | ) | (3,083 | ) | ||||||||||||||
Noncontrolling interests in other consolidated partnerships | (21 | ) | 435 | (19 | ) | (24 | ) | (42 | ) | 395 | (80 | ) | ||||||||||||||||
Net income attributable to Tanger Factory Outlet Centers, Inc. | 44,075 | 24,481 | 34,512 | 17,542 | 23,003 | 103,068 | 56,469 | |||||||||||||||||||||
Allocation to participating securities | (494 | ) | (308 | ) | (408 | ) | (481 | ) | (481 | ) | (1,210 | ) | (1,391 | ) | ||||||||||||||
Net income available to common shareholders | $ | 43,581 | $ | 24,173 | $ | 34,104 | $ | 17,061 | $ | 22,522 | $ | 101,858 | $ | 55,078 | ||||||||||||||
Basic earnings per common share | ||||||||||||||||||||||||||||
Net income | $ | 0.46 | $ | 0.26 | $ | 0.36 | $ | 0.18 | $ | 0.24 | $ | 1.08 | $ | 0.59 | ||||||||||||||
Diluted earnings per common share | ||||||||||||||||||||||||||||
Net income | $ | 0.46 | $ | 0.26 | $ | 0.36 | $ | 0.18 | $ | 0.24 | $ | 1.08 | $ | 0.59 | ||||||||||||||
Weighted average common shares | ||||||||||||||||||||||||||||
Basic | 94,746 | 94,741 | 94,536 | 93,851 | 93,834 | 94,675 | 93,741 | |||||||||||||||||||||
Diluted | 94,799 | 94,795 | 94,697 | 93,922 | 93,902 | 94,737 | 93,811 | |||||||||||||||||||||
13
Supplemental Operating and Financial Data for the
Quarter Ended 9/30/2015
FFO and FAD Analysis (dollars and shares in thousands)
Three Months Ended | YTD | |||||||||||||||||||||||||||
9/30/15 | 6/30/15 | 3/31/15 | 12/31/14 | 9/30/14 | 9/30/15 | 9/30/14 | ||||||||||||||||||||||
Funds from operations: | ||||||||||||||||||||||||||||
Net income | $ | 46,460 | $ | 25,359 | $ | 36,386 | $ | 18,520 | $ | 24,297 | $ | 108,205 | $ | 59,632 | ||||||||||||||
Adjusted for - | ||||||||||||||||||||||||||||
Depreciation and amortization of real estate assets - consolidated properties | 28,428 | 23,919 | 23,637 | 25,052 | 25,425 | 75,984 | 75,909 | |||||||||||||||||||||
Depreciation and amortization of real estate assets - unconsolidated joint ventures | 5,411 | 5,038 | 4,076 | 4,164 | 3,040 | 14,525 | 8,048 | |||||||||||||||||||||
Gain on sale of assets and interests in unconsolidated entities | (20,215 | ) | — | (13,726 | ) | (7,513 | ) | — | (33,941 | ) | — | |||||||||||||||||
Funds from operations | 60,084 | 54,316 | 50,373 | 40,223 | 52,762 | 164,773 | 143,589 | |||||||||||||||||||||
FFO attributable to noncontrolling interests in other consolidated partnerships | (45 | ) | 412 | (42 | ) | (46 | ) | (62 | ) | 325 | (139 | ) | ||||||||||||||||
Allocation to participating securities | (640 | ) | (583 | ) | (560 | ) | (795 | ) | (1,045 | ) | (1,783 | ) | (2,858 | ) | ||||||||||||||
Funds from operations available to common shareholders | $ | 59,399 | $ | 54,145 | $ | 49,771 | $ | 39,382 | $ | 51,655 | $ | 163,315 | $ | 140,592 | ||||||||||||||
Funds from operations per share | $ | 0.59 | $ | 0.54 | $ | 0.50 | $ | 0.40 | $ | 0.52 | $ | 1.64 | $ | 1.42 | ||||||||||||||
Funds available for distribution to common shareholders: | ||||||||||||||||||||||||||||
Funds from operations | $ | 59,399 | $ | 54,145 | $ | 49,771 | $ | 39,382 | $ | 51,655 | $ | 163,315 | $ | 140,592 | ||||||||||||||
Adjusted for - | ||||||||||||||||||||||||||||
Corporate depreciation excluded above | 357 | 353 | 352 | 346 | 349 | 1,062 | 1,125 | |||||||||||||||||||||
Amortization of finance costs | 694 | 603 | 599 | 728 | 547 | 1,896 | 1,654 | |||||||||||||||||||||
Amortization of net debt discount (premium) | 139 | (88 | ) | 14 | (328 | ) | (92 | ) | 65 | (273 | ) | |||||||||||||||||
Amortization of share-based compensation | 3,994 | 3,953 | 3,613 | 3,817 | 3,813 | 11,560 | 10,934 | |||||||||||||||||||||
Straight line rent adjustment | (1,924 | ) | (1,549 | ) | (1,269 | ) | (1,047 | ) | (1,666 | ) | (4,742 | ) | (5,027 | ) | ||||||||||||||
Market rent adjustment | 825 | 383 | 916 | 961 | 734 | 2,124 | 2,247 | |||||||||||||||||||||
2nd generation tenant allowances | (1,428 | ) | (4,128 | ) | (956 | ) | (6,718 | ) | (2,570 | ) | (6,512 | ) | (8,824 | ) | ||||||||||||||
Capital improvements | (3,555 | ) | (4,558 | ) | (2,738 | ) | (7,668 | ) | (12,701 | ) | (10,851 | ) | (29,251 | ) | ||||||||||||||
Adjustments from unconsolidated joint ventures | (506 | ) | (399 | ) | (479 | ) | (940 | ) | (286 | ) | (1,384 | ) | (543 | ) | ||||||||||||||
Funds available for distribution | $ | 57,995 | $ | 48,715 | $ | 49,823 | $ | 28,533 | $ | 39,783 | $ | 156,533 | $ | 112,634 | ||||||||||||||
Funds available for distribution per share | $ | 0.58 | $ | 0.49 | $ | 0.50 | $ | 0.29 | $ | 0.40 | $ | 1.57 | $ | 1.14 | ||||||||||||||
Dividends paid per share | $ | 0.285 | $ | 0.285 | $ | 0.240 | $ | 0.240 | $ | 0.240 | $ | 0.810 | $ | 0.705 | ||||||||||||||
FFO payout ratio | 48 | % | 53 | % | 48 | % | 60 | % | 46 | % | 49 | % | 50 | % | ||||||||||||||
FAD payout ratio | 49 | % | 58 | % | 48 | % | 83 | % | 60 | % | 52 | % | 62 | % | ||||||||||||||
Diluted weighted average common shs. | 99,877 | 99,873 | 99,775 | 99,023 | 99,003 | 99,815 | 98,930 | |||||||||||||||||||||
14
Supplemental Operating and Financial Data for the
Quarter Ended 9/30/2015
Unconsolidated Joint Venture Information
The following table details certain information as of September 30, 2015, except for Net Operating Income ("NOI") which is for the nine months ended September 30, 2015, about various unconsolidated real estate joint ventures in which we have an ownership interest (dollars in millions):
Joint Venture | Center Location | Ownership % | Square Feet | Tanger's Share of Total Assets | Tanger's Share of NOI | Tanger's Share of Debt | ||||||||||||||
Charlotte (1) | Charlotte, NC | 50.0 | % | 397,837 | $ | 44.0 | $ | 5.2 | $ | 45.0 | ||||||||||
Columbus (2) | Columbus, OH | 50.0 | % | — | 12.3 | — | — | |||||||||||||
Galveston/Houston | Texas City, TX | 50.0 | % | 352,705 | 32.6 | 3.7 | 32.5 | |||||||||||||
National Harbor | National Harbor, MD | 50.0 | % | 338,786 | 51.4 | 4.1 | 41.8 | |||||||||||||
RioCan Canada (3) | Various | 50.0 | % | 870,187 | 129.7 | 4.7 | 5.9 | |||||||||||||
Savannah (4) (5) | Savannah, GA | 50.0 | % | 377,286 | 98.2 | 4.2 | 42.6 | |||||||||||||
Westgate | Glendale, AZ | 58.0 | % | 413,527 | 49.8 | 4.3 | 36.0 | |||||||||||||
Wisconsin Dells (6) | Wisconsin Dells, WI | 50.0 | % | N/A | — | 0.3 | — | |||||||||||||
Total | $ | 418.0 | $ | 26.5 | $ | 203.8 | ||||||||||||||
(1) | Center opened on July 31, 2014. |
(2) | Center is currently under construction. |
(3) | Includes a 161,449 square foot center in Bromont, Quebec, a 308,803 square foot center in Cookstown, Ontario, a 284,218 square foot center in Ottawa, Ontario (which opened on October 17, 2014), a 115,717 square foot center in Saint-Sauveur, Quebec, as well as due diligence costs for additional potential sites in Canada. |
(4) | Based on capital contribution and distribution provisions in the joint venture agreement, we expect our economic interest in the venture's cash flow to be greater than indicated in the Tanger Ownership column, which states our legal interest in this venture. As of September 30, 2015, based upon the liquidation proceeds we would receive from a hypothetical liquidation of our investment based on depreciated book value, our estimated economic interest in the venture was approximately 98%. Our economic interest may fluctuate based on a number of factors, including mortgage financing, partnership capital contributions and distributions, and proceeds from gains or losses of asset sales. |
(5) | Center opened on April 16, 2015. |
(6) | In February 2015, we closed on the sale of our equity interest in the joint venture in Wisconsin Dells. |
15
Supplemental Operating and Financial Data for the
Quarter Ended 9/30/2015
Non-GAAP Pro Rata Balance Sheet and Income Statement
The following pro rata information is not, and is not intended to be, a presentation in accordance with GAAP. The pro rata balance sheet and income statement data reflect our proportionate economic ownership of each asset in our portfolio that we do not wholly own. These assets may be found in the table above entitled, “Unconsolidated Joint Venture Information.” The amounts shown in the column labeled “Consolidated” were prepared on a basis consistent with the Company’s consolidated financial statements as filed with the SEC on the most recent Form 10-Q or 10-K, as applicable. The amounts in the column labeled “Pro Rata Portion Unconsolidated Joint Ventures” were derived on a property-by-property basis by applying to each financial statement line item the ownership percentage interest used to arrive at our share of net income or loss during the period when applying the equity method of accounting. A similar calculation was performed for the amounts in the column labeled “Pro Rata Portion Noncontrolling interests.”
We do not control the unconsolidated joint ventures and the presentations of the assets and liabilities and revenues and expenses do not represent our legal claim to such items. The operating agreements of the unconsolidated joint ventures generally provide that partners may receive cash distributions (1) quarterly, to the extent there is available cash from operations, (2) upon a capital event, such as a refinancing or sale or (3) upon liquidation of the venture. The amount of cash each partner receives is based upon specific provisions of each operating agreement and vary depending on factors including the amount of capital contributed by each partner and whether any contributions are entitled to priority distributions. Upon liquidation of the joint venture and after all liabilities, priority distributions and initial equity contributions have been repaid, the partners generally would be entitled to any residual cash remaining based on the legal ownership percentage shown in the table above entitled “Unconsolidated Joint Venture Information”.
We provide pro rata balance sheet and income statement information because we believe it assists investors and analysts in estimating our economic interest in our unconsolidated joint ventures when read in conjunction with the Company’s reported results under GAAP. The presentation of pro rata financial statements has limitations as an analytical tool. Some of these limitations include:
•The amounts shown on the individual line items were derived by applying our overall economic ownership interest percentage determined when applying the equity method of accounting and do not necessarily represent our legal claim to the assets and liabilities, or the revenues and expenses; and
•Other companies in our industry may calculate their pro rata interest differently than we do, limiting the usefulness as a comparative measure.
Because of these limitations, the pro rata balance sheet and income statement should not be considered in isolation or as a substitute for our financial statements as reported under GAAP, We compensate for these limitations by relying primarily on our GAAP results and using the pro rata balance sheet and income statement only supplementally.
16
Supplemental Operating and Financial Data for the
Quarter Ended 9/30/2015
Non-GAAP Pro Rata Balance Sheet as of September 30, 2015 (dollars in thousands)
Non-GAAP Pro Rata Adjustments | |||||||||||||||
Consolidated | Pro Rata Portion Noncontrolling Interests | Pro Rata Portion Unconsolidated Joint Ventures | Non-GAAP Pro Rata Balance Sheet | ||||||||||||
ASSETS | |||||||||||||||
Rental property | |||||||||||||||
Land | $ | 225,306 | $ | — | $ | 55,557 | $ | 280,863 | |||||||
Buildings, improvements and fixtures | 2,173,499 | (160 | ) | 336,711 | 2,510,050 | ||||||||||
Construction in progress | 63,445 | — | 16,960 | 80,405 | |||||||||||
2,462,250 | (160 | ) | 409,228 | 2,871,318 | |||||||||||
Accumulated depreciation | (727,921 | ) | — | (27,937 | ) | (755,858 | ) | ||||||||
Total rental property, net | 1,734,329 | (160 | ) | 381,291 | 2,115,460 | ||||||||||
Cash and cash equivalents | 20,661 | — | 16,249 | 36,910 | |||||||||||
Restricted cash | 42,904 | — | — | 42,904 | |||||||||||
Rental property held for sale | 19,286 | — | — | 19,286 | |||||||||||
Investments in unconsolidated joint ventures | 197,964 | (436 | ) | (197,528 | ) | — | |||||||||
Deferred lease costs and other intangibles, net | 130,390 | — | 10,292 | 140,682 | |||||||||||
Deferred debt origination costs, net | 10,688 | — | 2,605 | 13,293 | |||||||||||
Prepaids and other assets | 74,577 | — | 4,471 | 79,048 | |||||||||||
Total assets | $ | 2,230,799 | $ | (596 | ) | $ | 217,380 | $ | 2,447,583 | ||||||
LIABILITIES AND EQUITY | |||||||||||||||
Liabilities | |||||||||||||||
Debt | |||||||||||||||
Senior, unsecured notes, net of discounts | $ | 794,080 | $ | — | $ | — | $ | 794,080 | |||||||
Unsecured term loans, net of discounts | 267,378 | — | — | 267,378 | |||||||||||
Mortgages payable, including premiums | 281,966 | — | 203,818 | 485,784 | |||||||||||
Unsecured lines of credit | 195,800 | — | — | 195,800 | |||||||||||
Total debt | 1,539,224 | — | 203,818 | 1,743,042 | |||||||||||
Accounts payable and accruals | 90,506 | — | 15,006 | 105,512 | |||||||||||
Deferred financing obligation | 28,388 | — | — | 28,388 | |||||||||||
Other liabilities | 31,405 | — | (1,444 | ) | 29,961 | ||||||||||
Total liabilities | 1,689,523 | — | 217,380 | 1,906,903 | |||||||||||
Commitments and contingencies | — | — | — | — | |||||||||||
Equity | |||||||||||||||
Tanger Factory Outlet Centers, Inc. | |||||||||||||||
Common shares | 958 | — | — | 958 | |||||||||||
Paid in capital | 802,638 | — | — | 802,638 | |||||||||||
Accumulated distributions in excess of net income | (256,180 | ) | — | — | (256,180 | ) | |||||||||
Accumulated other comprehensive income | (33,943 | ) | — | — | (33,943 | ) | |||||||||
Equity attributable to Tanger Factory Outlet Centers, Inc. | 513,473 | — | — | 513,473 | |||||||||||
Equity attributable to noncontrolling interests | |||||||||||||||
Noncontrolling interests in Operating Partnership | 27,207 | — | — | 27,207 | |||||||||||
Noncontrolling interest in other consolidated partnerships | 596 | (596 | ) | — | — | ||||||||||
Total equity | 541,276 | (596 | ) | — | 540,680 | ||||||||||
Total liabilities and equity | $ | 2,230,799 | $ | (596 | ) | $ | 217,380 | $ | 2,447,583 | ||||||
17
Supplemental Operating and Financial Data for the
Quarter Ended 9/30/2015
Non-GAAP Pro Rata Statement of Operations year to date September 30, 2015 (dollars in thousands)
Non-GAAP Pro Rata Adjustments | |||||||||||||||
Consolidated | Pro Rata Portion Noncontrolling Interests | Pro Rata Portion Unconsolidated Joint Ventures | Non-GAAP Pro Rata Statement of Operations | ||||||||||||
REVENUES | |||||||||||||||
Base rentals | $ | 215,799 | $ | (10 | ) | $ | 27,250 | $ | 243,039 | ||||||
Percentage rentals | 6,896 | — | 1,363 | 8,259 | |||||||||||
Expense reimbursements | 93,815 | (5 | ) | 13,943 | 107,753 | ||||||||||
Management, leasing and other services | 4,263 | — | — | 4,263 | |||||||||||
Other income | 5,795 | — | 1,060 | 6,855 | |||||||||||
Total revenues | 326,568 | (15 | ) | 43,616 | 370,169 | ||||||||||
EXPENSES | |||||||||||||||
Property operating | 108,921 | (3 | ) | 16,928 | 125,846 | ||||||||||
General and administrative | 34,431 | — | 212 | 34,643 | |||||||||||
Acquisition costs | — | — | — | — | |||||||||||
Abandoned pre-development costs | — | — | — | — | |||||||||||
Depreciation and amortization | 77,046 | (5 | ) | 14,459 | 91,500 | ||||||||||
Total expenses | 220,398 | (8 | ) | 31,599 | 251,989 | ||||||||||
Operating income | 106,170 | (7 | ) | 12,017 | 118,180 | ||||||||||
OTHER INCOME/(EXPENSE) | |||||||||||||||
Interest expense | (40,110 | ) | 2 | (3,785 | ) | (43,893 | ) | ||||||||
Gain on sale of assets and interests in unconsolidated entities | 33,941 | — | 33,941 | ||||||||||||
Other nonoperating income (expense) | (98 | ) | 461 | 9 | 372 | ||||||||||
Income before equity in earnings of unconsolidated joint ventures | 99,903 | 456 | 8,241 | 108,600 | |||||||||||
Equity in earnings of unconsolidated joint ventures | 8,302 | (61 | ) | (8,241 | ) | — | |||||||||
Net income | 108,205 | 395 | — | 108,600 | |||||||||||
Noncontrolling interests in Operating Partnership | (5,532 | ) | — | — | (5,532 | ) | |||||||||
Noncontrolling interests in other consolidated partnerships | 395 | (395 | ) | — | — | ||||||||||
Net income attributable to Tanger Factory Outlet Centers, Inc. | 103,068 | — | — | 103,068 | |||||||||||
Allocation to participating securities | (1,210 | ) | — | — | (1,210 | ) | |||||||||
Net income available to common shareholders | $ | 101,858 | $ | — | $ | — | $ | 101,858 | |||||||
18
Supplemental Operating and Financial Data for the
Quarter Ended 9/30/2015
External Growth Pipeline Summary as of September 30, 2015
Project/Market | Projected Opening | Approx Size in Sq Ft (000s) | Est Total Net Cost (millions) | Cost to Date (millions) | Tanger Ownership Percentage | Est Total Construction Loan (millions) | Amount Drawn (millions) | Est Future Tanger Capital Requirement (millions) | Projected Stabilized Yield (1) | ||||||||||||
Under construction: | |||||||||||||||||||||
New Developments | |||||||||||||||||||||
Southaven, MS (Memphis) (2,3) | 11/20/15 | 320 | 67.8 | 47.5 | 50% | 60.0 | 15.2 | — | 9.5% - 10.5% | ||||||||||||
Columbus, OH (4) | 2Q16 | 355 | 94.9 | 19.7 | 50% | — | — | 37.6 | 10.0% - 11.0% | ||||||||||||
Total New Developments | 675 | $ | 162.7 | $ | 67.2 | $ | 60.0 | $ | 15.2 | $ | 37.6 | 10.3% | |||||||||
Expansions - | |||||||||||||||||||||
None | |||||||||||||||||||||
Total Expansions | — | $ | — | $ | — | $ | — | $ | — | $ | — | —% | |||||||||
Total Under Construction | 675 | $ | 162.7 | $ | 67.2 | $ | 60.0 | $ | 15.2 | $ | 37.6 | 10.3% | |||||||||
Pre-development: | |||||||||||||||||||||
None | |||||||||||||||||||||
(1) | While actual yields for individual projects may vary, the company's current targeted stabilized yield on estimated total net cost for development projects is 9% - 11% in the United States and 7% - 9% in Canada. Weighted average projected stabilized yields for projects under construction are calculated using the midpoint of the projected stabilized yield disclosed for each project, or the midpoint of the company's targeted stabilized yield for projects labeled TBD. | ||||||||||||||||||||
(2) | Based on capital contribution and distribution provisions in the joint venture agreement, we expect our economic interest in the venture's cash flow to be greater than indicated in the Tanger Ownership Percentage column, which in this case, states the company's legal interest in this venture. The company's economic interest may fluctuate based on a number of factors, including mortgage financing, partnership capital contributions and distributions, and proceeds from the gain or losses of asset sales. | ||||||||||||||||||||
(3) | Joint venture is consolidated for financial reporting purposes. | ||||||||||||||||||||
(4) | Partners currently plan to initially fund the project with equity, but may secure mortgage financing upon stabilization. | ||||||||||||||||||||
The company's estimates, projections and judgments with respect to projected opening date, approximate size, estimated total net cost, Tanger ownership percentage, estimated total construction loan, estimated future Tanger capital requirement and projected stabilized yield for new development and expansion projects are subject to adjustment prior to and during the development process. Estimated total net cost shown net of outparcel sales and public financing. There are risks inherent to real estate development, some of which are not under the direct control of the company. Please refer to the company's filings with the Securities and Exchange Commission on Form10-K and Form 10-Q for a discussion of these risks. | |||||||||||||||||||||
19
Supplemental Operating and Financial Data for the
Quarter Ended 9/30/2015
Debt Outstanding Summary (dollars in thousands)
As of September 30, 2015 | |||||||||||
Principal Balance | Stated Interest Rate | Effective Interest Rate | Maturity Date | ||||||||
Unsecured debt: | |||||||||||
Unsecured lines of credit (1) | $ | 195,800 | LIBOR + 1.00% | 10/24/2017 | |||||||
2020 Senior unsecured notes | 300,000 | 6.125% | 6.219% | 6/1/2020 | |||||||
2023 Senior unsecured notes | 250,000 | 3.875% | 4.076% | 12/1/2023 | |||||||
2024 Senior unsecured notes | 250,000 | 3.75 | % | 3.819% | 12/1/2024 | ||||||
Unsecured term loan (2) | 250,000 | LIBOR + 1.05% | 2/23/2019 | ||||||||
Unsecured term note | 7,500 | LIBOR + 1.30% | 8/28/2017 | ||||||||
Unsecured note | 10,000 | 1.50% | 3.153% | 6/30/2016 | |||||||
Net debt discounts | (6,041 | ) | |||||||||
Total unsecured debt | $ | 1,257,259 | |||||||||
Secured mortgage debt: | |||||||||||
Atlantic City, NJ (including premium of $3,393) (3) | $ | 47,391 | 5.14% - 7.65% | 5.05% | 11/15/2021 - 12/8/2026 | ||||||
Deer Park, NY (net of discount of $924) (4) | 149,076 | LIBOR + 1.50% | 2.80% | 8/30/2018 | |||||||
Foxwoods, CT (5) | 70,250 | LIBOR + 1.65% | 12/5/2017 | ||||||||
Southaven, MS (6) | 15,248 | LIBOR + 1.75% | 4/29/2018 | ||||||||
Total secured mortgage debt | $ | 281,965 | |||||||||
Tanger's share of unconsolidated JV debt: | |||||||||||
Charlotte (7) | $ | 45,000 | LIBOR + 1.45% | 11/24/2018 | |||||||
Galveston/Houston (8) | 32,500 | LIBOR + 1.50% | 7/01/2017 | ||||||||
National Harbor (9) | 41,850 | LIBOR + 1.65% | 11/13/2019 | ||||||||
RioCan Canada (including premium of $331) (10) | 5,938 | 5.75 | % | 4.18 | % | 5/10/2020 | |||||
Savannah (11) | 42,570 | LIBOR + 1.65% | 5/21/2017 | ||||||||
Westgate (12) | 35,960 | LIBOR + 1.75% | 6/27/2017 | ||||||||
Total Tanger's share of unconsolidated JV debt | $ | 203,818 | |||||||||
(1) | The company has an unsecured, syndicated credit line with a borrowing capacity totaling $500.0 million and a separate cash management line of credit with a borrowing capacity of $20.0 million with one of the participants in the syndication. Both lines expire on October 24, 2017 with the option to further extend the maturity for one additional year. Facility fees of 15 basis points annually are charged in arrears based on the full amount of the commitment. |
(2) | On July 2, 2014, the credit agreement for the unsecured term loan due February 23, 2019 was amended and restated to change the interest rate from LIBOR + 1.60% to LIBOR + 1.05%. |
(3) | Represents mortgages assumed in the acquisitions of various properties. |
(4) | On August 30, 2013, as part of the acquisition of a controlling interest in Deer Park, we assumed an interest-only mortgage loan that has a five year term and carries an interest rate of LIBOR + 1.50%. In October 2013, we entered into interest rate swap agreements to hedge our variable exposure on notional amounts aggregating $150.0 million. The interest rate swap agreements fix the base LIBOR rate at an average of 1.30%, creating a contractual interest rate of 2.80% on such amounts through August 14, 2018. |
(5) | In December 2014, the joint venture closed on a mortgage loan with the ability to borrow up to $70.3 million. The loan initially matures on December 5, 2017, with two one -year extension options. |
20
Supplemental Operating and Financial Data for the
Quarter Ended 9/30/2015
(6) | In April 2015, the joint venture closed on a mortgage loan with the ability to borrow up to $60.0 million. The loan initially matures on April 29, 2018, with one two-year extension option. As of September 30, 2015 the balance on the loan was $15.2 million. The balance is available as constructions progresses. |
(7) | In November 2014, the joint venture closed on a mortgage loan of $90.0 million. The loan initially matures on November 24, 2018, with one one -year extension option. |
(8) | In July 2013, the joint venture closed on a mortgage loan with the ability to borrow up to $70.0 million with a maturity date of July 1, 2017 and the option to extend the maturity for one additional year. As of September 30, 2015, the balance on the loan was $65.0 million. The additional $5.0 million is available for future expansion. |
(9) | In November 2014, the joint venture amended the initial construction loan to increase the amount available to borrow from $62.0 million to $87.0 million and extended the maturity date until November 13, 2019. As of September 30, 2015, the balance on the loan was $83.7 million. The additional $3.3 million is available for future expansion. |
(10) | Represents the mortgage assumed related to the acquisition of the Saint-Sauveur, Quebec property by the RioCan co-owners in November 2012. The mortgage has a principal balance of $11.2 million and matures on May 10, 2020. |
(11) | In May 2014, the joint venture closed on a construction loan with the ability to borrow up to $97.7 million. In September 2015, the loan maximum borrowing amount was increased to $100.9 million. The construction loan has a maturity date of May 21, 2017, with two options to extend the maturity date each for one additional year. As of September 30, 2015, the balance on the loan was $85.1 million. The additional $15.8 million is available for construction of the approximately 42,000 square foot expansion that is currently in process. |
(12) | In May 2014, the joint venture amended and restated the initial construction loan to increase the amount available to borrow from $48.3 million to $62.0 million. The amended and restated loan had a maturity date of June 27, 2015. On April 1, 2015, the joint venture exercised the option to extend the maturity date of the loan to June 27, 2017. As of September 30, 2015, the balance on the loan was $62.0 million. |
21
Supplemental Operating and Financial Data for the
Quarter Ended 9/30/2015
Future Scheduled Principal Payments (dollars in thousands)
As of September 30, 2015 | |||||||||||
Year | Tanger Consolidated Payments | Tanger's Share of Unconsolidated JV Payments | Total Scheduled Payments | ||||||||
2015 | $ | 686 | $ | 62 | $ | 748 | |||||
2016 | 12,842 | 254 | 13,096 | ||||||||
2017 (1) | 276,558 | 111,298 | 387,856 | ||||||||
2018 | 168,432 | 45,284 | 213,716 | ||||||||
2019 | 253,369 | 42,151 | 295,520 | ||||||||
2020 | 303,566 | 4,438 | 308,004 | ||||||||
2021 | 5,793 | — | 5,793 | ||||||||
2022 | 4,436 | — | 4,436 | ||||||||
2023 | 254,768 | — | 254,768 | ||||||||
2024 | 255,140 | — | 255,140 | ||||||||
2025 & thereafter | 7,206 | — | 7,206 | ||||||||
$ | 1,542,796 | $ | 203,487 | $ | 1,746,283 | ||||||
Net Discount on Debt | (3,572 | ) | 331 | (3,241 | ) | ||||||
$ | 1,539,224 | $ | 203,818 | $ | 1,743,042 | ||||||
Senior Unsecured Notes Financial Covenants (2)
As of September 30, 2015 | ||||||
Required | Actual | Compliance | ||||
Total Consolidated Debt to Adjusted Total Assets | <60% | 50 | % | Yes | ||
Total Secured Debt to Adjusted Total Assets | <40% | 9 | % | Yes | ||
Total Unencumbered Assets to Unsecured Debt | >150% | 175 | % | Yes | ||
Consolidated Income Available for Debt Service to Annual Debt Service Charge | >1.5 | 4.95 | Yes | |||
(1) | Includes balances of $195.8 million outstanding under the company's unsecured lines of credit. |
(2) | For a complete listing of all debt covenants related to the company's Senior Unsecured Notes, as well as definitions of the above terms, please refer to the company's filings with the Securities and Exchange Commission. |
22
Supplemental Operating and Financial Data for the
Quarter Ended 9/30/2015
Investor Information
Tanger Outlet Centers welcomes any questions or comments from shareholders, analysts, investment managers, media and prospective investors. Please address all inquiries to our Investor Relations Department.
Tanger Factory Outlet Centers, Inc. | |
Investor Relations | |
Phone: | (336) 834-6892 |
Fax: | (336) 297-0931 |
e-mail: | tangerir@tangeroutlet.com |
Mail: | Tanger Factory Outlet Centers, Inc. |
3200 Northline Avenue | |
Suite 360 | |
Greensboro, NC 27408 | |
23
Supplemental Operating and Financial Data for the
Quarter Ended 9/30/2015