Attached files
| file | filename |
|---|---|
| EX-99.1 - PRESS RELEASE - ATHENAHEALTH INC | athnq32015earningsrelease.htm |
| 8-K - FORM 8-K - ATHENAHEALTH INC | athnq32015form8k.htm |
Third Quarter Fiscal Year 2015 
Prepared Remarks October 22, 2015
Jonathan Bush, Chairman & Chief Executive Officer
Kristi Matus, Executive Vice President, Chief Financial & Administrative Officer
About These Remarks
The following commentary is provided by management in conjunction with the third quarter fiscal year 2015 earnings press release issued by athenahealth, Inc. (“athenahealth” or “we”). These remarks represent management’s current views on our financial and operational performance and are provided to give investors and analysts more time to analyze and understand our performance in advance of the earnings conference call. These prepared remarks will not be read on the conference call. A complete reconciliation between generally accepted accounting principles (“GAAP”) and non-GAAP results, as well as a summary of supplemental metrics and definitions, is provided in the tables following these prepared remarks.
Earnings Conference Call Information
To participate in our live conference call and webcast, please dial 877-853-5645 (or 408-940-3868 for international calls) using conference code no. 50137013, or visit the Investors section of our website at www.athenahealth.com. A replay will be available for one week following the conference call at 855-859-2056 (and 404-537-3406 for international calls) using conference code no. 50137013. A webcast replay will also be archived on our website.
Safe Harbor and Forward-Looking Statements
These remarks contain forward-looking statements, which are made pursuant to the safe harbor provisions of the Private Securities Litigation Reform Act of 1995, including statements reflecting management’s expectations for future financial and operational performance and operational expenditures, expected growth and penetration in major health care and technology markets, and business outlook, including the fiscal year 2015 guidance and additional insight thereto; statements regarding our research and development efforts and product offerings and enhancements; the benefits of and anticipated operational results from our service offerings and demands for and adoption of our service offerings; the further integration and repackaging of our services and the resulting benefits; changes in the types of providers and health care entities we serve and the range of tasks we perform for clients; our sales, marketing and partnering activities and plans; introduction of new partners and capabilities as part of our “More Disruption Please” (MDP) effort and anticipated operational results from partners’ service offerings; the development of the athenaClinicals® Enterprise and athenaCoordinator® Enterprise service offerings; client behavior and preferences, and implementation of services for new clients and deals; clinical and financial performance metrics for our clients and our ability to influence such metrics; our market position and awareness among physicians; the potential for cross-sales among service offerings and sales involving multiple services; our implementation pipeline and expectations on new deals and network growth; the expansion of the number of users of our services; the interoperability of athenaNet®; changes in the industry, our positioning to lead such changes, and the extent of our experience to manage such changes for our clients; the creation of the health care Internet and connected care; and statements found under our “Reconciliation of Non-GAAP Financial Measures to Comparable GAAP Measures” section of these remarks. Forward-looking statements may often be identified with words such as “we expect,” “we anticipate,” “upcoming,” “plan,” “aim,” or similar indications of future expectations. These statements are neither promises nor guarantees, and are subject to a variety of risks and uncertainties, many of which are beyond our control, which could cause actual results to differ materially from those contemplated in these
1
forward-looking statements. In particular, the risks and uncertainties include, among other things: our fluctuating operating results; our variable sales and implementation cycles, which may result in fluctuations in our quarterly results; risks associated with the acquisition and integration of companies and new technologies, including those related to our ability to integrate the services, offerings, and technologies of Epocrates, Razor Insights, LLC, and webOMR and realize the expected benefits such as increased awareness among physicians and acceleration into new market segments; risks associated with our expectations regarding our ability to maintain profitability; the impact of increased sales and marketing and research and development expenditures, including whether increased expansion in revenues is attained, and impact on margins and profitability; changes in tax rates or exposure to additional tax liabilities; the highly competitive industry in which we operate and the relative immaturity of the market for our service offerings; and the evolving and complex governmental and regulatory compliance environment in which we and our clients operate. Existing and prospective investors are cautioned not to place undue reliance on these forward-looking statements, which speak only as of the date hereof. We undertake no obligation to update or revise the information contained in these remarks, whether as a result of new information, future events or circumstances, or otherwise. For additional disclosure regarding these and other risks faced by us, see the disclosures contained in our public filings with the Securities and Exchange Commission (“SEC”), available on the Investors section of our website at www.athenahealth.com and on the SEC’s website at www.sec.gov.
Use of Non-GAAP Financial Measures
These remarks contain non-GAAP financial measures, as defined by SEC Regulation G. The GAAP financial measure most directly comparable to each non-GAAP financial measure used or discussed, and a reconciliation of the differences between each non-GAAP financial measure and the comparable GAAP financial measure, are included following these prepared remarks or can be found within our third quarter fiscal year 2015 earnings press release in the Investors section of our website at www.athenahealth.com.
Opening Remarks
athenahealth’s vision is to build the health care internet and connect care across care continuum. Today, we connect providers to financial results and clinical outcomes, we connect providers to their patients, we connect providers to new innovations and finally, we connect providers to each other. During Q3 2015, we added a record 4,784 providers onto the network, grew our athenaCoordinator receivers by almost 40% with the addition of 350 receiver nodes, and connected our clients to nearly 95 thousand electronic global trading partners. Additionally, we expanded our population health network with the signing of Summit Medical Group. Finally, we are further connecting providers to disruptive innovation with the launch of our first telehealth partner, Chiron Health, in the MDP Marketplace.
Highlights from Q3 2015 include the following:
• | Grew consolidated revenue by 24% and athenahealth-branded revenue by 24% over Q3 2014 |
• | Delivered Non-GAAP Adjusted Gross Margin rate of 62.9%, up from 61.2% in Q3 2014 |
• | Grew net new active physicians on athenaCollector® (3,953 physicians added), athenaClinicals (2,818 physicians added), and athenaCommunicator® (3,422 physicians added) in Q3 2015, compared to athenaCollector (3,420 physicians added), athenaClinicals (2,786 physicians added), and athenaCommunicator (3,846 physicians added) in Q3 2014 |
• | Grew athenaCollector physicians by 23%, athenaClinicals physicians by 36%, and athenaCommunicator physicians by 30% over Q3 2014, representing continued strong network growth in 2015 |
2
• | Completed the implementation at CareWell Urgent Care (athenaOne®), brought two regional health ministries live at Trinity Health (athenaOne) and brought the first implementation wave live at Beth Israel Deaconess Healthcare (athenaOne) |
Results Overview
athenahealth’s top line results for the third quarter of fiscal year (“FY”) 2015 reflect solid revenue growth:
• | Total revenue: |
◦ | $236.1 million in Q3 2015, representing 24% growth over $190.4 million in Q3 2014 |
▪ | athenahealth-branded revenue was $217.8 million in Q3 2015, representing 24% growth over $175.6 million for Q3 2014 |
◦ | $667.2 million for the nine months ending September 30, 2015, representing 24% growth over $539.4 million in the same period last year |
▪ | athenahealth-branded revenue was $619.0 million for the nine months ending September 30, 2015, representing 25% growth over $494.1 million in the same period last year |
Our bottom line results for Q3 2015, consistent with our growth strategy, demonstrate strong sales, marketing, and research and development investments, and a focus on operating efficiencies:
• | Non-GAAP Adjusted Gross Profit and Margin: |
◦ | $148.5 million, or 62.9% of total revenue, in Q3 2015, an increase of 27% over $116.6 million, or 61.2% of total revenue, in Q3 2014 |
• | GAAP selling and marketing expense: |
◦ | $55.9 million, or 23.7% of total revenue, in Q3 2015, an increase of 24% over $45.2 million, or 23.7% of total revenue, in Q3 2014 |
• | GAAP research and development expense: |
◦ | $22.6 million, or 9.6% of total revenue, in Q3 2015, an increase of 25% over $18.1 million, or 9.5% of total revenue, in Q3 2014 |
• | GAAP general and administrative expense: |
◦ | $34.8 million, or 14.7% of total revenue, in Q3 2015, an increase of 9% from $31.8 million, or 16.7% of total revenue, in Q3 2014 |
• | Non-GAAP Adjusted EBITDA: |
◦ | $49.0 million, or 20.7% of total revenue, in Q3 2015, an increase of 39% from $35.2 million, or 18.5% of total revenue, in Q3 2014 |
• | Non-GAAP Adjusted Operating Income: |
◦ | $25.4 million, or 10.8% of total revenue, in Q3 2015, an increase of 37% from $18.5 million, or 9.7% of total revenue, in Q3 2014 |
• | Non-GAAP Adjusted Net Income: |
◦ | $14.3 million, or $0.36 per diluted share, in Q3 2015, an increase of 38% from $10.4 million, or $0.27 per diluted share, in Q3 2014 |
We measure our performance based on a balanced scorecard model. We believe that this framework is an excellent report card for our performance for the current year and that it measures the key performance indicators required for long-term success. For 2015, we have developed a more streamlined and more
3
heavily weighted scorecard focused on eight key stability, performance, satisfaction and financial metrics. The table below shows the scorecard results for Q1 2015, Q2 2015, Q3 2015, and year-to-date Q3 2015. For certain metrics (i.e., Client Days in Accounts Receivable), our goal is to improve our performance by effectively reducing the scorecard metrics results throughout the year. Please reference the last page of this document for definitions of our corporate scorecard metrics.
Q1 2015 Results | Q2 2015 Results | Q3 2015 Results | YTD 2015 Results | |||||||||
Stability (10% weight) | ||||||||||||
Voluntary Turnover | 2.2 | % | 2.8 | % | 3.4 | % | 8.4 | % | ||||
Employee Engagement | (a) | 4.3 | (a) | 4.3 | ||||||||
Stability Results | 115 | % | 95 | % | 70 | % | 93 | % | ||||
Performance (25% weight) | ||||||||||||
Client Days in Accounts Receivable (“DAR”) | 41.1 | 40.8 | 40.7 | 40.9 | ||||||||
Closed-Loop Order Rate | 42.5 | % | 43.5 | % | 44.5 | % | 43.5 | % | ||||
Performance Results | 97 | % | 95 | % | 95 | % | 95 | % | ||||
Satisfaction (20% weight) | ||||||||||||
Net Promoter Score | 42.3 | 40.5 | 39.9 | 40.9 | ||||||||
Satisfaction Results | 96 | % | 92 | % | 91 | % | 93 | % | ||||
Financial (45% weight) | ||||||||||||
Bookings (b) | (b) | (b) | (b) | (b) | ||||||||
Total Revenue ($M) | $ | 206.4 | $ | 224.7 | $ | 236.1 | $ | 667.2 | ||||
Non-GAAP Adjusted Operating Income ($M) | $ | 16.3 | $ | 22.2 | $ | 25.4 | $ | 63.9 | ||||
Financial Results | 130 | % | 115 | % | 91 | % | 113 | % | ||||
Total Results | 113 | % | 103 | % | 90 | % | 103 | % | ||||
(a) | Employee Engagement survey result reported in Q2 and Q4 only. |
(b) | Since the bookings metric contains highly sensitive data, we do not disclose all of the specific performance measures and targets, because we believe that such disclosure would result in serious competitive harm. |
We believe that our underlying drivers of long-term success remain relatively strong as supported by the following metric results:
• | Voluntary Turnover of 3.4% in Q3 2015, above our goal of 2.6%. We closely track employee retention metrics and monitor employee engagement via our semi-annual engagement surveys. We continue to focus on programs that attract and develop top talent across all of our locations. |
• | Client Days in Accounts Receivable of 40.7 days in Q3 2015, above our goal of 37.6 days, and above 39.2 days in Q3 2014. Client Days in Accounts Receivable continues to be impacted by credentialing-related activity resulting from strong provider growth within the base as well as new provider growth. |
• | Closed-Loop Order Rate of 44.5% in Q3 2015, mostly in line with our goal of 44.8%. |
• | Net Promoter Score of 39.9 in Q3 2015, versus goal of 44.0 and 40.5 in Q2 2015. We continue to focus on improving our service around change management, the client on-boarding experience, and issue resolution. |
4
athenahealth’s client base continues to expand while client adoption of other services in the athenahealth service suite grows. As our client base expands outside the traditional ambulatory market, we believe that total active providers, or nodes, on our network will become a more appropriate metric to use in measuring our market share. During Q3 2015:
• | 87% of all new athenaCollector deals included athenaClinicals, compared to 79% in Q3 2014 |
• | 82% of all new athenaCollector deals included athenaClinicals, athenaCommunicator and athenaCoordinator, compared to 74% in Q3 2014. |
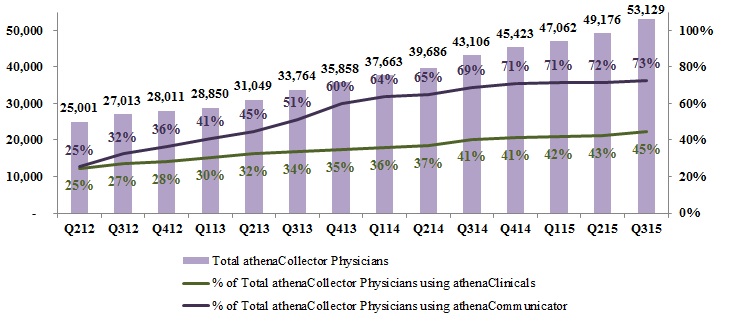
• | 45% of total athenaCollector physicians have adopted athenaClinicals, up from 41% in Q3 2014 |
• | 73% of total athenaCollector physicians have adopted athenaCommunicator, up from 69% in Q3 2014 |
• | Net new physicians and providers added sequentially to the network were as follows: |
athenaCollector | athenaClinicals | athenaCommunicator | ||||||||||||
Active physicians and providers: | Physicians | Providers | Physicians | Providers | Physicians | Providers | ||||||||
Beginning balance as of 6/30/15 | 49,176 | 67,530 | 20,923 | 27,641 | 35,248 | 45,902 | ||||||||
Net new additions | 3,953 | 4,784 | 2,818 | 3,430 | 3,422 | 4,084 | ||||||||
Ending balance as of 9/30/15 | 53,129 | 72,314 | 23,741 | 31,071 | 38,670 | 49,986 | ||||||||
Sequential growth % | 8 | % | 7 | % | 13 | % | 12 | % | 10 | % | 9 | % | ||
• | Net new physicians and providers added to the network since Q3 2014 were as follows: |
athenaCollector | athenaClinicals | athenaCommunicator | ||||||||||||
Active physicians and providers: | Physicians | Providers | Physicians | Providers | Physicians | Providers | ||||||||
Beginning balance as of 9/30/14 | 43,106 | 59,415 | 17,458 | 23,053 | 29,683 | 38,699 | ||||||||
Net new additions | 10,023 | 12,899 | 6,283 | 8,018 | 8,987 | 11,287 | ||||||||
Ending balance as of 9/30/15 | 53,129 | 72,314 | 23,741 | 31,071 | 38,670 | 49,986 | ||||||||
Y/Y growth % | 23 | % | 22 | % | 36 | % | 35 | % | 30 | % | 29 | % | ||
• | 350 athenaCoordinator receivers were added to the network, bringing our athenaCoordinator receiver base to 7,056 receivers |
Revenue Discussion
Q3 2015 revenue was $236.1 million and grew by 24% (or $45.6 million) over Q3 2014. athenahealth-branded revenue for Q3 2015 was $217.8 million and grew by 24% (or $42.2 million) over Q3 2014. Revenue for the nine months ended September 30, 2015 was $667.2 million and grew by 24% (or $127.8 million) over the same period last year. athenahealth-branded revenue for the nine months ended September 30, 2015 was $619.0 million and grew by 25% (or $124.9 million) over the same period last year.
Q3 2015 | Q3 2014 | Y/Y Growth% | ||
athenahealth-branded | $217.8 | $175.6 | 24 | % |
Epocrates-branded | $13.7 | $9.8 | 40 | % |
Third-party tenant and other non-core | $4.6 | $5.0 | (8 | )% |
Consolidated Revenue | $236.1 | $190.4 | 24 | % |
5
YTD Q3 2015 | YTD Q3 2014 | Y/Y Growth% | ||
athenahealth-branded | $619.0 | $494.1 | 25 | % |
Epocrates-branded | $36.1 | $31.7 | 14 | % |
Third-party tenant and other non-core | $12.1 | $13.6 | (11 | )% |
Consolidated Revenue | $667.2 | $539.4 | 24 | % |
In terms of trends in our recurring revenue base, same-store analysis of claims created—a proxy for physician office utilization—indicates that physician office activity in Q3 2015 increased slightly over physician office activity during Q3 2014. However, our analysis also showed that physician office activity in Q3 2015 was relatively flat compared to physician office activity in Q2 2015.
Non-GAAP Adjusted Gross Margin Discussion
Our Non-GAAP Adjusted Gross Margin was 62.9% for Q3 2015, up approximately 170 basis points from 61.2% in Q3 2014. One of our goals is to improve gross margin on a service-line basis each year. As previously discussed, the expansion of our newer service offerings, such as athenaCoordinator Enterprise and athenaOne for the hospital and health system market, is expected to serve as a headwind to total company margin expansion until these new services become more automated and scalable.
Balance Sheet and Cash Flow Highlights
As of September 30, 2015, we had cash and cash equivalents of $116.7 million and outstanding indebtedness of $300.0 million. Operating cash flow decreased by $1.2 million from net cash provided by operating activities of $104.1 million for the nine months ended September 30, 2014, to net cash provided by operating activities of $102.9 million for the nine months ended September 30, 2015.
Fiscal Year 2015 Outlook
Our fiscal year 2015 guidance we released in conjunction with our fourth quarter and full year 2014 earnings call on February 6, 2015 is summarized in the following table:
For the Fiscal Year Ending December 31, 2015 | |
Forward-Looking Guidance | |
GAAP Total Revenue | $905 - $925 million |
Non-GAAP Adjusted Gross Margin | 62.5% - 63.5% |
Non-GAAP Adjusted Operating Income | $75 - $85 million |
Non-GAAP Adjusted Net Income per Diluted Share | $1.10 - $1.20 |
Non-GAAP Tax Rate | 40% |
We are not making any changes to the fiscal year 2015 guidance we released in conjunction with our fourth quarter and full year 2014 earnings call on February 6, 2015. However, based on our year-to-date performance and our current expectations for Q4 2015, we are providing additional insight into our fiscal year 2015 guidance as follows:
• | We expect GAAP Total Revenue to be at or above the mid-point of the $905 million to $925 million guidance range. |
• | We expect Non-GAAP Adjusted Gross Margin to be close to the high end of the 62.5% to 63.5% guidance range. |
• | We expect Non-GAAP Adjusted Operating Income to be above the high end of the $75 million to $85 million guidance range. |
• | Finally, we expect Non-GAAP Adjusted Net Income per Diluted Share to be above the high end of the $1.10 to $1.20 guidance range. |
6
Please refer to our press release dated February 5, 2015 for a reconciliation of these non-GAAP financial measures to comparable GAAP measures for fiscal year 2015 guidance.
2015 Investor Summit
Our 8th Annual Investor Summit will be held at our Watertown, Massachusetts headquarters on Thursday, December 10, 2015. Please note that, due to limited capacity, attendance at the Investor Summit is by invitation only. A live webcast of this event can, however, be accessed via the Investors section of athenahealth’s website at www.athenahealth.com.
Product Development Discussion
Product development at athenahealth is organized around our mission to be health care providers’ most trusted service, helping them do well doing the right thing. In order to fulfill this goal, we deliver services backed by cloud-based software, networked knowledge, and back-office work. We deliver cloud-based services for revenue cycle management and medical billing, electronic health records, patient engagement, care coordination, population health management, and clinical intelligence and decision support.
athenahealth-branded and Epocrates-branded service offerings
The following suite of cloud-based services connects our clients to financial results, clinical outcomes, patients, and the care continuum:
athenaCollector is our cloud-based medical billing and practice management service. It is the foundation of our service portfolio and entered general availability in 2000.
athenaClinicals is our cloud-based electronic health record (“EHR”) service. It entered general availability in 2006 and was made available as a stand-alone service in 2010.
athenaCommunicator is our cloud-based patient engagement and communication service. It entered general availability in 2010 and, at this time, requires adoption of athenaCollector or athenaOne.
athenaCommunicator Enterprise (formerly included in our athenaCoordinator Enterprise service) is our cloud-based population health management service. It entered general availability in 2012 upon the acquisition of Healthcare Data Services LLC in October 2012.
athenaCoordinator (formerly known as athenaCoordinator Core) is our cloud-based order transmission and care collaboration service for providers and facilities that receive and fulfill health care orders. It entered general availability in 2012.
athenaCoordinator Enterprise is our cloud-based care coordination and patient access service. It assures smooth transitions in care, with network-wide scheduling and secure text messaging for provider collaboration. athenahealth teams take on the referral management work so providers and staff get all relevant information and patients receive a “red carpet” experience upon arrival. It was launched in early 2014 and it entered general availability for specific markets in 2015.
Epocrates-branded services center around a variety of clinical information and clinical decision support offerings and are available through health care professionals’ mobile devices. These services include: drug and disease information, medical calculator and tools, clinical guidelines, clinical messaging, virtual representative services, market research, and formulary hosting. The Epocrates network consists of over one million health care professionals, including approximately 50% of active U.S. physicians. athenahealth acquired Epocrates on March 12, 2013.
Connecting to financial results:
We empower our clients to achieve and sustain financial health while staying focused on quality patient care by combining cloud-based software, networked knowledge, and back-office work. The athenaNet platform, a single instance of cloud-based software, enables every client to benefit from the collective knowledge of all other clients. athenahealth is a learning network dedicated to the success of our clients.
7
For example, we have a full-time team dedicated to our Peak Performance Initiative. The team’s goal is to study top performers across our national network, isolate what it is that they do differently from average practices, and disseminate the resulting insights across our client base. The latest installment of this initiative is focused on helping our clients improve patient collections. This research indicates that improving patient collections requires changing office workflows to fully utilize our athenaCollector tools, holding staff accountable for potentially uncomfortable conversations, and asking patients to shoulder a financial burden that many may find unfamiliar. In addition to staff training and accountability, pre-visit collections strategy, and ongoing collections efforts, establishing best practices around time-of-service collections is key to creating a lasting collections culture. Time-of-service (“TOS”) collections rate is defined as the percentage of co-pay and outstanding balance dollars collected for each patient visit at the time of service. Our research team identified that the best practices to increase the TOS collections rate include credit card on file agreements, large-balance payment plans, standardized down payments, and collection-focused digital check-in tools. We will continue to track the TOS collection rate across our network and provide clients with the necessary insight, best practices, and tools to improve patient collections. Stay tuned for future installments of the peak performance initiative that will be focused on patient loyalty and patient access.
We are committed to doing the hard work required to lessen the burden on providers and help them thrive through regulatory changes. This commitment has been demonstrated by the countless hours the cross functional athenahealth team has spent getting our clients ready for the ICD-10 transition. We believe our ICD-10 transition readiness, leading up to the October 1, 2015 deadline, is confirmed by the following metrics: 1) athenaNet is 100% ready to submit ICD-10 compatible claims, 2) completed testing with 83% of payers by claim volume, 3) completed testing of 95% of charge interfaces, and 4) over 1.25 million claims have been practiced with ICD-10 codes across the network. We have now shifted our focus and energy to identifying and resolving any issues following the October 1, 2015 transition date. To this end, we have fully staffed a 24/7 nerve center in four locations to monitor client performance and payer trends by making sure claims have been submitted, acknowledged by the payers, successfully adjudicated, and finally, that all denials are investigated. We are disclosing our overall ICD-10 transition progress and network performance with the launch of our external ICD-10 insights dashboard.
Finally, in anticipation of the ICD-10 transition, we have developed a new go-live process, called “Live in Five”, where we can successfully bring clients live in 5 days. When this program is applicable, these small group clients are live on athenaNet and are able to schedule patients and document encounters in 5 days and are able to submit claims in approximately 30 days. We began offering this program in September 2015 and in just one month, 14 small group clients have benefited from this shortened on-boarding process. Going forward, we aim to scale this accelerated onboarding program and make this a standard operating procedure for all clients who either need to be live or want to be live in this shortened timeframe.
Connecting to clinical outcomes:
athenahealth is committed to doing the hard work required to lessen the burden on providers. Our Patient-Centered Medical Home (“PCMH”) Accelerator Program is one of many initiatives from athenahealth that combines cloud-based software with the work and support of service teams to help close the gap on revenue-impacting industry changes. Acknowledged by the industry as an innovative primary care delivery model, the PCMH aims to replace episodic care with team-based, coordinated care. The National Committee for Quality Assurance (“NCQA”) awards PCMH Recognition to providers who meet strenuous criteria for delivering continuous, comprehensive, accessible, and community-based care. The tenets of the PCMH philosophy - open access, patient activation, continuity of care, and focus on outcomes - are aligned with our goal to equip our clients with what they need to optimize performance and deliver better care. Our PCMH Accelerator Program streamlines providers’ pathway towards formal
8
NCQA PCMH Recognition. First, users of both athenaClinicals and athenaCommunicator receive 35.25 pre-validated auto-credits from NCQA. Second, NCQA-approved practice support workflows totaling 45.50 points are integrated directly into athenaNet, easing administrative burden and reporting requirements for practices applying for recognition. The combination of our pre-validated workflows, our reporting tools, and our high number of auto credits provides our clients with 95% of the points needed for Level 3 Recognition. Level 3 Recognition represents the highest certification from the NCQA. This recognition is a critical stepping stone to value-based reimbursement and is meaningful from a reputation and financial perspective. Beginning in 2018, recognized providers will be eligible for a 5 percent reimbursement bonus from the Centers for Medicare and Medicaid Services.
Our ability to connect clients to financial results and clinical outcomes is our proven value and the power behind our technology-enabled services. This was demonstrated once again by the performance of our athenaCommunicator Enterprise clients in the 2014 Medicare Shared Savings Program (“MSSP”) and Pioneer ACO rankings. While athenahealth clients represent approximately 2% of the Accountable Care Organizations (“ACO”), they earned approximately 10% of the earned shared savings across the MSSP and Pioneer ACOs in the country1. athenahealth clients also drove approximately 130% more earned savings per covered life as compared to the national average across all MSSP ACOs. Also, athenahealth clients outperformed the national average across nearly all ACO33 measures, including a 32% lower than national average on the percentage of lives with poor HbA1c control (one of the key measures for monitoring diabetic patients). We have demonstrated time and again that we can partner with clients and consistently beat the national average against both cost and quality measures. Another familiar example is our clients’ industry-leading attestation success with both Stage 1 and Stage 2 of Meaningful Use2.
Connecting to patients:
We remain committed to helping our clients drive patient engagement, improve patient access, and close care gaps. As a result of our single instance, multi-tenant architecture, we have unparalleled access and insight into client performance. As part of our peak performance initiative, our athenaResearch team analyzed clients with the best patient portal adoption rates across the network. This analysis resulted in athenahealth developing a robust strategy and step-by-step best practices to help clients drive increases in portal adoption, thereby increasing patient engagement. This research showed that portal adoption significantly improves patient loyalty which in turn can significantly improve a practice’s financial performance. For example, the 18-month patient retention rates for portal adopters was 79% compared to a 65% patient retention rate among non-portal adopters. In addition, using six illustrative practices from our network, our analysis showed that revenue over a three year period from a retained patient was between 6 times to 20 times larger than that of a non-retained patient. This unique research and network insight continues to guide us on ways to improve our patient portal offering and on ways to help our clients increase their portal adoption rates. Our portal adoption rate has increased to 28.8% this quarter, up from 22.3% in Q3 2014 and up slightly from 28.0% in Q2 2015. More importantly, the total number of patients registered for the portal has increased over 100% from approximately 4.1 million in Q3 2014 to approximately 8.9 million in Q3 2015.
______________________________
1Medicare Shared Savings and Pioneer ACO performance calculated from the Medicare Shared Savings Program Accountable Care Organizations Performance Year 2014 Results. https://data.cms.gov/ACO/Medicare-Shared-Savings-Program-Accountable-Care-O/ucce-hhpu
2 athenahealth’s Meaningful Use performance compared national average which was calculated from analysis of the Centers for Medicare and Medicaid Services data released in June 2014 and April 2015. http://www.healthit.gov/sites/default/files/mu_report.xlsx
9
Connecting to the care continuum:
The athenahealth team is dedicated to making athenahealth’s network the most connected platform in health care. We connect providers on athenaNet with labs, pharmacies, hospitals, radiology centers, and imaging centers as well as nearly every insurer in the country. We exchange health information and connect care in an operational and usable way and because of the value we deliver, our network continues to grow. Today, we connect care for more than 72,000 providers across a connected network of nearly 95,000 electronic global trading partners. In the past quarter alone, we exchanged nearly one billion electronic transactions of patient information with our clients’ trading partners, which represents growth of 78% from the 560 million electronic transactions exchanged in Q3 2014. In addition, with continuing improvement to our current 59% Total Automation Rate, we seek to increase the electronic flow of information across our network. Even with such progress, we are in the early days of bringing the full power of the internet to health care. As such, we maintain our strategic commitment to drive connectedness with health care providers and organizations who are not yet on athenaNet, and we are gaining momentum. Not only can all providers on athenaNet share clinical information with each other at this time, but they can also share clinical information with anyone on the CommonWell Health Alliance network. As a reminder, the CommonWell Health Alliance members, like athenahealth, are commited to developing, deploying and promoting interoperabiity and effective health care data exchange. Moreover, the number of individual hospitals and health systems that are on legacy in-patient software but see the value in connecting to our network is now growing. Our efforts to foster the electronic exchange of health information produces results for our clients, reduces inefficiencies for all of health care, and deepens our strategic relationships with care organizations everywhere. Stay tuned for a broader update of our interoperability strategy at our Annual Investor Summit on December 10, 2015.
The athenahealth team is also focused on extending our software, knowledge, and work business model into the hospital and health system market. The efficiency, productivity, and speed of our product development efforts helped us achieve a few key milestones in the third quarter including the sunsetting of the RazorInsights brand and the processing of our first full health system and inpatient claims through athenaNet. Our athenaOne service for hospitals and health systems is broader than our athenaOne offering for the ambulatory market because it also includes our patient access services. As part of our overall development strategy, we are converting a few critical access and community hospital clients to our full athenaOne offering. Going forward, all future sales and client onboarding in the 50-bed and under hospital market will be on our integrated athenaOne platform. Our product development roadmap also includes extending our athenaOne offering beyond the 50-bed hospital market and into the larger and more complex health system market over time. We look to expand our development partnerships with additional hospitals that offer a diverse set of inpatient scenarios such as a larger critical access hospital, an over 50-bed surgical hospital and/or a large academic medical center. Stay tuned for a broader update of our care continuum strategy at our Annual Investor Summit on December 10, 2015.
Business Development Update
More Disruption Please (“MDP”)
Opening athenaNet and building an ecosystem of partners remains a key element of our strategic priorities. Through our MDP program, we will continue to ensure that all of athenaNet is open with application programming interfaces for new generations of innovators and entrepreneurs looking to disrupt the health care industry. Our MDP program consists of three major components: network, marketplace, and accelerator. The MDP Network is comprised of innovative thinkers, entrepreneurs, and startups with a shared mission to improve the state of health care. Just last month, we gathered 75 CEOs from this growing network at our 5th Annual MDP Conference at our Point Lookout facility in Maine. The MDP Marketplace features technology partners with capabilities that integrate with athenaNet, adding value to our overall service offerings and client experience. During Q3 2015, we launched telehealth as a new capability in the MDP Marketplace with our first telehealth partner, Chiron Health.
10
Chiron Health allows practices to integrate fully reimbursed video visits into their existing workflows. With Chiron Health, practices can schedule remote visit appointments in athenaCollector as they would for an in-person visit, and then Chiron Health handles the rest. As of September 30, 2015, we are contracted and live with 49 partners to sell their technology and services to our client base. An additional 28 partners are contracted and ready to start beta testing as we look to rapidly expand the number of partners and capabilities offered on our MDP Marketplace. We are also pleased to announce that we achieved a major milestone this quarter by bringing over 1,200 MDP activations for clients live on at least one solution offered by these MDP Marketplace partners. The number of client activations for MDP Marketplace services has grown 83% year-to-date, bringing total activations to 1,279. Finally, our MDP Accelerator program provides seed funding, free office space, and ongoing mentorship from our experts, advisors, and partners to early-stage companies. Following the same path as Smart Scheduling, both Hale Health and PatientPop, both having joined the Accelerator program last quarter, are now integrated with athenaNet and are featured on the MDP Marketplace. As we enter our second year with the MDP Accelerator program, we plan to broaden our ability to help high-potential companies gain better access to the markets they want to serve. As we expand our services into the inpatient setting, we expect to leverage our Accelerator program to identify companies that target hospitals and health systems as clients and look to bundle these complimentary services with our own. To learn more about our MDP program and partnership opportunities and to explore the athenahealth Marketplace, please visit www.athenahealth.com/disruption.
Recent acquisitions
On January 13, 2015, athenahealth acquired Razor Insights, LLC (“RazorInsights”), a leader in cloud-based electronic health record and financial solutions for rural, critical access, and community hospitals. On January 23, 2015, athenahealth signed an agreement to purchase webOMR, the web-based clinical applications and electronic health record platform developed by Beth Israel Deaconess Medical Center in Boston, Massachusetts. Both acquisitions are expected to accelerate athenahealth’s ability to support the full spectrum of the hospital and health system market. We acquired RazorInsights for $40.0 million, and we purchased webOMR from Beth Israel Deaconess Medical Center for $22.0 million. Our purchase price of the webOMR technology asset is included in capitalized software development costs.
Client Base Discussion
The total number of physicians who have gone live on athenaCollector, our core service offering, is the metric we currently use to define our client base and market share. However, as our client base expands outside the traditional ambulatory market, total active providers—or nodes on our network—will become a more appropriate metric used to define our client base and market share.
During Q3 2015, 87% of all new athenaCollector deals included athenaClinicals, above 79% in Q3 2014. 82% of all new athenaCollector deals included athenaClinicals, athenaCommunicator, and athenaCoordinator. The athenaOne rate of 82% in Q3 2015 compares to 74% in Q3 2014. Among “live” (i.e., implemented and active) athenaCollector clients, adoption of athenaClinicals and athenaCommunicator continues to grow and resulted in continued growth to our installed base across all of our service offerings.
11
athenahealth Service Offering Adoption
athenaCollector Clients
During Q3 2015, total active physicians on athenaCollector grew by 23% year-over-year, to 53,129. On a sequential basis, we added a record 3,953 net new active physicians on athenaCollector, versus 3,420 in Q3 2014. Our quarterly net new physician additions may vary widely due to the number and size of clients that go live in a particular quarter. Furthermore, our larger clients can be more complex and take longer to go live, particularly if our clients request a more phased implementation approach. Total active providers on athenaCollector grew by 22% year-over-year, to 72,314. On a sequential basis, we added a record 4,784 net new active providers on athenaCollector, versus 3,990 in Q3 2014.
athenaClinicals Clients
During Q3 2015, total active physicians live on athenaClinicals grew by 36% year-over-year, to 23,741. On a sequential basis, we added a record 2,818 net new active physicians on athenaClinicals, versus 2,786 in Q3 2014. This equates to an overall adoption rate of 45% of total athenaCollector physicians, up from 41% in Q3 2014. Total active providers on athenaClinicals grew by 35% year-over-year, to 31,071. On a sequential basis, we added a record 3,430 net new active providers on athenaClinicals, versus 3,320 in Q3 2014. We expect the athenaClinicals client base to increase over time due to cross-selling within our existing base and growth in the volume of athenaOne deals.
athenaCommunicator Clients
During Q3 2015, total active physicians live on athenaCommunicator grew by 30% year-over-year, to 38,670. On a sequential basis, we added 3,422 net new active physicians on athenaCommunicator, versus 3,846 in Q3 2014. This equates to an overall adoption rate of 73% of total athenaCollector physicians, up from 69% in Q3 2014. Total active providers on athenaCommunicator grew by 29% year-over-year, to 49,986. On a sequential basis, we added 4,084 net new providers on athenaCommunicator, versus 4,723 in Q3 2014. We expect the athenaCommunicator client base to increase over time due to cross-selling within our existing base and growth in the volume of athenaOne deals.
New Deals
On September 24, 2015, we announced that Summit Medical Group (“SMG”) has selected our cloud-based population health service, athenaCommunicator Enterprise, to enhance care coordination and advance its population health management initiatives. SMG is one of the largest primary care based organizations in East Tennessee with 220 physicians and more than 100 advanced practitioners providing
12
care at 54 practice locations in 12 East Tennessee counties. SMG providers work with Summit Strategic Solutions, a Management Service Organization, to coordinate care for one of East Tennessee’s largest at-risk patient populations.
Client Implementations
Below are the publicly disclosed clients that went live or partially live during Q3 2015:
• | CareWell Urgent Care (~50 providers) went live on our full suite of services, athenaOne, in July 2015. |
• | Beth Israel Deaconess Healthcare (~185 providers) started the phased rollout of our suite of services, athenaOne, across its network of providers and brought the first implementation wave live in Q3 2015. |
• | Trinity Health started the phased rollout of our suite of services, athenaOne, in some of its physician network offices and brought two regional health ministries live in Q3 2015 as planned. |
Growth Discussion
The athenahealth marketing organization encompasses our growth and sales operations, event and partner marketing, inside sales agents (“ISAs”), advertising, corporate communications, and product marketing teams. This organization executes in-market investments in an effort to generate new business opportunities for athenahealth. The athenahealth sales organization includes all quota-carrying sales representatives, as well as our sales team leaders, channel sales team, and sales training and development organization.
The athenahealth team continues to track well against our annual growth goals with strong performance across all three sales segments in the quarter. Notably, year-to-date consolidated bookings growth is tracking well against our 30% annual bookings growth goal. In addition, the Enterprise team continues to grow our population health client base. As a reminder, we repackaged athenaCommunicator Enterprise and athenaCoordinator Enterprise in Q1 2015 to better position us to win in the enterprise segment. We believe that this product repackaging and our ability to target the right prospects and decision makers should not only shorten our sales cycle but help us grow our population health client base. We have added five population health clients, including Summit Medical Group, so far this year and our pipeline continues to grow.
As of September 30, 2015, we have a total of 161 quota-carrying sales representatives, up 13% from September 30, 2014. Our athenahealth-branded services sales force is currently divided into three groups: enterprise, which is dedicated to serving the largest managed care organizations, as well as those with high growth potential; group, which is dedicated to medical practices with seven to 150 physicians; and small group, which is dedicated to medical practices with one to six physicians.
13
Stock-Based Compensation Expense, Amortization of Purchased Intangible Assets, and Reconciliation of Non-GAAP Financial Measures
athenahealth, Inc.
STOCK-BASED COMPENSATION
(Unaudited, in thousands)
Set forth below is a breakout of stock-based compensation impacting the Condensed Consolidated Statements of Income for the three and nine months ended September 30, 2015, and 2014:
Three Months Ended September 30, | Nine Months Ended September 30, | ||||||||||||||
2015 | 2014 | 2015 | 2014 | ||||||||||||
Stock-based compensation charged to Condensed Consolidated Statements of Income: | |||||||||||||||
Direct operating | $ | 3,584 | $ | 2,987 | $ | 10,883 | $ | 8,806 | |||||||
Selling and marketing | 4,162 | 3,652 | 13,745 | 10,878 | |||||||||||
Research and development | 2,164 | 1,499 | 6,707 | 5,298 | |||||||||||
General and administrative | 5,070 | 4,283 | 16,608 | 14,004 | |||||||||||
Total stock-based compensation expense | 14,980 | 12,421 | 47,943 | 38,986 | |||||||||||
Amortization of capitalized stock-based compensation related to software development (1) | 1,244 | 635 | 3,013 | 1,515 | |||||||||||
Total | $ | 16,224 | $ | 13,056 | $ | 50,956 | $ | 40,501 | |||||||
(1) | In addition, for the three months ended September 30, 2015, and 2014, $1.8 million and $1.7 million, respectively, of stock-based compensation was capitalized in the line item Capitalized software costs, net in the Condensed Consolidated Balance Sheets for which $1.2 million and $0.6 million, respectively, of amortization was included in the line item Depreciation and amortization in the Condensed Consolidated Statements of Income. For the nine months ended September 30, 2015, and 2014, $5.4 million and $3.5 million, respectively, of stock-based compensation was capitalized in the line item Capitalized software costs, net in the Condensed Consolidated Balance Sheets for which $3.0 million and $1.5 million, respectively, of amortization was included in the line item Depreciation and amortization in the Condensed Consolidated Statements of Income. |
athenahealth, Inc.
AMORTIZATION OF PURCHASED INTANGIBLE ASSETS
(Unaudited, in thousands)
Set forth below is a breakout of amortization of purchased intangible assets impacting the Condensed Consolidated Statements of Income for the three and nine months ended September 30, 2015, and 2014:
Three Months Ended September 30, | Nine Months Ended September 30, | ||||||||||||||
Amortization of purchased intangible assets allocated to: | 2015 | 2014 | 2015 | 2014 | |||||||||||
Direct operating | $ | 3,662 | $ | 2,534 | $ | 11,177 | $ | 9,189 | |||||||
Selling and marketing | 2,373 | 4,206 | 7,119 | 13,178 | |||||||||||
Total amortization of purchased intangible assets | $ | 6,035 | $ | 6,740 | $ | 18,296 | $ | 22,367 | |||||||
14
athenahealth, Inc.
RECONCILIATION OF NON-GAAP FINANCIAL MEASURES
TO COMPARABLE GAAP MEASURES
(Unaudited, in thousands, except per share amounts)
The following is a reconciliation of the non-GAAP financial measures used by us to describe our financial results determined in accordance with accounting principles generally accepted in the United States of America (“GAAP”). An explanation of these measures is also included below under the heading “Explanation of Non-GAAP Financial Measures.”
While management believes that these non-GAAP financial measures provide useful supplemental information to investors regarding the underlying performance of our business operations, investors are reminded to consider these non-GAAP measures in addition to, and not as a substitute for, financial performance measures prepared in accordance with GAAP. In addition, it should be noted that these non-GAAP financial measures may be different from non-GAAP measures used by other companies, and management may utilize other measures to illustrate performance in the future. Non-GAAP measures have limitations in that they do not reflect all of the amounts associated with our results of operations as determined in accordance with GAAP.
Please note that these figures may not sum exactly due to rounding.
Non-GAAP Adjusted Gross Margin
Set forth below is a presentation of our “Non-GAAP Adjusted Gross Profit” and “Non-GAAP Adjusted Gross Margin,” which represents Non-GAAP Adjusted Gross Profit as a percentage of total revenue.
(unaudited, in thousands) | Three Months Ended | Nine Months Ended | |||||||||||||
September 30, | September 30, | ||||||||||||||
2015 | 2014 | 2015 | 2014 | ||||||||||||
Total revenue | $ | 236,068 | $ | 190,428 | $ | 667,196 | $ | 539,385 | |||||||
Direct operating expense | 94,850 | 79,343 | 269,306 | 226,265 | |||||||||||
Total revenue less direct operating expense | 141,218 | 111,085 | 397,890 | 313,120 | |||||||||||
Add: Stock-based compensation allocated to direct operating expense | 3,584 | 2,987 | 10,883 | 8,806 | |||||||||||
Add: Amortization of purchased intangible assets allocated to direct operating expense | 3,662 | 2,534 | 11,177 | 9,189 | |||||||||||
Non-GAAP Adjusted Gross Profit | $ | 148,464 | $ | 116,606 | $ | 419,950 | $ | 331,115 | |||||||
Non-GAAP Adjusted Gross Margin | 62.9 | % | 61.2 | % | 62.9 | % | 61.4 | % | |||||||
15
Non-GAAP Adjusted EBITDA
Set forth below is a reconciliation of our “Non-GAAP Adjusted EBITDA” and “Non-GAAP Adjusted EBITDA Margin,” which represents Non-GAAP Adjusted EBITDA as a percentage of total revenue.
(unaudited, in thousands) | Three Months Ended | Nine Months Ended | |||||||||||||
September 30, | September 30, | ||||||||||||||
2015 | 2014 | 2015 | 2014 | ||||||||||||
Total revenue | $ | 236,068 | $ | 190,428 | $ | 667,196 | $ | 539,385 | |||||||
GAAP net income (loss) | 5,795 | (1,631 | ) | 6,312 | (11,848 | ) | |||||||||
Add: Provision for (benefit) from income taxes | 3,365 | (853 | ) | 7,412 | (6,074 | ) | |||||||||
Add: Total other (income) expense | (5,970 | ) | 1,218 | (24,523 | ) | 3,935 | |||||||||
Add: Stock-based compensation expense | 14,980 | 12,421 | 47,943 | 38,986 | |||||||||||
Add: Depreciation and amortization | 24,763 | 17,258 | 67,216 | 46,693 | |||||||||||
Add: Amortization of purchased intangible assets | 6,035 | 6,740 | 18,296 | 22,367 | |||||||||||
Add: Integration and transaction costs | — | — | 964 | — | |||||||||||
Add: Lease termination costs | — | — | 4,446 | — | |||||||||||
Non-GAAP Adjusted EBITDA | $ | 48,968 | $ | 35,153 | $ | 128,066 | $ | 94,059 | |||||||
Non-GAAP Adjusted EBITDA Margin | 20.7 | % | 18.5 | % | 19.2 | % | 17.4 | % | |||||||
Non-GAAP Adjusted Operating Income
Set forth below is a reconciliation of our “Non-GAAP Adjusted Operating Income” and “Non-GAAP Adjusted Operating Income Margin,” which represents Non-GAAP Adjusted Operating Income as a percentage of total revenue.
(unaudited, in thousands) | Three Months Ended | Nine Months Ended | |||||||||||||
September 30, | September 30, | ||||||||||||||
2015 | 2014 | 2015 | 2014 | ||||||||||||
Total revenue | $ | 236,068 | $ | 190,428 | $ | 667,196 | $ | 539,385 | |||||||
GAAP net income (loss) | 5,795 | (1,631 | ) | 6,312 | (11,848 | ) | |||||||||
Add: Provision for (benefit) from income taxes | 3,365 | (853 | ) | 7,412 | (6,074 | ) | |||||||||
Add: Total other (income) expense | (5,970 | ) | 1,218 | (24,523 | ) | 3,935 | |||||||||
Add: Stock-based compensation expense | 14,980 | 12,421 | 47,943 | 38,986 | |||||||||||
Add: Amortization of capitalized stock-based compensation related to software development | 1,244 | 635 | 3,013 | 1,515 | |||||||||||
Add: Amortization of purchased intangible assets | 6,035 | 6,740 | 18,296 | 22,367 | |||||||||||
Add: Integration and transaction costs | — | — | 964 | — | |||||||||||
Add: Lease termination costs | — | — | 4,446 | — | |||||||||||
Non-GAAP Adjusted Operating Income | $ | 25,449 | $ | 18,530 | $ | 63,863 | $ | 48,881 | |||||||
Non-GAAP Adjusted Operating Income Margin | 10.8 | % | 9.7 | % | 9.6 | % | 9.1 | % | |||||||
16
Non-GAAP Adjusted Net Income
Set forth below is a reconciliation of our “Non-GAAP Adjusted Net Income” and “Non-GAAP Adjusted Net Income per Diluted Share.”
(unaudited, in thousands) | Three Months Ended | Nine Months Ended | |||||||||||||
September 30, | September 30, | ||||||||||||||
2015 | 2014 | 2015 | 2014 | ||||||||||||
GAAP net income (loss) | $ | 5,795 | $ | (1,631 | ) | $ | 6,312 | $ | (11,848 | ) | |||||
Add: Stock-based compensation expense | 14,980 | 12,421 | 47,943 | 38,986 | |||||||||||
Add: Amortization of capitalized stock-based compensation related to software development | 1,244 | 635 | 3,013 | 1,515 | |||||||||||
Add: Amortization of purchased intangible assets | 6,035 | 6,740 | 18,296 | 22,367 | |||||||||||
Add: Integration and transaction costs | — | — | 964 | — | |||||||||||
Add: Lease termination costs | — | — | 4,446 | — | |||||||||||
Less: Gain on sale of marketable securities | (7,585 | ) | — | (28,656 | ) | — | |||||||||
Sub-total of tax deductible items | 14,674 | 19,796 | 46,006 | 62,868 | |||||||||||
Less: Tax impact of tax deductible items (1) | (5,870 | ) | (7,918 | ) | (18,402 | ) | (25,147 | ) | |||||||
Add: Tax impact resulting from applying non-GAAP tax rate (2) | (299 | ) | 140 | 1,922 | 1,095 | ||||||||||
Non-GAAP Adjusted Net Income | $ | 14,300 | $ | 10,387 | $ | 35,838 | $ | 26,968 | |||||||
Weighted average shares - diluted | 39,536 | 37,999 | 39,476 | 37,783 | |||||||||||
Non-GAAP Adjusted Net Income per Diluted Share | $ | 0.36 | $ | 0.27 | $ | 0.91 | $ | 0.71 | |||||||
(1) | Tax impact calculated using a statutory tax rate of 40%. |
(2) | Represents adjusting the GAAP net loss at a non-GAAP tax rate of 40%. We used a non-GAAP tax rate of 40% to normalize the tax impact to our Non-GAAP Adjusted Net Income per Diluted Share based on the fact that a relatively small change in pre-tax GAAP income (loss) in any one period could result in a volatile GAAP effective tax rate. |
17
(unaudited, in thousands) | Three Months Ended | Nine Months Ended | |||||||||||||
September 30, | September 30, | ||||||||||||||
2015 | 2014 | 2015 | 2014 | ||||||||||||
GAAP net income (loss) per share - diluted | $ | 0.15 | $ | (0.04 | ) | $ | 0.16 | $ | (0.31 | ) | |||||
Add: Stock-based compensation expense | 0.38 | 0.33 | 1.21 | 1.03 | |||||||||||
Add: Amortization of capitalized stock-based compensation related to software development | 0.03 | 0.02 | 0.08 | 0.04 | |||||||||||
Add: Amortization of purchased intangible assets | 0.15 | 0.18 | 0.46 | 0.59 | |||||||||||
Add: Integration and transaction costs | — | — | 0.02 | — | |||||||||||
Add: Lease termination costs | — | — | 0.11 | — | |||||||||||
Less: Gain on sale of marketable securities | (0.19 | ) | — | (0.73 | ) | — | |||||||||
Sub-total of tax deductible items | 0.37 | 0.52 | 1.17 | 1.66 | |||||||||||
Less: Tax impact of tax deductible items (1) | (0.15 | ) | (0.21 | ) | (0.47 | ) | (0.67 | ) | |||||||
Add: Tax impact resulting from applying non-GAAP tax rate (2) | (0.01 | ) | — | 0.05 | 0.03 | ||||||||||
Non-GAAP Adjusted Net Income per Diluted Share | $ | 0.36 | $ | 0.27 | $ | 0.91 | $ | 0.71 | |||||||
Weighted average shares - diluted | 39,536 | 37,999 | 39,476 | 37,783 | |||||||||||
(1) | Tax impact calculated using a statutory tax rate of 40%. |
(2) | Represents adjusting the GAAP net loss at a non-GAAP tax rate of 40%. We used a non-GAAP tax rate of 40% to normalize the tax impact to our Non-GAAP Adjusted Net Income per Diluted Share based on the fact that a relatively small change in pre-tax GAAP income (loss) in any one period could result in a volatile GAAP effective tax rate. |
18
Explanation of Non-GAAP Financial Measures
We report our financial results in accordance with accounting principles generally accepted in the United States of America, or GAAP. However, management believes that, in order to properly understand our short-term and long-term financial and operational trends, investors may wish to consider the impact of certain non-cash or non-recurring items, when used as a supplement to financial performance measures in accordance with GAAP. These items result from facts and circumstances that vary in frequency and impact on continuing operations. Management also uses results of operations before such items to evaluate the operating performance of athenahealth and compare it against past periods, make operating decisions, and serve as a basis for strategic planning. These non-GAAP financial measures provide management with additional means to understand and evaluate the operating results and trends in our ongoing business by eliminating certain non-cash expenses and other items that management believes might otherwise make comparisons of our ongoing business with prior periods more difficult, obscure trends in ongoing operations, or reduce management’s ability to make useful forecasts. Management believes that these non-GAAP financial measures provide additional means of evaluating period-over-period operating performance. In addition, management understands that some investors and financial analysts find this information helpful in analyzing our financial and operational performance and comparing this performance to our peers and competitors.
Management defines “Non-GAAP Adjusted Gross Profit” as total revenue, less direct operating expense, plus (1) stock-based compensation expense allocated to direct operating expense and (2) amortization of purchased intangible assets allocated to direct operating expense, and “Non-GAAP Adjusted Gross Margin” as Non-GAAP Adjusted Gross Profit as a percentage of total revenue. Management considers these non-GAAP financial measures to be important indicators of our operational strength and performance of our business and a good measure of our historical operating trends. Moreover, management believes that these measures enable investors and financial analysts to closely monitor and understand changes in our ability to generate income from ongoing business operations.
Management defines “Non-GAAP Adjusted EBITDA” as the sum of GAAP net income (loss) before provision for (benefit) from income taxes, total other (income) expense, stock-based compensation expense, depreciation and amortization, amortization of purchased intangible assets, integration and transaction costs, and lease termination costs and “Non-GAAP Adjusted EBITDA Margin” as Non-GAAP Adjusted EBITDA as a percentage of total revenue. Management defines “Non-GAAP Adjusted Operating Income” as the sum of GAAP net income (loss) before provision for (benefit) from income taxes, total other (income) expense, stock-based compensation expense, amortization of capitalized stock-based compensation related to software development, amortization of purchased intangible assets, integration and transaction costs, and lease termination costs and “Non-GAAP Adjusted Operating Income Margin” as Non-GAAP Adjusted Operating Income as a percentage of total revenue. Management defines “Non-GAAP Adjusted Net Income” as the sum of GAAP net income (loss) before stock-based compensation expense, amortization of capitalized stock-based compensation related to software development, amortization of purchased intangible assets, integration and transaction costs, lease termination costs, and gain on sale of marketable securities and any tax impact related to these preceding items, and an adjustment to the tax provision for the non-GAAP tax rate and “Non-GAAP Adjusted Net Income per Diluted Share” as Non-GAAP Adjusted Net Income divided by weighted average diluted shares outstanding. Management considers all of these non-GAAP financial measures to be important indicators of our operational strength and performance of our business and a good measure of our historical operating trends, in particular the extent to which ongoing operations impact our overall financial performance.
19
Management excludes or adjusts each of the items identified below from the applicable non-GAAP financial measure referenced above for the reasons set forth with respect to that excluded item:
• | Stock-based compensation expense and amortization of capitalized stock-based compensation related to software development — excluded because these are non-cash expenditures that management does not consider part of ongoing operating results when assessing the performance of our business, and also because the total amount of the expenditure is partially outside of our control because it is based on factors such as stock price, volatility, and interest rates, which may be unrelated to our performance during the period in which the expenses are incurred. |
• | Amortization of purchased intangible assets — purchased intangible assets are amortized over their estimated useful lives and generally cannot be changed or influenced by management after the acquisition. Accordingly, this item is not considered by management in making operating decisions. Management does not believe such charges accurately reflect the performance of our ongoing operations for the period in which such charges are incurred. |
• | Integration and transaction costs — Integration costs are the severance payments and retention bonuses for certain employees relating to the RazorInsights acquisition. Transaction costs are non-recurring costs related to specific transactions. Accordingly, management believes that such expenses do not have a direct correlation to future business operations, and therefore, these costs are not considered by management in making operating decisions. Management does not believe such charges accurately reflect the performance of our ongoing operations for the period in which such charges are incurred. |
• | Lease termination costs — represents costs to terminate certain lease agreements. Management does not believe such costs accurately reflect the performance of our ongoing operations for the period in which such costs are incurred. |
• | Gain on sale of marketable securities — represents gain on sale of marketable securities. Management does not believe such gains accurately reflect the performance of our ongoing operations for the period in which such gains are reported. |
• | Non-GAAP tax rate — We use a non-GAAP tax rate of 40% to normalize the tax impact to our Non-GAAP Adjusted Net Income per Diluted Share based on the fact that a relatively small change in pre-tax GAAP income (loss) in any one period could result in a volatile GAAP effective tax rate. |
20
Supplemental Metrics and Definitions
Fiscal Year 2014 | Fiscal Year 2015 | ||||||||||||||||
Q1 | Q2 | Q3 | Q4 | Q1 | Q2 | Q3 | |||||||||||
Client Base | |||||||||||||||||
Total Physicians on athenaCollector | 37,663 | 39,686 | 43,106 | 45,423 | 47,062 | 49,176 | 53,129 | ||||||||||
Total Providers on athenaCollector | 52,886 | 55,425 | 59,415 | 62,349 | 64,648 | 67,530 | 72,314 | ||||||||||
Total Physicians on athenaClinicals | 13,521 | 14,672 | 17,458 | 18,811 | 19,796 | 20,923 | 23,741 | ||||||||||
Total Providers on athenaClinicals | 18,343 | 19,733 | 23,053 | 24,804 | 26,166 | 27,641 | 31,071 | ||||||||||
Total Physicians on athenaCommunicator | 24,030 | 25,837 | 29,683 | 32,163 | 33,578 | 35,248 | 38,670 | ||||||||||
Total Providers on athenaCommunicator | 31,707 | 33,976 | 38,699 | 41,777 | 43,770 | 45,902 | 49,986 | ||||||||||
Client Performance | |||||||||||||||||
Net Promoter Score | 44.7 | 41.2 | 47.5 | 42.0 | 42.3 | 40.5 | 39.9 | ||||||||||
Client Days in Accounts Receivable (“DAR”) | 41.1 | 39.0 | 39.2 | 38.8 | 41.1 | 40.8 | 40.7 | ||||||||||
First Pass Resolution (“FPR”) Rate | 93.5 | % | 93.7 | % | 93.7 | % | 94.3 | % | 93.7 | % | 94.0 | % | 93.8 | % | |||
Electronic Remittance Advice (“ERA”) Rate | 82.3 | % | 82.6 | % | 82.8 | % | 84.6 | % | 83.2 | % | 82.9 | % | 82.3 | % | |||
Total Claims Submitted | 25,785,710 | 28,177,665 | 29,169,062 | 32,864,269 | 32,809,734 | 35,002,061 | 35,826,192 | ||||||||||
Total Client Collections ($) | 3,172,115,234 | 3,679,375,661 | 3,843,394,756 | 4,263,271,914 | 4,110,989,781 | 4,633,427,941 | 4,803,761,899 | ||||||||||
Total Working Days | 61 | 64 | 64 | 62 | 61 | 64 | 64 | ||||||||||
Employees | |||||||||||||||||
Direct | 1,573 | 1,633 | 1,698 | 1,797 | 1,914 | 2,123 | 2,285 | ||||||||||
Selling & Marketing | 509 | 556 | 569 | 582 | 602 | 649 | 666 | ||||||||||
Research & Development | 717 | 812 | 918 | 952 | 1,010 | 1,172 | 1,262 | ||||||||||
General & Administrative | 289 | 311 | 340 | 345 | 351 | 380 | 407 | ||||||||||
Total Employees | 3,088 | 3,312 | 3,525 | 3,677 | 3,877 | 4,324 | 4,619 | ||||||||||
Quota Carrying Sales Force | |||||||||||||||||
Total Quota Carrying Sales Representatives | 133 | 140 | 142 | 153 | 150 | 151 | 161 | ||||||||||
Supplemental Metrics Definitions | |
Client Base | |
Total Physicians on athenaCollector | The number of physicians that have rendered a service which generated a medical claim that was billed during the last 91 days on the athenaCollector platform. Examples of physicians include Medical Doctors (“MDs”) and Doctors of Osteopathic Medicine (“DOs”). |
Total Providers on athenaCollector | The number of providers, including physicians, that have rendered a service which generated a medical claim that was billed during the last 91 days on the athenaCollector platform. Examples of non-physician providers are Nurse Practitioners (“NPs”) and Registered Nurses (“RNs”). |
Total Physicians on athenaClinicals | The number of physicians that have rendered a service through the athenaClinicals platform which generated a medical claim that was billed during the last 91 days on the athenaCollector platform. |
Total Providers on athenaClinicals | The number of providers, including physicians, that have rendered a service through the athenaClinicals platform which generated a medical claim that was billed during the last 91 days on the athenaCollector platform. |
Total Physicians on athenaCommunicator | The number of physicians that have rendered a service which generated a medical claim that was billed during the last 91 days on the athenaCollector platform and whose practice is actively using athenaCommunicator. |
Total Providers on athenaCommunicator | The number of providers, including physicians, that have rendered a service which generated a medical claim that was billed during the last 91 days on the athenaCollector platform and whose practice is actively using athenaCommunicator. |
Client Performance | |
Net Promoter Score | The percentage of clients who chose 9 or 10 (defined as promoters) less the percentage of clients who chose 0 through 6 ( defined as detractors) on a scale of 1 to 10 when asked if they would recommend athenahealth to a trusted friend or colleague. These responses are generated from a "client listening" survey that the Company conducts for its client base twice per year. |
Client Days in Accounts Receivable (“DAR”) | The average number of days that it takes outstanding balances on claims to be resolved, e.g. paid, for clients on athenaCollector. Clients that have been live less than 90 days are excluded, as well as clients who are terminating services. |
First Pass Resolution (“FPR”) Rate | Approximates the percentage of primary claims that are favorably adjudicated and closed after a single submission during the period. Currently, the FPR rate is calculated on a monthly basis, and certain practices are excluded (e.g. those that have been live for less than 90 days). |
Electronic Remittance Advice (“ERA”) Rate | Remittance refers to the information about payments (a/k/a explanations of benefits) received from insurance companies during the period. The ERA rate reflects the percentage of total charges that were posted using electronic remittance. |
Total Claims Submitted | The number of claims billed through athenaNet during the period. |
Total Client Collections | The dollar value of collections posted on behalf of clients during the period. |
Total Working Days | The total number of days during the quarter minus weekends and U.S. Post Office holidays. |
Employees | |
Direct | The total number of full time equivalent individuals (“FTEs”) employed by athenahealth to support its service operations as of quarter end. This team includes production systems, enrollment services, paper claim submission, claim resolution, clinical operations, professional services, account management, and client services. |
Selling & Marketing | The total number of FTEs employed by athenahealth to support its sales and marketing efforts as of quarter end. This team includes sales representatives, business development staff and the marketing team. |
Research & Development | The total number of FTEs employed by athenahealth to support its research and development efforts as of quarter end. This team includes product development and product management. |
General & Administrative | The total number of FTEs employed by athenahealth to support its general and administrative functions as of quarter end. This team includes finance, human resources, compliance, learning and development, internal audit, corporate technology, recruiting, facilities, and legal. |
Total Employees | The total number of FTEs employed by athenahealth as of quarter end. This number excludes interns and seasonal employees. |
Total Quota Carrying Sales Representatives | The total number of athenahealth-branded services sales representatives who carry quota for net new annual recurring revenue as of quarter end. |
Corporate Scorecard Metrics Definitions | |
Stability | |
Voluntary Turnover | A quarterly average of the number of voluntary terminations divided by starting headcount. Voluntary turnover excludes employees on action plans or employees on counseling out plans. |
Employee Engagement | Quarterly engagement survey results for employees.. Employee engagement results are reported in Q2 and Q4 only. |
Performance | |
Client Days in Accounts Receivable (“DAR”) | The average number of days that it takes outstanding balances on claims to be resolved, e.g. paid, for clients on athenaCollector. Clients that have been live less than 90 days are excluded, as well as clients who are terminating services. |
Closed-Loop Order Rate | The percent of orders that are tied within 90 days of order submission (Non-Rx) and the percent of Rx orders with notification that the prescription was received by the patient based on claim history or refill requests (Rx). |
Satisfaction | |
Net Promoter Score | Survey respondents from athenaOne survey (sample includes all clients live, surveyed on a bi-annual basis) are categorized as detractors (0-6 score for "likelihood to recommend"), passives (7-8), and promoters (9-10). The Net Promoter Score is calculated by subtracting the % of detractors from the % of promoters. |
Financial | |
Bookings | The annualized value of deals sold. |
Total Revenue | Total consolidated revenue. |
Non-GAAP Adjusted Operating Income | Total non-GAAP adjusted operating income. |