Attached files
| file | filename |
|---|---|
| 8-K - FORM 8-K - SYNOVUS FINANCIAL CORP | d94337d8k.htm |
| EX-99.1 - EX-99.1 - SYNOVUS FINANCIAL CORP | d94337dex991.htm |
| EX-99.2 - EX-99.2 - SYNOVUS FINANCIAL CORP | d94337dex992.htm |
| Exhibit 99.3
|
Third Quarter 2015 Results
October 20, 2015
SYNOVUS the bank of here
|
|
Forward-looking statements and use of non-GAAP financial measures Forward Looking Statements
This slide presentation and certain of our other filings with the Securities and Exchange Commission contain statements that constitute “forward-looking statements” within the meaning of, and subject to the protections of, Section 27A of the Securities Act of 1933, as amended, and Section 21E of the Securities Exchange Act of 1934, as amended. All statements other than statements of historical fact are forward-looking statements. You can identify these forward-looking statements through Synovus’ use of words such as “believes,” “anticipates,” “expects,” “may,” “will,” “assumes,” “should,” “predicts,” “could,” “should,” “would,” “intends,” “targets,” “estimates,” “projects,” “plans,” “potential” and other similar words and expressions of the future or otherwise regarding the outlook for Synovus’ future business and financial performance and/or the performance of the banking industry and economy in general. These forward-looking statements include, among others, (1) statements on credit trends and key credit metrics; (2) future loan and deposit growth and deposit ratios; (3) future net interest margin; (4) future non-interest income; (5) future adjusted non-interest expense levels; (6) statements on future retail sales productivity and branch openings; (7) our capital management plan, including our share repurchase program; (8) our strategy and initiatives for future growth; (9) statements related to talent acquisition and its future impact; and (10) our assumptions underlying these expectations . Prospective investors are cautioned that any such forward-looking statements are not guarantees of future performance and involve known and unknown risks and uncertainties which may cause the actual results, performance or achievements of Synovus to be materially different from the future results, performance or achievements expressed or implied by such forward-looking statements. Forward-looking statements are based on the information known to, and current beliefs and expectations of, Synovus’ management and are subject to significant risks and uncertainties. Actual results may differ materially from those contemplated by such forward-looking statements. A number of factors could cause actual results to differ materially from those contemplated by the forward-looking statements in this presentation. Many of these factors are beyond Synovus’ ability to control or predict.
These forward-looking statements are based upon information presently known to Synovus’ management and are inherently subjective, uncertain and subject to change due to any number of risks and uncertainties, including, without limitation, the risks and other factors set forth in Synovus’ filings with the Securities and Exchange Commission, including its Annual Report on Form 10-K for the year ended December 31, 2014 under the captions “Cautionary Notice Regarding Forward-Looking Statements” and “Risk Factors” and in Synovus’ quarterly reports on Form 10-Q and current reports on Form 8-K. We believe these forward-looking statements are reasonable; however, undue reliance should not be placed on any forward-looking statements, which are based on current expectations and speak only as of the date that they are made. We do not assume any obligation to update any forward-looking statements as a result of new information, future developments or otherwise, except as otherwise may be required by law.
Use of Non-GAAP Financial Measures
This slide presentation contains certain non-GAAP financial measures determined by methods other than in accordance with generally accepted accounting principles. Such non-GAAP financial measures include the following: adjusted net income per common share, diluted; adjusted non-interest income; adjusted non-interest expense; adjusted pre-tax, pre-credit costs income; average core deposits; average core deposits excluding average state, county, and municipal deposits; Tier 1 common equity ratio; and the tangible common equity to tangible assets ratio. The most comparable GAAP measures to these measures are net income per common share, diluted; total non-interest income; total non-interest expense; income before income taxes; total deposits; and the ratio of total equity to total assets, respectively. Management uses these non-GAAP financial measures to assess the performance of Synovus’ core business and the strength of its capital position. Synovus believes that these non-GAAP financial measures provide meaningful additional information about Synovus to assist investors in evaluating Synovus’ operating results, financial strength and capitalization. The non-GAAP financial measures should be considered as additional views of the way our financial measures are affected by significant charges for credit costs and other factors. Adjusted net income per common share, diluted and adjusted pre-tax, pre-credit costs income are measures used by management to evaluate core operating results exclusive of credit costs as well as certain income/expenses. Adjusted non-interest expense is a measure utilized by management to measure the success of expense management initiatives focused on reducing recurring controllable operating costs. Average core deposits and average core deposits excluding state, county, and municipal deposits are measures used by management to evaluate organic growth or deposits and the quality of deposits as a funding source. The Tier 1 common equity ratio and the tangible common equity to tangible assets ratio are used by management to assess the strength of our capital position. These non-GAAP financial measures should not be considered as a substitute for operating results determined in accordance with GAAP and may not be comparable to other similarly titled measures of other companies. The computations of the non-GAAP financial measures used in this slide presentation are set forth in the Appendix to this slide presentation.
| 2 |
|
|
|
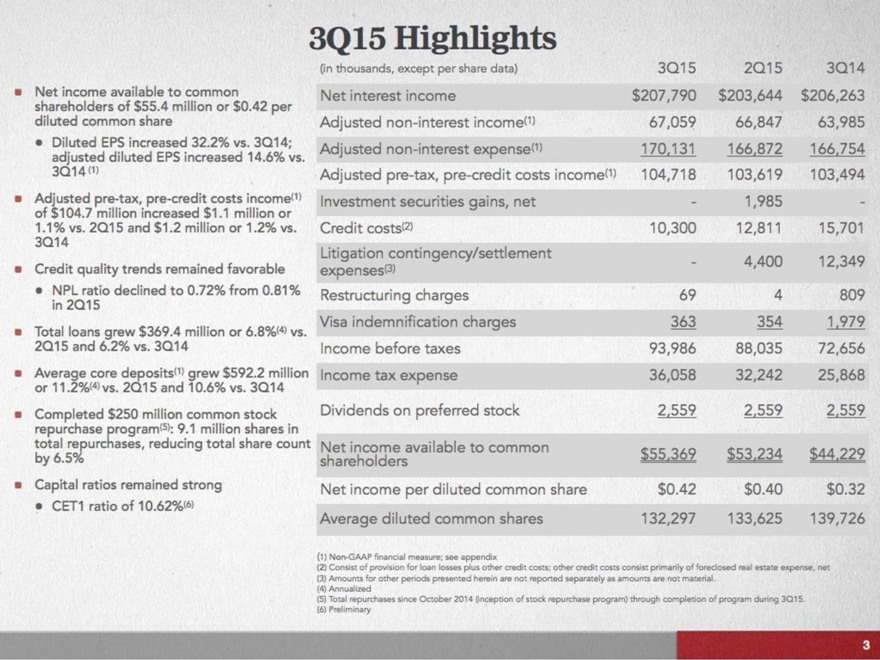
Net income available to common shareholders of $55.4 million or $0.42 per diluted common share
Diluted EPS increased 32.2% vs. 3Q14; adjusted diluted EPS increased 14.6% vs. 3Q14(1)
Adjusted pre-tax, pre-credit costs income(1) of $104.7 million increased $1.1 million or 1.1% vs. 2Q15 and $1.2 million or 1.2% vs. 3Q14
Credit quality trends remained favorable
NPL ratio declined to 0.72% from 0.81% in 2Q15
Total loans grew $369.4 million or 6.8%(4) vs. 2Q15 and 6.2% vs. 3Q14
Average core deposits(1) grew $592.2 million or 11.2%(4) vs. 2Q15 and 10.6% vs. 3Q14
Completed $250 million common stock repurchase program(5): 9.1 million shares in total repurchases, reducing total share count by 6.5%
Capital ratios remained strong
CET1 ratio of 10.62%(6)
3Q15 Highlights
(in thousands, except per share data) 3Q15 2Q15 3Q14
Net interest income $207,790 $203,644 $206,263
Adjusted non-interest income(1) 67,059 66,847 63,985
Adjusted non-interest expense(1) 170,131 166,872 166,754
Adjusted pre-tax, pre-credit costs income(1) 104,718 103,619 103,494
Investment securities gains, net - 1,985 -
Credit costs(2) 10,300 12,811 15,701
Litigation contingency/settlement expenses(3) - 4,400 12,349
Restructuring charges 69 4 809
Visa indemnification charges 363 354 1,979
Income before taxes 93,986 88,035 72,656
Income tax expense 36,058 32,242 25,868
Dividends on preferred stock 2,559 2,559 2,559
Net income available to common shareholders $55,369 $53,234 $44,229
Net income per diluted common share $0.42 $0.40 $0.32
Average diluted common shares 132,297 133,625 139,726
(1) Non-GAAP financial measure; see appendix
(2) Consist of provision for loan losses plus other credit costs; other credit costs consist primarily of foreclosed real estate expense, net
(3) Amounts for other periods presented herein are not reported separately as amounts are not material.
(4) Annualized
(5) Total repurchases since October 2014 (inception of stock repurchase program) through completion of program during 3Q15.
(6) preliminary
3
|
|
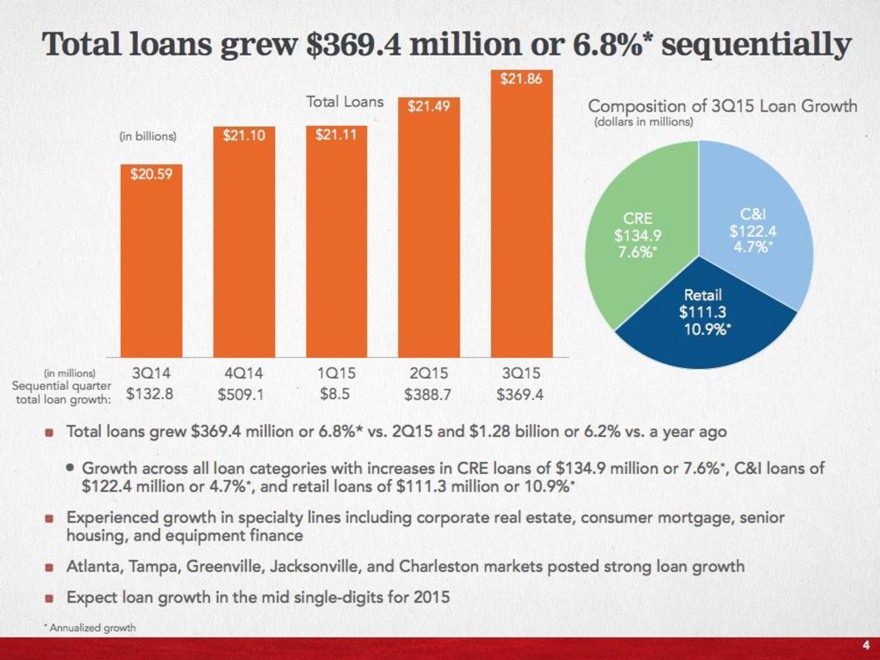
Total loans grew $369.4 million or 6.8%* sequentially
Total Loans
$21.11
(in millions) Sequential quarter total loan growth:
3Q14 4Q14 1Q15 2Q15 3Q15
$132.8 $509.1 $8.5 $388.7 $369.4
Total loans grew $369.4 million or 6.8%* vs. 2Q15 and $1.28 billion or 6.2% vs. a year ago
Growth across all loan categories with increases in CRE loans of $134.9 million or 7.6%*, C&I loans of $122.4 million or 4.7%*, and retail loans of $111.3 million or 10.9%*
Experienced growth in specialty lines including corporate real estate, consumer mortgage, senior housing, and equipment finance
Atlanta, Tampa, Greenville, Jacksonville, and Charleston markets posted strong loan growth
Expect loan growth in the mid single-digits for 2015
* Annualized growth
Composition of 3Q15 Loan Growth (dollars in millions)
(in billions)
$21.86
$21.49
$21.11
$21.10
$20.59
CRE $134.9 7.6%*
C&I $122.4 4.7%*
Retail $111.3 10.9%*
4
|
|
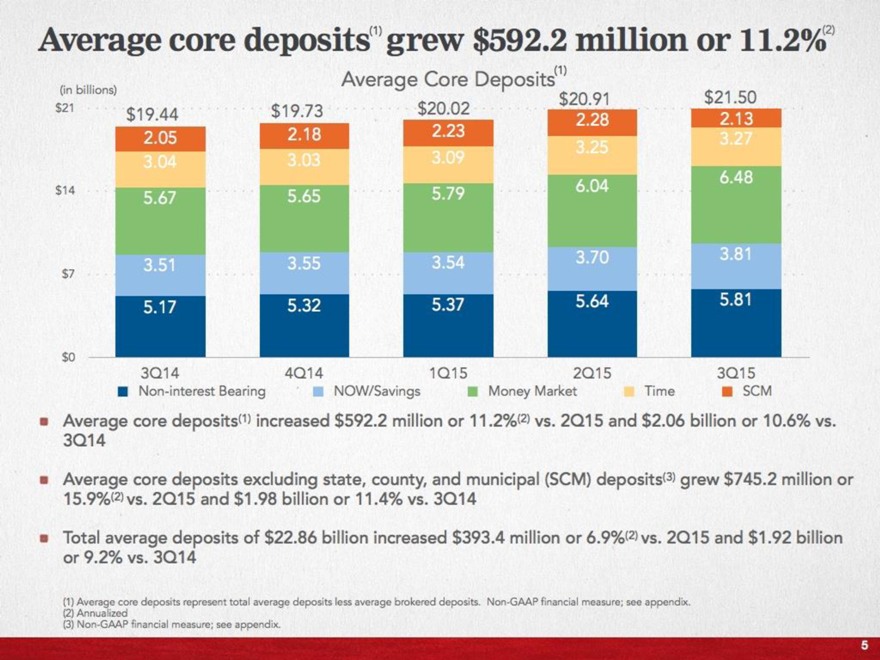
Average core deposits(1) grew $592.2 million or 11.2 %(2)
(in billions)
Average Core Deposits(1)
$21 $14 $7 $0
3Q14 4Q14 1Q15 2Q15 3Q15
$19.44
2.05
3.04
5.67
3.51
5.17
$19.73
2.18
3.03
5.65
3.55
5.32
$20.02
2.23
3.09
5.79
3.54
5.37
$20.91
2.28
6.04
3.70
5.64
$21.50
2.13
3.27
6.48
3.81
5.81
Non-interest Bearing NOW/Savings Money Market Time SCM
Average core deposits(1) increased $592.2 million or 11.2%(2) vs. 2Q15 and $2.06 billion or 10.6% vs. 3Q14
Average core deposits excluding state, county, and municipal (SCM) deposits(3) grew $745.2 million or 15.9%(2) vs. 2Q15 and $1.98 billion or 11.4% vs. 3Q14
Total average deposits of $22.86 billion increased $393.4 million or 6.9%(2) vs. 2Q15 and $1.92 billion or 9.2% vs. 3Q14
(1) Average core deposits represent total average deposits less average brokered deposits. Non-GAAP financial measure; see appendix.
(2) Annualized
(3) Non-GAAP financial measure; see appendix.
5
|
|
Net interest income and net interest margin remain stable
(dollars in millions)
$206.3 $203.6 $207.8
3.37%
3.15%
3.14%
3Q14 2Q15 3Q15
Net Interest income
Net Interest Margin
Net Interest Income Sensitivity
Change in short-term interest rates (in b.p.s)
+200
+ 100
Estimated % increase in net interest income*
7.2%
4.7%
* as compared to unchanged rates (for the next 12 months)
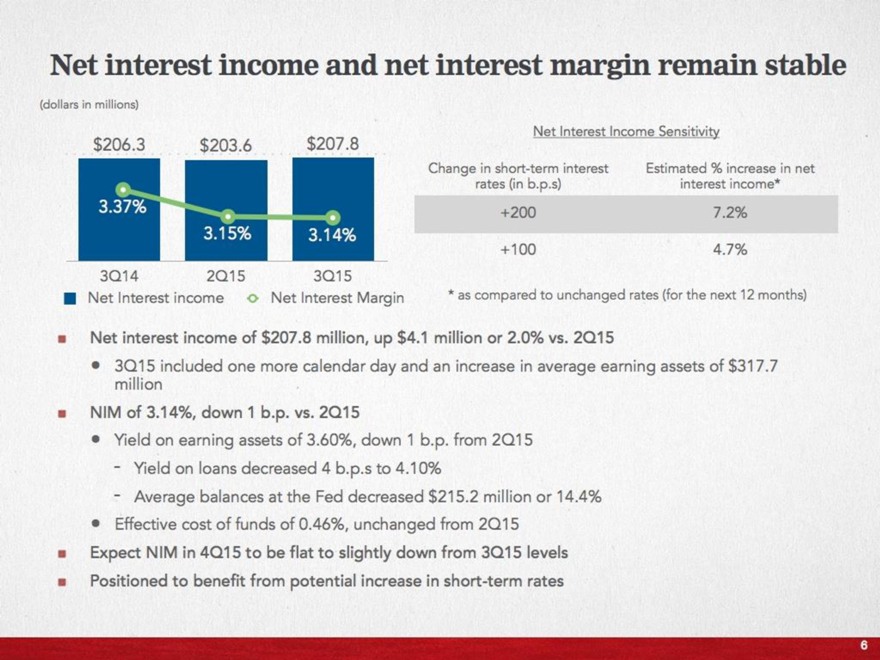
Net interest income of $207.8 million, up $4.1 million or 2.0% vs. 2Q15
3Q15 included one more calendar day and an increase in average earning assets of $317.7 million
NIM of 3.14%, down 1 b.p. vs. 2Q15
Yield on earning assets of 3.60%, down 1 b.p. from 2Q15
- Yield on loans decreased 4 b.p.s to 4.10%
- Average balances at the Fed decreased $215.2 million or 14.4%
Effective cost of funds of 0.46%, unchanged from 2Q15
Expect NIM in 4Q15 to be flat to slightly down from 3Q15 levels
Positioned to benefit from potential increase in short-term rates
6
|
|
Non-interest income reflects higher core banking fees
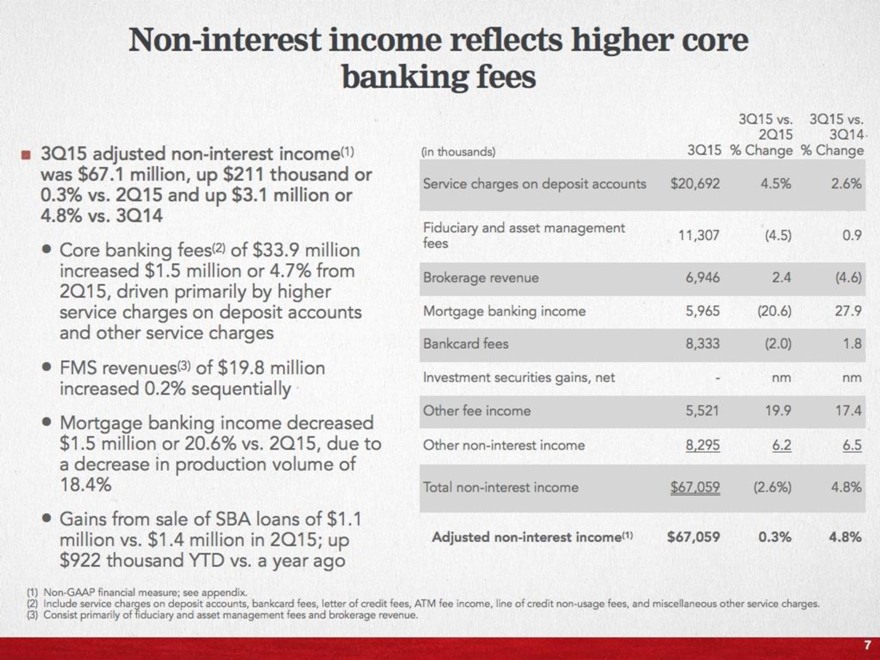
3Q15 adjusted non-interest income1) was $67.1 million, up $211 thousand or 0.3% vs. 2Q15 and up $3.1 million or 4.8% vs. 3Q14
Core banking fees(2) of $33.9 million increased $1.5 million or 4.7% from 2Q15, driven primarily by higher service charges on deposit accounts and other service charges
FMS revenues(3) of $19.8 million increased 0.2% sequentially
Mortgage banking income decreased $1.5 million or 20.6% vs. 2Q15, due to a decrease in production volume of 18.4%
Gains from sale of SBA loans of $1.1 million vs. $1.4 million in 2Q15; up $922 thousand YTD vs. a year ago
(in thousands) 2Q15 3Q14 3Q15 % Change % Change
Service charges on deposit accounts $20,692 4.5% 2.6%
Fiduciary and asset management fees 11,307(4.5) 0.9
Brokerage revenue 6,946 2.4(4.6)
Mortgage banking income 5,965(20.6) 27.9
Bankcard fees 8,333(2.0) 1.8
Investment securities gains, net - nm nm
Other fee income 5,521 19.9 17.4
Other non-interest income 8,295 6.2 6.5
Total non-interest income $67,059(2.6%) 4.8%
Adjusted non-interest income(1) $67,059 0.3% 4.8%
(1) Non.GAAP financial measure; see appendix.
(2) Include service charges on deposit accounts, bankcard fees, letter of credit fees, ATM fee income, line of credit non-usage fees, and miscellaneous other service charges.
(3) Consist primarily of fiduciary and asset management fees and brokerage revenue.
7
|
|
Continued progress on expense management
(in millions)
$560.1
$503.3
$534.6
$504.4
YTD 3Q14 YTD 3Q15
Headcount: 4,563 4,424
Total Non-interest Expense
Adjusted Non-interest Expense*
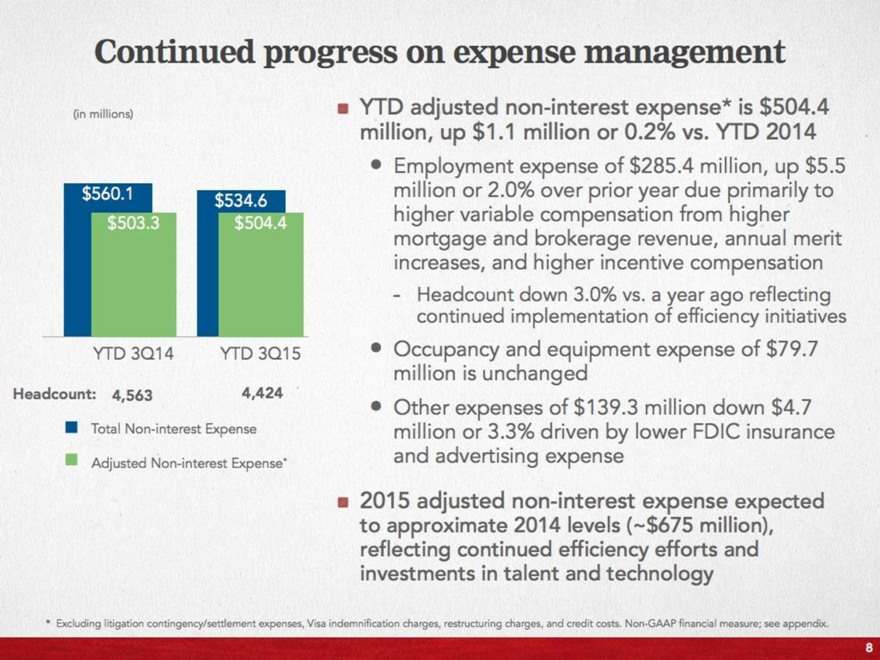
YTD adjusted non-interest expense* is $504.4 million, up $1.1 million or 0.2% vs. YTD 2014
Employment expense of $285.4 million, up $5.5 million or 2.0% over prior year due primarily to higher variable compensation from higher mortgage and brokerage revenue, annual merit increases, and higher incentive compensation
- Headcount down 3.0% vs. a year ago reflecting continued implementation of efficiency initiatives
Occupancy and equipment expense of $79.7 million is unchanged
Other expenses of $139.3 million down $4.7 million or 3.3% driven by lower FDIC insurance and advertising expense
2015 adjusted non-interest expense expected to approximate 2014 levels (~$675 million), reflecting continued efficiency efforts and investments in talent and technology
* Excluding litigation contingency/settlement expenses, Visa indemnification charges, restructuring charges, and credit costs. Non-GAAP financial measure; see appendix.
8
|
|
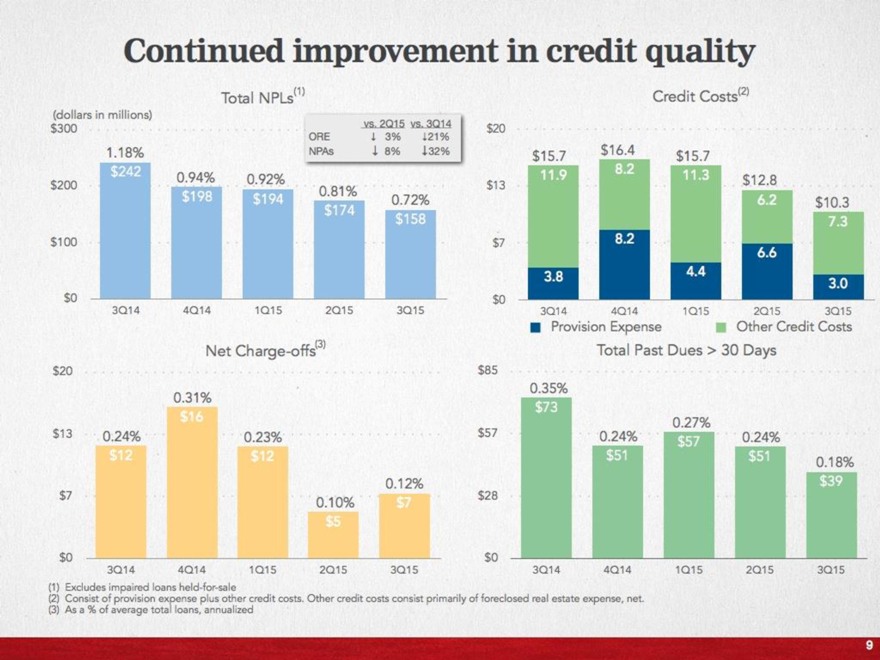
Continued improvement in credit quality
Total NPLs(1) (dollars in millions)
$300
$200
$100
$0
Net Charge-offs (3)
1.18%
$242
0.94%
$198
0.92%
$194
0.81%
$174
0.72%
$158
3Q14 4Q14 1Q15 2Q15 3Q15
Credit Costs (2)
$20
$13
$7
$0
11.9
3.8
8.2
8.2
11.3
4.4
6.2
6.6
7.3
3.0
$15.7
$16.4
$15.7
$12.8
$10.3
3Q14 4Q14 1Q15 2Q15 3Q15
Provision Expense Other Credit Costs
Total Past Dues > 30 Days
Net Charge-offs (3)
$20
$13
$7
$0
0.24%
0.31%
0.23%
0.10%
0.12%
3Q14 4Q14 1Q15 2Q15 3Q15
$12
$16
$12
$5
$7
Total Past Dues > 30 Days
$85
$57
$28
$0
0.35%
$73
0.24%
$51
0.27%
$57
0.24%
$51
0.18%
$39
3Q14 4Q14 1Q15 2Q15 3Q15
(1) Excludes impaired loans held-for-sale
(2) Consist of provision expense plus other credit costs. Other credit costs consist primarily of foreclosed real estate expense, net
(3) As a % of average total loans, annualized
9
|
|
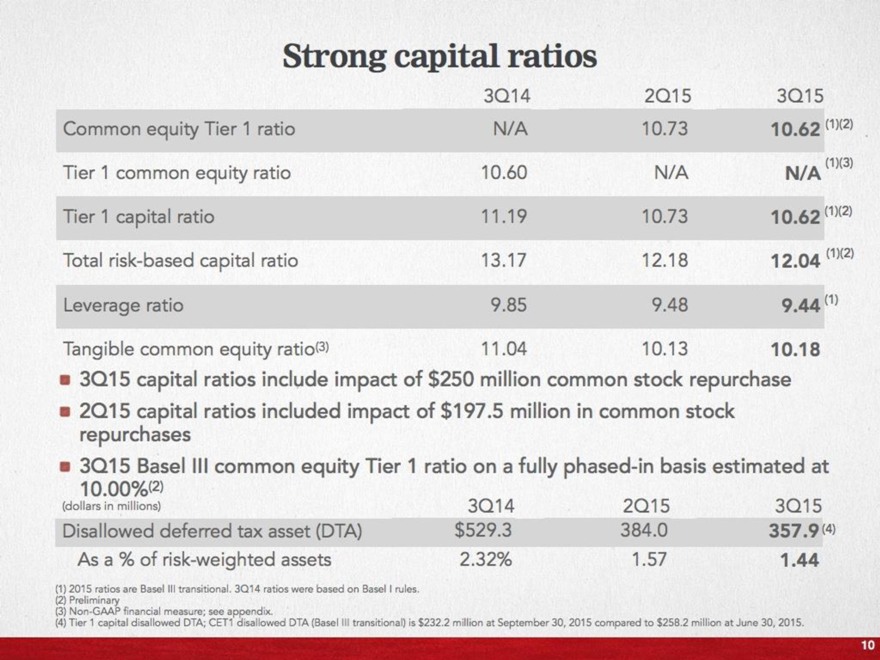
Strong capital ratios
3Q14 2Q15 3Q15
Common equity Tier 1 ratio N/A 10.73 10.62 (1) (2)
Tier 1 common equity ratio 10.60 N/A N/A (1) (3)
Tier 1 capital ratio 11.19 10.73 10.62 (1) (2)
Total risk-based capital ratio 13.17 12.18 12.04 (1) (2)
Leverage ratio 9.85 9.48 9.44 (1)
Tangible common equity ratio (3)) 11.04 10.13 10.18
3Q15 capital ratios include impact of $250 million common stock repurchase
2Q15 capital ratios included impact of $197.5 million in common stock repurchases
3Q15 Basel III common equity Tier 1 ratio on a fully phased-in basis estimated at 10.00%(2)
(dollars in millions) 3Q14 2Q15 3Q15
Disallowed deferred tax asset (DTA) $529.3 384.0 357.9(4)
As a % of risk-weighted assets 2.32% 1.57 1.44
(1) 2015 ratios are Basel III transitional. 3Q14 ratios were based on Basel I rules.
(2) Preliminary
(3) Non-GAAP financial measure; see appendix.
(4) Tier 1 capital disallowed DTA; CET1 disallowed DTA (Basel III transitional) is $232.2 million at September 30, 2015 compared to $258.2 million at June 30, 2015.
10
|
|
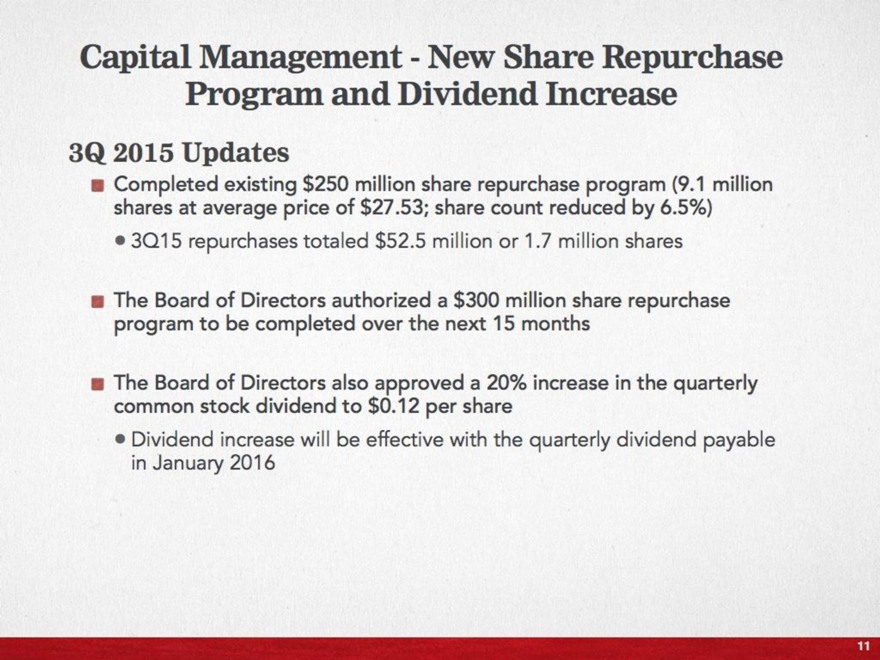
Capital Management - New Share Repurchase Program and Dividend Increase
3Q 2015 Updates
Completed existing $250 million share repurchase program (9.1 million shares at average price of $27.53; share count reduced by 6.5%)
3Q15 repurchases totaled $52.5 million or 1.7 million shares
The Board of Directors authorized a $300 million share repurchase program to be completed over the next 15 months
The Board of Directors also approved a 20% increase in the quarterly common stock dividend to $0.12 per share
Dividend increase will be effective with the quarterly dividend payable in January 2016
11
|
|

Appendix
|
|
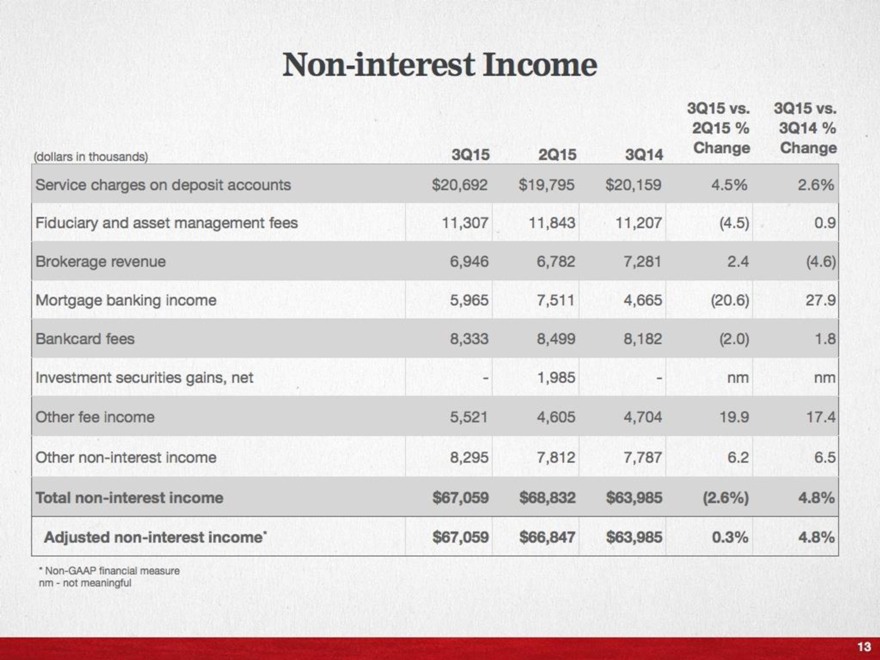
Non-interest Income
(dollars in thousands) 3Q15 2Q15 3Q14 3Q15 vs. 2Q15 % Change 3Q15 vs. 3Q14 % Change
Service charges on deposit accounts $20,692 $19,795 $20,159 4.5% 2.6%
Fiduciary and asset management fees 11,307 11,843 11,207 (4.5) 0.9
Brokerage revenue 6,946 6,782 7,281 2.4 (4.6)
Mortgage banking income 5,965 7,511 4,665 (20.6) 27.9
Bankcard fees 8,333 8,499 8,182 (2.0) 1.8
Investment securities gains, net - 1,985 - nm nm
Other fee income 5,521 4,605 4,704 19.9 17.4
Other non-interest income 8,295 7,812 7,787 6.2 6.5
Total non-interest income $67,059 $68,832 $63,985 (2.6%) 4.8%
Adjusted non-interest income* $67,059 $66,847 $63,985 0.3% 4.8%
* Non-GAAP financial measure
nm - not meaningful
13
|
|
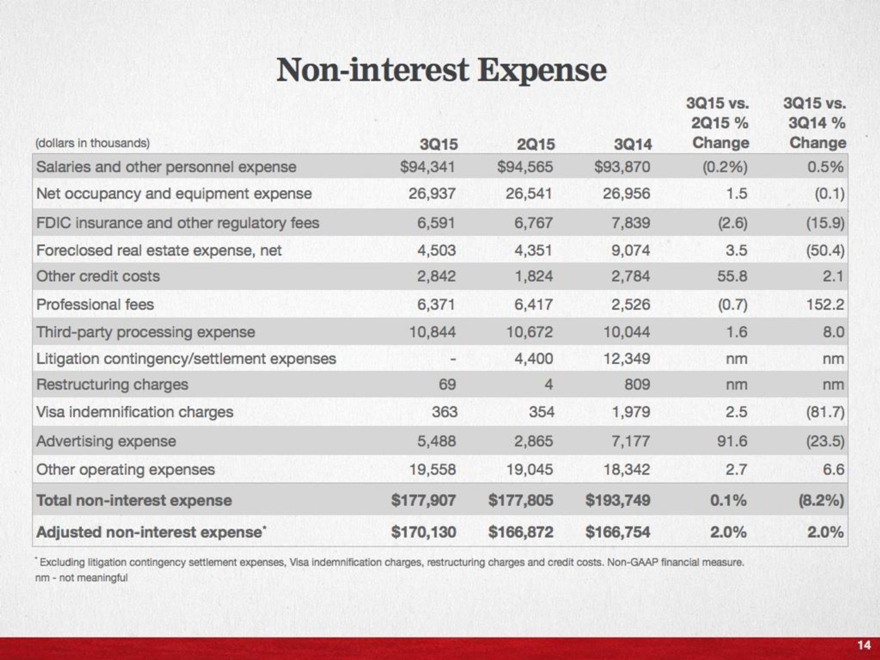
Non-interest Expense
(Dollars in thousands) 3Q15 2Q15 3Q14 3Q15 vs. 2Q15 % Change 3Q15 vs. 3Q14 % Change
Salaries and other personnel expense $94,341 $94,565 $93,870(0.2%) 0.5%
Net occupancy and equipment expense 26,937 26,541 26,956 1.5 (0.1)
FDIC insurance and other regulatory fees 6,591 6,767 7,839 (2.6) (15.9)
Foreclosed real estate expense, net 4,503 4,351 9,074 3.5 (50.4)
Other credit costs 2,842 1,824 2,784 55.8 2.1
Professional fees 6,371 6,417 2,526 (0.7) 152.2
Third-party processing expense 10,844 10,672 10,044 1.6 8.0
Litigation contingency/settlement expenses - 4,400 12,349 nm nm
Restructuring charges 69 4 809 nm nm
Visa indemnification charges 363 354 1,979 2.5 (81.7)
Advertising expense 5,488 2,865 7,177 91.6 (23.5)
Other operating expenses 19,558 19,045 18,342 2.7 6.6
Total non-interest expense $177,907 $177,805 $193,749 0.1% (8.2%)
Adjusted non-interest expense* $170,130 $166,872 $166,754 2.0% 2.0%
* Excluding litigation contingency settlement expenses, Visa indemnification charges, restructuring charges and credit costs. Non-GAAP financial measure.
nm - not meaningful
14
|
|
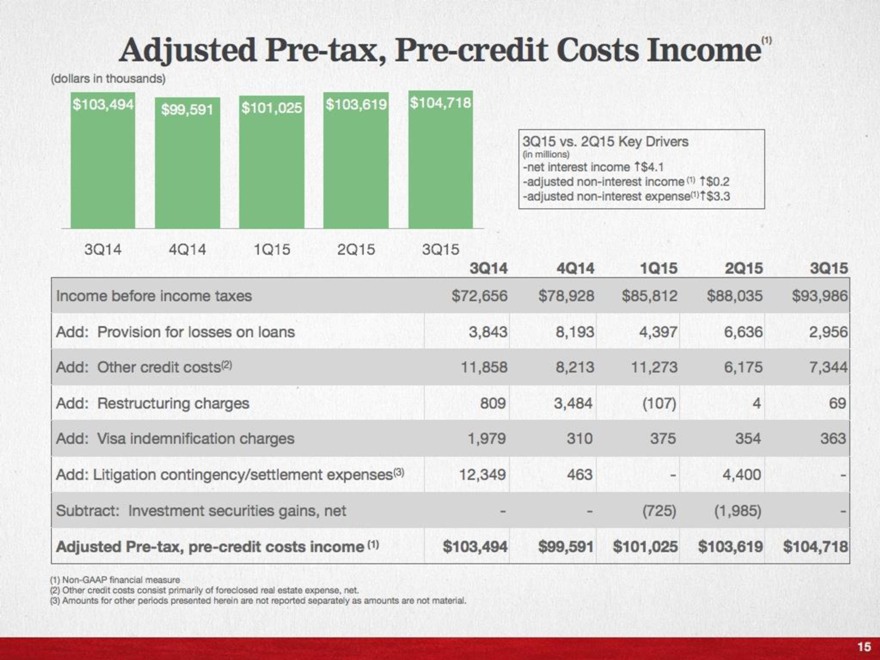
Adjusted Pre-tax, Pre-credit Costs Income(1)
(dollars in thousands)
$103,494 $99,591 $101,025 $103.619 $104,718
3Q14 4Q14 1Q15 2Q15 3Q15
3Q15 vs. 2Q15 Key Drivers (in millions)
- net interest income $4.1
- adjusted non-interest income(1) $0.2
- adjusted non-interest expense(1) $3.3
3Q14 4Q14 1Q15 2Q15 3Q15
INCOME BEFORE INCOME TAXES $72,656 $78,928 $85,812 $88,035 $93,986
ADD: PROVISION FOR LOSSES ON LOANS 3,843 8,193 4,397 6,636 2,956
ADD: OTHER CREDIT COSTS(2) 11,858 8,213 11,273 6,175 7,344
ADD: RESTRUCTURING CHARGES 809 3,484 (107) 4 69
ADD: VISA INDEMNIFICATION CHARGES 1,979 310 375 354 363
ADD: LITIGATION CONTINGENCY/SETTLEMENT EXPENSES(3) 12,349 463 - 4,400 -
SUBTRACT: INVESTMENT SECURITIES GAINS, NET - -(725) (1,985) -
ADJUSTED PRE-TAX, PRE-CREDIT COSTS INCOME(1) $103,494 $99,591 $101,025 $103,619 $104,718
(1) Non-GAAP financial measure
(2) Other credit costs consist primarily of foreclosed real estate expense, net.
(3) Amounts for other periods presented herein are not reported separately as amounts are not material.
15
|
|
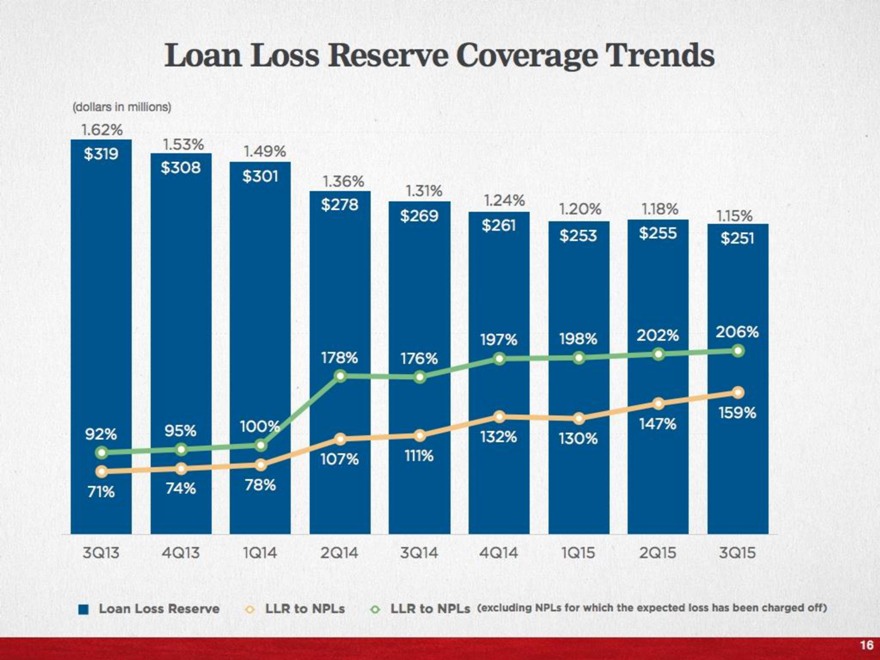
Loan Loss Reserve Coverage Trends
(dollars in millions)
Loan Loss Reserve
LLR to NPLs
LLR to NPLs (excluding NPLs for which the expected loss has been charged off)
1.62%
$319
1.53%
$308
1.49%
$3.01
1.36%
$278
1.31%
$269
1.24%
$261
1.20%
$253
1.18%
$255
1.15%
$251
3Q13 4Q13 1Q14 2Q14 3Q14 4Q14 1Q15 2Q15 3Q15
92% 95% 100% 178% 176% 197% 198% 202% 206%
71% 74% 78% 107% 111% 132% 130% 147% 159%
16
|
|
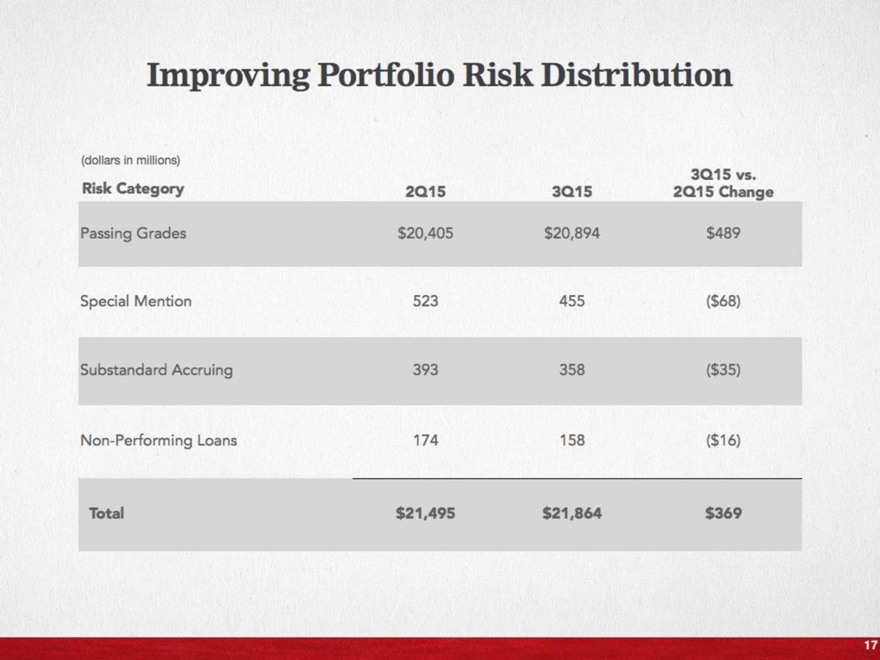
Improving Portfolio Risk Distribution
(dollars in millions)
Risk Category 2Q15 3Q15 3Q15 vs. 2Q15 Change
Passing Grades $20,405 $20,894 $489
Special Mention 523 455($68)
Substandard Accruing 393 358($35)
Non-Performing Loans 174 158($16)
Total $21,495 $21,864 $369
17
|
|
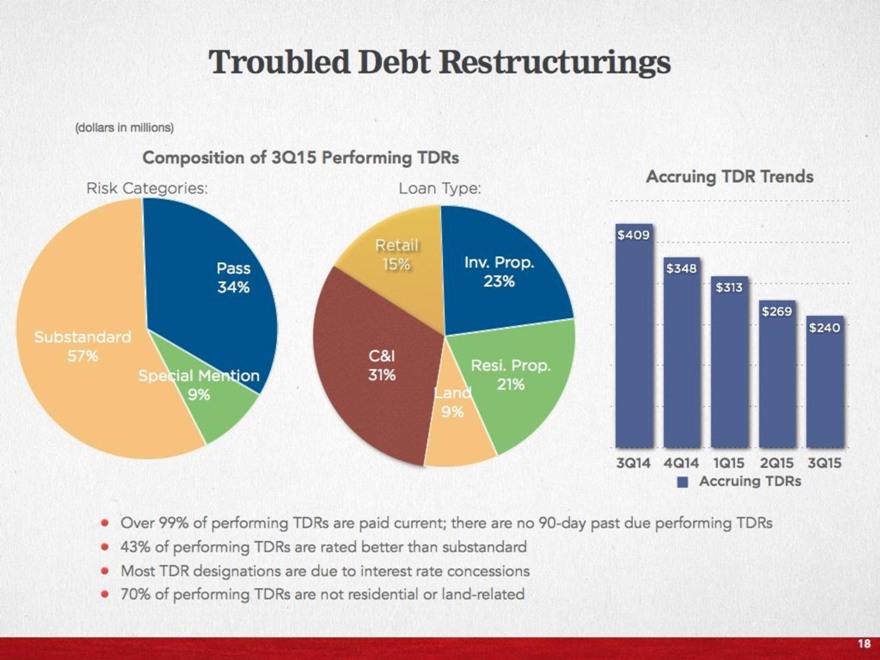
Troubled Debt Restructurings
(dollars in millions)
Composition of 3Q15 Performing TDRs
Risk Categories:
Substandard 57%
Pass 34%
Special Mention 9%
Loan Type:
Retail 15%
C&I 31%
Land 9%
Resi. Prop. 21%
Inv. Prop. 23%
Accruing TDR Trends
3Q14 4Q14 1Q15 2Q15 3Q15
Accruing TDRs
$409
$348
$313
$269
$240
Over 99% of performing TDRs are paid current; there are no 90-day past due performing TDRs
43% of performing TDRs are rated better than substandard
Most TDR designations are due to interest rate concessions
70% of performing TDRs are not residential or land-related
18
|
|
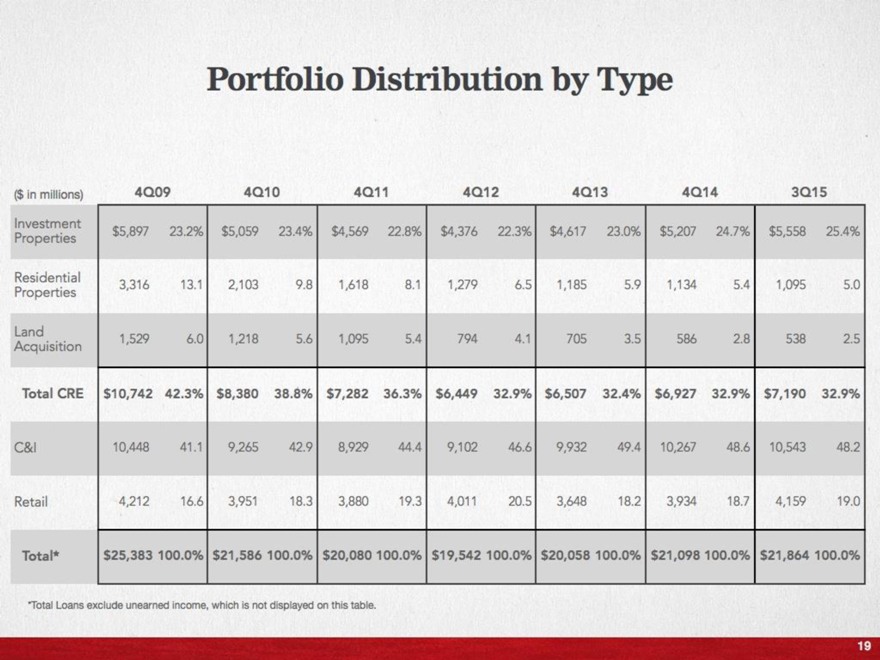
Portfolio Distribution by Type
($ in millions) 4Q09 4Q10 4Q11 4Q12 4Q13 4Q14 3Q15
Investment Properties $5,897 23.2% $5,059 23.4% $4,569 22.8% $4,376 22.3% $4,617 23.0% $5,207 24.7% $5,558 25.4%
Residential Properties 3,316 13.1 2,103 9.8 1,618 8.1 1,279 6.5 1,185 5.9 1,134 5.4 1,095 5.0
Land Acquisition 1,529 6.0 1,218 5.6 1,095 5.4 794 4.1 705 3.5 586 2.8 538 2.5
Total CRE $10,742 42.3% $8,380 38.8% $7,282 36.3% $6,449 32.9% $6,507 32.4% $6,927 32.9% $7,190 32.9%
C&I 10,448 41.1 9,265 42.9 8,929 44.4 9,102 46.6 9,932 49.4 10,267 48.6 10,543 48.2
Retail 4,212 16.6 3,951 18.3 3,880 19.3 4,011 20.5 3,648 18.2 3,934 18.7 4,159 19.0
Total* $25,383 100.0% $21,586 100.0% $20,080 100.0% $19,542 100.0% $20,058 100.0% $21,098 100.0% $21,864 100.0%
* Total Loans exclude unearned income, which is not displayed on this table.
19
|
|
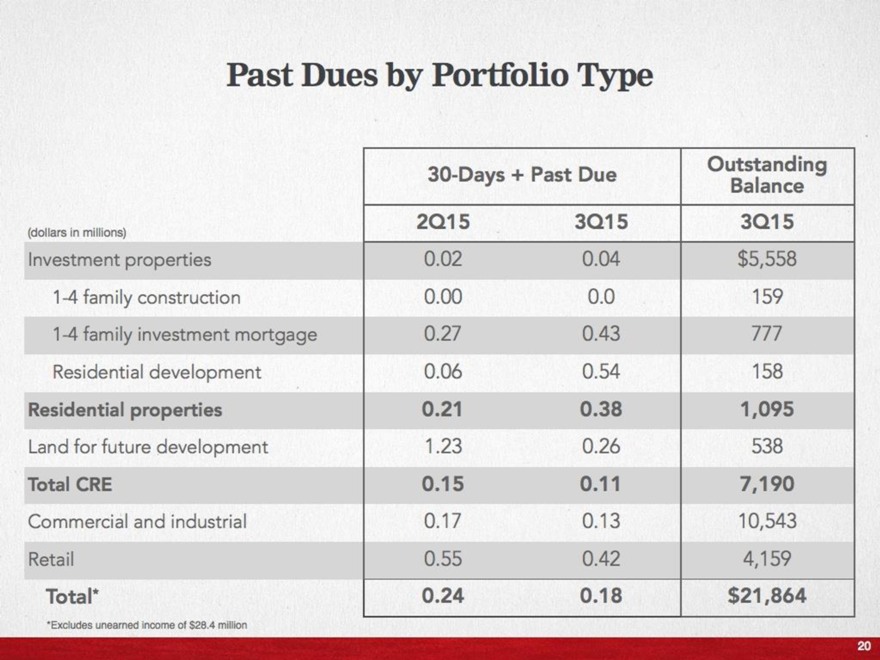
Past Dues by Portfolio Type
30-Days + Past Due Outstanding
Balance
(dollars in millions) 2Q15 3Q15 3Q15
Investment properties 0.02 0.04 $5,558
1-4 family construction 0.00 0.0 159
1-4 family investment mortgage 0.27 0.43 777
Residential development 0.06 0.54 158
Residential properties 0.21 0.38 1,095
Land for future development 1.23 0.26 538
Total CRE 0.15 0.11 7,190
Commercial and industrial 0.17 0.13 10,543
Retail 0.55 0.42 4,159
Total* 0.24 0.18 $21,864
* Excludes unearned income of $28.4 million
20
|
|
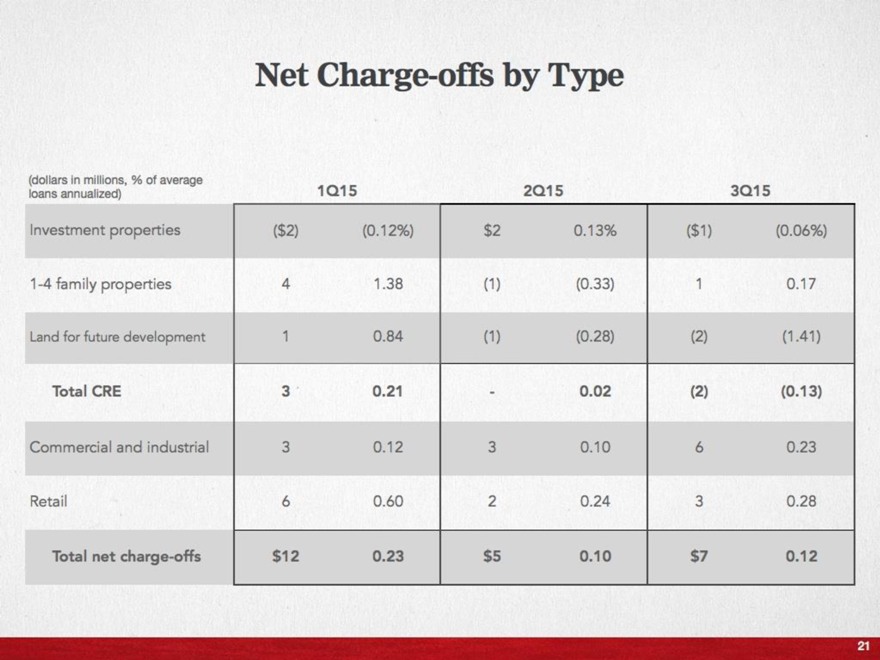
Net Charge-offs by Type
(dollars in millions, % of average loans annualized)
1Q15 2Q15 3Q15
Investment properties ($2) (0.12%) $2 0.13%($1)(0.06%)
1-4 family properties 4 1.38 (1) (0.33) 1 0.17
Land for future development 1 0.84 (1) (0.28) (2) (1.41)
Total CRE 3 0.21 - 0.02 (2) (0.13)
Commercial and industrial 3 0.12 3 0.10 6 0.23
Retail 6 0.60 2 0.24 3 0.28
Total net charge-offs $12 0.23 $5 0.10 $7 0.12
21
|
|
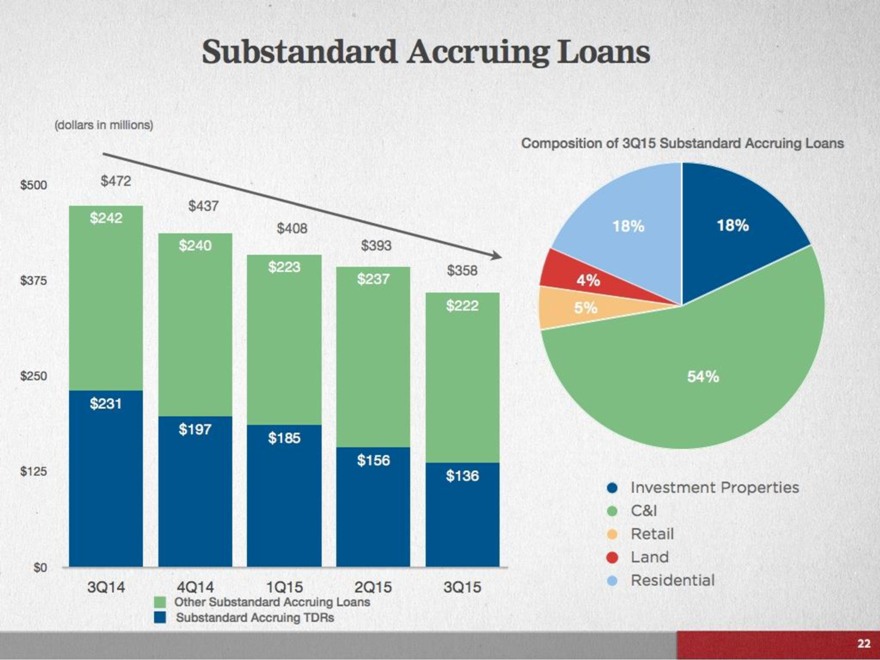
Substandard Accruing Loans
(dollars in millions)
$472
$437
$408
$393
$358
$242
$240
$223
$237
$222
$231
$197
$185
$156
$136
$500
$375
$250
$125
$0
3Q14 4Q14 1Q15 2Q15 3Q15
Other Substandard Accruing Loans
Substandard Accruing TDRs
Composition of 3Q15 Substandard Accruing Loans
18%
4%
5%
54%
18%
Investment Properties
C&I
Retail
Land
Residential
22
|
|
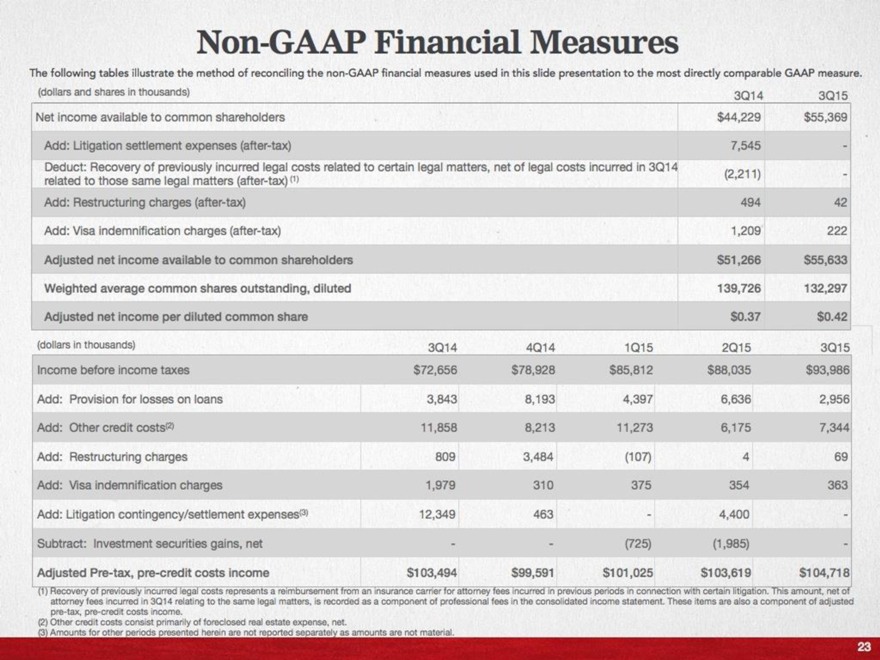
Non-GAAP Financial Measures
The following tables illustrate the method of reconciling the non-GAAP financial measures used in this slide presentation to the most directly comparable GAAP measure.
(dollars and shares in thousands) 3Q14 3Q15
Net income available to common shareholders $44,229 $55,369
Add: Litigation settlement expenses (after-tax) 7,545 -
Deduct: Recovery of previously incurred legal costs related to certain legal matters, net of legal costs incurred in 3Q14 related to those same legal matters (after-tax) (1) (2,211) -
Add: Restructuring charges (after-tax) 494 42
Add: Visa indemnification charges (after-tax) 1,209 222
Adjusted net income available to common shareholders $51,266 $55,633
Weighted average common shares outstanding, diluted 139,726 132,297
Adjusted net income per diluted common share $0.37 $0.42
(dollars in thousands) 3Q14 4Q14 1Q15 2Q15 3Q15
Income before income taxes $72,656 $78,928 $85,812 $88,035 $93,986
Add: Provision for losses on loans 3,843 8,193 4,397 6,636 2,956
Add: Other credit costs(2) 11,858 8,213 11,273 6,175 7,344
Add: Restructuring charges 809 3,484(107) 4 69
Add: Visa indemnification charges 1,979 310 375 354 363
Add: Litigation contingency/settlement expenses(3) 12,349 463 - 4,400 -
Subtract: Investment securities gains, net - -(725) (1,985) -
Adjusted Pre-tax, pre-credit costs income $103,494 $99,591 $101,025 $103,619 $104,718
(1) Recovery of previously incurred legal costs represents a reimbursement from an insurance carrier for attorney fees incurred in previous periods in connection with certain litigation. This amount, net of attorney fees incurred in 3Q14 relating to the same legal matters, is recorded as a component of professional fees in the consolidated income statement. These items are also a component of adjusted pre-tax, pre-credit costs income.
(2) Other credit costs consist primarily of foreclosed real estate expense, net.
(3) Amounts for other periods presented herein are not reported separately as amounts are not material.
23
|
|
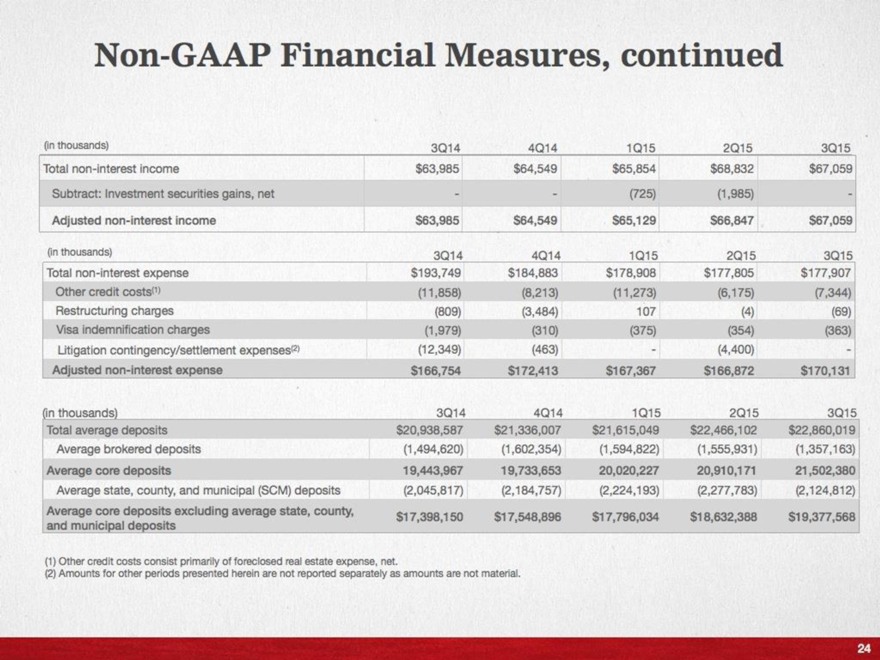
Non-GAAP Financial Measures, continued
(in thousands) 3Q14 4Q14 1Q15 2Q15 3Q15
Total non-interest income $63,985 $64,549 $65,854 $68,832 $67,059
Subtract: Investment securities gains, net - -(725) (1,985) -
Adjusted non-interest income $63,985 $64,549 $65,129 $66,847 $67,059
(in thousands) 3Q14 4Q14 1Q15 2Q15 3Q15
Total non-interest expense $193,749 $184,883 $178,908 $177,805 $177,907
Other credit costs (1) (11,858) (8,213) (11,273) (6,175) (7,344)
Restructuring charges (809) (3,484) 107(4) (69)
Visa indemnification charges (1,979) (310) (375) (354) (363)
Litigation contingency/settlement expenses (2) (12,349) (463) -(4,400) -
Adjusted non-interest expense $166,754 $172,413 $167,367 $166,872 $170,131
[in thousands) 3Q14 4Q14 1Q15 2Q15 3Q15
Total average deposits $20,938,587 $21,336,007 $21,615,049 $22,466,102 $22,860,019
Average brokered deposits (1,494,620) (1,602,354) (1,594,822) (1,555,931) (1,357,163)
Average core deposits 19,443,967 19,733,653 20,020,227 20,910,171 21,502,380
Average state, county, and municipal (SCM) deposits (2,045,817) (2,184,757) (2,224,193) (2,277,783) (2,124,812)
Average core deposits excluding average state, county, and municipal deposits $17,398,150 $17,548,896 $17,796,034 $18,632,388 $19,377,568
(1) Other credit costs consist primarily of foreclosed real estate expense, net.
(2) Amounts for other periods presented herein are not reported separately as amounts are not material.
24
|
|
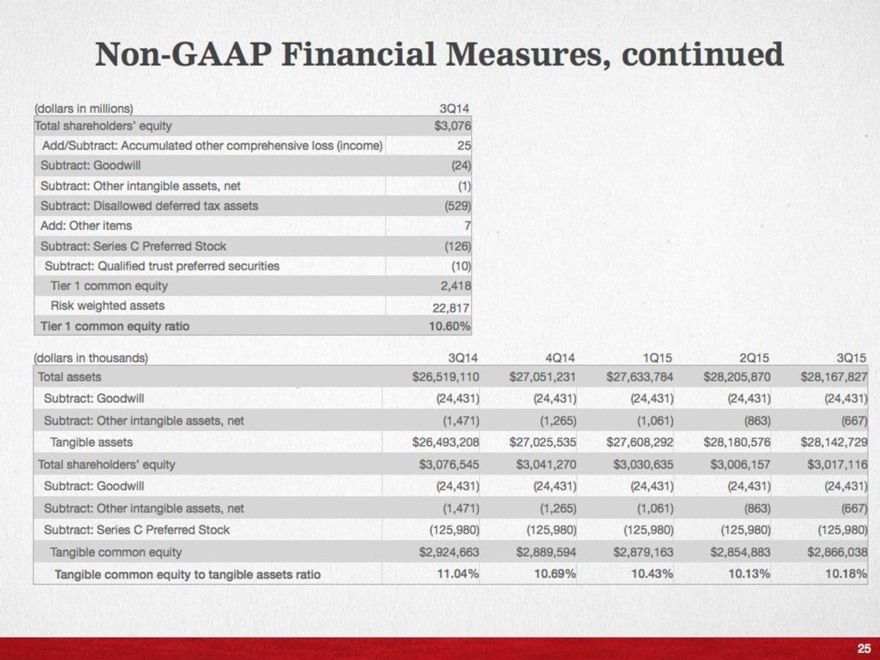
Non-GAAP Financial Measures, continued
(dollars in millions)
3Q14
Total shareholders’ equity $3,076
Add/Subtract: Accumulated other comprehensive loss (income) 25
Subtract: Goodwill (24)
Subtract: Other intangible assets, net (1)
Subtract: Disallowed deferred tax assets (529)
Add: Other items 7
Subtract: Series C Preferred Stock (126)
Subtract: Qualified trust preferred securities (10)
Tier 1 common equity 2,418
Risk weighted assets 22,817
Tier 1 common equity ratio 10.60%
(dollars in thousands) 3Q14 4Q14 1Q15 2Q15 3Q15
Total assets $26,519,110 $27,051,231 $27,633,784 $28,205,870 $28,167,827
Subtract: Goodwill (24,431) (24,431) (24,431) (24,431) (24,431)
Subtract: Other intangible assets, net (1,471) (1,265) (1,061) (863) (667)
Tangible assets $26,493,208 $27,025,535 $27,608,292 $28,180,576 $28,142,729
Total shareholders’ equity $3,076,545 $3,041,270 $3,030,635 $3,006,157 $3,017,116
Subtract: Goodwill (24,431) (24,431) (24,431) (24,431) (24,431)
Subtract: Other intangible assets, net (1,471) (1,265) (1,061) (863) (667)
Subtract: Series C Preferred Stock (125,980) (125,980) (125,980) (125,980) (125,980)
Tangible common equity $2,924,663 $2,889,594 $2,879,163 $2,854,883 $2,866,038
Tangible common equity to tangible assets ratio 11.04% 10.69% 10.43% 10.13% 10.18%
25