Attached files
| file | filename |
|---|---|
| EX-99.1 - EARNINGS RELEASE DATED OCTOBER 20, 2015 - OMNICOM GROUP INC. | e66547ex99-1.htm |
| 8-K - FORM 8-K - OMNICOM GROUP INC. | e66547-8k.htm |
Exhibit 99.2

Third Quarter 2015 Results October 20, 2015 Investor Presentation
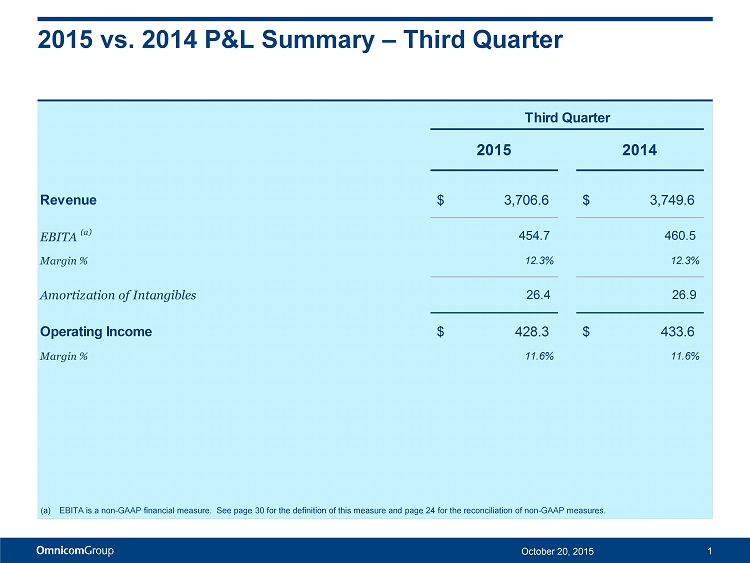
2015 vs. 2014 P&L Summary – Third Quarter 1 (a) EBITA is a non - GAAP financial measure. See page 30 for the definition of this measure and page 24 for the reconciliation of non - GAAP measures. 2015 2014 Revenue $ 3,706.6 $ 3,749.6 EBITA (a) 454.7 460.5 Margin % 12.3% 12.3% Amortization of Intangibles 26.4 26.9 Operating Income $ 428.3 $ 433.6 Margin % 11.6% 11.6% Third Quarter October 20, 2015
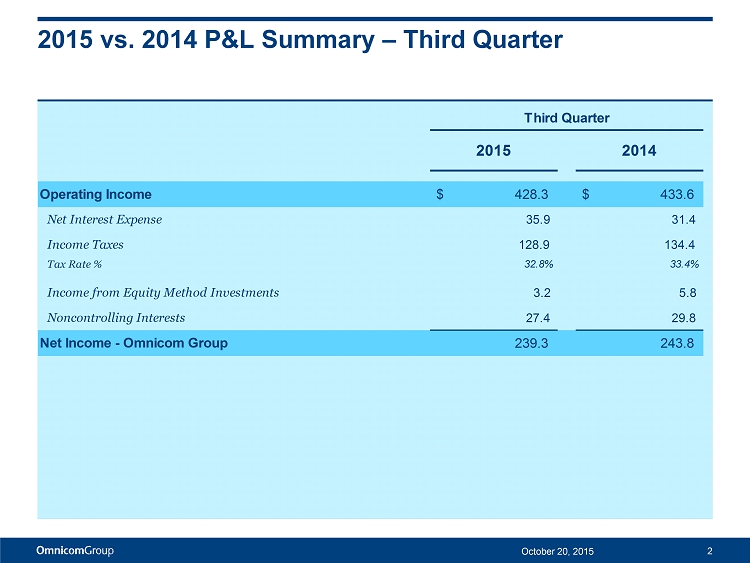
2015 vs. 2014 P&L Summary – Third Quarter 2 2015 2014 Operating Income $ 428.3 $ 433.6 Net Interest Expense 35.9 31.4 Income Taxes 128.9 134.4 Tax Rate % 32.8% 33.4% Income from Equity Method Investments 3.2 5.8 Noncontrolling Interests 27.4 29.8 Net Income - Omnicom Group 239.3 243.8 Third Quarter October 20, 2015
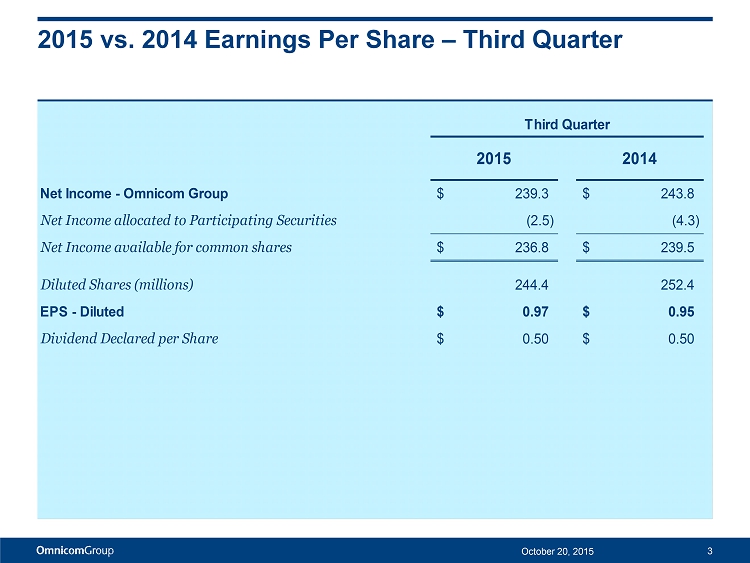
2015 vs. 2014 Earnings Per Share – Third Quarter 3 2015 2014 Net Income - Omnicom Group $ 239.3 $ 243.8 Net Income allocated to Participating Securities (2.5) (4.3) Net Income available for common shares $ 236.8 $ 239.5 Diluted Shares (millions) 244.4 252.4 EPS - Diluted $ 0.97 $ 0.95 Dividend Declared per Share $ 0.50 $ 0.50 Third Quarter October 20, 2015
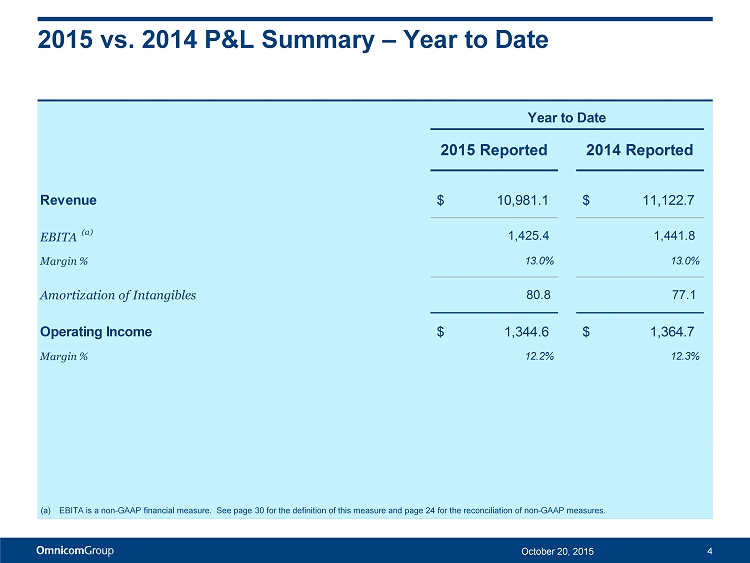
2015 vs. 2014 P&L Summary – Year to Date 4 (a) EBITA is a non - GAAP financial measure. See page 30 for the definition of this measure and page 24 for the reconciliation of non - GAAP measures. 2015 Reported 2014 Reported Revenue $ 10,981.1 $ 11,122.7 EBITA (a) 1,425.4 1,441.8 Margin % 13.0% 13.0% Amortization of Intangibles 80.8 77.1 Operating Income $ 1,344.6 $ 1,364.7 Margin % 12.2% 12.3% Year to Date October 20, 2015
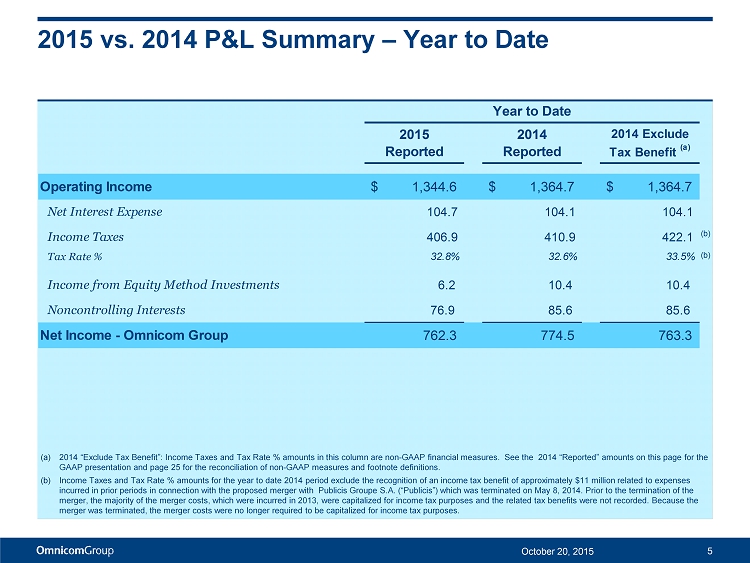
2015 vs. 2014 P&L Summary – Year to Date 5 2015 Reported 2014 Reported 2014 Exclude Tax Benefit (a) Operating Income $ 1,344.6 $ 1,364.7 $ 1,364.7 Net Interest Expense 104.7 104.1 104.1 Income Taxes 406.9 410.9 422.1 (b) Tax Rate % 32.8% 32.6% 33.5% (b) Income from Equity Method Investments 6.2 10.4 10.4 Noncontrolling Interests 76.9 85.6 85.6 Net Income - Omnicom Group 762.3 774.5 763.3 Year to Date (a) 2014 “Exclude Tax Benefit ”: Income Taxes and Tax Rate % amounts in this column are non - GAAP financial measures. See the 2014 “Reported” amounts on this pa ge for the GAAP presentation and page 25 for the reconciliation of non - GAAP measures and footnote definitions. (b) Income Taxes and Tax Rate % amounts for the year to date 2014 period exclude the recognition of an income tax benefit of approximately $11 million related to expenses incurred in prior periods in connection with the proposed merger with Publicis Groupe S.A. (“ Publicis ”) which was terminated on May 8, 2014. Prior to the termination of the merger, the majority of the merger costs, which were incurred in 2013, were capitalized for income tax purposes and the relat ed tax benefits were not recorded. Because the merger was terminated, the merger costs were no longer required to be capitalized for income tax purposes. October 20, 2015
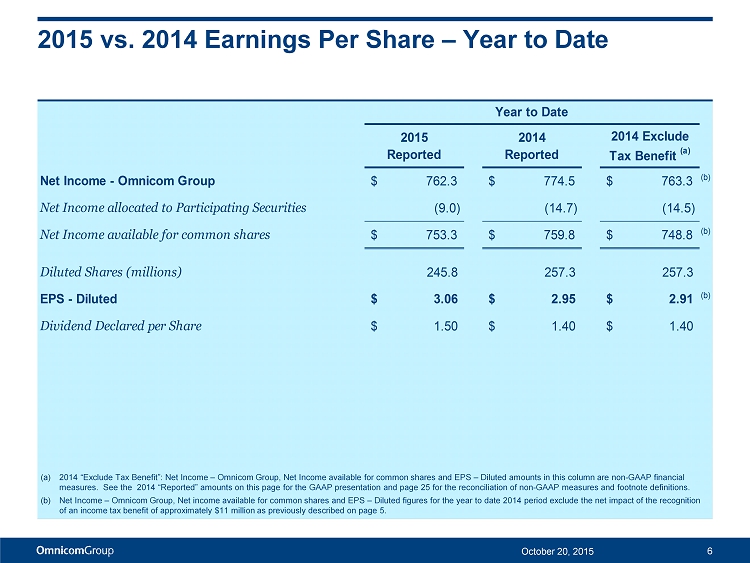
2015 vs. 2014 Earnings Per Share – Year to Date 6 2015 Reported 2014 Reported 2014 Exclude Tax Benefit (a) Net Income - Omnicom Group $ 762.3 $ 774.5 $ 763.3 (b) Net Income allocated to Participating Securities (9.0) (14.7) (14.5) Net Income available for common shares $ 753.3 $ 759.8 $ 748.8 (b) Diluted Shares (millions) 245.8 257.3 257.3 EPS - Diluted $ 3.06 $ 2.95 $ 2.91 (b) Dividend Declared per Share $ 1.50 $ 1.40 $ 1.40 Year to Date (a) 2014 “Exclude Tax Benefit ”: Net Income – Omnicom Group, Net Income available for common shares and EPS – Diluted amounts in this column are non - GAAP financi al measures. See the 2014 “Reported” amounts on this page for the GAAP presentation and page 25 for the reconciliation of non - GAA P measures and footnote definitions. (b) Net Income – Omnicom Group, Net income available for common shares and EPS – Diluted figures for the year to date 2014 period exclude the net impact of the recognition of an income tax benefit of approximately $11 million as previously described on page 5. October 20, 2015
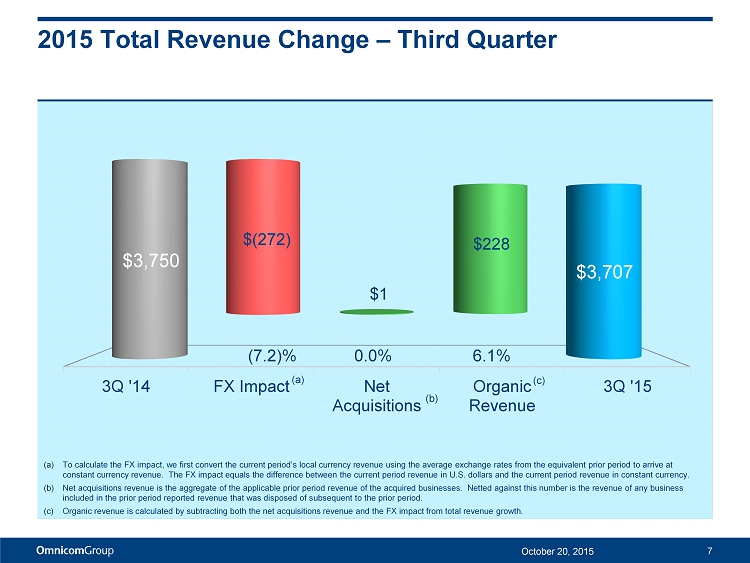
2015 Total Revenue Change – Third Quarter 7 October 20, 2015 (a) To calculate the FX impact, we first convert the current period’s local currency revenue using the average exchange rates fro m t he equivalent prior period to arrive at constant currency revenue. The FX impact equals the difference between the current period revenue in U.S. dollars and the cu rre nt period revenue in constant currency. (b) Net acquisitions revenue is the aggregate of the applicable prior period revenue of the acquired businesses. Netted against thi s number is the revenue of any business included in the prior period reported revenue that was disposed of subsequent to the prior period. (c) Organic revenue is calculated by subtracting both the net acquisitions revenue and the FX impact from total revenue growth. 3Q '14 FX Impact Net Acquisitions Organic Revenue 3Q '15 $3,750 $3,707 $(272) $1 $228 (b) (c) (7.2)% 0.0% 6.1% (a)
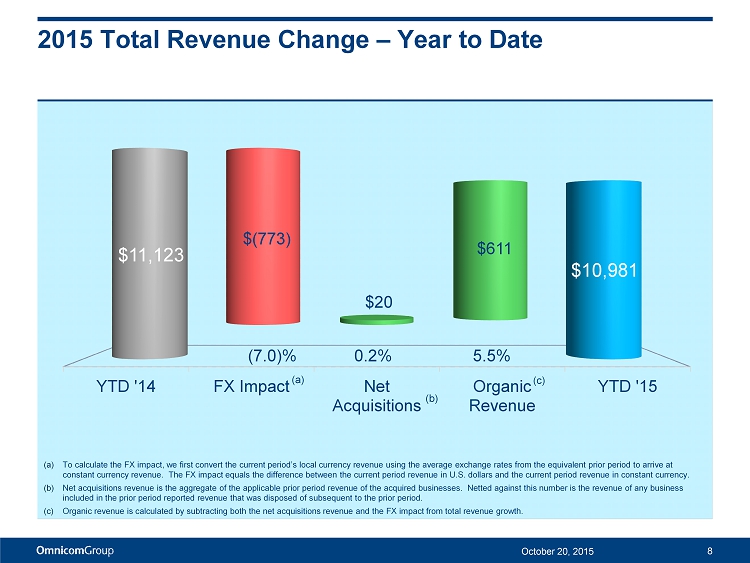
2015 Total Revenue Change – Year to Date 8 October 20, 2015 (a) To calculate the FX impact, we first convert the current period’s local currency revenue using the average exchange rates fro m t he equivalent prior period to arrive at constant currency revenue. The FX impact equals the difference between the current period revenue in U.S. dollars and the cu rre nt period revenue in constant currency. (b) Net acquisitions revenue is the aggregate of the applicable prior period revenue of the acquired businesses. Netted against thi s number is the revenue of any business included in the prior period reported revenue that was disposed of subsequent to the prior period. (c) Organic revenue is calculated by subtracting both the net acquisitions revenue and the FX impact from total revenue growth. YTD '14 FX Impact Net Acquisitions Organic Revenue YTD '15 $11,123 $10,981 $(773) $20 $611 (b) (c) (7.0)% 0.2% 5.5% (a)
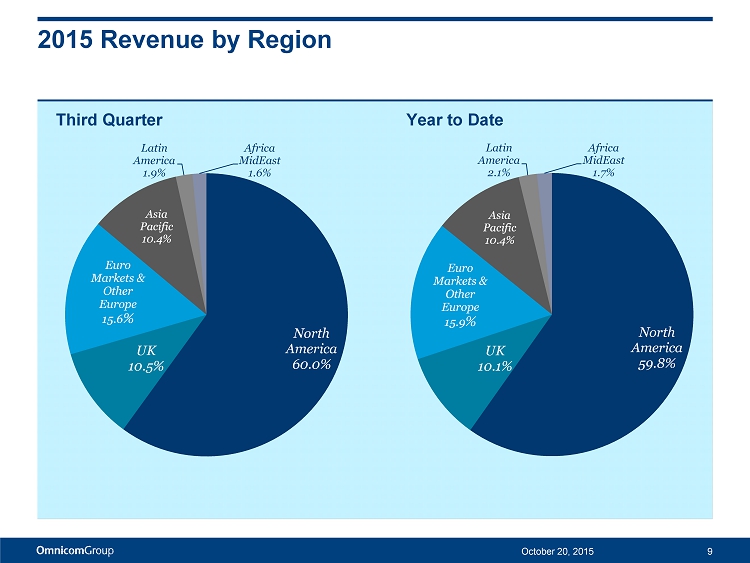
2015 Revenue by Region October 20, 2015 9 Third Quarter North America 60.0% UK 10.5% Euro Markets & Other Europe 15.6 % Asia Pacific 10.4% Latin America 1.9% Africa MidEast 1.6% Year to Date North America 59.8% UK 10.1% Euro Markets & Other Europe 15.9 % Asia Pacific 10.4% Latin America 2.1% Africa MidEast 1.7%
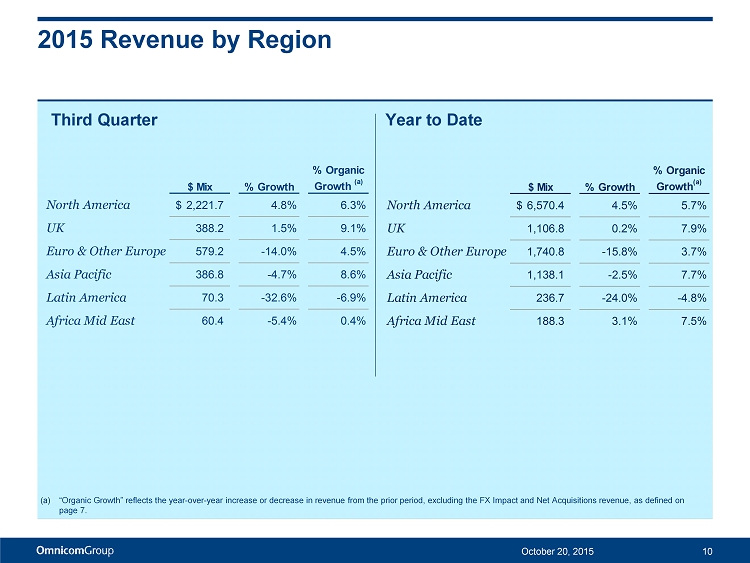
2015 Revenue by Region 10 Third Quarter Year to Date October 20, 2015 $ Mix % Growth % Organic Growth (a) North America 2,221.7$ 4.8% 6.3% UK 388.2 1.5% 9.1% Euro & Other Europe 579.2 -14.0% 4.5% Asia Pacific 386.8 -4.7% 8.6% Latin America 70.3 -32.6% -6.9% Africa Mid East 60.4 -5.4% 0.4% $ Mix % Growth % Organic Growth (a) North America 6,570.4$ 4.5% 5.7% UK 1,106.8 0.2% 7.9% Euro & Other Europe 1,740.8 -15.8% 3.7% Asia Pacific 1,138.1 -2.5% 7.7% Latin America 236.7 -24.0% -4.8% Africa Mid East 188.3 3.1% 7.5% (a) “Organic Growth” reflects the year - over - year increase or decrease in revenue from the prior period, excluding the FX Impact and Net Acquisitions revenue, as defined on page 7.
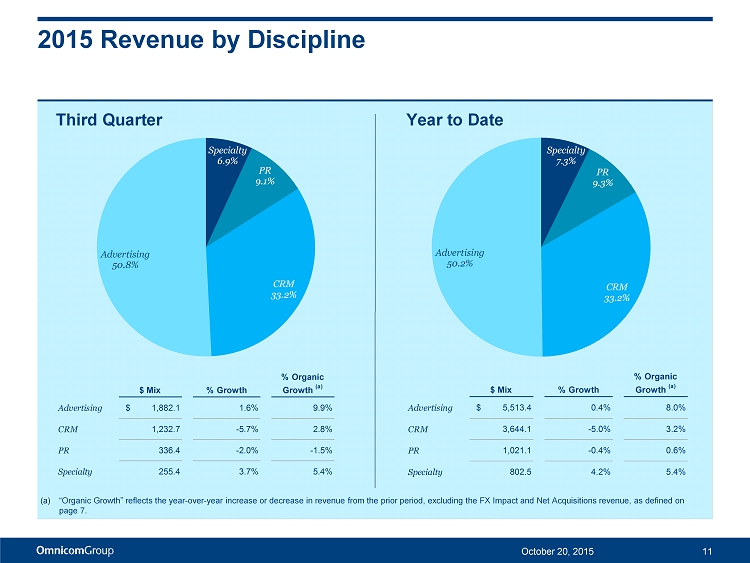
2015 Revenue by Discipline October 20, 2015 11 Third Quarter Specialty 6.9% PR 9.1% CRM 33.2% Advertising 50.8% Specialty 7.3% PR 9.3% CRM 33.2% Advertising 50.2% $ Mix % Growth % Organic Growth (a) Advertising $ 1,882.1 1.6% 9.9% CRM 1,232.7 -5.7% 2.8% PR 336.4 -2.0% -1.5% Specialty 255.4 3.7% 5.4% $ Mix % Growth % Organic Growth (a) Advertising $ 5,513.4 0.4% 8.0% CRM 3,644.1 -5.0% 3.2% PR 1,021.1 -0.4% 0.6% Specialty 802.5 4.2% 5.4% (a) “Organic Growth” reflects the year - over - year increase or decrease in revenue from the prior period, excluding the FX Impact and Net Acquisitions revenue, as defined on page 7. Year to Date
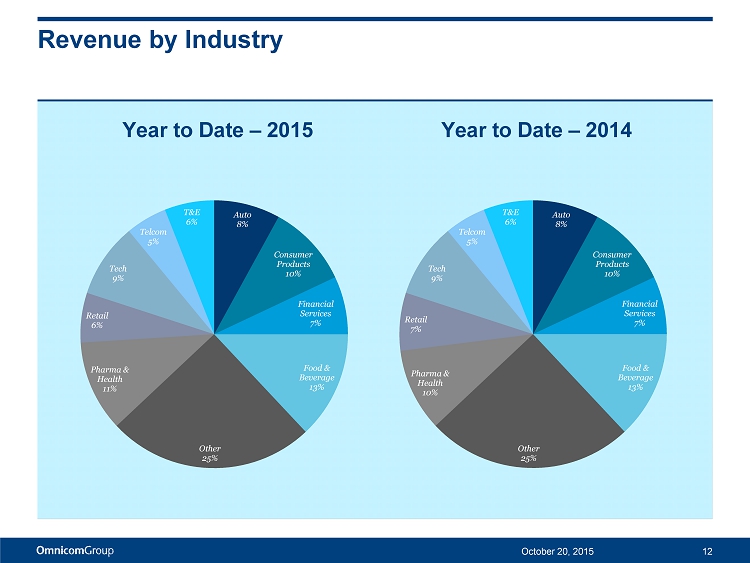
Revenue by Industry October 20, 2015 12 Auto 8% Consumer Products 10% Financial Services 7% Food & Beverage 13% Other 25% Pharma & Health 11% Retail 6% Tech 9% Telcom 5% T&E 6% Auto 8% Consumer Products 10% Financial Services 7% Food & Beverage 13% Other 25% Pharma & Health 10% Retail 7% Tech 9% Telcom 5% T&E 6% Year to Date – 2015 Year to Date – 2014
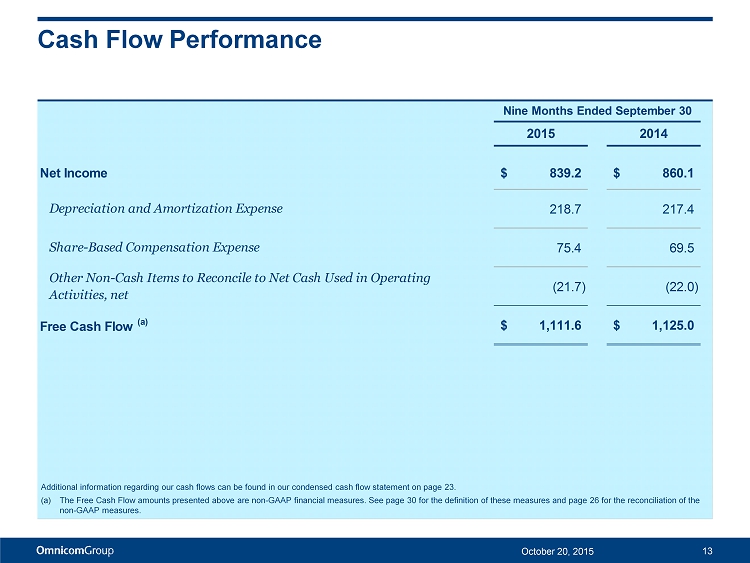
Cash Flow Performance 13 October 20, 2015 2015 2014 Net Income 839.2$ 860.1$ Depreciation and Amortization Expense 218.7 217.4 Share-Based Compensation Expense 75.4 69.5 Other Non-Cash Items to Reconcile to Net Cash Used in Operating Activities, net (21.7) (22.0) Free Cash Flow (a) 1,111.6$ 1,125.0$ Nine Months Ended September 30 Additional information regarding our cash flows can be found in our condensed cash flow statement on page 23. (a) The Free Cash Flow amounts presented above are non - GAAP financial measures. See page 30 for the definition of these measures and page 26 for the reconciliation of the non - GAAP measures.
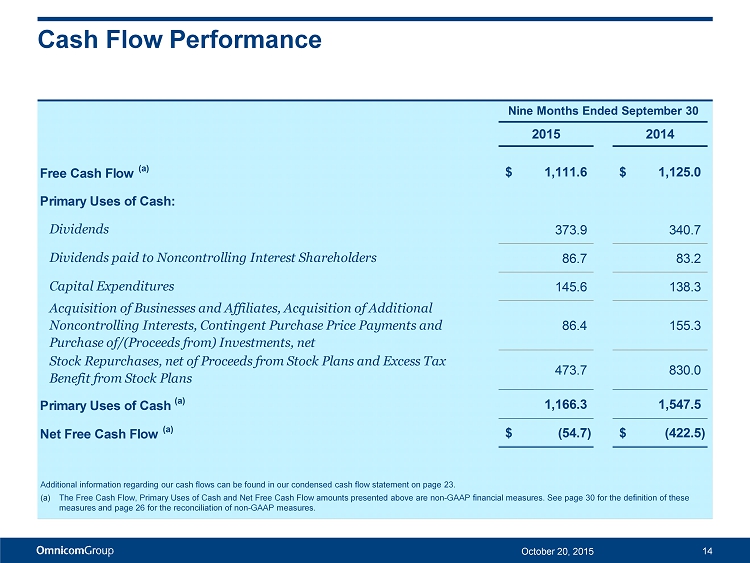
Cash Flow Performance 14 October 20, 2015 2015 2014 Free Cash Flow (a) 1,111.6$ 1,125.0$ Primary Uses of Cash: Dividends 373.9 340.7 Dividends paid to Noncontrolling Interest Shareholders 86.7 83.2 Capital Expenditures 145.6 138.3 Acquisition of Businesses and Affiliates, Acquisition of Additional Noncontrolling Interests, Contingent Purchase Price Payments and Purchase of/(Proceeds from) Investments, net 86.4 155.3 Stock Repurchases, net of Proceeds from Stock Plans and Excess Tax Benefit from Stock Plans 473.7 830.0 Primary Uses of Cash (a) 1,166.3 1,547.5 Net Free Cash Flow (a) (54.7)$ (422.5)$ Nine Months Ended September 30 Additional information regarding our cash flows can be found in our condensed cash flow statement on page 23. (a) The Free Cash Flow, Primary Uses of Cash and Net Free Cash Flow amounts presented above are non - GAAP financial measures. See pag e 30 for the definition of these measures and page 26 for the reconciliation of non - GAAP measures.
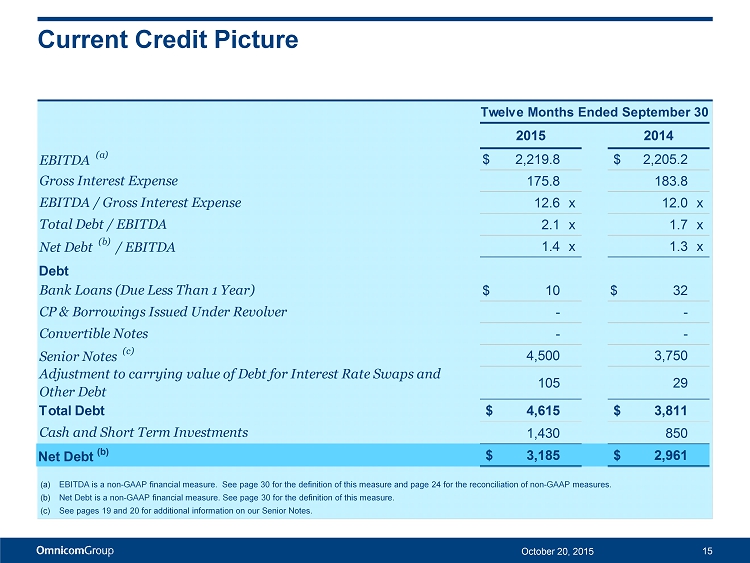
Current Credit Picture 15 October 20, 2015 (a) EBITDA is a non - GAAP financial measure. See page 30 for the definition of this measure and page 24 for the reconciliation of no n - GAAP measures. (b) Net Debt is a non - GAAP financial measure. See page 30 for the definition of this measure. (c) See pages 19 and 20 for additional information on our Senior Notes. 2015 2014 EBITDA (a) $ 2,219.8 $ 2,205.2 Gross Interest Expense 175.8 183.8 EBITDA / Gross Interest Expense 12.6 x 12.0 x Total Debt / EBITDA 2.1 x 1.7 x Net Debt (b) / EBITDA 1.4 x 1.3 x Debt Bank Loans (Due Less Than 1 Year) $ 10 $ 32 CP & Borrowings Issued Under Revolver - - Convertible Notes - - Senior Notes (c) 4,500 3,750 Adjustment to carrying value of Debt for Interest Rate Swaps and Other Debt 105 29 Total Debt $ 4,615 $ 3,811 Cash and Short Term Investments 1,430 850 Net Debt (b) $ 3,185 $ 2,961 Twelve Months Ended September 30
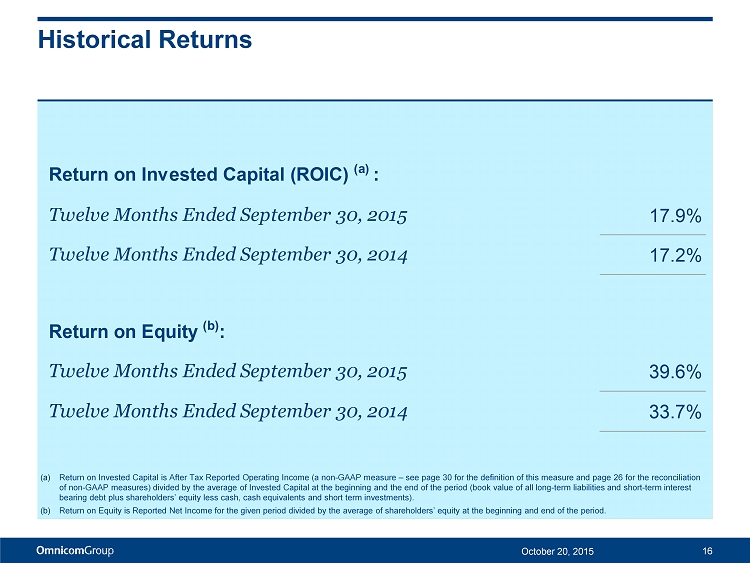
Historical Returns 16 October 20, 2015 Return on Invested Capital (ROIC) (a) : Twelve Months Ended September 30, 2015 17.9% Twelve Months Ended September 30, 2014 17.2% Return on Equity (b) : 15 Twelve Months Ended September 30, 2015 39.6% Twelve Months Ended September 30, 2014 33.7% (a) Return on Invested Capital is After Tax Reported Operating Income (a non - GAAP measure – see page 30 for the definition of this m easure and page 26 for the reconciliation of non - GAAP measures) divided by the average of Invested Capital at the beginning and the end of the period (book value of all long - term liabilities and short - term interest bearing debt plus shareholders’ equity less cash, cash equivalents and short term investments). (b) Return on Equity is Reported Net Income for the given period divided by the average of shareholders’ equity at the beginning and end of the period.
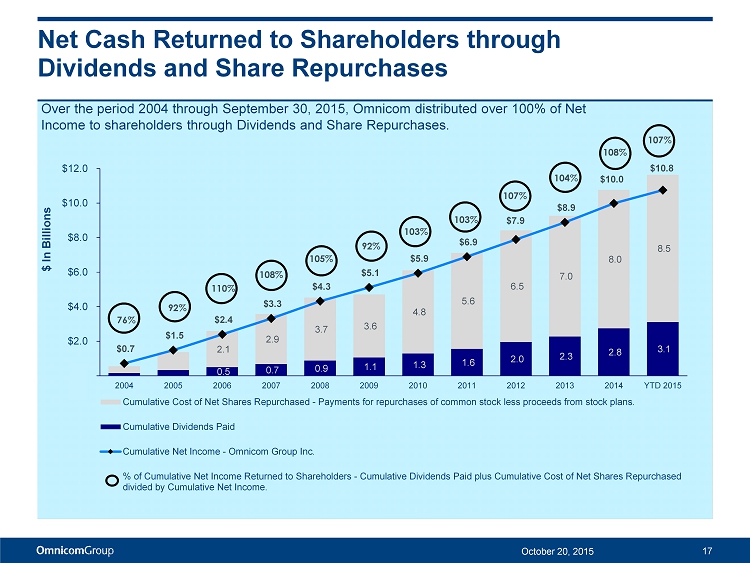
Net Cash Returned to Shareholders through Dividends and Share Repurchases 17 October 20, 2015 0.5 0.7 0.9 1.1 1.3 1.6 2.0 2.3 2.8 3.1 2.1 2.9 3.7 3.6 4.8 5.6 6.5 7.0 8.0 8.5 $0.7 $1.5 $2.4 $3.3 $4.3 $5.1 $5.9 $6.9 $7.9 $8.9 $10.0 $10.8 76 % 92 % 110% 108% 105% 92 % 103 % 103% 107% 104% 108% 107% $- $2.0 $4.0 $6.0 $8.0 $10.0 $12.0 2004 2005 2006 2007 2008 2009 2010 2011 2012 2013 2014 YTD 2015 Cumulative Cost of Net Shares Repurchased - Payments for repurchases of common stock less proceeds from stock plans. Cumulative Dividends Paid Cumulative Net Income - Omnicom Group Inc. % of Cumulative Net Income Returned to Shareholders - Cumulative Dividends Paid plus Cumulative Cost of Net Shares Repurchased divided by Cumulative Net Income. Over the period 2004 through September 30, 2015, Omnicom distributed over 100% of Net Income to shareholders through Dividends and Share Repurchases . $ In Billions
Supplemental Financial Information October 20, 2015 18
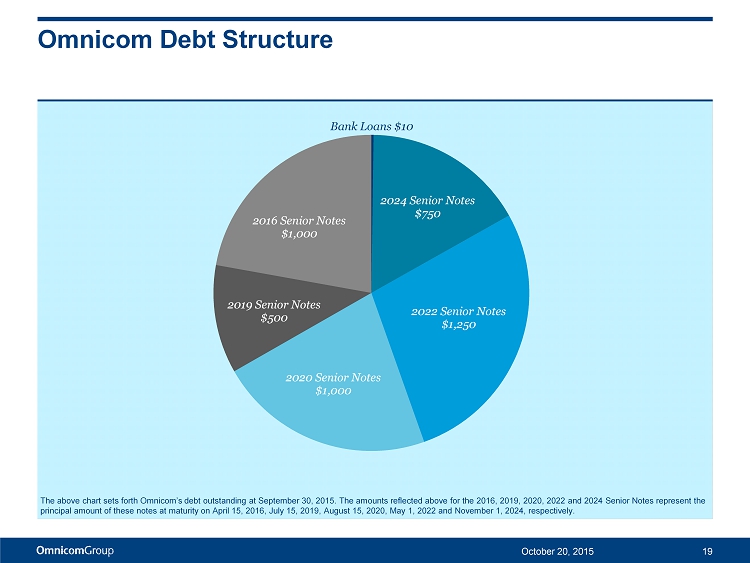
Omnicom Debt Structure Bank Loans $10 2024 Senior Notes $750 2022 Senior Notes $1,250 2020 Senior Notes $1,000 2019 Senior Notes $500 2016 Senior Notes $1,000 19 October 20, 2015 The above chart sets forth Omnicom’s debt outstanding at September 30, 2015. The amounts reflected above for the 2016, 2019, 2020, 2022 and 2024 Senior Notes represent the principal amount of these notes at maturity on April 15, 2016, July 15, 2019, August 15, 2020, May 1, 2022 and November 1, 2024, respectively.
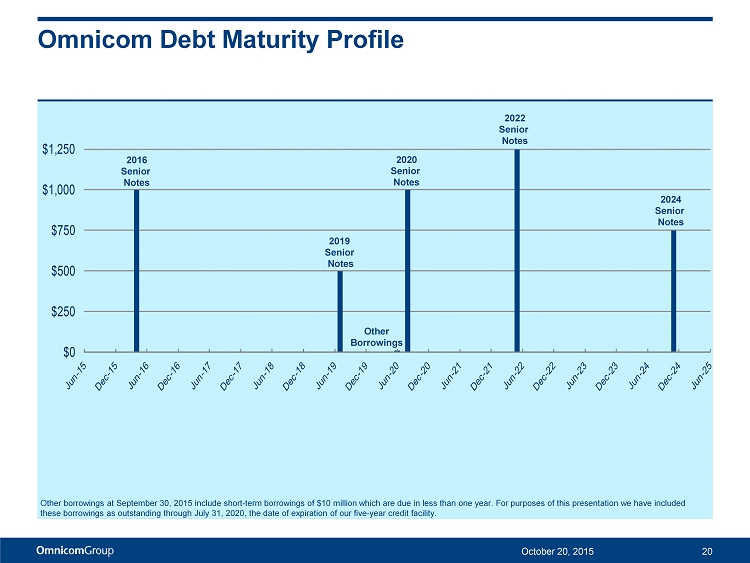
Omnicom Debt Maturity Profile 20 October 20, 2015 Other borrowings at September 30, 2015 include short - term borrowings of $10 million which are due in less than one year. For purposes of this presentation we have included these borrowings as outstanding through July 31, 2020, the date of expiration of our five - year credit facility. $0 $250 $500 $750 $1,000 $1,250 2016 Senior Notes Other Borrowings 2019 Senior Notes 2022 Senior Notes 2020 Senior Notes 2024 Senior Notes
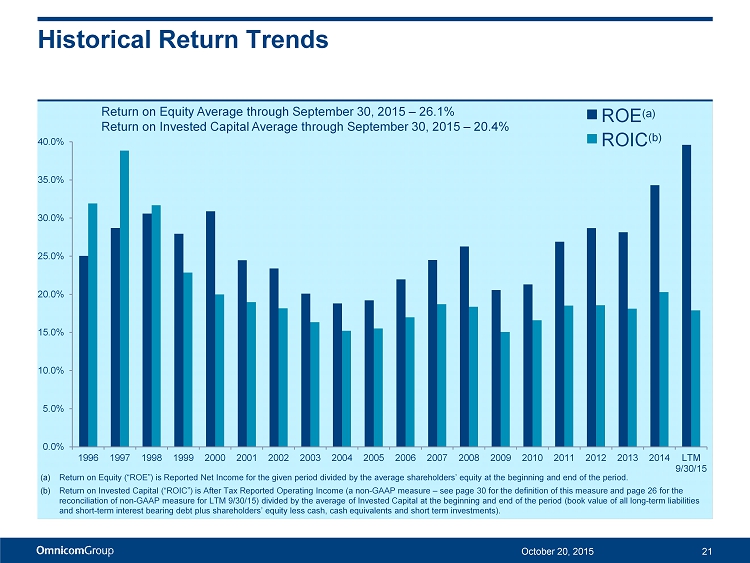
Historical Return Trends 0.0% 5.0% 10.0% 15.0% 20.0% 25.0% 30.0% 35.0% 40.0% 1996 1997 1998 1999 2000 2001 2002 2003 2004 2005 2006 2007 2008 2009 2010 2011 2012 2013 2014 LTM 9/30/15 October 20, 2015 21 (a) Return on Equity (“ROE”) is Reported Net Income for the given period divided by the average shareholders’ equity at the begin nin g and end of the period. (b) Return on Invested Capital (“ROIC”) is After Tax Reported Operating Income (a non - GAAP measure – see page 30 for the definition of this measure and page 26 for the reconciliation of non - GAAP measure for LTM 9/30/15) divided by the average of Invested Capital at the beginning and end of the period (book value of all long - term liabilities and short - term interest bearing debt plus shareholders’ equity less cash, cash equivalents and short term investments). Return on Equity Average through September 30, 2015 – 26.1% Return on Invested Capital Average through September 30, 2015 – 20.4% ROE (a) ROIC (b)
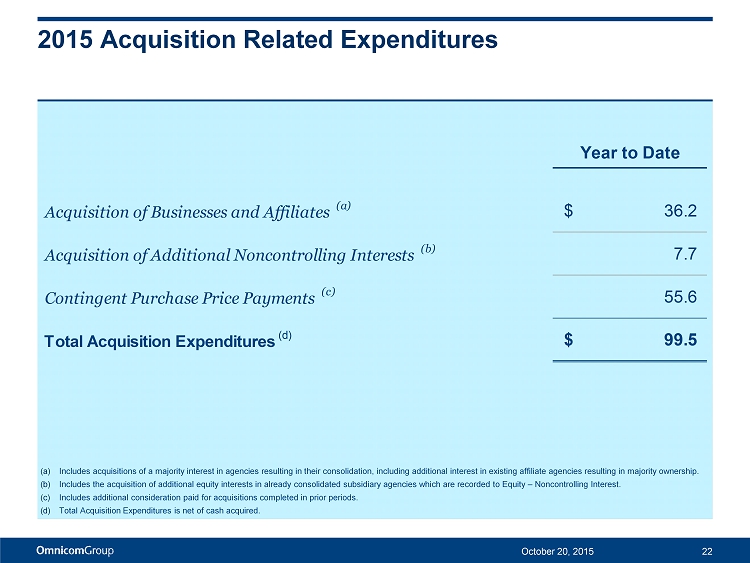
2015 Acquisition Related Expenditures 22 October 20, 2015 (a) Includes acquisitions of a majority interest in agencies resulting in their consolidation, including additional interest in e xis ting affiliate agencies resulting in majority ownership. (b) Includes the acquisition of additional equity interests in already consolidated subsidiary agencies which are recorded to Equ ity – Noncontrolling Interest. (c) Includes additional consideration paid for acquisitions completed in prior periods. (d) Total Acquisition Expenditures is net of cash acquired. Year to Date Acquisition of Businesses and Affiliates (a) 36.2$ Acquisition of Additional Noncontrolling Interests (b) 7.7 Contingent Purchase Price Payments (c) 55.6 Total Acquisition Expenditures (d) 99.5$
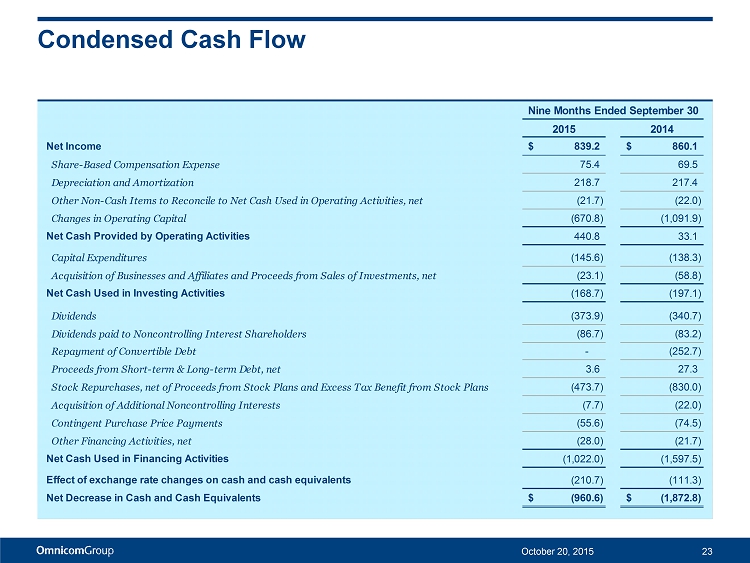
Condensed Cash Flow 23 October 20, 2015 2015 2014 Net Income 839.2$ 860.1$ Share-Based Compensation Expense 75.4 69.5 Depreciation and Amortization 218.7 217.4 Other Non-Cash Items to Reconcile to Net Cash Used in Operating Activities, net (21.7) (22.0) Changes in Operating Capital (670.8) (1,091.9) Net Cash Provided by Operating Activities 440.8 33.1 Capital Expenditures (145.6) (138.3) Acquisition of Businesses and Affiliates and Proceeds from Sales of Investments, net (23.1) (58.8) Net Cash Used in Investing Activities (168.7) (197.1) Dividends (373.9) (340.7) Dividends paid to Noncontrolling Interest Shareholders (86.7) (83.2) Repayment of Convertible Debt - (252.7) Proceeds from Short-term & Long-term Debt, net 3.6 27.3 Stock Repurchases, net of Proceeds from Stock Plans and Excess Tax Benefit from Stock Plans (473.7) (830.0) Acquisition of Additional Noncontrolling Interests (7.7) (22.0) Contingent Purchase Price Payments (55.6) (74.5) Other Financing Activities, net (28.0) (21.7) Net Cash Used in Financing Activities (1,022.0) (1,597.5) Effect of exchange rate changes on cash and cash equivalents (210.7) (111.3) Net Decrease in Cash and Cash Equivalents (960.6)$ (1,872.8)$ Nine Months Ended September 30
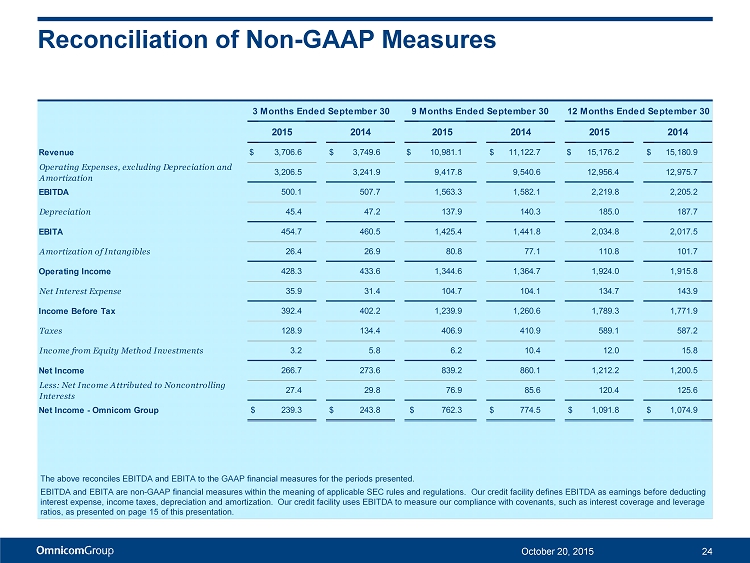
Reconciliation of Non - GAAP Measures 24 October 20, 2015 The above reconciles EBITDA and EBITA to the GAAP financial measures for the periods presented. EBITDA and EBITA are non - GAAP financial measures within the meaning of applicable SEC rules and regulations. Our credit facilit y defines EBITDA as earnings before deducting interest expense, income taxes, depreciation and amortization. Our credit facility uses EBITDA to measure our compliance wit h c ovenants, such as interest coverage and leverage ratios, as presented on page 15 of this presentation. 2015 2014 2015 2014 2015 2014 Revenue $ 3,706.6 $ 3,749.6 $ 10,981.1 $ 11,122.7 $ 15,176.2 $ 15,180.9 Operating Expenses, excluding Depreciation and Amortization 3,206.5 3,241.9 9,417.8 9,540.6 12,956.4 12,975.7 EBITDA 500.1 507.7 1,563.3 1,582.1 2,219.8 2,205.2 Depreciation 45.4 47.2 137.9 140.3 185.0 187.7 EBITA 454.7 460.5 1,425.4 1,441.8 2,034.8 2,017.5 Amortization of Intangibles 26.4 26.9 80.8 77.1 110.8 101.7 Operating Income 428.3 433.6 1,344.6 1,364.7 1,924.0 1,915.8 Net Interest Expense 35.9 31.4 104.7 104.1 134.7 143.9 Income Before Tax 392.4 402.2 1,239.9 1,260.6 1,789.3 1,771.9 Taxes 128.9 134.4 406.9 410.9 589.1 587.2 Income from Equity Method Investments 3.2 5.8 6.2 10.4 12.0 15.8 Net Income 266.7 273.6 839.2 860.1 1,212.2 1,200.5 Less: Net Income Attributed to Noncontrolling Interests 27.4 29.8 76.9 85.6 120.4 125.6 Net Income - Omnicom Group $ 239.3 $ 243.8 $ 762.3 $ 774.5 $ 1,091.8 $ 1,074.9 3 Months Ended September 30 12 Months Ended September 309 Months Ended September 30
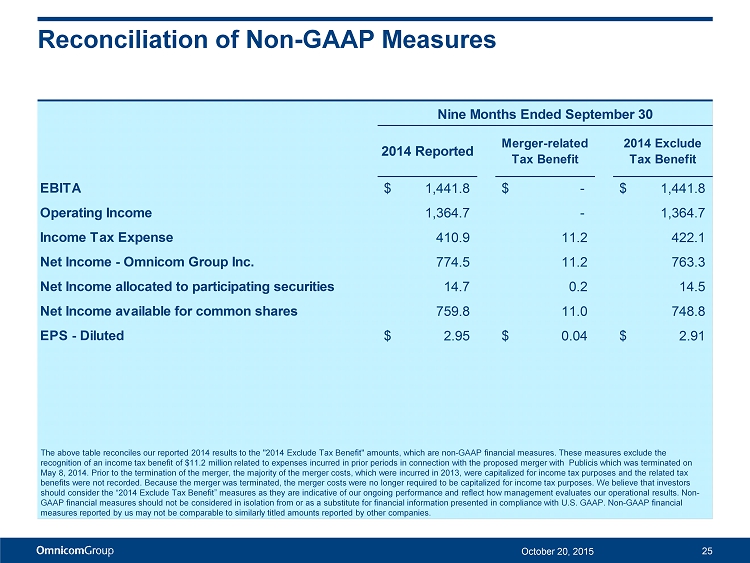
Reconciliation of Non - GAAP Measures 25 October 20, 2015 2014 Reported Merger-related Tax Benefit 2014 Exclude Tax Benefit EBITA $ 1,441.8 $ - $ 1,441.8 Operating Income 1,364.7 - 1,364.7 Income Tax Expense 410.9 11.2 422.1 Net Income - Omnicom Group Inc. 774.5 11.2 763.3 Net Income allocated to participating securities 14.7 0.2 14.5 Net Income available for common shares 759.8 11.0 748.8 EPS - Diluted $ 2.95 $ 0.04 $ 2.91 Nine Months Ended September 30 The above table reconciles our reported 2014 results to the " 2014 Exclude Tax Benefit" amounts, which are non - GAAP financial measures. These measures exclude the recognition of an income tax benefit of $11.2 million related to expenses incurred in prior periods in connection with the pr opo sed merger with Publicis which was terminated on May 8, 2014. Prior to the termination of the merger, the majority of the merger costs, which were incurred in 2013, were capi tal ized for income tax purposes and the related tax benefits were not recorded. Because the merger was terminated, the merger costs were no longer required to be capitalized for in come tax purposes. We believe that investors should consider the “2014 Exclude Tax Benefit” measures as they are indicative of our ongoing performance and reflect how management evaluates our operational results. Non - GAAP financial measures should not be considered in isolation from or as a substitute for financial information presented in com pliance with U.S. GAAP. Non - GAAP financial measures reported by us may not be comparable to similarly titled amounts reported by other companies.
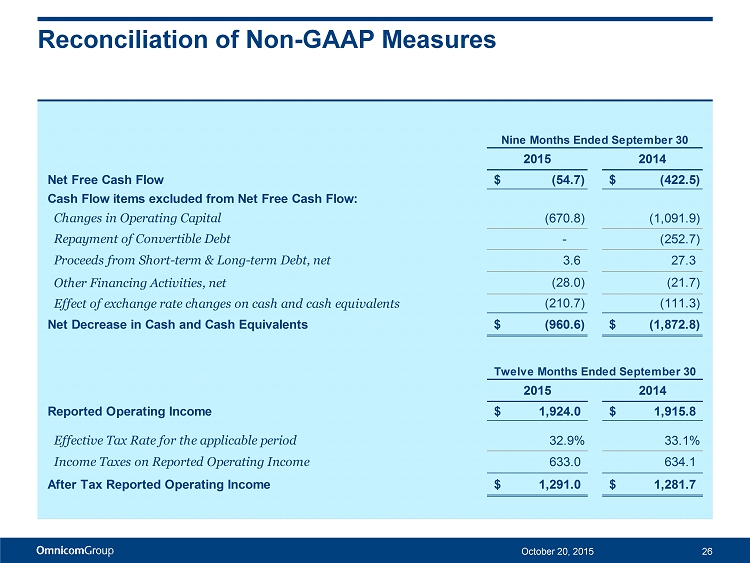
Reconciliation of Non - GAAP Measures October 20, 2015 26 2015 2014 Net Free Cash Flow (54.7)$ (422.5)$ Cash Flow items excluded from Net Free Cash Flow: Changes in Operating Capital (670.8) (1,091.9) Repayment of Convertible Debt - (252.7) Proceeds from Short-term & Long-term Debt, net 3.6 27.3 Other Financing Activities, net (28.0) (21.7) Effect of exchange rate changes on cash and cash equivalents (210.7) (111.3) Net Decrease in Cash and Cash Equivalents (960.6)$ (1,872.8)$ Nine Months Ended September 30 2015 2014 Reported Operating Income 1,924.0$ 1,915.8$ Effective Tax Rate for the applicable period 32.9% 33.1% Income Taxes on Reported Operating Income 633.0 634.1 After Tax Reported Operating Income 1,291.0$ 1,281.7$ Twelve Months Ended September 30
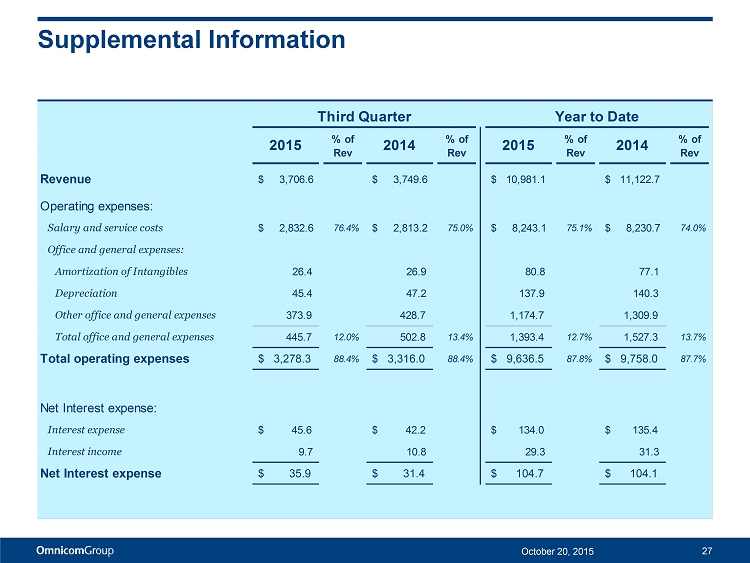
Supplemental Information 27 October 20, 2015 2015 % of Rev 2014 % of Rev 2015 % of Rev 2014 % of Rev Revenue $ 3,706.6 $ 3,749.6 $ 10,981.1 $ 11,122.7 Operating expenses: Salary and service costs $ 2,832.6 76.4% $ 2,813.2 75.0% $ 8,243.1 75.1% $ 8,230.7 74.0% Office and general expenses: Amortization of Intangibles 26.4 26.9 80.8 77.1 Depreciation 45.4 47.2 137.9 140.3 Other office and general expenses 373.9 428.7 1,174.7 1,309.9 Total office and general expenses 445.7 12.0% 502.8 13.4% 1,393.4 12.7% 1,527.3 13.7% Total operating expenses $ 3,278.3 88.4% $ 3,316.0 88.4% $ 9,636.5 87.8% $ 9,758.0 87.7% Net Interest expense: Interest expense $ 45.6 $ 42.2 $ 134.0 $ 135.4 Interest income 9.7 10.8 29.3 31.3 Net Interest expense $ 35.9 $ 31.4 $ 104.7 $ 104.1 Third Quarter Year to Date
Third Quarter Acquisition October 20, 2015 28 Established in 2006, Cortex is a leading healthcare communication agency providing services to the pharmaceutical and nutrition industries and healthcare providers. The agency’s main areas of focus include creative brand and disease awareness campaigns, medical services (consultancy and education), medical marketing project development and management, digital projects (internet, mobile and webcasts) and patient programs. Cortex is based in Istanbul, Turkey, and is expected to strengthen the TBWA \ Worldhealth offerings in Turkey and elsewhere in the Middle East.
Third Quarter Acquisition October 20, 2015 29 Founded in 2007, RE - MIND is the largest independent digital media agency in France, offering strategic consulting and cross - channel media marketing expertise to its clients. DataOnDemand , founded in 2012, is focused on the CRM market, developing custom cross - channel direct marketing strategies for its clients using state of the art technology solutions. Both RE - MIND and DataOnDemand are based in Paris , France with offices in Lyon and Biarritz and will operate within the Omnicom Media Group network.
![]()
The preceding materials have been prepared for use in the October 20, 2015 conference call on Omnicom’s results of operations fo r the period ended September 30, 2015. The call will be archived on the Internet at http://investor.omnicomgroup.com/investor-relations/news-events-and-filings. Forward - Looking Statements Certain statements in this presentation constitute forward - looking statements, including statements within the meaning of the Private Securities Litigation Reform Act of 1995. In addition, from time to time, the Company or its representatives have made, or may make, forward - looking statements, orally or in writing. These statements may discuss goals, intentions and expectations as to future plans, trends, events, results of operations or financial condition, or otherwise, based on current beliefs of the Company’s management as well as assumptions made by, and information currently available to, the Company’s management. Forward - looking statements may be accompanied by words such as “aim,” “anticipate,” “believe,” “plan,” “could,” “wou ld,” “should,” “estimate,” “expect,” “forecast,” “future,” “guidance,” “intend,” “may,” “will,” “possible,” “potential,” “predict,” “project” or similar words, phrases or expressions. The se forward - looking statements are subject to various risks and uncertainties, many of which are outside the Company’s control. Therefore, you should not place undue reliance on such statements. Factors that could cause actual results to differ ma terially from those in the forward - looking statements include: international, national or local economic, social or political conditions that could adversely affect the Company or it s clients; losses on media purchases and production costs incurred on behalf of clients; reductions in client spending, a slowdown in client payments and changes in client advertising, marketing and corporate communications requirements; failure to manage potential conflicts of interest between or among clients; unanticipated changes relating to competitive factors in the advertising, marketing and corporate communications industries ; ability to hire and retain key personnel; ability to attract new clients and retain existing clients in the manner anticipated; reliance on information technology systems; changes in legislation or governmental regulations affecting the Company or its clients; conditions in the credit markets; risks associated with assumptions the Company makes in connection with its critical accounting estimates and legal proceedings; and the Company’s international operations, which are subject to the risks of currency fluctuation and currency repatriation restrictions. The foregoing list of factors is not exhaustive. You should carefully consider the foregoing factors and the other risks and uncertainties that may affect the Company’s business, including those described in the “Risk Factors” in Omnicom’s Annual Report on Form 10 - K for the year ended December 31, 2014. Except as required under applicable law, the Company does not assume any obligation to update these forward - looking statements . Non - GAAP Financial Measures We present financial measures determined in accordance with generally accepted accounting principles in the United States (“G AAP ”) and adjustments to the GAAP presentation (“Non - GAAP”), which we believe are meaningful for understanding our performance. Non - GAAP financial measures should not be considered in isolation f rom, or as a substitute for, financial information presented in compliance with GAAP. Non - GAAP financial measures as reported by us may not be comparable to similarly titled amounts reported b y other companies. We provide a reconciliation of non - GAAP measures to the comparable GAAP measures on pages 24, 25 and 26. The Non - GAAP measures used in this presentation include the following: 2014 Exclude Tax Benefit, which excludes the impact of the tax benefit related to expenses incurred in 2013 related to the proposed merger with Publicis which was terminated in 2014. We believe that this presentation allows for a more meaningful understanding of our performance. Net Free Cash Flow, defined as Free Cash Flow (defined below) less the Primary Uses of Cash (defined below). Net Free Cash Fl ow is one of the metrics used by us to assess our sources and uses of cash and was derived from our consolidated statements of cash flows. We believe that this presentation is meaningful for unde rst anding our primary sources and primary uses of that cash flow. Free Cash Flow, defined as net income plus depreciation, amortization, share based compensation expense less other non - cash items to reconcile to net cash provided by operating activities. Primary Uses of Cash, defined as dividends to common shareholders, dividends paid to non - controlling interest shareholders, capital expenditures , cash paid on acquisitions, payments for additional interest in controlled subsidiaries and stock repurchases, net of the proceeds and excess tax benefit from our stock plans, and excludes changes in wor king capital and other investing and financing activities, including commercial paper issuances and redemptions used to fund working capital changes. EBITDA, defined as operating income before interest, taxes, depreciation and amortization. We believe EBITDA is meaningful be cau se the financial covenants in our credit facilities are based on EBITDA. EBITA, defined as operating income before interest, taxes and amortization. We use EBITA as an additional operating performan ce measure, which excludes acquisition - related amortization expense, because we believe that EBITA is a useful measure to evaluate the performance of our businesses. Net Debt, defined as total debt less cash, cash equivalents and short - term investments. We believe net debt, together with the c omparable GAAP measures, reflects one of the metrics used by us to assess our cash management. After Tax Reported Operating Income, defined as reported operating income less income taxes calculated using the effective ta x r ate for the applicable period. Other Information All dollar amounts are in millions except for per share amounts and figures shown on pages 3, 6 and 25 and the net cash retur ned to shareholders figures on page 17. The information contained in this document has not been audited, although some data has been derived from Omnicom’s historical financial statements, including its audited financial statements. In addition, industry, operational and other non - financial data contained in this document have been derived from sources that we believe to be reliable, but we have n ot independently verified such information, and we do not, nor does any other person, assume responsibility for the accuracy or completeness of that information. Certain amounts in prior periods ha ve been reclassified to conform to our current presentation. The inclusion of information in this presentation does not mean that such information is material or that disclosure of such inf ormation is required. Disclosure October 20, 2015 30