Attached files
| file | filename |
|---|---|
| 8-K - FORM 8-K - AMSURG CORP | d31686d8k.htm |
| EX-99.1 - EX-99.1 - AMSURG CORP | d31686dex991.htm |
| EX-99.3 - EX-99.3 - AMSURG CORP | d31686dex993.htm |
 A Compelling Opportunity to Create Shareholder Value October 20, 2015 Exhibit 99.2 |
 Forward-Looking Statements This presentation includes forward-looking statements within the meaning of Section 27A of the Securities Act and Section 21E
of the Securities Exchange Act of 1934, as amended. These forward-looking statements include, but are not limited to, statements regarding AmSurg’s proposed business combination
transaction with TeamHealth (including financing of the proposed transaction and the benefits, results, effects and timing of a transaction), all statements regarding AmSurg’s (and
AmSurg’s and TeamHealth’s combined) expected future financial position, results of operations, cash flows, financing plans, business strategy, budgets, capital expenditures, competitive positions,
growth opportunities, plans and objectives of management, and statements containing the words such as “anticipate,” “approximate,” “believe,” “plan,”
“estimate,” “expect,” “project,” “could,” “would,” “should,” “will,” “intend,” “may,” “potential,” and other similar
expressions. Statements in this presentation concerning the business
outlook or future economic performance, anticipated profitability, revenues, expenses or other financial items, and service line growth of AmSurg (and the combined businesses of AmSurg and TeamHealth), together with other statements that are not
historical facts, are forward-looking statements that are estimates reflecting the best judgment of AmSurg based upon currently available information. Such forward-looking statements are inherently uncertain, and shareholders and other potential investors must recognize that
actual results may differ materially from AmSurg’s expectations as a result of a variety of factors, including, without limitation, those discussed below. Such forward-looking statements are
based upon management’s current expectations and include known and unknown risks, uncertainties and other factors, many of which AmSurg is unable to predict or control, that may cause AmSurg’s
actual results, performance or plans with respect to TeamHealth, to differ materially from any future results, performance or plans expressed or implied by such forward-looking statements.
These statements involve risks, uncertainties and other factors discussed below and detailed from time to time in AmSurg’s filings with the Securities and Exchange Commission (the
“SEC”). Risks and uncertainties related to the proposed transaction with TeamHealth include, but are not limited to, uncertainty as to
whether AmSurg will further pursue, enter into or consummate the transaction on the terms set forth in the proposal or on other terms, potential adverse reactions or changes to business
relationships resulting from the announcement or completion of the transaction, uncertainties as to the timing of the transaction, adverse effects on AmSurg’s stock price resulting from the
announcement or consummation of the transaction or any failure to complete the transaction, competitive responses to the announcement or consummation of the transaction, the risk that regulatory,
licensure or other approvals and financing required for the
consummation of the transaction are not obtained or are obtained subject
to terms and conditions that are not anticipated, costs and difficulties related to the integration of TeamHealth’s businesses and operations with AmSurg’s businesses and operations, the inability to obtain, or delays in obtaining, cost
savings and synergies from the transaction, unexpected costs, liabilities, charges or expenses resulting from the transaction, litigation relating to the transaction, the inability to retain key personnel,
and any changes in general economic and/or industry specific
conditions. In addition to the factors set forth above, other factors that may affect AmSurg’s plans, results or stock price are set
forth in AmSurg’s Annual Report on Form 10-K and its reports on Forms 10-Q and 8-K. Consequently, actual results, performance or developments may differ materially from the forward-looking
statements included above. AmSurg disclaims any intent or obligation to update these forward-looking statements. Additional Information This presentation is provided for informational purposes only and does not constitute an offer to purchase or the solicitation of
an offer to sell any securities. Subject to future developments, AmSurg may file a registration statement and/or tender offer documents with the SEC in connection with a possible business
combination transaction with TeamHealth. AmSurg and TeamHealth shareholders should read those filings, and any other filings made by AmSurg with the SEC in connection with a possible business
combination, if any, as they will contain important information. Those documents, if and when filed, as well as AmSurg’s other public filings with the SEC, may be obtained without charge at
the SEC’s website at www.sec.gov and at AmSurg’s website at www.amsurg.com. |
 Strategically & Financially Compelling Combination
1 Creates market leader in physician services, giving a voice to core constituency in healthcare
Leading national provider of outsourced physician services to health
systems Network of more than 1,200 healthcare facilities and
approximately 20,000 clinicians Breadth and depth of services accelerates
cross-sell and new contract wins Enhances relationships with health
insurers in the midst of increasing consolidation Financially compelling
transaction Provides 36% premium to TeamHealth shareholders at
current prices and implies a multiple of 15.2x 2016E EBITDA (for
combined TeamHealth and IPC) or 10.9x EBITDA inclusive of base case run
rate synergies of $200 million Expected to be immediately accretive to
earnings by greater than $0.35 assuming base case run rate
synergies Pro forma net leverage at closing of 5.1x, expected to be below 4.5x by end of first year
Led by experienced AmSurg management team with strong integration track
record Financial performance of AmSurg since closing Sheridan transaction
has exceeded initial public guidance on every metric
AmSurg successful integration track record serves as a roadmap for TeamHealth
transaction Ability to optimize financing of the AmSurg/TeamHealth and
TeamHealth/IPC transactions could decrease aggregate financing expense
by $100 to $150 million |
 Summary
Terms of Proposal Merger
Consideration $11.49 per share in cash and fixed exchange ratio of 0.768x – Implies total value per share at offer of $71.47 per share including $59.98 per share in newly
issued common stock in the combined company – Structured to balance pro forma equity ownership to 50%/50% to enable both companies’
shareholders to share in upside of the combined company
–
Implies consideration mix of 16% cash and 84% stock to TeamHealth
shareholders Delivers
~22% of TeamHealth’s
current market capitalization in cash
Deal Value Total implied firm value of TeamHealth at offer of $7.8bn Social Issues Open to combined company retaining TeamHealth name or new mutually agreeable name
Openness to discuss social issues through constructive engagement
Financing Cash consideration funded with mix of new bank debt and publicly issued bonds Guggenheim Securities and J.P. Morgan are highly confident in ability to finance proposed
combination Synergies Base case assumes $200mm in annual synergies with opportunity for up to $290mm, subject to due diligence confirmation Approvals & Timing Shareholder vote required at both companies Regulatory approvals and customer closing conditions Anticipated closing by Q1 2016 if TeamHealth engages promptly Source: FactSet, ThomsonOne and public company filings as of 10/19/2015 2 |
 Creates a highly differentiated market leader Significant diversification Reduces risks of IPC integration New and expanded opportunities to accelerate growth Deal structure maintains upside opportunity Combined Company Controls its Destiny Physician Staffing ’15 EBITDA (1) $477mm Firm Value $6.1bn Health Insurers Significant consolidation 3 Large Players + Local Blues Hospitals Significant consolidation 4 Large Public Health Systems Supply Chain 1 Standalone PBM PBM / Retail Convergence Emergence of End Game Winners UnitedHealth CVS HCA Fresenius McKesson Express Scripts ’15 EBITDA $737mm Firm Value $9.8bn ’15 EBITDA $660mm Firm Value $8.9bn ’15 EBITDA $516mm Firm Value $6.3bn TeamHealth AmSurg Mednax Envision Race for Scale… …Creates Opportunities for New TeamHealth Source: FactSet, ThomsonOne and public company filings as of 10/19/2015 Note: TeamHealth includes IPC (with $60mm of synergies) (1) Assumes midpoint of AmSurg management guidance 3 |
 Combination has the Potential to Significantly Enhance
Shareholder Value Most Complete Platform of Outsourced Clinical Services Accelerates Multiple Avenues of Growth 1 Management has High Credibility, Proven Track Record, and Strong Cultural Fit 6 Largest National Provider with Highly Diversified Business Mix 2 Best Positioned for Evolving Payment Models and Enabling Providers to Better Coordinate Care 5 Opportunities for Meaningful Synergies 4 Delivers Immediate Financial Return at Modest Leverage 3 Catalytic to organic growth and M&A opportunities Value Driver Reduces risk Quantifiable impacts on immediate value Cost: increase base earnings Revenue: further accelerate growth Positioned for shift to value-based payments, bundling and risk Adds credibility to value story 4 |
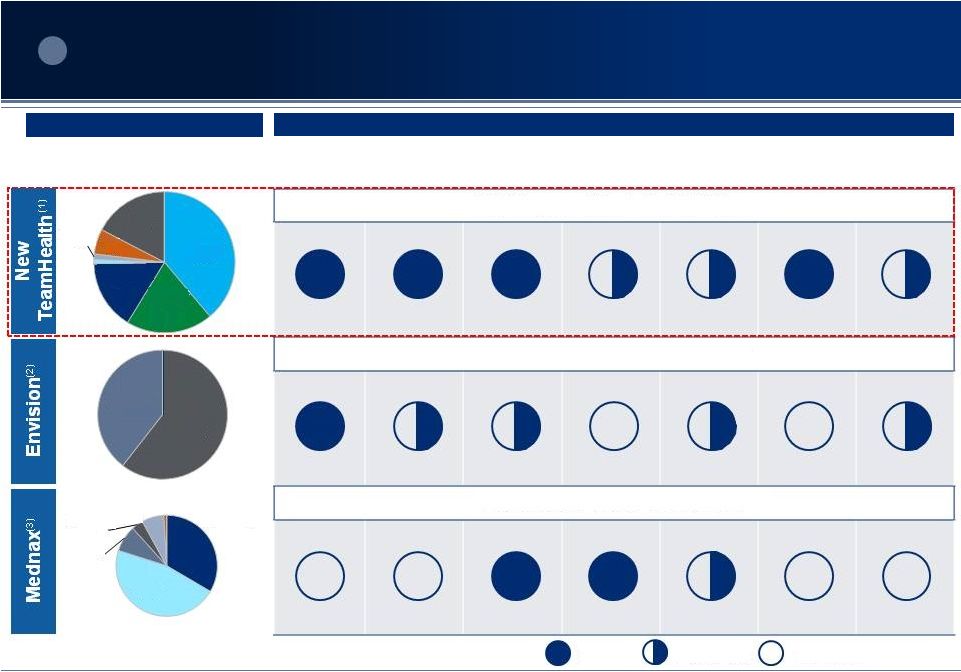 Core Presence Non-Core Clinical Service Offerings Business Mix Source: Company filings (1) Pro forma business mix calculated based on standalone business mix applied to 2014 revenue, as reported. AmSurg contribution of revenue assumes midpoint of 2015 guidance (2) Based on 6 months ending Q2 2015 results; pro forma for Rural/Metro
(3) Based on FY 2014 results; pro forma for vRad ED Hospitalist Anesthesiology Children’s Services Radiology Surgery Center Post-Acute 2015E Revenue: ~$7bn & ~20,000 Clinicians 2015E Revenue: ~$6bn & ~9,000 Clinicians 2015E Revenue: ~$3bn & ~3,000 Clinicians 1 Most Complete Platform of Outsourced Clinical Services Accelerates Growth 5 Emergency Department 39% Acute / PAC Hospitalists 20% Anesthesiology 16% Children's 1% Radiology 1% Other 6% ASC 17% Emergency Staffing & Other 61% Ambulance 39% Anesthesiology 33% Neonatal 46% Maternal 8% Pediatric Cardiology 4% Radiology 7% Other 1% |
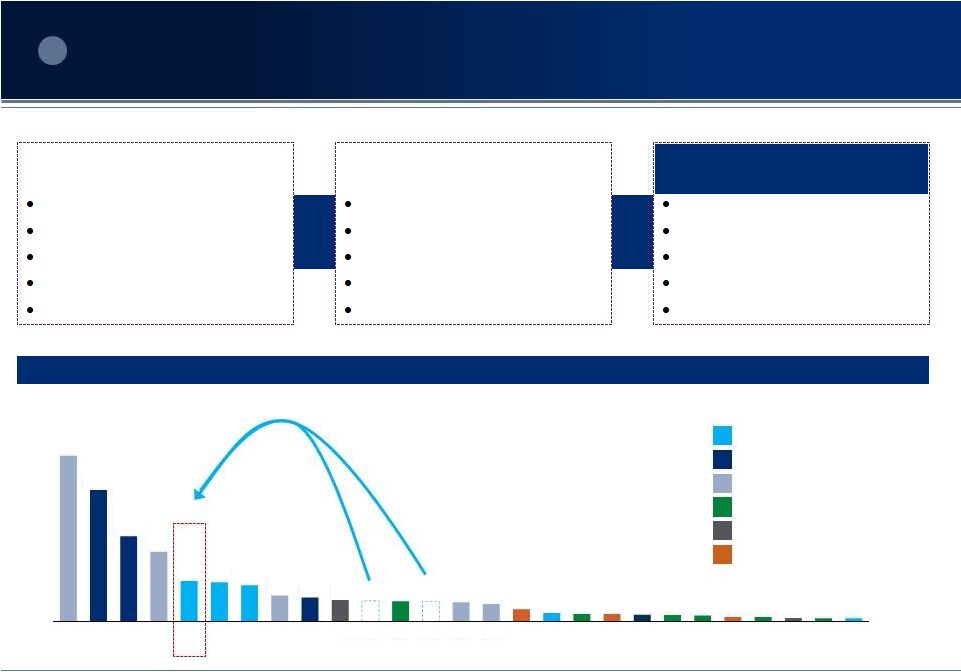 $ in millions Staffing Alternate Site Acute Care Post-Acute Home Health / Hospice Senior Housing Healthcare Services Provider Landscape: Market Capitalizations Source: FactSet and public company filings as of 10/19/2015 (1) Assumes midpoint of AmSurg management guidance (2) Includes IPC (with $60mm of synergies) (3) Includes $200mm of combined synergies AmSurg 2015E Revenue (1) $2.5bn 2015E Adj. EBITDA (1) $477mm States 38 Healthcare facilities 210 Clinicians 5,000+ TeamHealth (2) 2015E Revenue $4.3bn 2015E Adj. EBITDA $516mm States 47 Healthcare facilities 1,000+ Clinicians 16,000+ New TeamHealth (3) 2015E Revenue ~$7.0bn 2015E Adj. EBITDA $1.1bn States 48 Healthcare facilities 1,200+ Clinicians ~20,000 + = Leading National Physician Services Company with Complementary Service Offerings 2 6 $32.6 $25.9 $16.8 $13.7 $7.9 $7.7 $7.1 $5.1 $4.7 $4.3 $4.0 $3.9 $3.9 $3.8 $3.4 $2.4 $1.6 $1.5 $1.4 $1.3 $1.2 $1.2 $0.9 $0.9 $0.7 $0.6 $0.6 HCA FMS DVA UHS MD EVHC CYH ACHC BKD AMSG HLS TMH THC LPNT CHE AHS SEM AMED SCAI KND ENSG LHCG GEN CSU USPH CCRN New TMH |
 5.1x
4.2x Pro Forma Net Leverage @ Close Net Leverage @ End of Year-1 $7.0 billion + Revenue $1.1 billion + EBITDA 20,000+ Healthcare Professionals Quickly Deleveraging (1) $450 million + Discretionary Free Cash Flow Year-1 Net Leverage 4.2x Source: FactSet and public company filings as of 10/19/2015 Note: Discretionary free cash flow calculated as cash flow from operations less capital expenditures, distributions to minority interests
and preferred dividends. Assumes $200mm of synergies.
(1) $75mm of synergies for leverage purposes Accelerates Growth 20% + EBITDA CAGR Delivers Immediate Financial Return at Modest Leverage $200 million + Combined Company Synergies 3 Immediately Accretive to Earnings and Value Year-1 Accretion in Excess of $0.35 Assuming Base Case Run-Rate Synergies 7 18% 23% TMH + IPC '15-'17 EBITDA CAGR PF AmSurg + TeamHealth '15-'17 EBITDA CAGR |
 Opportunities for Meaningful Synergies
4 Preliminary synergy range of $200 – $290 million, including $40 – $60 million from IPC The analysis assumes $200mm as the Base Case Synergy Assumption Revenue Synergies Managed Care Opportunities for collaboration and enhanced relationships with managed care organizations Enterprise New Contract Growth Enterprise new contract growth rate increases by 1% due to enhanced portfolio and
cross selling opportunities
Sheridan Contract Growth Increases in Sheridan's growth rate to match TeamHealth new contract growth rate
leveraging their sales expertise and client base
IPC Synergies with TeamHealth Collections improvements, bundled services, post-acute service Incremental EBITDA from Revenue Synergies $130mm – $185mm Cost Synergies TeamHealth Cost Synergies Operations support, back office, public company costs incurred; potential group
purchasing on malpractice, benefits and other costs
IPC Synergies with TeamHealth Corporate and regional overhead; public company costs; operating, billing and purchasing savings Incremental EBITDA from Cost Synergies $70mm – $105mm 8 |
 At the
forefront of key
fee-for-value
initiatives Participation in BPCI initiative provides early
experience with Medicare’s new reimbursement program
Healthcare system has ~$1.5bn of bundled payments in today’s program
Infrastructure in place through IPC
Magnitude of financial impact will only increase over time
Scale / Partner of choice:
in over 1,200 healthcare facilities and employs 20,000
clinicians who are best positioned to manage / coordinate care to drive cost
down Strategic Asset: Value of the hospitalist as care coordinator will only increase The transaction offers immediate and concrete strategic and financial return and better
positions the company for value based payments, bundling and risk sharing
arrangements Best Positioned for Evolving Payment Models and
Enabling Coordinated Care 5 9 |
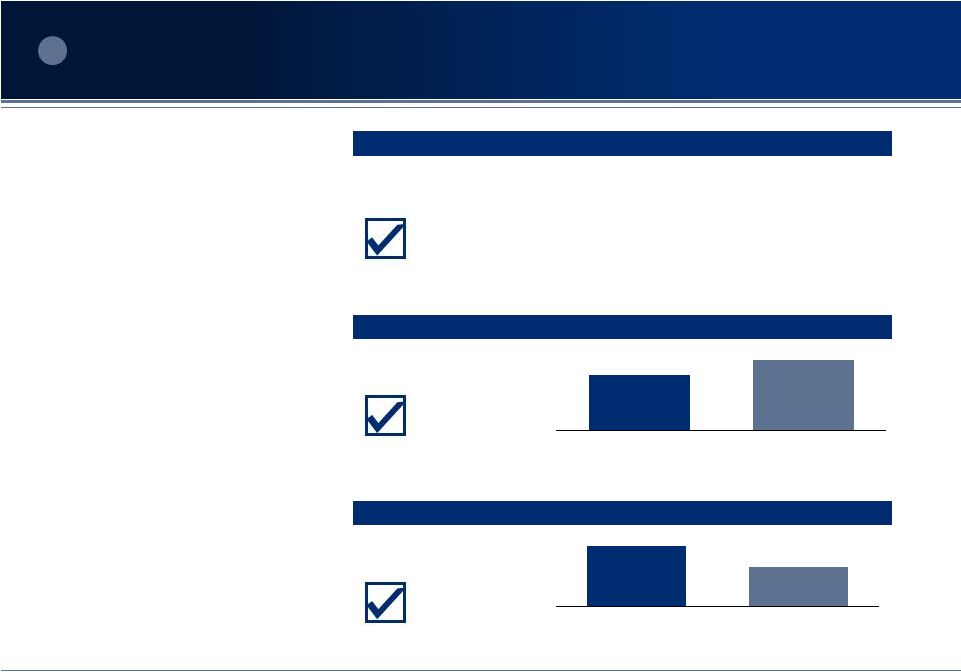
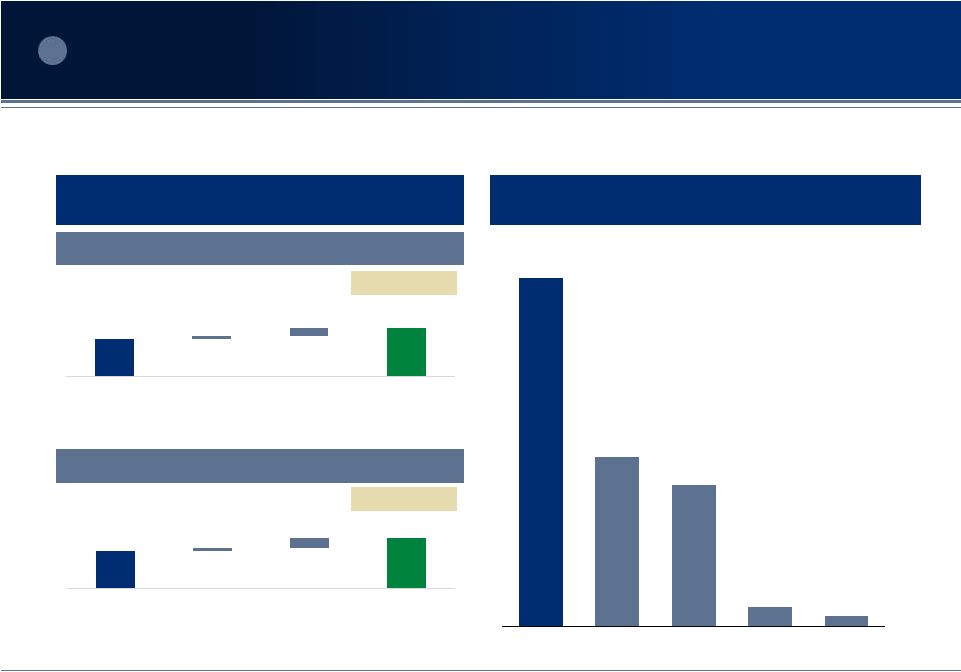 Management has High Credibility, Proven Track
Record, and Strong Cultural Fit
6 AmSurg management has been instrumental in driving long term shareholder appreciation
and has outperformed the peer group over the last three years
Source:
FactSet and public company filings as of 10/19/2015
Note: Current IPC shown as of unaffected price of $58.46 (1) Represents the day prior to AmSurg’s acquisition of Sheridan Share Price Performance Since May 28, 2014 (1) Recent Performance has Outpaced Expectations Mid-Point Adj. EBITDA Guidance ($ in millions) Mid-Point Adj. EPS Guidance ($ / share) $448 $9 $20 $477 6.5% Increase $3.28 $0.07 $0.21 8.5% Increase $3.56 10 FY2015 Guidance as of Q4 '14 Increase to FY2015 Guidance in Q1 '15 Increase to FY2015 Guidance in Q2 '15 Current FY 2015 Guidance FY2015 Guidance as of Q4 '14 Increase to FY2015 Guidance in Q1 '15 Increase to FY2015 Guidance in Q2 '15 Current FY 2015 Guidance 82% 40% 34% 5% 3% AMSG MD IPC TMH EVHC |
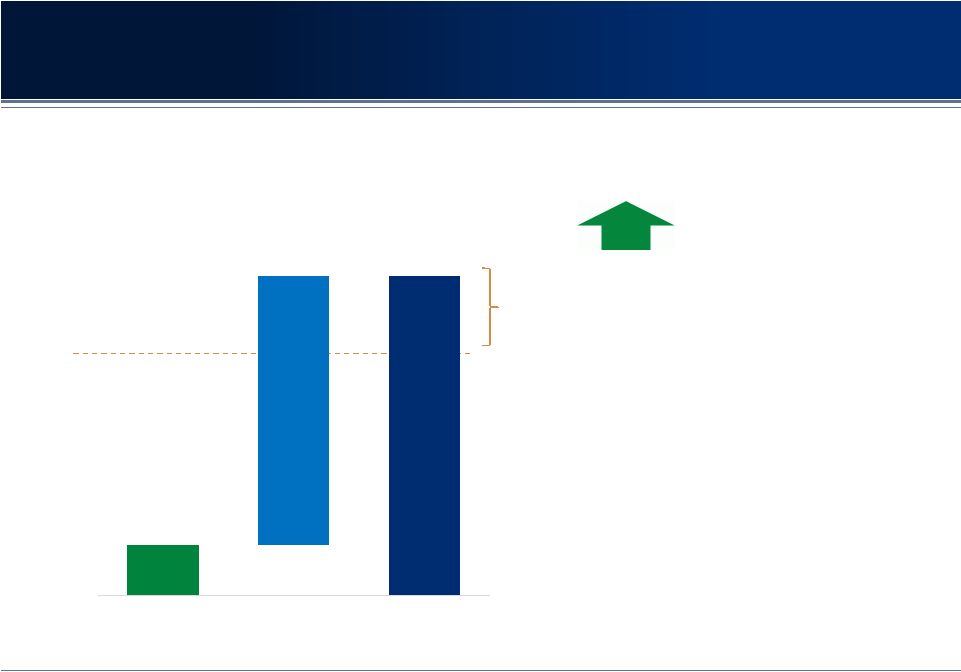 Combination Represents Significant Value Creation
Opportunity for TeamHealth Shareholders
Significant value creation to TeamHealth stockholders through initial premium as well
as continued upside and equal share of synergies
Current Price: $52.50 Source: FactSet and Company Filings as of 10/19/2015 Note: Assumes $200mm of run rate synergies. Peer group includes AmSurg, Envision, Mednax and TeamHealth. (1) Net of share of assumed transaction expenses 36% Premium Share of incremental synergies capitalized at peer NTM EBITDA multiple of ~12.3x (1) implies >$10.00 of additional upside, representing a >50% premium to current 11 $11.49 $59.98 $71.47 Cash Stock Total Value at Offer |
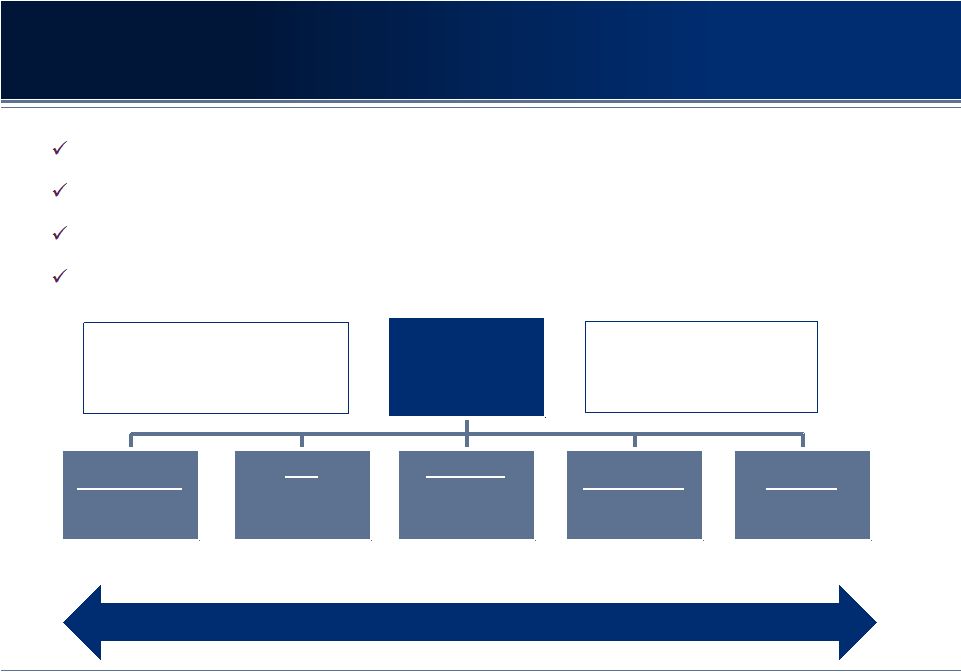 Shared
Vision for New TeamHealth Transformational Combination Aligned with the
Future of Healthcare New
Breadth
to TeamHealth Brand & Long-term Vision: Partner of choice for health systems Comprehensive Platform: Industry leading portfolio of outsourced physician services Multiple Levers of Growth: Built for the long-term with new and expanded growth opportunities Aligned with the Future: Best positioned to enable providers to move toward value-based care Best of Breed Management Team Full Suite of Solutions Care Coordination: Hospital to Home Platform to Manage Risk Post-Acute Coordination of Care Surgical Outpatient Largest by Revenue: ~$7.0bn Largest by Clinicians: 20,000 Leader in more sub-specialties than anyone Market Size Medical $20bn $19bn $19bn $14bn $15bn 12 New TeamHealth TeamHealth ED Sheridan Anesthesia / Neo IPC Hospitalist & Post-acute Radisphere Radiology AmSurg ASCs |
 We
believe our proposal is compelling for TeamHealth Shareholders
MOE with a 36% “control premium”
$71.47 per share value at offer, above all-time high
15x+ TeamHealth EBITDA Valuation
50/50% ownership: “not truly selling”
Enormous value creation opportunity
$1.8bn value of capitalized synergies larger than the
$1.6bn IPC transaction
We have great respect for the value of the TeamHealth
Name for NewCo
Openness to discuss social issues through
constructive engagement
Concrete path to near-term value in excess of $80.00
per share
Share in upside equally with base case of $200mm of
synergies
Opportunity to avoid $100mm-$150mm of breakage
costs from IPC financing
AmSurg CEO/Management team
Continued financial outperformance
Stock up 82% since Sheridan
Integration experience
Synergies conservative and achievable
Opportunity to create the Best-In-Class Provider of Clinical
Outsourced Services …with meaningfully enhanced
outlook 13
Proposal delivers significant value today…
|
 Next
Steps No expected financing contingency; JPM/Guggenheim
highly confident in AmSurg ability to finance merger
Proposal based on public information/internal estimates
Would conduct prompt due diligence to reach agreed upon
transaction Shareholder votes required for both
companies Do not anticipate significant regulatory
hurdles Look forward to engaging promptly with
TeamHealth’s Board to reach an agreement TeamHealth
Shareholders Must Urge Their Board of Directors to Engage
with AmSurg to Consummate Significant Value Creating Transaction 14 |
 Financial
Information We have included certain financial measures in
this presentation, including Adjusted EBITDA and Adjusted EPS, which are “non-GAAP financial measures” as defined under the rules and regulations promulgated by the SEC. We define
Adjusted EBITDA as earnings before interest expense, net,
income taxes, depreciation, amortization, share-based
compensation, transaction costs, changes in contingent purchase price
consideration, gain or loss on deconsolidations and
discontinued operations. Adjusted EBITDA, as presented herein, is considered a supplemental measure of our performance and is not required by, or presented in accordance with, generally accepted accounting principles in the
United States (“GAAP”). Adjusted EBITDA is not a measure of
our financial performance under GAAP and should not be
considered as an alternative to net income or any other performance
measure derived in accordance with GAAP. We define
Adjusted EPS as net earnings per share, excluding discontinued operations, gains or loss from deconsolidations, which are non-cash in nature, transaction costs, including associated debt extinguishment costs and deferred financing
write-off, and acquisition-related amortization
expense (the majority of which relate to the Sheridan transaction and which are of a nature and significance not generally associated with our historical individual center acquisition activity), changes
in contingent purchase price consideration and
share-based compensation expense. Our measures of
Adjusted EBITDA and Adjusted EPS may not be comparable to similarly titled measures of other companies and are not measures of performance calculated in accordance with GAAP. We have included information
concerning Adjusted EBITDA and Adjusted EPS in this presentation because
we believe that such information is used by certain
investors as measures of a company’s historical performance. We believe these measures are frequently used by securities analysts, investors and other interested parties in the evaluation of issuers of equity securities, many of which
present EBITDA, Adjusted EBITDA, EPS and Adjusted EPS when
reporting their results. Our presentation of Adjusted
EBITDA and Adjusted EPS should not be construed as an inference that our
future results will be unaffected by unusual or
nonrecurring items. |