Attached files
| file | filename |
|---|---|
| 8-K - FORM 8-K - Blackstone Group Inc | d54841d8k.htm |
| EX-99.1 - EX-99.1 - Blackstone Group Inc | d54841dex991.htm |
 Blackstone’s Third Quarter 2015 Earnings October 15, 2015 Exhibit 99.2 |
 Blackstone 1 Blackstone’s Third Quarter 2015 Highlights Economic Net Income (“ENI”) was negative $416 million, or $(0.35)/unit, in the third quarter, driven by declines in the unrealized value of public holdings, despite strong underlying portfolio fundamentals across the funds. • ENI was $1.7 billion ($1.45/unit) year-to-date on $3.7 billion of Total Revenues. Distributable Earnings (“DE”) was $692 million ($0.58/unit) in the third quarter, on $470 million of Realized Performance Fees. • DE was $3.0 billion ($2.51/unit) year-to-date, up 54% from $1.9 billion in the same period last year, on $2.7 billion of Realized Performance Fees, up 54% year-over-year. Fee Related Earnings (“FRE”) was $266 million in the third quarter, up 12% from $237 million in the same period last year. GAAP Net Income was negative $255 million for the quarter, net of certain non-cash IPO and transaction related expenses and net income attributable to non-controlling interests, primarily inside ownership. Total Assets Under Management (“AUM”) reached a record $333.9 billion through a combination of consistently strong fundraising and organic expansion. • Gross inflows were $16.1 billion in the third quarter, bringing last twelve months (“LTM”) inflows to a record $96.9 billion. • Total AUM increased 17% year-over-year, despite returning $59.7 billion of capital to investors over the LTM as asset growth and above-market appreciation outpaced increased realizations. Significant capital deployment of $6.5 billion in the third quarter and $16.6 billion year-to-date was achieved by leveraging Blackstone’s diverse platform to find opportunities globally. Blackstone declared a third quarter distribution of $0.49 per common unit payable on November 2, 2015; year-to-date distributions were a record $2.12 per common unit, up 58% over the same period last year. |
 Blackstone 2 Blackstone’s Third Quarter 2015 Earnings “n/m” = Not Meaningful. % Change % Change (Dollars in Thousands, Except per Unit Data) 3Q'14 3Q'15 vs. 3Q'14 YTD'14 YTD'15 vs. YTD'14 Fee Revenues 658,465 $ 707,826 $ 7% 1,889,897 $ 1,913,474 $ 1% Performance Fees 891,087 (639,349) n/m 3,068,539 1,604,051 (48)% Investment Income (Loss) 80,766 (136,131) n/m 373,204 64,284 (83)% Interest Income and Dividend Revenue 23,585 35,459 50% 68,041 96,936 42% Total Revenues 1,653,903 (32,195) n/m 5,399,681 3,678,745 (32)% Total Expenses 816,028 356,661 (56)% 2,385,565 1,906,791 (20)% Taxes 79,519 27,070 (66)% 115,863 57,376 (50)% Economic Net Income (Loss) (“ENI”) 758,356 $ (415,926) $ n/m 2,898,253 $ 1,714,578 $ (41)% ENI per Unit 0.66 $
(0.35) $
n/m 2.51 $
1.45 $
(42)% GAAP Net Income (Loss) 250,505 $ (254,697) $ n/m 1,033,138 $ 508,919 $ (51)% Fee Related Earnings (“FRE”) 236,820 $ 265,667 $ 12% 618,287 $ 624,732 $ 1% Distributable Earnings (“DE”) 686,086 $ 691,534 $ 1% 1,929,904 $ 2,965,661 $ 54% DE per Common Unit 0.54 $
0.58 $
7% 1.59 $
2.51 $
58% Total AUM 284,414,936 $ 333,925,521 $ 17% 284,414,936 $ 333,925,521 $ 17% Fee-Earning AUM 214,819,600 $ 240,939,356 $ 12% 214,819,600 $ 240,939,356 $ 12% |
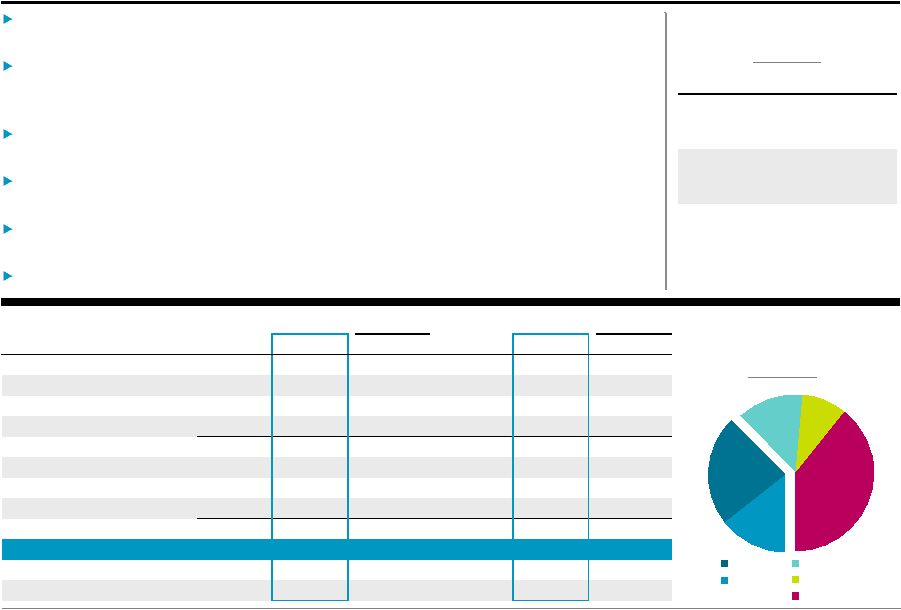
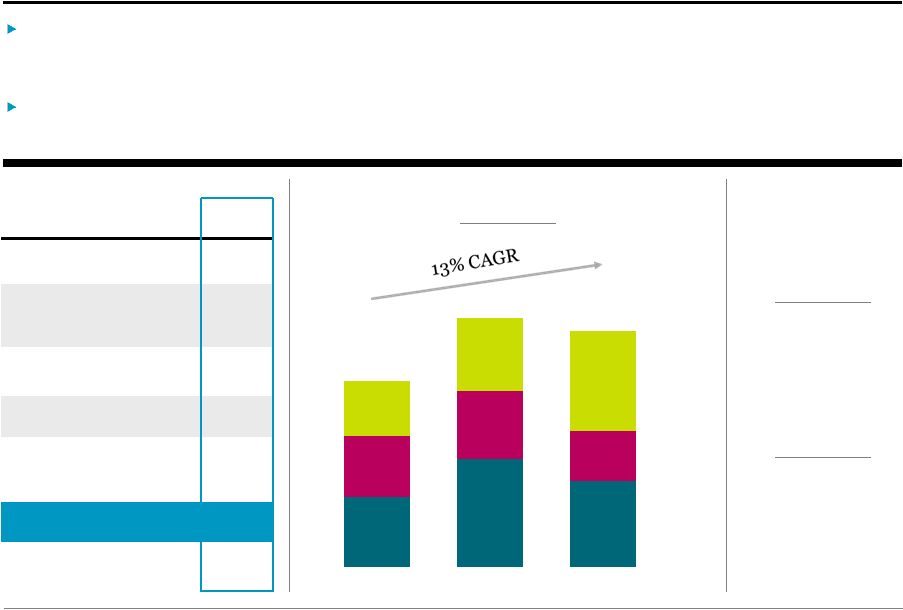
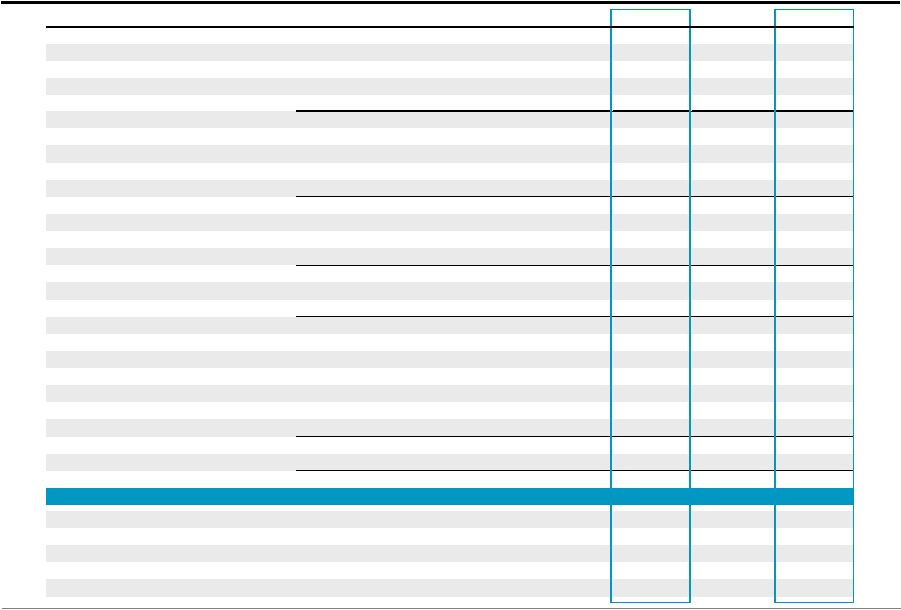
 Blackstone 3 Private Equity 9.5% 3Q’15 LTM increase in fund carrying value $215 million 3Q’15 Realized Performance Fees $91.5 billion Total AUM up 31% YoY Carrying value decline of 2.3% in the quarter was driven principally by a decline in public investment values despite strong underlying revenue and EBITDA growth trends across the portfolio. • Overall appreciation of 7.7% year-to-date and 9.5% LTM significantly outperformed broader market indices. Realizations remained strong with $2.7 billion realized during the quarter and $14.2 billion realized LTM on public and strategic exits in corporate private equity funds. Completed the private sales of Center Parcs, CMS Info Systems and Agile Electric and public share sales of Summit Materials, Michaels Stores and Scout24. Announced the strategic sales of AVINTIV, SunGard Data Systems and Vivint Solar, which are expected to close later this year. Deployed $1.7 billion and committed an additional $1.2 billion of capital during the quarter across several new investments and accretive add-on acquisitions to the portfolio. Raised $3.7 billion across various tactical opportunities and corporate private equity mandates; launched fundraising for the seventh secondary fund. % Change % Change (Dollars in Thousands) 3Q'14 3Q'15 vs. 3Q'14 YTD'14 YTD'15 vs. YTD'14 Fee Revenues 153,545 $ 126,019 $ (18)% 421,265 $ 351,261 $ (17)% Performance Fees 221,368 (594,831) n/m 1,222,842 595,971 (51)% Investment Income (Loss) 7,667 (63,772) n/m 151,643 40,488 (73)% Interest Income and Dividend Revenue 5,346 8,119 52% 15,240 23,403 54% Total Revenues 387,926 (524,465) n/m 1,810,990 1,011,123 (44)% Compensation 79,007 69,522 (12)% 225,352 206,690 (8)% Performance Fee Compensation 124,378 (125,145) n/m 361,915 173,385 (52)% Other Operating Expenses 34,109 43,693 28% 106,308 144,906 36% Total Expenses 237,494 (11,930) n/m 693,575 524,981 (24)% Economic Income (Loss) 150,432 $ (512,535) $ n/m 1,117,415 $ 486,142 $ (56)% Total AUM 69,890,367 $ 91,490,669 $ 31% 69,890,367 $ 91,490,669 $ 31% Fee-Earning AUM 43,817,741 $ 50,560,404 $ 15% 43,817,741 $ 50,560,404 $ 15% |
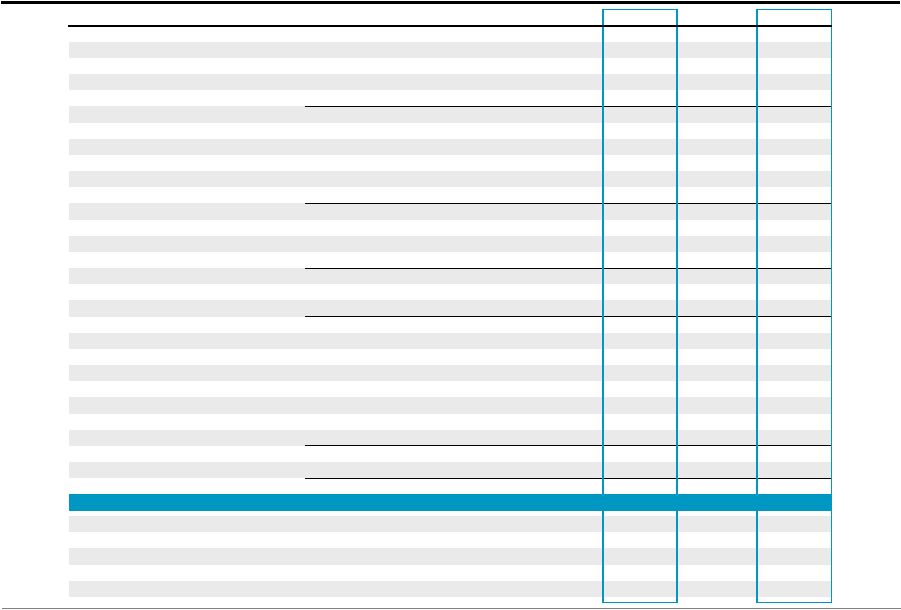
 Blackstone 4 Real Estate 14.2% 3Q’15 LTM increase in fund carrying value $173 million 3Q’15 Realized Performance Fees $93.2 billion Total AUM up 16% YoY Opportunistic Real Estate funds’ carrying value was down 0.1% during the quarter as strong operating fundamentals across the portfolio were offset by declines in public investment values. • Appreciation of 8.6% year-to-date and 14.2% LTM significantly outpaced broader market indices. Unique scale and reach of global platform resulted in continued active investment pace, with $4.3 billion invested in the third quarter and an additional $4.5 billion committed as of quarter end. Active pace of realizations with $3.0 billion in the quarter driven by private sales including Center Parcs and the NY Times Office building, bringing LTM realizations to $23.5 billion. Total AUM was up 16% year-over-year to $93.2 billion as a result of record level of fundraising activity and strong market appreciation, while Fee-Earning AUM was up 24% year-over-year to $64.9 billion. • Robust quarterly fundraising of $3.8 billion, including $2.5 billion for the Core+ real estate strategy, bringing Total AUM to $8.5 billion less than two years after launching the business. % Change % Change (Dollars in Thousands) 3Q'14 3Q'15 vs. 3Q'14 YTD'14 YTD'15 vs. YTD'14 Fee Revenues 185,400 $ 186,015 $ 0% 512,856 $ 502,638 $ (2)% Performance Fees 537,197 46,860 (91)% 1,414,677 864,412 (39)% Investment Income (Loss) 63,665 (55,561) n/m 172,628 31,034 (82)% Interest Income and Dividend Revenue 7,135 11,057 55% 21,254 31,313 47% Total Revenues 793,397 188,371 (76)% 2,121,415 1,429,397 (33)% Compensation 90,586 99,255 10% 256,401 263,573 3% Performance Fee Compensation 173,445 36,581 (79)% 455,708 254,434 (44)% Other Operating Expenses 36,138 42,050 16% 105,787 125,539 19% Total Expenses 300,169 177,886 (41)% 817,896 643,546 (21)% Economic Income 493,228 $ 10,485 $ (98)% 1,303,519 $ 785,851 $ (40)% Total AUM 80,188,858 $ 93,187,556 $ 16% 80,188,858 $ 93,187,556 $ 16% Fee-Earning AUM 52,308,175 $ 64,858,622 $ 24% 52,308,175 $ 64,858,622 $ 24% |
 Blackstone 5 Hedge Fund Solutions 3.6% 3Q’15 LTM Composite Gross Return $35.8 billion Incentive Fee Eligible AUM at 3Q’15 $2.2 billion 3Q’15 Fee-Earning Gross Inflows The composite gross return was down 0.9% for the quarter demonstrating BAAM’s ability to provide downside protection in difficult global markets. • Returns were up 2.8% year-to-date and 3.6% LTM, outperforming global markets with significantly lower volatility. Fee-Earning gross inflows of $2.2 billion during the quarter and $9.5 billion LTM were driven by investments in customized and commingled strategies and individual investor solutions. • October 1 subscriptions of $557 million are not yet included in Fee-Earning AUM. Total AUM reached $68.4 billion driven by customized strategies growth and continued platform diversification. • Total AUM for BAAM’s individual investor solutions platform reached $5.8 billion, up from $2.7 billion as of the third quarter of 2014. • BAAM’s third seeding vehicle held its first close with $655 million in commitments. • BAAM held its final closing for its first permanent capital vehicle acquiring general partner interests in hedge funds, bringing total commitments to $3.3 billion. The composite gross return is based on the BAAM Principal Solutions (“BPS”) Composite which does not include BAAM's individual
investor solutions (liquid alternatives), long-only equity, long-biased commodities, ventures (seeding and minority interests), strategic opportunities (co-investments), Senfina (direct trading) and advisory (non-discretionary) platforms, except for investments by BPS funds directly into those platforms. BAAM-managed funds in liquidation are also excluded. On a net of fees basis, the BPS Composite was (1.0)% for 3Q’15, 2.2% for
YTD’15 and 2.7% for LTM’15. % Change
% Change (Dollars in Thousands) 3Q'14 3Q'15 vs. 3Q'14 YTD'14 YTD'15 vs. YTD'14 Fee Revenues 121,286 $ 133,238 $ 10% 354,830 $ 392,080 $ 10% Performance Fees 32,156 (32,322) n/m 128,615 66,405 (48)% Investment Income (Loss) 1,525 (6,879) n/m 26,227 (12,496) n/m Interest Income and Dividend Revenue 2,724 4,136 52% 7,725 12,055 56% Total Revenues 157,691 98,173 (38)% 517,397 458,044 (11)% Compensation 41,940 44,408 6% 125,852 146,353 16% Performance Fee Compensation 11,090 (10,488) n/m 45,292 25,185 (44)% Other Operating Expenses 20,480 24,147 18% 65,061 65,852 1% Total Expenses 73,510 58,067 (21)% 236,205 237,390 1% Economic Income 84,181 $ 40,106 $ (52)% 281,192 $ 220,654 $ (22)% Total AUM 64,183,863 $ 68,405,948 $ 7% 64,183,863 $ 68,405,948 $ 7% Fee-Earning AUM 62,037,082 $ 65,182,338 $ 5% 62,037,082 $ 65,182,338 $ 5% |
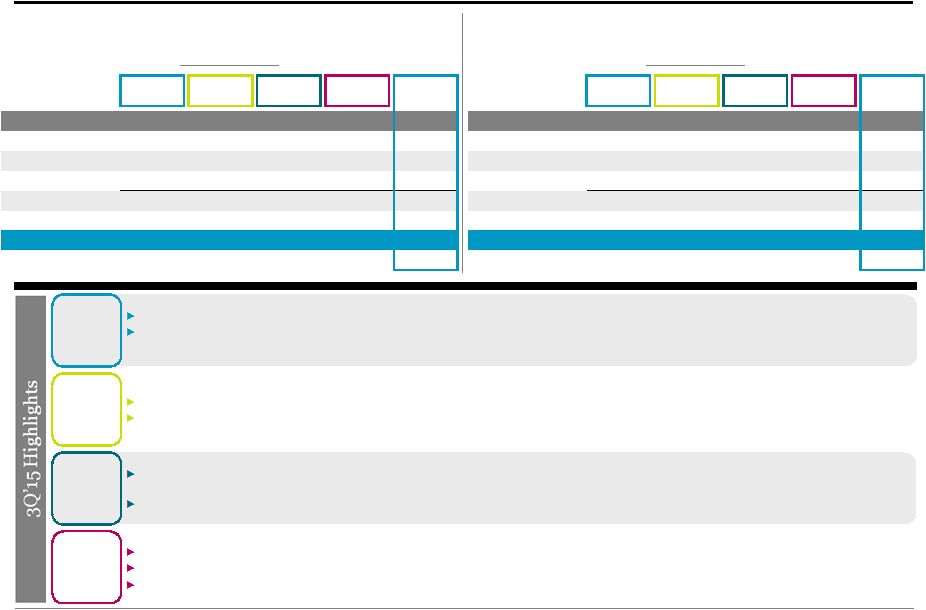
 Blackstone 6 14% 24% Credit $80.8 billion 3Q’15 Total AUM Investment Performance Gross Returns Returns in all three alternative credit strategies were impacted by declines in public markets. Total AUM growth of 15% over the past year was driven by strong fundraising for new product launches, including $7.7 billion for the new energy focused funds, credit alpha strategies and European senior debt strategy. Fee Revenues of $116 million in the quarter, up 3% year-over-year reflects a stable Fee-Earning AUM base with a predictable Management Fee Revenue stream. Launched 10 CLOs over the past year (six U.S. and four European) raising $5.5 billion of capital including a $618 million U.S. CLO during the third quarter. Deployed $432 million and committed an additional $1.5 billion of capital during the quarter across the drawdown funds. Robust realizations of $1.1 billion across drawdown funds in the quarter. Long Only Funds Alternative Strategies Funds For Mezzanine and Rescue Lending Strategies, Investment Performance represents the combined cash flows of the fee-earning funds
exceeding $100 million of fair value at each respective quarter end. For Hedge Fund Strategies, Investment Performance represents the weighted-average composite of the fee-earning funds exceeding $100 million of
fair value at each respective quarter end. Investment Performance excludes the Blackstone Funds that were contributed to GSO as part of Blackstone’s acquisition of GSO in March 2008. Mezzanine Strategies’ net returns were (3.2)% for 3Q’15 and 4.4% for YTD’15, Rescue Lending Strategies’ net returns were (5.7)% for 3Q’15 and (1.0)% for YTD’15 and Hedge Fund Strategies’ net returns were (2.4)% for 3Q’15 and
0.1% for YTD’15. Performing Credit includes Mezzanine Funds and business development companies (“BDCs”). Customized Credit Strategies (“CCS”) include closed-end funds, commingled funds, the exchange traded
fund and separately managed accounts. CLOs
CCS % Change % Change (Dollars in Thousands) 3Q'14 3Q'15 vs. 3Q'14 YTD'14 YTD'15 vs. YTD'14 Fee Revenues 113,240 $ 116,489 $ 3% 330,472 $ 360,957 $ 9% Performance Fees 100,366 (59,056) n/m 302,405 77,263 (74)% Investment Income (Loss) 7,932 (8,442) n/m 20,826 6,165 (70)% Interest Income and Dividend Revenue 5,968 6,053 1% 16,721 17,642 6% Total Revenues 227,506 55,044 (76)% 670,424 462,027 (31)% Compensation 54,877 51,324 (6)% 156,939 148,325 (5)% Performance Fee Compensation 51,249 (31,427) n/m 152,339 35,774 (77)% Other Operating Expenses 20,860 24,898 19% 75,858 70,273 (7)% Total Expenses 126,986 44,795 (65)% 385,136 254,372 (34)% Economic Income 100,520 $ 10,249 $ (90)% 285,288 $ 207,655 $ (27)% Total AUM 70,151,848 $ 80,841,348 $ 15% 70,151,848 $ 80,841,348 $ 15% Fee-Earning AUM 56,656,602 $ 60,337,992 $ 6% 56,656,602 $ 60,337,992 $ 6% 3Q'15 YTD'15 Mezzanine Strategies (3.2)% 6.1% Rescue Lending Strategies (6.3)% (0.7)% Hedge Fund Strategies (2.2)% 1.4% 14% 9% 39% Hedge Fund Strategies Rescue Lending Performing Credit |
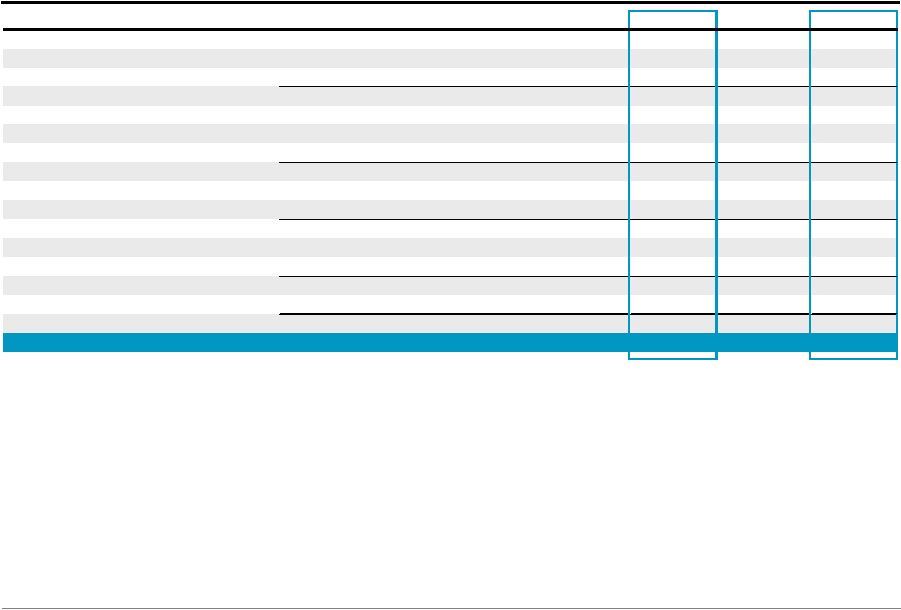
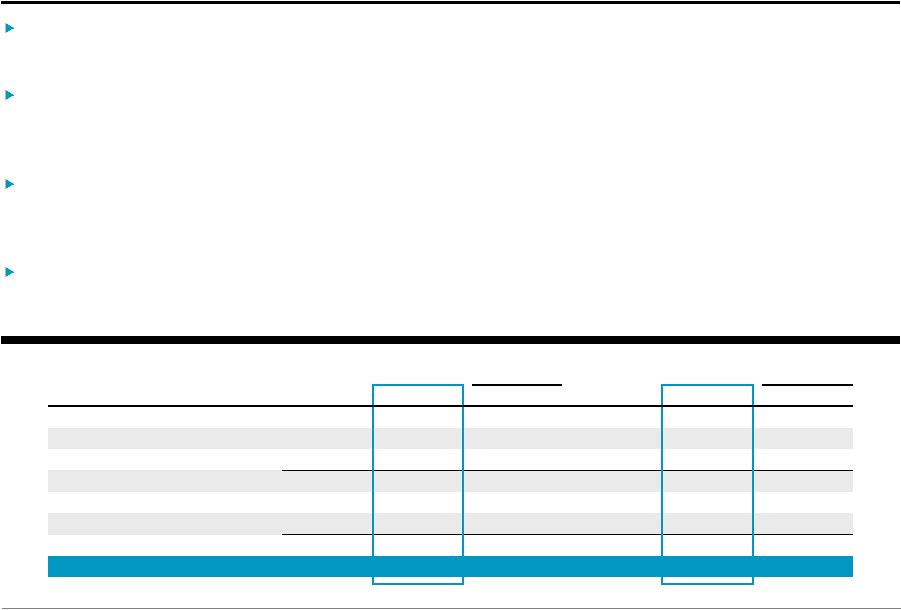 Blackstone 7 Financial Advisory The spin-off of Blackstone’s Advisory businesses was completed on October 1, 2015. The new company, PJT Partners Inc., is now formally separated from Blackstone and trades on the New York Stock Exchange under the ticker PJT. Fee Revenues rose 72% in the third quarter compared to the prior year primarily due to increased deal size of closed Advisory transactions. % Change % Change (Dollars in Thousands) 3Q'14 3Q'15 vs. 3Q'14 YTD'14 YTD'15 vs. YTD'14 Fee Revenues 84,994 $ 146,065 $ 72% 270,474 $ 306,538 $ 13% Investment Income (Loss) (23) (1,477) n/m 1,880 (907) n/m Interest Income and Dividend Revenue 2,412 6,094 153% 7,101 12,523 76% Total Revenues 87,383 150,682 72% 279,455 318,154 14% Compensation 58,016 65,066 12% 189,442 183,824 (3)% Other Operating Expenses 19,853 22,777 15% 63,311 62,678 (1)% Total Expenses 77,869 87,843 13% 252,753 246,502 (2)% Economic Income 9,514 $ 62,839 $ 560% 26,702 $ 71,652 $ 168% Total expenses (which do not include expenses related to the spin-off transaction) increased 13% in the third quarter compared to the prior year primarily due to an increase in compensation expenses resulting from increased Fee Revenues. |
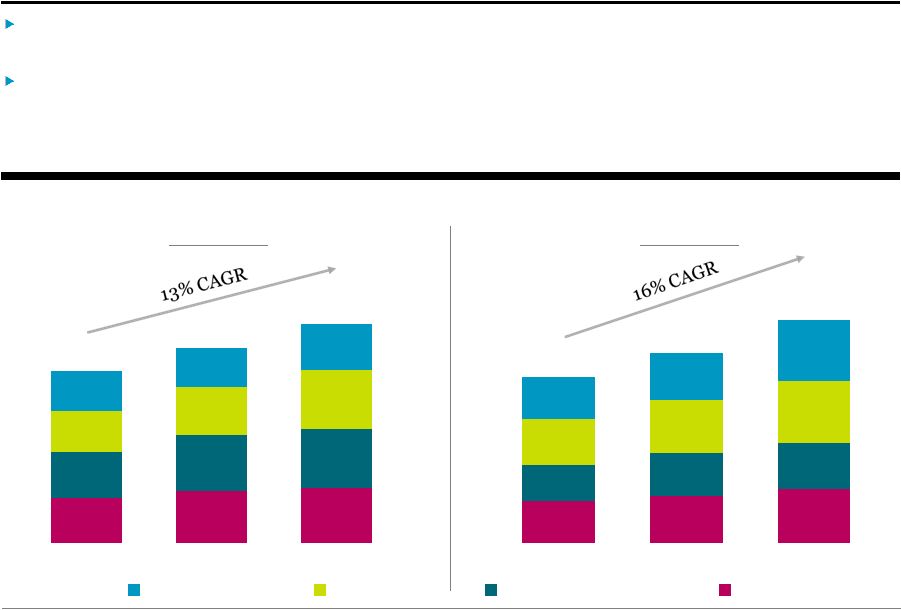 Blackstone 8 $49.5 $56.7 $60.3 $50.8 $62.0 $65.2 $44.7 $52.3 $64.9 $43.6 $43.8 $50.6 3Q'13 3Q'14 3Q'15 $63.3 $70.2 $80.8 $53.2 $64.2 $68.4 $69.0 $80.2 $93.2 $62.6 $69.9 $91.5 3Q'13 3Q'14 3Q'15 Total AUM by Segment (Dollars in Billions) $284.4 $333.9 $248.1 Fee-Earning AUM by Segment (Dollars in Billions) $214.8 $240.9 $188.6 Private Equity Real Estate Hedge Fund Solutions Credit Record Fee-Earning AUM of $240.9 billion was up 12% year-over-year as $66.0 billion of gross inflows
significantly outpaced $37.6 billion of realizations
and outflows. Total AUM increased 17%
year-over-year to $333.9 billion driven by $96.9 billion from gross inflows and $12.3 billion from strong fund appreciation. • Each segment had significant growth despite $59.7 billion of capital returned to investors over the LTM period.
Assets Under Management |
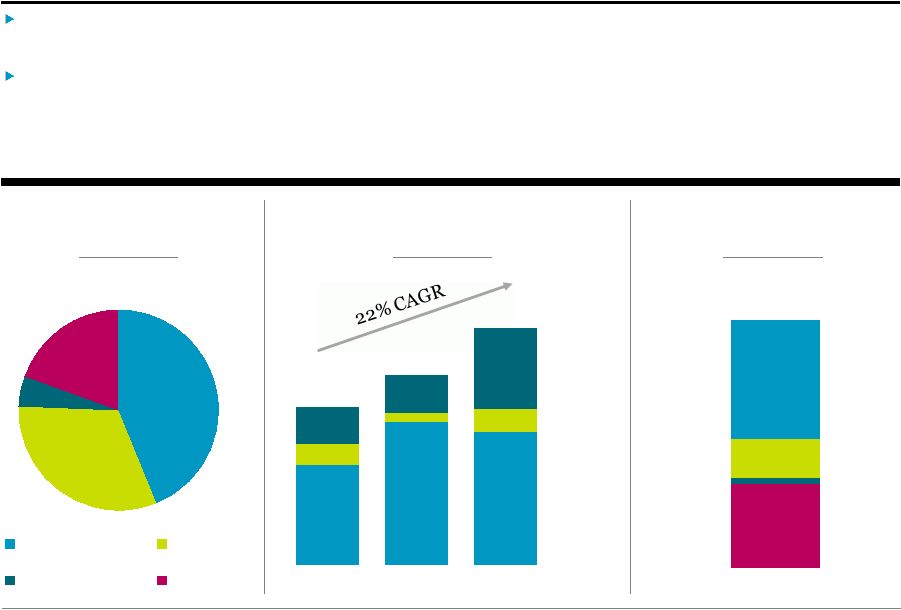 Blackstone 9 $37.3 $27.0 $4.1 $16.6 Additional Capital Detail Record undrawn capital (“Total Dry Powder”) of $84.9 billion, up 101% year-over-year, driven by fundraises for the latest global private equity and real estate funds. Performance Fee Eligible AUM reached $247.1 billion at quarter end, up 25% year-over-year, despite significant realizations in the Real Estate and Private Equity segments. • Consistently strong fundraising drove a 116% year-over-year increase in Performance Fee Eligible assets not yet invested to $85.1 billion. Private Equity Real Estate Hedge Fund Solutions Credit $85 billion 3Q’15 Total Dry Powder $48 billion Not Currently Earning Management Fees $16.0 $7.6 $23.0 Credit Hedge Fund Solutions Real Estate Private Equity $47.7 $104.0 $148.8 $138.6 $22.5 $9.8 $23.4 $38.4 $39.4 $85.1 3Q'13 3Q'14 3Q'15 Uninvested Not Currently Earning Fees Currently Earning Fees $247 billion Performance Fee Eligible AUM $197.9 $247.1 $164.9 |
 Blackstone 10 $2.44 $3.78 $3.03 $2.16 $2.38 $1.74 $1.92 $2.56 $3.51 3Q'13 3Q'14 3Q'15 At September 30, 2015, Blackstone had $4.2 billion in total cash, corporate treasury and liquid investments and $9.8 billion of total net value, or $8.28 per DE unit, up 13% compounded annually from $6.51 at the same period in 2013. As of the end of the third quarter, Blackstone had no net debt, over $9.8 billion of total net value on the balance sheet and maintained its A+/A+ ratings. Balance Sheet Highlights Balance Sheet Highlights are preliminary, and exclude the consolidated Blackstone funds. Liquid Investments are primarily Blackstone
investments in Hedge Fund Solutions and non-drawdown
Credit. Illiquid Investments include Blackstone investments in Private Equity, Real Estate and Other, which were $796 million, $1.0 billion, and
$259 million, respectively, as of September 30, 2015,
$965 million, $1.4 billion, and $402 million, respectively, as of September 30, 2014 and $922 million, $1.3 billion, and $257 million, respectively, as of September 30, 2013. Cash and Investments per unit amounts are calculated using period end DE Units Outstanding (see page 30, Unit Rollforward).
(Dollars in Millions)
3Q’15 Cash and Cash Equivalents $ 1,380 Treasury Cash Management Strategies 2,602 Liquid Investments 172 Illiquid Investments 2,066 Net Accrued Performance Fees 3,585 Total Net Value $ 9,805 Outstanding Bonds (at par) $ 2,822 A+/A+ rated by S&P and Fitch $1.1 billion undrawn credit revolver with May 2019 maturity $4.2 billion total cash, corporate treasury and liquid investments Cash and Investments Net Performance Fees Total Cash and Liquids Illiquids $8.28 $8.72 $6.51 |
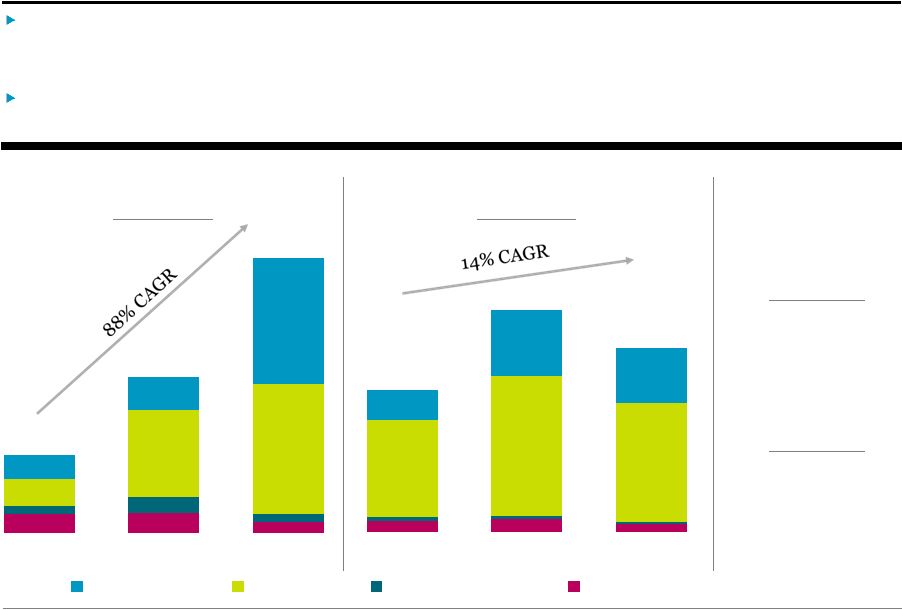 Blackstone 11 $188 $197 $106 $157 $267 $861 $1,287 $236 $327 $1,242 3Q'13 LTM 3Q'14 LTM 3Q'15 LTM $1,890 $2,730 $2,316 $589 $1,294 $1,075 3Q'13 3Q'14 3Q'15 Net Accrued Performance Fees were $3.6 billion ($3.03/unit) despite high Net Realized Performance Fees of $2.7 billion over the LTM period. • Realized 63% of the $4.3 billion Net Accrued Performance Fees balance from one year prior. Net Realized Performance Fees grew at a 88% compound annual growth rate since the third quarter of 2013, primarily driven by increased realizations in Private Equity and Real Estate. Performance Fees Net Realized Performance Fees (Dollars in Millions) $1,542 $2,715 $768 Net Accrued Performance Fees (Dollars in Millions) $4,334 $3,585 $2,769 Private Equity Real Estate Credit Hedge Fund Solutions $3.6 billion Net Accrued Performance Fees 58% Net Accrued Performance Fees Related to Publics/Pending Exits $2.7 billion 3Q’15 LTM Net Realized Performance Fees |
 Blackstone 12 GAAP Statement of Operations % Change % Change (Dollars in Thousands, Except per Unit Data) (Unaudited) 3Q'14 3Q'15 vs. 3Q'14 YTD'14 YTD'15 vs. YTD'14 Revenues Management and Advisory Fees, Net 640,949 $ 703,596 $ 10% 1,833,632 $ 1,894,496 $ 3% Performance Fees Realized Carried Interest 638,676 435,189 (32)% 1,613,958 2,580,266 60% Realized Incentive Fees 35,445 33,455 (6)% 118,743 110,775 (7)% Unrealized Carried Interest 222,105 (1,055,920) n/m 1,213,181 (1,124,010) n/m Unrealized Incentive Fees (6,163) (50,832) 725% 112,709 36,274 (68)% Total Performance Fees 890,063 (638,108) n/m 3,058,591 1,603,305 (48)% Investment Income (Loss) Realized 91,142 99,952 10% 459,878 445,705 (3)% Unrealized 38,445 (179,298) n/m 62,754 (262,024) n/m Total Investment Income (Loss) 129,587 (79,346) n/m 522,632 183,681 (65)% Interest and Dividend Revenue 18,107 26,244 45% 47,516 70,129 48% Other 720 (813) n/m 1,583 (2,478) n/m Total Revenues 1,679,426 11,573 (99)% 5,463,954 3,749,133 (31)% Expenses Compensation and Benefits Compensation 525,093 393,655 (25)% 1,511,085 1,426,233 (6)% Performance Fee Compensation Realized Carried Interest 186,003 97,798 (47)% 595,702 628,079 5% Realized Incentive Fees 19,029 15,062 (21)% 61,173 49,126 (20)% Unrealized Carried Interest 164,132 (228,697) n/m 319,158 (204,876) n/m Unrealized Incentive Fees (9,002) (14,641) 63% 39,221 16,450 (58)% Total Compensation and Benefits 885,255 263,177 (70)% 2,526,339 1,915,012 (24)% General, Administrative and Other 128,015 158,664 24% 400,061 436,496 9% Interest Expense 31,615 36,860 17% 86,129 105,644 23% Fund Expenses 10,253 18,296 78% 20,241 76,845 280% Total Expenses 1,055,138 476,997 (55)% 3,032,770 2,533,997 (16)% Other Income (Loss) Net Gains (Losses) from Fund Investment Activities 8,682 (16,867) n/m 217,422 158,703 (27)% Income Before Provision for Taxes 632,970 $ (482,291) $ n/m 2,648,606 $ 1,373,839 $ (48)% Provision for Taxes 79,108 1,573 (98)% 216,487 144,168 (33)% Net Income (Loss) 553,862 $ (483,864) $ n/m 2,432,119 $ 1,229,671 $ (49)% Net Income (Loss) Attributable to Redeemable Non-Controlling Interests in Consolidated
(23,328) (12,520) (46)% 44,950 8,787 (80)% 55,491 30,671 (45)% 239,513 179,183 (25)% Net Income (Loss) Attributable to Non-Controlling Interests in Blackstone Holdings
271,194 (247,318) n/m 1,114,518 532,782 (52)% Net Income (Loss) Attributable to The Blackstone Group L.P. ("BX")
250,505 $ (254,697) $ n/m 1,033,138 $ 508,919 $ (51)% Net Income (Loss) per Common Unit, Basic 0.41 $
(0.40) $
n/m 1.70 $
0.81 $
(52)% Net Income (Loss) per Common Unit, Diluted 0.41 $
(0.40) $
n/m 1.69 $
0.80 $
(53)% Net Income Attributable to Non-Controlling Interests in Consolidated Entities |
 Appendix * * * * * * * * |
 Blackstone 14 Total Segments (Dollars in Thousands) 3Q'14 4Q'14 1Q'15 2Q'15 3Q'15 YTD'14 YTD'15 Revenues Management and Advisory Fees, Net Base Management Fees 505,493 $ 508,588 $ 516,397 $ 516,492 $ 564,287 $ 1,478,941 $ 1,597,176 $ Advisory Fees 84,131 151,837 84,238 76,998 146,153 269,008 307,389 Transaction and Other Fees, Net
90,885 46,446 37,073 11,728 32,403 199,991 81,204 Management Fee Offsets
(22,763) (27,146) (17,945) (18,434) (34,176) (59,625) (70,555) Total Management and Advisory Fees, Net
657,746 679,725 619,763 586,784 708,667 1,888,315 1,915,214 Performance Fees Realized Carried Interest 638,752 836,562 1,207,594 937,483 435,189 1,614,034 2,580,266 Realized Incentive Fees 36,840 131,777 29,670 47,819 34,785 129,968 112,274 Unrealized Carried Interest
222,026 495,935 373,852 (441,949) (1,055,977) 1,213,026 (1,124,074) Unrealized Incentive Fees (6,531) (140,936) 62,620 26,311 (53,346) 111,511 35,585 Total Performance Fees
891,087 1,323,338 1,673,736 569,664 (639,349) 3,068,539 1,604,051 Investment Income (Loss) Realized 75,832 153,477 107,792 136,497 87,526 389,948 331,815 Unrealized 4,934 (55,053) 81,849 (125,723) (223,657) (16,744) (267,531) Total Investment Income (Loss)
80,766 98,424 189,641 10,774 (136,131) 373,204 64,284 Interest Income and Dividend Revenue
23,585 28,303 30,451 31,026 35,459 68,041 96,936 Other 719 7,823
(4,872)
3,973
(841)
1,582
(1,740)
Total Revenues
1,653,903 2,137,613 2,508,719 1,202,221 (32,195) 5,399,681 3,678,745 Expenses Compensation 324,426 199,525 329,838 289,352 329,575 953,986 948,765 Performance Fee Compensation
Realized Carried Interest
186,003 219,941 292,248 238,032 97,799 595,702 628,079 Realized Incentive Fees
19,029 48,926 12,227 21,837 15,061 61,173 49,125 Unrealized Carried Interest
164,132 59,879 74,380 (50,559) (228,697) 319,158 (204,876) Unrealized Incentive Fees
(9,002) (58,497) 24,961 6,131 (14,642) 39,221 16,450 Total Compensation and Benefits
684,588 469,774 733,654 504,793 199,096 1,969,240 1,437,543 Other Operating Expenses 131,440 137,457 143,282 168,401 157,565 416,325 469,248 Total Expenses 816,028 607,231 876,936 673,194 356,661 2,385,565 1,906,791 Economic Income (Loss) 837,875 $ 1,530,382 $ 1,631,783 $ 529,027 $ (388,856) $ 3,014,116 $ 1,771,954 $ Economic Net Income (Loss) 758,356 $ 1,446,733 $ 1,622,064 $ 508,440 $ (415,926) $ 2,898,253 $ 1,714,578 $ Fee Related Earnings 236,820 $ 384,720 $ 180,624 $ 178,441 $ 265,667 $ 618,287 $ 624,732 $ Distributable Earnings 686,086 $ 1,134,054 $ 1,240,207 $ 1,033,920 $ 691,534 $ 1,929,904 $ 2,965,661 $ Total Assets Under Management 284,414,936 $ 290,381,069 $ 310,451,289 $ 332,723,546 $ 333,925,521 $ 284,414,936 $ 333,925,521 $ Fee-Earning Assets Under Management 214,819,600 $ 216,691,799 $ 223,511,700 $ 239,342,214 $ 240,939,356 $ 214,819,600 $ 240,939,356 $ Weighted Average Fee-Earning AUM 213,525,423 $ 215,196,253 $ 218,241,987 $ 237,576,488 $ 239,786,680 $ 210,597,134 $ 238,291,612 $ LP Capital Invested 6,664,365 $ 7,810,098 $ 4,765,536 $ 4,814,362 $ 6,145,446 $ 16,559,403 $ 15,725,344 $ Total Capital Invested 7,619,737 $ 8,090,350 $ 5,052,370 $ 5,048,058 $ 6,507,371 $ 18,285,610 $ 16,607,799 $ |
 Blackstone 15 Private Equity (Dollars in Thousands) 3Q'14 4Q'14 1Q'15 2Q'15 3Q'15 YTD'14 YTD'15 Revenues Management Fees, Net Base Management Fees 108,236 $ 105,817 $ 108,383 $ 121,918 $ 128,452 $ 310,024 $ 358,753 $ Transaction and Other Fees, Net 48,996 15,183 20,359 (12,131) 9,358 119,459 17,586 Management Fee Offsets (5,837) (7,350) (4,949) (9,028) (12,262) (11,796) (26,239) Total Management Fees, Net 151,395 113,650 123,793 100,759 125,548 417,687 350,100 Performance Fees Realized Carried Interest 124,913 297,290 382,978 546,575 214,532 457,112 1,144,085 Unrealized Carried Interest 96,455 457,098 566,822 (305,573) (809,363) 765,730 (548,114) Total Performance Fees 221,368 754,388 949,800 241,002 (594,831) 1,222,842 595,971 Investment Income (Loss) Realized 20,421 46,951 44,816 50,258 46,917 155,768 141,991 Unrealized (12,754) (19,789) 31,487 (22,301) (110,689) (4,125) (101,503) Total Investment Income (Loss) 7,667 27,162 76,303 27,957 (63,772) 151,643 40,488 Interest Income and Dividend Revenue 5,346 6,743 7,617 7,667 8,119 15,240 23,403 Other 2,150 2,991 (1,825) 2,515 471 3,578 1,161 Total Revenues 387,926 904,934 1,155,688 379,900 (524,465) 1,810,990 1,011,123 Expenses Compensation 79,007 51,095 70,089 67,079 69,522 225,352 206,690 Performance Fee Compensation Realized Carried Interest 30,944 36,958 39,482 106,502 16,303 229,435 162,287 Unrealized Carried Interest 93,434 77,966 178,120 (25,574) (141,448) 132,480 11,098 Total Compensation and Benefits 203,385 166,019 287,691 148,007 (55,623) 587,267 380,075 Other Operating Expenses 34,109 36,590 38,755 62,458 43,693 106,308 144,906 Total Expenses 237,494 202,609 326,446 210,465 (11,930) 693,575 524,981 Economic Income (Loss) 150,432 $ 702,325 $ 829,242 $ 169,435 $ (512,535) $ 1,117,415 $ 486,142 $ Total Assets Under Management 69,890,367 $ 73,073,252 $ 76,327,189 $ 92,026,337 $ 91,490,669 $ 69,890,367 $ 91,490,669 $ Fee-Earning Assets Under Management 43,817,741 $ 43,890,167 $ 49,342,211 $ 49,537,189 $ 50,560,404 $ 43,817,741 $ 50,560,404 $ Weighted Average Fee-Earning AUM 43,838,483 $ 42,899,791 $ 45,051,839 $ 49,925,744 $ 50,268,174 $ 44,328,213 $ 50,307,467 $ LP Capital Invested 2,277,861 $ 3,459,063 $ 2,374,599 $ 1,800,854 $ 1,535,702 $ 6,164,210 $ 5,711,155 $ Total Capital Invested 3,172,660 $ 3,593,887 $ 2,517,769 $ 1,949,748 $ 1,677,876 $ 7,603,111 $ 6,145,393 $ |
 Blackstone 16 Real Estate (Dollars in Thousands) 3Q'14 4Q'14 1Q'15 2Q'15 3Q'15 YTD'14 YTD'15 Revenues Management Fees, Net Base Management Fees 155,089 $ 156,208 $ 152,348 $ 140,743 $ 175,710 $ 472,294 $ 468,801 $ Transaction and Other Fees, Net 38,312 26,220 15,216 21,510 21,390 65,390 58,116 Management Fee Offsets (8,977) (8,540) (4,866) (5,428) (10,147) (25,903) (20,441) Total Management Fees, Net 184,424 173,888 162,698 156,825 186,953 511,781 506,476 Performance Fees Realized Carried Interest 349,237 526,041 811,249 363,983 169,051 961,721 1,344,283 Realized Incentive Fees 1,159 4,296 723 1,220 3,879 7,203 5,822 Unrealized Carried Interest
187,175 77,173 (181,019) (188,608) (128,854) 446,873 (498,481) Unrealized Incentive Fees (374) (4,401) 6,069 3,935 2,784 (1,120) 12,788 Total Performance Fees 537,197 603,109 637,022 180,530 46,860 1,414,677 864,412 Investment Income (Loss) Realized 49,173 105,901 71,344 85,432 39,821 203,194 196,597 Unrealized 14,492 (28,364) 37,510 (107,691) (95,382) (30,566) (165,563) Total Investment Income (Loss) 63,665 77,537 108,854 (22,259) (55,561) 172,628 31,034 Interest Income and Dividend Revenue 7,135 8,943 9,997 10,259 11,057 21,254 31,313 Other 976 1,788 (3,977) 1,077 (938) 1,075 (3,838) Total Revenues 793,397 865,265 914,594 326,432 188,371 2,121,415 1,429,397 Expenses Compensation 90,586 69,916 84,834 79,484 99,255 256,401 263,573 Performance Fee Compensation Realized Carried Interest 64,187 173,534 246,496 116,168 52,546 259,462 415,210 Realized Incentive Fees 592 2,323 356 671 1,838 3,657 2,865 Unrealized Carried Interest
108,789 4,061 (98,084) (50,559) (23,018) 193,113 (171,661) Unrealized Incentive Fees (123) (2,227) 2,575 230 5,215 (524) 8,020 Total Compensation and Benefits
264,031 247,607 236,177 145,994 135,836 712,109 518,007 Other Operating Expenses 36,138 40,296 40,143 43,346 42,050 105,787 125,539 Total Expenses 300,169 287,903 276,320 189,340 177,886 817,896 643,546 Economic Income 493,228 $ 577,362 $ 638,274 $ 137,092 $ 10,485 $ 1,303,519 $ 785,851 $ Total Assets Under Management 80,188,858 $ 80,863,187 $ 92,785,658 $ 91,578,634 $ 93,187,556 $ 80,188,858 $ 93,187,556 $ Fee-Earning Assets Under Management 52,308,175 $ 52,563,068 $ 50,783,247 $ 62,683,857 $ 64,858,622 $ 52,308,175 $ 64,858,622 $ Weighted Average Fee-Earning AUM 52,764,267 $ 52,236,610 $ 51,671,739 $ 60,939,868 $ 63,492,663 $ 53,590,344 $ 62,809,264 $ LP Capital Invested 3,046,867 $ 3,478,850 $ 1,443,163 $ 2,963,609 $ 4,118,952 $ 7,756,292 $ 8,525,724 $ Total Capital Invested 3,071,425 $ 3,584,035 $ 1,405,603 $ 3,035,837 $ 4,326,151 $ 7,946,117 $ 8,767,591 $ |
 Blackstone 17 Hedge Fund Solutions (Dollars in Thousands) 3Q'14 4Q'14 1Q'15 2Q'15 3Q'15 YTD'14 YTD'15 Revenues Management Fees, Net Base Management Fees 121,484 $ 125,105 $ 130,637 $ 130,216 $ 133,592 $ 357,876 $ 394,445 $ Transaction and Other Fees, Net 161 189 25 - 219 380 244 Management Fee Offsets
(1,099) (929) (280) (608) (507) (4,085) (1,395) Total Management Fees, Net
120,546 124,365 130,382 129,608 133,304 354,171 393,294 Performance Fees Realized Incentive Fees 6,683 86,028 10,516 16,915 2,783 54,501 30,214 Unrealized Carried Interest - - - 8,014 (5,394) - 2,620 Unrealized Incentive Fees
25,473 (74,993) 47,427 15,855 (29,711) 74,114 33,571 Total Performance Fees 32,156 11,035 57,943 40,784 (32,322) 128,615 66,405 Investment Income (Loss) Realized 2,693 (357) (10,375) (1,757) (468) 21,907 (12,600) Unrealized (1,168) 812 4,483 2,032 (6,411) 4,320 104 Total Investment Income (Loss)
1,525 455 (5,892) 275 (6,879) 26,227 (12,496) Interest Income and Dividend Revenue 2,724 3,389 3,949 3,970 4,136 7,725 12,055 Other 740 1,196 (1,607) 459 (66) 659 (1,214) Total Revenues 157,691 140,440 184,775 175,096 98,173 517,397 458,044 Expenses Compensation 41,940 5,806 56,104 45,841 44,408 125,852 146,353 Performance Fee Compensation Realized Incentive Fees 2,312 23,950 3,470 8,711 (436) 18,501 11,745 Unrealized Carried Interest - - - 4,077 (3,041) - 1,036 Unrealized Incentive Fees
8,778 (27,064) 15,651 3,764 (7,011) 26,791 12,404 Total Compensation and Benefits 53,030 2,692 75,225 62,393 33,920 171,144 171,538 Other Operating Expenses 20,480 21,068 21,206 20,499 24,147 65,061 65,852 Total Expenses 73,510 23,760 96,431 82,892 58,067 236,205 237,390 Economic Income 84,181 $ 116,680 $ 88,344 $ 92,204 $ 40,106 $ 281,192 $ 220,654 $ Total Assets Under Management 64,183,863 $ 63,585,670 $ 66,378,908 $ 67,829,866 $ 68,405,948 $ 64,183,863 $ 68,405,948 $ Fee-Earning Assets Under Management 62,037,082 $ 61,417,558 $ 64,114,498 $ 65,512,170 $ 65,182,338 $ 62,037,082 $ 65,182,338 $ Weighted Average Fee-Earning AUM 60,009,283 $ 61,730,313 $ 62,910,553 $ 65,453,883 $ 65,782,066 $ 57,522,469 $ 64,902,211 $ LP Capital Invested 473,233 $ 25,489 $ 133,351 $ 2,131 $ 66,427 $ 828,639 $ 201,909 $ Total Capital Invested 487,398 $ 12,137 $ 139,223 $ 2,136 $ 71,132 $ 886,420 $ 212,491 $ |
 Blackstone 18 Credit (Dollars in Thousands) 3Q'14 4Q'14 1Q'15 2Q'15 3Q'15 YTD'14 YTD'15 Revenues Management Fees, Net Base Management Fees 120,684 $ 121,458 $ 125,029 $ 123,615 $ 126,533 $ 338,747 $ 375,177 $ Transaction and Other Fees, Net 3,025 4,728 1,457 2,060 1,289 13,433 4,806 Management Fee Offsets
(6,850) (10,327) (7,850) (3,370) (11,260) (17,841) (22,480) Total Management Fees, Net 116,859 115,859 118,636 122,305 116,562 334,339 357,503 Performance Fees Realized Carried Interest 164,602 13,231 13,367 26,925 51,606 195,201 91,898 Realized Incentive Fees 28,998 41,453 18,431 29,684 28,123 68,264 76,238 Unrealized Carried Interest (61,604) (38,336) (11,951) 44,218 (112,366) 423 (80,099) Unrealized Incentive Fees (31,630) (61,542) 9,124 6,521 (26,419) 38,517 (10,774) Total Performance Fees 100,366 (45,194) 28,971 107,348 (59,056) 302,405 77,263 Investment Income (Loss) Realized 3,040 1,020 2,237 2,723 1,735 8,334 6,695 Unrealized 4,892 (7,437) 6,887 2,760 (10,177) 12,492 (530) Total Investment Income (Loss)
7,932 (6,417) 9,124 5,483 (8,442) 20,826 6,165 Interest Income and Dividend Revenue
5,968 6,319 5,651 5,938 6,053 16,721 17,642 Other (3,619) 1,557 3,493 34 (73) (3,867) 3,454 Total Revenues 227,506 72,124 165,875 241,108 55,044 670,424 462,027 Expenses Compensation 54,877 31,261 49,877 47,124 51,324 156,939 148,325 Performance Fee Compensation Realized Carried Interest 90,872 9,449 6,270 15,362 28,950 106,805 50,582 Realized Incentive Fees 16,125 22,653 8,401 12,455 13,659 39,015 34,515 Unrealized Carried Interest (38,091) (22,148) (5,656) 21,497 (61,190) (6,435) (45,349) Unrealized Incentive Fees (17,657) (29,206) 6,735 2,137 (12,846) 12,954 (3,974) Total Compensation and Benefits
106,126 12,009 65,627 98,575 19,897 309,278 184,099 Other Operating Expenses 20,860 14,666 21,836 23,539 24,898 75,858 70,273 Total Expenses 126,986 26,675 87,463 122,114 44,795 385,136 254,372 Economic Income 100,520 $ 45,449 $ 78,412 $ 118,994 $ 10,249 $ 285,288 $ 207,655 $ Total Assets Under Management 70,151,848 $ 72,858,960 $ 74,959,534 $ 81,288,709 $ 80,841,348 $ 70,151,848 $ 80,841,348 $ Fee-Earning Assets Under Management 56,656,602 $ 58,821,006 $ 59,271,744 $ 61,608,998 $ 60,337,992 $ 56,656,602 $ 60,337,992 $ Weighted Average Fee-Earning AUM 56,913,390 $ 58,329,539 $ 58,607,856 $ 61,256,993 $ 60,243,777 $ 55,156,108 $ 60,272,670 $ LP Capital Invested 866,404 $ 846,696 $ 814,423 $ 47,768 $ 424,365 $ 1,810,262 $ 1,286,556 $ Total Capital Invested 888,254 $ 900,291 $ 989,775 $ 60,337 $ 432,212 $ 1,849,962 $ 1,482,324 $ |
 Blackstone 19 Financial Advisory (Dollars in Thousands) 3Q'14 4Q'14 1Q'15 2Q'15 3Q'15 YTD'14 YTD'15 Revenues Advisory Fees 84,131 $ 151,837 $ 84,238 $ 76,998 $ 146,153 $ 269,008 $ 307,389 $ Transaction and Other Fees, Net 391 126 16 289 147 1,329 452 Total Advisory and Transaction Fees
84,522 151,963 84,254 77,287 146,300 270,337 307,841 Investment Income (Loss) Realized 505 (38) (230) (159) (479) 745 (868) Unrealized (528) (275) 1,482 (523) (998) 1,135 (39) Total Investment Income (Loss)
(23) (313) 1,252 (682) (1,477) 1,880 (907) Interest Income and Dividend Revenue
2,412 2,909 3,237 3,192 6,094 7,101 12,523 Other 472 291 (956) (112) (235) 137 (1,303) Total Revenues 87,383 154,850 87,787 79,685 150,682 279,455 318,154 Expenses Compensation 58,016 41,447 68,934 49,824 65,066 189,442 183,824 Total Compensation and Benefits 58,016 41,447 68,934 49,824 65,066 189,442 183,824 Other Operating Expenses 19,853 24,837 21,342 18,559 22,777 63,311 62,678 Total Expenses 77,869 66,284 90,276 68,383 87,843 252,753 246,502 Economic Income (Loss) 9,514 $ 88,566 $ (2,489) $ 11,302 $ 62,839 $ 26,702 $ 71,652 $ |
 Blackstone 20 Unitholder Distribution Generated $0.58 of Distributable Earnings per common unit during the quarter, bringing the year-to-date amount to $2.51 per common unit, up 58% compared to the same period last year. Declared a quarterly distribution of $0.49 per common unit to record holders as of October 26, 2015; payable on November 2, 2015. % Change % Change (Dollars in Thousands, Except per Unit Data) 3Q'14 4Q'14 1Q'15 2Q'15 3Q'15 vs. 3Q'14 YTD'14 YTD'15 vs. YTD'14 686,086 $ 1,134,054 $ 1,240,207 $ 1,033,920 $ 691,534 $ 1% 1,929,904 $ 2,965,661 $ 54% Add: Other Payables Attributable to Common Unitholders 69,707 87,977 7,288 - - (100)% 119,447 7,288 (94)% DE before Certain Payables 755,793 1,222,031 1,247,495 1,033,920 691,534 (9)% 2,049,351 2,972,949 45% Percent to Common Unitholders 53% 53% 53% 54% 54% 53% 53% DE before Certain Payables Attributable to Common Unitholders 400,587 650,899 663,608 554,120 370,902 (7)% 1,082,803 1,588,630 47% Less: Other Payables Attributable to Common Unitholders (69,707) (87,977) (7,288) - - (100)% (119,447) (7,288) (94)% DE Attributable to Common Unitholders 330,880 562,922 656,320 554,120 370,902 12% 963,356 1,581,342 64% DE per Common Unit 0.54 $ 0.92 $ 1.05 $ 0.88 $ 0.58 $ 7% 1.59 $ 2.51 $ 58% Less: Retained Capital per Common Unit (0.10) $ (0.14) $ (0.16) $ (0.14) $ (0.09) $ (10)% (0.25) $ (0.39) $ 56% Actual Distribution per Common Unit 0.44 $ 0.78 $ 0.89 $ 0.74 $ 0.49 $ 11% 1.34 $ 2.12 $ 58% Record Date Oct 26, 2015 Payable Date Nov 2, 2015 Distributable Earnings (“DE”) A detailed description of Blackstone’s distribution policy and the definition of Distributable Earnings can be found on page 31,
Definitions and Distribution Policy. DE before Certain Payables represents Distributable Earnings before the deduction for the Payable Under Tax Receivable Agreement and tax expense (benefit) of wholly owned subsidiaries. Per
Unit calculations are based on end of period Total Common Units Outstanding (page 30, Unit Rollforward); actual distributions are paid to unitholders as of the applicable record date. For the periods presented, Net
Cash Available for Distribution per Common Unit equals the Actual Distribution per Common Unit. Retained capital is withheld pro-rata from common and Blackstone Holdings Partnership unitholders. Common
unitholders’ share was $57.2 million for 3Q’15 and $245.6 million for YTD’15. |
 Blackstone 21 Inflows include contributions, capital raised, other increases in available capital, purchases and acquisitions. Outflows represent
redemptions, client withdrawals and other decreases
in available capital. Realizations represent realizations from the disposition of assets. Market Activity represents gains (losses) on portfolio investments and impact of foreign exchange rate fluctuations. 3Q’15 Fee-Earning AUM Rollforward (Dollars in Millions) 3Q’15 LTM Fee-Earning AUM Rollforward (Dollars in Millions) Private Equity Real Estate Hedge Fund Solutions Credit Inflows: BPP ($1.5 billion); final closing of BREP VIII ($850 million);
BREDS II ($786 million). Realizations: BREDS ($651 million); BREP International II ($212 million); BREP VI ($158 million); BREP Europe III ($166 million). Inflows: Individual investor solutions ($1.1 billion); specialized solutions ($476 million); commingled products ($327 million);
customized solutions ($240 million).
Outflows:
Driven by investors’ liquidity needs and certain strategic
shifts in their programs. Inflows: BDCs ($1.1 billion); Hedge Fund Strategies ($594
million); new CLO product ($600 million). Outflows: BDCs ($647 million); Hedge Fund Strategies ($272 million).
Realizations: Returned to CLO
investors ($1.0 billion European, $872 million U.S.); drawdown funds ($719 million). Inflows: Tactical Opportunities platform ($1.8
billion); Strategic Partners ($285 million).
Realizations: BCP V strategic and
public dispositions including Center Parcs, Summit Materials, CMS Info Systems and Michaels Stores;
Strategic Partners fund of fund realizations.
Fee-Earning Assets Under Management
Private Real Hedge Fund Equity Estate Solutions 2Q'15 49,537 $ 62,684 $ 65,512 $ 61,609 $ 239,342 $ Inflows 2,168 3,505 2,166 3,323 11,162 Outflows (5) (6) (948) (1,129) (2,088) Realizations (1,017) (1,559) (266) (2,596) (5,438) Net Inflows (Outflows) 1,146 1,940 952 (402) 3,636 Market Activity (122) 234 (1,282) (869) (2,039) 3Q'15 50,561 $ 64,858 $ 65,182 $ 60,338 $ 240,939 $ QoQ Increase (Decrease) 2% 3% (1)% (2)% 1% Credit Total Private Real Hedge Fund Equity Estate Solutions 3Q'14 43,818 $ 52,308 $ 62,037 $ 56,657 $ 214,820 $ Inflows 12,654 26,376 9,546 17,389 65,965 Outflows (1,099) (4,203) (6,102) (6,384) (17,788) Realizations (5,005) (9,150) (390) (5,259) (19,804) Net Inflows 6,550 13,023 3,054 5,746 28,373 Market Activity 193 (473) 91 (2,065) (2,254) 3Q'15 50,561 $ 64,858 $ 65,182 $ 60,338 $ 240,939 $ YoY Increase 15% 24% 5% 6% 12% Credit Total |
 Blackstone 22 3Q’15 Total AUM Rollforward (Dollars in Millions) 3Q’15 LTM Total AUM Rollforward (Dollars in Millions) Inflows include contributions, capital raised, other increases in available capital, purchases and acquisitions. Outflows represent
redemptions, client withdrawals and other decreases in available
capital. Realizations represent realizations from the disposition of assets. Market Activity represents gains (losses) on portfolio investments and impact of foreign exchange rate fluctuations. Total Assets Under Management Private Equity Real Estate Hedge Fund Solutions Credit Inflows: BPP ($2.5 billion); final closing of
BREP VIII ($851 million); BREDS ($422
million). Realizations: BREP International II ($682 million); BREP VI ($474 million); BREP Europe III ($375 million); BREP VII ($359 million); BREDS ($467 million). Inflows: BAAM’s third seeding vehicle held its first close with $655 million in commitments; additional close of general partner
interests vehicle with $3.3 billion in total
commitments. Outflows:
Driven by investors’ liquidity needs and certain strategic
shifts in their programs. Inflows: Capital raised in energy focused products ($1.0 billion); European Senior Debt Strategy ($954 million); BDCs ($1.1 billion).
Outflows: BDCs ($647 million); Hedge Fund Strategies ($247 million). Realizations: Returned to CLO investors ($1.9 billion); drawdown funds ($1.1 billion).
Inflows: Tactical Opportunities platform ($2.1 billion); fundraising for seventh private equity fund ($1.1 billion). Realizations: BCP V ($1.7 billion) and Strategic Partners ($522 million). Private Real Hedge Fund Equity Estate Solutions 3Q'14 69,890 $ 80,189 $ 64,184 $ 70,152 $ 284,415 $ Inflows 31,050 29,341 10,646 25,874 96,911 Outflows (1,087) (455) (6,204) (7,151) (14,897) Realizations (14,220) (23,821) (419) (6,312) (44,772) Net Inflows 15,743 5,065 4,023 12,411 37,242 Market Activity 5,858 7,934 199 (1,722) 12,269 3Q'15 91,491 $ 93,188 $ 68,406 $ 80,841 $ 333,926 $ YoY Increase 31% 16% 7% 15% 17% Credit Total Private Real Hedge Fund Equity Estate Solutions 2Q'15 92,026 $ 91,579 $ 67,830 $ 81,289 $ 332,724 $ Inflows 3,882 4,276 3,126 4,817 16,101 Outflows (79) (6) (958) (1,198) (2,241) Realizations (2,705) (3,050) (277) (2,962) (8,994) Net Inflows 1,098 1,220 1,891 657 4,866 Market Activity (1,633) 389 (1,315) (1,105) (3,664) 3Q'15 91,491 $ 93,188 $ 68,406 $ 80,841 $ 333,926 $ QoQ Increase (Decrease) (1)% 2% 1% (1)% 0% Credit Total |
 Blackstone 23 Net Accrued Performance Fees Net Accrued Performance Fees are presented net of performance fee compensation and do not include clawback amounts, if any, which are disclosed in the 10-K/Q. Net Realized Performance Fees are included in DE. When these fees are received, the receivable is reduced without further impacting DE. Per Unit
calculations are based on end of period DE Units Outstanding (see
page 30, Unit Rollforward).
$3.6
billion
Net Accrued Performance Fees at 3Q’15
$3.03
per unit
Net Accrued Performance Fees at 3Q’15
63%
of 3Q’14 Net Accrued Performance Fees realized in LTM’15 Net Accrued Performance Fees (Dollars in Millions, Except per Unit Data) 2Q'15 3Q'15 3Q'15 Per Unit QoQ Change Private Equity BCP IV Carried Interest 186 $
156
$
0.13
$
(30)
$
BCP V
Carried Interest 1,119
486 0.41 (633) BCP VI Carried Interest 320 303 0.26 (17) BEP Carried Interest 82 59 0.05 (23) Tactical Opportunities Carried Interest 36 42 0.04 6 BTAS Carried Interest 2 1 - (1) Strategic Partners Carried Interest 18 27 0.02 9 Other Carried Interest 1 1 - - Total Private Equity 1,764 $
1,075 $
0.91 $
(689) $
Real Estate BREP IV Carried Interest 36 26 0.02 (10) BREP V Carried Interest 583 542 0.46 (41) BREP VI Carried Interest 868 720 0.61 (148) BREP VII Carried Interest 565 613 0.52 48 BREP VIII Carried Interest - 3 - 3 BREP Europe III Carried Interest 200 195 0.16 (5) BREP Europe IV Carried Interest 86 112 0.09 26 BREP Asia Carried Interest 43 48 0.04 5 BPP Carried Interest 18 24 0.02 6 BPP Incentive Fees 4 7 0.01 3 BREDS Carried Interest 11 14 0.01 3 BREDS Incentive Fees 3 5 - 2 Asia Platform Incentive Fees 7 7 0.01 - Total Real Estate 2,424 $
2,316 $
1.95 $
(108) $
Hedge Fund Solutions
Incentive Fees
60 38 0.03 (22) Total Hedge Fund Solutions 60 $
38
$
0.03 $
(22) $
Credit
Carried Interest
183 134 0.11 (49) Incentive Fees 41 22 0.02 (19) Total Credit 224 $
156
$
0.13
$
(68)
$
Total
Blackstone Carried Interest
4,357 3,506 2.96 (851) Incentive Fees 115 79 0.07 (36) Net Accrued Performance Fees 4,472 $
3,585 $
3.03 $
(887) $
Memo: Net Realized Performance Fees
52 $
31
$
0.03 $
(21) $
|
 Blackstone 24 Investment Records as of September 30, 2015 (a) Notes on page 25. Committed Available Unrealized Investments Realized Investments Total Investments Net IRRs (d) (Dollars in Thousands, Except Where Noted) Capital Capital (b) Value MOIC (c) % Public Value MOIC (c) Value MOIC (c) Realized Total Private Equity BCP I (Oct 1987 / Oct 1993) 859,081 $ - $
- $
n/a - 1,741,738 $ 2.6x 1,741,738 $ 2.6x 19% 19% BCP II (Oct 1993 / Aug 1997) 1,361,100 - - n/a - 3,256,819 2.5x 3,256,819 2.5x 32% 32% BCP III (Aug 1997 / Nov 2002) 3,967,422 - - n/a - 9,184,688 2.3x 9,184,688 2.3x 14% 14% BCOM (Jun 2000 / Jun 2006) 2,137,330 199,298 305,478 1.4x - 2,619,040 1.4x 2,924,518 1.4x 7% 6% BCP IV (Nov 2002 / Dec 2005) 6,773,182 221,559 2,360,762 1.3x 27% 18,652,893 3.2x 21,013,655 2.8x 45% 36% BCP V (Dec 2005 / Jan 2011) 21,024,105 1,330,193 13,220,032 1.6x 59% 23,805,670 2.0x 37,025,702 1.8x 10% 8% BCP VI (Jan 2011 / Jan 2017) 15,183,973 5,537,622 12,254,533 1.3x 18% 2,004,781 1.9x 14,259,314 1.4x 47% 12% BEP (Aug 2011 / Feb 2015) 2,438,835 230,025 2,784,328 1.3x 21% 539,484 2.0x 3,323,812 1.4x 56% 20% BEP II (Feb 2015 / Feb 2021) 4,951,351 4,951,351 - n/a - - n/a - n/a n/a n/a BCP VII (TBD) 16,775,000 16,775,000 - n/a - - n/a - n/a n/a n/a Total Corporate Private Equity 75,471,379 $ 29,245,048 $ 30,925,133 $ 1.4x 36% 61,805,113 $ 2.3x 92,730,246 $ 1.9x 19% 16% Tactical Opportunities 11,999,235 7,057,842 5,598,643 1.1x 1% 1,208,134 1.5x 6,806,777 1.2x 38% 12% Strategic Partners 17,280,564 4,227,205 6,971,984 1.7x n/a 12,720,524 1.1x 19,692,508 1.3x n/a 15% Other Funds and Co-Investment (e) 1,868,221 277,682 1,311,485 1.1x 45% 108,013 1.8x 1,419,498 1.1x n/a n/m Total Private Equity 106,619,399 $ 40,807,777 $ 44,807,245 $ 1.4x 27% 75,841,784 $ 1.9x 120,649,029 $ 1.7x 19% 15% Real Estate Dollar Pre-BREP 140,714 $ - $
- $
n/a - 345,190 $ 2.5x 345,190 $ 2.5x 33% 33% BREP I (Sep 1994 / Oct 1996) 380,708 - - n/a - 1,327,708 2.8x 1,327,708 2.8x 40% 40% BREP II (Oct 1996 / Mar 1999) 1,198,339 - - n/a - 2,531,613 2.1x 2,531,613 2.1x 19% 19% BREP III (Apr 1999 / Apr 2003) 1,522,708 - - n/a - 3,328,504 2.4x 3,328,504 2.4x 21% 21% BREP IV (Apr 2003 / Dec 2005) 2,198,694 - 1,027,268 0.9x 11% 3,632,929 2.2x 4,660,197 1.7x 45% 13% BREP V (Dec 2005 / Feb 2007) 5,539,418 - 5,071,272 2.3x 30% 7,729,999 2.2x 12,801,271 2.2x 13% 11% BREP VI (Feb 2007 / Aug 2011) 11,059,523 584,807 8,799,927 2.2x 65% 16,589,673 2.4x 25,389,600 2.3x 15% 13% BREP VII (Aug 2011 /Apr 2015) 13,486,361 3,002,256 15,819,308 1.6x 1% 7,514,814 1.9x 23,334,122 1.7x 34% 24% BREP VIII (Apr 2015 / Oct 2020) 15,928,531 14,984,719 1,087,193 1.1x - - n/a 1,087,193 1.1x n/a n/m Total Global BREP 51,454,996 $ 18,571,782 $ 31,804,968 $ 1.7x 24% 43,000,430 $ 2.2x 74,805,398 $ 2.0x 22% 17% Euro BREP Int'l (Jan 2001 / Sep 2005) 824,172 € - € - € n/a - 1,364,490 € 2.1x 1,364,490 € 2.1x 23% 23% BREP Int'l II (Sep 2005 / Jun 2008) 1,629,748 53,252 817,019 1.2x 45% 1,417,697 2.1x 2,234,716 1.6x 10% 6% BREP Europe III (Jun 2008 / Sep 2013) 3,205,140 464,993 3,451,390 1.8x 7% 2,356,583 2.2x 5,807,973 2.0x 25% 20% BREP Europe IV (Sep 2013 / Mar 2019) 6,693,483 3,064,932 4,836,148 1.3x - 354,935 1.3x 5,191,083 1.3x 35% 21% Total Euro BREP 12,352,543 € 3,583,177 € 9,104,557 € 1.4x 7% 5,493,705 € 2.0x 14,598,262 € 1.6x 18% 14% BREP Co-Investment (f) 5,709,088 $ - $
5,555,712 $ 1.8x 67% 5,804,079 $ 2.2x 11,359,791 $ 2.0x 16% 16% BREP Asia (Jun 2013 / Dec 2017) 5,079,687 2,944,998 2,709,568 1.3x - 52,498 1.4x 2,762,066 1.3x 22% 14% Total BREP 78,314,999 $ 25,614,141 $ 52,158,982 $ 1.6x 23% 56,167,818 $ 2.2x 108,326,800 $ 1.9x 21% 17% BPP (g) 7,925,523 $ 3,278,618 $ 5,400,419 $ 1.2x - - $
n/a 5,400,419 $ 1.2x n/a 20% BREDS (h) 7,256,058 $ 2,359,876 $ 2,482,860 $ 1.2x - 5,197,513 $ 1.3x 7,680,373 $ 1.3x 13% 12% Hedge Fund Solutions BSCH (Dec 2013 / Jun 2020) (i) 3,301,000 $ 3,015,745 $ 297,429 $ 1.1x - 54,573 $ n/a 352,002 $ 1.3x n/m 8% Hedge Fund Solutions 3,301,000 $ 3,015,745 $ 297,429 $ 1.1x - 54,573 $ n/a 352,002 $ 1.3x n/m 8% Credit (j) Mezzanine I (Jul 2007 / Oct 2011) 2,000,000 $ 102,380 $ 472,638 $ 1.8x - 4,384,595 $ 1.6x 4,857,233 $ 1.6x n/a 18% Mezzanine II (Nov 2011 / Nov 2016) 4,120,000 2,731,998 2,507,099 1.2x - 1,514,372 1.5x 4,021,471 1.3x n/a 19% Rescue Lending I (Sep 2009 / May 2013) 3,253,143 552,445 1,848,064 1.3x - 4,034,599 1.5x 5,882,663 1.4x n/a 13% Rescue Lending II (Jun 2013 / Jun 2018) 5,125,000 3,485,668 1,924,642 1.1x - 88,846 1.1x 2,013,488 1.1x n/a 22% Total Credit 14,498,143 $ 6,872,491 $ 6,752,443 $ 1.2x - 10,022,412 $ 1.5x 16,774,855 $ 1.4x n/a 16% |
 Blackstone 25 Investment Records as of September 30, 2015 – Notes The returns presented herein represent those of the applicable Blackstone Funds and not those of The Blackstone Group L.P.
n/m Not meaningful. n/a Not applicable. (a) Preliminary. (b) Available Capital represents total investable capital commitments, including side-by-side, adjusted for certain expenses and
expired or recallable capital, less invested capital. This amount
is not reduced by outstanding commitments to investments.
(c) Multiple of Invested Capital (“MOIC”) represents carrying value, before management fees, expenses and Carried Interest,
divided by invested capital.
(d) Net Internal Rate of Return (“IRR”) represents the annualized inception to September 30, 2015 IRR on total invested capital
based on realized proceeds and unrealized value, as applicable,
after management fees, expenses and Carried Interest.
(e) Returns for Other Funds and Co-Invest are not meaningful as these funds have limited transaction activity.
(f) BREP Co-Investment represents co-investment capital raised for various BREP investments. The Net IRR reflected is calculated
by aggregating each co-investment’s realized proceeds
and unrealized value, as applicable, after management fees, expenses and Carried Interest. (g) BPP, or Blackstone Property Partners, are the core+ real estate funds which invest with a more modest risk profile and lower
leverage.
(h) Excludes Capital Trust drawdown funds. (i) BSCH is a permanent capital vehicle focused on acquiring strategic minority positions in alternative asset managers.
(j) The Total Investments MOIC for Mezzanine I, Mezzanine II, Rescue Lending I and Rescue Lending II Funds, excluding recycled
capital during the investment period, was 2.0x, 1.7x, 1.6x and 1.3x,
respectively. Funds presented represent the flagship credit
drawdown funds only. The Total Credit Net IRR is the combined IRR of the four
flagship credit drawdown funds presented. |
 Blackstone 26 Reconciliation of GAAP to Non-GAAP Measures Notes on page 27. (Dollars in Thousands) 3Q'14 4Q'14 1Q'15 (m) 2Q'15 3Q'15 YTD'14 YTD'15 Net Income (Loss) Attributable to The Blackstone Group L.P. 250,505 $ 551,451 $ 629,448 $ 134,168 $ (254,697) $ 1,033,138 $ 508,919 $ Net Income (Loss) Attributable to Non-Controlling Interests in Blackstone Holdings 271,194 586,582 645,230 134,870 (247,318) 1,114,518 532,782 Net Income Attributable to Non-Controlling Interests in Consolidated Entities
55,491 95,557 81,796 66,716 30,671 239,513 179,183 Net Income (Loss) Attributable to Redeemable Non-Controlling Interests in Consolidated Entities (23,328) 29,844 7,527 13,780 (12,520) 44,950 8,787 Net Income (Loss) 553,862 $ 1,263,434 $ 1,364,001 $ 349,534 $ (483,864) $ 2,432,119 $ 1,229,671 $ Provision for Taxes 79,108 74,686 99,344 43,251 1,573 216,487 144,168 Income (Loss) Before Provision for Taxes 632,970 $ 1,338,120 $ 1,463,345 $ 392,785 $ (482,291) $ 2,648,606 $ 1,373,839 $ Transaction-Related Charges (a) 209,240 291,550 231,862 192,018 80,962 564,832 504,842 Amortization of Intangibles (b) 27,828 26,113 25,899 24,720 30,624 85,141 81,243 (Income) Associated with Non-Controlling Interests of Consolidated Entities
(c) (32,163) (125,401) (89,323) (80,496) (18,151) (284,463) (187,970) Economic Income (Loss) 837,875 $ 1,530,382 $ 1,631,783 $ 529,027 $ (388,856) $ 3,014,116 $ 1,771,954 $ Taxes (d) (79,519) (83,649) (9,719) (20,587) (27,070) (115,863) (57,376) Economic Net Income (Loss) 758,356 $ 1,446,733 $ 1,622,064 $ 508,440 $ (415,926) $ 2,898,253 $ 1,714,578 $ Taxes (d) 79,519 83,649 9,719 20,587 27,070 115,863 57,376 Performance Fee Adjustment (e) (891,087) (1,323,338) (1,673,736) (569,664) 639,349 (3,068,539) (1,604,051) Investment (Income) Loss Adjustment (f) (80,766) (98,424) (189,641) (10,774) 136,131 (373,204) (64,284) Net Interest Loss (g) 10,636 5,851 8,402 14,411 9,522 30,660 32,335 Performance Fee Compensation and Benefits Adjustment (h) 360,162 270,249 403,816 215,441 (130,479) 1,015,254 488,778 Fee Related Earnings 236,820 $ 384,720 $ 180,624 $ 178,441 $ 265,667 $ 618,287 $ 624,732 $ Net Realized Performance Fees (i) 470,560 699,472 932,789 725,433 357,114 1,087,127 2,015,336 Realized Investment Income (j) 75,832 153,477 107,792 136,497 87,526 389,948 331,815 Net Interest (Loss) (g) (10,636) (5,851) (8,402) (14,411) (9,522) (30,660) (32,335) Taxes and Related Payables Including Payable Under Tax Receivable Agreement
(k) (96,437) (108,456) (16,994) (20,587) (27,070) (172,332) (64,651) Equity-Based Compensation (l) 9,947 10,692 44,398 28,547 17,819 37,534 90,764 Distributable Earnings 686,086 $ 1,134,054 $ 1,240,207 $ 1,033,920 $ 691,534 $ 1,929,904 $ 2,965,661 $ Interest Expense 34,221 34,154 38,853 45,437 44,981 98,701 129,271 Taxes and Related Payables Including Payable Under Tax Receivable Agreement
(k) 96,437 108,456 16,994 20,587 27,070 172,332 64,651 Depreciation and Amortization 7,557 7,200 6,927 6,715 6,719 25,100 20,361 Adjusted EBITDA 824,301 $ 1,283,864 $ 1,302,981 $ 1,106,659 $ 770,304 $ 2,226,037 $ 3,179,944 $ |
 Blackstone 27 Reconciliation of GAAP to Non-GAAP Measures – Notes Note: See page 31, Definitions and Distribution Policy. (a) This adjustment adds back to Income (Loss) Before Provision (Benefit) for Taxes amounts for Transaction-Related Charges which
include principally equity-based compensation charges
associated with Blackstone’s initial public offering and long-term retention programs outside of annual deferred compensation and other corporate actions.
(b) This adjustment adds back to Income (Loss) Before Provision (Benefit) for Taxes amounts for the Amortization of Intangibles which
are associated with Blackstone’s initial public offering and
other corporate actions. (c)
This adjustment adds back to Income (Loss) Before Provision (Benefit) for Taxes
the amount of (Income) Loss Associated with Non- Controlling
Interests of Consolidated Entities and includes the amount of Management Fee Revenues associated with Consolidated CLO Entities. (d) Taxes represent the current tax provision (benefit) calculated on Income (Loss) Before Provision (Benefit) for Taxes.
(e) This adjustment removes from EI the total segment amount of Performance Fees.
(f) This adjustment removes from EI the total segment amount of Investment Income (Loss).
(g) This adjustment represents Interest Income and Dividend Revenue less Interest Expense.
(h) This adjustment removes from expenses the compensation and benefit amounts related to Blackstone’s profit sharing plans related
to Performance Fees.
(i) Represents the adjustment for realized Performance Fees net of corresponding actual amounts due under Blackstone’s profit
sharing plans related thereto.
(j) Represents the adjustment for Blackstone’s Investment Income (Loss) - Realized. (k) Taxes and Related Payables Including Payable Under Tax Receivable Agreement represent the current tax provision (benefit)
calculated on Income (Loss) Before Provision (Benefit) for Taxes and the
Payable Under Tax Receivable Agreement. (l)
Represents equity-based award expense included in EI.
(m) Blackstone adopted new GAAP consolidation guidance in 2Q’15 which resulted in the deconsolidation of certain Blackstone
Funds as of January 1, 2015. Adoption did not change Net Income
Attributable to The Blackstone Group L.P. in 1Q’15, but did change Income Before Taxes, Net Income and Net Income Attributable to Non-Controlling and Redeemable Non-Controlling Interests in
Consolidated Entities. Such amounts have been recast here from
the amounts originally reported in 1Q’15. |
 Blackstone 28 Walkdown of Financial Metrics See page 29, Walkdown of Financial Metrics – Calculation of Certain Non-GAAP Financial Metrics for the calculation of the amounts presented herein that are not the respective
captions on page
14, Total Segments. 3Q’15 Fee Related Earnings per Unit is based on end of
period DE Units Outstanding; 3Q’15 DE per Unit is based on DE attributable to Common Unit Holders (see page 20, Unitholder Distribution) and end of period Total Common Units Outstanding; and 3Q’15 ENI per Unit is based on Weighted-Average ENI Adjusted
Units. YTD’15 per Unit represents the sum of the last three
quarters. See page 30, Unit Rollforward. (Dollars in Thousands,
Except per Unit Data) 3Q'15
YTD'15 Results Per Unit Results Per Unit Base Management Fees 564,287 $ 1,597,176 $ Advisory Fees 146,153 307,389 Transaction and Other Fees, Net 32,403 81,204 Management Fee Offsets (34,176) (70,555) Other Revenue (841) (1,740) Compensation (329,575) (948,765) Non-Interest Operating Expenses (112,584) (339,977) Fee Related Earnings 265,667 $ 0.22 $
624,732 $ 0.52 $
Net Realized Incentive Fees
19,724 63,149 Net Realized Carried Interest 337,390 1,952,187 Realized Investment Income 87,526 331,815 Net Interest (Loss) (9,522) (32,335) Taxes and Related Payables (27,070) (64,651) Equity-Based Compensation 17,819 90,764 Distributable Earnings 691,534 $ 0.58 $
2,965,661 $ 2.51 $
Net Unrealized Incentive Fees
(38,704) 19,135 Net Unrealized Carried Interest (827,280) (919,198) Unrealized Investment (Loss) (223,657) (267,531) Add Back: Related Payables - 7,275 Less: Equity-Based Compensation (17,819) (90,764) Economic Net Income (Loss) (415,926) $ (0.35) $
1,714,578 $ 1.45 $ |
 Blackstone 29 Walkdown of Financial Metrics – Calculation of Certain Non-GAAP Financial Metrics Unless otherwise noted, all amounts are the respective captions from the Total Segment information.
(a) Represents equity-based award expense included in Economic Income. (b) See page 26, Reconciliation of GAAP to Non-GAAP Measures for this adjustment.
(c) Represents tax-related payables including the Payable Under Tax Receivable Agreement, which is a component of Taxes and Related
Payables. (Dollars in Thousands)
3Q'15 YTD'15 Other Operating Expenses 157,565 469,248 Less: Interest Expense (44,981) (129,271) Non-Interest Operating Expenses 112,584 $ 339,977 $ Realized Incentive Fees 34,785 112,274 Less: Realized Incentive Fee Compensation (15,061) (49,125) Net Realized Incentive Fees 19,724 $ 63,149 $ Realized Carried Interest 435,189 2,580,266 Less: Realized Carried Interest Compensation (97,799) (628,079) Net Realized Carried Interest 337,390 $ 1,952,187 $ Interest Income and Dividend Revenue 35,459 96,936 Less: Interest Expense (44,981) (129,271) Net Interest (Loss) (9,522) $ (32,335) $ Equity-Based Compensation (a) 17,819 $ 90,764 $ Taxes and Related Payables (b) (27,070) $ (64,651) $ Unrealized Incentive Fees (53,346) 35,585 Less: Unrealized Incentive Fee Compensation 14,642 (16,450) Net Unrealized Incentive Fees (38,704) $ 19,135 $ Unrealized Carried Interest (1,055,977) (1,124,074) Less: Unrealized Carried Interest Compensation 228,697 204,876 Net Unrealized Carried Interest (827,280) $ (919,198) $ Related Payables (c) - $
7,275 $ $ $ |
 Blackstone 30 Unit Rollforward Common Unitholders receive tax benefits from deductions taken by Blackstone’s corporate tax paying subsidiaries and bear responsibility for the deduction from Distributable Earnings of the Payable Under Tax Receivable Agreement and certain other tax-related payables. Distributable Earnings Units Outstanding excludes units which are not entitled to distributions. 3Q'14 4Q'14 1Q'15 2Q'15 3Q'15 Total GAAP Weighted-Average Common Units Outstanding - Basic 611,684,213 615,492,620 625,276,969 631,881,205 638,832,799 Adjustments: Weighted-Average Unvested Deferred Restricted Common Units 3,294,657 6,843,140 5,955,072 2,311,444 1,913,028 Total GAAP Weighted-Average Common Units Outstanding - Diluted 614,978,870 622,335,760 631,232,041 634,192,649 640,745,827 Adjustments: Weighted-Average Blackstone Holdings Partnership Units 539,856,777 536,973,966 548,837,150 555,641,388 550,983,910 Weighted-Average Economic Net Income Adjusted Units 1,154,835,647 1,159,309,726 1,180,069,191 1,189,834,037 1,191,729,737 Economic Net Income Adjusted Units, End of Period 1,155,075,985 1,159,954,181 1,192,529,251 1,190,864,027 1,191,328,573 Total Common Units Outstanding 607,590,602 611,480,457 625,985,058 630,414,455 635,440,608 Adjustments: Blackstone Holdings Partnership Units 538,760,225 536,543,970 550,783,119 545,861,003 549,317,005 Distributable Earnings Units Outstanding 1,146,350,827 1,148,024,427 1,176,768,177 1,176,275,458 1,184,757,613 |
 Blackstone 31 Definitions and Distribution Policy Blackstone discloses the following financial measures that are calculated and presented on the basis of methodologies other than in accordance with generally accepted accounting principles in the United States of America (“non-GAAP”) in this presentation:
• Blackstone uses Economic Income, or “EI”, as a key measure of value creation, a benchmark of its performance and in making
resource deployment and
compensation decisions across its five segments. EI represents segment net income before taxes excluding transaction-related charges. Transaction-related charges arise from Blackstone’s initial public offering (“IPO”) and long-term retention
programs outside of annual deferred compensation and other
corporate actions, including acquisitions. Transaction-related charges include equity-based compensation charges, the amortization of intangible assets and contingent consideration associated with acquisitions. EI presents revenues and expenses on a basis
that deconsolidates the investment funds Blackstone
manages. •
Economic Net Income, or “ENI”, represents EI adjusted to include current period taxes. Taxes represent the current tax provision (benefit) calculated on Income (Loss) Before Provision for Taxes. • Blackstone uses Fee Related Earnings, or “FRE”, as a key measure to highlight earnings from operations excluding: (a) the
income related to performance
fees and related carry plan costs and (b) income earned from Blackstone’s investments in the Blackstone Funds. Blackstone uses FRE as a measure to assess whether recurring revenue from its businesses is sufficient to adequately cover all of its operating expenses and
generate profits. FRE equals contractual fee revenues less (a)
compensation expenses (which includes amortization of non-IPO and non-acquisition-related equity- based awards, but excludes amortization of IPO and acquisition-related equity-based awards, carried interest and incentive fee
compensation), and (b) other non-interest operating
expenses. •
Distributable Earnings, or “DE”, which is derived from
Blackstone’s segment reported results, is a supplemental measure to assess performance and amounts available for distributions to Blackstone unitholders, including Blackstone personnel and others who are limited partners of the
Blackstone Holdings
partnerships.
DE is intended to show the amount of net realized earnings without the effects of the consolidation of the Blackstone Funds. DE, which is a component of ENI, is the sum across all segments of: (a) Total Management and Advisory Fees, (b) Interest and
Dividend Revenue, (c)
Other Revenue, (d) Realized Performance Fees, and (e) Realized Investment Income (Loss); less (a) Compensation, excluding the expense of equity-based awards, (b) Realized Performance Fee Compensation, (c) Other Operating Expenses, and (d) Taxes and Related Payables Including the Payable Under Tax Receivable Agreement. DE is reconciled to Blackstone’s Consolidated Statement of Operations.
• Blackstone uses Adjusted Earnings Before Interest, Taxes and Depreciation and Amortization, or “Adjusted EBITDA”, which is
derived from segment results, to assess its ability to service
its borrowings. Adjusted EBITDA represents DE plus the addition of (a) Interest Expense, (b) Taxes and Related Payables Including Payable Under Tax Receivable Agreement, and (c) Depreciation and Amortization.
Distribution Policy. Blackstone’s intention is to distribute quarterly
approximately 85% of The Blackstone Group L.P.’s share of Distributable Earnings, subject to adjustment by amounts determined by Blackstone’s general partner to be necessary or appropriate to provide for the
conduct of its business, to make appropriate investments in its
business and funds, to comply with applicable law, any of its debt instruments or other agreements, or to provide for future cash requirements such as tax-related payments, clawback obligations and distributions to unitholders for any ensuing quarter. The amount to be distributed could also be adjusted upward in any one quarter. All of the foregoing is subject to the qualification that
the declaration and payment of any distributions are at the sole
discretion of Blackstone’s general partner and may change at any time, including, without limitation, to eliminate such distributions entirely. |
 Blackstone 32 Forward-Looking Statements This presentation may contain forward-looking statements within the meaning of Section 27A of the Securities Act of 1933 and
Section 21E of the Securities Exchange Act of 1934 which reflect
Blackstone’s current views with respect to, among other things,
Blackstone’s operations and financial performance. You can identify these
forward-looking statements by the use of words such as
“outlook,” “indicator,” “believes,”
“expects,” “potential,” “continues,” “may,” “will,” “should,” “seeks,” “approximately,” “predicts,”
“intends,” “plans,” “estimates,”
“anticipates” or the negative version of these words or other comparable words. Such forward-looking statements are subject to various risks and uncertainties. Accordingly, there are or will be important factors that could cause actual
outcomes
or results to differ materially from those indicated in these statements. Blackstone believes these factors include but are not limited to those described under the section entitled “Risk Factors” in its Annual Report on Form 10-K for the fiscal
year ended December 31, 2014, as such factors may be updated from
time to time in its periodic filings with the Securities and Exchange Commission, which are accessible on the SEC’s website at www.sec.gov. These factors should not be construed as exhaustive
and should be read in conjunction with the other cautionary
statements that are included in this presentation and in the filings. Blackstone undertakes no obligation to publicly update or review any forward-looking statement, whether as a result of new information, future
developments or otherwise.
This presentation does not constitute an offer of any Blackstone
Fund. |