Attached files
| file | filename |
|---|---|
| EX-99.1 - EX-99.1 - BLUCORA, INC. | d65114dex991.htm |
| 8-K - FORM 8-K - BLUCORA, INC. | d65114d8k.htm |
| EX-10.1 - EX-10.1 - BLUCORA, INC. | d65114dex101.htm |
 Blucora to Acquire HD Vest,
Announces Strategic Transformation
October 14, 2015
Exhibit 99.2 |
 Forward-Looking Statements
This presentation contains forward-looking statements within the meaning of
Section 27A of the Securities Act of 1933 and Section 21E of the
Securities Exchange Act of 1934. Actual results may differ
significantly from management's expectations due to various risks and uncertainties including, but not limited to: general economic, industry, and market sector
conditions; the timing and extent of market acceptance of developed products
and services and related costs; the ability to successfully
integrate acquired businesses; future acquisitions; the
successful execution of the Company's strategic initiatives, operating plans, and marketing strategies; and the condition of our cash investments. A more detailed description of these and certain other factors that could affect actual results is
included in Blucora, Inc.’s most recent Annual Report on Form 10-K and
subsequent reports filed with or furnished to the Securities and
Exchange Commission. Readers are cautioned not to place undue
reliance on these forward-looking statements. |
 Announcing Strategic Transformation
• Becoming a strategically focused company in the growing financial services and technology market by acquiring HD Vest and divesting Monoprice and InfoSpace • Moving from a collection of less predictable assets to aligned businesses with consistent growth, recurring revenue and favorable market tailwinds • Initiating a plan to reduce corporate operating expenses by ~30% by 2017 driven by strategic focus • Shifting our capital allocation approach to return of at least 30% of our
actual FCF to shareholders in 2017
2 |
 Blucora Acquisition of HD Vest
3 Transformative acquisition that is attractive, synergistic with TaxACT and consistent with our
stated strategy
Key Metrics and Timeline • Estimated purchase price of $580M– financed with cash and committed debt financing • Significant equity rollover by HD Vest management team tied to HD Vest and Blucora
performance • Transaction values HD Vest at 13.5x 2016E unlevered FCF (12.1x pro forma for synergies)
• Significantly accretive (30%+) to Blucora non-GAAP annual earnings per share
• Transaction expected to close in late fourth quarter 2015, subject to customary closing conditions
and regulatory approvals
Attractive HDV Business Fundamentals • $36+ billion in AUM (assets under management) that includes $9+ billion in fee-based advisory
AUM that is growing at a 2-year 2014 CAGR of 19%
• 3-year 2015 estimated revenue CAGR of 9% and greater than 75% of revenue is recurring
• Industry leading production payout rates and segment income margin • 3-year 2015 estimated segment income CAGR of 13% demonstrating operating leverage
• Limited exposure to equity market movements; interest rate upside Strategic Combination • Establishes strategic focus, building around our strongest asset in TaxACT
• Combines largest U.S. tax professional-oriented Independent Broker/Dealer (“IBD”) with the U.S.
leader in low cost tax preparation
• Attractive secular tailwinds coupled with substantial synergy opportunity (expected annual
EBITDA synergies of $5M by CY2017)
• Adds stable, recurring and predictable cash flow • Brings an experienced management team with strong track record of execution
• Provides for full utilization and acceleration of NOLs • Evolves capital allocation: debt pay down to 3.0x net leverage (early 2017) followed by return of
capital (at least 30% of annual actual FCF)
|
 Strategic Repositioning
4 Upon this transaction, Blucora will seek to divest InfoSpace and Monoprice and meaningfully
reduce corporate expenses
Corporate Overhead • Focus allows for reduced expenses at corporate • Targeting $12M (~30% reduction) in forward corporate operating expense run-rate by 2017
• Opportunity for rationalization of resources across HDV and TaxACT over time
Capital Allocation Blucora Portfolio • Divest InfoSpace and Monoprice • Upon divestitures, use sale proceeds to pay down debt • Expected timeline to achieve separation is mid-2016 • Near-term priority: aggressively deleverage through divestitures and organic cash
generation • At 3.0x net debt leverage ratio, systematic return of capital to shareholders at least 30%
of annual actual FCF - expected early 2017 • Acquisition activity limited in the near term • Longer-term opportunities in the financial services and technology space |
 HD
Vest |
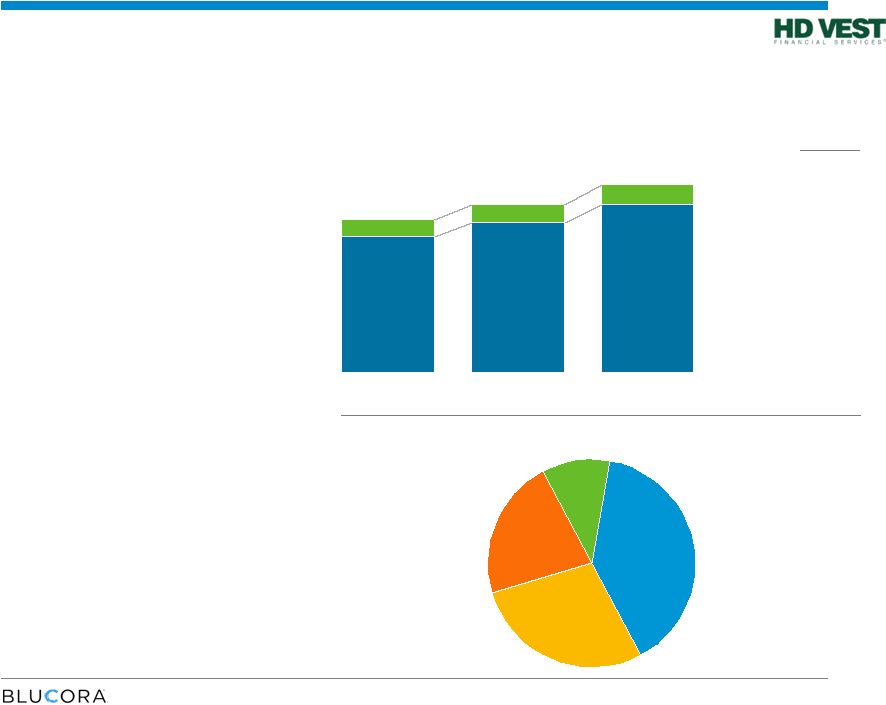 220.0 244.1 272.5 28.3 29.2 32.4 $248.3 $273.2 $304.9 2012 2013 2014 Company Overview • Founded in 1983 and headquartered in Irving, Texas • Market leader-double the size of next two competitors combined • ~300 employees • 4,500+ advisors in all 50 states – Tenured advisor base – Average over 10 years with the Company and over 20 years in the tax preparation profession • Advisors provide investment advice to 360,000+ clients • Proven technology to accelerate and improve advisor productivity • Unparalleled specialized training for tax professionals 6 Revenue Trend 2014 Revenue Mix CAGR Other revenue retained by HDV 6.8% 11.3% 10.8% Advisor- driven revenue A leading technology, training and support platform for tax professionals to deliver customized
financial solutions to retail investors
39.4% 28.3% 21.7% 10.6% Fee-based Trails Transactional Other |
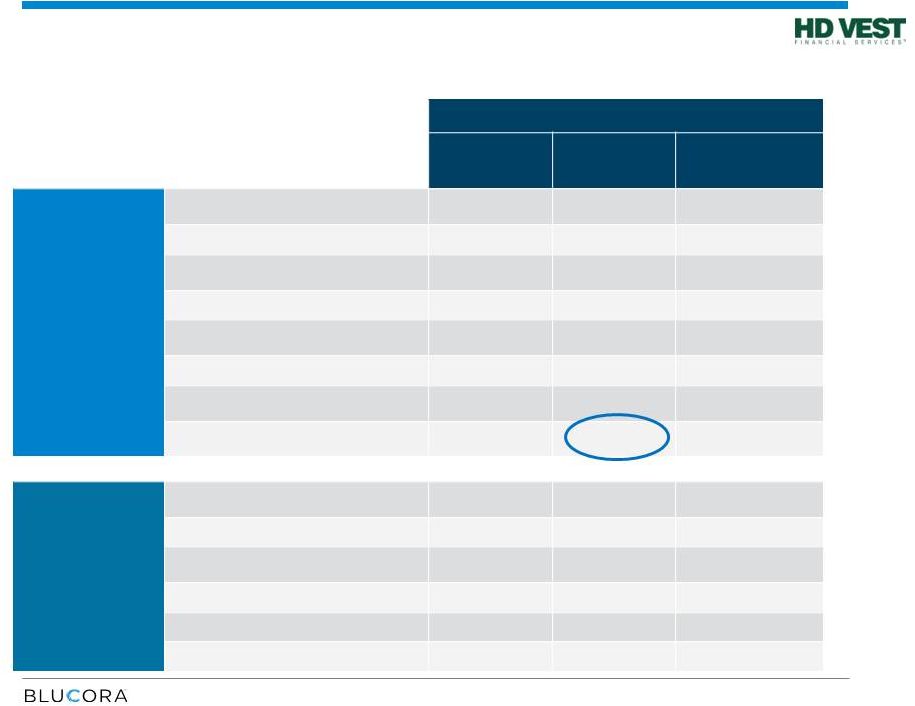 Financial Outlook
7 HD Vest ($ millions) 2015 2016 Long-term model (1) Financial Metrics • Revenue $318-322 $334-344 – % YoY
(mid-point) 5% 6% 7-9% • Net revenue $99-101 $105-108 – % YoY 4% 7% 6-9% • Segment income $42-44 $46-48 – % YoY 7% 9% 9-11% • % Margin 13.4% 14.0% – • Unlevered FCF $40-42 $43-45 10-12% Other Key Metrics • Total AUM ($ billions) $37 $39 – % YoY 0% 6% 4-6% • Fee-based AUM ($ billions) $10 $11 – % YoY 5% 13% 10-13% • Recurring revenue rate 77.5% 78.0% 50-100bps • Production payout (%) 76.6% 76.8% 10-30bps (1) Includes synergies. Forward guidance reflects current market conditions and the underlying momentum in the
HDV model. |
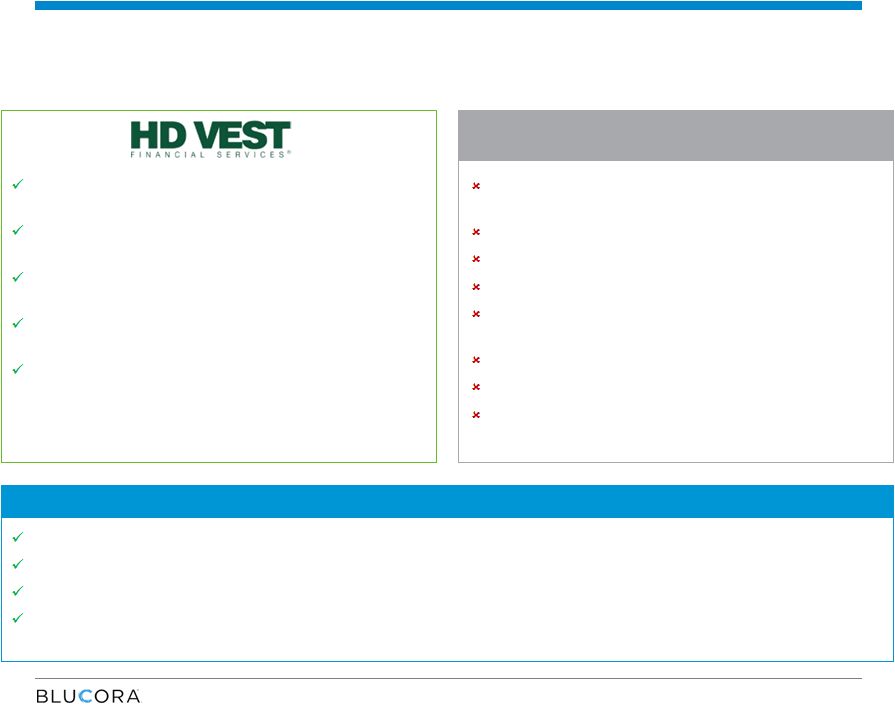 Lower attrition rate among its advisor base vs. industry
Minimal financial outlay upfront to recruit new advisors
Lower production payout rates
Segment income margins (>13%) consistently outperforming the top quartile of
IBDs Differentiated Broker-Dealer Model
8 Developing financial advisors through specialized training of tax professionals Long-standing tax advisory relationship anchors investment advisory business Meaningful tax client base to mine for investment clients Training and service offerings provide a unique value proposition to less experienced advisors Leading technology tools to identify investment opportunities Advisor client relationship limited to investments Advisors bring established book of business Not targeting a niche advisor or client base Tailored for experienced advisors Recruiting bonuses and retention loans required Minimum sales quotas required Sole source of income for advisors Advisor profile leads to higher regulatory exposure Traditional IBDs The HD Vest Model: |
 Topline Performance and Recurring Revenue
• Business model generates high recurring revenue and strong visibility • 77% recurring revenue in 2014, (fee-based, trails and sweep income) • Multiple levers for future organic growth – Per client productivity – more solutions, conversion to fee-based advisory – Clients per advisor – modest penetration to date – New advisors – 225K tax professionals nationwide 9 184.0 204.9 236.0 64.3 68.3 68.9 $248.3 $273.2 $304.9 2012 2013 2014 Revenue Trend $ Millions Other Recurring CAGR 3.5% 13.3% 10.8% |
 Growth in Advisory AUM
10 • Fee-based advisory AUM is a key growth driver • 2014 net inflows totaled approximately 11% of prior year-end advisory AUM • Since 2012, advisory AUM share of total client assets has grown by over 325 basis points to 26% • Conversion of eligible non-fee based AUM provides meaningful growth opportunity CAGR 18.8% $6.8 $8.4 $9.6 22.4% 23.9% 25.7% 2012 2013 2014 Fee-Based Advisory AUM Advisory % of Client Assets Fee-Based Advisory AUM $ Billions at year end |
 Balanced Sensitivity to Market Movements
11
• Eliminating equity market impact to AUM shows steady organic growth in a market neutral environment: – Consistent net asset inflows and the AUM shift to fee-based advisory are the primary drivers of growth Market Neutral Growth Interest Rate Upside • Meaningful upside expected from interest rate hikes – For every 25bps increase in LIBOR segment income increases by ~$2M Equity Market Correlation • We estimate a 20% decrease in S&P 500 represents ~10% decrease in segment income – Transaction revenue: no correlation to market movements – Fee based and trails revenue: limited exposure to market movements |
 Blucora Transformation |
 Compelling Combination
13 + = Well Established Footprint and Market Positioning Proven Growth and Cash Flow Generation Strong growth metrics (2012-2015E CAGR) • 3.8% eFile growth • 12.0% revenue growth • 13.7% segment income growth Margin profile (2015E) • 47.5% segment income Leading brokerage and technology platform for tax professionals advisors • 4,500+ advisors in all 50 states providing investment advice to 360,000+ clients • Financial representatives manage more than $36 billion in assets Strong growth metrics (2012-2015E CAGR) • 7.3% AUM growth • 8.8% revenue growth • 13.5% segment income growth Margin profile (2015E) • 13.4% segment income • Industry-leading franchise across the tax preparation and financial advisory sectors • One stop shop for tax advisors to serve their clients and gain incremental revenue from financial advisory • Strong financial profile with high growth fundamentals and expanding recurring revenue • Proven HD Vest advisor recruiting strategies and a fresh advisor base to mine at TaxACT • Superior execution capabilities Leading provider of internet-enabled tax solutions • Has enabled filing of 46M federal tax returns and ~5.5M total eFiles last tax season • Strong user base of 19,500+ professional tax advisors |
 Positioned Favorably Against Converging Trends
14 • Use of advisors has nearly doubled since the financial crisis in 2008 • Independent advisors are growing faster than wirehouse advisors • US investable assets have nearly doubled in the wake of the Great Recession • An influx of 40m new retirees expected over the next decade DIY leader for mass-market DIFM SaaS provider DIFM RIA & IBD Core Tax Prep Interactions • Mass-market is embracing the convergence of technology enabled financial services and
personal advice
• “Do it yourself” and “Do it for me” models both must be powered by scaled technology
platforms Technology Enabled Business Models Reshaping Financial Services • Appropriate investment strategies dependent on investors’ tax situations • Increasing demands on consumers’ time to understand and file taxes • Digital do-it-yourself tax preparation continues to displace “paper & pencil” and desktop solutions Growing AUM Potential Continued Shift to Digital Tax Prep Growing Advisory Opportunity Increasingly Complex Tax Code |
 Substantial Synergy Opportunities, Expanded Addressable
Markets 15 Investment and Advisory Platform for Tax Professionals 360,000+ Clients 4,500+ Securities- Licensed Tax Professionals Tax Software for Individuals and Tax Professionals 5.5M Individual Tax Filers 19,500 Tax Professionals Retirement and wealth management solutions tailored to TaxACT customers Additional tax professionals convert to financial advisory Integrated solutions for tax professionals Synergies will produce $5 million in EBITDA by 2017 |
 Pro
Forma 2015E (1)
• Revenue: $436.8M • Segment Income: $ 98.5M • Adjusted EBITDA $ 86.5M • Non-GAAP EPS $ 1.09 Financial Technology and Services • Long-term industry tailwinds • Well positioned players in the tax space • Sizable cross-sell opportunity • Well-established brands • Differentiated models with distinct growth drivers The New Blucora 16 2016 Priorities • Maximize opportunities with HD Vest and TaxACT - solutions and customers • Divest InfoSpace and Monoprice • Implement corporate operating expense reductions • Debt pay down • Focused company with leading assets in the financial services and technology space
• Growing businesses, 9.6% 2015E 3-year Revenue CAGR • Experienced HD Vest and TaxAct management team with key operating expertise • Strong cash flow generation enhanced by NOL asset (1) Represents combined results of TaxAct, HDVEST, and Blucora corporate and assumes debt structure post close back to 2012. Excludes
results from our E-Commerce (i.e. Monoprice) and
Search and Content (i.e. Infospace) segments. See appendix for Pro Forma Reconciliations. |
 Core
Financial Technology and Services Financial Profile
17 Pro Forma Revenue $ Millions Pro Forma Segment Income $ Millions Pro Forma Adj. EBITDA & Unlevered FCF (1) $ Millions 9.6% CAGR 8.8% 12.0% 13.6% CAGR 13.5% 13.7% CAGR 19.4% TaxACT HD Vest (1) Represents combined segment income less pro forma corporate operating expense ($12M per year), capital expenditures and cash taxes (net of NOL utilization). Adj. EBITDA Unlevered FCF 16.1% 83 91 104 117 248 273 305 320 $331 $364 $409 $437 2012 2013 2014 2015E 38 41 50 56 29 33 40 43 $67 $74 $90 $99 2012 2013 2014 2015E $55 $62 $78 $87 $47 $56 $70 $81 2012 2013 2014 2015E |
 18 Recap-Strategic Transformation • Becoming a strategically focused company in the growing financial services and technology market by acquiring HD Vest and divesting Monoprice and InfoSpace • Moving from a collection of less predictable assets to aligned businesses with consistent growth, recurring revenue and favorable market tailwinds • Initiating a plan to reduce corporate operating expenses by ~30% by 2017 driven by strategic focus • Shifting our capital allocation approach to return of at least 30% of our actual FCF to shareholders in 2017 • Leadership transition – initiating search for a new CEO with domain knowledge, experience and operational expertise in the financial services and technology market |
 Thank You |
 Pro
Forma Non-GAAP Reconciliation 20
2012
2013
2014
2015 Estimate
GAAP ProForma Net Income (Loss)
(1)
(17,620)
$
(22,225) $
1,783
$
- (3) Other Loss (Net) 36,575 49,572
34,179 -
(3)
Tax (Benefit) / Expense
(11,747)
(14,817) 1,189
- (3) Corporate Level Activity 60,067 61,033
52,859 -
(3)
Segment Income
67,275
73,563 90,010
98,456 Corporate Operating
Expenses (2)
12,000
12,000 12,000
12,000 Adjusted EBITDA
(5)
55,275
61,563 78,010
86,456 (4)
CapEx
5,365
3,340 5,140
3,067 Cash
Taxes 2,600
2,500 2,700
2,900 Unlevered FCF
47,310
55,723 70,170
80,489 (1) Represents
combined results of TaxACT, HDVEST, and Blucora Corporate and assumes debt structure post close back to FY 2012. Excludes results from our E-Commerce (i.e. Monoprice) and Search and Content (i.e. InfoSpace) segments.
(2) Corporate operating expenses assumed at estimated 2017
run rate of $12M per year post reductions.
(3) Amount not practicable to estimate for ProForma
purposes. (4) Non-GAAP EPS calculated
based upon Adjusted EBITDA less depreciation, cash taxes and interest expense divided by expected fully diluted share count. (5) We define Adjusted EBITDA as net income, determined in accordance with GAAP, exluding the effects of income
taxes, depreciation, amortization of intangible
assets, impairments of goodwill and intangible assets, stock-based compensation, and other loss, net (which primarily includes items such as interest income, interest expense, amortization of debt issuance costs, accretion of debt discounts, realized gains and
losses on available-for-sale investments,
impairment losses on equity investments, adjustments to
contingent liabilities related to business combinations, and gain on third party bankruptcy settlement). BLUCORA, INC. Reconciliations of Non-GAAP Financial Measures to the Nearest Comparable GAAP Measure
Segment Income / Adjusted EBITDA / Unlevered Free Cash Flow
Reconciliation (Unaudited)
(Amounts in thousands) |