Attached files
| file | filename |
|---|---|
| EX-99.2 - EX-99.2 - Premier, Inc. | d80699dex992.htm |
| 8-K - FORM 8-K - Premier, Inc. | d80699d8k.htm |
 2015 Investor Day and Economic Outlook
Exhibit 99.1 |
 Forward-looking statements—Certain statements included in this presentation, including, but not limited to, those related to our financial and business outlook, strategy and growth drivers, member retention and renewal rates and revenue visibility, cross and upsell opportunities, acquisition activities, including integration and financial performance expectations of acquired companies,
and our acquisition pipeline, revenue available under contract, financial
flexibility, Class B LP Unit exchange process and 2016 financial
guidance and related assumptions, are “forward-looking statements” within the meaning of the federal securities laws. Forward-looking statements may involve known and unknown risks, uncertainties and other factors that may cause the actual
results of Premier to be materially different from historical
results or from any future results or projections expressed or implied by such forward-looking statements. Accordingly, readers should not place undue reliance on any forward looking statements.
Readers are urged to consider statements in the conditional or
future tenses or that include terms such as “believes,” “belief,” “expects,” “estimates,” “intends,” “anticipates” or “plans” to be uncertain and forward-looking. Forward-looking statements may include comments as to Premier’s beliefs and expectations as to future events and trends affecting its business and are necessarily
subject to uncertainties, many of which are outside
Premier’s control. More information on potential risks and
other factors that could affect Premier’s financial results
is included, and updated, from time to time, in Premier’s periodic and current filings with the SEC, including Premier’s most recent Form 10-K for the year ended June 30, 2015.
Forward-looking statements speak only as
of the date they are made. Premier undertakes no obligation to publicly update
or revise any forward-looking statements. Non-GAAP
financial measures—This presentation includes certain “non-GAAP financial
measures” as defined in Regulation G under the
Securities Exchange Act of 1934. Schedules are attached that reconcile the non-GAAP financial measures included in this presentation to the most directly comparable financial measures calculated and presented in accordance with Generally
Accepted Accounting Principles in the United States. Our Form 10-K for the
year ended June 30, 2015 provides further explanation and
disclosure regarding our use of non-GAAP financial measures and should be read in conjunction with this presentation. Forward-looking statements and Non-GAAP financial measures |
 |
 Driving long-term sustainable value Unique member alignment Positioned to capitalize on compelling industry trends Integrated framework delivering solutions Balance sheet strength and financial flexibility Experienced and tenured management team |
 Strong historical performance
demonstrates consistent and sustainable
growth |
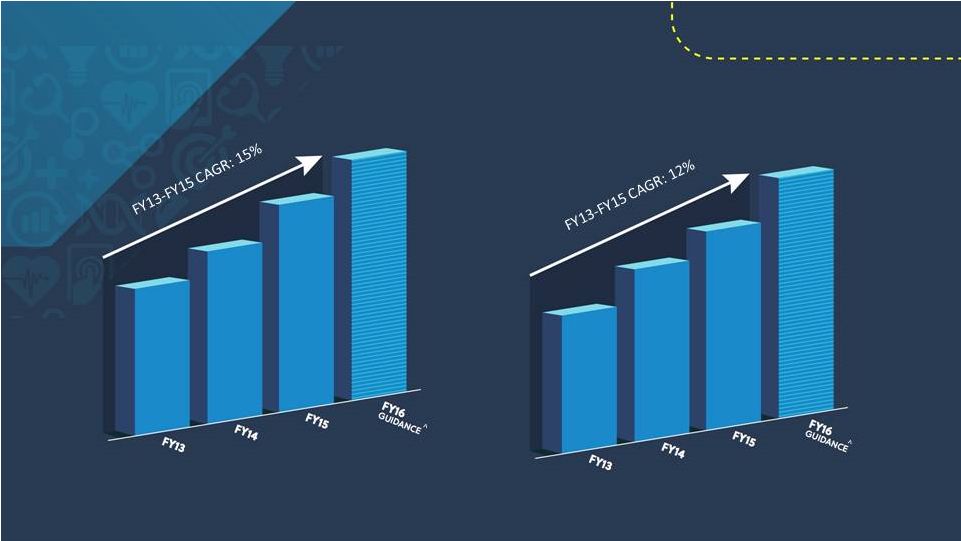 $1,144 – $1,175 Consolidated Net Revenue* (in millions) Consolidated Adjusted EBITDA* (in millions) $764 $869 $1,007 $425 - 444 $314 $351 $393 *Comparisons are with non-GAAP pro forma information that reflects the impact of the company’s reorganization and initial
public offering. See Adjusted EBITDA, Segment Adjusted
EBITDA and Adjusted Fully Distributed Net Income reconciliations to GAAP equivalents in Appendix. ^As of 10/6/15. Includes estimated contribution from Partnership for Patients government contract.
|
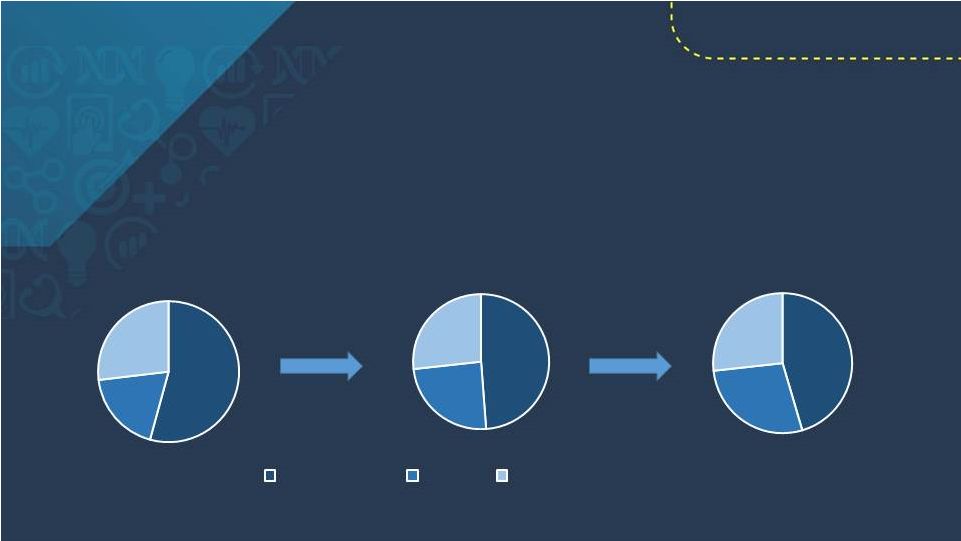 Strategic intent to diversify and expand businesses 54% 19% 27% FY13 Consolidated Net Revenue Mix* Strategic diversification 49% 24% 27% FY14 Net Admin Fees Products Performance Services 45% 28% 27% FY15 *Comparisons are with non-GAAP pro forma information that reflects the impact of the company’s reorganization and initial public
offering. See Adjusted EBITDA, Segment Adjusted EBITDA and Adjusted Fully Distributed Net Income reconciliations to GAAP equivalents in Appendix.
|
 Diversified and powerful financial model Multiple growth drivers Core “chassis” built Recurring and visible revenue Cross and up-sell opportunities Financial flexibility |
 Unique Member Alignment Ownership Structure Review |
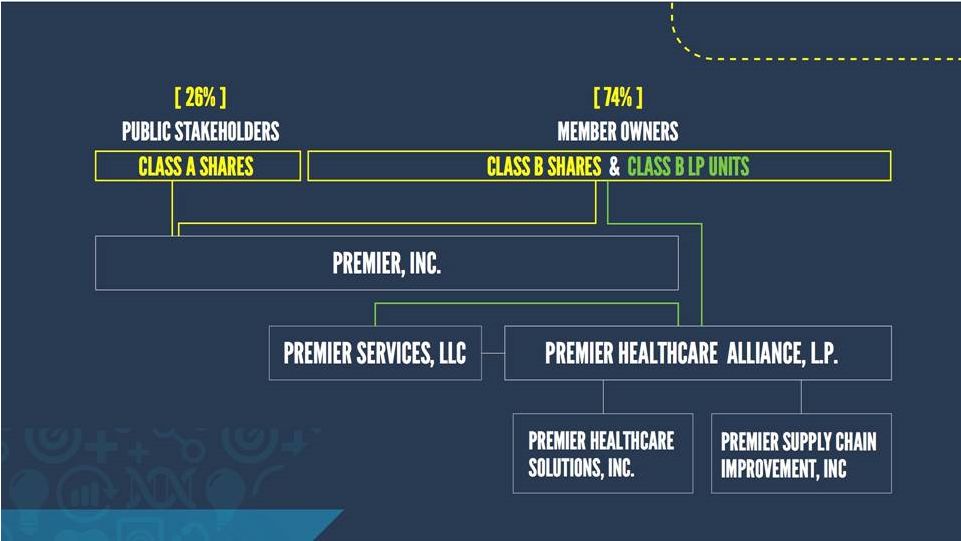 Note: % Ownership as of July 31, 2015 |
 How we keep structural implications simple • Given Up-C structure and differences between taxes paid by our Class A unit holder (Premier GP) vs.
distributions to our Class B unit holders (members owners), we
calculate Adjusted Fully Distributed Net
Income
* for comparability purposes • Reflects taxes and net income as if the Company was a C-Corp for all periods presented
• Class A and Class B shares will be used to calculate fully diluted EPS to
eliminate variability due to member exchanges over time
Adjusted fully distributed net income Share count Structure • Structured as “up C” with Premier, Inc. (parent C-Corp above operating partnership and subsidiaries)
• Premier, Inc. formed with two classes of stock • Class A shares held by public investors • Class B shares allocated to member owners • 22% of Limited Partner interests sold to Premier, Inc., 78% retained by member owners as Class B units
• Class B units eligible to exchange 1/7th per year on quarterly basis, over seven-year period
• Exchange of Class B Common Units for A-shares (on a 1-for-1 basis) as B-units vest subject to ROFR
by members owners and Premier, Inc.
• Current ownership is 26% by public shareholders and 74% by member owners
Impact of IPO and
exchange process
* See Adjusted EBITDA and Adjusted Fully Distributed Net Income reconciliations to GAAP equivalents in Appendix
|
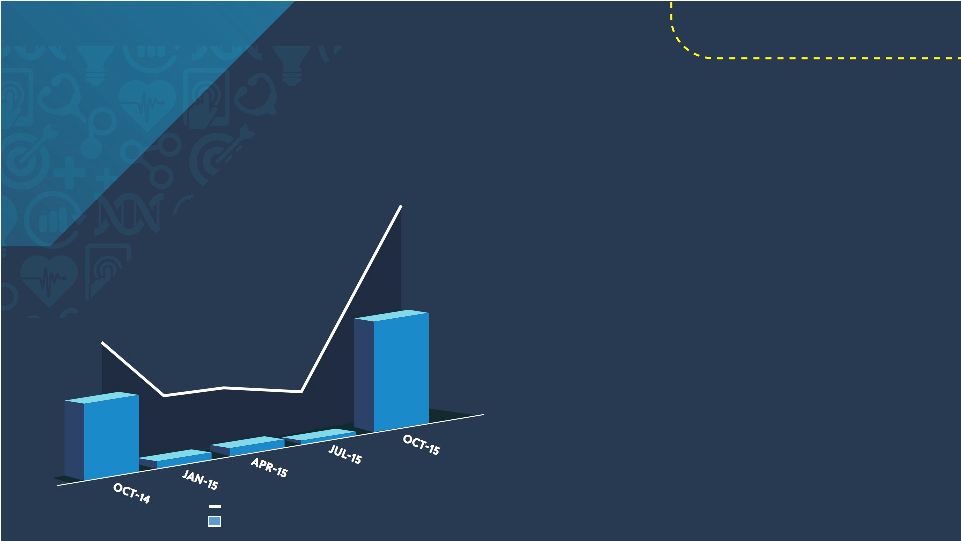 Quarterly share exchange update • October 31, 2015 exchange update • 6.2 million shares initially indicated for exchange • 400,000 shares either retracted or purchased through right of first refusal • 5.8 million shares to be exchanged • Secondary offering being evaluated 4.7 5.8 0.3 0.3 0.1 16.0 26.6 11.3 11.0 10.8 PINC Class B to Class A Quarterly Share Exchange Results (in millions) Cumulative Class B Shares Eligible to be Exchanged Class B Shares Exchanged |
 Change the game in supply chain: Uncover unmatched savings and value, and lead the disruption of the industry Supply Chain Segment Review |
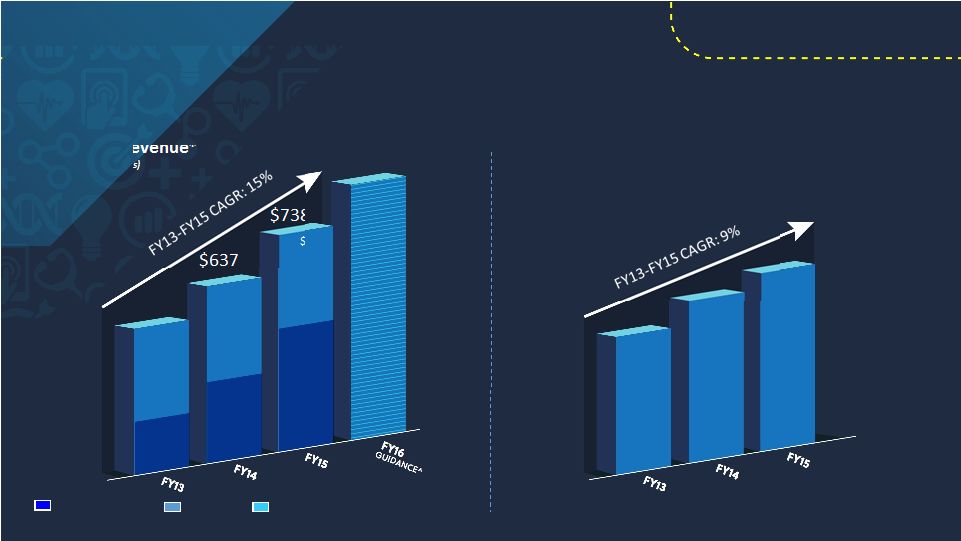 Emerging products businesses and strong net administrative fee performance driving accelerated growth $792 – $813 Supply Chain Services Segment Net Revenue* (in millions) Supply Chain Services Segment Adjusted EBITDA* (in millions) $144 $213 $279 $327 $355 $391 $414 $424 $457 $559 $637 $738 *Comparisons are with non-GAAP pro forma information that reflects the impact of the company’s
reorganization and initial public offering. See Adjusted EBITDA, Segment
Adjusted EBITDA and Adjusted Fully Distributed Net Income
reconciliations to GAAP equivalents in Appendix. Net Admin
Fees Products
Other Services and Support
<$1 <$1 $2 ^ As of 10/6/15 |
 Supply Chain Services Driving long-term profitable growth Deliver stable administrative fee growth Continue to scale product businesses Leverage supply chain “chassis” Integrate analytics capabilities Future investments |
 Be the data analytics “backbone” with wrap- around services for cost and quality improvement over the short-term and population health management solutions over the long-term Performance Services Segment Review |
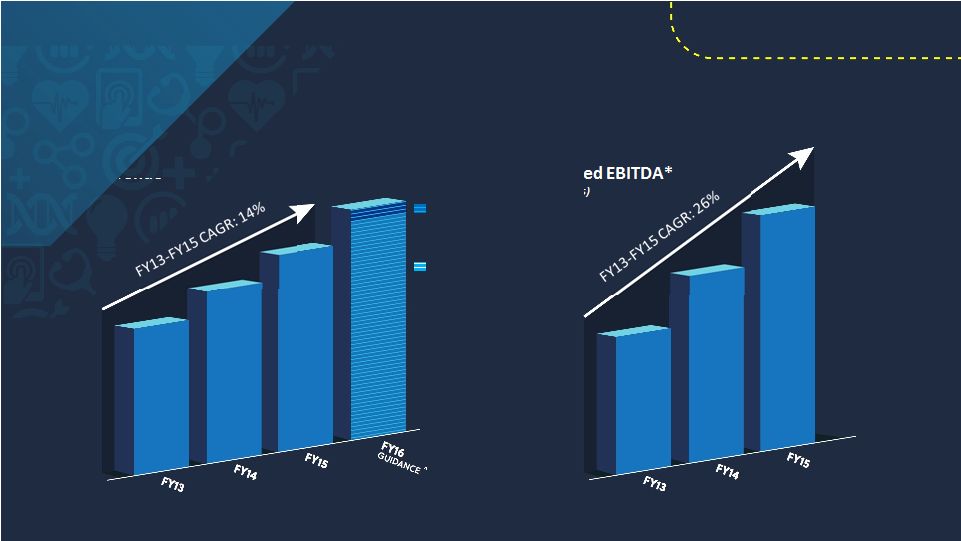 Accelerated revenue and profitable growth driven by increasing demand
for expanded product offerings and strategic acquisitions
$352-$362 Performance Services Segment Net Revenue* (in millions) Performance Services Segment Adjusted EBITDA* (in millions) $205 $232 $269 $56 $74 $90 *Comparisons are with non-GAAP pro forma information that reflects the impact of the company’s reorganization and initial public offering. See Adjusted EBITDA, Segment Adjusted EBITDA and Adjusted Fully Distributed Net Income reconciliations to GAAP equivalents in Appendix. CECity + Healthcare Insights Premier, Inc. ^ As of 10/6/15 |
 Premier + CECity + Healthcare Insights Strategic and Attractive Economics Healthcare Insights Strategic Fit Enables Premier to offer a more complete solution that delivers additional value by adding financial management solutions to existing cost and quality applications Attractive Economics Accretive in year one with financial contributions accelerating CECity Strategic Fit Extends seamless performance analytics and improvement platform across the entire ambulatory and acute care spectrum, creating opportunities for growth and expansion Attractive Economics Accretive in year one with financial contributions accelerating Expected to be accretive to adjusted fully distributed earnings per share by $0.02-$0.04 in fiscal 2016 and $0.08-$0.10 in fiscal 2017 Tax amortization benefit enhances returns in initial years $30-$35 $60-$70 $7-$9 $22-$27 CECity + HCI Expected Financial Contributions (in millions) Revenue Guidance* Adjusted EBITDA Guidance* * As of 10/6/15 |
 Performance Services Driving long-term profitable growth Focus in emerging industry areas Leverage PremierConnect ® platform Drive acquisition synergies Member co-development Future investments |
 Significant financial flexibility to support a disciplined and targeted approach to invest in the business while seeking out acquisitions to create value for all stakeholders Capital Deployment Overview |
 INTERNAL Ongoing capital and expense budgets MEMBER CO-INNOVATION Use collaboratives and committees to identify new opportunities PARTNERSHIPS Joint development through partnerships in technology and population health INNOVATION INVESTMENTS Minority investments to foster early stage innovation and expansion opportunities ACQUISITION Acquire expanded capabilities and R&D functions Disciplined and targeted approach Capital Deployment |
 Targeted and disciplined acquisition strategy in areas of provider needs *Purchased initial 60% ownership in 2011. Remaining 40% minority interest purchased in February 2015.
Strategic Need
Company Clinical & physician preference cost reduction Closed July 2013 Data acquisition from multiple technologies Closed October 2013 Health system capital expenditure cost reduction Closed April 2014 Supply chain technology enablement Closed August 2014 Quality & safety improvement Closed September 2014 Direct sourcing Closed February 2015* Integrated financial management, cost analytics Closed July 2015 Ambulatory performance improvement, professional education, population health Closed August 2015 Physician practice operational and financial performance improvement Closed October 2015 |
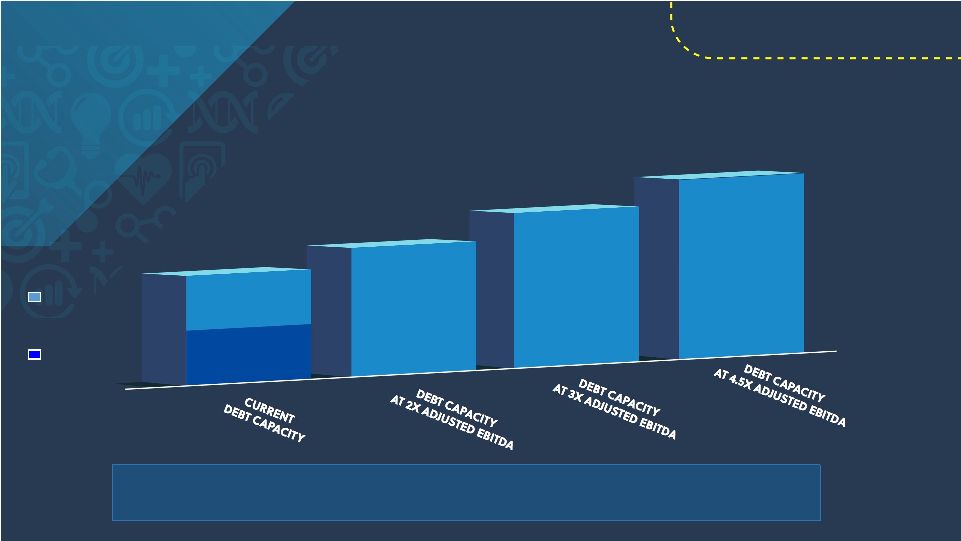 Ample financial capacity to support further growth opportunities $150 $600 ~$900 ~$1,300 ~$2,000 Available Debt Current Debt Total Debt Capacity (in millions) Significant free cash flow generation provides flexibility to add incremental leverage for larger and more transformative acquisitions |
 Attractive acquisition pipeline designed to drive ROI Diverse and growing end markets to drive Premier’s growth Supply Chain Services Performance Services Alternative Site Expansion Supply Chain analytics and workflow Physician preference item (PPI) management Integrated Pharmacy Shared services / standardized care Ambulatory clinical integration Population health management Patient engagement and social interaction Data acquisition and management |
 Well Positioned for Continued Sustainable Growth Long-term Financial Goals |
 Significant fiscal 2016 revenue visibility PERFORMANCE METRICS (1) FY 2016 FY 2015 3 Year Average Revenue available under contract (2) $1.05B --- --- GPO retention rate (3) --- 99% 97% SaaS institutional renewal rate (4) --- 94% 94% (1) As of fiscal year-end June 30, 2015 (2) Revenue available under contract updated to include revenue visibility from CECity and Healthcare Insights. Visibility is now $1.05
billion or 91 percent of the midpoint of the company’s FY16
guidance range. (3)
The retention rate is calculated based upon the aggregate purchasing volume
among all members participating in our GPO for such fiscal year less the annualized GPO purchasing volume for departed members for such fiscal year, divided by the aggregate purchasing volume among all members participating in our
GPO for such fiscal year.
(4) The renewal rate is calculated based upon the total number of members that have SaaS revenue in a given period that also have
revenue in the corresponding prior year period divided
by the total number of members that have SaaS revenue in the same period of the
prior year. OVER 90%
FY 2016 REVENUE GUIDANCE
RANGE ALREADY AVAILABLE
UNDER CONTRACT
HIGH GPO RETENTION AND SAAS INSTITUTIONAL RENEWAL RATES |
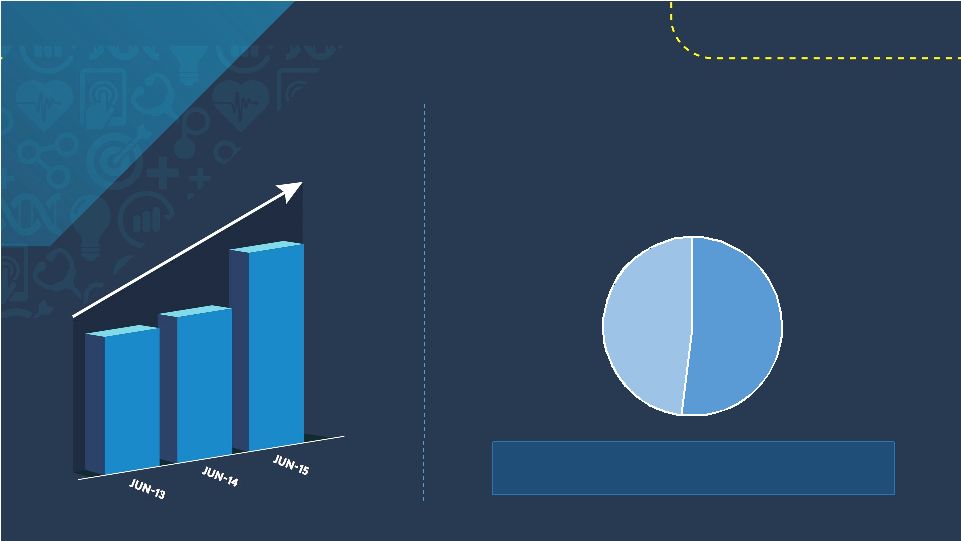 Premier Member Hospitals
*Expansion of a hospital’s relationship with Premier defined as an
increase in participation in one or more offerings. Hospital
Relationship Expansion*: FY13 -
FY15 1,900 (52%) member hospitals expanded their relationship with Premier over the past two years 2,900 3,000 3,600 Driving increase in membership and expansion of our relationships +24% 1,900 52% |
 Member engagement across core capabilities demonstrates recognition of integrated value Category June 2013 June 2015 Cost and Quality/Safety 24% 27% Any Two Categories 25% 34% All Three Categories 2% 10% Tracking and measuring a static cohort of member hospitals over a three-year period to
understand the change in participation yields a significant up-sell
opportunity* Reduce
Costs Improve Quality and Safety Population Health *Hospitals are counted in a category (reduce cost, improve quality & safety, population health) if they participate in at least one
offering in that category (numerator). The hospital
cohort is based on those hospitals that were Premier members at both 6/30/13 and 6/30/15 (denominator). |
  Fiscal 2016 annual guidance* * Updated October 6, 2015. The Company does not reconcile guidance for adjusted EBITDA and non-GAAP adjusted fully distributed net
income per-share to net income (loss) or GAAP earnings per share because the Company does not provide guidance for reconciling items between net income (loss) and adjusted EBITDA and non-GAAP adjusted fully distributed earnings
per share. The Company is unable to provide guidance for these reconciling items since certain items that impact net income (loss) are outside of the Company’s control and cannot be reasonably predicted. Accordingly, a reconciliation
to net income (loss) or GAAP earnings per share is not available without unreasonable effort. Supply Chain Services growth driven by: » Mid-single-digit net administrative fee revenue growth » 16-19% product revenue growth » Continued high GPO retention rates Guidance Assumptions: Performance Services growth driven by: » Continued demand for integrated offerings of SaaS-based subscription and licensed
products, advisory services and collaboratives
» Continuation of high SaaS institutional renewal rates » $30-35 million revenue and $7-9 million adjusted EBITDA contributions from CECity
and Healthcare Insights acquisitions
» Contribution from Partnership for Patients government contract Updated Previous (in millions, except per share data) FY 2016 % YoY Increase FY 2016 Net Revenue: Supply Chain Services segment $792 - $813 7% - 10% $792 - $813 Performance Services segment $352 - $362 31% - 35% $346 - $355 Total Net Revenue $1,144 - $1,175 14% - 17% $1,138 - $1,168 Non-GAAP adjusted EBITDA $425 - $444 8% - 13% $425 - $444 Non-GAAP adjusted fully distributed EPS $1.54 - $1.62 8% - 13% $1.54 - $1.62 Fiscal 2016 Financial Guidance Premier, Inc. updates full-year fiscal 2016 financial guidance, as follows: |
 Long-term financial goals Our path to continued profitable targeted growth TARGETED DOUBLE DIGIT GROWTH Invest in our PEOPLE Manage EXPENSES Innovate PRODUCTS Multiple REVENUE DRIVERS Financial FLEXIBILITY |
 Q & A |
 Appendix |
  Fiscal 2013 and fiscal 2014 non-GAAP reconciliations
2014*
2013
2014
2013
Reconciliation of Pro Forma Net Revenue to Net
Revenue: Pro Forma Net Revenue
235,466
$
200,938
$
869,286
$
764,278
$
Pro forma adjustment for revenue share
post-IPO —
39,663
41,263
105,012
Net Revenue
235,466
$
240,601
$
910,549
$
869,290
$
Reconciliation of Pro Forma Adjusted EBITDA and Segment
Adjusted EBITDA to Net Income and Operating Income: Net income 66,632 $
103,496
$
332,617
$
375,086
$
Pro forma adjustment for revenue share
post-IPO —
(39,663)
(41,263)
(105,012)
Interest and investment income, net
(378)
(366)
(1,019)
(965)
Income tax expense
3,248
3,788
27,709
9,726
Depreciation and amortization
9,809
7,883
36,761
27,681
Amortization of purchased intangible assets
904
385
3,062
1,539
Pro Forma EBITDA
80,215
75,523
357,867
308,055
Stock-based compensation
6,358
—
19,476
—
Acquisition related expenses
711
—
2,014
—
Strategic and financial restructuring
expenses 146
1,823
3,760
5,170
Adjustment to tax receivable agreement
liability 6,215
—
6,215
—
Gain on sale of investment
(522)
—
(38,372)
—
Other (income) expense, net
121
783
65
788
Pro Forma Adjusted EBITDA
93,244
$
78,129
$
351,025
$
314,013
$
Pro Forma Adjusted EBITDA
93,244
$
78,129
$
351,025
$
314,013
$
Depreciation and amortization
(9,809)
(7,883)
(36,761)
(27,681)
Amortization of purchased intangible assets
(904)
(385)
(3,062)
(1,539)
Stock-based compensation
(6,358)
—
(19,476)
—
Acquisition related expenses
(711)
—
(2,014)
—
Strategic and financial restructuring
expenses (146)
(1,823)
(3,760)
(5,170)
Adjustment to tax receivable agreement
liability (6,215)
—
(6,215)
—
Equity in net income of unconsolidated
affiliates (4,805)
(3,636)
(16,976)
(11,968)
Deferred compensation plan expense
(1,972)
—
(1,972)
—
62,324
64,402
260,789
267,655
Pro forma adjustment for revenue share
post-IPO —
39,663
41,263
105,012
Operating income
62,324
$
104,065
$
302,052
$
372,667
$
* Note that no pro forma adjustments were made for the
three months ended June 30, 2014; as such, actual results are presented for the three months ended June 30, 2014. Three Months Ended June 30, Year Ended June 30, Supplemental Financial Information - Reporting of Pro Forma Adjusted EBITDA
(Unaudited)
(In thousands)
Reconciliation of Selected Non-GAAP Measures to GAAP
Measures and Non-GAAP Adjusted Fully
Distributed Net Income |
 Fiscal 2013 and fiscal 2014 non-GAAP reconciliations
2014*
2013
2014
2013
Reconciliation of Non-GAAP Adjusted Fully Distributed
Net Income: Non-GAAP Adjusted Fully
Distributed Net Income (pro forma): Net
income (loss) attributable to shareholders
8,879
$
(797)
$
28,332
$
7,376
$
Pro forma adjustment for revenue share
post-IPO —
(39,663)
(41,263)
(105,012)
Income tax expense
3,248
3,788
27,709
9,726
Stock-based compensation
6,358
—
19,476
—
Gain on sale of investment
(522)
—
(38,372)
—
Acquisition related expenses
711
—
2,014
—
Strategic and financial restructuring
expenses 146
1,823
3,760
5,170
Adjustment to tax receivable agreement
liability 6,215
—
6,215
—
Amortization of purchased intangible
assets 904
385
3,062
1,539
Net income attributable to noncontrolling interest in
Premier LP 57,281
104,726
303,336
369,189
Non-GAAP adjusted fully distributed income before
income taxes 83,220
70,262
314,269
287,988
Income tax expense on fully distributed income before
income taxes 33,288
28,105
125,708
115,195
Non-GAAP adjusted fully distributed net income (pro
forma) 49,932
$
42,157
$
188,561
$
172,793
$
* Note that no pro forma adjustments were made for the
three months ended June 30, 2014; as such, actual results are presented for the three months ended June 30, 2014. Three Months Ended June 30, Year Ended June 30, Supplemental Financial Information - Reporting of Pro Forma Adjusted EBITDA (Unaudited) (In thousands) Reconciliation of Selected Non-GAAP Measures to GAAP Measures
and Non-GAAP Adjusted Fully Distributed Net Income
|
  Fiscal 2013 and fiscal 2014 non-GAAP reconciliations
2014*
2013
2014
2013
Reconciliation of numerator for GAAP EPS to Adjusted Fully
Distributed EPS Net income (loss)
attributable to shareholders after adjustment of redeemable limited partners' capital to redemption amount 491,389 $
(797)
$
(2,713,256)
$
7,376
$
Adjustment of redeemable
limited partners' capital to redemption amount (482,510)
- 2,741,588
- Net income (loss)
attributable to shareholders
8,879
(797)
28,332
7,376 Pro forma
adjustment for revenue share post-IPO
—
(39,663)
(41,263)
(105,012)
Income tax expense
3,248
3,788
27,709
9,726
Stock-based compensation
6,358
—
19,476
—
Gain on sale of investment
(522)
—
(38,372)
—
Acquisition related expenses
711
—
2,014
—
Strategic and financial restructuring
expenses 146
1,823
3,760
5,170
Adjustment to tax receivable agreement
liability 6,215
—
6,215
—
Amortization of purchased intangible assets
904
385
3,062
1,539
Net income attributable to noncontrolling interest in
Premier LP 57,281
104,726
303,336
369,189
Non-GAAP adjusted fully distributed income before
income taxes 83,220
70,262
314,269
287,988
Income tax expense on fully distributed income before
income taxes 33,288
28,105
125,708
115,195
Non-GAAP adjusted fully distributed net income (pro
forma) 49,932
$
42,157
$
188,561
$
172,793
$
Reconciliation of denominator for GAAP EPS to Adjusted
Fully Distributed EPS Weighted
Average: Common shares used for basic and
diluted earnings per share
32,375
5,733
25,633
5,858 Potentially
dilutive shares
194
-
124
- Class A common shares
outstanding
- 26,642
6,742
26,517 Conversion of Class B
common units
112,511
112,608
112,584
112,608 Weighted average fully distributed
shares outstanding - diluted
145,080
144,983
145,083
144,983
Reconciliation of GAAP EPS to Adjusted Fully
Distributed EPS GAAP income (loss) per
share
$ 15.18 $ (0.14)
$
(105.85)
$ 1.26 Impact of adjustment of redeemable limited partners' capital to redemption amount
$ (14.90) $ -
$ 106.96 $
- Impact of
additions: Pro forma adjustment for revenue
share post-IPO
$ - $ (6.92)
$ (1.61) $ (17.93)
Income tax expense
$ 0.10 $ 0.66
$ 1.08 $ 1.66
Stock-based compensation
$ 0.20 $ -
$ 0.76 $
- Gain on sale of
investment
$ (0.02) $ -
$ (1.50) $
- Acquisition related
expenses
$ 0.02 $ -
$ 0.08 $
- Strategic and financial
restructuring expenses
$ 0.00 $ 0.32
$ 0.15 $ 0.88
Adjustment to tax receivable agreement
liability
$ 0.19 $ -
$ 0.24 $
- Amortization of
purchased intangible assets
$ 0.03 $ 0.07
$ 0.12 $ 0.26
Net income attributable to noncontrolling interest in
Premier LP
$ 1.77 $ 18.27
$ 11.83 $ 63.02
Impact of corporation taxes
$ (1.03) $ (4.90)
$ (4.90) $ (19.66)
Impact of increased share count
$ (1.20) $ (7.06)
$ (6.06) $ (28.31)
Non-GAAP earnings per share on adjusted fully
distributed net income - diluted
$ 0.34 $ 0.29
$ 1.30 $ 1.19
* Note that actual results are presented for the three
months ended June 30, 2014. Three Months
Ended June 30,
Year Ended
June 30,
Supplemental Financial Information - Reporting of Net
Income and Earnings Per Share
(Unaudited)
(In thousands)
Reconciliation of Selected Non-GAAP Measures to GAAP
Measures |
  Fiscal 2014 and fiscal 2015 non-GAAP reconciliations
2015*
2014*
2015*
2014
Reconciliation of Pro Forma Net Revenue to Net
Revenue: Pro Forma Net Revenue
266,553
$
235,466
$
1,007,029
$
869,286
$
Pro forma adjustment for revenue share
post-IPO —
—
—
41,263
Net Revenue
266,553
$
235,466
$
1,007,029
$
910,549
$
Net income
32,061
$
66,632
$
234,785
$
332,617
$
Pro forma adjustment for revenue share
post-IPO —
—
—
(41,263)
Interest and investment income, net
(349)
(378)
(866)
(1,019)
Income tax expense
24,235
3,248
36,342
27,709
Depreciation and amortization
12,079
9,809
45,186
36,761
Amortization of purchased intangible assets
2,538
904
9,136
3,062
EBITDA
70,564
80,215
324,583
357,867
Stock-based compensation
7,369
6,358
28,498
19,476
Acquisition related expenses
2,629
711
9,037
2,014
Strategic and financial restructuring
expenses 92
146
1,373
3,760
(Gain) loss on investment
—
(522)
1,000
(38,372)
Adjustment to tax receivable agreement
liability —
6,215
—
6,215
Acquisition related adjustment - deferred
revenue 4,147
—
13,371
—
Loss on disposal of long-lived assets
15,243
15,243
Other expense (income), net
60
121
70
65
Adjusted EBITDA
100,104
$
93,244
$
393,175
$
351,025
$
Segment Adjusted EBITDA:
Supply Chain Services
100,970
$
94,394
$
391,180
$
396,470
$
Pro forma adjustment for revenue share
post-IPO —
—
—
(41,263)
Supply Chain Services (including pro forma adjustment) 100,970 $
94,394
$
391,180
$
355,207
$
Performance Services
22,518
19,531
90,235
73,898
Corporate
(23,384)
(20,681)
(88,240)
(78,080)
Adjusted EBITDA
100,104
$
93,244
$
393,175
$
351,025
$
Depreciation and amortization
(12,079)
(9,809)
(45,186)
(36,761)
Amortization of purchased intangible assets
(2,538)
(904)
(9,136)
(3,062)
Stock-based compensation
(7,369)
(6,358)
(28,498)
(19,476)
Acquisition related expenses
(2,629)
(711)
(9,037)
(2,014)
Strategic and financial restructuring
expenses (92)
(146)
(1,373)
(3,760)
Adjustment to tax receivable agreement
liability —
(6,215)
—
(6,215)
Acquisition related adjustment - deferred
revenue (4,147)
—
(13,371)
—
Equity in net income of unconsolidated
affiliates (6,473)
(4,805)
(21,285)
(16,976)
Deferred compensation plan expense (income)
544
(1,972)
753
(1,972)
65,321
62,324
266,042
260,789
Pro forma adjustment for revenue share
post-IPO —
—
—
41,263
Operating income
65,321
$
62,324
$
266,042
$
302,052
$
Equity in net income of unconsolidated
affiliates 6,473
4,805
21,285
16,976
Interest and investment income, net
349
378
866
1,019
(Loss) gain on investment
—
522
(1,000)
38,372
Loss on disposal of long-lived assets
(15,243)
—
(15,243)
—
Other (expense) income, net
(604)
1,851
(823)
1,907
Income before income taxes
56,296
$
69,880
$
271,127
$
360,326
$
* Note that no pro forma adjustments were made for the
three months and year ended June 30, 2015 and the three months ended June 30, 2014; as such, actual results are presented for each of these periods.
Three Months Ended
June 30,
Year Ended
June 30,
Supplemental Financial Information - Reporting of Pro
Forma Adjusted EBITDA
(Unaudited)
(In thousands)
Reconciliation of Selected Non-GAAP Measures to GAAP
Measures and Non-GAAP Adjusted Fully
Distributed Net Income Reconciliation of Net
Income to Adjusted EBITDA and Reconciliation of Segment Adjusted EBITDA to Income Before Income Taxes: |
 Fiscal 2014 and fiscal 2015 non-GAAP reconciliations
2015*
2014*
2015*
2014
Reconciliation of Non-GAAP Pro Forma Adjusted Fully
Distributed Net Income: Net income
attributable to shareholders
7,990
$
8,879
$
38,743
$
28,332
$
Pro forma adjustment for revenue share
post-IPO —
—
—
(41,263)
Income tax expense
24,235
3,248
36,342
27,709
Stock-based compensation
7,369
6,358
28,498
19,476
Acquisition related expenses
2,629
711
9,037
2,014
Strategic and financial restructuring
expenses 92
146
1,373
3,760
(Gain) loss on investment
—
(522)
1,000
(38,372)
Adjustment to tax receivable agreement
liability —
6,215
—
6,215
Acquisition related adjustment -
deferred revenue
4,147
—
13,371
—
Loss on disposal of long-lived assets
15,243
—
15,243
—
Amortization of purchased intangible
assets 2,538
904
9,136
3,062
Net income attributable to noncontrolling interest in
Premier LP 24,071
57,281
194,206
303,336
Non-GAAP pro forma adjusted fully distributed
income before income taxes
88,314
83,220
346,949
314,269
Income tax expense on fully distributed income before
income taxes 35,326
33,288
138,780
125,708
Non-GAAP Pro Forma Adjusted Fully Distributed Net
Income 52,988
$
49,932
$
208,169
$
188,561
$
* Note that no pro forma adjustments were made for the
three months and year ended June 30, 2015 and the three months ended June 30, 2014; as such, actual results are presented for each of these periods.
Three Months Ended
June 30,
Year Ended
June 30,
Supplemental Financial Information -
Reporting of Pro Forma Adjusted EBITDA
(Unaudited)
(In thousands)
Reconciliation of Selected Non-GAAP Measures to GAAP
Measures and Non-GAAP Adjusted Fully
Distributed Net Income |
 Fiscal 2014 and fiscal 2015 non-GAAP reconciliations
2015
2014
Reconciliation of Non-GAAP Free Cash Flow to Net Cash
Provided by Operating Activities: Net cash
provided by operating activities
108,483
$
79,431
$
Purchases of property and
equipment (19,670)
(15,898)
$
Distributions to limited partners
(23,412)
(21,299)
$
Payments to limited partners under tax receivable
agreements (11,499)
—
$
Non-GAAP free
cash flow 53,902
$
42,234
$
Supplemental
Financial
Information
-
Reporting
of
Non-GAAP
Free
Cash
Flow
Reconciliation of Selected Non-GAAP Measures to GAAP
Measures (Unaudited)
(In thousands)
Three Months Ended
June 30, |
  Fiscal 2014 and fiscal 2015 non-GAAP reconciliations
2015*
2014*
2015*
2014
Reconciliation of numerator for GAAP EPS to Non-GAAP
EPS on Net Income Attributable to Stockholders Net (loss) income attributable to stockholders after adjustment of redeemable
(84,076)
$
491,389
$
(865,292)
$
(2,713,256)
$
Adjustment of redeemable limited partners' capital to
redemption amount 92,066
(482,510)
904,035
2,741,588
Net income attributable to stockholders
7,990
8,879
38,743
28,332 Reconciliation of
denominator for GAAP EPS to Non-GAAP EPS on Net Income Attributable to Stockholders Weighted Average: Common shares used for basic and diluted earnings per share
37,576
32,375
35,681
25,633 Potentially dilutive
shares
1,592
194
1,048
124
Weighted average fully distributed shares outstanding
- diluted
39,168
32,569
36,729
25,757 Reconciliation of GAAP EPS to
Non-GAAP EPS on Net Income Attributable to Stockholders GAAP earnings (loss) per share $ (2.24)
$
15.18
$ (24.25) $ (105.85)
Impact of adjustment of redeemable limited partners'
capital to redemption amount
$ 2.45 $ (14.90)
$ 25.34 $ 106.96
Impact of potentially dilutive shares
$ (0.01) $ (0.01)
$ (0.04) $ (0.01)
Non-GAAP earnings per share on net income attributable
to stockholders - diluted
$ 0.20 $ 0.27
$ 1.05 $ 1.10
Reconciliation of numerator for GAAP EPS to Non-GAAP
EPS on Adjusted Fully Distributed Net Income
Net (loss) income attributable to shareholders after
adjustment of redeemable limited partners'
capital to redemption amount
(84,076)
$
491,389
$
(865,292)
$
(2,713,256)
$
Adjustment of redeemable limited partners' capital to
redemption amount 92,066
(482,510)
904,035
2,741,588
Net income attributable to shareholders
7,990
8,879
38,743
28,332 Pro forma adjustment
for revenue share post-IPO
—
—
—
(41,263)
Income tax expense
24,235
3,248
36,342
27,709
Stock-based compensation
7,369
6,358
28,498
19,476
Acquisition related expenses
2,629
711
9,037
2,014
Strategic and financial restructuring
expenses 92
146
1,373
3,760
(Gain) loss on investment
—
(522)
1,000
(38,372)
Adjustment to tax receivable agreement
liability —
6,215
—
6,215
Acquisition related adjustment - deferred
revenue 4,147
—
13,371
—
Loss on disposal of long-lived assets
15,243
—
15,243
—
Amortization of purchased intangible assets
2,538
904
9,136
3,062
Net income attributable to noncontrolling interest in
Premier LP 24,071
57,281
194,206
303,336
Non-GAAP pro forma adjusted fully distributed income
before income taxes 88,314
83,220
346,949
314,269
Income tax expense on fully distributed income before
income taxes 35,326
33,288
138,780
125,708
Non-GAAP pro forma adjusted fully distributed net
income 52,988
$
49,932
$
208,169
$
188,561
$
* Note that no pro forma adjustments were made for the
three months and year ended June 30, 2015 and the three months ended June 30, 2014; as such, actual results are presented for each of these periods.
Three Months Ended
June 30,
Year Ended
June 30,
Supplemental Financial Information - Reporting of Net
Income and Earnings Per Share
(Unaudited)
(In thousands, except per share data)
Reconciliation of Selected Non-GAAP Measures to GAAP
Measures |
 Fiscal 2014 and fiscal 2015 non-GAAP reconciliations
2015*
2014*
2015*
2014
Reconciliation of denominator for GAAP EPS to Non-GAAP
Adjusted Fully Distributed Net Income
Weighted Average:
Common shares used for basic and diluted earnings per
share 37,576
32,375
35,681
25,633
Potentially dilutive shares
1,592
194
1,048
124
Class A common shares outstanding
-
-
-
6,742
Conversion of Class B common units
106,471
112,511
108,518
112,584
Weighted average fully distributed shares outstanding
- diluted
145,639
145,080
145,247
145,083
Reconciliation of GAAP EPS to Adjusted Fully Distributed
EPS GAAP earnings (loss) per
share
$
(2.24)
$
15.18
$
(24.25)
$
(105.85) Impact of adjustment of redeemable
limited partners' capital to redemption amount $ 2.45
$
(14.90)
$
25.34
$ 106.96
Impact of additions:
Pro forma adjustment for revenue share
post-IPO
$
- $ -
$
- $ (1.61)
Income tax expense
$
0.64
$
0.10
$
1.02
$
1.08 Stock-based
compensation
$
0.20
$
0.20
$
0.80
$
0.76 Acquisition related
expenses
$
0.07
$
0.02
$
0.25
$
0.08 Strategic and
financial restructuring expenses
$
0.00
$
0.00
$
0.04
$
0.15 (Gain) loss on
investment
$
- $ (0.02)
$
0.03
$
(1.50) Adjustment to tax
receivable agreement liability
$
- $ 0.19
$
- $ 0.24
Acquisition related adjustment -
deferred revenue
$
0.11
$
-
$
0.37
$
- Loss on disposal of long-lived assets $ 0.41
$
-
$
0.43
$
- Amortization of purchased intangible assets $ 0.07
$
0.03
$
0.26
$
0.12 Net income
attributable to noncontrolling interest in Premier LP $ 0.64
$
1.77
$
5.44
$
11.83 Impact of corporation
taxes
$
(0.94)
$
(1.03)
$
(3.90)
$
(4.90) Impact of increased
share count
$
(1.05)
$
(1.20)
$
(4.40)
$
(6.06) Non-GAAP earnings per
share on adjusted fully distributed net income - diluted $ 0.36
$
0.34
$
1.43
$
1.30 * Note that no pro
forma adjustments were made for the three months and year ended June 30, 2015 and the three months ended June 30, 2014; as such, actual results are presented for each of these periods.
Three Months Ended
June 30,
Year Ended
June 30,
Supplemental Financial Information -
Reporting of Net Income and Earnings Per Share
(Unaudited)
(In thousands, except per share data)
Reconciliation of Selected Non-GAAP Measures to GAAP
Measures |