Attached files
| file | filename |
|---|---|
| 8-K - FORM 8-K - Wellesley Bancorp, Inc. | v420889_8k.htm |
Exhibit 99.1

I NVESTOR P RESENTATION S EPTEMBER 25, 2015 T ICKER : WEBK WWW . WELLESLEYBANK . COM
This presentation contains certain “forward - looking statements” within the meaning of the U . S . Private Securities Litigation Reform Act of 1995 about the Company and the Bank . Forward - looking statements include statements regarding anticipated future events and can be identified by the fact that they do not relate strictly to historical or current facts . They often include words such as “believe,” “expect,” “anticipate,” “estimate,” and “intend” or future or conditional verbs such as “will ,” “ would,” “should,” “could,” or “may . ” Forward - looking statements, by their nature, are subject to significant assumptions, risks and uncertainties . Certain factors that could cause actual results to differ materially from expected results include increased competitive pressures, changes in the interest rate environment, general economic conditions or conditions within the securities markets, and legislative and regulatory changes that could adversely affect the business in which the Company and the Bank are engaged . More detailed information regarding these factors is included in our filings with the U . S . Securities and Exchange Commission, including in the “Risk Factors” section of our Annual Report on Form 10 - K for the year ended December 31 , 2014 . In addition, it should be noted that our forward - looking statements speak only as of the date of this presentation . We do not undertake to update our forward - looking statements to reflect the impact of events or circumstances that may arise after the date on which such statements are made . Forward Looking Statements and Associated Risk Factors

Page 3 S UMMARY S TATISTICS – J UNE 30, 2015 Total Assets: ($000) $561,928 Total Loans, net: ($000) $472,919 Total Deposits: ($000) $428,429 Total Stockholders’ Equity: ($000) $50,474 Book Value per Common Share: $20.53 Shares Outstanding: (1) 2,459,138 Headquarters: Wellesley, MA Insider Ownership: (2) 18% Institutional Ownership: (2) 27% (1) As of August 1, 2015 (2) Source: SNL Financial LC

Page 4 C ORPORATE P ROFILE AND S TRUCTURE ▪ Growth Oriented, Independent, and Community Based by Design ▪ Serving Wellesley and t he Greater Boston Area Since 1911 ▪ Five Locations in Norfolk and Suffolk County, including a limited hour Retirement Community Office ▪ Wealth Management Services W ELLESLEY B ANCORP , I NC . Parent Holding Company W ELLESLEY B ANK Massachusetts Chartered Stock Co - operative Bank W ELLESLEY I NVESTMENT P ARTNERS , LLC Wholly Owned Subsidiary of Wellesley Bank

Page 5 E XPERIENCED AND D EDICATED M ANAGEMENT T EAM Name Title/Function Years in Industry Years with Wellesley Bank Thomas J. Fontaine President and Chief Executive Officer 29 16 Gary P. Culyer SVP and Chief Financial Officer 32 4 Ralph L. Letner SVP and Chief Lending Officer 29 1 Eloise C. Thibault SVP and Treasurer 27 25 Henry M. Connors SVP and Director of Deposit Operations 30 14 Alice E. Lee SVP of Retail Banking 18 10 Maureen E. Sullivan SVP of Marketing and Human Resources 2 2 John W. Wescott SVP of Information Technology 35 7 Ann Marie DeCoff VP of Loan Operations 33 10 Angela H. Yee VP and Compliance Officer 13 5 Louis P. Crosier President of Wellesley Investment Partners, LLC 15 1

Page 6 W ELLESLEY B ANK M ASSACHUSETTS B ANKING O FFICES Source: SNL Financial LC Newton Centre - Office to be opened March, 2016 Newton Centre Office to be opened March, 2016 *North Hill Branch - Limited Hour/Retirement Community Current Locations* Wellesley Investment Partners, LLC

Page 7 G ROWTH S TRATEGY AND K EYS TO S UCCESS ▪ Emphasis on Organic Growth ▪ Continued Growth of a Diverse Lending Mix of Residential and Commercial Loans ▪ Maintain Solid Credit Culture ▪ Focus on Growing Strategic Client Relationships with Emphasis on Core * Deposit Relationships ▪ Increase Wealth Management Assets Under Management and Income Premier Client Service Experience Financial Stability Access to Decision Makers Premier Client Service Experience Experienced and Dedicated Team Product Depth Financial Stability * All Deposits other than CD’s and Institutional CD’s

Page 8 T OTAL A SSETS ($000) (1) See Addendum 200,000 250,000 300,000 350,000 400,000 450,000 500,000 550,000 600,000 FY2009 FY 2010 FY 2011 FY 2012 FY 2013 FY 2014 Q2 2015 Total Assets
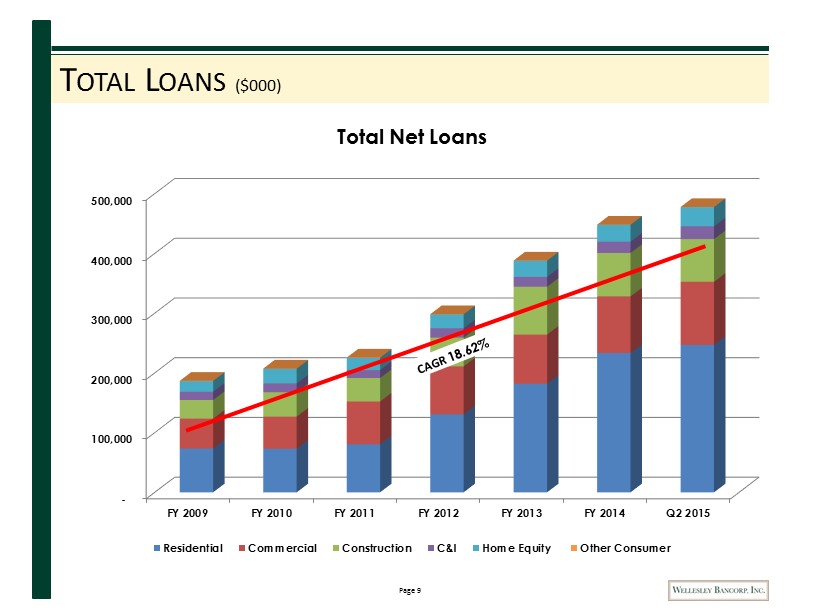
Page 9 T OTAL L OANS ($000) - 100,000 200,000 300,000 400,000 500,000 FY 2009 FY 2010 FY 2011 FY 2012 FY 2013 FY 2014 Q2 2015 Total Net Loans Residential Commercial Construction C&I Home Equity Other Consumer

Page 10 L OAN C OMPOSITION 2009 (Dollar values in thousands as of June 30,2009) Loan Type Balance % of Total Residential $ 78,565 41.4% Commercial 42,620 22.4% Construction 36,444 19.2% C & I 12,804 6.7% Home Equity Lines 18,837 9.9% Cons. & Other 669 0.4% Total $189,939 100.0% 2015 (Dollar values in thousands as of June 30,2015) Loan Type Balance % of Total Residential $246,923 51.7% Commercial 105,524 22.1% Construction 71,478 14.9% C & I 21,472 4.5% Home Equity Lines 32,017 6.7% Cons. & Other 282 0.1% Total $477,696 100.0% 2009 - 2015 CAGR Growth % 24.7 14.9 16.3 8.3 11.3 ( 11.1) Construction 14.9% Residential 51.7% Home Equity 6.7 Commercial real estate 22.1% C&I 4.5% Other consumer 0.1% Construction 19.2% Residential , 41.4% Home Equity 9.9% Commercial real estate 22.4 % C&I 6.7% Other consumer 0.4%

Page 11 D EPOSIT C OMPOSITION 2009 (Dollar values in thousands as of June 30, 2009) Deposit Type Balance % of Total Demand & NOW $ 34,793 17.2% Savings 15,786 7.8% Money Market 40,763 20.2% Certificates 110,851 54.8% Total $202,193 100.0% 2015 (Dollar values in thousands as of June 30, 2015) Deposit Type Balance % of Total Demand & NOW $98,826 23.1% Savings 106,589 24.9% Money Market 77,858 18.1% Certificates 145,157 33.9% Total $428,430 100% 2009 - 2015 CAGR Growth % 20.9 41.5 12.5 5.0 Demand & NOW 17% Savings 8% Money Market 20% Certificates 55% Core Deposits as % of Total: 45.2% Demand & NOW 23% Savings 25% Money Market 18% Certificates 34% Core Deposits as % of Total: 66.1% MRQ Cost of Int. Bearing Deposits: 2.38% MRQ Cost of Int. Bearing Deposits: 0.71% • SIGNIFICANT SHIFT TO CORE DEPOSIT FUNDING WITH STRONG GROWTH IN TRANSACTIONAL ACCOUNTS
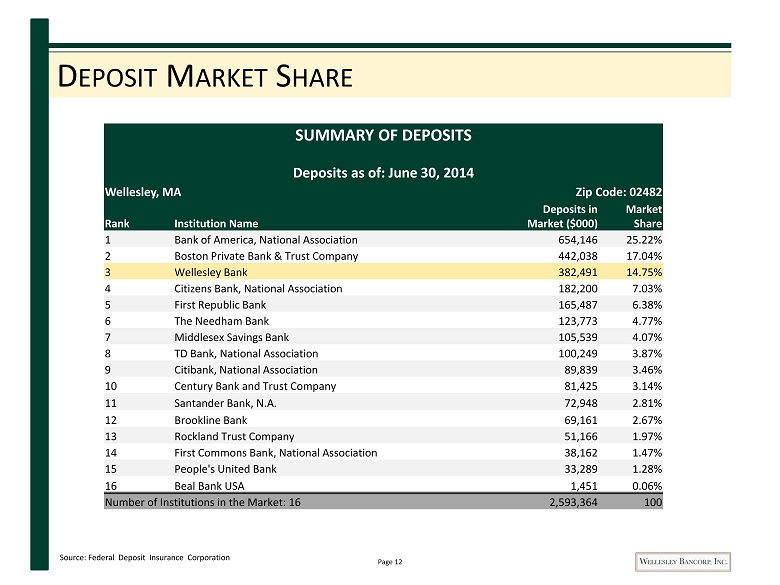
Page 12 D EPOSIT M ARKET S HARE SUMMARY OF DEPOSITS Deposits as of: June 30, 2014 Wellesley, MA Zip Code: 02482 Rank Institution Name Deposits in Market ($000) Market Share 1 Bank of America, National Association 654,146 25.22% 2 Boston Private Bank & Trust Company 442,038 17.04% 3 Wellesley Bank 382,491 14.75% 4 Citizens Bank, National Association 182,200 7.03% 5 First Republic Bank 165,487 6.38% 6 The Needham Bank 123,773 4.77% 7 Middlesex Savings Bank 105,539 4.07% 8 TD Bank, National Association 100,249 3.87% 9 Citibank, National Association 89,839 3.46% 10 Century Bank and Trust Company 81,425 3.14% 11 Santander Bank, N.A. 72,948 2.81% 12 Brookline Bank 69,161 2.67% 13 Rockland Trust Company 51,166 1.97% 14 First Commons Bank, National Association 38,162 1.47% 15 People's United Bank 33,289 1.28% 16 Beal Bank USA 1,451 0.06% Number of Institutions in the Market: 16 2,593,364 100 Source: Federal Deposit Insurance Corporation

Page 13 D EPOSIT M ARKET S HARE P OTENTIAL SUMMARY OF DEPOSITS Deposit s as of: June 30, 2014 BOSTON, MA Zip Code: 02110 Number of Institutions in the Market: 16 Total Value of Deposits ( $ 000) : 41,634,616 NEWTON CENTER, MA Zip Code: 02459 Number of Institutions in the Market: 11 Total Value of Deposits ($ 000) : 1,931,814 Source: Federal Deposit Insurance Corporation

Page 14 A SSET Q UALITY Source: SNL Financial LC (1) See Addendum (2) Year to date 12/2011 12/2012 12/2013 12/2014 6/2015 Peers (1) 6/2015 NPLs / Total Loans (%) 3.06% 1.18% 0.98% 1.08% 0.89% 1.46% Loan Loss Reserves/ Gross Loans (%) 1.51% 1.29% 1.09% 1.06% 1.05% 1.08% Loan Loss Reserves/NPLs (%) 49.25% 109.52% 112.50% 98.99% 100.02% 82.66% Net Charge - offs/ Gross Loans (%) (2) 0.09% 0.04% 0.04% 0.03% 0.02% 0.06%

Page 15 W ELLESLEY B ANCORP , I NC . F INANCIAL H IGHLIGHTS 2012 FQ4 2013 FQ4 2014 FQ2 2014 FQ4 2015 FQ2 Period Ended 12/31/2012 12/31/2013 6/30/2014 12/31/2014 6/30/2015 Balance Sheet Highlights ($000) Total Assets 376,048 458,520 494,304 535,115 561,928 Total Net Loans 303,221 384,543 418,323 443,883 475,207 Total Deposits 298,059 357,518 386,986 422,245 428,429 Total Equity 44,971 46,789 48,110 49,346 50,474 Profitability (%) Net Income ($000) 681 434 431 436 585 ROAA 0.74 0.39 0.36 0.34 0.42 ROAE 6.09 3.93 3.59 3.56 4.65 Net Interest Margin 3.50 3.47 3.43 3.32 3.38 Efficiency Ratio 66.04 79.08 78.20 83.72 77.65 Noninterest Inc/ Operating Rev 10.30 6.32 5.48 5.15 5.54 Balance Sheet Ratios/ Capital (%) Loans/ Deposits 99.96 108.51 108.88 106.12 111.51 Securities/ Assets 10.97 8.69 8.73 10.53 9.67 Total Equity/ Total Assets 11.96 10.20 9.73 9.22 8.98 Tier 1 Ratio 16.59 13.80 13.20 12.93 12.02 Risk-based Capital Ratio 17.94 15.05 14.45 14.18 13.17 Leverage Ratio (BHC Only) 12.03 10.64 9.90 9.46 9.21 Asset Quality (%) NCOs/ Avg Loans 0.00 0.10 0.00 0.00 0.00 Loan Loss Reserves/ Gross Loans 1.25 1.08 1.09 1.06 1.00 Loan Loss Provision/ NCO NM 157.89 NM NM NM Per Share Information ($) Common Shares Outstanding (actual) 2,394,071 2,454,465 2,454,592 2,459,138 2,459,138 Avg Diluted Shares 2,196,774 2,289,247 2,294,515 2,310,137 2,325,245 Basic Book Value per Share 18.78 19.06 19.62 20.07 20.53 Common Dividends Declared per Share 0.0000 0.0000 0.0250 0.0250 0.0300 EPS after Extra 0.31 0.19 0.19 0.19 0.25 Pre-Provision Earnings Per Share 0.35 0.24 0.27 0.21 0.29 Wellesley Bancorp, Inc. Financial Highlights

Page 16 WEBK S TOCK P RICE AND V OLUME C HART Statistics Average Price: $17.22 Volume Weighted Avg. Price: $15.22 Average Daily Trading Volume: 2,438 Stock Price and Volume Since 1/25/2012 0 50 100 150 200 250 300 350 400 450 $0.00 $5.00 $10.00 $15.00 $20.00 $25.00 01/25/12 07/25/12 01/25/13 07/25/13 01/25/14 07/25/14 01/25/15 07/25/15 Thousands Volume WEBK Stock Price Price/LTM EPS = 22.6x Price/TBV = 95% Note: Market data as of 9/16/2015 Source: SNL Financial

Page 17 C APITAL R ATIOS 8.39% 8.42% 12.23% 13.36% 6.00% 7.00% 8.00% 9.00% 10.00% 11.00% 12.00% 13.00% 14.00% TCE / TA Leverage Ratio Tier 1 Ratio RBC Ratio 6/30/15 Actual Capital Ratios 6/30/15 Actual Capital Ratios

Page 18 C ULTURE S TATEMENT At Wellesley Bank, it is all about the people; our employees, our community and most importantly our clients. It’s about hiring great people and treating them well, which in turn is a direct reflection on how we treat our clients. We pride ourselves in having an entrepreneurial spirit, where we continue to evolve, stay open to ideas and make quick sound decisions that make sense. The foundation of our bank is built on integrity, community and exceptional client service, where everyone is treated fairly and with respect. We continue to seek excellence, success and satisfaction in our work at Wellesley Bank. The Bank and directors are dedicated to providing an environment that enables all employees to attain these goals.

Page 19 A DDENDUM (1) SNL Financial LC custom peer group as of June 30, 2015: Bankwell Financial Group, Inc. (BWFG) BSB Bancorp, Inc. (BLMT) Chicopee Bancorp, Inc. (CBNK) Coastway Bncp, Inc. (CWAY) Community Bancorp, (CMTV) Elmira Savings Bank (ESBK) Empire Bancorp, Inc. (EMPK) Green County BNCP, Inc. (GCB Lake Shore Bancorp, Inc. (LSBK) Naugatuck Valley Finl (NVSL) Northeast Community Bncp (NECB) Pathfinder Bancorp, Inc. (PBHC) Patriot National Bancorp, Inc. (PNBK) Provident Bancorp, Inc. (PVBC) PSB Holdings Inc. (PSBH) SBT Bancorp, Inc. (SBTB) Sussex Bancorp (SBBX) Union Bankshares Inc. (UNB) Westfield Financial Inc. (WFD)