Attached files
| file | filename |
|---|---|
| EX-23.1 - EX-23.1 - Petco Holdings Inc | d42894dex231.htm |
Table of Contents
As filed with the Securities and Exchange Commission on September 24, 2015
Registration No. 333-206436
UNITED STATES
SECURITIES AND EXCHANGE COMMISSION
Washington, D.C. 20549
Amendment No. 1
to
FORM S-1
REGISTRATION STATEMENT
UNDER
THE SECURITIES ACT OF 1933
PETCO HOLDINGS, INC.
(Exact name of registrant as specified in its charter)
| Delaware | 5990 | 46-1075492 | ||
| (State or other jurisdiction of incorporation or organization) |
(Primary Standard Industrial Classification Code Number) |
(I.R.S. Employer Identification Number) |
10850 Via Frontera,
San Diego, California 92127
(858) 453-7845
(Address, including zip code, and telephone number, including area code, of registrant’s principal executive offices)
James Myers
Chief Executive Officer
10850 Via Frontera,
San Diego, California 92127
(858) 453-7845
(Name, address, including zip code, and telephone number, including area code, of agent for service)
Copies to:
| Thomas Holden, Esq. Patrick O’Brien, Esq. Ropes & Gray LLP 3 Embarcadero Center San Francisco, California 94111-4006 (415) 315-6300 |
Darragh J. Davis, Esq. Vice President, General Counsel & Corporate Secretary 10850 Via Frontera, San Diego, California 92127 (858) 453-7845 |
Jeffrey D. Karpf, Esq. Helena K. Grannis, Esq. Cleary Gottlieb Steen & Hamilton LLP One Liberty Plaza New York, New York 10006 (212) 225-2000 |
Approximate date of commencement of proposed sale to public: As soon as practicable after this Registration Statement is declared effective.
If any of the securities being registered on this Form are to be offered on a delayed or continuous basis pursuant to Rule 415 under the Securities Act of 1933, check the following box. ¨
If this Form is filed to register additional securities for an offering pursuant to Rule 462(b) under the Securities Act, check the following box and list the Securities Act registration statement number of the earlier effective registration statement for the same offering. ¨
If this Form is a post-effective amendment filed pursuant to Rule 462(c) under the Securities Act, check the following box and list the Securities Act registration statement number of the earlier effective registration statement for the same offering. ¨
If this Form is a post-effective amendment filed pursuant to Rule 462(d) under the Securities Act, check the following box and list the Securities Act registration statement number of the earlier effective registration statement for the same offering. ¨
Indicate by check mark whether the registrant is a large accelerated filer, an accelerated filer, a non-accelerated filer, or a smaller reporting company. See the definitions of “large accelerated filer,” “accelerated filer” and “smaller reporting company” in Rule 12b-2 of the Exchange Act.
|
Large accelerated filer ¨ |
Accelerated filer ¨ | Non-accelerated filer x | Smaller reporting company ¨ | |||
| (Do not check if a smaller reporting company) |
The Registrant hereby amends this Registration Statement on such date or dates as may be necessary to delay its effective date until the Registrant shall file a further amendment which specifically states that this Registration Statement shall thereafter become effective in accordance with Section 8(a) of the Securities Act of 1933 or until the Registration Statement shall become effective on such date as the Securities and Exchange Commission, acting pursuant to said Section 8(a), may determine.
Table of Contents
The information in this prospectus is not complete and may be changed. We may not sell these securities until the registration statement filed with the Securities and Exchange Commission is effective. This prospectus is not an offer to sell these securities and it is not soliciting an offer to buy these securities in any jurisdiction where the offer or sale is not permitted.
Subject to completion, dated September 24, 2015
Preliminary prospectus
Shares

Petco Holdings, Inc.
Common Stock
$ per share
This is the initial public offering of our common stock. The selling stockholders identified in this prospectus are offering shares. We will not receive any of the proceeds from the sale of the shares being sold by the selling stockholders. We currently expect the initial public offering price to be between $ and $ per share of common stock.
The selling stockholders have granted the underwriters an option to purchase up to additional shares of our common stock.
We have applied to list our common stock on under the symbol “ .”
| Per share | Total | |||||||
| Initial public offering price |
$ | $ | ||||||
| Underwriting discounts and commissions(1) |
$ | $ | ||||||
| Proceeds to selling stockholders before expenses |
$ | $ | ||||||
| (1) | See “Underwriting” for additional information regarding underwriting compensation. |
Investing in our common stock involves risk. See “Risk Factors” beginning on page 20.
Neither the Securities and Exchange Commission nor any state securities commission has approved or disapproved of these securities or passed on the adequacy or accuracy of this prospectus. Any representation to the contrary is a criminal offense.
The underwriters expect to deliver the shares of common stock to investors on or about , 2015.
| Goldman, Sachs & Co. | BofA Merrill Lynch | J.P. Morgan | ||||
| Credit Suisse | Deutsche Bank Securities | Morgan Stanley | Wells Fargo Securities | Jefferies | ||||
| TPG Capital BD, LLC | Piper Jaffray | Stifel | Cantor Fitzgerald & Co. | Guggenheim Securities | Nomura | |||||
Prospectus dated , 2015
Table of Contents

Table of Contents
| Page | ||||
| 1 | ||||
| 20 | ||||
| 40 | ||||
| 42 | ||||
| 43 | ||||
| 44 | ||||
| 45 | ||||
| 47 | ||||
| Management’s Discussion and Analysis of Financial Condition and Results of Operations |
51 | |||
| 72 | ||||
| 89 | ||||
| 99 | ||||
| 128 | ||||
| 130 | ||||
| 134 | ||||
| 138 | ||||
| 140 | ||||
| Certain Material United States Federal Income Tax Considerations for Non-U.S. Holders |
142 | |||
| 147 | ||||
| 150 | ||||
| 155 | ||||
| 155 | ||||
| 155 | ||||
| F-1 | ||||
We are responsible for the information contained in this prospectus and in any free writing prospectus we prepare or authorize. Neither we, the selling stockholders nor the underwriters have authorized anyone to provide you with different information, and neither we, the selling stockholders nor the underwriters take responsibility for any other information others may give you. We are not, and the selling stockholders and underwriters are not, making an offer to sell these securities in any jurisdiction where the offer or sale is not permitted. You should not assume that the information contained in this prospectus is accurate as of any date other than its date.
i
Table of Contents
INDUSTRY AND MARKET DATA
This prospectus includes market data and forecasts with respect to the pet food, supplies and services industry. Although we are responsible for all of the disclosure contained in this prospectus, in some cases we rely on and refer to market data and certain industry forecasts that were obtained from third-party surveys, market research, consultant surveys, publicly available information and industry publications and surveys that we believe to be reliable. Unless otherwise indicated, all market and industry data and other statistical information and forecasts contained in this prospectus are based on independent industry publications, government publications, reports by market research firms or other published independent sources, such as Packaged Facts, and other externally obtained data that we believe to be reliable. Some market and industry data, and statistical information and forecasts, are also based on management’s estimates, which are derived from our review of internal surveys as well as the independent sources referred to above. Any such market data, information or forecast may prove to be inaccurate because of the method by which we obtain it or because it cannot always be verified with complete certainty given the limits on the availability and reliability of raw data, the voluntary nature of the data gathering process and other limitations and uncertainties, including those discussed under the caption “Risk Factors.” As a result, although we believe that these sources are reliable, we have not independently verified the information.
TRADEMARKS AND SERVICE MARKS
Petco® is a registered trademark of Petco Animal Supplies, Inc. and Petco Animal Supplies Stores, Inc. Unleashed by Petco®, Healthier Pets. Happier People. Better World.®, Drs. Foster Smith®, WholePets® and Vetco® are registered trademarks of Petco Animal Supplies Stores, Inc. Pals Rewards™ and What We Feed Them Matters™ are trademarks of Petco Animal Supplies Stores, Inc. All other product and company names are trademarks of their respective owners.
Solely for convenience, the trademarks, service marks and trade names referred to in this prospectus are listed without the ®, SM and TM symbols.
ii
Table of Contents
This summary highlights information contained in other parts of this prospectus. Because it is only a summary, it does not contain all of the information that you should consider before investing in shares of our common stock and it is qualified in its entirety by, and should be read in conjunction with, the more detailed information appearing elsewhere in this prospectus. Unless the context requires otherwise, references in this prospectus to the “Company,” “Petco,” “we,” “us” and “our” refer to Petco Holdings, Inc. and its consolidated subsidiaries. “Petco Animal Supplies” refers to Petco Animal Supplies, Inc., our wholly owned subsidiary, and “Petco Stores” refers to Petco Animal Supplies Stores, Inc., our wholly owned indirect subsidiary. “Drs. Foster and Smith” refers to Drs. Foster Smith™. We report on the basis of a 52- or 53-week fiscal year, which ends on the Saturday closest to January 31. References to “fiscal year” mean the year in which that fiscal year began. For example, fiscal 2014 ended January 31, 2015, fiscal 2013 ended February 1, 2014 and fiscal 2012 ended February 2, 2013. Fiscal 2012 contained 53 weeks, while fiscal 2013 and fiscal 2014 contained 52 weeks. You should read the entire prospectus, especially “Risk Factors,” “Cautionary Note Regarding Forward-Looking Statements” and our financial statements and the related notes, before deciding to buy shares of our common stock.
Our Company
We believe in the powerful bond between humans and their pets. Our promise is to nurture connections between pets and their parents for better lives together. We strive to be the trusted partner of choice for pet parents, offering a fun, engaging and educational customer experience at more than 1,400 convenient store locations across the country and through our websites. We are a leading omnichannel specialty retailer of pet food, supplies, services and companion animals in the United States, with one of the largest selections of premium pet brands and services available to pet lovers. We offer purposeful products comprising what we believe are among the most trusted and authentic brands in the pet industry, many of which are not currently sold or carried by our closest pet specialty competitor.
With over 50 years of history, our goal is to offer our customers the merchandise, services and advice to help ensure that their pets enjoy the best nutrition and the highest quality of life in loving homes. We support pet parents who view their pets as extensions of their family. We believe this “humanization” trend drives demand for premium products and services, leading to higher levels of spending per pet. Our omnichannel business model helps nurture these powerful relationships between people and their pets. This is our vision: Healthier Pets. Happier People. Better World.
As of August 1, 2015, we operated 1,409 stores across all 50 states, the District of Columbia and Puerto Rico and an additional 13 stores through our joint venture in Mexico. We have two retail formats: Petco, our flagship retail store format, and Unleashed by Petco (“Unleashed”), a smaller format and up-scale urban lifestyle concept, which enable us to capitalize on real estate opportunities in a variety of urban, suburban and rural markets across the country. We offer a robust suite of in-store services that we believe appeal to discerning pet parents. These services, which cannot be replicated online, include grooming and dog training as well as low-cost vaccination and preventative wellness services, and we continue to expand and enhance our services offerings to address this fast-growing market segment. Our stores are complemented by the largest ecommerce platform in specialty pet retail, which includes Petco.com, DrsFosterSmith.com, Liveaquaria.com and Unleashed.com, and we have one of the most followed pet brands on social media.
Our stores are at the heart of our customer engagement strategy, showcasing our love for pets and providing opportunities for our associates to deliver high-quality service and knowledgeable advice
1
Table of Contents
to customers. Based on measures of unaided brand awareness and our Net Promoter Score, the Petco brand is widely recognized and highly recommended. To capitalize on our trusted brand and drive engagement with pet parents, we empower our sales associates to provide solutions for customers in the areas of pet nutrition, behavior and services. We utilize the rich customer insights gathered from our Pals loyalty card database to help guide our customer engagement strategy. This database included 19.1 million active members (which we define as members having made a purchase in the last twelve months) and captured 87% of our total sales in fiscal 2014. We believe our highly trained sales associates, together with our data-driven customer engagement model, promote regular return visits of our customers and help establish Petco as a one stop shop for all pet needs.
We have made substantial investments in our omnichannel retail model to position us for continued growth and success in the evolving pet industry. We operate our ecommerce business in-house, utilizing fulfillment processes which are integrated with our network of distribution centers. In recent years, we have made significant investments in our infrastructure to further optimize our business platform. Additionally, these investments include integrating new technology across stores, web and mobile experiences to complement our advanced in-house ecommerce fulfillment processes; a new advanced Customer Relationship Management (“CRM”) system to manage our Pals loyalty program; and the opening of our fifth main distribution center in Reno, Nevada to support our western U.S. store expansion and ecommerce businesses.
The $74 billion pet industry continues to thrive. We estimate that there are more than 6 million new pet households since 2007, while pet ownership among millennial households was 59% in 2014 compared to 50% in 2010, according to Packaged Facts. We believe pet humanization and ownership trends will continue to drive outsized growth of the pet services and premium offerings market segments compared to other portions of the pet industry. We plan to continue to invest in our business to maintain our leading position in the fastest-growing segments of the pet food, supplies and services industry. As a leading pet specialty retailer of natural and organic pet food brands, we believe we are well-positioned to capitalize on these favorable industry trends and take additional market share from grocery and discount stores.
Under the leadership of our experienced management team, we have taken several actions to strengthen our market position and enhance our growth potential. These actions include:
| • | refreshing our stores to make them more appealing and engaging to our customers; |
| • | expanding and refining our assortment of premium pet food and private label products; |
| • | enhancing the range, experience and quality of the robust suite of services offered in our stores; |
| • | developing an additional store format, Unleashed, which enables us to access a broader range of markets, customers and real estate; |
| • | building an industry-leading, comprehensive ecommerce platform, including pet pharmacy and prescription offerings; and |
| • | establishing a model for international growth through our joint venture in Mexico. |
We have established a track record of strong and consistent financial performance, achieving more than 20 consecutive years of net sales growth through various economic cycles. Key financial highlights include:
| • | achieving positive comparable sales growth for our 21 most recent consecutive quarters, and averaging 3.5% of comparable sales growth annually from fiscal 2005 to fiscal 2014; |
2
Table of Contents
| • | growing our store base from 779 stores under the Petco banner as of the end of fiscal 2005 to 1,251 stores under the Petco banner and 122 stores under the Unleashed banner as of the end of fiscal 2014, representing a compound annual growth rate (“CAGR”) of 6.6% on our total store base; |
| • | increasing the share of our net sales attributable to ecommerce from 1.2% in fiscal 2005 to 8.5% during the first two quarters of fiscal 2015, which includes our operations since our acquisition of Drs. Foster and Smith; |
| • | increasing net sales from $1,996 million for fiscal 2005 to $3,995 million for fiscal 2014, representing a CAGR of 8.0%; |
| • | increasing net income from $22 million for fiscal 2010 to $75 million for fiscal 2014, representing a CAGR of 35.3%; and |
| • | increasing Adjusted EBITDA from $320 million for fiscal 2010 to $457 million for fiscal 2014, representing a CAGR of 9.3%, and increasing Adjusted Net Income from $46 million for fiscal 2010 to $103 million for fiscal 2014, representing a CAGR of 22.6%. |
Adjusted EBITDA and Adjusted Net Income are financial measures that are not presented in accordance with U.S. generally accepted accounting principles (“GAAP”). For a discussion of our use of Adjusted EBITDA and Adjusted Net Income and reconciliations to net income, and historical comparable sales growth, please refer to “Summary Historical Consolidated Financial Data” and “Selected Historical Consolidated Financial Data.”
Our Industry
We compete in the highly attractive U.S. pet industry (including food, supplies, veterinary services and non-medical services), which was a $74 billion industry in 2014 and is projected to grow to $92 billion in 2019, representing a 4.3% CAGR, according to Packaged Facts. From 2014 to 2019, Packaged Facts forecasts that non-veterinary pet services, pet food and pet supplies will grow at a CAGR of 6.2%, 3.8% and 3.0%, respectively. The pet food, supplies and services market is highly fragmented, spread across superstores, discount stores, supermarkets, independent pet retailers and online retailers, with an increasing number of pet-owning households choosing to shop the pet specialty channel.
The pet specialty channel (which includes retail chains but not local independent pet stores) is the second largest channel with 24% market share in 2014, according to Packaged Facts. We estimate growth in this channel has outpaced that in the overall market with a 7.5% CAGR from 2005 to the end of 2014 compared to the U.S. pet industry’s 5.0% CAGR over the same period. As of June 2015, we estimate that we had approximately 16% of the total U.S. pet specialty chain and independent retail market share, based on total number of locations.
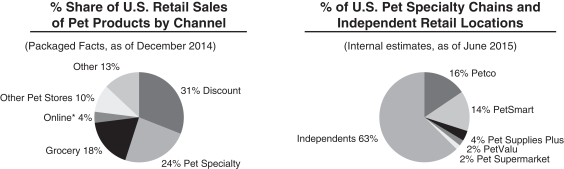
| * | Online includes ecommerce sales of brick and mortar market participants, including Petco. |
3
Table of Contents
The pet industry is characterized by the following trends that we believe positively impact our competitive positioning:
| • | Stable, defensive sector with continued attractive consumer trends. The pet industry has consistently demonstrated resilience across economic cycles, driven in part by the replenishment nature of consumable products and services such as pet food, grooming and veterinary services. Packaged Facts estimates that pet ownership has climbed to 63.8 million households in 2014 (or 54% of U.S. households), up from 61.2 million households in 2010 (or 53% of U.S. households). Spending on pets has consistently increased, even during the last recession, and is projected to reach $77.0 billion in 2015, up from $62.7 billion in 2010 and $47.2 billion in 2005, with average household spending of approximately $1,150 per year at the end of 2014. |
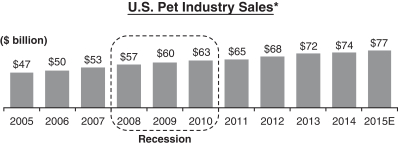
| * | Represents internal estimates for 2005 to 2008, and Packaged Facts data from 2009 to 2015E. |
| • | Continued expansion of the pet humanization trend. At the forefront of the pet industry’s momentum is pet humanization, the trend in which passionate and loyal pet parents view their pets as family and strive to provide better care for their pets through premium food, supplies and services. The pet humanization trend is demonstrated by results of a 2014 survey of pet owners conducted by Packaged Facts, set forth in the following charts: |
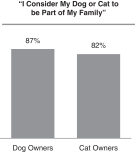
|
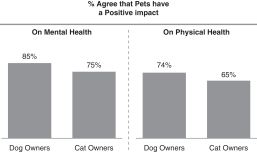
|
We believe this humanization trend leads many pet parents to seek to provide high-quality care for their pets with premium food, supplies and services, which is further increasing spending in the pet industry as 68% of dog owners and 63% of cat owners reported in the 2014 survey that they enjoy purchasing pet products that pamper their pets. The trend is also driving increased spending on non-medical services such as grooming and training, which Packaged Facts forecasts to be the highest growth-rate sub-sector in the pet industry, at a 6.2% CAGR from 2014 to 2019. In addition, as pet parents increasingly use social media as a means to personify and share their pets with others, we believe pet-focused content in social media will continue to accelerate the humanization trend.
4
Table of Contents
| • | High growth rate in premium pet food. As the trend of healthy human food consumption has grown, there has been a corresponding focus on nutritious options for pets. Specifically, natural food, with simple core ingredients, has driven increased spending on pet food. The higher demand for natural food products and more specialized formulas for different life-stages, breed sizes, special needs and diet types has fueled premiumization in the pet food industry, leading to the faster growth of products with higher net sales per unit. This premiumization trend has impacted all market segments and product types in the pet food industry. |
| • | Favorable demographic trends with millennials and higher-income households representing a growth opportunity. Pet ownership among the technology savvy millennial generation (age 18 to 29) was 59% of households in 2014 compared to 50% of households in 2010. Our market research indicates that millennials have higher average intended pet spend compared to baby boomers (age 50 to 68), with 76% of millennials indicating that they would splurge on certain items for pets compared to 50% of boomers. In addition, millennials, who tend to live in more dense urban locations, favor online shopping and social media, which represent additional growth avenues. A significant percentage of pet care and pet food sales also come from households with incomes of over $70,000, according to Packaged Facts. These favorable demographics represent a source for continued long-term industry growth, particularly within pet specialty. |
| • | Shift to specialty retailers. Pet specialty chains comprised 24% of the $43.8 billion in U.S. retail pet product sales in 2014, with discount merchandisers (31%) and grocery (18%) as significant competitors. We believe the pet specialty channel will gain market share from discount merchandisers and grocery, driven by the availability of knowledgeable associates; broader assortments of pet-related products; channel-specific foods and treats; service offerings such as grooming, training and vaccination; millennial customer preference for the specialty experience; and the availability of live animals and adoptions. Moreover, we believe that continued expansion of larger specialty chains, with size and scale leverage, will put increasing pressure on the highly fragmented independent pet specialty retailers. |
| • | Growing importance of omnichannel retailing in the pet industry. In recent years, pet food and pet supply sales have experienced significant growth in the pet specialty and ecommerce channels. Although Packaged Facts estimates that the ecommerce share of total expenditures in the pet food and supply industry was only 4% as of the end of 2014, it is growing rapidly, which we believe is being driven by online convenience, free shipping and reliable delivery advantages. In a recent Packaged Facts survey, nearly 31% of pet parents reported buying pet products online more frequently than they used to, up from only 14% in 2011. As the ecommerce segment grows, we believe the ability to provide an integrated, omnichannel experience by providing customers with the ability to shop for, and manage the needs of, their pets anytime and anywhere will be a competitive advantage over both ecommerce-only retailers and smaller independent retailers. As part of the omnichannel retail experience, we expect channel boundaries to blur, but physical stores will continue to support the vast majority of the market, especially key offerings such as pet services. |
As a result of these major industry trends, we believe that the pet industry will continue to be an attractive, dynamic and growing part of the overall U.S. economy. We also believe that pet parents are increasingly looking for specialty pet retailers, both in-store and online, with the knowledge and expertise to holistically address the health and well-being of their pets and the scale to remain convenient and price competitive on a broad selection of pet products and services.
5
Table of Contents
Our Competitive Strengths
We believe that we will continue to capitalize on attractive industry dynamics as a result of the following key competitive strengths:
Nationally recognized and trusted brand authority in pet retailing. We have one of the most widely recognized brands in the pet industry. We believe unaided brand awareness for Petco is over 70% as of the end of the second quarter of fiscal 2015. Our customers are strong advocates, as demonstrated by our Net Promoter Score (a measure of loyalty based on whether our Pals customers would recommend our stores to a friend or family member), which has consistently increased since implementing the program in 2012 to a score of approximately 75, comparable to other leading retail brands. We believe our long history of service to pet parents has driven brand authenticity and trust with our customers.
Our brand recognition is driven in large part by the scale of our store presence. We are the largest specialty pet retailer in the United States by total number of stores, with over 1,400 stores covering all 50 states, the District of Columbia and Puerto Rico. We also recently successfully expanded into Mexico with a joint venture with Grupo Gigante and currently have 13 Petco stores with plans to open additional stores in the future.
We believe that the scale of our national store footprint provides us with several advantages over smaller chains and independents in maintaining our brand authority, including product purchasing power, integrated marketing efforts and advertising scale, more convenient locations for customers, overall effectiveness in associate training and more robust omnichannel capabilities.
Broad and innovative product and service offerings. We have one of the broadest assortments of pet products and services, including exclusive and private label brands and natural and organic foods.
| • | Supplies and companion animal sales represented approximately 54% of our total sales in fiscal 2014. Our supplies offerings combine an extensive assortment, high level of quality and unique offerings through preferred vendor relationships and private label product lines. The companion animals we sell in our stores, which include birds, reptiles, aquatic life and other small animals, and in-store adoption centers also help us to initiate pet parent relationships and acquire long-term customers, in addition to creating a fun and engaging in-store shopping experience. |
| • | Food and consumables represented approximately 38% of our total sales during fiscal 2014. We are well-positioned to capitalize on the premium food trend by providing an extensive assortment of natural and organic pet brands, including leading natural brands that are currently not carried by our closest pet specialty competitor. |
| • | Services represented approximately 8% of our total sales in fiscal 2014. We complement our pet food and merchandise offerings with in-store grooming and training offerings to address the humanization-related increased demand for pet services. We complement these core services with our Vetco mobile vaccination in-store clinics, which supported over 80% of our locations as of the end of fiscal 2014. |
We believe that as a result of the actions we have taken to refine our product and service offerings, we are well-positioned to maximize our exposure to the fastest-growing segments of the pet industry. We believe the quality and breadth of our product offerings, combined with the services we offer, make Petco a leading retail destination and drive customer loyalty.
6
Table of Contents
A differentiated customer engagement approach. At the core of our business model is a focus on creating a genuine, supportive long-term relationship with the pet parent. We accomplish this through our knowledgeable in-store associates, interactive store experiences, customer rewards program and targeted marketing. We use years of customer insights from our 19.1 million active Pals loyalty card member database to train our in-store associates to generate high-content discussions with customers about pet nutrition, behavior and services. This consultative approach is even more involved around companion animal purchase and adoption activities. A key to our store environments has been improving store navigation through enhanced visual merchandising and display, right-sizing of categories and brands through space optimization, as well as innovation around new “shop in shops” like fun and fashion accessories, health and wellness, and natural, all of which are high-growth categories. We are not simply transaction-focused, but strive to create an interactive customer experience that drives regular return visits and establishes Petco as a one stop shop for all pet needs. Our customer data, gathered through our Pals loyalty program, demonstrates the high frequency and value of our best customers. For example, the top 10% of our Pals database customers on average visit Petco 18 times per year and spend an average of $856 per year. We also utilize our six-million customer e-mail database to contact customers with informational, promotional and loyalty-related direct marketing. We track our overall progress in customer engagement through our Net Promoter Score framework, which has demonstrated improving scores since its implementation in 2012. We believe our highly trained sales associates and data-driven customer engagement model have been effective in driving the quality of the shopping experience and visits to our stores.
Well-positioned store base and flexible real estate strategy. We have developed two store formats that enable us to appeal to a broad range of customers in different markets and locations. As of August 1, 2015, we had 1,283 Petco stores in urban, suburban and rural markets that generally range from 6,000 to 15,000 square feet and average 14,000 square feet. As of August 1, 2015, we also operated 126 Unleashed stores in or around urban markets, which average 5,000 square feet and are designed to have particular appeal to the millennial customer. The physical look of our stores has kept pace with investments across our chain to ensure that they are well-maintained and that we continue to innovate and improve our in-store experience. Approximately 46% of our stores have been remodeled, and 76% of our retail footprint has been opened or remodeled, since fiscal 2010. Our flexible store model enables us to appeal to a broad range of customers at different life stages and in urban, suburban and rural markets, which we believe enhances our growth prospects in each of these markets.
Leading omnichannel capabilities. We have the largest integrated ecommerce offering in pet specialty retail, with Petco.com, DrsFosterSmith.com, Liveaquaria.com and Unleashed.com collectively generating over $185 million in total net sales during the first two quarters of fiscal 2015. While in 2014 approximately 4% of overall pet food and supplies spending in the pet industry (excluding services) was attributable to ecommerce, the portion of our net sales generated through our websites was approximately 8.5% during the first two quarters of fiscal 2015. Petco.com recreates the in-store experience by focusing on a fun, content-driven shopping experience for online customers. We offer leading convenience capabilities with our broad national footprint and ecommerce capabilities, including our repeat delivery service for consumables and supplies and our recent partnership with Instacart, which provides same-day delivery of Petco products in major U.S. cities. We acquired DrsFosterSmith.com in fiscal 2015, which enables us to offer a complementary assortment of online pet pharmacy, prescription food and therapeutic, health and wellness products. In 2015, DrsFosterSmith.com was among the top ten most trustworthy websites in the country according to the Online Trust Alliance. Our sites collectively have 2.5 million active customers and provide us with a substantial base for direct marketing efforts to help facilitate repeat visits to stores and online
7
Table of Contents
purchases. Combined with our flexible store format, we seek to utilize our ecommerce capabilities to provide a seamless, integrated experience focused on quality, customer service and convenience.
Proven and experienced management team. We have an experienced and proven management team of successful retail industry veterans. Our Chief Executive Officer and Chairman of our Board of Directors, Jim Myers, has spent his entire 25-year retail career with Petco. Our Executive Vice President and Chief Financial Officer, Michael Nuzzo, has over 15 years of retail experience and brings extensive financial and operational experience from both GNC Holdings and Abercrombie & Fitch. Brad Weston, our President and Chief Merchandising Officer, with 27 years of experience in the retail industry, has served at Petco for three years, having previously served as Senior Vice President and Chief Merchandising Officer at Dick’s Sporting Goods for five years. Our management team has delivered consistent top- and bottom-line results throughout business cycles and has developed and implemented a number of initiatives to strengthen our future competitive positioning and growth prospects.
Our Growth Strategy
We grew our net sales at a CAGR of 8.0% from fiscal 2010 to fiscal 2014, while the pet industry as a whole grew at a CAGR of 4.1% during the same period. We believe our continued focus on the high-growth segments of the pet industry will enable us to continue to outpace the overall growth of the pet industry. We believe our competitive strengths, combined with our strategic investments in our business, position us to capitalize on industry drivers. Key elements of our future growth strategy are detailed below.
Increase core business comparable sales growth.
Continue to elevate our customer engagement efforts. We view our customer engagement model as a significant competitive advantage, and we continue to find ways to improve our approach, both online and in stores, to fuel increased sales growth. Our engagement efforts focus on each stage of the customer lifecycle, from early engagement welcome emails to growth- and retention-based brand initiatives and event-based campaigns to win back customer appreciation and reactivation efforts. We see opportunities to improve the cross-selling of merchandise and services through a mix of promotional and informational messaging, including by offering more customized e-mails to our Pals members to more effectively generate return visits. We are also exploring an opportunity to generate cross-selling synergies between our Petco and Drs. Foster and Smith customer bases. We are a leader among pet specialty retailers in social media, with millions of members, fans, and followers across Facebook, Twitter, Instagram, Pinterest and other social media outlets. Social media engagement enables us to effectively reach our customers, particularly millennial customers who on average significantly outpace baby boomers in omnichannel shopping habits and pet accessory “splurge” tendencies. Overall, we seek to be at the forefront of the shift to more individualized marketing and customer engagement, creating a loyalty-based, lifetime value proposition for pet parents that increases visit frequency and per trip expenditure levels.
Convert more customers to premium pet food buyers. The pet food category is a key driver of traffic for our stores and our websites that offer food products. For example, the total average size of transactions including food purchases was approximately 34% higher than non-food purchases during the second quarter of fiscal 2015. Pals members purchasing food during the second quarter of fiscal 2015 also made an average of approximately 3.1 trips to our stores during the quarter, compared to approximately 1.8 average trips made by Pals members who did not purchase food during the quarter.
8
Table of Contents
As pet parents are often resistant to switching pet foods, we designed our most recent advertising campaign—“what we feed them matters”—around inspiring pet parents to think critically about nutrition. In fiscal 2015 we also launched our Petco in-store demo program, which offers free pet food samples and nutritional information on brands and pet nutrition alternatives. The advertising campaign and demo program are supported by enhanced in-store associate training on nutrition conversations with customers.
With our high-quality, broad assortment of premium and natural pet food, as well as our integrated product and services offerings and compelling in-store and online experience, we are well-positioned to drive sales growth and increase customer retention by converting customers to our differentiated assortment of premium pet food brands. Although we generally do not have formal exclusivity agreements with our vendors, several of these brands are not carried by our closest competitors. Many of these brands are innovative and new, helping differentiate our product offering, further reinforcing the Petco brand as an authority in pet retailing. These brand offerings are typically higher margin due to their natural and premium qualities. We are consistently enhancing our offerings by establishing new relationships with brands we believe recognize our ability to help build brand awareness for their products and leverage the premium pricing opportunities of the specialty pet channel.
Increase penetration of pet services. Pet services is one of the fastest-growing segments in pet specialty retail with a projected CAGR of 6.2% from 2014 to 2019. While our services net sales grew at nearly twice the projected growth rate of the pet services industry in fiscal 2014, it represented only 7.7% of our total fiscal 2014 net sales. We have taken a number of steps to expand and enhance our services offerings to enable us to continue to outpace the overall pet services industry and to capitalize on this key sales growth driver. We use our many on-site pet services offerings to create the feel of an in-store theater, which we believe provides our customers with an experiential shopping environment that builds and promotes customer loyalty. We believe our services offerings distinguish us from other ecommerce and pet retailers. Our services are an important component of driving the in-store experience for our customers and enhancing the frequency of customer visits and total expenditures. For example, based on recent analysis, our dog-grooming customers generally visit our stores 50% more often than our average store customer, with close to double the amount spent per year (including grooming spend).
In fiscal 2014, we introduced a new store format and remodel design that positions services front and center within an overall health and wellness theme. We have also made changes to our management and employee compensation structures to drive further growth of our pet services business. We plan to further integrate vaccination services through our in-house Vetco business. We believe these investments position us well to continue to gain market share in the pet services industry.
Expand private label product sales. Our private label offering of pet supplies accounted for 15% of our net sales in fiscal 2014 and from fiscal 2010 to fiscal 2014 we grew our private label sales at a CAGR of 7.1%. We have an established infrastructure for developing, introducing and fostering growth in private label products, including a dedicated sourcing office in Asia, established in 2007. We intend to increase our private label sales by increasing penetration of existing brands such as You & Me, Well & Good, Sophresh, Bowl Mates and Bootique. We also intend to continue to expand our offering of new products and brands, including by opportunistically licensing additional brands. We also have an opportunity to leverage our Drs. Foster and Smith brand for developing veterinarian-approved product lines that can support both our online and store merchandising initiatives. We believe growing our private label sales will enhance overall net sales growth and drive gross margin rate benefit.
9
Table of Contents
Expand our integrated omnichannel model.
Continue to open profitable new stores. We believe our compelling product offering, leading customer engagement and the success of our flexible format stores across a broad range of geographic regions and population densities creates a significant opportunity to profitably increase our store count. Our flexible format stores, which generally range from 4,000 to 15,000 square feet, permit us to enter a wide range of markets to capitalize on attractive growth opportunities. For example, our smaller format Unleashed stores provide a differentiated market fill-in opportunity in urban centers. Our Petco store model has attractive economics for urban, suburban and more rural market settings. Based on our internal estimates, there are 800 to 900 additional locations in the United States that fit our performance requirements for new stores.
In addition, through our joint venture in Mexico with Grupo Gigante, we have successfully expanded the Petco store brand into Mexico, where we currently have 13 stores and plan to open additional stores in the future. Our initial performance in Mexico has greatly exceeded our internal expectations and creates a model for further potential international expansion.
Link stores, web and mobile in an integrated digital platform. We intend to utilize our leading digital presence, customer engagement programs such as Pals and new technology implementation to grow our omnichannel leadership position and acquire market share in the evolving pet retail landscape. Our strategy includes the following initiatives:
| • | Our Petco.com and DrsFosterSmith.com websites are already leading ecommerce banners. We expect our new 2015 IBM web platform implementation to enhance our advanced digital capabilities that will facilitate channel offerings like repeat delivery. |
| • | We are installing a new technology and communications infrastructure at our stores and equipping store associates with tablet devices to enable in-store online orders from our websites, known as “extended aisle.” We are also upgrading our in-store services scheduling technology to enhance our ability to generate repeat visits and cross-sell health and wellness merchandise. We expect this technology investment will enable future online-to-store links and give us additional flexibility for taking and fulfilling customer transactions. |
| • | We plan to continue to expand our same day delivery service partnership with Instacart, which currently offers 13,000 Petco stock-keeping units (“SKUs”) to customers in over 50 cities, including New York, Boston, Chicago, San Francisco and Los Angeles. |
Align organizational incentives to drive omnichannel growth. We believe that aligning incentives, training and communication programs to support omnichannel is as important as digital asset implementation to driving significant net sales growth. For example, we are augmenting incentive programs for our store organization to also reward in-store efforts to generate online sales. We believe that if our employees have an equal incentive to foster a strong customer relationship any time through any channel, we can drive an overall higher total company net sales growth rate.
Drive operational excellence.
Invest in new innovative revenue driving capabilities. We have a history of making strategic investments in systems, infrastructure, and complementary businesses to drive growth. Our management team has a disciplined focus and advanced return-on-investment framework for capital
10
Table of Contents
allocation decisions related to new stores, distribution facilities, and home office assets. We also regularly evaluate business acquisition opportunities in the pet industry. Overall, we seek to remain close to new and emerging business trends in the industry and take a measured approach to assessing their potential growth value to Petco.
Drive cost optimization in order to re-allocate resources to new growth opportunities. We continually seek to optimize our business model by rationalizing our cost structure and investing in future growth drivers. We have a track record of more than 20 years of profitable net sales growth and a continued focus on our expense base. Through a comprehensive assessment of our cost structure, we have identified additional cost saving opportunities in several areas, including cost of goods sold, operating expenses, distribution efficiency and corporate general and administrative expenses. We believe these opportunities for additional savings can result in further margin and profitability expansion and help us to maintain our long track-record of profitable net sales growth.
Utilize the Petco Foundation to drive organizational mission. The Petco Foundation, a separately incorporated 501(c)(3) nonprofit organization, invests in ground-breaking animal welfare work and finds homes for more than 400,000 pets last year through our Think Adoption First program in support of our mission to find a home for animals in need. The Petco Foundation is a significant factor in facilitating pet ownership and is aligned with our mission of making sure pets enjoy the best nutrition and the highest quality of life in loving homes. Since we believe that operational excellence is largely culturally influenced, the Petco Foundation serves as a meaningful employee rallying point that creates significant opportunities for continued success.
Risks Related to Our Business
An investment in our common stock involves a high degree of risk. Among these important risks are the following:
| • | general economic factors or failure to successfully predict and respond to changing consumer trends and demand could materially adversely affect our sales, results of operations and cash flow; |
| • | competition, including Internet-based competition, could negatively impact our business; |
| • | any damage to our reputation or our brand could materially adversely affect our business, financial condition and results of operations; |
| • | we may not be able to successfully execute our expansion strategy, including our international expansion, or manage and sustain our recent growth; |
| • | the loss of any of our key merchandise vendors, or of our exclusive distribution arrangements with certain of our vendors, would negatively impact our business; |
| • | product recalls and product liability exposure, as well as changes in product safety and other consumer protection laws, could increase our costs and otherwise restrict our operations; |
| • | breaches of, or interruptions in, our data security and information systems could disrupt or business and expose us to risk of loss; and |
| • | our substantial indebtedness could adversely affect our financial condition and limit our ability to pursue our growth strategy. |
See “Risk Factors” and “Cautionary Note Regarding Forward-Looking Statements.”
11
Table of Contents
Our Sponsors
TPG. TPG Global, LLC (together with its affiliates, “TPG”) is a leading global private investment firm founded in 1992 with more than $74 billion of assets under management as of June 30, 2015, and offices in San Francisco, Fort Worth, Austin, Beijing, Dallas, Hong Kong, Houston, London, Luxembourg, Melbourne, Moscow, Mumbai, New York, São Paulo, Shanghai, Singapore, Tokyo and Toronto. TPG has extensive experience with global public and private investments executed through leveraged buyouts, recapitalizations, spinouts, growth investments, joint ventures and restructurings. The firm’s investments span a variety of industries, including healthcare, financial services, travel and entertainment, technology, energy, industrials, retail, consumer, real estate and media and communications.
LGP. Founded in 1989 and based in Los Angeles, Leonard Green & Partners (‘‘LGP,” and together with TPG, the “Sponsors”) is one of the nation’s leading private equity firms. LGP frequently invests in companies that are leaders in their markets, including The Container Store, Shake Shack, Whole Foods Market, Jetro Cash & Carry, Activision, CHG Healthcare and Life Time Fitness. The firm invests in traditional buyouts, going-private transactions, recapitalizations, growth capital investments, corporate carve-outs and selective public equity and debt positions. LGP has a long history of investing in the pet sector, including its investment in VCA, a nationwide veterinarian hospital chain that went public in 2001.
We are party to certain agreements with the Sponsors and their affiliates, including a stockholders’ agreement pursuant to which the Sponsors and other stockholders have rights with respect to the designation of director nominees and a management services agreement pursuant to which affiliates of the Sponsors provide management, consulting and other services to us from time to time. Pursuant to the management services agreement, we will pay an aggregate of $ million upon its termination in connection with this offering. See “Certain Relationships and Related Party Transactions.”
We are currently controlled, and after this offering is completed will continue to be controlled, by the Sponsors and certain other significant stockholders. Upon completion of this offering, investment funds affiliated with the Sponsors and certain other significant stockholders will beneficially own % of our outstanding common stock (or % if the underwriters exercise in full their option to purchase additional shares from the selling stockholders). As long as the Sponsors and other significant stockholders own or control at least a majority of our outstanding voting power, they will have the ability to exercise substantial control over all corporate actions requiring stockholder approval, irrespective of how our other stockholders may vote, including the election and removal of directors and the size of our board, any amendment of our certificate of incorporation or bylaws, or the approval of any merger or other significant corporate transaction, including a sale of substantially all of our assets. Even if their ownership falls below 50%, the Sponsors and other significant stockholders will continue to be able to strongly influence or effectively control our decisions.
The Sponsors’ interests may not align with the interests of our other stockholders. The Sponsors are in the business of making investments in companies and may acquire and hold interests in businesses that compete directly or indirectly with us. The Sponsors may also pursue acquisition opportunities that may be complementary to our business, and, as a result, those acquisition opportunities may not be available to us. See “Risks Related to Our Common Stock and this Offering— Our Sponsors and certain other significant stockholders will continue to have significant influence over us after this offering, including control over decisions that require the approval of stockholders, which could limit your ability to influence the outcome of matters submitted to stockholders for a vote.”
12
Table of Contents
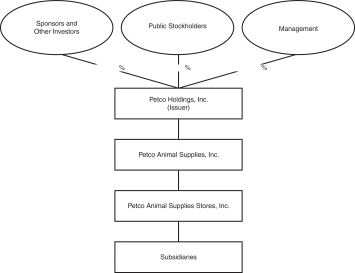
Corporate Information and Structure
Petco Holdings, Inc. is a Delaware corporation that was formed in October 2012 in connection with a corporate restructuring to support the Company’s capital structure. Its only material assets are the shares of the equity of Petco Animal Supplies, Inc., a Delaware corporation, which is the holder of 100% of the equity of Petco Animal Supplies Stores, Inc., a Delaware corporation. Petco Holdings, Inc. does not conduct any operations other than with respect to its direct and indirect ownership of its subsidiaries and conducts all of its business through Petco Animal Supplies and its subsidiaries. Our principal executive offices are located at 10850 Via Frontera, San Diego, California 92127, and our telephone number at that location is (858) 453-7845. Our website address is www.petco.com. Our website is included as an inactive textual reference only and our website and the information contained on our website do not constitute a part of this prospectus.
The following chart shows our simplified organizational structure immediately following the consummation of this offering assuming no exercise of the underwriters’ option to purchase additional shares:
13
Table of Contents
THE OFFERING
| Common stock offered by the selling stockholders |
shares. |
| Common stock to be outstanding after this offering |
shares. |
| Option to purchase additional shares of common stock |
additional shares from the selling stockholders. |
| Use of proceeds |
We will not receive any of the proceeds from the sale of shares by the selling stockholders. See “Use of Proceeds. |
| Dividend policy |
Our Board of Directors does not currently intend to pay dividends on our common stock. However, we expect to reevaluate our dividend policy on a regular basis following the offering and may, subject to compliance with the covenants contained in our credit facilities and other considerations, determine to pay dividends in the future. See “Management’s Discussion and Analysis of Financial Condition and Results of Operations—Liquidity and Capital Resources” and “Description of Indebtedness” for restrictions on our ability to pay dividends. |
| Risk factors |
You should read the “Risk Factors” section of this prospectus for a discussion of factors to consider carefully before deciding to invest in shares of our common stock. |
| Stock exchange listing and proposed symbol |
We have applied to list our common stock on under the symbol “ .” |
| Conflicts of interest |
Certain affiliates of TPG Capital BD, LLC, an underwriter in this offering, will own in excess of 10% of our issued and outstanding common stock following this offering. In addition, these affiliates of TPG Capital BD, LLC, as selling stockholders, will receive more than 5% of the net proceeds of this offering. As a result of the foregoing relationships, TPG Capital BD, LLC is deemed to have a “conflict of interest” within the |
14
Table of Contents
| meaning of FINRA Rule 5121. Accordingly, this offering will be made in compliance with the applicable provisions of FINRA Rule 5121. Pursuant to that rule, the appointment of a qualified independent underwriter is not necessary in connection with this offering. In accordance with FINRA Rule 5121(c), no sales of the shares will be made to any discretionary account over which TPG Capital BD, LLC exercises discretion without the prior specific written approval of the account holder. See “Underwriting—Conflicts of Interest.” |
The number of shares of common stock to be outstanding after this offering is based on shares of common stock outstanding as of , 2015 and excludes the following:
| • | shares of common stock issuable upon exercise of stock options outstanding as of , 2015 at a weighted average exercise price of $ per share; |
| • | that number of shares of common stock issuable upon exercise of a warrant to purchase shares of common stock, exercisable in connection with this offering, determined by dividing $ by the average closing price of a share of our common stock as reported on for the first 30 consecutive trading days commencing on the effective date of this offering; |
| • | shares of common stock underlying restricted stock units (“RSUs”) subject to future vesting requirements as of , 2015; and |
| • | shares of common stock reserved for future issuance under our equity incentive plans as of , 2015. |
Unless otherwise indicated, this prospectus reflects and assumes the following:
| • | an initial public offering price of $ per share, the midpoint of the price range set forth on the cover page of this prospectus; |
| • | the adoption of our restated certificate of incorporation and our amended and restated bylaws, to be effective upon the closing of this offering; |
| • | no exercise by the underwriters of their option to purchase up to additional shares of our common stock in this offering; and |
| • | for all periods, a for reverse split of our common stock effected on , 2015. |
15
Table of Contents
SUMMARY HISTORICAL CONSOLIDATED FINANCIAL DATA
The following table sets forth summary historical consolidated financial data for the periods presented and at the dates indicated below. We have derived the balance sheet data as of January 31, 2015 and February 1, 2014 and the statement of income and comprehensive income and cash flow data for fiscal years 2014, 2013 and 2012 from our audited consolidated financial statements included elsewhere in this prospectus. We have derived the balance sheet data as of August 1, 2015 and August 2, 2014 and the statement of income and comprehensive income and cash flow data for the 26-week period ended August 1, 2015 and August 2, 2014 from our unaudited interim condensed consolidated financial statements, included elsewhere in this prospectus.
Historical results are not necessarily indicative of the results to be expected for future periods and operating results for the 26 weeks ended August 1, 2015 are not necessarily indicative of the results that may be expected for the fiscal year ending January 30, 2016. The following information should be read in conjunction with the section entitled “Management’s Discussion and Analysis of Financial Condition and Results of Operations” and our consolidated financial statements and the notes thereto contained elsewhere in this prospectus.
Our fiscal year ends on the Saturday closest to January 31, resulting in fiscal years of either 52 or 53 weeks. All references to a fiscal year refer to the fiscal year ending on the Saturday closest to January 31 of the following year. For example, references to fiscal 2014 refer to the fiscal year beginning February 2, 2014 and ending January 31, 2015, references to fiscal 2013 refer to the fiscal year beginning February 2, 2013 and ending February 1, 2014 and references to fiscal 2012 refer to the fiscal year beginning January 28, 2012 and ending February 2, 2013. Fiscal 2014 and fiscal 2013 each include 52 weeks, and fiscal 2012 includes 53 weeks.
| Fiscal Year Ended | 26 Weeks Ended | |||||||||||||||||||
| (Dollars in thousands, except per share data) | January 31, 2015 (Fiscal 2014) |
February 1, 2014 (Fiscal 2013) |
February 2, 2013 (Fiscal 2012) |
August 1, 2015 |
August 2, 2014 |
|||||||||||||||
| (53 weeks) | (unaudited) | (unaudited) | ||||||||||||||||||
| Statement of operations data: |
||||||||||||||||||||
| Net sales |
$ | 3,995,368 | $ | 3,785,153 | $ | 3,528,030 | $ | 2,168,705 | $ | 1,941,408 | ||||||||||
| Cost of sales and occupancy costs |
2,778,427 | 2,601,855 | 2,403,065 | 1,514,751 | 1,351,611 | |||||||||||||||
|
|
|
|
|
|
|
|
|
|
|
|||||||||||
| Gross profit |
1,216,941 | 1,183,298 | 1,124,965 | 653,954 | 589,797 | |||||||||||||||
| Selling, general and administrative expenses |
928,684 | 884,991 | 837,681 | 498,539 | 455,558 | |||||||||||||||
| Goodwill impairment charges |
7,753 | — | — | — | — | |||||||||||||||
|
|
|
|
|
|
|
|
|
|
|
|||||||||||
| Operating income |
280,504 | 298,307 | 287,284 | 155,415 | 134,239 | |||||||||||||||
| Interest income |
(422 | ) | (119 | ) | (372 | ) | (199 | ) | (134 | ) | ||||||||||
| Interest expense |
159,292 | 157,143 | 128,123 | 78,345 | 79,955 | |||||||||||||||
| Loss on extinguishment of debt |
— | 3,810 | — | — | — | |||||||||||||||
| Other expenses |
— | 1,364 | 642 | — | — | |||||||||||||||
|
|
|
|
|
|
|
|
|
|
|
|||||||||||
| Income before income taxes and (income) loss from equity method investees |
121,634 | 136,109 | 158,891 | 77,269 | 54,418 | |||||||||||||||
| Income tax expense |
46,398 | 50,836 | 60,070 | 30,588 | 21,531 | |||||||||||||||
| (Income) Loss from equity method investees |
(106 | ) | 508 | — | (327 | ) | 96 | |||||||||||||
|
|
|
|
|
|
|
|
|
|
|
|||||||||||
| Net income |
$ | 75,342 | $ | 84,765 | $ | 98,821 | $ | 47,008 | $ | 32,791 | ||||||||||
|
|
|
|
|
|
|
|
|
|
|
|||||||||||
| Net income per share attributable to common stockholders |
$ | $ | $ | $ | $ | |||||||||||||||
| Basic |
||||||||||||||||||||
| Diluted |
||||||||||||||||||||
| Weighted average common shares outstanding |
||||||||||||||||||||
| Basic |
||||||||||||||||||||
| Diluted |
||||||||||||||||||||
| Cash dividends declared per common share |
$ | — | $ | — | $ | $ | — | $ | — | |||||||||||
16
Table of Contents
| Fiscal Year Ended | 26 Weeks Ended | |||||||||||||||||||
| (Dollars in thousands, except per square foot) | January 31, 2015 (Fiscal 2014) |
February 1, 2014 (Fiscal 2013) |
February 2, 2013 (Fiscal 2012) |
August 1, 2015 |
August 2, 2014 |
|||||||||||||||
| (53 weeks) | (unaudited) | (unaudited) | ||||||||||||||||||
| Store data: |
||||||||||||||||||||
| Number of stores at period end |
1,383 | 1,314 | 1,230 | 1,409 | 1,364 | |||||||||||||||
| Comparable sales growth(1) |
1.8 | % | 4.9 | % | 7.6 | % | 2.9 | % | 0.8 | % | ||||||||||
| Rent expense(2) |
$ | 354,311 | $ | 334,964 | $ | 322,168 | $ | 183,206 | $ | 173,945 | ||||||||||
| Net sales per square foot(3) |
$ | 217.0 | $ | 213.4 | $ | 208.6 | $ | 115.4 | $ | 106.8 | ||||||||||
| As of | As of | |||||||||||||||||||
| (Dollars in thousands) | January 31, 2015 (Fiscal 2014) |
February 1, 2014 (Fiscal 2013) |
February 2, 2013 (Fiscal 2012) |
August 1, 2015 |
August 2, 2014 |
|||||||||||||||
| (unaudited) | (unaudited) | |||||||||||||||||||
| Balance sheet data (end of period): |
||||||||||||||||||||
| Cash and cash equivalents |
$ | 191,265 | $ | 135,793 | $ | 130,367 | $ | 57,948 | $ | 77,183 | ||||||||||
| Merchandise inventories |
393,808 | 386,240 | 334,521 | 453,497 | 408,756 | |||||||||||||||
| Working capital(4) |
250,326 | 235,281 | 173,088 | 183,513 | 218,415 | |||||||||||||||
| Fixed assets, net |
591,812 | 513,877 | 487,378 | 621,710 | 552,981 | |||||||||||||||
| Total assets |
2,706,981 | 2,543,754 | 2,462,073 | 2,835,797 | 2,589,315 | |||||||||||||||
| Total debt(5) |
2,268,211 | 2,238,048 | 2,240,942 | 2,316,253 | 2,233,185 | |||||||||||||||
| Net debt(6) |
2,076,946 | 2,102,255 | 2,110,575 | 2,258,305 | 2,156,002 | |||||||||||||||
| Stockholders’ deficit |
(330,338 | ) | (410,271 | ) | (512,123 | ) | (285,517 | ) | (370,935 | ) | ||||||||||
| Fiscal Year Ended | 26 Weeks Ended | |||||||||||||||||||
| (Dollars in thousands, except per square foot) | January 31, 2015 (Fiscal 2014) |
February 1, 2014 (Fiscal 2013) |
February 2, 2013 (Fiscal 2012) |
August 1, 2015 |
August 2, 2014 |
|||||||||||||||
| (53 weeks) | (unaudited) | (unaudited) | ||||||||||||||||||
| Other financial data: |
||||||||||||||||||||
| Net cash provided by (used for) Operating activities |
$ | 245,432 | $ | 164,553 | $ | 248,423 | $ | 92,503 | $ | 58,185 | ||||||||||
| Investing activities |
(213,728 | ) | (145,753 | ) | (178,416 | ) | (269,427 | ) | (109,123 | ) | ||||||||||
| Financing activities |
23,768 | (13,374 | ) | (61,659 | ) | 43,607 | (7,672 | ) | ||||||||||||
| Capital expenditures |
(191,627 | ) | (136,008 | ) | (160,160 | ) | (106,778 | ) | (101,810 | ) | ||||||||||
| Depreciation and amortization(7) |
130,791 | 115,929 | 106,922 | 69,226 | 61,661 | |||||||||||||||
| EBITDA(8) |
411,401 | 408,554 | 393,564 | 224,968 | 195,804 | |||||||||||||||
|
|
|
|
|
|
|
|
|
|
|
|||||||||||
| Adjusted EBITDA(8) |
$ | 456,808 | $ | 437,101 | $ | 420,377 | $ | 240,063 | $ | 208,931 | ||||||||||
|
|
|
|
|
|
|
|
|
|
|
|||||||||||
| Adjusted Net Income(8) |
$ | 103,443 | $ | 99,376 | $ | 115,098 | $ | 56,153 | $ | 40,715 | ||||||||||
|
|
|
|
|
|
|
|
|
|
|
|||||||||||
| (1) | Comparable sales growth is for retail locations and ecommerce. A new store or website becomes comparable on the first day of the fiscal month following 12 full fiscal months of operation. Relocated stores become comparable stores on the first day of operation if original store was open longer than 12 full fiscal months. If, during the period presented, a store was closed, sales from that store are included up to the first day of the month of closing. See “Management’s Discussion and Analysis of Results of Operations and Financial Condition—How We Assess the Performance of our Business.” |
| (2) | Rent expense includes rent for stores and distribution centers and other small equipment leases. |
| (3) | Net sales per square foot is calculated by dividing net sales, including ecommerce sales, by total square footage as of the end of each fiscal year. |
| (4) | Working capital is defined as current assets less current liabilities. |
| (5) | Total debt includes obligations under our senior secured credit facilities, senior notes, senior payment-in-kind (“PIK”) toggle notes, capital lease and mortgage liabilities. |
| (6) | Net debt is defined as total debt less cash and cash equivalents. |
| (7) | Depreciation and amortization includes asset impairments and write-offs of $8.9 million, $2.3 million and $0.3 million for fiscal years 2014, 2013 and 2012, respectively. Asset impairments and write-offs for the 26-week period ending August 1, 2015 and August 2, 2014 included in depreciation and amortization were $1.8 million and $2.7 million, respectively. |
| (8) | EBITDA, Adjusted EBITDA and Adjusted Net Income are financial measures that are not defined under U.S. GAAP. We use these non-GAAP financial measures, and believe they enhance an investor’s understanding of our financial and operating performance from period to period, because they exclude certain material non-cash items, unusual or non-recurring items |
17
Table of Contents
| that we do not expect to continue in the future and certain other adjustments we believe are not reflective of our ongoing operations and our performance. We also report Adjusted EBITDA, or variations of this metric required under the indentures and credit agreements governing our outstanding indebtedness, to our lenders and noteholders. Certain of our debt covenants use Adjusted EBITDA or variations of this metric, including covenants regarding amounts of permitted liens we may incur and restricted payments we may make. We believe that EBITDA, Adjusted EBITDA and Adjusted Net Income provide investors with a useful tool for assessing the comparability between periods of our ability to generate cash from operations sufficient to pay taxes, to service debt and to undertake capital expenditures. We use these metrics to measure our core financial and operating performance for business planning purposes, to assess our liquidity and to compare our performance to that of our competitors. In addition, we believe EBITDA, Adjusted EBITDA and Adjusted Net Income are measures commonly used by investors to evaluate companies in the pet industry. However, they are not presentations made in accordance with U.S. GAAP and the use of the terms EBITDA, Adjusted EBITDA and Adjusted Net Income vary from others in our industry. These financial measures are not intended to represent and should not be considered as alternatives to net income, operating income or any other performance measures derived in accordance with GAAP as measures of operating performance or operating cash flows or as measures of liquidity. |
| EBITDA, Adjusted EBITDA and Adjusted Net Income have important limitations as analytical tools and you should not consider them in isolation or as substitutes for analysis of our results as reported under GAAP. For example, these financial measures: |
| • | exclude certain tax payments that may reduce cash available to us; |
| • | do not reflect any cash capital expenditure requirements for the assets being depreciated and amortized that may have to be replaced in the future; |
| • | do not reflect changes in, or cash requirements for, our working capital needs; |
| • | do not reflect the significant interest expense, or the cash requirements necessary to service interest or principal payments, on our debt; and |
| • | other companies in our industry may calculate these measures differently than we do, limiting their usefulness as comparative measures. |
| The table below illustrates a reconciliation of net income to EBITDA, Adjusted EBITDA and Adjusted Net Income for the periods presented: |
| Fiscal Year Ended | 26 Weeks Ended | |||||||||||||||||||
| (Dollars in thousands) | January 31, 2015 (Fiscal 2014) |
February 1, 2014 (Fiscal 2013) |
February 2, 2013 (Fiscal 2012) |
August 1, 2015 |
August 2, 2014 |
|||||||||||||||
| (53 weeks) | (unaudited) | (unaudited) | ||||||||||||||||||
| Net income |
$ | 75,342 | $ | 84,765 | $ | 98,821 | $ | 47,008 | $ | 32,791 | ||||||||||
| Interest expense, net |
158,870 | 157,024 | 127,751 | 78,146 | 79,821 | |||||||||||||||
| Income tax expense |
46,398 | 50,836 | 60,070 | 30,588 | 21,531 | |||||||||||||||
| Depreciation and amortization(1) |
130,791 | 115,929 | 106,922 | 69,226 | 61,661 | |||||||||||||||
|
|
|
|
|
|
|
|
|
|
|
|||||||||||
| EBITDA |
$ | 411,401 | $ | 408,554 | $ | 393,564 | $ | 224,968 | $ | 195,804 | ||||||||||
| Stock compensation |
3,095 | 3,083 | 4,940 | 1,465 | 1,444 | |||||||||||||||
| Store pre-opening and closing costs(2) |
10,000 | 8,693 | 8,865 | 4,805 | 3,421 | |||||||||||||||
| Management fees(3) |
6,666 | 7,356 | 6,928 | 3,170 | 3,352 | |||||||||||||||
| Loss on debt extinguishment |
— | 3,810 | — | — | — | |||||||||||||||
| Term loan amendment fees(4) |
— | 1,364 | 642 | — | — | |||||||||||||||
| Relocation, retention, severance and other related miscellaneous costs |
9,999 | 3,733 | 5,239 | 3,360 | 4,814 | |||||||||||||||
| Other adjustments(5) |
15,647 | 508 | 199 | 2,295 | 96 | |||||||||||||||
|
|
|
|
|
|
|
|
|
|
|
|||||||||||
| Adjusted EBITDA |
$ | 456,808 | $ | 437,101 | $ | 420,377 | $ | 240,063 | $ | 208,931 | ||||||||||
| Depreciation and amortization |
(130,791 | ) | (115,929 | ) | (106,922 | ) | (69,226 | ) | (61,661 | ) | ||||||||||
| Interest expense, net |
(158,870 | ) | (157,024 | ) | (127,751 | ) | (78,146 | ) | (79,821 | ) | ||||||||||
| Loss on extinguishment of debt |
— | (3,810 | ) | — | — | — | ||||||||||||||
| Other expenses |
— | (1,364 | ) | (642 | ) | — | — | |||||||||||||
| Income taxes, adjusted(6) |
(63,704 | ) | (59,598 | ) | (69,964 | ) | (36,538 | ) | (26,734 | ) | ||||||||||
|
|
|
|
|
|
|
|
|
|
|
|||||||||||
| Adjusted Net Income |
$ | 103,443 | $ | 99,376 | $ | 115,098 | $ | 56,153 | $ | 40,715 | ||||||||||
|
|
|
|
|
|
|
|
|
|
|
|||||||||||
| (1) | Depreciation and amortization includes asset impairments and write-offs. |
18
Table of Contents
| (2) | The add-back of store pre-opening and closing costs are limited to $10.0 million in any four-quarter period, which is consistent with the requirements of reporting adjusted EBITDA under the indenture governing our senior notes. Uncapped pre-opening and closing costs for the fiscal year ended January 31, 2015 were $10.1 million. |
| (3) | Represent annual fees plus out of pocket expenses paid in accordance with a management services agreement with the Sponsors and certain other significant stockholders for management, consulting and other services. The management services agreement terminates in connection with this offering. See “Certain Relationships and Related Party Transactions—Management Services Agreement.” |
| (4) | Term loan amendment fees represent the portion of fees incurred to amend the term loan facility that were recorded as other expenses in the consolidated statements of income and comprehensive income. |
| (5) | Other adjustments include legal settlements, goodwill impairment, income / loss from equity method investees, acquisition & other non-recurring costs. |
| (6) | Represents income tax expense at the effective tax rate derived from our consolidated financial statements for the periods presented as applied to Adjusted EBITDA as defined above but including the impact of depreciation and amortization, interest expense, net, loss on extinguishment of debt and certain other expenses. |
19
Table of Contents
This offering and investing in our common stock involves a high degree of risk. You should carefully consider the risks and uncertainties described below together with all of the other information contained in this prospectus, including the section titled “Cautionary Note Regarding Forward-Looking Statements” and our consolidated financial statements and the related notes appearing at the end of this prospectus, before deciding to invest in our common stock. If any of the following risks actually occurs, our business, prospects, operating results and financial condition could suffer materially, the trading price of our common stock could decline and you could lose all or part of your investment. The risks and uncertainties described below are not the only ones we face. Additional risks and uncertainties not presently known to us or deemed to be material by us may impair our operations and performance.
Risks Related to Our Business
A decline in consumer spending or a change in consumer preferences or demographics could reduce our sales or profitability and adversely affect our business.
Our sales depend on consumer spending, which is influenced by factors beyond our control, including general economic conditions, the availability of discretionary income and credit, weather, consumer confidence and unemployment levels. We may experience declines in sales or changes in the types of products and services sold during economic downturns. Our business would be harmed by any material decline in the amount of consumer spending, which could reduce our sales, or a decrease in the sales of higher-margin products, such as certain of our supplies offerings, which could reduce our profitability and adversely affect our business.
We have also benefited from increasing discretionary spending on pets and from current trends in humanization and premiumization in the pet industry as well as favorable pet ownership demographics. To the extent these trends slow or reverse, our sales and profitability would be adversely affected. The success of our business depends in part on our ability to identify and respond to evolving trends in demographics and consumer preferences. Failure to timely identify or effectively respond to changing consumer tastes, preferences, spending patterns and pet care needs could adversely affect our relationship with our customers, the demand for our products and services, our market share and our profitability.
Our continued success is substantially dependent on positive perceptions of Petco, including our owned or exclusive brands.
We believe that one of the reasons our customers prefer to shop at Petco and our associates choose Petco as a place of employment is the reputation we have built over many years of serving our primary constituencies: customers, associates and the communities in which we operate. To be successful in the future, we must continue to preserve, grow and leverage the value of our reputation. Reputational value is based in large part on perceptions of subjective qualities, and even isolated incidents that erode trust and confidence, particularly if they result in adverse publicity or widespread reaction on social media, governmental investigations or litigation, can have an adverse impact on these perceptions and lead to adverse effects on our business, including decreased comparable sales, consumer boycotts, loss of new store development opportunities, lower associate morale and productivity, or associate recruiting difficulties.
In addition, we sell many products under our owned or private label brands. Maintaining consistent product quality, competitive pricing and availability of our branded products for our customers is essential to developing and maintaining customer loyalty and brand awareness. These products also generally have higher margins than national brand products. If one or more of these brands experiences a loss of consumer acceptance or confidence, our sales and gross margin could be adversely affected.
20
Table of Contents
Competition in the markets in which we operate, including internet-based competition, is strong and if we are unable to compete effectively, our ability to generate sales may suffer and our operating income and net income could decline.
The pet food, supplies and services industry is highly competitive. We compete with a number of specialty pet store chains and independent pet stores. We also compete with supermarkets, warehouse clubs and mass merchants as well as online retailers. The pet food, supplies and services industry has become increasingly competitive due to the expansion of pet-related product offerings by certain supermarkets, warehouse clubs and other retail merchandisers, and the entrance of additional independent pet stores with unique product offerings and other pet specialty retailers into the pet food and pet supply market, some of which have developed store formats similar to ours. Some of these competitors are larger and have access to greater capital and management resources than we do.
We may face greater competition from national, regional and local retailers in the future. In particular, if any of our major competitors seeks to gain or retain market share by reducing prices or by introducing additional products or services, we may be required to reduce prices on our key products or services or introduce new offerings in order to remain competitive, which may negatively impact our profitability and require a change in our operating strategies.
If consumer preferences change and thereby decrease the attractiveness of what we believe to be our competitive advantages, including our extensive product assortment, premium product offerings, competitive pricing, high-quality service offerings and a unique customer experience, or if we fail to otherwise positively differentiate our customer experience from that of our competitors, our business and results of operations could be adversely affected.
We may be unable to execute our expansion strategy successfully or manage and sustain our growth and, as a result, our business may be adversely affected.
One of our strategies is to open new locations by focusing on both existing markets and by targeting new ones. However, we may not be able to open locations at existing or anticipated rates. Our ability to open new locations depends on a number of factors, including:
| • | whether we have adequate capital resources for leasehold improvements, fixtures, inventory and pre-opening expenses; |
| • | our ability to identify new store sites that offer attractive potential returns on our investment without unduly disrupting sales in existing locations; |
| • | our ability to locate and obtain favorable sites and negotiate acceptable lease terms; |
| • | our ability to identify and negotiate acceptable arrangements with potential partners in those geographic areas where we believe that collaboration would enhance the likelihood of our success; |
| • | our ability to obtain and distribute adequate product supplies to our locations, including by expanding our distribution facilities; |
| • | our ability to hire, train and retain skilled managers and personnel; and |
| • | our ability to continue to upgrade our information and other operating systems to control the anticipated growth and expanded operations. |
Our continued growth also depends, to a significant degree, on our ability to increase sales in our new and existing locations. As a result of new location openings in existing markets and because mature locations will represent an increasing proportion of our store base over time, our comparable sales increases in future periods may be lower than historical levels or our comparable sales may not increase at all.
21
Table of Contents
Our existing locations may not maintain their current levels of sales and profitability, and new locations may not generate sales levels necessary to achieve store-level profitability comparable to that of our existing locations. To the extent we are unable to open new stores in accordance with our expectations, our sales growth would come primarily from comparable sales, in which case growth in profitability would depend significantly on our ability to increase margins or reduce costs as a percentage of sales.
New locations that we open in our existing markets may draw customers from our existing locations and may have lower sales growth relative to locations opened in new markets. New locations also may face greater competition and have lower anticipated sales volumes relative to previously opened locations during their comparable years of operations. An increase in our ecommerce sales may have similar effects. These factors, together with increased pre-opening expenses at our new locations, may reduce our average store contribution and operating margins.
In addition, we are opening new locations in, and are remodeling some of our existing locations into, our newer store format, which incorporates our most recent merchandising strategies. Our expansion plans and continued growth depend on our ability to successfully open and operate new locations across our store formats. Moreover, because the size, format, location and target market for new Unleashed stores differ from our traditional Petco format, the challenges, costs, results of operations and timeline for profitability for new Unleashed stores may differ materially from those typically observed when opening new Petco locations. If we are unable to effectively predict and respond to these differences, the success of expansion through our Unleashed store format may suffer. There can be no assurance that our newer formats will be as or more profitable than our existing locations, and they may be less profitable than historical levels for our other locations. If we are unable to profitably open and operate new locations and maintain the profitability of our existing locations, our business, financial condition and results of operations may be adversely affected.
Moreover, if we fail to expand our distribution facilities or internal systems or procedures in support of our growth plans, or incur difficulties operating our distribution facilities, our ability to deliver merchandise to our locations in a timely fashion could be adversely affected. As a result, our ability to support our planned new store growth may be adversely affected.
We routinely evaluate our strategic alternatives with respect to each of our locations and our other operating assets and investments. In connection with this evaluation, we may elect to close stores or to sell or otherwise dispose of selected assets or investments. Excluding relocations, we closed one location in fiscal 2013, 16 locations during fiscal 2014 and seven locations through the first half of fiscal 2015. There can be no assurance that any future sale or disposition would be achieved on terms favorable to us because we incur closing costs or may lose sales to our competitors as a result.
If we fail to generate or obtain sufficient capital to finance our continued expansion, we may be unable to sustain our growth and our business may be adversely affected.
The rate of our expansion will depend on the availability of adequate capital, which in turn will depend in large part on cash flow generated by our business and the availability of equity and debt capital. There can be no assurance that we will be able to maintain sufficient cash flow or obtain sufficient equity or debt capital on acceptable terms, or at all, to support our expansion plans.
Moreover, the credit agreements governing our senior secured credit facilities and the indentures governing our outstanding notes contain provisions that restrict the amount of debt we may incur in the future, and certain other covenants that may restrict or impair our growth plans. If we are not successful in generating or obtaining sufficient capital, we may be unable to open additional locations as planned, which may adversely affect our results of operations.
22
Table of Contents
We depend on key personnel, and if we lose the services of any of our principal executive officers, we may not be able to run our business effectively.
We are dependent upon the efforts of our principal executive officers. The loss of any of our principal executive officers could affect our ability to run our business effectively. Our success will depend on our ability to retain our current management and to attract and retain qualified personnel in the future. Competition for senior management personnel is intense and there can be no assurance that we can retain our personnel. The loss of a member of senior management requires the remaining executive officers to divert immediate and substantial attention to seeking a replacement. The inability to fill vacancies in our senior executive positions on a timely basis could adversely affect our ability to implement our business strategy, which would negatively impact our results of operations.
The loss of any of our key merchandise vendors, or of any of our exclusive distribution arrangements with certain of our vendors, would negatively impact our business.
We purchase significant amounts of products from a number of vendors with limited supply capabilities. There can be no assurance that our current pet food or supply vendors will be able to accommodate our anticipated growth and expansion of our locations and ecommerce. An inability of our existing vendors to provide products in a timely or cost-effective manner could impair our business, financial condition and results of operations. We do not maintain long-term supply contracts with any of our merchandise vendors. Any vendor could discontinue selling to us at any time. The loss of any of our significant vendors of pet food, particularly premium pet food, or pet supplies offered by us would have a negative impact on our business, financial condition and results of operations. In addition, in our experience, it is challenging to persuade pet food buyers to switch to a different product, which could make it difficult to retain a customer if we lose a pet food vendor and exacerbate the negative impact of such loss.
We continually seek to expand our base of pet food and supply vendors and to identify new pet products. If we are unable to identify or enter into distribution relationships with new vendors or to replace the loss of any of our existing vendors, we may experience a competitive disadvantage, our business may be disrupted and our results of operations may be adversely affected.
Most of the premium pet food brands that we purchase are not widely carried in supermarkets, warehouse clubs or mass merchants. If any premium pet food manufacturers were to make premium pet food products widely available in supermarkets or through mass merchants, or if the premium brands currently available to supermarkets and mass merchants were to increase their market share at the expense of the premium brands sold only through specialty pet food and supplies retailers, our ability to attract and retain customers or our competitive position may suffer. Furthermore, if supermarkets, warehouse clubs or mass merchants begin offering any of these premium pet food brands at lower prices, our sales and gross margin could be adversely affected.
Several of the pet food brands we currently purchase and offer for sale to our customers are not offered by our closest pet specialty competitor. However, in most cases, we have not entered into formal exclusivity agreements with the vendors for such brands. In the event these vendors choose to enter into distribution arrangements with other specialty pet retailers or other competitors our sales could suffer and our business could be adversely affected.
Our principal vendors currently provide us with certain incentives such as volume purchasing, trade discounts, cooperative advertising and market development funds. A reduction or discontinuance of these incentives would increase our costs and could reduce our profitability.
23
Table of Contents
A disruption, malfunction or increased costs in the operation, expansion or replenishment of our distribution centers or our supply chain would affect our ability to deliver to our locations and ecommerce customers or increase our expenses, which could harm our sales and profitability.
Our vendors generally ship merchandise to one or more of our five distribution centers, which receive and allocate merchandise to our locations and ecommerce customers. The success of our stores depends on their timely receipt of merchandise. If any shipped merchandise was delayed because of the impact of weather on transnational shipping, particularly from our vendors in Asia, our operations would likely be significantly disrupted. Disruption to shipping and transportation channels due to slowdowns or work-stoppages at ports on the West Coast of the United States have occurred in the past, and to the extent they occur in the future, could cause us to rely more heavily on airfreight to achieve timely delivery to our customers, resulting in significantly higher freight costs. We may not be able to pass all or any portion of these higher costs on to our customers or adjust our pricing structure in a timely manner in order to remain competitive, either of which could have a material adverse effect on our results of operations. If any of our distribution centers were to shut down or lose significant capacity for any reason, our operations would likely be significantly disrupted. In addition, any interruption or malfunction in our distribution operations, including, but not limited to, the loss of a key vendor that provides transportation of merchandise to or from our distribution centers, or regulatory issues with respect to any of our distribution centers, could adversely affect our sales and results of operations. An interruption in our inventory supply chain could result in out-of-stock or excess merchandise inventory levels or adversely effect our ability to make timely deliveries to ecommerce customers, and could adversely affect our sales and results of operations.
A determination that we are in violation of any contractual obligations or government regulations could result in a disruption to our operations and could adversely affect our financial results.
We are subject to various contractual obligations with third-party providers and federal, state and local laws and regulations governing, among other things, our relationships with employees, including minimum wage requirements, overtime, terms and conditions of employment, working conditions and citizenship requirements; veterinary practices, or the operation of veterinary clinics in retail stores; the transportation, handling and sale of small pets; the generation, handling, storage, transportation and disposal of waste and hazardous materials; the distribution, import/export and sale of products; providing services to our customers; contracted services with various third-party providers; credit and debit card processing; the handling, security, protection and use of customer and associate information; and the licensing and certification of services.
Given varying and uncertain interpretations of these laws and regulations and the fact that the laws and regulations are enforced by the courts and by regulatory authorities with broad discretion, we can make no assurances that we would be found to be in compliance in all jurisdictions. We also could be subject to costs, including fines, penalties or sanctions and third-party claims as a result of violations of, or liabilities under, the above-referenced contracts, laws and regulations. Although we routinely obtain broad indemnities from our suppliers in respect of their products, we could be adversely affected if we were found not to be in compliance with applicable regulations and we were not made whole by our suppliers. Any allegation or determination of non-compliance could also be damaging to our reputation and our brand.
We occasionally seek to grow our business through acquisitions of or investments in new or complementary businesses, products or services, or through strategic ventures, and the failure to successfully identify these opportunities, manage and integrate these acquisitions, investments or alliances, or to achieve an adequate return on these investments, could have a material adverse effect on us.
The pet food, supplies and services industry is highly fragmented. We have completed acquisitions in the past and may pursue expansion and acquisition opportunities in the future. For
24
Table of Contents
example, in 2015 we acquired Drs. Foster and Smith. If we are unable to manage acquisitions, investments or strategic ventures, or integrate any acquired businesses, services or technologies effectively, we may not realize the expected benefits from the transaction relative to the consideration paid, and our business, results of operations and financial condition may be materially and adversely affected. To be successful, the integration process requires us to achieve the benefits of combining the companies, including generating operating efficiencies and synergies and eliminating or reducing redundant costs. This integration process involves inherent uncertainties, and there can be no assurance that the anticipated benefits of these acquisitions will be fully realized without incurring unanticipated costs or diverting management’s attention from our core operations.
From time to time we also make strategic investments, such as through our joint venture with Grupo Gigante in Mexico. These investments typically involve many of the same risks posed by acquisitions, particularly those risks associated with the diversion of our resources, the inability of the new venture to generate sufficient revenues, the management of relationships with third parties and potential expenses. Strategic ventures have the added risk that the other strategic venture partners may have economic, business or legal interests or objectives that are inconsistent with our interests and objectives.
Further, we may be unsuccessful in identifying and evaluating business, legal or financial risks as part of the due diligence process associated with a particular transaction. In addition, some investments may result in the incurrence of debt or may have contingent consideration components, such as certain earnouts payable by us in connection with our acquisition of Drs. Foster and Smith in 2015, that may require us to pay additional amounts in the future in relation to future performance results of the subject business. If we do enter into agreements with respect to these transactions, we may fail to complete them due to factors such as failure to obtain regulatory or other approvals. We may be unable to realize the full benefits from these transactions, such as increased net sales or enhanced efficiencies, within the timeframes that we expect or at all. These events could divert attention from our other businesses and adversely affect our business, financial condition and operating results. Any future acquisitions also could result in potentially dilutive issuances of equity securities, the incurrence of additional debt or the assumption of contingent liabilities.
We face various risks as an ecommerce retailer.
Although ecommerce represents a growing segment of the pet industry, ecommerce operations are still in the early stages of development. As part of our growth strategy, we seek to further integrate our in-store and online operations and have made significant investments to integrate and grow our ecommerce business. We may require additional capital in the future to sustain or grow our ecommerce business. Business risks related to our ecommerce business include our ability to keep pace with rapid technological change, failure in our security procedures and operational controls, failure or inadequacy in our systems or ability to process customer orders, government regulation and legal uncertainties with respect to ecommerce, and collection of sales or other taxes by one or more states or foreign jurisdictions. If any of these risks materialize, it could have an adverse effect on our business.
In some circumstances increased transactions through the our website may result in reduced customer traffic in our stores, particularly as customers take advantage of home delivery services available for online orders when making certain types of purchases, such as for bulk orders or heavy pet products. There is a risk that any such reduced customer traffic may reduce the sales of certain products and services in our stores. The availability of free shipping of online and “extended aisle” orders increases our costs and could adversely affect our profitability.
In addition, as other internet retailers have increased market share in recent years we have faced increased competition, and may continue to face increased competition in the future, from internet retailers who enter the market. Our failure to positively differentiate our product and services offerings from these internet retailers could have a material adverse effect on our business, results of operations or financial condition.
25
Table of Contents
Our marketing programs, ecommerce initiatives and use of consumer information are governed by an evolving set of laws and enforcement trends and unfavorable changes in those laws or trends, or our failure to comply with existing or future laws, could substantially harm our business and results of operations.
We collect, maintain and use data provided to us through our online activities and other customer interactions in our business. Our current and future marketing programs depend on our ability to collect, maintain and use this information, and our ability to do so is subject to certain contractual restrictions in third-party contracts as well as evolving federal, state and international laws and enforcement trends. It is possible that these requirements may be interpreted and applied in a manner that is inconsistent from one jurisdiction to another, may conflict with other rules or may conflict with our practices. If so, we may suffer damage to our reputation and be subject to proceedings or actions against us by governmental entities or others. Any such proceeding or action could hurt our reputation, force us to spend significant amounts to defend our practices, distract our management, increase our costs of doing business and result in monetary liability.
Our reputation and business may be harmed if our or our vendors’ computer network security or any of the databases containing customer or other personal information maintained by us or our third-party providers is compromised, which could materially adversely effect our results of operations.
We collect, store and transmit proprietary or confidential information regarding our customers, employees, job applicants and others, including credit card information and personally identifiable information. The protection of customer, employee and company data in the information technology systems we use (including those maintained by third-party providers) is critical. Security could be compromised, confidential information, such as customer credit card numbers or other personally identifiable customer information that we or our vendors collect, could be misappropriated or system disruptions could occur. In addition, we may not have the resources or technical sophistication to anticipate or prevent rapidly evolving types of cyber-attacks. Attacks may be targeted at us, our customers or others who have entrusted us with information. Actual or anticipated attacks may cause us to incur increasing costs, including costs to deploy additional personnel and protection technologies, train employees and engage third-party experts and consultants. Advances in computer capabilities, new technological discoveries or other developments may result in the breach or compromise of the technology used by us to protect transactions or other sensitive data. In addition, data and security breaches could also occur as a result of non-technical issues, including intentional or inadvertent breach by our employees or by persons with whom we have commercial relationships, that result in the unauthorized release of personal or confidential information. Any compromise or breach of our or our vendors’ computer network security could result in a violation of applicable privacy and other laws, costly investigations and litigation, as well as potential regulatory or other actions by governmental agencies and harm to our brand, business and results of operation. As a result of any of the foregoing, we could experience adverse publicity, loss of sales, the cost of remedial measures and significant expenditures to reimburse third parties for damages, which could adversely impact our results of operations.
Failure by us or our vendors to comply with data security requirements or rectify a security issue may result in fines and the imposition of restrictions on our ability to accept payment cards, which could adversely affect our operations. There can be no assurance that we will be able to satisfy The Payment Card Industry (“PCI”) data security standards. In addition, PCI is controlled by a limited number of vendors that have the ability to impose changes in PCI’s fee structure and operational requirements without negotiation. Such changes in fees and operational requirements may result in our failure to comply with PCI security standards, as well as significant unanticipated expenses.
26
Table of Contents
If our information systems or infrastructure fail to perform as designed or are interrupted for a significant period of time, our business could be adversely affected.
The efficient operation of our business is dependent on our information systems. In particular, we rely on our information systems to effectively manage our financial and operational data, to maintain our in-stock positions and to transact the sale of our products in our stores. The failure of our information systems to perform as designed, loss of data or any interruption of our information systems for a significant period of time could disrupt our business.
Our operations also depend on our ability to maintain and protect the computer systems we use to manage our purchase orders, store inventory levels, web applications, accounting functions and other critical aspects of our business. Our systems are vulnerable to damage from fire, floods, earthquakes, power loss, telecommunications failures, terrorist and cyber attacks and similar events. Our disaster recovery planning may not be sufficient to adequately respond to any such events. In addition, we may have inadequate insurance coverage to compensate for any related losses and expenses. Any of these events could damage our reputation, disrupt our business and be expensive to remedy.
We continue to invest in our information systems and IT infrastructure. Enhancement to or replacement of our major financial or operational information systems could have a significant impact on our ability to conduct our core business operations and increase our risk of loss resulting from disruptions of normal operating processes and procedures that may occur during the implementation of new information systems. We can make no assurances that the costs of investments in our information systems will not exceed estimates, that the systems will be implemented without material disruption, or that the systems will be as beneficial as predicted. If any of these events occur, our results of operations could be adversely affected.
If we are required to restructure our operations to comply with regulations governing our industry, it could have a material adverse effect on our business and results of operations.
The transportation and sale of small animals is governed by various state and local regulations. These laws vary from state to state and are enforced by the courts and by regulatory authorities with broad discretion. There can be no assurance that, given varying and uncertain interpretations of these laws, we would be found to be in compliance in all states. A determination that we are in violation of applicable laws in any state in which we operate could require us to restructure our operations to comply with the requirements of that state, which could have a material adverse effect on our business and results of operations.
Negative publicity arising from claims that we do not properly care for animals we handle or sell could adversely affect how we are perceived by the public and reduce our sales and profitability.
From time to time we are subject to claims or complaints that we do not properly care for some of the pets we handle or for companion animals we handle and sell, which may include dogs, cats, birds, fish, reptiles and other small animals. Deaths or injuries sometimes occur while small animals are in our care. As a result, we may be subject to claims that our animal care practices, including the grooming, training and other services we offer, or the related training of our associates, may not provide the proper level of care. Any such claims or complaints, as well as any related news reports or reports on social media, could cause negative publicity, which in turn could harm our business and have a material adverse effect on our results of operations.
27
Table of Contents
Our international operations may result in additional market risks, which may adversely affect our business.
We recently expanded into Mexico through a joint venture with Grupo Gigante and operate 13 Petco stores in Mexico as of August 1, 2015, and plan to open additional stores in the future. As our international operations grow, they may require greater management and financial resources. International operations require the integration of personnel with varying cultural and business backgrounds and an understanding of the relevant differences in the cultural, legal, and regulatory environments. Our results may be increasingly affected by the risks of our international activities, including:
| • | challenges anticipating or responding to the impact that local culture and market forces may have on local consumer preferences and trends; |
| • | fluctuations in currency exchanges rates; |
| • | changes in international staffing and employment issues; |
| • | the imposition of taxes, duties, tariffs or other trade barriers; |
| • | shipping delays, such as the recent slowdown or work stoppage at ports on the West Coast, or customs delays; |
| • | greater difficulty in utilizing and enforcing our intellectual property rights; |
| • | the burden of complying with foreign laws, including regulatory regimes, tax laws and financial accounting standards; |
| • | political and economic instability and developments; and |
| • | issues or disputes arising with our joint venture partners, if any, in such operations. |
Our quarterly operating results may fluctuate due to the timing of expenses, new store openings and store closures.
Our expansion plans, including the timing of new store openings and related preopening costs, the amount of net sales contributed by new and existing stores and the timing of and estimated costs associated with store closings, may cause our quarterly results of operations to fluctuate. Furthermore, because new stores tend to experience higher payroll, advertising and other store-level expenses as a percentage of net sales than more mature stores, and new store openings also often contribute to lower store operating margins until those stores become established, which may result in quarterly fluctuations in operating results. Quarterly operating results are not necessarily accurate predictors of performance.
Quarterly operating results may also vary depending on a number of factors, many of which are outside our control, including:
| • | changes in our pricing policies or those of our competitors; |
| • | our sales and channels mix and the relevant gross margins of the products and services sold; |
| • | the hiring and retention of key personnel; |
| • | wage and cost pressures; |
| • | changes in fuel prices or electrical rates; |
| • | costs related to acquisitions of businesses; and |
| • | general economic factors. |
28
Table of Contents
Food safety, quality and health concerns could adversely affect our business.
We could be adversely affected if consumers lose confidence in the safety and quality of our own private label or vendor-supplied food products and supplies. Adverse publicity about these types of concerns, whether valid or not, may discourage consumers from buying the products in our locations or cause vendor production and delivery disruptions. The actual or perceived sale of contaminated food products by us could result in product liability claims against our vendors or us and a loss of consumer confidence, which could have an adverse effect on our sales and operations. Given the difficulty in converting food customers, if we lose customers due to a loss of confidence in safety or quality, it may be difficult to reacquire such customers.
Product recalls and product liability, as well as changes in product safety and other consumer protection laws, may adversely impact our operations, merchandise offerings, reputation, results of operations, cash flow and financial condition.
We are subject to regulations by a variety of federal, state and international regulatory authorities. In fiscal 2014, we purchased merchandise from more than 800 vendors. One or more of our vendors might not adhere to product safety requirements or our quality control standards, and we might not identify the deficiency before merchandise ships to our stores. Any issues of product safety, including but not limited to those manufactured in foreign countries, could cause us to recall some of those products. If our vendors fail to manufacture or import merchandise that adheres to our quality control standards, our reputation and brands could be damaged, potentially leading to increases in customer litigation against us. Furthermore, to the extent we are unable to replace any recalled products, we may have to reduce our merchandise offerings, resulting in a decrease in sales. If our vendors are unable or unwilling to recall products failing to meet our quality standards, we may be required to recall those products at a substantial cost to us. Moreover, changes in product safety or other consumer protection laws could lead to increased costs to us for certain merchandise, or additional labor costs associated with readying merchandise for sale. Long lead times on merchandise ordering cycles increase the difficulty for us to plan and prepare for potential changes to applicable laws. In the event that we are unable to timely comply with regulatory changes or regulators do not believe we are complying with current regulations applicable to us, significant fines or penalties could result, and could adversely affect our reputation, results of operations, cash flow and financial condition.
Fluctuations in the prices and availability of certain commodities, such as rawhide, grains and meat protein, could materially adversely affect our operating results.
The pet food and supplies industry is subject to risks related to increases in the price of and the availability of certain commodities used in the production of certain pet food and other pet-related products, specifically seed, wheat and rice, as well as other materials such as rawhide, that are used in certain pet accessories. Additionally, increased human consumption or population increases may potentially limit the supply of or increase prices for certain of meat proteins used in animal feed. Historically, in circumstances where these price increases have resulted in increased purchase costs, we have been able to pass these increases on to customers. However, our ability to pass on increased purchase costs in the future will be significantly impacted by market conditions and competitive factors. If we are unable to pass on any increased purchase costs to customers, we may experience reduced margins, which could have a material adverse effect on our business, results of operations or financial condition.
Failure to protect our intellectual property could harm our competitive position or require us to incur significant expenses to enforce our rights.
Our trademarks, such as “Petco,” “Unleashed by Petco,” “Drs. Foster Smith,” “Vetco,” “Pals Rewards,” “Healthier Pets. Happier People. Better World.” and “What we feed them matters,” are valuable assets that support our brand and consumers’ perception of our products. We rely on trademark, copyright, trade secret, patent and other intellectual property laws, as well as nondisclosure
29
Table of Contents
and confidentiality agreements and other methods, to protect our trademarks, trade names, proprietary information, technologies and processes. Our non-disclosure agreements and confidentiality agreements may not effectively prevent disclosure of our proprietary information, technologies and processes and may not provide an adequate remedy in the event of unauthorized disclosure of such information, which could harm our competitive position. In addition, effective intellectual property protection may be unavailable or limited for some of our trademarks and patents in some foreign countries. We may need to engage in litigation or similar activities to enforce our intellectual property rights, to protect our trade secrets or to determine the validity and scope of proprietary rights of others. Any such litigation could require us to expend significant resources and divert the efforts and attention of our management and other personnel from our business operations. If we fail to protect our intellectual property, our business, financial condition and results of operations may be materially adversely affected.
We may be subject to intellectual property infringement claims or other allegations, which could result in substantial damages and diversion of management’s efforts and attention.
We have obligations with respect to the non-use and non-disclosure of third-party intellectual property. The steps we take to prevent misappropriation, infringement or other violation of the intellectual property of others may not be successful. From time to time, third parties have asserted intellectual property infringement claims against us and may continue to do so in the future. While we believe that our products and operations do not infringe in any material respect upon proprietary rights of other parties and/or that meritorious defenses would exist with respect to any assertions to the contrary, we may from time to time be found to infringe on the proprietary rights of others.
Any claims that our products, services or marketing materials infringe these rights, regardless of their merit or resolution, could be costly and may divert the efforts and attention of our management and technical personnel. We may not prevail in such proceedings given the complex technical issues and inherent uncertainties in intellectual property litigation. If such proceedings result in an adverse outcome, we could, among other things, be required to:
| • | pay substantial damages (potentially treble damages in the United States); |
| • | cease the manufacture, use or sale of the infringing products, operations or services; |
| • | discontinue the use of the infringing processes; |
| • | expend significant resources to develop non-infringing products, operations or services; and |
| • | enter into licensing arrangements from the third party claiming infringement, which may not be available on commercially reasonable terms, or may not be available at all. |
If any of the foregoing occurs, our ability to compete could be affected or our business, financial condition and results of operations may be materially adversely affected.
Our real estate leases generally obligate us for long periods, which subjects us to various financial risks.
We lease virtually all of our store and distribution center locations, generally for long terms. While we have the right to terminate some of our leases under specified conditions by making specified payments, we may not be able to terminate a particular lease if or when we would like to do so. If we decide to close stores, we are generally required to continue paying rent and operating expenses for the balance of the lease term, or to pay to exercise rights to terminate, and the performance of any of these obligations may be expensive. When we assign or sublease vacated locations, we may remain liable for the lease obligations if the assignee or sublessee does not perform. In addition, when leases
30
Table of Contents
for the stores in our ongoing operations expire, we may be unable to negotiate renewals, either on commercially acceptable terms, or at all, which could cause us to close stores. Accordingly, we are subject to the risks associated with leasing real estate, which could have a material adverse effect on our results.
Changes in payment card transaction, or “swipe” fees, could erode our profit margins.
Our selling, general and administrative expenses are affected by credit and debit card transaction, or “swipe,” fees charged by financial institutions to process such payments. Increases in such charges by credit card companies, or legislation or litigation that results in such increases, could increase our costs and adversely affect our profitability.
We are party to routine litigation arising in the ordinary course of our business and may become involved in additional litigation, all of which could require time and attention from certain members of management and result in significant legal expenses.
We are involved in litigation arising in the ordinary course of business. Even if we prevail, litigation can be time-consuming and expensive. An unfavorable outcome in one or more of these existing lawsuits, or future litigation to which we become a party, could have a material adverse effect on our business, financial condition, results of operations and cash flows. See Note 15, Contingencies, in our unaudited consolidated financial statements elsewhere in this prospectus.
Changes in laws, accounting standards and subjective assumptions, estimates and judgments by management related to complex accounting matters could significantly affect our financial results.
Accounting principles generally accepted in the United States of America and related accounting pronouncements, implementation guidelines and interpretations with regard to a wide range of matters relevant to our business are highly complex, continually evolving and involve many subjective assumptions, estimates and judgments by us. Changes in these rules or their interpretation, or changes in facts, underlying assumptions, estimates or judgments by us could significantly impact our reported or expected financial performance.
Failure to attract and retain quality sales associates and experienced management personnel could adversely affect our performance.
Our performance depends on recruiting, developing, training and retaining quality sales associates in large numbers and experienced management personnel. Our ability to meet our labor needs while controlling labor costs is subject to external factors such as unemployment levels, prevailing wage rates, minimum wage legislation, changing demographics, health and other insurance costs and governmental labor and employment requirements. In the event of increasing wage rates, if we fail to increase our wages competitively, the quality of our workforce could decline, causing our customer service to suffer, while increasing our wages could cause our earnings to decrease. If we do not continue to attract, train and retain quality associates and management personnel, our performance could be adversely affected.
Labor disputes may have an adverse effect on our operations.
We are not currently party to a collective bargaining agreement with any of our employees. If we were to experience a union organizing campaign, this activity could be disruptive to our operations. There can be no assurance that some or all of our employees will not become covered by a collective bargaining agreement or that we will not encounter labor conflicts or strikes. Any labor disruptions could have an adverse effect on our business or results of operations and could cause us to lose customers.
31
Table of Contents
Claims under our insurance plans and policies may differ from our estimates, which could adversely affect our results of operations.
We use a combination of insurance and self-insurance plans to provide for potential liabilities for workers’ compensation, general liability, business interruption, property and directors’ and officers’ liability insurance, vehicle liability and employee health-care benefits. Our insurance coverage may not be sufficient, and any insurance proceeds may not be timely paid to us. In addition, liabilities associated with the risks that are retained by us are estimated, in part, by considering historical claims experience, demographic factors, severity factors and other actuarial assumptions, and our business, financial condition and results of operations may be adversely affected if these assumptions are incorrect.
We are subject to environmental, health and safety laws and regulations that could result in costs to us.
In connection with the ownership and operations of our stores and distribution centers, we are subject to laws and regulations relating to the protection of the environment and health and safety matters, including those governing the management and disposal of wastes and the clean-up of contaminated sites. We could incur costs, including fines and other sanctions, cleanup costs and third-party claims, as a result of violations of or liabilities under environmental laws and regulations. Although we are not aware of any of our sites at which we currently have material remedial obligations, the imposition of remedial obligations as a result of the discovery of contaminants in the future could result in additional costs.
Risks Related to Our Indebtedness
Our substantial indebtedness could adversely affect our cash flow and prevent us from fulfilling our obligations under existing debt agreements.
As of August 1, 2015, we and our subsidiaries had approximately $2,325.9 million of indebtedness outstanding ($1,169.9 million amended term loan facility, $71.0 million revolving credit facility, $1,050.0 million in outstanding notes, a $20.3 million construction loan and $14.7 million in capital lease obligations) and an additional $280.6 million of unused commitments available to be borrowed under our amended revolving credit facility. This amount is net of $48.4 million of outstanding letters of credit. Our level of indebtedness could restrict our operations and could have important consequences. For example, it could:
| • | make it more difficult for us to satisfy our obligations with respect to our existing indebtedness; |
| • | increase our vulnerability to general adverse economic and industry conditions; |
| • | require us to dedicate a substantial portion of our cash flow from operations to payments on our indebtedness, thereby reducing the availability of our cash flow to fund working capital and capital expenditures, and for other general corporate purposes; |
| • | limit our flexibility in planning for, or reacting to, changes in our business and industry, which may place us at a competitive disadvantage compared to our competitors that have less debt; |
| • | restrict us from making strategic acquisitions or other investments or cause us to make non-strategic divestitures; and |
| • | limit, along with the financial and other restrictive covenants in the documents governing our indebtedness, among other things, our ability to obtain additional financing for working capital and capital expenditures, and for other general corporate purposes. |
32
Table of Contents
The credit agreements governing our senior secured credit facilities and the indentures governing our outstanding notes contain various covenants that limit our discretion in the operation of our business.
The credit agreements governing our senior secured credit facilities and the indentures governing our outstanding notes contain various provisions that limit our discretion in the operation of our business by restricting our ability to:
| • | undergo a change in control; |
| • | sell assets; |
| • | pay dividends and make other distributions; |
| • | make investments and other restricted payments; |
| • | redeem or repurchase our capital stock; |
| • | incur additional debt and issue preferred stock; |
| • | create liens; |
| • | consolidate, merge or sell all or substantially all of our assets; |
| • | enter into certain transactions with our affiliates; |
| • | engage in new lines of business; and |
| • | enter into sale and lease-back transactions. |
Any of these restrictions on our ability to operate our business in our discretion could adversely affect our business by, among other things, limiting our ability to adapt to changing industry conditions and to take advantage of financing, merger and acquisition and other corporate opportunities. Events beyond our control could affect our ability to meet this financial test, and we cannot assure you that we will meet it.
Despite current indebtedness levels, we may incur substantial additional indebtedness in the future. This could further increase the risks associated with our substantial leverage.
We may incur substantial additional indebtedness in the future. The terms of the credit agreements governing our senior secured credit facilities and the indentures governing our outstanding notes allow us and our subsidiaries to incur additional indebtedness, subject to limitations. As of August 1, 2015, we and our subsidiaries had an additional $280.6 million of unused commitments available to be borrowed under our amended revolving credit facility. This amount is net of $48.4 million of outstanding letters of credit. If new debt is added to our current debt levels, or any debt is incurred by our subsidiaries, the related risks that we and they now face could increase. In addition, the indentures governing our outstanding notes will not restrict our ability to enter into certain transactions that do not constitute indebtedness, such as operating leases. We lease substantially all of our locations and other facilities. See “Management’s Discussion and Analysis of Financial Condition and Results of Operations—Contractual Obligations.”
To service our indebtedness, we will require a significant amount of cash. Our ability to generate or access cash depends on many factors beyond our control.
Our ability to make payments on and refinance our indebtedness, including our outstanding notes, and to fund planned capital expenditures, will depend on our ability to generate or access cash in the future. This ability is subject to general economic, financial, competitive, legislative, regulatory and other factors that are beyond our control.
33
Table of Contents
In addition, we are a holding company and conduct our operations through our subsidiaries. Accordingly, repayment of our indebtedness is dependent on the generation of cash flow by our subsidiaries and their ability to make such cash available to us by dividend, debt repayment or otherwise. Our subsidiaries may not be able to, or may not be permitted to, make distributions to enable us to make payments in respect of our indebtedness. Each of our subsidiaries is a distinct legal entity and, under certain circumstances, legal and contractual restrictions may limit our ability to obtain cash from our subsidiaries. In particular, the terms of our Senior Notes, which are held by Petco Animal Supplies, Inc., a wholly owned subsidiary of Petco Holdings, Inc., restrict the amount of funds available for transfer to Petco Holdings, Inc.
Unless amended or redeemed, our senior secured credit facilities, our senior notes and our senior PIK toggle notes will mature on or prior to December 1, 2018. We cannot assure you that our business will generate sufficient cash flow from operations or that future borrowings will be available to us under the senior secured asset-based revolving credit facility in an amount sufficient to enable us to pay our indebtedness, including our outstanding notes, or to fund our other liquidity needs. Further, we cannot assure you that we will be able to refinance any of our indebtedness, including the senior secured credit facilities or our outstanding notes, on commercially reasonable terms, or at all.
Our failure to comply with the covenants contained in the credit agreements for our senior secured credit facilities or the indentures governing our outstanding notes, including as a result of events beyond our control, could result in an event of default that could cause repayment of our debt to be accelerated.
If we are not able to comply with the covenants and other requirements contained in the indentures governing our outstanding notes, the credit agreements governing our senior secured credit facilities or any other debt instruments, an event of default under the relevant debt instrument could occur. In addition to imposing restrictions on our business and operations, some of our debt instruments include covenants relating to financial ratios and tests. Our ability to comply with these covenants may be affected by events beyond our control, including prevailing economic, financial and industry conditions. The breach of any of these covenants would result in a default under these instruments. If an event of default does occur under one of these agreements, it could trigger a default under our other debt instruments, prohibit us from accessing additional borrowings and permit the holders of the defaulted debt to declare amounts outstanding with respect to that debt to be immediately due and payable. Our assets and cash flow may not be sufficient to fully repay borrowings under our outstanding debt instruments. In addition, we may not be able to refinance or restructure the payments on the applicable debt. Even if we were able to secure additional financing, it may not be available on favorable terms.
Our variable rate indebtedness subjects us to interest rate risk, which could cause our indebtedness service obligations to increase significantly.
Borrowings under our senior secured credit facilities are at variable rates of interest and expose us to interest rate risk. If interest rates increase, our debt service obligations on the variable rate indebtedness would increase even though the amount borrowed remains the same, and our net income and cash flows, including cash available for servicing our indebtedness, would correspondingly decrease. Although we may enter into agreements limiting our exposure to higher interest rates, these agreements may not be effective.
34
Table of Contents
A ratings downgrade or other negative action by a ratings organization could adversely affect the trading price of the shares of our common stock.
Credit rating agencies continually revise their ratings for companies they follow. The condition of the financial and credit markets and prevailing interest rates have fluctuated in the past and are likely to fluctuate in the future. In addition, developments in our business and operations could lead to a ratings downgrade for us or our subsidiaries. Any fluctuation in the rating of us or our subsidiaries may impact our ability to access debt markets in the future or increase our cost of future debt, which could have a material adverse effect on our operations and financial condition and may adversely affect the trading price of shares of our common stock.
Risks Related to Our Common Stock and this Offering
Our Sponsors and certain other significant stockholders will continue to have significant influence over us after this offering, including control over decisions that require the approval of stockholders, which could limit your ability to influence the outcome of matters submitted to stockholders for a vote.
We are currently controlled, and after this offering is completed will continue to be controlled, by the Sponsors and certain other significant stockholders. Upon completion of this offering, investment funds affiliated with the Sponsors and certain other significant stockholders will beneficially own % of our outstanding common stock (or % if the underwriters exercise in full their option to purchase additional shares from the selling stockholders). As long as the Sponsors and certain other significant stockholders own or control at least a majority of our outstanding voting power, they will have the ability to exercise substantial control over all corporate actions requiring stockholder approval, irrespective of how our other stockholders may vote, including the election and removal of directors and the size of our board, any amendment of our certificate of incorporation or bylaws, or the approval of any merger or other significant corporate transaction, including a sale of substantially all of our assets. Even if their ownership falls below 50%, the Sponsors and certain other significant stockholders will continue to be able to strongly influence or effectively control our decisions.
Additionally, the Sponsors’ and certain other significant stockholders’ interests may not align with the interests of our other stockholders. The Sponsors are in the business of making investments in companies and may acquire and hold interests in businesses that compete directly or indirectly with us. The Sponsors and certain other significant stockholders may also pursue acquisition opportunities that may be complementary to our business, and, as a result, those acquisition opportunities may not be available to us.
Certain of our directors have relationships with the Sponsors and certain other significant stockholders, which may cause conflicts of interest with respect to our business.
Following this offering, of our directors will be affiliated with the Sponsors and certain other significant stockholders. These directors have fiduciary duties to us and, in addition, have duties to the applicable Sponsor or stockholder affiliate. As a result, these directors may face real or apparent conflicts of interest with respect to matters affecting both us and the affiliated Sponsors or stockholders, whose interests may be adverse to ours in some circumstances.
Provisions of our corporate governance documents could make an acquisition of our company more difficult and may prevent attempts by our stockholders to replace or remove our current management, even if beneficial to our stockholders.
In addition to the Sponsors’ and certain other significant stockholders’ beneficial ownership of a controlling percentage of our common stock, our certificate of incorporation and bylaws and the Delaware General Corporation Law (the “DGCL”) contain provisions that could make it more difficult for
35
Table of Contents
a third party to acquire us, even if doing so might be beneficial to our stockholders. Our Board of Directors has the right to issue preferred stock without stockholder approval that could be used to dilute a potential hostile acquiror. In addition, these provisions may frustrate or prevent any attempts by our stockholders to replace or remove our current management by making it more difficult for stockholders to replace members of our Board of Directors. Because our Board of Directors is responsible for appointing the members of our management team, these provisions could in turn affect any attempt to replace current members of our management team. As a result, you may lose your ability to sell your stock for a price in excess of the prevailing market price due to these protective measures, and efforts by stockholders to change our direction or management of the Company may be unsuccessful. See “Description of Capital Stock.”
If you purchase shares of common stock in this offering, you will suffer immediate and substantial dilution of your investment.
The initial public offering price of our common stock is substantially higher than the net tangible book deficit per share of our common stock. Therefore, if you purchase shares of our common stock in this offering, you will pay a price per share that substantially exceeds our net tangible book deficit per share after this offering. Based on an assumed initial public offering price of $ per share, which is the midpoint of the price range on the cover of this prospectus, you will experience immediate dilution of $ per share, representing the difference between our pro forma net tangible book deficit per share after giving effect to this offering and the initial public offering price. In addition, purchasers of common stock in this offering will have paid % of the aggregate price paid by all purchasers of our common stock but will own only approximately % of our common stock outstanding after this offering. We also have a large number of outstanding stock options to purchase common stock with exercise prices that are below the estimated initial public offering price of our common stock. To the extent that these options are exercised, you will experience further dilution. See “Dilution” for more detail.
Your percentage ownership in us may be diluted by future issuances of capital stock, which could reduce your influence over matters on which stockholders vote.
Pursuant to our certificate of incorporation and by-laws, our Board of Directors has the authority, without action or vote of our stockholders, to issue all or any part of our authorized but unissued shares of common stock, including shares issuable upon the exercise of options, or shares of our authorized but unissued preferred stock. Issuances of common stock or voting preferred stock would reduce your influence over matters on which our stockholders vote and, in the case of issuances of preferred stock, would likely result in your interest in us being subject to the prior rights of holders of that preferred stock.
An active, liquid trading market for our common stock may not develop, which may limit your ability to sell your shares.
Prior to this offering, there was no public market for our common stock. Although we intend to apply to list our common stock on under the symbol “ ,” an active trading market for our shares may never develop or be sustained following this offering. The initial public offering price will be determined by negotiations between the selling stockholders and the underwriters and may not be indicative of market prices of our common stock that will prevail in the open market after the offering. A public trading market having the desirable characteristics of depth, liquidity and orderliness depends upon the existence of willing buyers and sellers at any given time, and its existence is dependent upon the individual decisions of buyers and sellers over which neither we nor any market maker has control. The failure of an active and liquid trading market to develop and continue would likely have a material adverse effect on the value of our common stock. The market price of our common stock may decline below the initial public offering price, and you may
36
Table of Contents
not be able to sell your shares of our common stock at or above the price you paid in this offering, or at all. An inactive market may also impair our ability to raise capital to continue to fund operations by selling shares and may impair our ability to acquire other companies or technologies by using our shares as consideration.
As a public company, we will become subject to additional laws, regulations and stock exchange listing standards, which will impose additional costs on us and divert our management’s attention.
We have operated our business as a private company since October 2006 following our acquisition by the Sponsors and certain co-investors. After this offering, we will be subject to the reporting requirements of the Securities Exchange Act of 1934, as amended (the “Exchange Act”), the Sarbanes-Oxley Act of 2002, as amended, the Dodd-Frank Wall Street Reform and Consumer Protection Act of 2010, the listing requirements of , and other applicable securities laws and regulations. Compliance with these laws and regulations will increase our legal and financial compliance costs and make some activities more difficult, time-consuming or costly. For example, the Exchange Act will require us, among other things, to file annual, quarterly and current reports with respect to our business and operating results. We also expect that being a public company and being subject to new rules and regulations will make it more expensive for us to obtain director and officer liability insurance, and we may be required to accept reduced coverage or incur substantially higher costs to obtain coverage. These additional requirements will impose significant additional costs on us and may divert management’s attention and affect our ability to attract and retain qualified board members.
Our operating results and share price may be volatile, and the market price of our common stock after this offering may drop below the price you pay.
Our quarterly operating results are likely to fluctuate in the future as a publicly traded company. In addition, securities markets worldwide have experienced, and are likely to continue to experience, significant price and volume fluctuations. This market volatility, as well as general economic, market or political conditions, could subject the market price of our shares to wide price fluctuations regardless of our operating performance. You may not be able to resell your shares at or above the initial public offering price or at all. Our operating results and the trading price of our shares may fluctuate in response to various factors, including:
| • | market conditions in the broader stock market; |
| • | actual or anticipated fluctuations in our quarterly financial and operating results; |
| • | introduction of new products or services by us or our competitors; |
| • | issuance of new or changed securities analysts’ reports or recommendations; |
| • | changes in debt ratings; |
| • | results of operations that vary from expectations of securities analysts and investors; |
| • | guidance, if any, that we provide to the public, any changes in this guidance or our failure to meet this guidance; |
| • | strategic actions by us or our competitors; |
| • | announcement by us, our competitors or our vendors of significant contracts or acquisitions; |
| • | sales, or anticipated sales, of large blocks of our stock; |
| • | additions or departures of key personnel; |
37
Table of Contents
| • | regulatory, legal or political developments; |
| • | public response to press releases or other public announcements by us or third parties, including our filings with the SEC; |
| • | litigation and governmental investigations; |
| • | changing economic conditions; |
| • | changes in accounting principles; |
| • | default under agreements governing our indebtedness; and |
| • | other events or factors, including those from natural disasters, pandemic pet disease, war, acts of terrorism or responses to these events. |
These and other factors, many of which are beyond our control, may cause our operating results and the market price and demand for our shares to fluctuate substantially. While we believe that operating results for any particular quarter are not necessarily a meaningful indication of future results, fluctuations in our quarterly operating results could limit or prevent investors from readily selling their shares and may otherwise negatively affect the market price and liquidity of our shares. In addition, in the past, when the market price of a stock has been volatile, holders of that stock have sometimes brought securities class action litigation against the company that issued the stock. If any of our stockholders brought a lawsuit against us, we could incur substantial costs defending the lawsuit. Such a lawsuit could also divert the time and attention of our management from our business, which could significantly harm our profitability and reputation.
A significant portion of our total outstanding shares are restricted from immediate resale but may be sold into the market in the near future. This could cause the market price of our common stock to drop significantly, even if our business is doing well.
Sales of a substantial number of shares of our common stock in the public market could occur at any time. These sales, or the perception in the market that the holders of a large number of shares intend to sell shares, could reduce the market price of our common stock. After this offering, we will have outstanding 806,977,944 shares of common stock based on the number of shares outstanding as of August 1, 2015. This includes the shares that the selling stockholders are selling, which may be resold in the public market immediately, and assumes no exercises of outstanding options. Substantially all of the shares that are not being sold in this offering will be subject to a 180-day lock-up period provided under agreements executed in connection with this offering. These shares will, however, be able to be resold after the expiration of the lock-up agreements described in the “Shares Eligible for Future Sale” and “Underwriting” sections of this prospectus. We also intend to file a Form S-8 under the Securities Act of 1933, as amended (“Securities Act”), to register all shares of common stock that we may issue under our equity compensation plans. In addition, the Sponsors and certain other significant stockholders have certain demand registration rights that could require us in the future to file registration statements in connection with sales of our stock by the selling stockholders and these other significant stockholders. See “Certain Relationships and Related Party Transactions—Stockholders’ Agreement.” Sales by the Sponsors and these other significant stockholders could be significant. Once we register these shares, they can be freely resold in the public market, subject to legal or contractual restrictions, such as the lock-up agreements described in the “Underwriting” section of this prospectus. As restrictions on resale end, the market price of our stock could decline if the holders of currently restricted shares sell them or are perceived by the market as intending to sell them.
38
Table of Contents
Since we have no current plans to pay regular cash dividends on our common stock following this offering, you may not receive any return on investment unless you sell your common stock for a price greater than that which you paid for it.
We do not anticipate paying any regular cash dividends on our common stock following this offering. Any decision to declare and pay dividends in the future will be made at the discretion of our Board of Directors and will depend on, among other things, our results of operations, financial condition, cash requirements, contractual restrictions and other factors that our board may deem relevant. In addition, our ability to pay dividends is, and may be, limited by covenants of existing and any future outstanding indebtedness we or our subsidiaries incur, including under our senior secured credit facilities and the indentures governing our outstanding notes. Therefore, any return on investment in our common stock is solely dependent upon the appreciation of the price of our common stock on the open market, which may not occur. See “Dividend Policy” for more detail.
We are a holding company with nominal net worth and will depend on dividends and distributions from our subsidiaries to pay any dividends.
Petco Holdings, Inc. is a holding company with nominal net worth. We do not have any material assets or conduct any business operations other than our investments in our subsidiaries. Our business operations are conducted primarily out of our indirect operating subsidiary, Petco Animal Supplies, Inc. and its subsidiaries. As a result, notwithstanding any restrictions on payment of dividends under our existing indebtedness, our ability to pay dividends, if any, will be dependent upon cash dividends and distributions or other transfers from our subsidiaries, including from Petco Animal Supplies Stores, Inc. Payments to us by our subsidiaries will be contingent upon their respective earnings and subject to any limitations on the ability of such entities to make payments or other distributions to us.
If securities or industry analysts do not publish research or reports about our business, if they adversely change their recommendations regarding our shares or if our results of operations do not meet their expectations, our share price and trading volume could decline.
The trading market for our shares likely will be influenced by the research and reports that industry or securities analysts publish about us or our business. We do not have any control over these analysts. If one or more of these analysts cease coverage of our company or fail to publish reports on us regularly, we could lose visibility in the financial markets, which in turn could cause our share price or trading volume to decline. Moreover, if one or more of the analysts who cover our Company downgrade our stock, or if our results of operations do not meet their expectations, our share price could decline.
39
Table of Contents
CAUTIONARY NOTE REGARDING FORWARD-LOOKING STATEMENTS
This prospectus contains forward-looking statements. Forward-looking statements are neither historical facts nor assurances of future performance. Instead, they are based on our current beliefs, expectations and assumptions regarding the future of our business, future plans and strategies, and other future conditions. Forward-looking statements can be identified by words such as “anticipate,” “believe,” “envision,” “estimate,” “expect,” “intend,” “may,” “plan,” “predict,” “project,” “target,” “potential,” “will,” “would,” “could,” “should,” “continue,” “contemplate” and other similar expressions, although not all forward-looking statements contain these identifying words. Examples of forward-looking statements include, among others, statements we make regarding:
| • | plans for future expansion and other business development activities; |
| • | expectations for market and industry growth and consumer preferences; |
| • | the continuation of advantageous trends in our industry; |
| • | product and services differentiation and customer engagement efforts; |
| • | omnichannel and ecommerce development initiatives; |
| • | the potential success of new store formats; |
| • | store openings and closings, as well as anticipated store economics; |
| • | plans for capital expenditures; |
| • | anticipated sources of future capital; |
| • | our plans with respect to the payments of dividends; |
| • | the effects of regulation and competition; |
| • | foreign currency conversion; and |
| • | all other statements regarding our intent, plans, beliefs or expectations or those of our directors or officers. |
We may not actually achieve the plans, intentions or expectations disclosed in our forward-looking statements, and you should not place significant reliance on our forward-looking statements. Actual results or events could differ materially from the plans, intentions and expectations disclosed in the forward-looking statements we make. Important factors that could cause actual results and events to differ materially from those indicated in the forward-looking statements include, among others, the following:
| • | general economic factors or failure to successfully predict and respond to changing consumer trends and demand could materially adversely affect our sales, results of operations and cash flow; |
| • | competition, including Internet-based competition, could negatively impact our business; |
| • | any damage to our reputation or our brand could materially adversely affect our business, financial condition and results of operations; |
| • | we may not be able to successfully execute our expansion strategy, including our international expansion, or manage and sustain our recent growth; |
| • | the loss of any of our key merchandise vendors, or of our exclusive distribution arrangements with certain of our vendors, would negatively impact our business; |
| • | product recalls and product liability exposure, as well as changes in product safety and other consumer protection laws, could increase our costs and otherwise restrict our operations; |
| • | our substantial indebtedness could adversely affect our financial condition and limit our ability to pursue our growth strategy; and |
40
Table of Contents
| • | breaches of, or interruptions in, our data security and information systems could disrupt or business and expose us to risk of loss; and |
| • | other factors described under “Risk Factors.” |
The forward-looking statements in this prospectus represent our views as of the date of this prospectus. We undertake no obligation to publicly update any forward-looking statements whether as a result of new information, future developments or otherwise.
41
Table of Contents
We will not receive any proceeds from the sale of shares by the selling stockholders. After deducting underwriting discounts and commissions, the selling stockholders will receive approximately $ million of proceeds from this offering.
42
Table of Contents
Following the completion of the offering, our Board of Directors does not currently intend to pay dividends on our common stock. However, we expect to reevaluate our dividend policy on a regular basis following the offering and may, subject to compliance with the covenants contained in our credit facilities and other considerations, determine to pay dividends in the future. The declaration, amount and payment of any future dividends on shares of our common stock will be at the sole discretion of our Board of Directors, which may take into account general and economic conditions, our financial condition and results of operations, our available cash and current and anticipated cash needs, capital requirements, contractual, legal, tax and regulatory restrictions, the implications of the payment of dividends by us to our stockholders or by our subsidiaries to us, and any other factors that our Board of Directors may deem relevant. See “Management’s Discussion and Analysis of Financial Condition and Results of Operations—Liquidity and Capital Resources” and “Description of Indebtedness,” included elsewhere in this prospectus, for descriptions of restrictions on our ability to pay dividends.
43
Table of Contents
The following table sets forth our cash and cash equivalents and capitalization at August 1, 2015 on an actual basis.
You should read this table in conjunction with the information contained in “Selected Historical Consolidated Financial Data” and “Management’s Discussion and Analysis of Financial Condition and Results of Operations,” as well as our consolidated financial statements and the related notes included elsewhere in this prospectus.
| (dollars in millions) | As of August 1, 2015 |
|||
| Cash and cash equivalents |
$ | 58 | ||
|
|
|
|||
| Long-term debt, including current portions: |
||||
| Senior secured credit facilities: |
||||
| Term loan facility |
1,170 | |||
| Revolving credit facility(1) |
71 | |||
| Senior notes |
500 | |||
| PIK toggle notes |
550 | |||
| Capital lease obligations |
15 | |||
| Construction loan |
20 | |||
|
|
|
|||
| Total debt(2) |
2,326 | |||
|
|
|
|||
| Stockholders’ deficit: |
||||
| Common stock, par value $0.001 per share; 895,000 shares authorized and 806,978 shares issued and outstanding |
1 | |||
| Returned capital and dividends in excess of earnings |
(450 | ) | ||
| Retained earnings |
162 | |||
| Accumulated other comprehensive income |
1 | |||
|
|
|
|||
| Total stockholders’ deficit |
(286 | ) | ||
|
|
|
|||
| Total capitalization |
$ | 2,040 | ||
|
|
|
|||
| (1) | As of August 1, 2015, there was $71.0 million of outstanding borrowings under the revolving credit facility and $280.6 million of available capacity, which is net of $48.4 million of outstanding letters of credit. |
| (2) | Excludes the impact of original issue discounts of $9.6 million. |
44
Table of Contents
If you invest in our common stock in this offering, your interest will be diluted to the extent of the difference between the initial public offering price per share of our common stock in this offering and the net tangible book deficit per share of our common stock. Dilution results from the fact that the initial public offering price per share of common stock is substantially in excess of the net tangible book deficit per share of our common stock attributable to the existing stockholders for our presently outstanding shares of common stock. Our net tangible book deficit per share represents the amount of our total tangible assets (total assets less intangible assets) less total liabilities, divided by the number of shares of common stock issued and outstanding.
As of August 1, 2015, we had a historical net tangible book deficit of $ million, or $ per share of common stock, based on shares of our common stock outstanding as of August 1, 2015. Dilution is calculated by subtracting net tangible book deficit per share of our common stock from the assumed initial public offering price per share of our common stock.
This offering will result in immediate dilution of $ per share of our common stock to investors purchasing shares of our common stock in this offering. The following table illustrates this dilution on a per share basis:
| Assumed initial public offering price per share |
$ | |||||||
| Net tangible book deficit per share as of August 1, 2015 |
$ | |||||||
|
|
|
|||||||
| Dilution per share to investors in this offering |
$ | |||||||
|
|
|
45
Table of Contents
The following table summarizes, as of August 1, 2015, the total number of shares of our common stock purchased, the total consideration paid or to be paid for these shares, and the average price per share of our common stock paid by existing stockholders and by new investors purchasing shares of our common stock from the selling stockholders in this offering.
| Shares purchased | Total consideration | Average price per share |
||||||||||||||||
| Number | Percent | Amount | Percent | |||||||||||||||
| Existing stockholders(1) |
% | $ | % | $ | ||||||||||||||
| New investors(2) |
$ | |||||||||||||||||
|
|
|
|
|
|
|
|
|
|
||||||||||
| Total |
100 | % | $ | 100 | % | $ | ||||||||||||
|
|
|
|
|
|
|
|
|
|
||||||||||
| (1) | Reflects shares purchased by existing stockholders, after deducting the shares offered hereby. |
| (2) | The selling stockholders identified in this prospectus are offering all of the shares of common stock in this offering. We are not offering any shares of common stock in this offering and we will not receive any of the proceeds from the sale of shares in this offering. |
The number of shares of common stock to be outstanding after this offering is based on shares of common stock outstanding as of , 2015 and excludes the following:
| • | shares of common stock reserved for future issuance under our equity incentive plans as of , 2015, of which shares of common stock were issuable upon exercise of outstanding stock options at a weighted average exercise price of $ per share; |
| • | shares of common stock underlying RSUs subject to future vesting requirements as of , 2015; and |
| • | that number of shares of common stock issuable upon exercise of a warrant to purchase shares of common stock, exercisable in connection with this offering, determined by dividing $ by the average closing price of a share of our common stock as reported on for the first 30 consecutive trading days commencing on the effective date of this offering. |
46
Table of Contents
SELECTED HISTORICAL CONSOLIDATED FINANCIAL DATA
The following table sets forth summary historical consolidated financial data for the periods presented and at the dates indicated below. We have derived the balance sheet, statement of income and comprehensive income, and cash flow data for fiscal years 2014, 2013, 2012, 2011 and 2010 from our audited consolidated financial statements. We have derived the balance sheet data as of August 1, 2015 and August 2, 2014 and the statement of income and comprehensive income and cash flow data for the 26-week period ended August 1, 2015 and August 2, 2014 from our unaudited interim condensed consolidated financial statements, included elsewhere in this prospectus.
Historical results are not necessarily indicative of the results to be expected for future periods and operating results for the 26 weeks ended August 1, 2015 are not necessarily indicative of the results that may be expected for the fiscal year ending January 30, 2016. The following information should be read in conjunction with the section entitled “Management’s Discussion and Analysis of Financial Condition and Results of Operations” and our consolidated financial statements and the notes thereto contained elsewhere in this prospectus.
Our fiscal year ends on the Saturday closest to January 31, resulting in fiscal years of either 52 or 53 weeks. All references to a fiscal year refer to the fiscal year ending on the Saturday closest to January 31 of the following year. For example, references to fiscal 2014 refer to the fiscal year beginning February 2, 2014 and ending January 31, 2015, references to fiscal 2013 refer to the fiscal year beginning February 2, 2013 and ending February 1, 2014, references to fiscal 2012 refer to the fiscal year beginning January 29, 2012 and ending February 2, 2013, references to fiscal 2011 refer to the fiscal year beginning January 30, 2011 and ending January 28, 2012 and references to fiscal 2010 refer to the fiscal year beginning January 31, 2011 and ending January 29, 2011. Fiscal 2014, fiscal 2013 fiscal 2011 and fiscal 2010 each include 52 weeks, and fiscal 2012 includes 53 weeks.
| Fiscal Year Ended | 26 Weeks Ended | |||||||||||||||||||||||||||
| (Dollars in thousands) | January 31, 2015 (Fiscal 2014) |
February 1, 2014 (Fiscal 2013) |
February 2, 2013 (Fiscal 2012) |
January 28, 2012 (Fiscal 2011) |
January 29, 2011 (Fiscal 2010) |
August 1, 2015 |
August 2, 2014 |
|||||||||||||||||||||
| (53 weeks) | (unaudited) | (unaudited) | ||||||||||||||||||||||||||
| Statement of operations data: |
||||||||||||||||||||||||||||
| Net sales |
$ | 3,995,368 | $ | 3,785,153 | $ | 3,528,030 | $ | 3,101,862 | $ | 2,869,113 | $ | 2,168,705 | $ | 1,941,408 | ||||||||||||||
| Cost of sales and occupancy costs |
2,778,427 | 2,601,855 | 2,403,065 | 2,122,188 | 1,984,116 | 1,514,751 | 1,351,611 | |||||||||||||||||||||
|
|
|
|
|
|
|
|
|
|
|
|
|
|
|
|||||||||||||||
| Gross profit |
1,216,941 | 1,183,298 | 1,124,965 | 979,674 | 884,997 | 653,954 | 589,797 | |||||||||||||||||||||
| Selling, general and administrative expenses |
928,684 | 884,991 | 837,681 | 753,635 | 708,045 | 498,539 | 455,558 | |||||||||||||||||||||
| Goodwill impairment charges |
7,753 | — | — | — | — | — | — | |||||||||||||||||||||
|
|
|
|
|
|
|
|
|
|
|
|
|
|
|
|||||||||||||||
| Operating income |
280,504 | 298,307 | 287,284 | 226,039 | 176,952 | 155,415 | 134,239 | |||||||||||||||||||||
|
|
|
|
|
|
|
|
|
|
|
|
|
|
|
|||||||||||||||
| Interest income |
(422 | ) | (119 | ) | (372 | ) | (164 | ) | (608 | ) | (199 | ) | (134 | ) | ||||||||||||||
| Interest expense |
159,292 | 157,143 | 128,123 | 112,385 | 96,632 | 78,345 | 79,955 | |||||||||||||||||||||
| Loss on extinguishment of debt |
— | 3,810 | — | 8,251 | 44,732 | — | — | |||||||||||||||||||||
| Other expenses |
— | 1,364 | 642 | 4,287 | — | — | — | |||||||||||||||||||||
|
|
|
|
|
|
|
|
|
|
|
|
|
|
|
|||||||||||||||
| Income before income taxes and (income) loss from equity method investees |
121,634 | 136,109 | 158,891 | 101,280 | 36,196 | 77,269 | 54,418 | |||||||||||||||||||||
| Income tax expense |
46,398 | 50,836 | 60,070 | 37,305 | 13,728 | 30,588 | 21,531 | |||||||||||||||||||||
| (Income) Loss from equity method investees |
(106 | ) | 508 | — | — | — | (327 | ) | 96 | |||||||||||||||||||
|
|
|
|
|
|
|
|
|
|
|
|
|
|
|
|||||||||||||||
| Net income |
$ | 75,342 | $ | 84,765 | $ | 98,821 | $ | 63,975 | $ | 22,468 | $ | 47,008 | $ | 32,791 | ||||||||||||||
|
|
|
|
|
|
|
|
|
|
|
|
|
|
|
|||||||||||||||
47
Table of Contents
| Fiscal Year Ended | 26 Weeks Ended | |||||||||||||||||||||||||||
| (Dollars in thousands) | January 31, 2015 (Fiscal 2014) |
February 1, 2014 (Fiscal 2013) |
February 2, 2013 (Fiscal 2012) |
January 28, 2012 (Fiscal 2011) |
January 29, 2011 (Fiscal 2010) |
August 1, 2015 |
August 2, 2014 |
|||||||||||||||||||||
| (53 weeks) | (unaudited) | (unaudited) | ||||||||||||||||||||||||||
| Net income per share attributable to common stockholders |
$ | $ | $ | $ | $ | $ | $ | |||||||||||||||||||||
| Basic |
||||||||||||||||||||||||||||
| Diluted |
||||||||||||||||||||||||||||
| Weighted average common shares outstanding |
||||||||||||||||||||||||||||
| Basic |
||||||||||||||||||||||||||||
| Diluted |
||||||||||||||||||||||||||||
| Cash dividends declared per common share |
$ | — | $ | — | $ | $ | — | $ | $ | — | $ | — | ||||||||||||||||
| Fiscal Year Ended | 26 Weeks Ended | |||||||||||||||||||||||||||
| (Dollars in thousands, except per square foot) |
January 31, 2015 (Fiscal 2014) |
February 1, 2014 (Fiscal 2013) |
February 2, 2013 (Fiscal 2012) |
January 28, 2012 (Fiscal 2011) |
January 29, 2011 (Fiscal 2010) |
August 1, 2015 |
August 2, 2014 |
|||||||||||||||||||||
| (53 weeks) | (unaudited) | (unaudited) | ||||||||||||||||||||||||||
| Store data: |
||||||||||||||||||||||||||||
| Number of stores at period end |
1,383 | 1,314 | 1,230 | 1,145 | 1,064 | 1,409 | 1,364 | |||||||||||||||||||||
| Comparable sales growth(1) |
1.8 | % | 4.9 | % | 7.6 | % | 5.2 | % | 1.8 | % | 2.9 | % | 0.8 | % | ||||||||||||||
| Rent expense(2) |
$ | 354,311 | $ | 334,964 | $ | 322,168 | $ | 298,221 | $ | 287,269 | $ | 183,206 | $ | 173,945 | ||||||||||||||
| Net sales per square foot(3) |
$ | 217.0 | $ | 213.4 | $ | 208.6 | $ | 192.2 | $ | 186.3 | $ | 115.4 | $ | 106.8 | ||||||||||||||
| As of | As of | |||||||||||||||||||||||||||
| (Dollars in thousands) | January 31, 2015 (Fiscal 2014) |
February 1, 2014 (Fiscal 2013) |
February 2, 2013 (Fiscal 2012) |
January 28, 2012 (Fiscal 2011) |
January 29, 2011 (Fiscal 2010) |
August 1, 2015 |
August 2, 2014 |
|||||||||||||||||||||
| (unaudited) | (unaudited) | |||||||||||||||||||||||||||
| Balance sheet data (end of period): |
||||||||||||||||||||||||||||
| Cash and cash equivalents |
$ | 191,265 | $ | 135,793 | $ | 130,367 | $ | 122,019 | $ | 108,427 | $ | 57,948 | $ | 77,183 | ||||||||||||||
| Merchandise inventories |
393,808 | 386,240 | 334,521 | 298,004 | 271,661 | 453,497 | 408,756 | |||||||||||||||||||||
| Working capital(4) |
250,326 | 235,281 | 173,088 | 208,902 | 185,328 | 183,513 | 218,415 | |||||||||||||||||||||
| Fixed assets, net |
591,812 | 513,877 | 487,378 | 428,559 | 396,319 | 621,710 | 552,981 | |||||||||||||||||||||
| Total assets |
2,706,981 | 2,543,754 | 2,462,073 | 2,322,710 | 2,189,601 | 2,835,797 | 2,589,315 | |||||||||||||||||||||
| Total debt(5) |
2,268,211 | 2,238,048 | 2,240,942 | 1,693,803 | 1,713,104 | 2,316,253 | 2,233,185 | |||||||||||||||||||||
| Net debt(6) |
2,076,946 | 2,102,255 | 2,110,575 | 1,571,784 | 1,604,677 | 2,258,305 | 2,156,002 | |||||||||||||||||||||
| Stockholders’ deficit |
(330,338 | ) | (410,271 | ) | (512,123 | ) | (12,757 | ) | (76,634 | ) | (285,517 | ) | (370,935 | ) | ||||||||||||||
48
Table of Contents
| Fiscal Year Ended | 26 Weeks Ended | |||||||||||||||||||||||||||
| (Dollars in thousands, except per square foot) |
January 31, 2015 (Fiscal 2014) |
February 1, 2014 (Fiscal 2013) |
February 2, 2013 (Fiscal 2012) |
January 28, 2012 (Fiscal 2011) |
January 29, 2011 (Fiscal 2010) |
August 1, 2015 |
August 2, 2014 |
|||||||||||||||||||||
| (53 weeks) | (unaudited) | (unaudited) | ||||||||||||||||||||||||||
| Other financial data: |
||||||||||||||||||||||||||||
| Net cash provided by (used for) |
||||||||||||||||||||||||||||
| Operating activities |
$ | 245,432 | $ | 164,553 | $ | 248,423 | $ | 207,321 | $ | 156,756 | $ | 92,503 | $ | 58,185 | ||||||||||||||
| Investing activities |
(213,728 | ) | (145,753 | ) | (178,416 | ) | (156,525 | ) | (104,376 | ) | (269,427 | ) | (109,123 | ) | ||||||||||||||
| Financing activities |
23,768 | (13,374 | ) | (61,659 | ) | (37,204 | ) | (145,798 | ) | 43,607 | (7,672 | ) | ||||||||||||||||
| Capital expenditures |
(191,627 | ) | (136,008 | ) | (160,160 | ) | (129,692 | ) | (94,595 | ) | (106,778 | ) | (101,810 | ) | ||||||||||||||
| Depreciation and |
130,791 | 115,929 | 106,922 | 101,308 | 105,371 | 69,226 | 61,661 | |||||||||||||||||||||
| EBITDA(8) |
411,401 | 408,554 | 393,564 | 314,809 | 237,591 | 224,968 | 195,804 | |||||||||||||||||||||
|
|
|
|
|
|
|
|
|
|
|
|
|
|
|
|||||||||||||||
| Adjusted EBITDA(8) |
$ | 456,808 | $ | 437,101 | $ | 420,377 | $ | 355,554 | $ | 319,814 | $ | 240,063 | $ | 208,931 | ||||||||||||||
|
|
|
|
|
|
|
|
|
|
|
|
|
|
|
|||||||||||||||
| Adjusted Net Income(8) |
$ | 103,443 | $ | 99,376 | $ | 115,098 | $ | 81,792 | $ | 45,740 | $ | 56,153 | $ | 40,715 | ||||||||||||||
|
|
|
|
|
|
|
|
|
|
|
|
|
|
|
|||||||||||||||
| (1) | Comparable sales growth is for retail locations and ecommerce. A new store or website becomes comparable on the first day of the fiscal month following 12 full fiscal months of operation. Relocated stores become comparable stores on the first day of operation if original store was opened longer than 12 full fiscal months. If, during the period presented, a store was closed, sales from that store are included up to the first day of the month of closing. See “Management’s Discussion and Analysis of Results of Operations and Financial Condition—How We Assess the Performance of our Business.” |
| (2) | Rent expense includes rent for stores and distribution centers and other small equipment leases. |
| (3) | Net sales per square foot is calculated by dividing net sales, including ecommerce sales, by total square footage as of the end of each fiscal year. |
| (4) | Working capital is defined as current assets less current liabilities. |
| (5) | Total debt includes obligations under our senior secured credit facilities, senior notes, senior PIK toggle notes, capital lease and mortgage liabilities. |
| (6) | Net debt is defined as total debt less cash and cash equivalents. |
| (7) | Depreciation and amortization includes asset impairments and write-offs of $8.9 million, $2.3 million, $0.3 million, $2.0 million and $2.4 million for fiscal years 2014, 2013, 2012, 2011 and 2010, respectively. Asset impairments and write-offs for the 26-week period ending August 1, 2015 and August 2, 2014 included in depreciation and amortization were $1.8 million and $2.7 million, respectively. |
| (8) | EBITDA, Adjusted EBITDA and Adjusted Net Income are financial measures that are not defined under U.S. GAAP. We use these non-GAAP financial measures, and believe they enhance an investor’s understanding of our financial and operating performance from period to period, because they exclude certain material non-cash items, unusual or non-recurring items that we do not expect to continue in the future and certain other adjustments we believe are not reflective of our ongoing operations and our performance. We also report Adjusted EBITDA, or variations of this metric required under the indentures and credit agreements governing our outstanding indebtedness, to our lenders and noteholders. Certain of our debt covenants use Adjusted EBITDA or variations of this metric, including covenants regarding amounts of permitted liens we incur and restricted payments we make. We believe that EBITDA, Adjusted EBITDA and Adjusted Net Income provide investors with a useful tool for assessing the comparability between periods of our ability to generate cash from operations sufficient to pay taxes, to service debt and to undertake capital expenditures. We use these metrics to measure our core financial and operating performance for business planning purposes, to assess our liquidity and to compare our performance to that of our competitors. In addition, we believe EBITDA, Adjusted EBITDA and Adjusted Net Income are measures commonly used by investors to evaluate companies in the pet industry. However, they are not presentations made in accordance with U.S. GAAP and the use of the terms EBITDA, Adjusted EBITDA and Adjusted Net Income vary from others in our industry. These financial measures are not intended to represent and should not be considered as alternatives to net income, operating income or any other performance measures derived in accordance with GAAP as measures of operating performance or operating cash flows or as measures of liquidity. |
EBITDA, Adjusted EBITDA and Adjusted Net Income have important limitations as analytical tools and you should not consider them in isolation or as substitutes for analysis of our results as reported under GAAP. For example, these financial measures:
| • | exclude certain tax payments that may reduce cash available to us; |
| • | do not reflect any cash capital expenditure requirements for the assets being depreciated and amortized that may have to be replaced in the future; |
| • | do not reflect changes in, or cash requirements for, our working capital needs; |
| • | do not reflect the significant interest expense, or the cash requirements necessary to service interest or principal payments, on our debt; and |
| • | other companies in our industry may calculate these measures differently than we do, limiting their usefulness as comparative measures. |
49
Table of Contents
The table below illustrates a reconciliation of net income to EBITDA, Adjusted EBITDA and Adjusted Net Income for the periods presented:
| Fiscal Year Ended | 26 Weeks Ended | |||||||||||||||||||||||||||
| (Dollars in thousands) | January 31, 2015 (Fiscal 2014) |
February 1, 2014 (Fiscal 2013) |
February 2, 2013 (Fiscal 2012) |
January 28, 2012 (Fiscal 2011) |
January 29, 2011 (Fiscal 2010) |
August 1, 2015 |
August 2, 2014 |
|||||||||||||||||||||
| (53 weeks) | (unaudited) | (unaudited) | ||||||||||||||||||||||||||
| Net income |
$ | 75,342 | $ | 84,765 | $ | 98,821 | $ | 63,975 | $ | 22,468 | $ | 47,008 | $ | 32,791 | ||||||||||||||
| Interest expense, net |
158,870 | 157,024 | 127,751 | 112,221 | 96,024 | 78,146 | 79,821 | |||||||||||||||||||||
| Income tax expense |
46,398 | 50,836 | 60,070 | 37,305 | 13,728 | 30,588 | 21,531 | |||||||||||||||||||||
| Depreciation and amortization(1) |
130,791 | 115,929 | 106,922 | 101,308 | 105,371 | 69,226 | 61,661 | |||||||||||||||||||||
|
|
|
|
|
|
|
|
|
|
|
|
|
|
|
|||||||||||||||
| EBITDA |
$ | 411,401 | $ | 408,554 | $ | 393,564 | $ | 314,809 | $ | 237,591 | $ | 224,968 | $ | 195,804 | ||||||||||||||
| Stock compensation |
3,095 | 3,083 | 4,940 | 4,136 | 17,540 | 1,465 | 1,444 | |||||||||||||||||||||
| Store pre-opening and closing costs(2) |
10,000 | 8,693 | 8,865 | 7,654 | 10,000 | 4,805 | 3,421 | |||||||||||||||||||||
| Management fees(3) |
6,666 | 7,356 | 6,928 | 7,000 | 7,000 | 3,170 | 3,352 | |||||||||||||||||||||
| Loss on debt extinguishment |
— | 3,810 | — | 8,251 | 44,732 | — | — | |||||||||||||||||||||
| Term loan amendment fees(4) |
— | 1,364 | 642 | 4,287 | — | — | — | |||||||||||||||||||||
| Relocation, retention, severance and other related miscellaneous costs |
9,999 | 3,733 | 5,239 | 9,421 | 2,531 | 3,360 | 4,814 | |||||||||||||||||||||
| Other adjustments(5) |
15,647 | 508 | 199 | (4 | ) | 420 | 2,295 | 96 | ||||||||||||||||||||
|
|
|
|
|
|
|
|
|
|
|
|
|
|
|
|||||||||||||||
| Adjusted EBITDA |
$ | 456,808 | $ | 437,101 | $ | 420,377 | $ | 355,554 | $ | 319,814 | $ | 240,063 | $ | 208,931 | ||||||||||||||
| Depreciation and amortization |
(130,791 | ) | (115,929 | ) | (106,922 | ) | (101,308 | ) | (105,371 | ) | (69,226 | ) | (61,661 | ) | ||||||||||||||
| Interest expense, net |
(158,870 | ) | (157,024 | ) | (127,751 | ) | (112,221 | ) | (96,024 | ) | (78,146 | ) | (79,821 | ) | ||||||||||||||
| Loss on extinguishment of debt |
— | (3,810 | ) | — | (8,251 | ) | (44,732 | ) | — | — | ||||||||||||||||||
| Other expenses |
— | (1,364 | ) | (642 | ) | (4,287 | ) | — | — | — | ||||||||||||||||||
| Income taxes, adjusted(6) |
(63,704 | ) | (59,598 | ) | (69,964 | ) | (47,695 | ) | (27,947 | ) | (36,358 | ) | (26,734 | ) | ||||||||||||||
|
|
|
|
|
|
|
|
|
|
|
|
|
|
|
|||||||||||||||
| Adjusted Net Income |
$ | 103,443 | $ | 99,376 | $ | 115,098 | $ | 81,792 | $ | 45,740 | $ | 56,513 | $ | 40,715 | ||||||||||||||
|
|
|
|
|
|
|
|
|
|
|
|
|
|
|
|||||||||||||||
| (1) | Depreciation and amortization includes asset impairments and write-offs. |
| (2) | The add-back of store preopening and closing costs is limited to $10.0 million in any four-quarter period, which is consistent with the requirements of reporting Adjusted EBITDA under the indenture governing our senior notes. Uncapped pre-opening and closing costs for the fiscal year ended January 31, 2015 were $10.1 million, and uncapped pre-opening and closing costs for the fiscal year ended January 29, 2011 were $14.8 million. |
| (3) | Represent annual fees plus out of pocket expenses paid in accordance with a management services agreement with the Sponsors and certain other significant stockholders for management, consulting and other services. The management services agreement will terminate in connection with this offering. See “Certain Relationships and Related Party Transactions—Management Services Agreement.” |
| (4) | Term loan amendment fees represent the portion of fees incurred to amend the term loan facility that were recorded as other expenses in the consolidated statements of income and comprehensive income. |
| (5) | Other adjustments include legal settlements, goodwill impairment, income / loss from equity method investees, acquisition & other non-recurring costs. |
| (6) | Represents income tax expense at the effective tax rate derived from our consolidated financial statements for the periods presented as applied to Adjusted EBITDA as defined above but including the impact of depreciation and amortization, interest expense, net, loss on extinguishment of debt and certain other expenses. |
50
Table of Contents
MANAGEMENT’S DISCUSSION AND ANALYSIS OF FINANCIAL CONDITION AND RESULTS OF OPERATIONS
You should read the following discussion and analysis of our financial condition and consolidated results of operations in conjunction with the “Selected historical consolidated financial data” section of this prospectus and our consolidated financial statements and the related notes appearing elsewhere in this prospectus. In addition to historical information, this discussion and analysis contains forward-looking statements that involve risks, uncertainties and assumptions. Our actual results may differ materially from those anticipated in these forward-looking statements as a result of certain factors, including, but not limited to, those set forth in the “Cautionary Note Regarding Forward-Looking Statements” and “Risk Factors” sections elsewhere in this prospectus.
We report on the basis of a 52- or 53-week fiscal year, which ends on the Saturday closest to January 31. References to “fiscal year” mean the year in which that fiscal year began. Fiscal 2014 ended January 31, 2015, fiscal 2013 ended February 1, 2014 and fiscal 2012 ended February 2, 2013. Fiscal 2012 contained 53 weeks, while fiscal 2013 and fiscal 2014 contained 52 weeks.
Management’s discussion and analysis of financial condition and results of operations (“MD&A”) is intended to provide the reader of our financial statements with a narrative from the perspective of management on our financial condition, results of operations, liquidity and other factors that may affect our future results. Our MD&A is presented in the following sections:
| • | Overview |
| • | How We Assess the Performance of Our Business |
| • | Executive Summary |
| • | Results of Operations |
| • | Liquidity and Capital Resources |
| • | Off-balance Sheet Arrangements and Contractual Obligations |
| • | Critical Accounting Policies and Estimates |
| • | Recent Accounting Pronouncements |
| • | Quantitative and Qualitative Disclosures about Market Risk |
Overview
We believe in the powerful bond between humans and their pets. Our promise is to nurture connections between pets and their parents for better lives together. We strive to be the trusted partner of choice for pet parents, offering a fun, engaging and educational customer experience at more than 1,400 convenient store locations across the country and through our websites. We are a leading omnichannel specialty retailer of pet food, supplies, services and companion animals in the United States, with one of the largest selections of premium pet brands and services available to pet lovers. We offer purposeful products comprising what we believe are among the most trusted and authentic brands in the pet industry, many of which are not currently sold or carried by our closest pet specialty competitor.
With over 50 years of history, our goal is to offer our customers the merchandise, services and advice to help ensure that their pets enjoy the best nutrition and the highest quality of life in loving homes. We support pet parents that view their pets as extensions of their family. We believe this humanization trend drives demand for premium products and services, leading to higher levels of spending per pet. Our omnichannel business model nurtures these powerful relationships between people and their pets. This is our vision: Healthier Pets. Happier People. Better World.
51
Table of Contents
We operate two retail formats: Petco, our flagship retail store format, and Unleashed, a smaller format and up-scale urban lifestyle concept, which enable us to capitalize on real estate opportunities in a variety of urban, suburban and rural markets across the country. We offer a robust suite of in-store services that we believe appeal to discerning pet parents. These services, which cannot be replicated online, include grooming and dog training as well as low-cost vaccination and preventative wellness services, and we continue to expand and enhance our services offerings to address this fast-growing market segment. Our stores are complemented by the largest ecommerce platform in specialty pet retail, which includes Petco.com, DrsFosterSmith.com, Liveaquaria.com and Unleashed.com, and we have one of the most followed pet brands on social media.
We operate in a highly competitive environment, and we address this challenge through our omnichannel business model and our broad and innovative assortment of pet food, supplies and services. We believe our knowledgeable associates differentiate our brand through targeted customer interaction that builds relationships and results in customer loyalty, return visits and sales growth. We carry many lines of food and supplies that are not available at other pet specialty retailers, including our private label products that offer our customers high quality products at a value. We believe our focus on premium pet nutrition gives us a position in a growing segment that cannot easily be duplicated.
How We Assess the Performance of Our Business
In assessing our performance, we consider a variety of performance and financial measures. The key measures we assess to evaluate the performance of our business are set forth below:
Net sales—Our net sales are comprised of gross sales of products and services, net of sales tax and certain discounts and promotions offered to our customers, including those offered under our customer loyalty programs. Net sales is driven by comparable sales and new stores.
Comparable sales—Comparable sales includes both retail and ecommerce sales. A new store or website is included in comparable sales beginning on the first day of the fiscal month following 12 full fiscal months of operation and is subsequently compared to like time periods from the previous year. Relocated stores become comparable stores on the first day of operation if the original store was open longer than 12 full fiscal months. If, during the period presented, a store was closed, sales from that store are included up to the first day of the month of closing. As we continue to pursue our growth strategy, we expect a portion of our net sales will continue to come from new stores not included in comparable sales. Accordingly, comparable sales is only one measure we use to assess our performance.
General macroeconomic and retail business trends are a key driver of changes in comparable sales.
Gross profit—Gross profit is equal to our net sales less our cost of sales and occupancy costs. Gross profit rate measures gross profit as a percentage of net sales.
Our cost of sales and occupancy costs include the following types of expenses:
| • | direct costs net of vendor rebates, allowances and discounts for products sold, including inbound freight charges; |
| • | shipping and handling costs; |
| • | inventory shrinkage costs and write-downs; |
| • | payroll costs of pet groomers and trainers and other direct costs of services; |
| • | store occupancy and utilities costs including rent, common area maintenance and real estate taxes; |
| • | merchandising purchasing costs; and |
52
Table of Contents
| • | internal transfer costs, warehousing and receiving costs and other costs of our distribution network including depreciation. |
Our ecommerce gross profit rate tends to be lower across all of our websites than in stores due to incremental shipping costs associated with free shipping and other expenses of delivery to customers.
Selling, general, and administrative expense—The following types of expenses are included in our selling, general, and administrative costs (“SG&A”): payroll costs of store employees and management; other costs associated with store operations; credit card fees; store pre-opening and remodeling costs; advertising expenses and general and administrative costs, including payroll and other costs associated with management and other support functions. As a result of this offering, any public company costs incurred will be reflected on this line item.
Operating income—Operating income equals gross profit less SG&A expenses and goodwill impairment charges.
Executive Summary
Highlights for the thirteen and twenty-six weeks ended August 1, 2015 include the following:
| • | Net sales increased 11.7% to $1.1 billion for the thirteen weeks ended August 1, 2015, compared to $971.1 million for the thirteen weeks ended August 2, 2014, primarily as a result of an increase in comparable sales, the addition of Drs. Foster and Smith, and new store openings. Net sales increased 11.7% to $2.2 billion for the twenty-six weeks ended August 1, 2015, compared to $1.9 billion for the twenty-six weeks ended August 2, 2014. |
| • | Comparable sales increased 3.1% during the thirteen weeks ended August 1, 2015, compared to a 0.6% increase in comparable sales, during the thirteen weeks ended August 2, 2014. Comparable sales increased 2.9% during the twenty-six weeks ended August 1, 2015, compared to a 0.8% increase in comparable sales during the twenty-six weeks ended August 2, 2014. |
| • | Operating income increased 23.6% to $78.0 million for the thirteen weeks ended August 1, 2015, compared to $63.1 million for the thirteen weeks ended August 2, 2014. Operating income increased 15.8% to $155.4 million for the twenty-six weeks ended August 1, 2015, compared to $134.2 million for the twenty-six weeks ended August 2, 2014. |
| • | We added 13 new locations, or 11 new locations net of relocations and closings (which we refer to as net new locations), during the thirteen weeks ended August 1, 2015. We added 44 new locations, or 36 new locations net of relocations and closings, during the twenty-six weeks ended August 1, 2015. |
Highlights for fiscal 2014 include the following:
| • | Net sales increased 5.6% to $4.0 billion for fiscal 2014, compared to $3.8 billion in fiscal 2013, primarily as a result of new store openings and an increase in comparable sales. |
| • | Comparable sales increased 1.8% during fiscal 2014, compared to a 4.9% increase during fiscal 2013. |
| • | Operating income decreased 6.0% to $280.5 million for fiscal 2014, compared to $298.3 million in fiscal 2013. A non-cash goodwill impairment charge and a legal settlement reached during fiscal 2014 contributed to the result. |
| • | We added 93 new locations, or 69 net new locations during fiscal 2014. |
53
Table of Contents
Results of Operations
The following tables present the percent of net sales of line items included in our consolidated statements of income:
| Thirteen weeks ended | Twenty-six weeks ended |
|||||||||||||||
| August 1, 2015 |
August 2, 2014 |
August 1, 2015 |
August 2, 2014 |
|||||||||||||
| Net sales |
100.0 | % | 100.0 | % | 100.0 | % | 100.0 | % | ||||||||
| Cost of sales and occupancy costs |
69.9 | 70.0 | 69.8 | 69.6 | ||||||||||||
|
|
|
|
|
|
|
|
|
|||||||||
| Gross profit |
30.1 | 30.0 | 30.2 | 30.4 | ||||||||||||
| Selling, general and administrative expenses |
22.9 | 23.5 | 23.0 | 23.5 | ||||||||||||
|
|
|
|
|
|
|
|
|
|||||||||
| Operating income |
7.2 | 6.5 | 7.2 | 6.9 | ||||||||||||
| Interest expense, net |
3.6 | 4.1 | 3.6 | 4.1 | ||||||||||||
|
|
|
|
|
|
|
|
|
|||||||||
| Income before income taxes and (income) loss from equity method investees |
3.6 | 2.4 | 3.6 | 2.8 | ||||||||||||
| Income tax expense |
1.4 | 0.9 | 1.4 | 1.1 | ||||||||||||
| (Income) loss from equity method investees |
(0.0 | ) | (0.0 | ) | (0.0 | ) | 0.0 | |||||||||
|
|
|
|
|
|
|
|
|
|||||||||
| Net income |
2.2 | % | 1.5 | % | 2.2 | % | 1.7 | % | ||||||||
|
|
|
|
|
|
|
|
|
|||||||||
| Fiscal year | ||||||||||||
| 2014 (52 weeks) |
2013 (52 weeks) |
2012 (53 weeks) |
||||||||||
| Net sales |
100.0 | % | 100.0 | % | 100.0 | % | ||||||
| Cost of sales and occupancy costs |
69.5 | 68.7 | 68.1 | |||||||||
|
|
|
|
|
|
|
|||||||
| Gross profit |
30.5 | 31.3 | 31.9 | |||||||||
| Selling, general and administrative expenses |
23.3 | 23.4 | 23.8 | |||||||||
| Goodwill impairment charges |
0.2 | — | — | |||||||||
|
|
|
|
|
|
|
|||||||
| Operating income |
7.0 | 7.9 | 8.1 | |||||||||
| Interest expense, net |
4.0 | 4.2 | 3.6 | |||||||||
| Loss on extinguishment of debt |
— | 0.1 | — | |||||||||
| Other expenses |
— | 0.0 | 0.0 | |||||||||
|
|
|
|
|
|
|
|||||||
| Income before income taxes and (income) loss from equity method investees |
3.0 | 3.6 | 4.5 | |||||||||
| Income tax expense |
1.1 | 1.4 | 1.7 | |||||||||
| (Income) loss from equity method investees |
(0.0 | ) | 0.0 | — | ||||||||
|
|
|
|
|
|
|
|||||||
| Net income |
1.9 | % | 2.2 | % | 2.8 | % | ||||||
|
|
|
|
|
|
|
|||||||
Thirteen weeks ended August 1, 2015, compared to the thirteen weeks ended August 2, 2014
Net Sales
Net sales increased $113.5 million (11.7%) to $1.1 billion for the thirteen weeks ended August 1, 2015, compared to $971.1 million for the thirteen weeks ended August 2, 2014. The increase over the prior year was driven by a 3.1% increase in comparable sales, the addition of Drs. Foster and Smith in the first quarter of fiscal 2015 ($53.6 million) and the addition of 55 net new locations since August 2, 2014 ($23.7 million). By product type, the increase in net sales over the prior year was driven by: supplies and companion animals ($78.2 million), dog and cat food ($25.8 million) and services and other ($9.5 million).
54
Table of Contents
The following table presents consolidated net sales mix percentages:
| Thirteen weeks ended | ||||||||
| Net sales mix summary | ||||||||
| August 1, 2015 | August 2, 2014 | |||||||
| Supplies and companion animals |
55.6 | % | 54.1 | % | ||||
| Dog and cat food |
36.2 | 37.7 | ||||||
| Services and other |
8.2 | 8.2 | ||||||
|
|
|
|
|
|||||
| Net sales |
100.0 | % | 100.0 | % | ||||
|
|
|
|
|
|||||
The shift in the composition of our sales mix for the thirteen weeks ended August 1, 2015 compared to the thirteen weeks ended August 2, 2014 was largely due to the addition of Drs. Foster and Smith, whose total net sales are comprised primarily of supplies.
Gross Profit
Gross profit increased by $35.2 million (12.1%) to $326.8 million for the thirteen weeks ended August 1, 2015, compared to $291.6 million for the thirteen weeks ended August 2, 2014, primarily due to a 3.1% increase in comparable sales, the addition of Drs. Foster and Smith and the addition of 55 net new locations since August 2, 2014. As a percentage of net sales, our gross profit rate increased from 30.0% to 30.1%. The increase in gross profit rate was primarily due to leveraging store occupancy costs as a percentage of sales, partially offset by lower merchandise margin resulting from the addition of Drs. Foster and Smith at lower gross margins on internet sales, which tend to be lower across all our websites than in our stores due to incremental shipping costs.
Selling, General and Administrative Expenses
SG&A expenses increased by $20.3 million (8.9%) to $248.8 million for the thirteen weeks ended August 1, 2015, compared to $228.5 million for the thirteen weeks ended August 2, 2014. As a percentage of net sales, our SG&A expenses decreased from 23.5% to 22.9%. This decrease was primarily due to leveraging store and corporate operating costs.
Interest Expense, Net
Interest expense, net was $38.8 million for the thirteen weeks ended August 1, 2015 compared with $39.7 million for the thirteen weeks ended August 2, 2014. The slight decrease in interest expense, net was primarily due to an increase in capitalized interest associated with the build-out of our new San Diego, California co-headquarters facility and lower interest incurred on our interest rate swaps for the thirteen weeks ended August 1, 2015 compared to the prior year.
Income Tax Expense
Our effective income tax rate was 39.5%, resulting in income tax expense of $15.5 million, for the thirteen weeks ended August 1, 2015, compared to an effective income tax rate of 39.3% for the thirteen weeks ended August 2, 2014, resulting in income tax expense of $9.2 million. The increase in our effective income tax rate was primarily due to changes in state tax rates in various filing jurisdictions.
Twenty-six weeks ended August 1, 2015 compared to the twenty-six weeks ended August 2, 2014
Net Sales
Net sales increased $227.3 million (11.7%) to $2.2 billion for the twenty-six weeks ended August 1, 2015, compared to $1.9 billion for the twenty-six weeks ended August 2, 2014. This increase was primarily due to the addition of Drs. Foster and Smith in the first quarter of fiscal 2015 ($108.1
55
Table of Contents
million), a 2.9% increase in our comparable sales and the addition of 55 net new locations since August 2, 2014 ($41.8 million). By product type, the increase in net sales over the prior year was driven by: supplies and companion animals ($157.9 million), dog and cat food ($46.4 million) and services and other ($23.0 million).
The following table presents consolidated net sales mix percentages:
| Twenty-six weeks ended | ||||||||
| Net sales mix summary | ||||||||
| August 1, 2015 | August 2, 2014 | |||||||
| Supplies and companion animals |
55.6 | % | 54.0 | % | ||||
| Dog and cat food |
36.2 | 38.0 | ||||||
| Services and other |
8.2 | 8.0 | ||||||
|
|
|
|
|
|||||
| Net sales |
100.0 | % | 100.0 | % | ||||
|
|
|
|
|
|||||
The shift in the composition of our sales mix for the twenty-six weeks ended August 1, 2015 compared to the twenty-six weeks ended August 2, 2014 was largely due to the addition of Drs. Foster and Smith, whose total net sales are comprised primarily of supplies, and growth in our wellness and grooming services.
Gross Profit
Gross profit increased by $64.2 million (10.9%) to $654.0 million for the twenty-six weeks ended August 1, 2015, compared to $589.8 million for the twenty-six weeks ended August 2, 2014. This increase was primarily due to a 2.9% increase in our comparable sales, the addition of Drs. Foster and Smith and the addition of 55 net new locations since August 2, 2014. As a percentage of net sales, our gross profit rate decreased from 30.4% to 30.2%. The decrease in gross profit rate was primarily the result of lower merchandise margins from the addition of Drs. Foster and Smith at lower gross margins on internet sales.
Selling, General and Administrative Expenses
SG&A expenses increased by $43.0 million (9.4%) to $498.5 million for the twenty-six weeks ended August 1, 2015, compared to $455.5 million for the twenty-six weeks ended August 2, 2014. As a percentage of net sales, our SG&A expenses decreased from 23.5% to 23.0%. This decrease was primarily due to leveraging store operating and corporate costs.
Interest Expense, Net
Interest expense, net was $78.1 million for the twenty-six weeks ended August 1, 2015 compared with $79.8 million for the twenty-six weeks ended August 2, 2014. The decrease in interest expense was primarily due to an increase in capitalized interest associated with the build-out of our new San Diego, California co-headquarters facility and lower interest incurred on our interest rate swaps for the twenty-six weeks ended August 1, 2015.
Income Tax Expense
Our effective income tax rate was 39.4%, resulting in income tax expense of $30.6 million, for the twenty-six weeks ended August 1, 2015 compared to an effective income tax rate of 39.6% for the twenty-six weeks ended August 2, 2014, resulting in income tax expense of $21.5 million. The decrease in our effective income tax rate was primarily due to the reversal of a valuation allowance related to a prior year capital loss.
56
Table of Contents
Fiscal 2014 compared with fiscal 2013
Net Sales
Net sales increased $210.2 million (5.6%) to $4.0 billion for fiscal 2014, compared to net sales of $3.8 billion in fiscal 2013. This increase was primarily the result of a 1.8% increase in our comparable sales and the addition of 69 net new locations in fiscal 2014 ($63.4 million). By product type, the increase in net sales over the prior year was driven by: dog and cat food ($97.0 million), supplies and companion animals ($73.2 million) and services and other ($40.0 million). Our comparable sales growth in fiscal 2014 was impacted by the challenging macroeconomic environment in the first half of the year.
The following table presents consolidated net sales mix percentages:
| Fiscal year | ||||||||
| 2014 (52 weeks) |
2013 (52 weeks) |
|||||||
| Supplies and companion animals |
54.3 | % | 55.4 | % | ||||
| Dog and cat food |
37.8 | 37.3 | ||||||
| Services and other |
7.9 | 7.3 | ||||||
|
|
|
|
|
|||||
| Net sales |
100.0 | % | 100.0 | % | ||||
|
|
|
|
|
|||||
The shift in the composition of our sales mix year over year was largely due to the continued growth of our natural food category and growth in our grooming and dog training services.
Gross Profit
Gross profit increased by $33.6 million (2.8%) to $1.22 billion in fiscal 2014 compared to $1.18 billion fiscal 2013, primarily due to a 1.8% increase our comparable sales and the addition of 69 net new locations since February 1, 2014. As a percentage of net sales, our gross profit rate decreased from 31.3% in fiscal 2013 to 30.5% in fiscal 2014. The decrease in gross profit rate was primarily the result of lower merchandise margins driven by shifts in sales mix.
Selling, General and Administrative Expenses
SG&A expenses increased by $43.7 million (4.9%) to $928.7 million in fiscal 2014 compared to $885.0 million in fiscal 2013. The increase in SG&A expenses was primarily due to the increase in location count, a one-time charge associated with a legal settlement in the fourth quarter of fiscal 2014 and the overall growth of our business. As a percentage of net sales, SG&A expenses decreased from 23.4% in fiscal 2013 to 23.3% in fiscal 2014. This decrease was primarily due to leveraging store operating and corporate costs.
Goodwill Impairment
During the fourth quarter of fiscal 2014, a revision to the go-forward strategy of our pet hotels reporting unit was made, which triggered the requirement for a quantitative impairment test. Our goodwill impairment test indicated that the carrying value of our pet hotels reporting unit exceeded its estimated fair value, and resulted in a goodwill impairment charge of $7.8 million for fiscal 2014, representing all of the goodwill associated with the pet hotels reporting unit. There were no goodwill impairment charges recorded in fiscal 2013.
Interest Expense, Net
Interest expense, net was $158.9 million in fiscal 2014 compared with $157.0 million for fiscal 2013. The increase in interest expense was primarily due to mark-to-market losses on our interest rate swaps and interest incurred for three interest rate swaps that became effective in the third quarter of fiscal 2013.
57
Table of Contents
Income Tax Expense
Our effective income tax rate was 38.1% for fiscal 2014, resulting in income tax expense of $46.4 million, compared to 37.5% for fiscal 2013. The increase in the effective income tax rate was primarily due to changes in state tax rates in various filing jurisdictions.
Loss on Debt Extinguishment
Loss on debt extinguishment was $3.8 million for fiscal 2013. The loss on debt extinguishment consisted of the write-off of a portion of our previously capitalized debt issuance costs, original issue discount costs and premium paid to our debt holders in connection with the amendment of our amended term loan facility and extinguishment of our $250.0 million senior secured asset based revolving credit facility. We did not incur any loss on debt extinguishment in fiscal 2014.
Other Expenses
Other expenses were $1.4 million for fiscal 2013, and consisted of the non-capitalizable portion of the fees incurred to amend our previously amended term loan facility. We did not incur other expenses in fiscal 2014.
Fiscal 2013 (52 weeks) compared with fiscal 2012 (53 weeks)
Net Sales
Net sales increased $257.1 million (7.3%) to $3.8 billion for fiscal 2013, compared to net sales of $3.5 billion in fiscal 2012. This increase was primarily the result of a 4.9% increase in our comparable sales, the addition of 84 net new locations in fiscal 2013 ($69.5 million), and the effect of sales during the 53rd week in fiscal 2012 ($67.9 million). By product type, the increase in net sales over the prior year was driven by: dog and cat food ($127.2 million), supplies and companion animals ($102.5 million) and services and other ($27.4 million).
The following table presents consolidated net sales mix percentages:
| Fiscal year | ||||||||
| 2013 (52 weeks) |
2012 (53 weeks) |
|||||||
| Supplies and companion animals |
55.4 | % | 56.5 | % | ||||
| Dog and cat food |
37.3 | 36.5 | ||||||
| Services and other |
7.3 | 7.0 | ||||||
|
|
|
|
|
|||||
| Net sales |
100.0 | % | 100.0 | % | ||||
|
|
|
|
|
|||||
The shift in the composition of our sales mix year over year was largely due to the continued growth of our natural food category and growth in our grooming and wellness services.
Gross Profit
Gross profit increased by $58.3 million (5.2%) to $1.2 billion in fiscal 2013 compared to fiscal 2012, primarily due to a 4.9% increase in our comparable sales, the addition of 84 net new locations in fiscal 2013 and the effect of the 53rd week in fiscal 2012. As a percentage of net sales, our gross profit rate decreased from 31.9% in fiscal 2012 to 31.3% in fiscal 2013. This decrease was the result of lower merchandise margins driven by shifts in sales mix and planned strategic price reductions, slightly offset by favorability from leveraging store occupancy costs as a percentage of sales.
58
Table of Contents
Selling, General and Administrative Expenses
SG&A expenses increased by $47.3 million (5.6%) to $885.0 million in fiscal 2013 compared to fiscal 2012. The increase in SG&A expenses was primarily due to an increase in location count and the overall growth of our business. As a percentage of net sales, SG&A expenses decreased from 23.8% in fiscal 2012 to 23.4% in fiscal 2013. This decrease was primarily driven by lower incentive compensation expense.
Interest Expense, Net
Interest expense, net was $157.0 million in fiscal 2013 compared with $127.8 million for fiscal 2012. The increase in interest expense was mainly due to the issuance of senior payment in kind (“PIK”) toggle notes in the third quarter of fiscal 2012 ($32.2 million), mark-to-market losses on interest rate swaps and interest incurred for interest rate swaps that became effective in the third quarter of fiscal 2012 (resulting in a full year of additional expense in fiscal 2013) and the third quarter of fiscal 2013 ($4.1 million). This was partially offset by lower interest on our amended term loan facility and, to a lesser extent, by our new revolving credit facility, both of which were completed during the first quarter of fiscal 2013, and have lower interest rate expense compared to the previous credit facilities ($8.5 million), along with the impact of the 53rd week included in fiscal 2012.
Loss on Debt Extinguishment
Loss on debt extinguishment was $3.8 million for fiscal 2013. The loss on debt extinguishment consisted of the write-off of a portion of our previously capitalized debt issuance costs, original issue discount costs and premium paid to our debt holders in connection with the amendment of our amended term loan facility and extinguishment of our $250.0 million senior secured asset based revolving credit facility. We did not incur any loss on debt extinguishment in fiscal 2012.
Other Expenses
Other expenses were $1.4 million for fiscal 2013 and $0.6 million for fiscal 2012. Other expenses represent the non-capitalizable portion of the fees incurred to amend our term loan facility.
Income Tax Expense
Our effective income tax rate was 37.5% for fiscal 2013, resulting in income tax expense of $50.8 million, compared to 37.8% for fiscal 2012, resulting in income tax expense of $60.1 million. The increase in our effective income tax rate was primarily due to changes in state tax rates in various filing jurisdictions.
Liquidity and Capital Resources
Overview
Our primary source of liquidity is funds generated by operating activities. Our ability to fund our operations, to make planned capital expenditures, to make scheduled debt payments and to repay or refinance indebtedness depends on our future operating performance and cash flows, which are subject to prevailing economic conditions and financial, business and other factors, some of which are beyond our control. We continue to generate operating cash flow in excess of our operating needs and have access to our amended revolving credit facility through April 19, 2018 (subject to a springing maturity 91 days inside the amended term loan facility maturity of November 24, 2017).
59
Table of Contents
As of August 1, 2015 we had $57.9 million of cash and cash equivalents and $183.5 million of working capital, which is current assets minus current liabilities, compared with $191.3 million of cash and cash equivalents and $250.3 million of working capital as of January 31, 2015. The $66.8 million decrease in our working capital was primarily due to a $158.8 million decrease in our cash associated with the acquisition of Drs. Foster and Smith in the first quarter of fiscal 2015, slightly offset by cash received from our construction loan.
On March 20, 2015, one of our wholly owned indirect subsidiaries entered into a construction loan agreement for up to $42.7 million, to partially finance the construction of our new San Diego, California co-headquarters facility. Once construction on the facility is completed, which is to be no later than August 1, 2016, the construction loan will convert into a term loan and will mature 102 months following the conversion date. The note bears interest at 3.75% per year. During the construction loan period, interest incurred will be added to the principal balance on a monthly basis. During the term loan period, interest and principal will be paid monthly based on an amortization period of 162 months. On the term loan maturity date, all principal and unpaid interest will be payable in full. We may prepay the loan in part or in full during the loan period subject to certain conditions and fees. As of August 1, 2015, we had $20.3 million outstanding on the construction loan.
As of January 31, 2015 we had $191.3 million of cash and cash equivalents and $250.3 million of working capital, compared with $135.8 million of cash and cash equivalents and $235.3 million of working capital as of February 1, 2014. The increase in cash and working capital as of January 31, 2015 compared to the prior year was primarily due to $40.0 million of borrowings under our amended revolving credit facility in preparation for the Drs. Foster and Smith acquisition in the first quarter of fiscal 2015.
As of February 1, 2014 we had $135.8 million of cash and cash equivalents and $235.3 million of working capital, compared with $130.4 million of cash and cash equivalents and $173.1 million of working capital as of February 2, 2013. The increase in working capital as of February 1, 2014 was primarily due to higher inventory levels to support sales volume.
We expect our cash flow from operations to be sufficient to meet our working capital needs, planned capital expenditures and debt service obligations for the next 12 months and the foreseeable future. We assess the economic environment and market conditions to guide our decisions for uses of excess cash from operations, including capital expenditures and investments. However, if we were to pursue a significant acquisition or if our cash flow from operations was negatively affected by macroeconomic or other unusual conditions, we may draw against our amended revolving credit facility to the extent it remains available. Additionally, we will continue to evaluate the use of our amended revolving credit facility to satisfy future obligations and strategically manage our cash flow.
Cash Flows
The following tables summarize our consolidated cash flows:
| Fiscal year | Twenty-six weeks ended | |||||||||||||||||||
| (Dollars in thousands) | 2014 (52 weeks) |
2013 (52 weeks) |
2012 (53 weeks) |
August 1, 2015 |
August 2, 2014 |
|||||||||||||||
| Total cash provided by (used in): |
||||||||||||||||||||
| Operating activities |
$ | 245,432 | $ | 164,553 | $ | 248,423 | $ | 92,503 | $ | 58,185 | ||||||||||
| Investing activities |
(213,728 | ) | (145,753 | ) | (178,416 | ) | (269,427 | ) | (109,123 | ) | ||||||||||
| Financing activities |
23,768 | (13,374 | ) | (61,659 | ) | 43,607 | (7,672 | ) | ||||||||||||
|
|
|
|
|
|
|
|
|
|
|
|||||||||||
| Increase (decrease) in cash and cash equivalents |
$ | 55,472 | $ | 5,426 | $ | 8,348 | $ | (133,317 | ) | $ | (58,610 | ) | ||||||||
|
|
|
|
|
|
|
|
|
|
|
|||||||||||
60
Table of Contents
Operating Activities
Net cash provided by operations increased $34.3 million for the twenty-six weeks ended August 1, 2015 compared to the twenty-six weeks ended August 2, 2014, due to an increase in net income plus non-cash charges and a decrease in cash used for prepaid expenses due to the timing of payments. This increase was partially offset by cash used for inventory to support our growing business.
Net cash provided by operating activities was $245.4 million, $164.6 million and $248.4 million for fiscal 2014, 2013 and 2012, respectively. Net cash provided by operating activities increased by $80.9 for fiscal 2014 compared to fiscal 2013, due to the following: increase in net income plus non-cash charges, cash used for inventory, accounts receivable due to the timing of payments, the timing of tax payments and accrued construction costs related to our new San Diego, California co-headquarters facility. Cash provided by operations decreased for fiscal 2013 compared to fiscal 2012 primarily due to an increase in cash used for inventory to support the growth of our business and the payment timing of accrued salaries and employee benefits and accrued expenses.
Substantially all of our sales are on a cash basis and therefore provide us with a significant source of liquidity. We use net operating cash principally to purchase merchandise inventory, to fund our capital expenditures and to make interest and principal payments on our debt. We finance our operations and store expansion program, remodels and other expenditures to support our growth initiatives primarily through cash generated from operating activities. Substantially all the inventory we purchase is financed through vendor credit.
Investing Activities
Net cash used in investing activities was $269.4 million for the twenty-six weeks ended August 1, 2015, compared to $109.1 million for the twenty-six weeks ended August 2, 2014. This increase related primarily to our purchase of Drs. Foster and Smith and capital expenditures. The twenty-six weeks ended August 1, 2015 included capital expenditures to build-out our San Diego, California co-headquarters facilities, construct leasehold improvements, purchase fixtures and equipment, remodel existing locations and purchase computer hardware and software related to our strategic infrastructure transformation initiatives. Additionally, we incurred capital expenditures associated with the construction and build-out of our new distribution center in Reno, Nevada.
Net cash used in investing activities was $213.7 million, $145.8 million and $178.4 million for fiscal 2014, 2013 and 2012, respectively, and relates primarily to capital expenditures. Fiscal 2014 included capital expenditures to purchase an office building and land in San Diego, California to relocate our existing co-headquarters facilities and to support the future expansion of our growing business, construct leasehold improvements, purchase fixtures and equipment for new locations and remodel existing locations and purchase computer hardware and software. See “—Capital expenditures” for a description of the type of expenditures incurred.
Financing Activities
Net cash provided by financing activities was $43.6 million for the twenty-six weeks ended August 1, 2015, compared to a use of $7.7 million for the twenty-six weeks ended August 2, 2014. During the twenty-six weeks ended August 1, 2015, financing activities consisted of $31.0 million of net borrowings under our amended revolving credit facility and $20.3 million of borrowings under our construction loan for our new co-headquarters in San Diego, California. These proceeds were slightly offset by $6.1 million in principal payments on our amended term loan facility.
Net cash provided by (used in) financing activities was $23.8 million, ($13.4) million and ($61.7) million in fiscal 2014, 2013 and 2012, respectively. During fiscal 2014, financing activities primarily
61
Table of Contents
consisted of $40.0 million of borrowings under our amended revolving credit facility in anticipation of the purchase of Drs. Foster and Smith in early fiscal 2015 and $1.4 million received in cash from stock option exercises for which we issued 3.1 million shares of our common stock. These proceeds were slightly offset by $12.3 million in principal payments on our amended term loan facility, $1.5 million for capital lease payments and $3.2 million for common stock repurchases.
During fiscal 2013, financing activities primarily consisted of $9.2 million in principal payments on our amended term loan facility, debt issuance costs paid and capitalized in conjunction with our revolving credit facility totaling $1.4 million, debt issuance costs paid and capitalized in conjunction with the amended term loan facility totaling $0.2 million, a $3.2 million cash bonus paid to optionholders related to options unvested as of the fiscal 2012 recapitalization, $2.0 million for capital lease payments and $3.3 million for equity repurchases.
During fiscal 2012, financing activities primarily consisted of the issuance of $550.0 million aggregate principal amount of our senior PIK toggle notes and a $589.4 million cash dividend and other payments made with respect to our equity interests.
Sources of Liquidity
Senior Secured Credit Facilities
Petco Animal Supplies has a $1,225.0 million ($1,212.8 million, net of original issue discount) senior secured term loan facility (the “term loan facility”), maturing on November 24, 2017, which was most recently amended on February 5, 2013, and a senior secured asset-based revolving credit facility (the “revolving credit facility”), providing for senior secured financing of up to $400.0 million, subject to a borrowing base, expiring on April 19, 2018 (subject to a springing maturity 91 days inside the term loan facility maturity), which was most recently amended on November 21, 2014. The term loan facility and the revolving credit facility are collectively referred to as the “senior secured credit facilities.”
At August 1, 2015, the outstanding principal balance of our amended term loan facility was $1.170 billion ($1.167 billion, net of the unamortized discount). Interest under the amended term loan facility is at our option, the bank’s alternative base rate payable quarterly in arrears or the London Interbank Offered Rate (“LIBOR”) (subject to a 1.00% floor) payable upon maturity of the LIBOR contract, plus the applicable rate in either case. The alternative base rate is the greater of the bank prime rate, federal funds effective rate plus 0.5% or adjusted LIBOR plus 1.0%. The applicable rate is either 2.00% per annum for an alternative base rate loan or 3.00% per annum for a LIBOR loan.
As of August 1, 2015, $71.0 million was outstanding under the amended revolving credit facility and $280.6 million remains available for borrowing, which is net of $48.4 million of outstanding letters of credit.
Our amended revolving credit facility has availability up to $400.0 million, including a $360.0 million “Tranche A” commitment and a $150.0 million letter of credit sub-facility. The availability is limited to a borrowing base, which allows us to borrow up to 90.0% of eligible credit card receivables plus the lesser of 85.0% of eligible inventory and 90.0% of the net orderly liquidation value of the inventory, net of certain reserves, for Tranche A. The first in-last out revolving commitment (the “FILO commitment”) borrowing base is incremental to the Tranche A borrowing base and is 10.0% of the eligible credit card receivables plus 10.0% of the net orderly liquidation value of eligible inventory (which advance rates will be reduced to 7.5% and 5% on November 21, 2015 and November 21, 2016, respectively). Letters of credit reduce the amount available to borrow under the revolving credit facility by their face value.
62
Table of Contents
Interest on our amended revolving credit facility is based on either the bank’s alternate base rate payable quarterly in arrears or LIBOR payable upon maturity of the LIBOR contract, in either case plus a spread. The bank spread rates are dependent on average historical excess availability as follows:
| FILO Loans | Tranche A Loans | |||||||||||||||
| Average Historical Excess Availability |
LIBOR Spread |
Alternate Bank Rate Spread (typically prime rate) |
LIBOR Spread |
Alternate Bank Rate Spread (typically prime rate) |
||||||||||||
| Less than $120.0 million |
3.00 | % | 2.00 | % | 1.75 | % | 0.75 | % | ||||||||
| From $120.0 million to $240.0 million |
2.75 | % | 1.75 | % | 1.50 | % | 0.50 | % | ||||||||
| In excess of $240.0 million |
2.50 | % | 1.50 | % | 1.25 | % | 0.25 | % | ||||||||
The rate in effect on unused commitments is 0.25% and is not dependent upon excess availability. The FILO commitment reduces by $10.0 million on each of November 21, 2015 and November 21, 2016, and Petco Animal Supplies will be required to prepay outstanding FILO loans to the extent such loans exceed the lower commitment level. The FILO loans may be prepaid at any time without penalty and any amounts prepaid cannot be reborrowed.
The obligations under our senior secured credit facilities are unconditionally guaranteed by each of Petco Animal Supplies’ domestic material subsidiaries (the “Guarantors”) and secured, subject to certain exceptions, by substantially all assets of Petco Animal Supplies and the Guarantors.
The credit agreements governing the senior secured credit facilities contain certain affirmative covenants and negative covenants that relate to indebtedness, liens, fundamental changes in the business, investments, restricted payments and agreements, among other things. The credit agreement governing the revolving credit facility requires Petco Animal Supplies to comply with a minimum fixed charge coverage ratio if excess availability falls below a specified threshold. Under the credit agreement governing the revolving term loan facility, compliance with a minimum fixed charge coverage is a condition to Petco Animal Supplies taking certain corporate actions. Such covenants apply to Petco Animal Supplies and its restricted subsidiaries.
Senior Notes
At August 1, 2015, the aggregate principal amount of Petco Animal Supplies’ unsecured senior notes maturing on December 1, 2018 was $500.0 million ($494.9 million, net of the unamortized discount). Our senior notes bear interest at a rate of 9.25% per annum, payable semi-annually in arrears on June 1 and December 1. Petco Animal Supplies may redeem the senior notes at our option, in whole or in part, based on the following agreed-upon schedule of redemption prices if redeemed during the 12-month period beginning on December 1 of each of the years indicated below:
| Year |
Percentage | |||
| 2014 |
104.625 | % | ||
| 2015 |
102.313 | % | ||
| 2016 and thereafter |
100.000 | % | ||
The indenture governing the senior notes contains negative covenants substantially similar to but less restrictive than those in our senior secured credit facilities. In addition, the indenture governing the senior notes contains a number of events of default (many of which are subject to applicable cure periods), including, among others, the failure to make payments when due, defaults under other agreements or instruments of indebtedness and non-compliance with covenants. Upon the occurrence of an event of default, the holders of the senior notes may declare all amounts outstanding to be immediately due and payable. At August 1, 2015, we were in compliance with all of the covenants under the indenture governing the senior notes.
63
Table of Contents
Senior PIK Toggle Notes
At August 1, 2015, the aggregate principal amount of our unsecured senior PIK toggle notes maturing on October 15, 2017 was $550.0 million ($548.6 million, net of the unamortized discount). Our PIK toggle notes bear interest at a rate of 8.50% per annum for cash interest and 9.25% for PIK interest, payable semi-annually in arrears on April 15 and October 15. For each interest payment (other than for the final interest period ending at stated maturity, which is to be paid in cash), we are required to pay interest on the PIK toggle notes entirely in cash, unless certain conditions are satisfied, in which case we are entitled to pay, to a certain extent, interest for such period by either increasing the principal amount of the notes or by issuing new notes for the amount of the interest payment.
We may redeem the PIK toggle notes at our option, in whole or in part, based on the following agreed-upon schedule of redemption prices if redeemed during the 12-month period beginning on October 15 of each of the years indicated below:
| Year |
Percentage | |||
| 2014 |
103.000 | % | ||
| 2015 |
101.500 | % | ||
| 2016 and thereafter |
100.000 | % | ||
The indenture governing the PIK toggle notes contains negative covenants substantially similar to, but less restrictive than, those in our senior secured credit facilities, restricting Petco Holdings and its restricted subsidiaries, including Petco Animal Supplies and its subsidiaries. In addition, the indenture governing the PIK toggle notes contains a number of events of default (many of which are subject to applicable cure periods), including, among others, the failure to make payments when due, defaults under other agreements or instruments of indebtedness and non-compliance with covenants. Upon the occurrence of an event of default, the holders of the PIK toggle notes may declare all amounts outstanding to be immediately due and payable. At August 1, 2015, we were in compliance with all of the covenants under the indenture governing the PIK toggle notes.
Under the credit agreements governing our Senior Secured Credit Facilities and the indentures governing our senior notes and PIK toggle notes, we are and will be permitted to enter into certain additional borrowing arrangements.
Derivative Financial Instruments
In August 2011, we entered into a total of six interest rate swap agreements in connection with $600.0 million of our amended term loan facility to fix the variable portion of our LIBOR loan and to limit our exposure to interest rate variability. The interest rate swaps were forward-starting with effective dates of September 28, 2012 and September 30, 2013 and are based on three-month LIBOR contracts subject to a 1.25% floor with key terms as follows (dollar amounts in thousands):
| Trade date |
Notional amount | Strike rate | Effective date | Expiration date | ||||||||||||
| August 16, 2011 |
$ | 100,000 | 2.06 | % | September 28, 2012 | September 30, 2016 | ||||||||||
| August 16, 2011 |
$ | 100,000 | 2.07 | % | September 28, 2012 | September 30, 2016 | ||||||||||
| August 12, 2011 |
$ | 100,000 | 2.15 | % | September 28, 2012 | September 30, 2016 | ||||||||||
| August 16, 2011 |
$ | 100,000 | 2.31 | % | September 30, 2013 | September 30, 2016 | ||||||||||
| August 16, 2011 |
$ | 100,000 | 2.31 | % | September 30, 2013 | September 30, 2016 | ||||||||||
| August 12, 2011 |
$ | 100,000 | 2.40 | % | September 30, 2013 | September 30, 2016 | ||||||||||
In connection with the February 5, 2013 term loan facility amendment, we elected to discontinue hedge accounting for the outstanding interest rate swaps. As such, unrealized losses in accumulated
64
Table of Contents
other comprehensive income will be reclassified into income as a component of interest expense during the periods in which the hedged forecasted transaction affects income, which is as interest on the amended term loan facility is incurred. All prospective changes in fair value are recorded as a component of interest expense in the condensed consolidated statements of income and comprehensive income in the period of change. Additionally, the interest rate swap agreements can reduce the availability of funds under our amended revolving credit facility.
Capital Expenditures
All of our retail locations and other support and distribution facilities are leased, with the exception of (i) our co-headquarters in San Diego, California which consists of four owned facilities (three of which are operational and one new location, which is currently being built-out and is expected to be placed into service during the second half of fiscal 2015) and one leased facility, (ii) our co-headquarters in San Antonio, which consists of one owned facility and an adjacent parcel of land, (iii) a retail store, distribution center and corporate office in Wisconsin related to our Drs. Foster and Smith acquisition and (iv) three retail locations. Our average net investment to open a new store ranges from approximately $500,000 to $800,000 depending on the size range for our typical stores, consisting of capital investments, inventory and pre-opening expenses, net of tenant allowances. We also incur capital expenditures related to store remodels, distribution centers and administrative support, including information technology.
Capital expenditures during the periods set forth below were as follows:
| Fiscal year | Twenty-six weeks ended | |||||||||||||||||||
| (in thousands) | 2014 (52 weeks) |
2013 (52 weeks) |
2012 (53 weeks) |
August 1, 2015 |
August 2, 2014 |
|||||||||||||||
| New and acquired locations |
$ | 62,407 | $ | 57,912 | $ | 63,760 | $ | 25,945 | $ | 30,151 | ||||||||||
| Investments in existing locations |
37,498 | 28,399 | 29,710 | 15,776 | 17,239 | |||||||||||||||
| Information technology |
29,652 | 32,589 | 41,882 | 19,667 | 16,385 | |||||||||||||||
| New San Diego, California co-headquarters purchase and build out |
45,328 | — | — | 30,850 | 33,750 | |||||||||||||||
| Supply chain and other |
16,742 | 17,108 | 24,808 | 14,540 | 4,285 | |||||||||||||||
|
|
|
|
|
|
|
|
|
|
|
|||||||||||
| Total capital expenditures |
$ | 191,627 | $ | 136,008 | $ | 160,160 | $ | 106,778 | $ | 101,810 | ||||||||||
|
|
|
|
|
|
|
|
|
|
|
|||||||||||
The total number of locations opened, acquired and remodeled were as follows:
| Fiscal year | Twenty-six weeks ended | |||||||||||||||||||
| 2014 | 2013 | 2012 | August 1, 2015 |
August 2, 2014 |
||||||||||||||||
| New locations, gross (other than acquired locations) |
93 | 90 | 87 | 44 | 57 | |||||||||||||||
| Acquired locations |
— | — | 11 | — | — | |||||||||||||||
| Full and limited remodels |
48 | 116 | 156 | 10 | 29 | |||||||||||||||
The majority of the capital expenditures for fiscal 2014, 2013 and 2012, as well as the twenty-six weeks ended August 1, 2015 and August 2, 2014, were discretionary in nature and were made to expand our business.
Off-Balance Sheet Arrangements and Contractual Obligations
Off-Balance Sheet Arrangements
We do not have any relationships that are considered off-balance sheet financing, other than operating leases. Specifically, we do not have any unconsolidated entities or financial partnerships,
65
Table of Contents
such as entities often referred to as structured finance or special purpose entities, which would have been established for the purpose of facilitating off-balance sheet arrangements or other contractually narrow or limited financing purposes. In addition, we do not engage in trading activities involving non-exchange-traded contracts. As a result, we are not materially exposed to any financing, liquidity, market or credit risk that could arise if we engaged in such relationships.
Contractual Obligations
The following summarizes our contractual obligations at January 31, 2015 and the effect such obligations could have on our liquidity and cash flow in future periods (amounts in thousands):
| Fiscal year | ||||||||||||||||||||||||
| 2015 | 2016 & 2017 |
2018 & 2019 |
2020 & beyond |
Other | Total | |||||||||||||||||||
| Operating leases |
$ | 374,615 | $ | 671,050 | $ | 502,900 | $ | 697,639 | $ | — | $ | 2,246,204 | ||||||||||||
| Estimated interest and fees on debt obligations(1) |
143,182 | 276,360 | 47,105 | — | — | 466,647 | ||||||||||||||||||
| Purchase obligations(2) |
168,109 | 30,465 | 18,212 | 21,093 | — | 237,879 | ||||||||||||||||||
|
|
|
|
|
|
|
|
|
|
|
|
|
|||||||||||||
| Total commitments |
685,906 | 977,875 | 568,217 | 718,732 | — | 2,950,730 | ||||||||||||||||||
| Debt, short and long-term(3) |
22,250 | 1,723,750 | 520,000 | — | — | 2,266,000 | ||||||||||||||||||
| Capital leases(4) |
2,176 | 3,305 | 3,175 | 9,434 | — | 18,090 | ||||||||||||||||||
| Other long-term liabilities(5) |
— | 5,127 | 851 | 3,895 | 72,354 | 82,227 | ||||||||||||||||||
|
|
|
|
|
|
|
|
|
|
|
|
|
|||||||||||||
| Total recorded liabilities |
24,426 | 1,732,182 | 524,026 | 13,329 | 72,354 | 2,366,317 | ||||||||||||||||||
|
|
|
|
|
|
|
|
|
|
|
|
|
|||||||||||||
| Total commitments and recorded liabilities |
$ | 710,332 | $ | 2,710,057 | $ | 1,092,243 | $ | 732,061 | $ | 72,354 | $ | 5,317,047 | ||||||||||||
|
|
|
|
|
|
|
|
|
|
|
|
|
|||||||||||||
| (1) | Estimated interest on debt obligations is based on current interest rates in effect at January 31, 2015. Debt fees include commitment and other fees associated with our senior secured credit facilities, and assumes interest payments on the PIK toggle notes will be made in cash interest at 8.5%. An election is available to settle interest obligations under the PIK toggle notes (excluding the first and final interest payment) by PIK under certain circumstances. PIK interest is payable at 9.25%. |
| (2) | Purchase obligations are defined as an agreement to purchase goods or services that is enforceable and legally binding on us and that specifies all significant terms including (a) fixed or minimum quantities to be purchased, (b) fixed, minimum or variable price provisions and (c) the approximate timing of the transaction. Aggregate purchase obligations in the above table include non-cancelable obligations under our advertising and marketing agreements, employment contracts, non-cancelable maintenance and service contracts and open purchase orders as of January 31, 2015. |
| (3) | Amounts shown for the debt include principal payments only. |
| (4) | Capital lease obligations include $4.7 million in implicit interest. |
| (5) | Other long-term liabilities consist of: self-insurance reserves, uncertain tax positions, taxes payable, asset retirement obligations, deferred and other compensation and interest rate swaps. For all items excluding other compensation and interest rate swaps, we are unable to make a reasonably reliable estimate of the timing of payments in individual years beyond 12 months, due to uncertainties in the timing of the settlement of liabilities; these items are therefore included in the “Other” category. |
66
Table of Contents
Segment
We operate under one reportable segment and generate net sales, income and cash through our sales of pet food, supplies and companion animals and services across store and ecommerce channels.
Inflation and Deflation Trends
Inflation and deflation can impact our financial performance. During inflationary periods, our financial results can be positively impacted in the short term as we sell lower-priced inventory in a higher price environment. Over the longer term, the impact of inflation is largely dependent on our ability to pass price increases to our customers, which is subject to competitive market conditions. Although neither inflation nor deflation has had a material impact on our operating results, we can make no assurance that our business will not be affected by inflation or deflation in the future.
Critical Accounting Policies and Estimates
The preparation of our consolidated financial statements in conformity with accounting principles generally accepted in the United States of America, or “GAAP,” requires us to make assumptions and estimates about future results, and apply judgments that affect the reported amounts of assets, liabilities, net sales, expenses and related disclosures. We base our estimates and judgments on historical experience, current trends and other factors that we believe to be relevant at the time our consolidated financial statements are prepared. On a regular basis, we review the accounting policies, assumptions, estimates and judgments to ensure that our financial statements are presented fairly and in accordance with GAAP. However, because future events and their effects cannot be determined with certainty, actual results could differ from our assumptions and estimates, and such differences could be material.
We state our significant accounting policies in the notes to our annual consolidated financial statements, which are included in this prospectus. We believe that the following accounting estimates are critical to aid in fully understanding and evaluating our reported financial results, as these estimates require management’s complex judgments, resulting from the need to make estimates about the effect of matters that are inherently uncertain.
Inventory Reserves
We value our inventory at the lower of the cost or fair market value through the establishment of inventory valuation and shrink reserves. Cost is determined by the average cost method and includes inbound freight charges. Our valuation reserves represent the excess of the carrying value or average cost, over the amount we expect to realize from the ultimate sale of the inventory. Valuation reserves establish a new cost basis, and subsequent changes in facts or circumstances do not result in an increase in the newly established cost basis. Our valuation reserves are subject to uncertainties, as the calculation requires us to make assumptions regarding inventory aging, forecasted consumer demand and trends and the promotional environment.
Our inventory shrink reserve represents estimated physical inventory losses that have occurred since the last physical inventory date. Periodic inventory observations are performed on a regular basis at store locations, and cycle counts are performed for inventory at distribution centers to ensure inventory is properly stated in our financial statements. During the period between counts at store and distribution center locations, we accrue for estimated shrink losses based on historical shrinkage results, taking into consideration any current trends in the business.
67
Table of Contents
We have not made any material changes in our methodology used to establish our inventory valuation and shrink reserves during the past three fiscal years. A 10% difference in our actual valuation reserve at January 31, 2015 would have an insignificant effect on pre-tax income in fiscal 2014. Additionally, we do not believe there is a reasonable likelihood that there will be a material change in future estimates or assumptions we use to calculate our shrink reserve. However, if estimates of losses are inaccurate, we may be exposed to losses or gains that could be material. A 10% difference in our actual reserve at January 31, 2015 would have affected pre-tax income by $3.2 million in fiscal 2014.
Long-lived Assets
Long-lived assets, other than goodwill and intangible assets, which are separately discussed below, are tested for recoverability whenever events or changes in circumstances indicate that the carrying value of an asset may not be recoverable. A long-lived asset is not recoverable if its carrying amount exceeds the sum of the undiscounted cash flows expected to result from its use and eventual disposition. If a long-lived asset is not recoverable, an impairment loss is recognized for the amount by which the carrying amount of the long-lived asset (or group of assets) exceeds its fair value, with fair value determined based on the income approach.
Factors we consider important and which could trigger an impairment review include: (i) significant underperformance of a store relative to expected historical or projected future operating results; (ii) significant changes in the manner of our use of assets or strategy for our overall business; (iii) significant negative industry or economic trends; or (iv) planned store closings.
We have not made any material changes in the accounting methodology we use to assess impairment losses during the past three fiscal years.
Goodwill and Trade Name Intangible Assets
We evaluate our goodwill and trade name, which are our most significant intangible assets, for impairment annually and whenever events or changes in circumstances indicate that the carrying value may not be recoverable. We assess whether a goodwill impairment exists using both qualitative and quantitative assessments. Our qualitative assessment involves determining whether events or circumstances exist that indicate it is more likely than not that the fair value of a reporting unit is less than its carrying amount, including goodwill. If based on this qualitative assessment we determine it is not more likely than not that the fair value of a reporting unit is less than its carrying amount, we will not perform a quantitative assessment. However, if we determine that it is more likely than not that the fair value of a reporting unit is less than its carrying amount, we then perform the first step of the two-step goodwill impairment test. In the first step of the goodwill impairment test, the reporting unit’s carrying amount (including goodwill) and its fair value are compared. If the estimated fair value of a reporting unit is less than the carrying value, a second step is performed to compute the amount of the impairment by determining an “implied fair value” of goodwill. The determination of our “implied fair value” requires us to allocate the estimated fair value of the reporting unit to the assets and liabilities of the reporting unit. Any unallocated fair value represents the “implied fair value” of goodwill, which is compared to the corresponding carrying value. If the “implied fair value” is less than the carrying value, an impairment charge would be recorded.
Factors we consider important and which could trigger an impairment review include: (i) significant underperformance of a reporting unit relative to expected historical or projected future cash flows; (ii) significant changes in the manner of our use of assets or strategy for our business at a reporting unit; (iii) significant negative industry or economic trends; or (iv) decreased market value of publicly traded peer companies.
68
Table of Contents
We have not made any material changes in the accounting methodology we use to assess impairment losses during the past three fiscal years.
Self-insurance Reserves
We maintain accruals for our self-insurance of workers’ compensation, preferred provider organization employee-related health care benefits and general and auto liabilities. Insurance coverage is in place above retention limits to limit our exposure to large claims. When estimating our self-insurance reserves, we consider a number of factors, including historical experience, trends related to claims and payments and information provided by our insurance brokers and actuaries. Periodically, we review our assumptions and valuations provided by our actuaries to determine the adequacy of our self-insurance reserves.
We are required to make assumptions and to apply judgments to estimate the ultimate cost to settle reported claims and claims incurred but not reported at the balance sheet date. There were no significant changes to the self-insurance reserves during the past three years other than routine current period activity. A 10% change in our self-insurance reserves at January 31, 2015 would have affected pre-tax income by $7.4 million in fiscal 2014.
Business Combinations
We account for acquisitions of assets or entities that include inputs and processes and have the ability to create outputs as business combinations. We record the purchase price for assets acquired and liabilities assumed based on estimated fair values. The excess of the fair value of the consideration conveyed over the fair value of the net assets acquired is recorded as goodwill. The income statement includes the results of operations for each acquisition from the respective date of acquisition.
Determining the fair value of these items requires management’s judgment, the utilization of independent valuation experts and involves the use of significant estimates and assumptions with respect to the timing and amounts of future cash inflows and outflows, discount rates, market prices and asset lives, among other items. The judgments made in the determination of the estimated fair value assigned to the assets acquired, the liabilities assumed and any contingent considerations, as well as the estimated useful life of each asset and the duration of each liability, can materially impact the financial statements in periods after acquisition, such as through depreciation and amortization.
Recent Accounting Pronouncements
In April 2014, the Financial Accounting Standards Board (the “FASB”) issued updated guidance on the presentation of financial statements and property, plant and equipment related to reporting discontinued operations and disclosures of disposals of components of an entity. The new guidance amends the criteria for reporting discontinued operations and includes additional disclosure requirements. The new standard is effective for annual periods beginning with our fiscal year 2015 and for interim periods beginning with our fiscal year 2016, with early adoption permitted for disposals or classifications as held for sale that have not been reported in financial statements previously available for issuance. We elected to early adopt this guidance, and it did not have a material impact on our condensed consolidated financial statements.
In May 2014, the FASB issued updated guidance on revenue recognition that requires an entity to recognize the amount of revenue to which it expects to be entitled for the transfer of promised goods or services to customers. The FASB has finalized a one year deferral of the effective date; the standard
69
Table of Contents
will be effective for our fiscal year 2018. The standard permits the use of either the retrospective or cumulative effect transition method. We are currently evaluating the impact the new standard and adoption methods will have on our consolidated financial statements and related disclosures. We have not yet selected a transition method, nor have we determined the effect of the standard on our ongoing financial reporting. The impact of the new standard on our consolidated financial statements is not expected to be material.
In April 2015, the FASB issued updated guidance on the presentation of debt issuance costs, which requires that debt issuance costs related to a recognized debt liability be presented on the balance sheet as a direct deduction from the carrying amount of the corresponding debt liability, consistent with the presentation of debt discounts. The new guidance will be effective for our fiscal year 2016, and early adoption is permitted. We plan to early adopt this accounting policy as of the end of fiscal year 2015. The guidance is to be applied on a retrospective basis, wherein the balance sheet of each individual period presented will be adjusted to reflect the period-specific effects of applying the new guidance. $19.0 million and $22.3 million in debt issuance costs are included in other assets in our condensed consolidated balance sheet as of August 1, 2015 and January 31, 2015, respectively.
In July 2015, the FASB issued updated guidance on inventory measurement that applies to inventory that is measured using any method other than the last-in, first out (“LIFO”) or retail inventory method. The new guidance requires inventory to be measured at the lower of cost and net realizable value. The new standard is effective for interim and annual periods beginning with our fiscal year 2017. We are currently evaluating the impact the new standard will have on our consolidated financial statements and related disclosures. The impact of the new standard on our consolidated financial statements is not expected to be material.
Quantitative and Qualitative Disclosures about Market Risk
We are subject to market risks arising from transactions in the normal course of our business. These risks are primarily associated with interest rate fluctuations, as well as changes in our credit standing, based on the capital and credit markets, which are not predictable. We do not currently hold any instruments for trading purposes.
Market risks relating to our operations result primarily from changes in short-term LIBOR, as our amended term loan facility and amended revolving credit facility utilize a portfolio of short-term LIBOR contracts. These LIBOR contracts are fixed rate instruments that can range from a period of between one and six months, at our discretion. Our portfolio of LIBOR contracts can vary in length and interest rate, such that adverse changes in short-term interest rates could affect the overall borrowing rate when contracts are renewed; however, LIBOR during the twenty-six weeks ended August 1, 2015 was below the LIBOR floor rate for the amended term loan facility.
Our amended term loan facility with an outstanding balance of $1.170 billion ($1.167 billion, net of discount) as of August 1, 2015 is subject to exposure of interest rate changes. For the amended term loan facility, a hypothetical 10% increase in variable rates from the applicable rates at August 1, 2015 would not have an impact on interest expense, as LIBOR was more than 10% below the floor stipulated in the amended term loan agreement. Additionally, on August 12, 2011 and August 16, 2011, we entered into six interest rate swap agreements in connection with $600.0 million of the amended term loan facility to fix the variable portion of the LIBOR loan and limit exposure to future interest rate variability. The interest rate swaps became effective on September 28, 2012 and September 30, 2013 and are based on three-month LIBOR contracts subject to a 1.25% floor. We cannot predict market fluctuations in interest rates and their impact on our debt, nor can there be any assurance that long-term fixed-rate debt will be available at favorable rates, if at all. Consequently,
70
Table of Contents
future results may differ materially from estimated results due to adverse changes in interest rates or debt availability.
We held money market fund investments of $17.0 million as of August 1, 2015, classified as cash and cash equivalents. We also had $8.4 million at August 1, 2015, classified as restricted cash. These investments are short-term in nature, and therefore changes in interest rates would not be expected have a material impact on the valuation of these investments; however, interest rate fluctuations would affect the amount of interest income that is earned.
Foreign Currency Risk
We enter into a significant amount of purchase obligations outside of the United States, which are settled in U.S. dollars and, therefore, have only minimal exposure to foreign currency exchange risks. Additionally, we are exposed to foreign currency fluctuations in connection with our Mexico joint venture and our available-for-sale investment in a publicly traded pet-related business in Australia; however, the impact of any currency fluctuations is not material to our results of operations. We do not hedge against foreign currency risks and believe that foreign currency exchange risk is immaterial to our operations.
71
Table of Contents
Our Company
We believe in the powerful bond between humans and their pets. Our promise is to nurture connections between pets and their parents for better lives together. We strive to be the trusted partner of choice for pet parents, offering a fun, engaging and educational customer experience at more than 1,400 convenient store locations across the country and through our websites. We are a leading omnichannel specialty retailer of pet food, supplies, services and companion animals in the United States, with one of the largest selections of premium pet brands and services available to pet lovers. We offer purposeful products comprising what we believe are among the most trusted and authentic brands in the pet industry, many of which are not currently sold or carried by our closest pet specialty competitor.
With over 50 years of history, our goal is to offer our customers the merchandise, services and advice to help ensure that their pets enjoy the best nutrition and the highest quality of life in loving homes. We support pet parents who view their pets as extensions of their family. We believe this “humanization” trend drives demand for premium products and services, leading to higher levels of spending per pet. Our omnichannel business model helps nurture these powerful relationships between people and their pets. This is our vision: Healthier Pets. Happier People. Better World.
As of August 1, 2015, we operated 1,409 stores across all 50 states, the District of Columbia and Puerto Rico and an additional 13 stores through our joint venture in Mexico. We have two retail formats: Petco, our flagship retail store format, and Unleashed, a smaller format and up-scale urban lifestyle concept, which enable us to capitalize on real estate opportunities in a variety of urban, suburban and rural markets across the country. We offer a robust suite of in-store services that we believe appeal to discerning pet parents. These services, which cannot be replicated online, include grooming and dog training as well as low-cost vaccination and preventative wellness services, and we continue to expand and enhance our services offerings to address this fast-growing market segment. Our stores are complemented by the largest ecommerce platform in specialty pet retail, which includes Petco.com, DrsFosterSmith.com, Liveaquaria.com and Unleashed.com, and we have one of the most followed pet brands on social media.
Our stores are at the heart of our customer engagement strategy, showcasing our love for pets and providing opportunities for our associates to deliver high-quality service and knowledgeable advice to customers. Based on measures of unaided brand awareness and our Net Promoter Score, the Petco brand is widely recognized and highly recommended. To capitalize on our trusted brand and drive engagement with pet parents, we empower our sales associates to provide solutions for customers in the areas of pet nutrition, behavior and services. We utilize the rich customer insights gathered from our Pals loyalty card database to help guide our customer engagement strategy. This database included 19.1 million active members (which we define as members having made a purchase in the last twelve months) and captured 87% of our total sales in fiscal 2014. We believe our highly trained sales associates, together with our data-driven customer engagement model, promote regular return visits of our customers and help establish Petco as a one stop shop for all pet needs.
We have made substantial investments in our omnichannel retail model to position us for continued growth and success in the evolving pet industry. We operate our ecommerce business in-house, utilizing fulfillment processes which are integrated with our network of distribution centers. In recent years, we have made significant investments in our infrastructure to further optimize our business platform. Additionally, these investments include integrating new technology across stores, web and mobile experiences to complement our advanced in-house ecommerce fulfillment processes; a new advanced CRM system to manage our Pals loyalty program; and the opening of our fifth main distribution center in Reno, Nevada to support our western U.S. store expansion and ecommerce business.
72
Table of Contents
The $74 billion pet industry continues to thrive. We estimate that there are more than 6 million new pet households since 2007, while pet ownership among millennial households was 59% in 2014 compared to 50% in 2010, according to Packaged Facts. We believe pet humanization and ownership trends will continue to drive outsized growth of the pet services and premium offerings market segments compared to other portions of the pet industry. We plan to continue to invest in our business to maintain our leading position in the fastest-growing segments of the pet food, supplies and services industry. As a leading pet specialty retailer of natural and organic pet food brands, we believe we are well-positioned to capitalize on these favorable industry trends and take additional market share from grocery and discount stores.
Under the leadership of our experienced management team, we have taken several actions to strengthen our market position and enhance our growth potential. These actions include:
| • | refreshing our stores to make them more appealing and engaging to our customers; |
| • | expanding and refining our assortment of premium pet food and private label products; |
| • | enhancing the range, experience and quality of the robust suite of services offered in our stores; |
| • | developing an additional store format, Unleashed, which enables us to access a broader range of markets, customers and real estate; |
| • | building an industry-leading, comprehensive ecommerce platform, including pet pharmacy and prescription offerings; and |
| • | establishing a model for international growth through our joint venture in Mexico. |
We have established a track record of strong and consistent financial performance, achieving more than 20 consecutive years of net sales growth through various economic cycles. Key financial highlights include:
| • | achieving positive comparable sales growth for our 21 most recent consecutive quarters, and averaging 3.5% of comparable sales growth annually from fiscal 2005 to fiscal 2014; |
| • | growing our store base from 779 stores under the Petco banner as of the end of fiscal 2005 to 1,251 stores under the Petco banner and 122 stores under the Unleashed banner as of the end of fiscal 2014, representing a CAGR of 6.6% on our total store base; |
| • | increasing the share of our net sales attributable to ecommerce from 1.2% in fiscal 2005 to 8.5% during the first two quarters of fiscal 2015, which includes our operations since our acquisition of Drs. Foster and Smith; |
| • | increasing net sales from $1,996 million for fiscal 2005 to $3,995 million for fiscal 2014, representing a CAGR of 8.0%; |
| • | increasing net income from $22 million for fiscal 2010 to $75 million for fiscal 2014, representing a CAGR of 35.3%; and |
| • | increasing Adjusted EBITDA from $320 million for fiscal 2010 to $457 million for fiscal 2014, representing a CAGR of 9.3%, and increasing Adjusted Net Income from $46 million for fiscal 2010 to $103 million for fiscal 2014, representing a CAGR of 22.6%. |
Adjusted EBITDA and Adjusted Net Income are financial measures that are not presented in accordance with U.S. GAAP. For a discussion of our use of Adjusted EBITDA and Adjusted Net Income and reconciliations to net income, and historical comparable sales growth, please refer to “Summary Historical Consolidated Financial Data” and “Selected Historical Consolidated Financial Data.”
73
Table of Contents
Our Industry
We compete in the highly attractive U.S. pet industry (including food, supplies, veterinary services and non-medical services), which was a $74 billion industry in 2014 and is projected to grow to $92 billion in 2019, representing a 4.3% CAGR, according to Packaged Facts. From 2014 to 2019, Packaged Facts forecasts that non-veterinary pet services, pet food and pet supplies will grow at a CAGR of 6.2%, 3.8% and 3.0%, respectively. The pet food, supplies and services market is highly fragmented, spread across superstores, discount stores, supermarkets, independent pet retailers and online retailers, with an increasing number of pet-owning households choosing to shop the pet specialty channel.
The pet specialty channel (which includes retail chains but not local independent pet stores) is the second largest channel with 24% market share in 2014, according to Packaged Facts. We estimate growth in this channel has outpaced that in the overall market with a 7.5% CAGR from 2005 to the end of 2014 compared to the U.S. pet industry’s 5.0% CAGR over the same period. As of June 2015, we estimate that we had approximately 16% of the total U.S. pet specialty chain and independent retail market share, based on total number of locations.
* Online includes ecommerce sales of brick and mortar market participants, including Petco.
The pet industry is characterized by the following trends that we believe positively impact our competitive positioning:
| • | Stable, defensive sector with continued attractive consumer trends. The pet industry has consistently demonstrated resilience across economic cycles, driven in part by the replenishment nature of consumable products and services such as pet food, grooming and veterinary services. Packaged Facts estimates that pet ownership has climbed to 63.8 million households in 2014 (or 54% of U.S. households), up from 61.2 million households in 2010 (or 53% of U.S. households). Spending on pets has consistently increased, even during the last recession, and is projected to reach $77.0 billion in 2015, up from $62.7 billion in 2010 and $47.2 billion in 2005, with average household spending of approximately $1,150 per year by the end of 2014. |
* Represents internal estimates for 2005 to 2008, and Packaged Facts data from 2009 to 2015E.
74
Table of Contents
| • | Continued expansion of the pet humanization trend. At the forefront of the pet industry’s momentum is pet humanization, the trend in which passionate and loyal pet parents view their pets as family and strive to provide better care for their pets through premium food, supplies and services. The pet humanization trend is demonstrated by results of a 2014 survey of pet owners conducted by Packaged Facts, set forth in the following charts: |
|
|
|
We believe this humanization trend leads many pet parents to seek to provide high-quality care for their pets with premium food, supplies and services, which is further increasing spending in the pet industry as 68% of dog owners and 63% of cat owners reported in the 2014 survey that they enjoy purchasing pet products that pamper their pets. The trend is also driving increased spending on non-medical services such as grooming and training, which Packaged Facts forecasts to be the highest growth-rate sub-sector in the pet industry, at a 6.2% CAGR from 2014 to 2019. In addition, as pet parents increasingly use social media as a means to personify and share their pets with others, we believe pet-focused content in social media will continue to accelerate the humanization trend.
| • | High growth rate in premium pet food. As the trend of healthy human food consumption has grown, there has been a corresponding focus on nutritious options for pets. Specifically, natural food, with simple core ingredients, has driven increased spending on pet food. The higher demand for natural food products and more specialized formulas for different life-stages, breed sizes, special needs and diet types has fueled premiumization in the pet food industry, leading to the faster growth of products with higher net sales per unit. This premiumization trend has impacted all market segments and product types in the pet food industry. |
| • | Favorable demographic trends with millennials and higher-income households representing a growth opportunity. Pet ownership among the technology savvy millennial generation (age 18 to 29) was 59% of households in 2014 compared to 50% of households in 2010. Our market research indicates that millennials have higher average intended pet spend compared to baby boomers (age 50 to 68), with 76% of millennials indicating that they would splurge on certain items for pets compared to 50% of boomers. In addition, millennials, who tend to live in more dense urban locations, favor online shopping and social media, which represent additional growth avenues. A significant percentage of pet care and pet food sales also come from households with incomes of over $70,000, according to Packaged Facts. These favorable demographics represent a source for continued long-term industry growth, particularly within pet specialty. |
| • | Shift to specialty retailers. Pet specialty chains comprised 24% of the $43.8 billion in U.S. retail pet product sales in 2014, with discount merchandisers (31%) and grocery (18%) as significant competitors. We believe the pet specialty channel will gain market share from discount merchandisers and grocery, driven by the availability of knowledgeable associates; broader assortments of pet-related products; channel-specific foods and treats; service offerings such as grooming, training and vaccination; millennial customer preference for the specialty experience; and the availability of live animals and adoptions. Moreover, we believe that continued expansion of larger specialty chains, with size and scale leverage, will put increasing pressure on the highly fragmented independent pet specialty retailers. |
75
Table of Contents
| • | Growing importance of omnichannel retailing in the pet industry. In recent years, pet food and pet supply sales have experienced significant growth in the pet specialty and ecommerce channels. Although Packaged Facts estimates that the ecommerce share of total expenditures in the pet food and supply industry was only 4% as of the end of 2014, it is growing rapidly, which we believe is being driven by online convenience, free shipping and reliable delivery advantages. In a recent Packaged Facts survey, nearly 31% of pet parents reported buying pet products online more frequently than they used to, up from only 14% in 2011. As the ecommerce segment grows, we believe the ability to provide an integrated, omnichannel experience by providing customers with the ability to shop for, and manage the needs of, their pets anytime and anywhere will be a competitive advantage over both ecommerce-only retailers and smaller independent retailers. As part of the omnichannel retail experience, we expect channel boundaries to blur, but physical stores will continue to support the vast majority of the market, especially key offerings such as pet services. |
As a result of these major industry trends, we believe that the pet industry will continue to be an attractive, dynamic and growing part of the overall U.S. economy. We also believe that pet parents are increasingly looking for specialty pet retailers, both in-store and online, with the knowledge and expertise to holistically address the health and well-being of their pets and the scale to remain convenient and price competitive on a broad selection of pet products and services.
Our Competitive Strengths
We believe that we will continue to capitalize on attractive industry dynamics as a result of the following key competitive strengths:
Nationally recognized and trusted brand authority in pet retailing. We have one of the most widely recognized brands in the pet industry. We believe unaided brand awareness for Petco is over 70% as of the end of the second quarter of fiscal 2015. Our customers are strong advocates, as demonstrated by our Net Promoter Score (a measure of loyalty based on whether our Pals customers would recommend our stores to a friend or family member), which has consistently increased since implementing the program in 2012 to a score of approximately 75, comparable to other leading retail brands. We believe our long history of service to pet parents has driven brand authenticity and trust with our customers.
Our brand recognition is driven in large part by the scale of our store presence. We are the largest specialty pet retailer in the United States by total number of stores, with over 1,400 stores covering all 50 states, the District of Columbia and Puerto Rico. We also recently successfully expanded into Mexico with a joint venture with Grupo Gigante and currently have 13 Petco stores with plans to open additional stores in the future.
We believe that the scale of our national store footprint provides us with several advantages over smaller chains and independents in maintaining our brand authority, including product purchasing power, integrated marketing efforts and advertising scale, more convenient locations for customers, overall effectiveness in associate training and more robust omnichannel capabilities.
Broad and innovative product and service offerings. We have one of the broadest assortments of pet products and services, including exclusive and private label brands and natural and organic foods.
| • | Supplies and companion animal sales represented approximately 54% of our total sales in fiscal 2014. Our supplies offerings combine an extensive assortment, high level of quality and unique offerings through preferred vendor relationships and private label product lines. The companion animals we sell in our stores, which include birds, reptiles, aquatic life and other |
76
Table of Contents
| small animals, and in-store adoption centers also help us to initiate pet parent relationships and acquire long-term customers, in addition to creating a fun and engaging in-store shopping experience. |
| • | Food and consumables represented approximately 38% of our total sales during fiscal 2014. We are well-positioned to capitalize on the premium food trend by providing an extensive assortment of natural and organic pet brands, including leading natural brands that are currently not carried by our closest pet specialty competitor. |
| • | Services represented approximately 8% of our total sales in fiscal 2014. We complement our pet food and merchandise offerings with in-store grooming and training offerings to address the humanization-related increased demand for pet services. We complement these core services with our Vetco mobile vaccination in-store clinics, which supported over 80% of our locations as of the end of fiscal 2014. |
We believe that as a result of the actions we have taken to refine our product and service offerings, we are well-positioned to maximize our exposure to the fastest-growing segments of the pet industry. We believe the quality and breadth of our product offerings, combined with the services we offer, make Petco a leading retail destination and drive customer loyalty.
A differentiated customer engagement approach. At the core of our business model is a focus on creating a genuine, supportive long-term relationship with the pet parent. We accomplish this through our knowledgeable in-store associates, interactive store experiences, customer rewards program and targeted marketing. We use years of customer insights from our 19.1 million active Pals loyalty card member database to train our in-store associates to generate high-content discussions with customers about pet nutrition, behavior and services. This consultative approach is even more involved around companion animal purchase and adoption activities. A key to our store environments has been improving store navigation through enhanced visual merchandising and display, right-sizing of categories and brands through space optimization, as well as innovation around new “shop in shops” like fun and fashion accessories, health and wellness, and natural, all of which are high-growth categories. We are not simply transaction-focused, but strive to create an interactive customer experience that drives regular return visits and establishes Petco as a one stop shop for all pet needs. Our customer data, gathered through our Pals loyalty program, demonstrates the high frequency and value of our best customers. For example, the top 10% of our Pals database customers on average visit Petco 18 times per year and spend an average of $856 per year. We also utilize our six-million customer e-mail database to contact customers with informational, promotional and loyalty-related direct marketing. We track our overall progress in customer engagement through our Net Promoter Score framework, which has demonstrated improving scores since its implementation in 2012. We believe our highly trained sales associates and data-driven customer engagement model have been effective in driving the quality of the shopping experience and visits to our stores.
Well-positioned store base and flexible real estate strategy. We have developed two store formats that enable us to appeal to a broad range of customers in different markets and locations. As of August 1, 2015, we had 1,283 Petco stores in urban, suburban and rural markets that generally range from 6,000 to 15,000 square feet and average 14,000 square feet. As of August 1, 2015, we also operated 126 Unleashed stores in or around urban markets, which average 5,000 square feet and are designed to have particular appeal to the millennial customer. The physical look of our stores has kept pace with investments across our chain to ensure that they are well-maintained and that we continue to innovate and improve our in-store experience. Approximately 46% of our stores have been remodeled, and 76% of our retail footprint has been opened or remodeled, since fiscal 2010. Our flexible store model enables us to appeal to a broad range of customers at different life stages and in urban, suburban and rural markets, which we believe enhances our growth prospects in each of these markets.
77
Table of Contents
Leading omnichannel capabilities. We have the largest integrated ecommerce offering in pet specialty retail, with Petco.com, DrsFosterSmith.com, Liveaquaria.com and Unleashed.com collectively generating over $185 million in total net sales during the first two quarters of fiscal 2015. While in 2014 approximately 4% of overall pet food and supplies spending in the pet industry (excluding services) was attributable to ecommerce, the portion of our net sales generated through our websites was approximately 8.5% during the first two quarters of fiscal 2015. Petco.com recreates the in-store experience by focusing on a fun, content-driven shopping experience for online customers. We offer leading convenience capabilities with our broad national footprint and ecommerce capabilities, including our repeat delivery service for consumables and supplies and our recent partnership with Instacart, which provides same-day delivery of Petco products in major U.S. cities. We acquired DrsFosterSmith.com in fiscal 2015, which enables us to offer a complementary assortment of online pet pharmacy, prescription food and therapeutic, health and wellness products. In 2015, DrsFosterSmith.com was among the top ten most trustworthy websites in the country according to the Online Trust Alliance. Our sites collectively have 2.5 million active customers and provide us with a substantial base for direct marketing efforts to help facilitate repeat visits to stores and online purchases. Combined with our flexible store format, we seek to utilize our ecommerce capabilities to provide a seamless, integrated experience focused on quality, customer service and convenience.
Proven and experienced management team. We have an experienced and proven management team of successful retail industry veterans. Our Chief Executive Officer and Chairman of our Board of Directors, Jim Myers, has spent his entire 25-year retail career with Petco. Our Executive Vice President and Chief Financial Officer, Michael Nuzzo, has over 15 years of retail experience and brings extensive financial and operational experience from both GNC Holdings and Abercrombie & Fitch. Brad Weston, our President and Chief Merchandising Officer, with 27 years of experience in the retail industry, has served at Petco for three years, having previously served as Senior Vice President and Chief Merchandising Officer at Dick’s Sporting Goods for five years. Our management team has delivered consistent top- and bottom-line results throughout business cycles and has developed and implemented a number of initiatives to strengthen our future competitive positioning and growth prospects.
Our Growth Strategy
We grew our net sales at a CAGR of 8.0% from fiscal 2010 to fiscal 2014, while the pet industry as a whole grew at a CAGR of 4.1% during the same period. We believe our continued focus on the high-growth segments of the pet industry will enable us to continue to outpace the overall growth of the pet industry. We believe our competitive strengths, combined with our strategic investments in our business, position us to capitalize on industry drivers. Key elements of our future growth strategy are detailed below.
Increase core business comparable sales growth.
Continue to elevate our customer engagement efforts. We view our customer engagement model as a significant competitive advantage, and we continue to find ways to improve our approach, both online and in stores, to fuel increased sales growth. Our engagement efforts focus on each stage of the customer lifecycle, from early engagement welcome emails to growth- and retention-based brand initiatives and event-based campaigns to win back customer appreciation and reactivation efforts. We see opportunities to improve the cross-selling of merchandise and services through a mix of promotional and informational messaging, including by offering more customized e-mails to our Pals members to more effectively generate return visits. We are also exploring an opportunity to generate cross-selling synergies between our Petco and Drs. Foster and Smith customer bases. We are a leader among pet specialty retailers in social media, with millions of members, fans, and followers
78
Table of Contents
across Facebook, Twitter, Instagram, Pinterest and other social media outlets. Social media engagement enables us to effectively reach our customers, particularly millennial customers who on average significantly outpace baby boomers in omnichannel shopping habits and pet accessory “splurge” tendencies. Overall, we seek to be at the forefront of the shift to more individualized marketing and customer engagement, creating a loyalty-based, lifetime value proposition for pet parents that increases visit frequency and per trip expenditure levels.
Convert more customers to premium pet food buyers. The pet food category is a key driver of traffic for our stores and our websites that offer food products. For example, the total average size of transactions including food purchases was approximately 34% higher than non-food purchases during the second quarter of fiscal 2015. Pals members purchasing food during the second quarter of fiscal 2015 also made an average of approximately 3.1 trips to our stores during the quarter, compared to approximately 1.8 average trips made by Pals members who did not purchase food during the quarter. As pet parents are often resistant to switching pet foods, we designed our most recent advertising campaign—“what we feed them matters”—around inspiring pet parents to think critically about nutrition. In fiscal 2015 we also launched our Petco in-store demo program, which offers free pet food samples and nutritional information on brands and pet nutrition alternatives. The advertising campaign and demo program are supported by enhanced in-store associate training on nutrition conversations with customers.
With our high-quality, broad assortment of premium and natural pet food, as well as our integrated product and services offerings and compelling in-store and online experience, we are well-positioned to drive sales growth and increase customer retention by converting customers to our differentiated assortment of premium pet food brands. Although we generally do not have formal exclusivity agreements with our vendors, several of these brands are not carried by our closest competitors. Many of these brands are innovative and new, helping differentiate our product offering, further reinforcing the Petco brand as an authority in pet retailing. These brand offerings are typically higher margin due to their natural and premium qualities. We are consistently enhancing our offerings by establishing new relationships with brands we believe recognize our ability to help build brand awareness for their products and leverage the premium pricing opportunities of the specialty pet channel.
Increase penetration of pet services. Pet services is one of the fastest-growing segments in pet specialty retail with a projected CAGR of 6.2% from 2014 to 2019. While our services net sales grew at nearly twice the projected growth rate of the pet services industry in fiscal 2014, it represented only 7.7% of our total fiscal 2014 net sales. We have taken a number of steps to expand and enhance our services offerings to enable us to continue to outpace the overall pet services industry and to capitalize on this key sales growth driver. We use our many on-site pet services offerings to create the feel of an in-store theater, which we believe provides our customers with an experiential shopping environment that builds and promotes customer loyalty. We believe our services offerings distinguish us from other ecommerce and pet retailers. Our services are an important component of driving the in-store experience for our customers and enhancing the frequency of customer visits and total expenditures. For example, based on recent analysis, our dog-grooming customers generally visit our stores 50% more often than our average store customer, with close to double the amount spent per year (including grooming spend).
In fiscal 2014, we introduced a new store format and remodel design that positions services front and center within an overall health and wellness theme. We have also made changes to our management and employee compensation structures to drive further growth of our pet services business. We plan to further integrate vaccination services through our in-house Vetco business. We believe these investments position us well to continue to gain market share in the pet services industry.
Expand private label product sales. Our private label offering of pet supplies accounted for 15% of our net sales in fiscal 2014 and from fiscal 2010 to fiscal 2014 we grew our private label sales at a CAGR of 7.1%. We have an established infrastructure for developing, introducing and fostering
79
Table of Contents
growth in private label products, including a dedicated sourcing office in Asia, established in 2007. We intend to increase our private label sales by increasing penetration of existing brands such as You & Me, Well & Good, Sophresh, Bowl Mates and Bootique. We also intend to continue to expand our offering of new products and brands, including by opportunistically licensing additional brands. We also have an opportunity to leverage our Drs. Foster and Smith brand for developing veterinarian-approved product lines that can support both our online and store merchandising initiatives. We believe growing our private label sales will enhance overall net sales growth and drive gross margin rate benefit.
Expand our integrated omnichannel model.
Continue to open profitable new stores. We believe our compelling product offering, leading customer engagement and the success of our flexible format stores across a broad range of geographic regions and population densities creates a significant opportunity to profitably increase our store count. Our flexible format stores, which generally range from 4,000 to 15,000 square feet, permit us to enter a wide range of markets to capitalize on attractive growth opportunities. For example, our smaller format Unleashed stores provide a differentiated market fill-in opportunity in urban centers. Our Petco store model has attractive economics for urban, suburban and more rural market settings. Based on our internal estimates there are 800 to 900 additional locations in the United States that fit our performance requirements for new stores.
In addition, through our joint venture in Mexico with Grupo Gigante, we have successfully expanded the Petco store brand into Mexico, where we currently have 13 stores and plan to open additional stores in the future. Our initial performance in Mexico has greatly exceeded our internal expectations and creates a model for further potential international expansion.
Link stores, web and mobile in an integrated digital platform. We intend to utilize our leading digital presence, customer engagement programs such as Pals and new technology implementation to grow our omnichannel leadership position and acquire market share in the evolving pet retail landscape. Our strategy includes the following initiatives:
| • | Our Petco.com and DrsFosterSmith.com websites are already leading ecommerce banners. We expect our new 2015 IBM web platform implementation to enhance our advanced digital capabilities that will facilitate channel offerings like repeat delivery. |
| • | We are installing a new technology and communications infrastructure at our stores and equipping store associates with tablet devices to enable in-store online orders from our websites, known as “extended aisle.” We are also upgrading our in-store services scheduling technology to enhance our ability to generate repeat visits and cross-sell health and wellness merchandise. We expect this technology investment will enable future online-to-store links and give us additional flexibility for taking and fulfilling customer transactions. |
| • | We plan to continue to expand our same day delivery service partnership with Instacart, which currently offers 13,000 Petco stock-keeping units (“SKUs”) to customers in over 50 cities, including New York, Boston, Chicago, San Francisco and Los Angeles. |
Align organizational incentives to drive omnichannel growth. We believe that aligning incentives, training and communication programs to support omnichannel is as important as digital asset implementation to driving significant net sales growth. For example, we are augmenting incentive programs for our store organization to also reward in-store efforts to generate online sales. We believe that if our employees have an equal incentive to foster a strong customer relationship any time through any channel, we can drive an overall higher total company net sales growth rate.
80
Table of Contents
Drive operational excellence.
Invest in new innovative revenue driving capabilities. We have a history of making strategic investments in systems, infrastructure, and complementary businesses to drive growth. Our management team has a disciplined focus and advanced return-on-investment framework for capital allocation decisions related to new stores, distribution facilities, and home office assets. We also regularly evaluate business acquisition opportunities in the pet industry. Overall, we seek to remain close to new and emerging business trends in the industry and take a measured approach to assessing their potential growth value to Petco.
Drive cost optimization in order to re-allocate resources to new growth opportunities. We continually seek to optimize our business model by rationalizing our cost structure and investing in future growth drivers. We have a track record of more than 20 years of profitable net sales growth and a continued focus on our expense base. Through a comprehensive assessment of our cost structure, we have identified additional cost saving opportunities in several areas, including cost of goods sold, operating expenses, distribution efficiency and corporate general and administrative expenses. We believe these opportunities for additional savings can result in further margin and profitability expansion and help us to maintain our long track-record of profitable net sales growth.
Utilize the Petco Foundation to drive organizational mission. The Petco Foundation, a separately incorporated 501(c)(3) nonprofit organization, invests in ground-breaking animal welfare work and finds homes for more than 400,000 pets last year through our Think Adoption First program in support of our mission to find a home for animals in need. The Petco Foundation is a significant factor in facilitating pet ownership and is aligned with our mission of making sure pets enjoy the best nutrition and the highest quality of life in loving homes. Since we believe that operational excellence is largely culturally influenced, the Petco Foundation serves as a meaningful employee rallying point that creates significant opportunities for continued success.
Our Stores
As of August 1, 2015, we operated 1,409 locations across all 50 states, the District of Columbia and Puerto Rico under two retail formats: Petco, our flagship retail format, and Unleashed, our up-scale urban lifestyle format. We also offer an expanded range of consumables and supplies through our Petco.com, DrsFosterSmith.com, Liveaquaria.com and Unleashed.com websites.
Our Petco stores span 1,283 retail locations across all 50 states, the District of Columbia and Puerto Rico and sell a broad range of premium pet consumables, supplies and companion animals, and services. Our Petco merchandising strategy is to provide a differentiated assortment of pet products and services. Petco stores have an average of 14,000 square feet and carry on average between 10,000 and 13,000 core SKUs.
As of August 1, 2015, we operated 126 Unleashed stores located in 13 states and the District of Columbia. These stores have an average of 5,000 square feet and carry an average range of between 5,000 and 7,000 core SKUs. This concept offers us a differentiated market fill-in opportunity in urban markets.
We also recently expanded into Mexico with a joint venture with Grupo Gigante and had 13 Petco stores in Mexico as of August 1, 2015, and plan to open additional stores in the future. In addition, we operated ten pet hotels as of August 1, 2015.
Site Selection
We have developed a rigorous and flexible process for site selection. We select sites for new store openings based on criteria such as local demographics, traffic patterns, psychographic profiles,
81
Table of Contents
store visibility and accessibility, pet purchase data from our existing customer database and availability of attractive lease terms. Our store model across both the Petco and Unleased formats is adaptable to markets of multiple sizes and settings, from suburban / rural populations of less than 50,000 to major urban metropolitan areas. Our store model is designed to be profitable in a variety of real estate venues, including neighborhood and lifestyle centers as well as single-unit, stand-alone locations. In most markets, we generally seek anchor locations within high-traffic, easily accessible shopping centers that can include major discount retailers, wholesale retailers, other specialty hardline retailers or supermarkets.
Members of our real estate team spend considerable time evaluating prospective sites before bringing a proposal to our real estate committee. Our real estate committee, which is comprised of certain members of senior management including our Chief Executive Officer, Chief Financial Officer and Senior Vice President of Stores, approves all prospective locations before a lease is signed. We believe there is a significant opportunity to expand our store base in the United States. Based on our internal research, there are an additional 800 to 900 locations in the United States that fit our performance requirements for new stores.
We currently plan to grow our store base at a rate of 60 to 70 net new stores annually. Our new store growth plan is supported by our target new unit economics, which we believe to be compelling. A typical store location ranges in size from 4,500 square feet for our Unleashed and smaller format Petco stores to 15,000 square feet for our more traditional Petco stores with an average size across the store base of 14,000 square feet. Our average net investment to open a new store ranges from approximately $500,000 to $800,000 depending on the size range for our typical stores, consisting of capital investments, inventory and pre-opening expenses, net of tenant allowances.
Sales for our new stores typically reach approximately 60% to 65% of mature store sales in the first twelve months after opening, and typically reach mature sales performance four to five years after opening. We target a four-wall Adjusted EBITDA margin (a measure of store level performance) of 18% to 20% at maturity and a 25% internal rate of return over our initial lease term.
ecommerce
Our stores are complemented by the largest integrated ecommerce offering in pet specialty retail, with Petco.com, DrsFosterSmith.com, Liveaquaria.com and Unleashed.com collectively generating over $185 million in total net sales during the first half of fiscal 2015 and having a combined 2.5 million active customers as of August 1, 2015. We offer leading convenience capabilities, including our “extended aisle” online ordering from our stores, repeat delivery for supplies and consumables and same-day delivery in major U.S. cities through our recent partnership with Instacart. In addition to the ability to order products, our websites recreate the in-store experience by focusing on a fun, content-driven shopping experience for online customers. Our websites are also one of our key marketing vehicles, specifically as it relates to social media marketing initiatives.
We acquired DrsFosterSmith.com in fiscal 2015, which allows us to offer a complementary assortment of online pet pharmacy, therapeutic, and health and wellness products. In 2015, DrsFosterSmith.com was recognized as one of the top ten most trustworthy websites in the country according to the Online Trust Alliance.
We believe that our websites are well-positioned to capture market share of online purchases, which represent one of the fastest growing distribution channels for pet products.
Products
We offer over 17,000 distinct items in our Petco and Unleashed stores and over an additional 18,000 items online through our Petco.com, DrsFosterSmith.com, Liveaquaria.com and
82
Table of Contents
Unleashed.com websites. Our assortment includes nationally recognized brand names as well as an extensive selection of proprietary brands, including our private label. The following chart shows the breakdown of our fiscal year 2014 net sales by merchandise category:
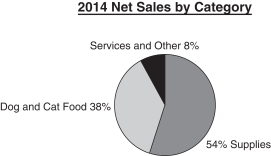
Our dog and cat food offerings consists of a broad assortment of leading natural, premium and essential foods. We continue to evolve our relationships with leading premium and natural food vendors and strive to retain a unique offering of products and brands. Many of our premium and natural brands are not available in grocery stores, discount clubs or other mass merchandisers. In addition, we offer a variety of prescription diet foods through our Drs. Foster and Smith website.
We offer an expansive selection of supplies for dogs and cats which includes treats and chews, cat litter, fun and fashion items, health and wellness products such as vitamins and flea medicine, toys, pet carriers, cat furniture, dog houses and veterinary supplies. In addition, we offer a variety of prescription medications through our full-service pet pharmacy on our Drs. Foster and Smith website.
We feature in-store specialty departments for companion animals, which include a large assortment of salt and fresh-water fish, birds, reptiles and other small pets. We also sell a variety of aquatic life and supplies through our Liveaquaria.com website. We do not sell dogs or cats, but provide space in our stores for adoption and animal welfare organizations.
We augment the breadth of our brand name merchandise with private label merchandise. Our private label offering of pet supplies accounted for 15% of our net sales in fiscal 2014 and from fiscal 2010 to fiscal 2014 we grew our private label sales at a CAGR of 7.1%. We intend to increase our private label sales by both increasing penetration of existing brands and developing and marketing new brands and licensed product labels that are not offered by our closest pet specialty retail competitors.
Services
Our broad assortment of pet services includes grooming, dog training, vaccinations and other veterinary services. We offer full-service, high-quality grooming and training services in all our Petco stores and self-service dog washes in many of our Unleashed locations.
We offer a variety of grooming services to customize each pet’s experience and our educated pet stylists help pet parents find comprehensive solutions to ensure the health and well-being of their pets.
We believe quality training is essential for long, happy and safe relationships between pet parents and their dogs. Our pet training services range from puppy classes to advanced or private courses, led by our passionate instructors to help pet parents build a lifetime bond with their dog.
Our in-store vaccination clinics through our Vetco brand offer a variety of preventative care services for the health and well-being of pets. We operate mobile clinics that supported over 80% of our locations as of the end of fiscal 2014, which offer affordable, low cost vaccination services and preventative veterinary care inside select stores during convenient evening and weekend hours.
83
Table of Contents
We believe the frequent return visits of our customers and our strong customer loyalty is driven by our in-store theatre highlighted by our live companion animals, in-store space for pet adoption and animal welfare organizations and interactive in-store customer experience.
Distribution Network
We operate five main and six regional distribution centers located in various parts of the United States. In fiscal 2014, we invested in a new warehouse management system platform for our distribution network. Bulk items are shipped either from our main distribution centers to regional distribution centers for redistribution to our stores, or are sent directly from main distribution centers to stores. Manufacturers ship non-bulk supplies to both main and regional distribution centers. We fulfill orders from our ecommerce customers through four of our main distribution centers and from a dedicated, owned warehouse for DrsFosterSmith.com. With the opening of our fifth main distribution center in Reno, NV, we believe our distribution network provides the coverage and capacity, and the ability to expand such coverage and capacity as needed, to meet our near-term growth needs.
Suppliers and Vendors
We purchase most of our merchandise directly from specialty suppliers and manufacturers of national brand products. While we do not maintain long-term supply contracts with any of our vendors, we believe we enjoy a favorable and stable relationship with each of these companies. Many of the natural and premium pet food brands we carry, such as Natural Balance, Blue Buffalo, Merrick, Wellness, Natural Choice, Science Diet and Eukanuba, are not presently carried by supermarkets and discount stores due to manufacturer restrictions. No supplier or manufacturer constitutes more than fifteen percent of our total purchases.
Marketing
Petco Marketing
At Petco our vision is Healthier Pets. Happier People. Better World. We believe in our WholePets philosophy of caring for the physical, mental, emotional and social well-being of pets.
To build this partnership, we have a variety of robust omnichannel, customer centric marketing programs that allow us to engage our customers in the ways most relevant to them. The integration of our online and print advertising supports our efforts to drive sales across all channels. We also employ a targeted local marketing strategy to help our stores be relevant to our customers within their unique trading area. Our expanding CRM capabilities give us the ability to use our customer data to continually increase the personalization and customization of our messages and their delivery.
We believe our marketing programs deliver brand differentiation, communicate pet parenting trends and innovation, and provide promotional offers to generate excitement for our breadth of products and pet services. We deliver our message across traditional media including newspaper circulars, TV, mail and in-store activities, while expanding digital and mobile vehicles including search, social media, email and display advertising.
84
Table of Contents
Customer-Friendly Digital Platforms
We believe that we offer a high level of service to customers shopping online through easy-to-use desktop and mobile websites and many customer-friendly features such as personalized recommendations, online rewards redemption, detailed product descriptions, specific breed information, and automatic repeat delivery. In addition, we place high importance on quick, accurate product delivery and offer customers a variety of options to take delivery of their purchases and make returns, including free shipping (on purchases over $49) and two-hour delivery (in over 50 cities as of August 1, 2015 through our partnership with Instacart). We also offer customers an efficient and friendly call and chat service center.
We engage Petco and Unleashed customers through the leading social media platforms on blogs, Twitter feeds, YouTube, Pinterest boards, Snapchat accounts and Facebook pages. We were also voted one of the five best brands on Instagram in February 2015. Social content includes insider pet parent news, exclusive content, brand profiles, product promotion, exclusive savings, customer service and event support. Posts and replies to customers are updated each day. Each platform is designed to build relationships with our customers and reinforce our position as an ‘everything for your pet’ resource with deep knowledge and solutions for all pet parents needs.
In-Store Activity
We maintain an active calendar of local in-store activities including adoption events, vaccination clinics, product demos and free samples every weekend. Specific events include Meet The Critters events, Reptile Rallies and more.
Pals Loyalty Program
Our Pals customer loyalty program is designed to cultivate and reward long-term relationships. Pals customers get access to private online events, exclusive savings and promotional offers with the ability to accumulate points for $5 off their next purchase for every $100 spent. Our Pals loyalty program provides a rich source of customer data with 87% of our sales in fiscal 2014 generated by Pals customers.
Petco Foundation
At the Petco Foundation, a separately incorporated 501(c)(3) nonprofit organization, we believe that every animal deserves to live its best life. Since 1999, we have invested more than $130 million in lifesaving animal welfare work to make that happen. With our more than 8,000 animal welfare partners, we inspire and empower communities to make a difference by investing in adoption and medical care programs, spay/neuter services, pet cancer research, service and therapy animals, and numerous other lifesaving initiatives. Through our Think Adoption First program, we partner with Petco stores and animal welfare organizations across the country to increase pet adoptions. To date, we have helped more than 4.2 million pets find their new loving families.
Competition
The pet food, supplies and services industry is highly competitive. This competition can be categorized into five different segments: grocery; discount stores; pet specialty; traditional pet stores and independent service providers; and ecommerce-only websites. Based on total sales, we are the second largest national pet specialty retailer, with the leading online position among national pet specialty retailers. We believe the primary competitive factors that influence our business are product assortment and quality, convenient store locations, an engaging store environment, attentive customer service and knowledgeable advice from our associates, our services offerings and providing excellent
85
Table of Contents
quality for a fair price. We focus our assortment on specialty products and premium pet foods, which minimizes the potential overlap with supermarkets and discount stores. We believe that we compete effectively within our various geographic areas. However, several of our competitors are much larger in terms of sales volume and have access to greater capital and management resources than we do.
Employees
As of August 1, 2015, we employed approximately 27,800 associates, of whom approximately 17,000 were employed full-time. Approximately 91% of our employees were assigned to stores or were in direct field supervision, approximately 5% were in distribution centers and approximately 5% were in our co-headquarters in San Diego, California and San Antonio, Texas or our Drs. Foster and Smith corporate office in Rhinelander, Wisconsin. We are not party to any collective bargaining agreements, and we believe our labor relations are generally good.
Legal Proceedings
We are involved in the legal proceedings described in Note 15, Contingencies, in our unaudited consolidated financial statements, and we are subject to other claims and litigation arising in the ordinary course of business. The outcome of any litigation is inherently uncertain, and if decided adversely to us, or if we determine that settlement of particular litigation is appropriate, we may be subject to liability that could have a material adverse effect on our business.
Properties
We have co-headquarter facilities, located in San Diego, California and San Antonio, Texas. Our new San Diego, California location was completed in the summer of fiscal 2015 and consists of one owned facility, comprising a total of 257,000 square feet. Our San Antonio location consists of one owned facility, comprising a total of 117,000 square feet, and an adjacent parcel of land, comprised of 20.6 acres. The prior San Diego, California location consists of three owned facilities, which are in the process of being sold. In addition, we own a corporate office and warehouse for Drs. Foster and Smith in Rhinelander, Wisconsin, comprising a total of 245,000 square feet.
We lease all of our distribution center locations and lease nearly all of our store locations. The original lease term for our stores is generally 10 years, with certain store leases being shorter or longer, and many of these leases contain renewal options. Store leases, excluding renewal options, expire at various dates through 2033. Our stores are generally located at sites co-anchored by strong destination stores. Certain leases require payment of property taxes, utilities, common area maintenance and insurance and, if annual sales at certain stores exceed specified amounts, provide for additional rent expense. The following table summarizes our 1,409 stores as of August 1, 2015:
| State |
Number of stores |
|||
| Alabama |
10 | |||
| Alaska |
6 | |||
| Arizona |
31 | |||
| Arkansas |
9 | |||
| California |
233 | |||
| Colorado |
34 | |||
| Connecticut |
27 | |||
86
Table of Contents
| State |
Number of stores |
|||
| Delaware |
4 | |||
| District of Columbia |
6 | |||
| Florida |
72 | |||
| Georgia |
30 | |||
| Hawaii |
10 | |||
| Idaho |
10 | |||
| Illinois |
63 | |||
| Indiana |
14 | |||
| Iowa |
12 | |||
| Kansas |
12 | |||
| Kentucky |
5 | |||
| Louisiana |
17 | |||
| Maine |
5 | |||
| Maryland |
36 | |||
| Massachusetts |
49 | |||
| Michigan |
21 | |||
| Minnesota |
20 | |||
| Mississippi |
6 | |||
| Missouri |
25 | |||
| Montana |
6 | |||
| Nebraska |
7 | |||
| Nevada |
13 | |||
| New Hampshire |
11 | |||
| New Jersey |
32 | |||
| New Mexico |
7 | |||
| New York |
77 | |||
| North Carolina |
24 | |||
| North Dakota |
4 | |||
| Ohio |
40 | |||
| Oklahoma |
11 | |||
| Oregon |
33 | |||
| Pennsylvania |
58 | |||
| Puerto Rico |
5 | |||
| Rhode Island |
4 | |||
| South Carolina |
14 | |||
| South Dakota |
2 | |||
| Tennessee |
22 | |||
| Texas |
122 | |||
| Utah |
16 | |||
| Vermont |
4 | |||
| Virginia |
49 | |||
| Washington |
49 | |||
| West Virginia |
5 | |||
| Wisconsin |
23 | |||
| Wyoming |
4 | |||
| Total |
1,409 | |||
87
Table of Contents
We also lease five main and six regional distribution centers which generally have lease terms from five to fifteen years and contain renewal options. The following table summarizes our current operational distribution center lease information at August 1, 2015:
| Location |
Distribution center type |
Date opened | Lease expiration | Square footage | ||||||
| Braselton, GA |
Main | March 2008 | May 2025 | 506,200 | ||||||
| Mira Loma, CA |
Main | August 1998 | September 2020 | 530,831 | ||||||
| Joliet, IL |
Main | August 1998 | December 2022 | 466,166 | ||||||
| Cranbury, NJ |
Main | December 2012 | October 2022 | 1,000,000 | ||||||
| Reno, NV |
Main | September 2015 | July 2030 | 770,650 | ||||||
| Taunton, MA |
Regional | March 2008 | April 2023 | 92,093 | ||||||
| Garland, TX |
Regional | October 1999 | June 2016 | 94,000 | ||||||
| Portland, OR |
Regional | December 2007 | March 2021 | 62,299 | ||||||
| Stockton, CA |
Regional | April 1996 | November 2015 | 55,200 | ||||||
| Orlando, FL |
Regional | December 2005 | February 2016 | 52,800 | ||||||
| Aurora, CO |
Regional | June 2005 | July 2020 | 40,513 | ||||||
| Total |
3,670,752 | |||||||||
88
Table of Contents
Executive Officers and Directors
Below is a list of the names, ages as of the date of this prospectus, positions and a brief account of the business experience of the individuals who serve as our executive officers and directors as of the date of this prospectus.
| Name |
Age | Title | ||||
| James Myers |
57 | Chief Executive Officer and Chairman of the Board of Directors | ||||
| Michael Nuzzo |
45 | Executive Vice President and Chief Financial Officer | ||||
| Bradley Weston |
50 | President and Chief Merchandising Officer | ||||
| Tom Farello |
63 | Senior Vice President, Operations | ||||
| Charles Piscitello |
52 | Senior Vice President, Chief People Officer | ||||
| Razia Richter |
51 | Senior Vice President, Chief Customer Champion | ||||
| Michael Zuna |
46 | Senior Vice President, Chief Digital Officer | ||||
| Kelly Breitenbecher |
51 | Senior Vice President and Chief Information Officer | ||||
| Mark Hilborn |
60 | Senior Vice President, Supply Chain | ||||
| Rebecca Frechette |
41 | Senior Vice President, Merchandising | ||||
| Steven Lossing |
49 | Senior Vice President, Operations | ||||
| John Carcasi |
45 | Senior Vice President, Merchandise Planning, Pricing and Inventory Management | ||||
| Brian Devine |
73 | Chairman Emeritus of the Board of Directors | ||||
| Jonathan Coslet |
50 | Director | ||||
| Carrie Wheeler |
43 | Director | ||||
| Gary Kusin |
64 | Director | ||||
| John Baumer |
47 | Director | ||||
| John Danhakl |
59 | Director | ||||
| Michael Solomon |
40 | Director | ||||
| Fred Simmons |
60 | Director | ||||
| Peter Starrett |
67 | Director | ||||
| Lawrence Hayward |
60 | Director | ||||
| Colm Lanigan |
49 | Director | ||||
James Myers joined Petco in 1990. He was elected to the Company’s Board of Directors in 2000 and promoted to Chief Executive Officer in 2004. He has served as Chairman of our Board of Directors since August 2015. Mr. Myers’ first assignment at Petco was Vice President and Controller. He progressed through several leadership roles in finance, and was promoted to Executive Vice President and Chief Financial Officer in 1998. Prior to joining Petco, Mr. Myers held various positions, including Senior Audit Manager, at the accounting firm KPMG from 1980 to 1990. He has served as a director of the Jack in the Box Inc., a publicly traded national restaurant company, since December 2010, and also serves on the Board of Directors of the Retail Industry Leaders Association. Mr. Myers earned a bachelor’s degree in accounting from John Carroll University.
Michael Nuzzo joined Petco as Executive Vice President and Chief Financial Officer in April 2015. Prior to joining Petco, Mr. Nuzzo served as the Executive Vice President and Chief Financial Officer for GNC Holdings, Inc., a multinational health and nutrition retailer, from 2008 to July 2014. From 1999 to September 2008, Mr. Nuzzo served in various senior level finance and retail operations and strategic planning roles with Abercrombie & Fitch, a specialty retailer of casual clothing for men, women and children, including Senior Vice President—Finance from June 2008 to September 2008 and Vice President—Finance from January 2006 to May 2008. Prior to his work in the
89
Table of Contents
retail sector, Mr. Nuzzo was a senior consultant with William M. Mercer and Medimetrix Group. Mr. Nuzzo earned a bachelor’s degree in economics from Kenyon College and earned a master’s degree in business administration in finance and accounting from the University of Chicago.
Brad Weston joined Petco in 2011 as Executive Vice President and Chief Merchandising Officer, and was appointed President in August 2015. Prior to joining Petco, Mr. Weston was Senior Vice President and Chief Merchandising Officer for Dick’s Sporting Goods, a full-line sporting goods retailer, from June 2006 to October 2011. Previously, he was Senior Vice President, General Merchandise Manager for May Merchandising Company in St. Louis and Robinsons-May in Los Angeles. Mr. Weston earned a bachelor’s degree from the University of California, Berkeley.
Thomas Farello is currently Senior Vice President, Operations, having joined Petco in 2006. Mr. Farello serves on the Board of Mascotas y Compañĺa, S.A.P.I de C.V., the entity through which we conduct our joint venture operations in Mexico. Prior to joining Petco, he was Senior Vice President for Retail Operations at Shaw’s Supermarkets/Star Markets, a grocery market chain operating in all six New England states, from 2000 to 2006. Previously, Mr. Farello held several executive positions at various grocery retail subsidiaries of the Fleming Companies, Inc., serving as Chief Executive Officer and President of Rainbow Food Stores from 1996 to 2000 and President of Hyde Park Markets from 1994 to 1996. He was also Chief Operating Officer and Executive Vice President of Retail Operations for Red Food Stores, part of the Ahold USA Group from 1990 to 1994. He previously held various leadership positions at H.E. Butt Grocery Company (HEB) from 1980 to 1990. Mr. Farello earned a bachelor’s degree in business administration from Miami University of Ohio and an MBA from Xavier University.
Charles Piscitello joined Petco in 2007 and serves as Senior Vice President and Chief People Officer. Prior to joining Petco, he was Vice President of Human Resources for Boston Scientific, a global medical device company, from September 2004 to March 2007. Previously, Mr. Piscitello held human resources and operational leadership roles at First Data Corporation, Gateway Inc., Coors Brewing Company and Abbott Laboratories. Mr. Piscitello earned a bachelor’s degree in communications from Marquette University. He serves as Chair of the Board for the Petco Foundation, a nonprofit entity that financially supports thousands of animal-welfare organizations across the United States, is a founding member of the Chief Human Resource Officers Council for the Institute for Corporate Productivity, and serves as member of the Executive Advisory Board for the Center for Peace and Commerce at the University of San Diego.
Razia Richter joined Petco in 1991 and has served as Senior Vice President, Chief Customer Champion since 2012, leading companywide efforts to build customer loyalty and satisfaction with our products and services. Ms. Richter previously served in a variety of leadership roles at Petco from 1991 to 2012, including Vice President of Southwest Store Operations, Vice President of Inventory Management and Analytical Services, Vice President of Business Development, Controller; Senior Vice President of Supply Chain and Senior Vice President of Store Operations Services and Support. Prior to joining Petco, she held various positions at the accounting firm KPMG from 1988 to 1991. Ms. Richter earned a bachelor’s degree in accounting from San Diego State University and a master’s degree in business administration from the University of San Diego.
Michael W. Zuna joined Petco in 2015 as Senior Vice President, Chief Marketing and Digital Officer. Prior to joining Petco, Mr. Zuna held senior marketing leadership positions at AFLAC, Inc., a publically traded insurance company, during the period from 2009 to 2015. From 2005 to 2009, Mr. Zuna was as an Executive Vice President at Saatchi & Saatchi, a global communications and advertising agency. Mr. Zuna served as an officer in the U.S. Navy from 1992 to 1996. He earned a bachelor’s degree in economics from the United States Naval Academy.
90
Table of Contents
Kelly Breitenbecher joined Petco in 2009 and currently serves as Senior Vice President and Chief Information Officer. Ms. Breitenbacher previously served as Petco’s Senior Vice President of Merchandise Operations/OmniChannel from 2012 to 2013. Prior to joining Petco, Ms. Breitenbecher was Senior Vice President of Supply Chain and Merchandise Operations at Circuit City, a national electronics retailer, from 2007 to 2009. She also served in various operations and merchandising functions at Best Buy, Payless Shoe Source and Federated Department Stores/Burdines. Ms. Breitenbecher holds a bachelor’s degree in advertising from Michigan State University.
Mark Hilborn joined Petco in 2007 and serves as Senior Vice President of Supply Chain. Prior to joining Petco in 2007, Mr. Hilborn spent nine years as Vice President of Logistics Operations for Sears, a national retailer, prior to which Mr. Hilborn served for 20 years in the United States Army as an officer responsible for various supply chain operations around the world. Mr. Hilborn earned a bachelor’s degree in business from the University of Alabama and a master’s degree in logistics from the Florida Institute of Technology.
Rebecca Frechette is currently Senior Vice President, Merchandising, having joined Petco in 2015 as Senior Vice President, Private Brand. Prior to joining Petco, Ms. Frechette held various merchandising and business development leadership positions at 7-Eleven, Inc. from 2012 to 2015, The Nielsen Company, Inc. from 2011 to 2012, Target Corporation, Inc. from 2004 to 2011, and Accenture from 1997 to 2004. Ms. Frechette earned a bachelor’s degree in organizational communication from University of Wisconsin—Eau Claire and an MBA from Purdue University.
Steven Lossing is currently Senior Vice President, Operations, having joined Petco in 2012 as Senior Vice President, Merchandising. Prior to joining Petco, Mr. Lossing held various merchandising leadership positions at J.C. Penney Department Store from 2002 to 2012, at Saks Inc. from 2001 to 2002, at Elder-Beerman Department Stores Company from 1999 to 2001, and at May Department Stores from 1988 to 1999. Mr. Lossing earned a bachelor’s degree in marketing from The Pennsylvania State University.
John Carcasi is currently Senior Vice President, Merchandise Planning, Pricing & Inventory Management, having joined Petco in 2013 as Vice President, Merchandise Planning and Inventory Management. Prior to joining Petco, Mr. Carcasi held numerous planning and allocation leadership positions at J.C. Penney Company, Inc. from 2001 to 2013, in operations at Tootsies Clothing Store from 1999 to 2001, in merchandising at The Children’s Collection from 1997 to 1999, and as a buyer at Foleys from 1994 to 1996. Mr. Carcasi earned a bachelor’s degree and MBA from Texas A&M University.
Brian Devine joined Petco in August 1990 and led the Company through a period of growth and expansion as it became a leading national specialty retail chain. He currently serves as Chairman Emeritus of the Board of Directors, having served as Chairman of the Board of Directors from 1994 to 2015, and retired as a Petco employee in 2011. He previously served as Petco’s President and Chief Executive Officer from 1990 until 2004. Prior to joining the Company, Mr. Devine spent 18 years with Toys “R” Us, a children’s toy retailer, where he held various leadership positions, including Senior Vice President; Director of Stores; and Senior Vice President, Growth, Development and Operations. He also was President of Krause’s Sofa Factory, a furniture retailer and manufacturer. Previously, Mr. Devine was Statistical Advisor for Planning for the U.S. Department of Health, Education and Welfare. Mr. Devine earned a bachelor’s degree in economics from Georgetown University. He is a director of the National Retail Federation, Sports First San Diego (formerly San Diego Sports Commission), and San Diego State University Business School. He is formerly a director of Wild Oats Markets, the San Diego Padres professional baseball team, Students in Free Enterprise, the Georgetown University Board of Regents and the Georgetown University College Board of Advisors.
91
Table of Contents
Jonathan Coslet has served as a Petco director since 2006. Mr. Coslet is a Senior Partner of TPG. Mr. Coslet is also a member of the firm’s Investment Committee and Management Committee. Prior to joining TPG in 1993, Mr. Coslet was in the Investment Banking Department of Donaldson, Lufkin & Jenrette, specializing in leveraged acquisitions and high yield finance from 1991 to 1993. Mr. Coslet received his MBA from Harvard Graduate School of Business Administration in 1991, where he was a Baker Scholar and a Loeb Fellow. Mr. Coslet received his B.S.E. in Economics (Finance) from the University of Pennsylvania Wharton School, where he was Valedictorian, summa cum laude, a Gordon Fellow and a Steur Fellow. Mr. Coslet currently serves on the Boards of Directors of Quintiles Transnational, IASIS Healthcare and Lifetime Fitness. He previously served on the Boards of Directors of Biomet, Burger King, J.Crew, Fidelity National Information Services, Endurance Specialty, Oxford Health Plans, Neiman Marcus and several others. Mr. Coslet also serves on the Board of Directors of Stanford Children’s Hospital, the Stanford Medicine Advisory Council, the Stanford Institute for Economic Policy Research Advisory Board and the Hamilton Project Advisory Council. Mr. Coslet is also the founder of Cardinal Education Scholars. He also has previously served on the Harvard Business School Board of Advisors and the Federal Reserve Bank of San Francisco Economic Advisory Council.
Carrie Wheeler has served as a Petco director since 2006. She is a Partner of TPG where she is responsible for the firm’s investments in the retail and consumer sectors. Prior to joining TPG in 1996, she was at Goldman, Sachs & Co., specializing in principal investments. Ms. Wheeler presently serves as a director of J. Crew Group, Inc., Gelson’s, Inc. and Savers, Inc. She was previously a director of Neiman Marcus Group and Denbury Resources. Ms. Wheeler also serves on the board of the UCSF Benioff Children’s Hospitals and is a trustee of the Bay Area Discovery Museum. Ms. Wheeler earned a bachelor’s degree in commerce with honors from Queen’s University.
Gary Kusin has served as a Petco director since 2006. He is a Senior Advisor to TPG. Prior to joining TPG, he was President and Chief Executive Officer of FedEx Kinko’s. Mr. Kusin was responsible for the strategic growth and transformation of Kinko’s and oversaw its ultimate sale to FedEx. Mr. Kusin then assisted FedEx in the transition of Kinko’s into FedEx Kinko’s. Prior to joining Kinko’s in 2001, Mr. Kusin was Chief Executive Officer of HQ Global Workplaces, now a part of Regus. In 1995, Mr. Kusin co-founded Laura Mercier Cosmetics, which he sold to Neiman- Marcus in 1998. Previously, Mr. Kusin was President and Co-Founder of Babbage’s Inc., now GameStop. Earlier in his career, he was Vice President and General Merchandise Manager for the Sanger-Harris division of Federated Department Stores, now operating as Macy’s. Mr. Kusin earned a bachelor’s degree from the University of Texas at Austin and a master’s degree in business administration from the Harvard Business School. He serves on the Board of Directors of Sabre Corporation (NASDAQ: SABR), Savers, Inc. and FleetPride. He has served with St. Mark’s School of Texas Board of Trustees, as Chairman of Dallas Young Presidents’ Organization, on Dallas Citizen’s Council Board of Directors, on the Southwestern Medical School Foundation and as Chairman of the Advisory Council for the University of Texas McComb’s School of Business.
John Baumer has served as a Petco director since 2006. He is a partner at LGP and joined the firm in 1999. Prior to joining LGP, he was a Vice President at Donaldson, Lufkin & Jenrette Securities Corporation in Los Angeles. Previously, Mr. Baumer worked at Fidelity Investments and Arthur Andersen. Mr. Baumer earned a bachelor’s degree in business administration from the University of Notre Dame and a master’s degree in business administration from the Wharton School at the University of Pennsylvania. He presently serves as a director of Aspen Dental Management, Inc., CHG Healthcare Services, Inc., Equinox Fitness, Leslie’s Poolmart, Inc., Prospect Medical Holdings, Inc., The Pure Group, U.S. Renal Care, Inc. He was previously a director of The Brickman Group, Ltd., Communications & Power Industries, Inc., FTD Group, Inc., Phoenix Scientific, Inc., Rite Aid Corporation and VCA Antech, Inc.
92
Table of Contents
John Danhakl has served as a Petco director since 2000. He joined LGP in 1995. Prior to joining LGP, Mr. Danhakl was a Managing Director in the Los Angeles office of Donaldson, Lufkin & Jenrette Securities Corporation in Los Angeles where he worked extensively with LGP as its lead investment banker. Mr. Danhakl was a Vice President in corporate finance at Drexel Burnham Lambert, Inc. from 1985 to 1990. Mr. Danhakl earned a bachelor’s degree from the University of California, Berkeley and a master’s degree in business administration from the Harvard Business School. He is a director of Advantage Sales and Marketing, CCC Information Services, Inc., IMS Health, Inc., J.Crew Group, Inc., Leslie’s Poolmart, Inc., LifeTime Fitness, Mister Car Wash, Packers Sanitation Services, Inc., Savers, Inc. and The Tire Rack, Inc. He has previously served on the Boards of Air Lease Corporation, Arden Group, Inc., Big 5 Sporting Goods Corporation, Rite Aid Corporation and VCA Antech, Inc.
Michael Solomon has served as a Petco director since 2006. He joined LGP in 2000. Prior to joining LGP, he worked in the Financial Sponsors Group of Deutsche Banc Alex Brown in Los Angeles. He is actively involved with LGP’s investment in Jetro Cash & Carry, Inc. and was previously involved with VCA Antech, Inc. Mr. Solomon earned a bachelor’s degree in economics from Pomona College and is a Chartered Financial Analyst. He presently serves as a director of Prospect Medical Holdings, Inc. and has previously served as a director of David’s Bridal, Inc., Dollar Financial Group, Inc. and Phoenix Scientific, Inc.
Fred Simmons has served as a Petco director since 2006. He joined Freeman Spogli & Co. (“FS & Co.”) in 1986 and became a General Partner in 1991. Prior to joining FS & Co., Mr. Simmons spent eight years with Bankers Trust Company. From 1978 to 1982, he served in the Commercial Banking Group in New York City, lending to middle market companies. From 1982 to 1986, he was based in Los Angeles and managed a lending group specializing in structuring and funding leveraged buyouts. Mr. Simmons earned a bachelor’s degree in philosophy, cum laude, from Williams College and a master’s degree in business administration from New York University. He is a director of Smile Brands, Inc.; Boot Barn Holding Co.; totes ISOTONER Corporation; LAMP Community, a Los Angeles-based nonprofit organization that works to lessen homelessness; the Alliance for College Ready Public Schools; and The Sound Body Sound Mind Foundation. Mr. Simmons has also served on the Board of Directors of a number of other public and private companies.
Peter Starrett has served as a Petco director since 2006. He is President of Peter Starrett Associates, a retail advisory firm he founded in August 1998. Since then, he has had an exclusive consulting arrangement with FS & Co. to help oversee their existing portfolio companies and to evaluate new retail investment opportunities. From 1990 to 1998, Mr. Starrett was President and Founder of Warner Bros. Studio Stores, a division of Time Warner. Prior to Warner Bros., he was President and C.E.O. of Plymouth Lamston Stores. Previously, Mr. Starrett was with Federated Department Stores from 1982 to 1988 and served as Chairman and C.E.O. of Children’s Palace, a Federated Division. He began his retail career at May Department Stores in 1975 and rose through the merchandising ranks to Vice President and General Merchandise Manager before joining Federated. Mr. Starrett earned a bachelor’s degree from the University of Denver and a master’s degree in business administration from the Harvard Business School. He is a director of Pacific Sunwear (Chairman of the Board), Boot Barn, Inc. (Chairman of the Board), H.H. Gregg, Inc., Floor & Décor, Inc. and several privately held retailers owned by FS & Co. He is also a director of Goodwill Southern California. Mr. Starrett has previously served on the Boards of a number of publicly held retailers, including: Guitar Center, Advance Auto Parts, The Pantry, Brylane, Galyan’s and AFC Enterprises. He is former director of the National Retail Federation.
Lawrence Hayward has served as a Petco director since 2007. He is Chairman of the Board of Directors and Chief Executive Officer of Leslie’s Poolmart, Inc., the world’s largest retailer of swimming pool supplies. He joined Leslie’s Poolmart in January 2000 as President and Chief Executive Officer and assumed the additional role of Chairman of the Board in September 2000. Prior to joining Leslie’s,
93
Table of Contents
Mr. Hayward served as President of ABCO Desert Markets, a leading food and drug retailer located in Arizona. From 1995 until 1999, he served as President and Chief Executive Officer of Carr Gottstein Foods Co., Alaska’s largest food and drug retailer and wholesale provider. From 1990 to 1995, Mr. Hayward held other senior level positions at Buttrey Food and Drug Company, one of the leading food and drug retailers in the Northwest. From 1981 until 1990 he served in various corporate positions at American Stores Company headquartered in Salt Lake City, Utah. He serves on the Advisory Board of Directors for the Paradigm Project and on the Board of Directors for the Boys & Girls Clubs of Metropolitan Phoenix.
Colm Lanigan has served as a Petco director since 2012. Since June 2012, Mr. Lanigan has been a senior investment professional at the Abu Dhabi Investment Authority, a public institution established by the Government of the Emirate of Abu Dhabi. Mr. Lanigan also serves on the Board of Directors of JRD Unico, Inc., a food wholesaler, and ConforMIS, Inc., a manufacturer of personalized orthopedic joints. From February 2006 to July 2011, Mr. Lanigan served as the chief executive officer at Tara Technologies Corporation, a manufacturer of precision components for high-tech industries. His prior experience includes service as Managing Director at Caxton-Iseman Capital, a private equity fund, and as a managing partner at Tara Capital Management. Mr. Lanigan has a B.Sc. from the University of Toronto and a J.D./L.L.B. from the University of Toronto Law School.
Director Qualifications
The Board of Directors seeks to ensure that it is composed of members whose particular experience, qualifications, attributes and skills, when taken together, will allow the Board of Directors to satisfy its oversight responsibilities effectively. In identifying candidates for membership on the Board of Directors, the Board of Directors considers (1) minimum individual qualifications, such as high ethical standards, integrity, mature and careful judgment, industry knowledge or experience and an ability to work collegially with the other members of the Board of Directors and (2) all other factors it considers appropriate, including alignment with our stockholders, especially investment funds affiliated with the Sponsors and certain other significant stockholders. While we have no specific diversity policies for considering Board of Directors candidates, we believe each director contributes to the Board of Directors’ overall diversity—which is broadly construed to mean a variety of opinions, perspectives, personal and professional experiences and backgrounds.
When considering whether the directors and nominees have the experience, qualifications, attributes and skills, to enable the Board of Directors to satisfy its oversight responsibilities effectively in light of our business and structure, the Board of Directors focused primarily on the information discussed in each of the directors’ biographical information above.
Each of the directors possesses high ethical standards, acts with integrity, and exercises careful, mature judgment. Each is committed to employing their skills and abilities to aid the long-term interests of the stakeholders of the Company. In addition, our directors are knowledgeable and experienced in one or more business, governmental, or civic endeavors, which further qualifies them for service as members of the Board of Directors.
As a group, the non-management directors possess experience in owning and managing enterprises like us and are familiar with corporate finance, strategic business planning activities and issues involving stakeholders.
Our Chief Executive Officer brings leadership, extensive business, operating, financial, legal and policy experience, and knowledge of our Company and the Company’s industry, to the Board of Directors. In addition, our Chief Executive Officer brings the broad strategic vision for our Company to the Board of Directors.
94
Table of Contents
Board Composition and Director Independence
Our business and affairs are managed under the direction of our Board of Directors. Our Board of Directors is composed of 12 directors: Messrs. Coslet and Kusin and Ms. Wheeler, who were designated for nomination as directors by TPG; Messrs. Baumer, Danhakl and Solomon, who were designated for nomination as directors by LGP; Messrs. Simmons and Starrett, who were designated for nomination as directors by FS Partners V, L.P., an affiliate of FS & Co.; Mr. Laningan, who was designated for nomination by the Abu Dhabi Investment Authority; Messrs. Devine and Hayward, who were designated for nomination as directors jointly by our Sponsors; and Mr. Myers, our Chief Executive Officer. Currently, each director is elected for a one-year term.
Our Board of Directors has determined that all of our directors, other than , are independent directors under the rules of . In making this determination, the Board of Directors considered the relationships that each such director has with our Company and all other facts and circumstances that the Board of Directors deemed relevant in determining such director’s independence, including beneficial ownership of our common stock.
Board Committees
Upon the completion of this offering, our Board of Directors will have three standing committees: the audit committee; the compensation committee; and the nominating and governance committee. Each of the committees operates under its own written charter adopted by the Board of Directors, each of which will be available on our website upon closing of this offering.
Audit committee
Following this offering, our audit committee will be composed of , with serving as chairperson of the committee. We anticipate that, prior to the completion of this offering, our audit committee will determine that meets the definition of “independent director” under the rules of and under Rule 10A-3 under the Exchange Act. Within 90 days following the effective date of the registration statement of which this prospectus forms a part, we anticipate that the audit committee will consist of a majority of independent directors, and within one year following the effective date of the registration statement of which this prospectus forms a part, the audit committee will consist exclusively of independent directors. None of our audit committee members simultaneously serves on the audit committees of more than three public companies, including ours. Our Board of Directors has determined that is an “audit committee financial expert” within the meaning of the SEC’s regulations and applicable listing standards of . The audit committee’s responsibilities upon completion of this offering will include:
| • | appointing, approving the compensation of, and assessing the qualifications, performance and independence of our independent registered public accounting firm; |
| • | pre-approving audit and permissible non-audit services, and the terms of such services, to be provided by our independent registered public accounting firm; |
| • | reviewing the audit plan with the independent registered public accounting firm and members of management responsible for preparing our financial statements; |
| • | reviewing and discussing with management our annual and quarterly financial statements and related disclosures as well as critical accounting policies and practices used by us; |
| • | reviewing the adequacy of our internal control over financial reporting; |
95
Table of Contents
| • | establishing policies and procedures for the receipt and retention of accounting-related complaints and concerns; |
| • | recommending, based upon the audit committee’s review and discussions with management and the independent registered public accounting firm, the inclusion of our audited financial statements in our Annual Report on Form 10-K; |
| • | reviewing and assessing the adequacy of the committee charter and submitting any changes to the Board of Directors for approval; |
| • | monitoring our compliance with legal and regulatory requirements as they relate to our financial statements and accounting matters; |
| • | preparing the audit committee report required by the rules of the SEC to be included in our annual proxy statement; and |
| • | reviewing and discussing our earnings releases with management. |
Compensation committee
Following this offering, our compensation committee will be composed of , with serving as chairperson of the committee. The compensation committee’s responsibilities upon completion of this offering will include:
| • | annually reviewing and approving corporate goals and objectives relevant to the compensation of our chief executive officer and our other executive officers; |
| • | evaluating the performance of our chief executive officer in light of such corporate goals and objectives and determining and approving the compensation of our chief executive officer; |
| • | reviewing and approving the compensation of our other executive officers; |
| • | appointing, compensating and overseeing the work of any compensation consultant, legal counsel or other advisor retained by the compensation committee; |
| • | conducting the independence assessment outlined in the rules with respect to any compensation consultant, legal counsel or other advisor retained by the compensation committee; |
| • | reviewing and assessing the adequacy of the committee charter and submitting any changes to the Board of Directors for approval; |
| • | reviewing and establishing our overall management compensation, philosophy and policy; |
| • | overseeing and administering our equity compensation and similar plans; |
| • | reviewing and approving our policies and procedures for the grant of equity-based awards; |
| • | reviewing and making recommendations to the Board of Directors with respect to director compensation; and |
| • | producing a compensation committee report for inclusion in our annual proxy statement in accordance with SEC proxy and disclosure rules. |
Nominating and governance committee
Following this offering, our nominating and governance committee will be composed of , with serving as chairperson of the committee. The nominating and governance committee’s responsibilities upon completion of this offering will include:
| • | developing and recommending to the Board of Directors criteria for board and committee membership; |
96
Table of Contents
| • | establishing procedures for identifying and evaluating director candidates, including nominees recommended by stockholders; |
| • | identifying individuals qualified to become members of the Board of Directors; |
| • | recommending to the Board of Directors the persons to be nominated for election as directors and to each of the committees of the Board of Directors; |
| • | developing and recommending to the Board of Directors a set of corporate governance principles; |
| • | articulating to each director what is expected, including reference to the corporate governance principles and directors’ duties and responsibilities; |
| • | reviewing and recommending to the Board of Directors practices and policies with respect to directors; |
| • | reviewing and recommending to the Board of Directors the compositions of the committees of the Board of Directors; |
| • | reviewing and assessing the adequacy of the committee charter and submitting any changes to the Board of Directors for approval; |
| • | reviewing all related person transactions for potential conflict of interest situations and approving all such transactions; |
| • | providing for new director orientation and continuing education for existing directors on a periodic basis; |
| • | performing an evaluation of the performance of the committee; and |
| • | overseeing the evaluation of the Board of Directors and management. |
Compensation Committee Interlocks and Insider Participation
During the fiscal year ended January 31, 2015, our compensation committee was comprised of Messrs. Coslet, Danhakl and Starrett. None of the members of our compensation committee has at any time during the prior three years been one of our officers or employees. None of our executive officers currently serves, or in the past fiscal year has served, as a member of the Board of Directors or compensation committee of any entity that has one or more executive officers serving on our Board of Directors or compensation committee. For a description of transactions between us and members of our compensation committee and affiliates of such members, please see “Certain Relationships and Related Party Transactions.”
Board Oversight of Risk Management
While the full Board of Directors has the ultimate oversight responsibility for the risk management process, its committees oversee risk in certain specified areas. In particular, our audit committee oversees management of enterprise risks as well as financial risks. Our compensation committee is responsible for overseeing the management of risks relating to our executive compensation plans and arrangements and the incentives created by the compensation awards it administers. Our nominating and governance committee oversees risks associated with corporate governance, business conduct and ethics, and is responsible for overseeing the review and approval of related party transactions. Pursuant to the Board of Directors’ instruction, management regularly reports on applicable risks to the relevant committee or the full Board of Directors, as appropriate, with additional review or reporting on risks conducted as needed or as requested by the Board of Directors and its committees.
97
Table of Contents
Codes of Ethics
We have adopted a code of ethics that applies to all of our employees, officers and directors. We have also adopted an additional code of ethics applicable to those officers responsible for financial reporting. Upon the closing of this offering, our codes of ethics will be available on our website. We intend to disclose any amendments to our codes, or any waivers of their requirements, on our website.
98
Table of Contents
Compensation Discussion and Analysis
Compensation of our named executive officers is determined under our compensation program for senior executives. This program is overseen by the compensation committee of the Board of Directors (referred to herein as the “Committee”). The Committee determines the compensation of all our executive officers. This compensation discussion and analysis focuses on our executive officers listed in the Summary Compensation Table and the other compensation tables below (referred to herein as our “named executive officers”). Our named executive officers for fiscal 2014 were:
| • | James Myers, Chief Executive Officer and President; |
| • | Larry Rutkowski, Former Executive Vice President and Chief Financial Officer; |
| • | Bradley Weston, Executive Vice President, Chief Merchandising Officer and President, Unleashed by Petco; |
| • | Thomas Farello, Senior Vice President, Operations; |
| • | Charles Piscitello, Senior Vice President, Chief People Officer; and |
| • | Elisabeth Charles, Former Senior Vice President, Chief Marketing Officer. |
Mr. Rutkowski served as our Executive Vice President and Chief Financial Officer from April 28, 2014 until his termination of employment on December 1, 2014. For the beginning of our 2014 fiscal year through April 27, 2014, and from December 2, 2014 through April 12, 2015, Mr. Myers, our Chief Executive Officer, informally served as our interim Chief Financial Officer. On April 13, 2015, Michael Nuzzo commenced employment with us as our Executive Vice President and Chief Financial Officer. Ms. Charles served as our Senior Vice President, Chief Marketing Officer until her termination of employment on August 22, 2014. Although Mr. Rutkowski and Ms. Charles are former employees, they are included as named executive officers in this discussion and the accompanying tables pursuant to SEC rules. Mr. Weston was appointed President in August 2015.
Principal Objectives of Our Compensation Program for Named Executive Officers
Our executive team is critical to our success and to building value for our stockholders. The principal objectives of our executive compensation program are to:
| • | attract and retain well-qualified executive talent to serve in leadership positions and advance our long-term growth strategy; |
| • | motivate such executives to succeed by providing compensation that is based on both short- and long-term Company performance; and |
| • | align the interests of our officers with those of our stockholders by delivering a substantial portion of the officers’ compensation through incentives that drive long-term enterprise value. |
We have designed our executive compensation program with specific features to help achieve these goals and to promote related objectives that are important to our long-term success.
Our executive compensation program is also designed to tie each named executive officer’s compensation to the achievement of performance objectives. The principal measures of our business performance, as they relate to our executive compensation program for the 2014 fiscal year, were as follows:
| • | EBITDA; |
99
Table of Contents
| • | Net sales; and |
| • | Return on capital employed. |
EBITDA and return on capital employed are non-GAAP financial measures. EBITDA is defined as net income or loss from our consolidated statements of comprehensive income before interest income and expense, income taxes, depreciation and amortization. For purposes of our executive compensation program, EBITDA is defined differently than how it is defined in the sections entitled “Summary Historical Consolidated Financial Data” and “Selected Historical Consolidated Financial Data” and excludes stock-based compensation, management fees and income (loss) from equity method investees and may exclude certain non-recurring items as determined by the Committee. Return on capital employed is defined as EBITDA (as defined under our executive compensation program) divided by average capital employed. Average capital employed is defined as up to the thirteen-month average of total assets, less cash and current liabilities, excluding the current portion of long-term debt as defined in our consolidated balance sheet. Net sales has the definition set forth in our consolidated statements of income and comprehensive income.
EBITDA was selected as a performance metric because we believe it is an important measure of our financial performance and our ability to service our debt and reflects our near- and longer-term goal of increasing profitability. Return on capital employed was selected as a performance metric because it effectively demonstrates how we are able to utilize available capital to generate and maximize profits. Net sales was selected as a performance metric because it is indicative of our financial performance and the effectiveness of our geographic and customer retention and acquisition strategies.
As described below, the primary elements of our executive compensation program are annual base salary, annual short-term cash incentives, long-term equity incentives, and retirement and termination benefits. Together, these items are intended to be complementary and serve the goals described above. The Committee, however, does not have any formal policies or guidelines for allocating compensation between short-term and long-term compensation, between cash and non-cash compensation or among different forms of cash and non-cash compensation.
Decision-Making Responsibility
Role of the Committee and Management in Compensation Decisions
Our executive compensation program is developed and overseen by the Committee, which is currently comprised of three directors affiliated with our Sponsors. The Committee is responsible for approving, and making all decisions regarding, the compensation of our named executive officers. In making these decisions, the Committee takes into account the views and recommendations of management, in particular our Chief Executive Officer and our Senior Vice President, Chief People Officer. Our Chief Executive Officer and Senior Vice President, Chief People Officer make recommendations about annual base salary increases, annual short-term incentive targets and long-term equity grants for our named executive officers (other than for themselves) within the context, and working within the parameters, of the Company’s annual budget for base salary increases and the size of the equity pool, in each case, available to all employees generally for the relevant fiscal year, as further described below.
Use of Compensation Consultants
In late 2013 and early 2014, the Company engaged Mercer Consulting, Inc. (“Mercer”), a nationally known compensation consulting firm, on a limited basis to provide market data, including market surveys and limited peer group data, relating to the total base compensation opportunities of
100
Table of Contents
our named executive officers, and to review the cash and equity-based compensation of our Chief Executive Officer, Chief Financial Officer, and Chief Merchandising Officer against market data prior to their annual performance reviews. See “Compensation setting process—Role of market data” below.
As part of our preparation to become a public company, the Committee plans to engage an independent consultant to provide a broader range of compensation consulting services going forward. These services are expected to include a review and analysis of our executive compensation levels and practices, board remuneration, executive officer and non-employee director ownership guidelines, peer group composition and long-term incentive plan design and grant practices.
Compensation Setting Process
For each named executive officer, the Committee has generally used survey market data and, for certain of our named executive officers, peer group data, as one factor to assist it in setting annual base salary, the target level of annual short-term cash incentives and, on a more limited basis, long-term incentive awards. Our Chief Executive Officer and Senior Vice President, Chief People Officer also review this data when making their compensation recommendations to the Committee, within the parameters described above.
Role of Market Data
Market surveys. The Committee reviews annually the total cash compensation opportunities of our named executive officers in light of available market data from surveys. As part of this review, the Committee is presented with information from surveys of executive compensation data from public and private companies within the retail sector with similar revenue and scope of operations.
The Committee generally sets base salary and target annual short-term cash incentive amounts that will result in total cash compensation opportunities of our named executive officers between approximately the 50th and 75th percentiles of the market survey group, after taking into account the other factors described below.
We have also used survey data of this type on a limited basis when determining the size of equity award grants and have used this survey data to develop general, non-binding Company guidelines against which equity awards have been evaluated. These guidelines cover employees at each of our senior executive levels, including our named executive officers, and set forth proposed long-term target award values for each job level, based on market survey data reflecting target award values for employees with similar salaries. These guidelines serve as a market check and are only one factor considered by the Committee when determining the size of equity awards.
Limited review of peer companies in 2014. As noted above, we engaged Mercer in late 2013 and early 2014 to provide an additional source of market data on the total compensation of chief executive officers, chief financial officers, and chief merchandising officers at our peer companies. We selected the following peer group companies through discussions with, and recommendations from, Mercer: Advance Auto Parts, American Eagle Outfitters, Big Lots, Cabelas, Dick’s Sporting Goods, Dollar Tree, Foot Locker, O’Reilly Automotive, OfficeMax, PetSmart, RadioShack, Sally Beauty Holdings, Inc., Tractor Supply, and Williams Sonoma.
The peer companies selected for this purpose are companies with which we compete for executive talent, and whose revenues range between 50% and 200% of our revenue. Peer companies were not pre-screened for their compensation levels or practices. For future years, the Committee, working with an independent consultant and management, intends to re-evaluate, and may make changes to, this list of peer companies.
101
Table of Contents
Other than the use of market survey and peer group data, we have not regularly engaged in formal peer group benchmarking with respect to our named executive officers. As we transition to a publicly traded company, the Committee may rely more heavily on market data and benchmarking of peer company compensation, which could result in changes in the level, timing and elements of compensation that we may use in the future for our named executive officers.
Internal Pay Equity and Other Factors
We take into account factors other than market and peer group data in setting base salary, annual short-term cash incentives and long-term equity incentives, which are the elements of total direct compensation. Such factors include internal pay equity, the experience and length of service of the executive, relative responsibilities among members of our executive team, contributions by the executive and business conditions. In addition, the Committee has also relied on the experience of the Sponsor-affiliated members of the Committee who consider the compensation of our executive team in light of the compensation structure of other portfolio companies or private equity-backed companies in general.
For elements of compensation other than total direct compensation, such as severance and change in control benefits, the Committee relies on its own business experience and familiarity with market conditions in determining the appropriate level of benefits for our named executive officers.
Elements of Compensation
The following is a discussion of the primary elements of the compensation for each of our named executive officers.
Annual Base Salary
We pay our named executive officers a base salary to provide them with a fixed, base level of compensation commensurate with the executive’s skill, competencies, experience and performance.
Base salaries are reviewed annually in March of each year, and the Committee makes adjustments to reflect individual and Company performance as well as survey and peer group data, as applicable. Our Chief Executive Officer and our Senior Vice President, Chief People Officer make recommendations to the Committee regarding base salary adjustments for our named executive officers (except with respect to their own salaries). These recommendations are generally based upon the executive’s individual contributions to the Company for the prior fiscal year, leadership and contribution to Company performance, internal pay considerations, as well as market conditions and survey data and the Company’s overall budget for base salary increases for Company employees generally. The Committee takes all of these factors into account when making its decisions on base salaries, but does not assign any specific weight to any one factor. In addition to the annual base salary review, the Committee may also adjust base salaries at other times during the year in connection with promotions, increased responsibilities or to maintain competitiveness in the market.
102
Table of Contents
The chart below provides the base salary for each of our named executive officers for fiscal 2014, and a comparison against their base salaries for fiscal 2013.
| Named executive officer |
Fiscal 2013 base salary |
Fiscal 2014 base salary |
||||||
| James Myers(1) |
$ | 1,000,000 | $ | 1,000,000 | ||||
| Lawrence Rutkowski |
— | $ | 600,000 | (2) | ||||
| Bradley Weston |
$ | 618,000 | $ | 650,000 | (3) | |||
| Thomas Farello |
$ | 535,500 | $ | 546,000 | ||||
| Charles Piscitello |
$ | 453,900 | $ | 465,000 | ||||
| Elisabeth Charles |
$ | 471,740 | $ | 480,000 | ||||
| (1) | The Committee did not increase Mr. Myers’ annual base salary for fiscal 2014, and his annual base salary remained at the level set in fiscal 2013. In addition to his duties as Chief Executive Officer and President, Mr. Myers informally served as interim Chief Financial Officer for the period of fiscal 2014 during which Mr. Rutkowski was not employed by the Company. Mr. Myers did not receive additional compensation for services performed as interim Chief Financial Officer. |
| (2) | Mr. Rutkowski’s base salary was established when he commenced employment with us on April 28, 2014 and was based on the Committee’s review of competitive market data and compensation with his former employer. |
| (3) | For 2014, the Committee increased Mr. Weston’s base salary in recognition of his additional title and responsibilities as President, Unleashed by Petco, effective March 19, 2014. |
On April 13, 2015, Mr. Nuzzo became our Executive Vice President and Chief Financial Officer. Pursuant to the terms of his employment agreement, Mr. Nuzzo receives a base salary of $575,000.
Short-term Cash Incentive Program
We believe that the opportunity to earn an annual cash incentive should be based upon actual performance measured against specified key business and financial metrics.
Each of our named executive officers participates in our Corporate Incentive Bonus Plan (the “Incentive Plan”) and is eligible for a target annual bonus that is equal to a percentage of his or her annual base salary. For fiscal 2014, the target annual bonus for each of our named executive officers was as follows:
| Named executive officer |
Target annual bonus as a percentage of annual base salary |
|||
| James Myers |
120 | % | ||
| Lawrence Rutkowski |
80 | % | ||
| Bradley Weston |
80 | % | ||
| Thomas Farello |
60 | % | ||
| Charles Piscitello |
50 | % | ||
| Elisabeth Charles |
50 | % | ||
These target bonus percentages were not changed from fiscal 2013 to fiscal 2014.
At the beginning of each fiscal year, the Committee establishes each named executive officer’s target bonus amount as well as the performance metrics under the Incentive Plan. Annual bonuses for our named executive officers are based entirely on the achievement of Company performance goals. For fiscal 2014, the Committee chose EBITDA, net sales and return on capital employed (each as defined and described above) as the performance metrics under the Incentive Plan, with EBITDA weighted at 80%, net sales at 10% and return on capital employed at 10%. For each performance metric, the Committee sets threshold, target and maximum goals that it believed to be reasonable, and
103
Table of Contents
that reflected current business conditions and our business plan and budget for the fiscal year, and reserves the right to make adjustments to such goals based on non-recurring events during the fiscal year that were not otherwise in the purview of the Committee when setting such goals. It is the Committee’s view that threshold levels of performance should have a higher probability of achievement and maximum levels should have lower probability of achievement, and that payouts associated with each should serve as significant incentive to participants. Achievement of a particular performance metric at the threshold level of performance results in 25% of the portion of the bonus associated with such metric being earned, achievement at target results in 100% of the portion of the bonus associated with such metric being earned and achievement at maximum results in 200% of that portion of the bonus being earned. If actual performance is greater than the target performance goal but is less than the maximum performance goal, or if actual performance is greater than the threshold performance goal but is less than the target performance goal, the amount that is earned is interpolated between the two applicable points on a straight-line basis.
For fiscal 2014, the Committee established a target EBITDA level, net sales level and return on capital employed percentage equal to $455.2 million, $4.117 billion and 22.20%, respectively.
Following the end of fiscal 2014, the Committee reviewed and determined the level of achievement for each performance metric. After reviewing the level of EBITDA achieved for fiscal 2014 and the recommendation by management that certain non-occurring items should be excluded from the calculation of EBITDA, the Committee determined that it was appropriate to exclude from the calculation of EBITDA costs associated with certain restructurings and legal and consulting fees. After adjusting EBITDA for these costs, EBITDA was determined to be $441.7 million, which, when taken together with the level of net sales and return on capital employed achieved for fiscal 2014 ($3.995 billion and 21.42%, respectively), resulted in achievement of 55.1% of the corporate performance goals. As a result, each named executive officer who was employed at the end of fiscal 2014 earned an annual cash incentive equal to his target annual bonus multiplied by 55.1%.
The actual amount earned by each of our named executive officers as a percentage of his target annual bonus in respect of fiscal 2014 is set forth in the table below.
| Named executive officer(1) |
2014 total bonus | |||
| James Myers |
$ | 661,200 | ||
| Bradley Weston |
$ | 286,520 | ||
| Thomas Farello |
$ | 180,508 | ||
| Charles Piscitello |
$ | 128,108 | ||
| (1) | Mr. Rutkowski’s employment with the Company terminated effective December 1, 2014, and Ms. Charles’ employment with the Company terminated effective August 22, 2014. Neither executive was entitled to an annual bonus under the Incentive Plan for the year of termination. However, in connection with their terminations of employment, Mr. Rutkowski and Ms. Charles received payments of $157,630 and $72,732, respectively, which reflect their annual bonuses for the year of termination based on actual performance, pro-rated for the number of days each was employed during the fiscal year. |
Long-Term Equity Incentive Awards
We use long-term equity incentive awards both to align the interests of our named executive officers with those of our stockholders and to encourage retention through the use of service-based vesting requirements. We believe that strong returns for our stockholders are achieved through a culture that focuses on long-term performance by our named executive officers.
104
Table of Contents
We maintain two equity compensation plans—the 2006 Key Management Incentive Award Plan (the “2006 Management Incentive Plan”) and the 2006 Senior Executive Incentive Award Plan (the “2006 Executive Incentive Plan,” and together, the “2006 Equity Plans”). The 2006 Equity Plans are identical in all material respects, except that the 2006 Executive Incentive Plan provides for grants only to certain eligible individuals who qualify as accredited investors under applicable securities laws. Our named executive officers receive grants of equity awards under our 2006 Executive Incentive Plan. Other than grants of RSUs to certain newly hired executives, the only equity awards we have granted to our named executive officers have been in the form of stock options.
In fiscal 2013, we implemented a practice of making annual grants to our executives and employees in order to be more in line with companies that we compete with for executive talent. Prior to this time, we had granted stock options to our executive officers in connection with our acquisition by the Sponsors in 2006 (with respect to those executives who employed at the time of, or shortly following, such acquisition) and stock options, and in certain cases, RSUs, in connection with new hires.
Stock options granted to our named executive officers generally are subject to time-based vesting over a five-year period. A portion of the options that are subject to time-based vesting conditions also have an annual accreting exercise price (that is, an exercise price that increases by a pre-determined amount each year). The Committee believes that time-vesting options reinforce our goals of retaining key executives and creating value for our stockholders. As discussed below under “Potential Payments Upon Termination or Change of Control,” stock options are subject to accelerated vesting in limited circumstances relating to change in certain control events.
Each year the Committee establishes an aggregate pool size for stock option grants for all eligible Company employees, which is then allocated among our named executive officers and other key employees. For fiscal 2014, each of our named executive officers received a stock option grant, the size of which was determined by the Committee based on recommendations of our Chief Executive Officer and Senior Vice President, Chief People Officer, which took into account the executive’s performance, the executive’s then-held long-term incentives, and a review of market survey and peer group data, as applicable. Mr. Rutkowski received a grant of stock options in connection with his commencement of employment on April 28, 2014, the amount of which was based on the Committee’s review of competitive market data and Mr. Rutkowski’s compensation with his former employer. For additional information regarding equity grants to our named executive officers for fiscal 2014, see “Grants of Plan Based Awards” below.
The completion of this offering will not result in any acceleration of vesting of outstanding stock options or other equity awards held by our named executive officers.
Retirement Programs
All of our named executive officers (other than Mr. Rutkowski and Ms. Charles) participate in our 401(k) plan (a tax-qualified defined contribution plan), which is a broad-based retirement plan in which generally all of our employees can participate. Under the 401(k) plan, we make discretionary matching contributions which, for our named executive officers, is 50% of an employee’s contributions on the first 3% of base salary deferred, subject to certain limits under the Internal Revenue Code of 1986, as amended (the “Code”), and employees vest ratably in Company matching contributions over a period of five years of service.
All of our named executive officers (other than Mr. Rutkowski and Ms. Charles) also participate in our nonqualified deferred compensation plan (a non-tax-qualified retirement plan), which provides eligible employees with an opportunity to defer a portion of their annual base salary and bonus. Under the nonqualified deferred compensation plan, we make a matching contribution of 50% of an eligible
105
Table of Contents
employee’s contributions on the first 3% of base salary deferred (or 6% if the eligible employee is not eligible to participate in our 401(k) plan), and a matching contribution of 50% of an eligible employee’s contributions on the first 6% of annual bonus deferred. The nonqualified deferred compensation plan is described further in the “Nonqualified Deferred Compensation” section below.
We believe that our retirement programs serve as an important tool to attract and retain our named executive officers and other key employees. We also believe that offering the ability to create stable retirement benefits encourages our named executive officers and other key employees to make a long-term commitment to us.
Severance and Change in Control Arrangements
We provide severance protection to Messrs. Myers, Weston and Piscitello in their employment agreements, and to Mr. Farello in his retention agreement. Mr. Rutkowski and Ms. Charles received severance in connection with the terminations of their respective employment, as further described below. Our severance and change in control protections are designed to be fair and competitive in order to aid in attracting and retaining experienced executives, including our named executive officers. Certain limited change in control-related protections for our named executive officers apply to their stock options and Mr. Myers is entitled to a tax gross-up payment in connection with certain change in control payments, as described below under “Potential payments upon termination or change in control.”
Employment Agreement with Mr. Nuzzo
As described above, we entered into an employment agreement with Mr. Nuzzo on April 8, 2015, under which Mr. Nuzzo became our Executive Vice President and Chief Financial Officer, effective April 13, 2015. Under his employment agreement, Mr. Nuzzo is entitled to an annual base salary of $575,000, and an annual cash bonus for each fiscal year based on pre-established Company performance goals, with a target annual cash bonus for our 2015 fiscal year equal to 80% of his annual base salary. In connection with his commencement of employment, Mr. Nuzzo was also granted an option to purchase 4,000,000 shares of our common stock under our 2006 Executive Incentive Plan. In addition, Mr. Nuzzo’s employment agreement provides severance protection in connection with certain terminations of employment, provided he timely executes (without revoking) a release of claims in favor of us, and further requires that Mr. Nuzzo comply with certain restrictive covenants.
Perquisites
Perquisites are provided to help us attract and retain top performing employees for key positions as well as for the reasons described below. All of our executives are offered financial, investment, estate and tax planning services in order to allow them to devote more time and resources to the Company. We also offer our executives the opportunity to have a Company-paid annual physical examination as a means of maintaining the health and well-being of our executives. In addition, we have provided our named executive officers with relocation benefits to facilitate their relocation in connection with their commencement of employment with us. In order to encourage team building within our organization, we have also paid for members of our senior management, including Messrs. Myers and Farello, to attend the Company’s annual Champions Circle Trip, which is a recognition award provided to certain high performing store managers, and we have provided all attendees with a gross-up on the taxes associated with such benefit. Lastly, our full-time employees, including our named executive officers, are provided with certain benefits, such as a discount on Company products and pet services.
106
Table of Contents
The costs associated with these perquisites (other than the benefits offered to all of our full-time employees) are included in the Summary Compensation Table.
Risk Assessment
The Committee has reviewed our compensation programs and has concluded that the risks arising from our compensation practices are not reasonably likely to have a material adverse effect on us.
Tax Deductibility
Because our common stock is not currently publicly traded, executive compensation paid in fiscal 2014 was not subject to Section 162(m) of the Code, which limits the deductibility of compensation paid to certain individuals to $1 million, excluding qualifying performance-based compensation and certain other compensation. Following this offering, at such time as we are subject to the deduction limitations under Section 162(m) of the Code, we expect that the Committee will consider the impact of Section 162(m) of the Code when structuring our executive compensation arrangements with our named executive officers. However, the Committee will retain flexibility to approve compensation arrangements that promote the objectives of the compensation program but that may not qualify for full or partial tax deductibility.
Summary Compensation Table
The following table sets forth information regarding the compensation awarded to, earned by or paid to each of our named executive officers during fiscal 2014.
| Name and principal position |
Fiscal year |
Salary ($)(1) | Option awards ($)(2) |
Non-equity incentive plan compensation ($)(3) |
All other compensation ($)(6) |
Total ($) | ||||||||||||||||||
| James Myers |
2014 | 1,000,000 | 927,500 | 661,200 | 150,525 | 2,739,225 | ||||||||||||||||||
| Chief Executive Officer and President |
||||||||||||||||||||||||
| Lawrence Rutkowski |
2014 | (4) | 300,000 | 2,116,800 | — | 1,583,744 | 4,000,544 | |||||||||||||||||
| Former Executive Vice President and Chief Financial Officer |
||||||||||||||||||||||||
| Bradley Weston |
2014 | 650,000 | 397,500 | 286,520 | 520,599 | 1,854,619 | ||||||||||||||||||
| Executive Vice President, Chief Merchandising Officer, and President, Unleashed by Petco |
||||||||||||||||||||||||
| Thomas Farello |
2014 | 546,000 | 238,500 | 180,508 | 79,214 | 1,044,222 | ||||||||||||||||||
| Senior Vice President, Operations |
||||||||||||||||||||||||
| Charles Piscitello |
2014 | 465,000 | 185,500 | 128,108 | 183,646 | 962,254 | ||||||||||||||||||
| Senior Vice President, Chief People Officer |
||||||||||||||||||||||||
| Elisabeth Charles |
2014 | (5) | 267,692 | 191,772 | — | 893,453 | 1,352,917 | |||||||||||||||||
| Former Senior Vice President, Chief Marketing Officer |
||||||||||||||||||||||||
| (1) | Amounts shown in this column are not reduced to reflect the named executive officer’s elections, if any, to defer receipt of compensation into either the Company’s 401(k) plan or nonqualified deferred compensation plan. |
| (2) | Represents the aggregate grant date fair value of stock option awards granted to each of our named executive officers in fiscal 2014 computed in accordance with FASB ASC Topic 718, excluding the effect of estimated forfeitures. The underlying valuation assumptions for stock option awards are discussed in Note 13 to our consolidated financial statements for the fiscal year ended January 31, 2015, included elsewhere in this prospectus. Each of Mr. Rutkowski and Ms. Charles forfeited the stock options that were granted to them in fiscal 2014 upon the terminations of their respective employment. In addition, in connection with Ms. Charles’ termination of employment, certain of her outstanding options were modified to extend the exercise period of such options until February 22, 2016. For Ms. Charles, the amount set forth in this column also includes $6,272, which represents the incremental fair value associated with this modification, calculated as of the modification date and computed in accordance with FASB ASC Topic 718. |
107
Table of Contents
| (3) | Represents the annual cash bonuses paid to Messrs. Myers, Weston, Farello and Piscitello under the Incentive Plan with respect to fiscal 2014. |
| (4) | Mr. Rutkowski joined the Company as Executive Vice President and Chief Financial Officer on April 28, 2014, and his employment with the Company terminated on December 1, 2014. The amounts shown for Mr. Rutkowski for 2014 reflect his compensation for the portion of fiscal 2014 during which he was employed by the Company, together with certain payments in connection with his termination of employment as further described in footnote (i) to the table that immediately follows. |
| (5) | Ms. Charles terminated employment with the Company on August 22, 2014. The amounts shown for Ms. Charles for fiscal 2014 reflect her compensation for the portion of fiscal 2014 during which she was employed by the Company, together with certain payments in connection with her termination of employment as further described in footnote (i) to the table that immediately follows. |
| (6) | Amounts included in the “All other compensation” column for our named executive officers include the following: |
| Name |
401(k) company match contributions ($)(a) |
Nonqualified deferred compensation company match contributions ($)(b) |
Executive physicals ($)(c) |
Company paid premiums for life insurance coverage ($)(d) |
Financial planning and tax preparation ($)(e) |
Company awards ($)(f) |
Relocation expenses ($)(g) |
Payments in respect of 2012 Recapitalization ($)(h) |
Severance ($)(i) |
Total ($)(j) |
||||||||||||||||||||||||||||||
| James Myers |
3,900 | 60,435 | 2,055 | 1,080 | 18,815 | 10,240 | — | 54,000 | — | 150,525 | ||||||||||||||||||||||||||||||
| Lawrence Rutkowski |
— | — | — | 540 | — | — | 115,342 | — | 1,467,862 | 1,583,744 | ||||||||||||||||||||||||||||||
| Bradley Weston |
3,954 | — | — | 1,080 | 18,815 | — | — | 496,750 | — | 520,599 | ||||||||||||||||||||||||||||||
| Thomas Farello |
3,918 | 17,201 | 3,350 | 1,080 | 8,000 | 5,025 | — | 40,640 | — | 79,214 | ||||||||||||||||||||||||||||||
| Charles Piscitello |
3,314 | 15,978 | 2,364 | 1,080 | 18,815 | 25 | — | 142,070 | — | 183,646 | ||||||||||||||||||||||||||||||
| Elisabeth Charles |
3,240 | 16,606 | — | 582 | — | — | — | 196,650 | 676,375 | 893,453 | ||||||||||||||||||||||||||||||
| (a) | Represents our matching contributions to our 401(k) plan, which is a broad-based tax-qualified defined contribution plan. |
| (b) | Represents our matching contributions to our nonqualified deferred compensation plan, which is a non-tax-qualified defined contribution plan. |
| (c) | Represents the value of an annual physical for each named executive officer who elected to utilize this benefit. |
| (d) | Represents Company-paid premiums for life insurance. |
| (e) | Represents the value of Company-paid financial planning and tax preparation assistance for each named executive officer who elected to utilize this benefit. |
| (f) | Represents the cost of certain Company awards, including (i) the amount of a gift card paid to Mr. Piscitello under the Company’s employee recognition program, which recognizes individuals for their contributions to the Company, and (ii) Messrs. Myers’ and Farello’s trips to the Company-sponsored Champions Circle Trip and a gross-up on the taxes associated with this trip. For Mr. Myers, the cost of such trip was $4,897 and the amount of the gross-up was $5,343. For Mr. Farello, the cost of such trip was $3,651 and the amount of the gross-up was $1,374. |
| (g) | Represents the value of expenses associated with Mr. Rutkowski’s relocation to San Diego, California. |
| (h) | Represents amounts payable to the executives in respect of their unvested options (in the case of Messrs. Myers, Weston, Farello, and Piscitello and Ms. Charles, equal to $54,000, $129,000, $40,640, $142,040 and $196,650, respectively) and unvested RSUs (in the case of Mr. Weston, equal to $367,750) in connection with the 2012 Recapitalization. For a description of the 2012 Recapitalization, see “—Adjustments to equity incentive awards” below. |
| (i) | Mr. Rutkowski’s and Ms. Charles’ employment with the Company terminated on December 1, 2014, and August 22, 2014, respectively. In connection with such terminations of employment, Mr. Rutkowski and Ms. Charles received the following payments: severance pay of $900,000 and $568,000, respectively; a bonus of $157,630 and $72,732, respectively, which is based on the amount the executive would have received had he or she remained employed with the Company and received an annual bonus pursuant to the Incentive Plan for fiscal 2014, pro-rated based on the executive’s actual days of service during fiscal 2014; Company-paid COBRA continuation coverage for 18 months (for Mr. Rutkowski) and 12 months (for Ms. Charles) of $9,092 and $9,428, respectively; for Ms. Charles, Company-paid financial planning and tax preparation assistance of $18,815 and outplacement services of $7,000; and, for Mr. Rutkowski, Company-paid commission and closing expenses of $391,140, relating to the sale of his residence in connection with his commencement of employment, and Company-paid legal expenses of $10,000 incurred in connection with the negotiation of his separation agreement. |
| (j) | On certain occasions, a guest of a named executive officer accompanied him or her on the Company aircraft for business-related travel, such as to attend a Sponsor’s annual meeting. No amounts have been included in the Summary Compensation Table in respect of such travel because the Company determined that there was no incremental cost to the Company associated with such travel. |
108
Table of Contents
Grants of Plan-Based Awards
The following table sets forth information regarding plan-based awards made to each of our named executive officers during fiscal 2014.
| Potential future payouts under non-equity incentive plan awards(1) |
Option awards (6) |
Exercise price of option awards ($/sh)(8) |
Grant date fair value of option awards ($)(9) |
|||||||||||||||||||||||||||
| Name |
Type of award |
Grant date |
Threshold ($)(2) |
Target ($)(3) |
Maximum ($)(4) |
|||||||||||||||||||||||||
| James Myers |
Annual Incentive Stock Options |
3/19/2014 | 300,000 | 1,200,000 | 2,400,000 | 1,750,000 | 2.00 | 927,500 | ||||||||||||||||||||||
| Lawrence Rutkowski |
Annual Incentive Stock Options |
5/1/2014 | 81,534 | (5) | 326,137 | (5) | 652,274 | (5) | 4,000,000 | (7) | 2.00 | 2,116,800 | ||||||||||||||||||
| Bradley Weston |
Annual Incentive Stock Options |
3/19/2014 | 130,000 | 520,000 | 1,040,000 | 750,000 | 2.00 | 397,500 | ||||||||||||||||||||||
| Thomas Farello |
Annual Incentive Stock Options |
3/19/2014 | 81,900 | 327,600 | 327,600 | 450,000 | 2.00 | 238,500 | ||||||||||||||||||||||
| Charles Piscitello |
Annual Incentive Stock Options |
3/19/2014 | 58,125 | 232,500 | 465,000 | 350,000 | 2.00 | 185,500 | ||||||||||||||||||||||
| Elisabeth Charles |
Annual Incentive Stock Options |
3/19/2014 | 60,000 | 240,000 | 480,000 | 350,000 | (7) | 2.00 | 185,500 | |||||||||||||||||||||
| (1) | Represents annual cash bonus opportunities granted under the Incentive Plan. As described in “—Short-term cash incentive program” above, each named executive officer was eligible to receive a target annual bonus that is equal to a percentage of his or her annual base salary. The actual amount paid to our actively employed named executive officers under the Incentive Plan for fiscal 2014 is reflected in the Summary Compensation Table above. |
| (2) | Under the Incentive Plan, if our actual EBITDA, net sales and return on capital employed for fiscal 2014 had been achieved at the applicable threshold levels, as determined by the Committee, 25% of the annual bonus would have been earned. See “—Short-term cash incentive program.” |
| (3) | Under the Incentive Plan, if actual EBITDA, net sales and return on capital employed for fiscal 2014 had been achieved at target levels, 100% of the annual bonus would have been earned. See “—Short-term cash incentive program.” |
| (4) | Under the Incentive Plan, if actual EBITDA, net sales and return on capital employed for fiscal 2014 had been achieved at maximum levels, 200% of the annual bonus would have been earned. See “—Short-term cash incentive program.” |
| (5) | The cash bonus opportunity for Mr. Rutkowski was pro-rated to reflect the fact that he commenced employment with the Company on April 28, 2014. |
| (6) | All awards included in this column are options to purchase shares of our common stock granted under the Company’s 2006 Executive Incentive Plan. |
| (7) | In connection with Mr. Rutkowksi’s and Ms. Charles’ terminations of employment, each executive forfeited the stock options granted to him or her during fiscal 2014. |
| (8) | The exercise price of the stock options is not less than the fair market value of a share of our common stock on the date of grant, as determined by our Board of Directors following a review of a valuation provided by a third-party valuation firm. |
| (9) | Amounts shown in this column reflect the fair value of the stock option awards on the date of grant determined in accordance with ASC Topic 718, excluding the effect of estimated forfeitures. The underlying valuation assumptions for option awards are further discussed in Note 13 to our consolidated financial statements for fiscal year ended January 31, 2015, included elsewhere in this prospectus. |
Narrative Disclosure to Summary Compensation Table and Grants of Plan-Based Awards Table
We are party to an employment agreement with Mr. Myers, dated October 26, 2006, which was amended on December 31, 2008 and December 26, 2012. The agreement had an initial five-year term and the term now automatically renews on each October 26, unless either party gives a notice of non-renewal at least 90 days in advance. Mr. Myers’ employment agreement provides for an initial base salary, subject to upward adjustment by the Committee, which was $1,000,000 for fiscal 2014. Mr. Myers is also eligible to earn an annual cash bonus for each fiscal year based on pre-established Company performance goals and his target annual bonus was 120% of his annual base salary for fiscal 2014. Mr. Myers is also entitled to participate in our retirement and welfare benefit plans and to receive an annual executive physical and financial planning and tax services.
We are also party to an employment agreement with Mr. Weston, dated October 17, 2011. Mr. Weston’s employment agreement provides for an initial base salary, subject to adjustment by the
109
Table of Contents
Committee, which was $650,000 for fiscal 2014. Mr. Weston is also entitled to earn an annual cash bonus for each fiscal year based on pre-established Company performance goals and his target annual bonus was 80% of his annual base salary for fiscal 2014. Mr. Weston is also entitled to participate in our retirement and welfare benefit plans and to receive an annual executive physical and financial planning and tax services.
We are also party to an employment agreement with Mr. Piscitello, dated September 7, 2010. Mr. Piscitello’s employment agreement provides for an initial base salary, subject to adjustment by the Committee, which was $465,000 for fiscal 2014. Mr. Piscitello is also eligible to earn an annual cash bonus for each fiscal year based on pre-established Company performance goals and his target annual bonus was 50% of his annual base salary for fiscal 2014. Mr. Piscitello is also entitled to participate in our retirement and welfare benefit plans and to receive an annual executive physical and financial planning and tax services.
We are also party to an offer letter with Mr. Farello, dated July 28, 2006. Mr. Farello’s offer letter provides for an initial base salary, which was $546,000 for fiscal 2014. Mr. Farello is also entitled to earn an annual cash bonus for each fiscal year based on pre-established Company performance goals and his target annual bonus was 60% of his annual base salary for fiscal 2014. Mr. Farello is also entitled to participate in our retirement and welfare benefit plans and to receive an annual executive physical and financial planning and tax services.
In connection with his termination of employment, Mr. Rutkowski entered into a separation agreement with the Company, effective December 1, 2014. In addition, Ms. Charles entered into a separation agreement with the Company in connection with her termination of employment, effective August 22, 2014. Payments made to Mr. Rutkowski and Ms. Charles pursuant to their respective separation agreements are included in the “All other compensation” column of the Summary Compensation Table and further described in the footnotes thereto.
For a description of the payments and benefits our named executive officers may be (or were, in the case of Mr. Rutkowski and Ms. Charles) entitled to in connection with a termination of employment, see “—Potential payments upon termination or change in control.”
110
Table of Contents
Outstanding Equity Awards at Fiscal Year End
The following table sets forth information regarding equity awards held by our named executive officers as of January 31, 2015, the last day of our 2014 fiscal year.
| Name |
Number of securities underlying unexercised options (exercisable) ($) |
Number of securities underlying unexercised options (unexercisable) (#) |
Option exercise price ($)(1) |
Option expiration date |
||||||||||||
| James Myers |
3,134,219 | — | 1.33 | (2) | 12/13/2016 | |||||||||||
| 365,669 | — | 0.20 | (2)(3)(4)(5) | 12/13/2016 | ||||||||||||
| 819,862 | — | 0.22 | (2)(3)(4) | 12/13/2016 | ||||||||||||
| 2,618,438 | — | 1.00 | (3) | 12/13/2016 | ||||||||||||
| 800,000 | 800,000 | 0.28 | (4) | 11/28/2021 | ||||||||||||
| 400,000 | — | 0.98 | (4) | 11/28/2021 | ||||||||||||
| 350,000 | 1,400,000 | 2.00 | 3/20/2023 | |||||||||||||
| — | 1,750,000 | 2.00 | 2/19/2024 | |||||||||||||
| Lawrence Rutkowski |
— | — | — | — | ||||||||||||
| Bradley Weston |
2,000,000 | 2,000,000 | 0.20 | (4) | 10/17/2021 | |||||||||||
| 600,000 | — | 0.89 | (4) | 10/17/2021 | ||||||||||||
| 100,000 | 400,000 | 2.00 | 3/20/2023 | |||||||||||||
| — | 750,000 | 2.00 | 2/19/2024 | |||||||||||||
| Thomas Farello |
500,000 | — | 1.33 | (2) | 12/13/2016 | |||||||||||
| 29,167 | — | 0.20 | (2)(3)(4)(5) | 12/13/2016 | ||||||||||||
| 120,833 | — | 0.22 | (2)(3)(4) | 12/13/2016 | ||||||||||||
| 58.335 | — | 1.25 | (2)(3)(4)(5) | 12/13/2016 | ||||||||||||
| 241,665 | — | 1.37 | (2)(3)(4) | 12/13/2016 | ||||||||||||
| 224,571 | — | 1.00 | (3) | 12/13/2016 | ||||||||||||
| 50,000 | — | 1.18 | (2) | 4/1/2018 | ||||||||||||
| 19,445 | — | 0.20 | (2)(3)(4)(5) | 4/1/2018 | ||||||||||||
| 47,222 | 33,333 | 0.25 | (2)(3)(4) | 4/1/2018 | ||||||||||||
| 6,482 | — | 1.25 | (2)(3)(4)(5) | 4/1/2018 | ||||||||||||
| 26,851 | — | 1.53 | (2)(3)(4) | 4/1/2018 | ||||||||||||
| 50,000 | — | 0.18 | (3)(4) | 4/1/2018 | ||||||||||||
| 280,000 | 280,000 | 0.28 | (4) | 11/28/2021 | ||||||||||||
| 90,000 | 360,000 | 2.00 | 3/20/2023 | |||||||||||||
| — | 450,000 | 2.00 | 3/19/2024 | |||||||||||||
| Charles Piscitello |
300,000 | — | 1.30 | (2) | 3/26/2017 | |||||||||||
| 90,000 | — | 0.23 | (2)(3)(4) | 3/26/2017 | ||||||||||||
| 17,500 | — | 1.25 | (2)(3)(4)(5) | 3/26/2017 | ||||||||||||
| 72,500 | — | 1.41 | (2)(3)(4) | 3/26/2017 | ||||||||||||
| 450,000 | — | 1.00 | (3) | 3/26/2017 | ||||||||||||
| 150,000 | — | 1.18 | (2) | 4/1/2018 | ||||||||||||
| 100,000 | 100,000 | 0.25 | (2)(3)(4)(5) | 4/1/2018 | ||||||||||||
| 19,445 | — | 1.25 | (5) | 4/1/2018 | ||||||||||||
| 80,555 | — | 1.53 | (2)(3)(4)(5) | 4/1/2018 | ||||||||||||
| 150,000 | — | 0.18 | (3)(4) | 4/1/2018 | ||||||||||||
| 7,819 | — | 0.18 | (3)(4) | 4/1/2008 | ||||||||||||
| 300,000 | — | 1.00 | (3)(4) | 4/1/2018 | ||||||||||||
| 280,000 | 280,000 | 0.28 | (4) | 11/28/2021 | ||||||||||||
| 140,000 | — | 0.98 | (4) | 11/28/2021 | ||||||||||||
| 70,000 | 280,000 | 2.00 | 3/20/2023 | |||||||||||||
| — | 350,000 | 2.00 | 3/19/2024 | |||||||||||||
111
Table of Contents
| Name |
Number of securities underlying unexercised options (exercisable) ($) |
Number of securities underlying unexercised options (unexercisable) (#) |
Option exercise price ($)(1) |
Option expiration date |
||||||||||||
| Elisabeth Charles(6) |
206,165 | — | 0.50 | (3)(4) | 3/2/2019 | |||||||||||
| 200,000 | — | 0.89 | (4) | 8/1/2021 | ||||||||||||
| (1) | The exercise price of all stock options was originally not less than 100% of the fair market value of a share of our common stock on the date the options were granted, as determined by our Board of Directors based, in part, on an independent third party valuation. |
| (2) | Messrs. Myers, Farello and Piscitello participated in our 2009 Option Exchange. For a description of the 2009 Option Exchange, see “—Adjustments to equity incentive awards” below. |
| (3) | In connection with the 2010 Recapitalization, the exercise price of each unvested option was reduced by the amount of $0.8612 to reflect the dividend payment. For a description of the 2010 Recapitalization, see “—Adjustments to equity incentive awards” below. |
| (4) | In connection with the 2012 Recapitalization, the exercise price of each unvested option was reduced by the per-share dividend amount of $0.7355, subject to a floor of $0.20 and, if the exercise price was not reduced by the full amount of the dividend, the remainder was granted to the option holder as a dividend-equivalent cash bonus, subject to the same vesting schedule as the unvested option and payable on the last day of the calendar quarter following the vesting date. For a description of the 2012 Recapitalization, see “—Adjustments to equity incentive awards” below. |
| (5) | Reflects stock options, the accreting exercise price of which became fixed as of the date of the 2012 Minority Sale. For a description of the 2012 Minority Sale, see “—Adjustments to equity incentive awards” below. |
| (6) | In connection with Ms. Charles’ termination of employment, certain of her outstanding options were modified to extend the exercise period until February 22, 2016. |
The following table sets forth the vesting schedule for the stock options held by our named executive officers that were unvested as of January 31, 2015:
| Name |
Number of stock options that have not vested (#) |
Type | Vesting date | |||||||||
| James Myers |
350,000 | Time-based | (a) | 3/19/2015 | ||||||||
| 350,000 | Time-based | (a) | 3/20/2015 | |||||||||
| 400,000 | Time-based | (b) | 10/26/2015 | |||||||||
| 350,000 | Time-based | (a) | 3/19/2016 | |||||||||
| 350,000 | Time-based | (a) | 3/20/2016 | |||||||||
| 400,000 | Time-based | (b) | 10/26/2016 | |||||||||
| 350,000 | Time-based | (a) | 3/19/2017 | |||||||||
| 350,000 | Time-based | (a) | 3/20/2017 | |||||||||
| 350,000 | Time-based | (a) | 3/19/2018 | |||||||||
| 350,000 | Time-based | (a) | 3/20/2018 | |||||||||
| 350,000 | Time-based | (a) | 3/19/2019 | |||||||||
| Lawrence Rutkowski |
— | — | — | |||||||||
| Bradley Weston |
150,000 | Time-based | (a) | 3/19/2015 | ||||||||
| 100,000 | Time-based | (a) | 3/20/2015 | |||||||||
| 1,000,000 | Time-based | (a) | 10/17/2015 | |||||||||
| 150,000 | Time-based | (a) | 3/19/2016 | |||||||||
| 100,000 | Time-based | (a) | 3/20/2016 | |||||||||
| 1,000,000 | Time-based | (a) | 10/17/2016 | |||||||||
112
Table of Contents
| Name |
Number of stock options that have not vested (#) |
Type | Vesting date | |||||||||
| 150,000 | Time-based | (a) | 3/19/2017 | |||||||||
| 100,000 | Time-based | (a) | 3/20/2017 | |||||||||
| 150,000 | Time-based | (a) | 3/19/2018 | |||||||||
| 100,000 | Time-based | (a) | 3/20/2018 | |||||||||
| 150,000 | Time-based | (a) | 3/19/2019 | |||||||||
| Thomas Farello |
90,000 | Time-based | (a) | 3/19/2015 | ||||||||
| 90,000 | Time-based | (a) | 3/20/2015 | |||||||||
| 33,333 | Time-based | (c) | 4/1/2015 | |||||||||
| 140,000 | Time-based | (b) | 10/26/2015 | |||||||||
| 90,000 | Time-based | (a) | 3/19/2016 | |||||||||
| 90,000 | Time-based | (a) | 3/20/2016 | |||||||||
| 140,000 | Time-based | (b) | 10/26/2016 | |||||||||
| 90,000 | Time-based | (a) | 3/19/2017 | |||||||||
| 90,000 | Time-based | (a) | 3/20/2017 | |||||||||
| 90,000 | Time-based | (a) | 3/19/2018 | |||||||||
| 90,000 | Time-based | (a) | 3/20/2018 | |||||||||
| 90,000 | Time-based | (a) | 3/19/2019 | |||||||||
| Charles Piscitello |
70,000 | Time-based | (a) | 3/19/2015 | ||||||||
| 70,000 | Time-based | (a) | 3/20/2015 | |||||||||
| 100,000 | Time-based | (c) | 4/1/2015 | |||||||||
| 140,000 | Time-based | (b) | 10/26/2015 | |||||||||
| 70,000 | Time-based | (a) | 3/19/2016 | |||||||||
| 70,000 | Time-based | (a) | 3/20/2016 | |||||||||
| 140,000 | Time-based | (b) | 10/26/2016 | |||||||||
| 70,000 | Time-based | (a) | 3/19/2017 | |||||||||
| 70,000 | Time-based | (a) | 3/20/2017 | |||||||||
| 70,000 | Time-based | (a) | 3/19/2018 | |||||||||
| 70,000 | Time-based | (a) | 3/20/2018 | |||||||||
| 70,000 | Time-based | (a) | 3/19/2019 | |||||||||
| Elisabeth Charles |
— | — | — | |||||||||
| (a) | 20% of each time-based option award (including time-based options with an accreting exercise price) vests on each of the first five anniversaries of the date of grant, or, for Mr. Weston, the date on which he was hired, subject generally, in each case, to the named executive officer’s continued employment with us through the applicable vesting date. |
| (b) | 20% of each time-based option award (including time-based options with an accreting exercise price) vests on each October 26 for five years following the date of grant, subject generally, in each case, to the named executive officer’s continued employment with us through the applicable vesting date. |
| (c) | 20% of each time-based option award (including time-based options with an accreting exercise price) vests on each April 1 for five years following the date of grant, subject generally, in each case, to the named executive officer’s continued employment with us through the applicable vesting date. |
Adjustments to Equity Incentive Awards
On December 11, 2009, we completed a one-for-one stock option exchange offer to allow then current employees and directors the opportunity to exchange their outstanding stock options with an accreting exercise price for (i) in the case of then vested options, options with an exercise price set at the then current exercise price as of the date immediately prior to the exchange, taking into account
113
Table of Contents
any prior accretion in the exercise price in accordance with the terms of such options, and (ii) in the case of then unvested options, options with an exercise price of $1.03, the fair market value of a share of our common stock on the exchange date, which were subject to two additional years of vesting and, beginning on the first anniversary of the exchange date, the exercise price of which was subject to accretion until the earliest of (A) the exercise of such options, (B) the date on which the options vested in full and (C) a change in control (the “2009 Option Exchange”).
On December 14, 2010, we completed a recapitalization transaction (the “2010 Recapitalization”), whereby our Board of Directors approved the payment of a cash dividend to our stockholders and also approved certain equitable adjustments to options. For each option that was vested at the time of the 2010 Recapitalization, we made a cash payment equal to the amount of the dividend. For each option that was not vested at the time of the 2010 Recapitalization, the exercise price of such unvested option was reduced to reflect the dividend payment.
On October 3, 2012, we completed a recapitalization transaction pursuant to which the Company became the sole stockholder and parent entity of Petco Animal Supplies (the “2012 Recapitalization”). In connection with the 2012 Recapitalization, each outstanding share of Petco Animal Supplies common stock was cancelled and converted into a share of Company common stock. In addition, the Company assumed the 2006 Executive Incentive Plan and the 2006 Management Incentive Plan, all references to Petco Animal Supplies were replaced with references to the Company, and all awards made in respect of Petco Animal Supplies common stock were converted into awards in respect of Company common stock. In addition, in connection with our 2012 Recapitalization, our Board of Directors approved the payment of a cash dividend to our stockholders and also approved certain equitable adjustments to options. For each option that was vested at the time of the 2012 Recapitalization, we made a cash payment equal to the amount of the dividend. For each option that was not vested at the time of the 2012 Recapitalization, the exercise price of such unvested option was reduced by the amount of the dividend (subject to a certain floor) and, if the exercise price was not reduced by the full amount of the dividend, the remainder was granted to the option holder as a dividend-equivalent cash bonus, subject to the same vesting schedule as the unvested option and payable on the last day of the calendar quarter following the vesting date. The option modifications pursuant to the 2012 Recapitalization are further discussed in Note 13 to our consolidated financial statements for fiscal year ended January 31, 2015, included elsewhere in this prospectus.
As a result of a minority stock sale in December 2012 (the “2012 Minority Sale”), a portion (based on the pro-rata portion of our common stock sold by the Sponsors) of outstanding options with an accreting exercise price was modified to fix the exercise price of such options as of the date of such sale (without further accretion of the exercise price). The 2012 Minority Sale is further discussed in Note 2 to our consolidated financial statements for fiscal year ended January 31, 2015, included elsewhere in this prospectus.
Options Exercised and Stock Vested
The following table sets forth the options that were exercised and stock awards that became vested during our 2014 fiscal year.
| Option awards | Stock awards | |||||||||||||||
| Name |
Number of shares acquired on exercise (#) |
Value realized on exercise ($) |
Number of shares acquired on vesting (#) |
Value realized on vesting ($) |
||||||||||||
| James Myers |
— | — | — | — | ||||||||||||
| Lawrence Rutkowski |
— | — | — | — | ||||||||||||
| Bradley Weston |
— | — | 166,666 | (1) | 278,332 | (2) | ||||||||||
| Thomas Farello |
— | — | — | — | ||||||||||||
| Charles Piscitello |
— | — | — | — | ||||||||||||
| Elisabeth Charles |
908,335 | (3) | 1,199,969 | (4) | — | — | ||||||||||
114
Table of Contents
| (1) | Represents shares subject to an RSU award granted to Mr. Weston under the 2006 Executive Incentive Plan that vested during fiscal 2014. |
| (2) | Represents the value realized upon vesting of the RSU award, which is the fair market value of a share of our common stock on the date of vesting ($1.67) multiplied by the number of shares that vested on such date. |
| (3) | Represents options granted to Ms. Charles, which she exercised in connection with her termination of employment. |
| (4) | Represents the value realized on exercise of the options, which is based on the difference between the applicable exercise price of an option and the fair market value of a share of our common stock on the date of exercise ($1.67), multiplied by the number of options exercised as of such date. |
Nonqualified Deferred Compensation
The following table sets forth information regarding the value of accumulated benefits of our named executive officers under our nonqualified deferred compensation arrangements as of January 31, 2015, the last day of our 2014 fiscal year.
| Name |
Executive contributions in last fiscal year ($) |
Company contributions in last fiscal year ($) |
Aggregate earnings in last fiscal year ($) |
Aggregate withdrawals / distributions ($) |
Aggregate balance at last fiscal year end ($) |
|||||||||||||||
| James Myers |
88,846 | 60,435 | 90,802 | — | 1,432,979 | |||||||||||||||
| Lawrence Rutkowski |
18,000 | — | 496 | 18,496 | — | |||||||||||||||
| Bradley Weston |
43,707 | — | 349 | — | 45,461 | |||||||||||||||
| Thomas Farello |
47,320 | 17,201 | 26,572 | — | 613,806 | |||||||||||||||
| Charles Piscitello |
121,151 | 15,978 | 32,347 | — | 504,870 | |||||||||||||||
| Elisabeth Charles |
21,450 | 16,606 | 15,281 | 264,138 | — | |||||||||||||||
Messrs. Myers, Weston, Farello and Piscitello participate in our nonqualified deferred compensation plan, which is an unfunded plan that is available to executives and certain key employees and directors of the Company. Under the plan, participants are permitted to defer a portion of their annual base salary and bonus. The Company makes a matching contribution of 50% of a participant’s contributions on the first 3% of base salary deferred (or 6% if a participant is not eligible to participate in our 401(k) plan), and a matching contribution of 50% of a participant’s contributions on the first 6% of annual bonus deferred. Participants are 100% vested in Company matching contributions. Participants may select among a broad range of investment alternatives under this plan, and participants’ accounts are credited with a rate of return based on the performance of the selected investments. The Company does not provide above-market or preferential earnings on deferred compensation. If a participant separates from service on or after reaching age 55 and attaining 6 years of service, the participant’s account may be paid in a single lump sum or in annual installments from two to 10 years (at the participant’s election). If a participant separates from service without meeting the age and service requirements set forth above, or as a result of his or her death or disability, the participant (or his or her beneficiaries, as applicable) will receive his or her account balance in the form of a lump sum. The Company has established a rabbi trust to assist in meeting a portion of its obligations under the plan. To the extent required to comply with Section 409A of the Code, payment upon termination of employment is subject to a six-month delay.
Mr. Rutkowski and Ms. Charles participated in our nonqualified deferred compensation plan during fiscal 2014, but received distributions of their account balances under this plan in connection with the terminations of their respective employments.
115
Table of Contents
Potential Payments Upon Termination or Change in Control
Each of our named executive officers is entitled to receive certain benefits upon a qualifying termination of employment and/or upon certain change in control transactions accompanied by a qualifying termination of employment within a certain time following such transaction, as described below:
Employment agreement with Messrs. Myers, Weston and Piscitello
If we terminate Messrs. Myers’, Weston’s or Piscitello’s employment without cause (as defined in their respective employment agreements) or if the executive resigns for good reason (as defined in their respective employment agreements), the executive will be entitled to severance in an amount equal to (A) two times his base salary (for Mr. Myers), 18 months’ base salary (for Mr. Weston) or six months’ base salary (for Mr. Piscitello), in each case payable in a lump sum, and (B) Company-paid health insurance coverage for three years (for Mr. Myers), 18 months (for Mr. Weston) or six months (for Mr. Piscitello) following their respective termination dates. Mr. Myers will also be entitled to an amount equal to his highest bonus paid in the five fiscal years immediately preceding his termination date, as well as Company-paid life insurance coverage for three years following his termination date. For Messrs. Weston and Piscitello, if any such termination without cause occurs within the 12-month period following a change in control (as defined in their respective employment agreements), in addition to the severance benefits described in (A) and (B) above, the executives will be entitled to receive (X) an amount equal to the annual bonus the executive would have been eligible to receive in respect of the fiscal year in which the termination occurs (calculated based on Company performance immediately prior to such termination of employment, but in no event greater than 100% of his target bonus), multiplied by 1.5 (for Mr. Weston) or multiplied by 1⁄2 (for Mr. Piscitello), in each case payable in a lump sum, and (Y) accelerated vesting of all unvested equity awards held by the executive. For Mr. Myers, if any such termination without cause or resignation for good reason, occurs within the 12-month period following a change in control (as defined in his employment agreement), in addition to the severance benefits described in (A) and (B) above, Mr. Myers will be entitled to receive (X) an amount equal to 1.5 times his average annual bonus for the three fiscal years immediately preceding the termination date, and (Y) Company-paid life insurance coverage for three years following his termination date. In addition, Mr. Myers is entitled to accelerated vesting of all unvested equity awards held by him in connection with a change in control. For Mr. Myers, if any payment or distribution under his employment agreement (including benefits or vesting acceleration of equity) would cause such payment to be subject to an excise tax under Section 4999 of the Code, the Company will make a gross-up payment to Mr. Myers in respect of such tax.
In a letter to Mr. Piscitello, dated July 30, 2015, we confirmed an oral agreement with him from 2011, under which Mr. Piscitello’s employment agreement was to be amended to provide for severance in an amount equal to 12 months’ base salary, payable in a lump sum, as well as Company paid medical benefits for a period of 12 months, under the circumstances described above. In addition, the letter confirmed that the amount in respect of his annual bonus that Mr. Piscitello would be entitled to receive on a qualifying termination in connection with a change of control, as described above, would be equal to the annual bonus he would have been eligible to receive in respect of the fiscal year in which the termination occurred (calculated based on Company performance immediately prior to such termination of employment), but in no event greater than 100% of his target bonus.
Upon a termination for cause or a resignation without good reason, Messrs. Myers, Weston and Piscitello will each be entitled only to compensation and benefits owed to him as of the termination date (referred to herein as “Accrued Obligations”). If the executive’s employment is terminated due to disability (as defined in the employment agreement) or death, the executive or his representatives or beneficiaries, as applicable, will be entitled to the Accrued Obligations, and, for Mr. Myers, an amount equal to his highest bonus paid in the five fiscal years immediately preceding the date of termination
116
Table of Contents
and continuation of health insurance coverage for a period of 12 months. It is a condition to receipt of the payments described above (other than the Accrued Obligations), that the executive or his representatives or beneficiaries, as applicable, timely execute (without revoking) a release of claims in favor of us. Each executive must also comply with certain restrictive covenants set forth in his employment agreement, including a covenant not to solicit our clients or employees during and for one year following his employment with us and covenants relating to confidentiality.
Retention Agreement with Mr. Farello
We entered into a retention agreement with Mr. Farello, effective December 26, 2012. Under his retention agreement, if we terminate Mr. Farello’s employment without cause (as defined in the retention agreement) or if Mr. Farello resigns for good reason (as defined in the retention agreement), in either case in connection with or within the one-year period following a change in control (as defined in the retention agreement), Mr. Farello will be entitled to severance in an amount equal to 12 months’ base salary and Company-paid medical benefits, payable over the 12-month period following his termination of employment, a lump sum payment equal to the annual bonus he would have been eligible to receive in respect of the fiscal year in which the termination occurred (calculated based on Company performance immediately prior to such termination of employment, but in no event greater than 100% of his target bonus), and accelerated vesting of all unvested equity awards held by Mr. Farello.
It is a condition to Mr. Farello’s receipt of the payments described above that he timely execute (without revoking) a release of claims in favor of us. Mr. Farello is also subject to certain restrictive covenants set forth in his employment agreement, including a covenant not to solicit our clients or employees during and for one year following his employment with us and covenants relating to confidentiality.
Summary of Potential Payments
The following tables summarize the payments that would have been made to our named executive officers who were employed by us at the end of fiscal 2014 upon the occurrence of a termination of employment or a change in control, assuming that each named executive officer’s termination of employment or a change in control occurred on January 31, 2015 (the last business day of our most recent fiscal year). If a termination of employment had occurred on this date, severance payments and benefits would have been determined, for each of the named executive officers, under his employment agreement or retention agreement, as applicable. Amounts shown do not include (i) accrued but unpaid salary and annual cash incentive bonuses for fiscal 2014 (which are reflected in the “Non-equity incentive plan compensation” column of the Summary Compensation Table) and (ii) other benefits earned or accrued by the named executive officer during his employment that are available to all salaried employees and that do not discriminate in scope, terms or operations in favor of executive officers. A description of the amounts actually paid to Mr. Rutkowski and Ms. Charles in connection with the terminations of their respective employment is included below.
Potential Payments—James Myers
| Executive payments and benefits |
Termination due to death or disability |
Termination without cause or for good reason |
CIC without termination |
CIC with termination within 1 year without cause or for good reason |
||||||||||||
| Severance |
1,519,104 | (1) | 3,519,104 | (2) | — | 3,589,340 | (3) | |||||||||
| Acceleration of Unvested Stock Options(4) |
— | 162,474 | 162,474 | (7) | 162,474 | |||||||||||
| Health and Welfare |
17,832 | (5) | 53,496 | (6) | — | 53,496 | (6) | |||||||||
| Total |
1,536,936 | 3,735,074 | 162,474 | (7) | 3,805,310 | (7) | ||||||||||
117
Table of Contents
| (1) | Represents an amount equal to Mr. Myers’ highest bonus paid in the five fiscal years immediately preceding the date of termination, which would be payable in a lump sum. |
| (2) | Represents two times Mr. Myers’ base salary and an amount equal to his highest bonus paid in the five fiscal years immediately preceding the date of termination, which would be payable in a lump sum. |
| (3) | Represents 24 months’ base salary and an amount equal to 1.5 times Mr. Myers’ average annual bonus for the three fiscal years immediately preceding the date of termination, which would be payable in a lump sum. |
| (4) | The value of the acceleration of unvested stock options is determined based on the difference between the exercise price of the options and the fair market value of a share of our common stock ($1.67) as of January 31, 2015. |
| (5) | Represents an amount equal to Company-paid health insurance coverage for a period of 12 months following Mr. Myers’ termination of employment. |
| (6) | Represents the cost of Company-paid health and life insurance coverage for three years following Mr. Myers’ termination of employment. |
| (7) | Mr. Myers is entitled to a tax gross-up payment in connection with certain change in control payments. Based on the assumptions set forth above and a per share value of our common stock of $1.67, no amount payable to him under the scenarios described above would have been subject to the excise tax under Section 4999 of the Code and, accordingly, no tax gross-up payment would have been due to him. |
Potential Payments—Bradley Weston
| Executive payments and benefits |
Termination due to death or disability |
Termination without cause or for good reason |
CIC without termination |
CIC with termination within 1 year without cause |
||||||||||||
| Severance |
— | 975,000 | (1) | — | 1,755,000 | (2) | ||||||||||
| Acceleration of Unvested Stock Options(3) |
— | 406,185 | — | 406,185 | ||||||||||||
| Health and Welfare |
— | 16,387 | (4) | — | 16,387 | (4) | ||||||||||
| Total |
— | 1,397,572 | — | 2,177,572 | ||||||||||||
| (1) | Represents 18 months’ base salary, which would be payable in a lump sum. |
| (2) | Represents 18 months’ base salary and an amount equal to the annual bonus Mr. Weston would have been eligible to receive in respect of the fiscal year in which the termination occurred (calculated based on Company performance immediately prior to such termination of employment, but in no event greater than 100% of his target bonus), multiplied by 1.5, which would be payable in a lump sum. For purposes of this table, this amount has been assumed to be 100% of his target bonus multiplied by 1.5. |
| (3) | The value of the acceleration of unvested stock options is determined based on the difference between the exercise price of the options and the fair market value of a share of our common stock ($1.67) as of January 31, 2015. |
| (4) | Represents an amount equal to Company-paid health insurance coverage for a period of 18 months following Mr. Weston’s termination of employment. |
118
Table of Contents
Potential Payments—Charles Piscitello
| Executive payments and benefits |
Termination due to death or disability |
Termination without cause or for good reason |
CIC without termination |
CIC with termination within 1 year without cause |
||||||||||||
| Severance |
— | 465,000 | (1) | — | 697,500 | (2) | ||||||||||
| Acceleration of Unvested Stock Options(3) |
— | 59,825 | — | 59,825 | ||||||||||||
| Health and Welfare |
— | 17,747 | (4) | — | 17,747 | (4) | ||||||||||
| Total |
— | 542,572 | — | 775,072 | ||||||||||||
| (1) | Represents 12 months’ base salary, which would be payable in a lump sum. |
| (2) | Represents 12 months’ base salary and an amount equal to the annual bonus Mr. Piscitello would have been eligible to receive in respect of the fiscal year in which the termination occurred (calculated based on Company performance immediately prior to such termination of employment, but in no event greater than 100% of his target bonus), which would be payable in a lump sum. For purposes of this table, this amount has been assumed to be 100% of his target bonus. |
| (3) | The value of the acceleration of unvested stock options is determined based on the difference between the exercise price of the options and the fair market value of a share of our common stock ($1.67) as of January 31, 2015. |
| (4) | Represents an amount equal to Company-paid health insurance coverage for a period of 12 months following Mr. Piscitello’s termination of employment. |
Potential Payments—Thomas Farello
| Executive payments and benefits |
Termination due to death or disability |
Termination without cause or for good reason |
CIC without termination |
CIC with termination within 1 year without cause or for good reason |
||||||||||||
| Severance |
— | — | — | 873,600 | (1) | |||||||||||
| Acceleration of Unvested Stock Options(2) |
— | — | — | 57,853 | ||||||||||||
| Health and Welfare |
— | — | — | 11,959 | (3) | |||||||||||
| Total |
— | — | — | 943,412 | ||||||||||||
| (1) | Represents 12 months’ base salary, payable over the 12-month period following a termination of employment, and a lump sum payment equal to the annual bonus Mr. Farello would have been eligible to receive in respect of the fiscal year in which the termination occurred (calculated based on Company performance immediately prior to such termination of employment, but in no event greater than 100% of his target bonus). For purposes of this table, this amount has been assumed to be 100% of his target bonus. |
| (2) | The value of the acceleration of unvested stock options is determined based on the difference between the exercise price of the options and the fair market value of a share of our common stock ($1.67) as of January 31, 2015. |
| (3) | Represents an amount equal to Company-paid health insurance coverage for a period of 12 months following Mr. Farello’s termination of employment. |
Separation Payments to Mr. Rutkowski and Ms. Charles
Mr. Rutkowski’s employment with the Company terminated on December 1, 2014. Pursuant to his separation agreement, Mr. Rutkowski received a cash payment of $1,057,630 (consisting of severance pay of $900,000 and a bonus of $157,630, which was based on the amount he would have received had he remained employed with the Company and received an annual bonus pursuant to the Incentive
119
Table of Contents
Plan for fiscal 2014, pro-rated based on his actual days of service during fiscal 2014). In addition, Mr. Rutkowski received Company-paid COBRA continuation coverage for 18 months of $9,092, Company-paid commission and closing expenses of $391,140, relating to the sale of his residence in connection with his commencement of employment and Company-paid legal expenses of $10,000 incurred in connection with the negotiation of his severance agreement.
Ms. Charles’ employment with the Company terminated on August 22, 2014. Pursuant to her separation agreement, Ms. Charles received a cash payment of $640,732 (consisting of severance pay of $568,000 and a bonus of $72,732, which was based on the amount she would have received had she remained employed with the Company and received an annual bonus pursuant to the Incentive Plan for fiscal 2014, pro-rated based on her actual days of service during fiscal 2014). In addition, Ms. Charles received Company-paid COBRA continuation coverage for 12 months of $9,428, Company-paid financial planning and tax preparation assistance valued at $18,815 and outplacement services valued at $7,000 and 406,165 outstanding options held by her were modified to extend the exercise period of such options until February 22, 2016.
As a condition to receipt of the payments described above, Mr. Rutkowski and Ms. Charles were each required to timely execute (without revoking) a release of claims in favor of us. Mr. Rutkowski and Ms. Charles are also required to comply with certain restrictive covenants set forth in their respective separation agreements, including covenants relating to confidentiality and nondisparagement.
Director Compensation
The following table shows information regarding the compensation earned by our non-employee directors during our 2014 fiscal year. The compensation received by Mr. Myers as an employee during our 2014 fiscal year is included in the Summary Compensation Table above and he did not receive any additional compensation for his service on our board of directors. Only our non-Sponsor directors received compensation for their services on our board of directors.
| Name |
Fees earned or paid in cash ($) |
Stock awards ($)(1) | All other compensation ($)(2) |
Total ($) | ||||||||||||
| Brian Devine |
225,000 | — | 37,797 | 262,797 | ||||||||||||
| Larry Hayward |
50,000 | 50,000 | 3,882 | 103,882 | ||||||||||||
| (1) | Represents the aggregate grant-date fair value of RSUs granted in fiscal 2014 computed in accordance with FASB ASC Topic 718. The fair value of each grant of RSUs at the grant date is equal to the number of RSUs granted multiplied by the fair market value of a share of our common stock on the date of grant. Mr. Hayward was granted 25,000 RSUs under the 2006 Senior Executive Incentive Award Plan on March 19, 2014, when the fair market value of a share of our common stock was $2.00. Mr. Hayward’s RSUs vest on the one year anniversary of the grant date. As of January 31, 2015 (the last day of fiscal 2014), Mr. Devine did not hold any unvested RSUs and Mr. Hayward held 25,000 unvested RSUs. |
| (2) | Amounts included in the “All other compensation” column for Mr. Devine include the value of Company-paid office space and administrative support ($6,048 and $31,749, respectively). The amount included in the “All other compensation” column for Mr. Hayward includes the amount of the dividend-equivalent cash bonus payable in respect of the 2012 Recapitalization. For a description of the 2012 Recapitalization, see “—Adjustments to equity incentive awards” above. |
We are party to a consulting agreement with Mr. Devine, our Chairman Emeritus of the Board of Directors, which became effective upon Mr. Devine’s retirement from employment with the Company on October 26, 2011 after 21 years of service. Under the consulting agreement, the Company generally receives services from Mr. Devine for up to 10 hours per week, and the term of the consulting
120
Table of Contents
agreement extends for a period of 10 years following the date on which Mr. Devine terminated full-time employment with us. Under the consulting agreement, we pay Mr. Devine $225,000 per year, and he continues to receive office space and administrative support at our expense.
Mr. Devine is also entitled to a retirement benefit pursuant to a supplemental executive retirement program (“SERP”), effective October 26, 2011. Under the SERP, we will pay Mr. Devine 240 monthly benefit payments, the amount of which shall be determined as follows: (i) the first 120 monthly payments are paid at the rate of 1/12 of $450,000 per month, less the sum of his consulting compensation (as defined in the SERP) and retirement plan benefit (as defined in the SERP); and (ii) the next 120 monthly payments will be paid at the rate of 1/12 of $450,000 per month, less his retirement plan benefit.
Corporate Incentive Bonus Plan
Our named executive officers are each entitled to participate in our Corporate Incentive Bonus Plan (“Incentive Plan”) for our 2015 fiscal year. The terms of our of Incentive Plan for fiscal 2015, as they apply to our named executive officers and our other senior executives, will be generally the same as the terms that applied for our 2014 fiscal year, as described above under “—Short-term cash incentive program,” subject to the modifications described herein. Specifically, for 2015, funding of annual bonuses will be determined shortly after the end of our fiscal year based on achievement of two pre-established metrics, EBITDA and Cash on Equity Return, rather than the three metrics used to determine bonuses for fiscal 2014. For 2015, the performance goals will be given the following weight under the Incentive Plan: EBITDA (75%) and Cash on Equity Return (25%).
2006 Equity Plans
The following is a description of our 2006 Senior Executive Incentive Award Plan and our 2006 Key Management Incentive Award Plan (collectively, the “2006 Equity Plans”). The 2006 Equity Plans are identical in all material respects, except that the 2006 Senior Executive Incentive Award Plan provides for grants to only certain eligible individuals who qualify as accredited investors under applicable securities laws. This summary is not a complete description of all provisions of the plans and is qualified in its entirety by reference to the 2006 Equity Plans, which will be filed as exhibits to the registration statement of which this prospectus is a part. We intend to adopt a new equity incentive plan, the 2015 Equity Incentive Plan, described below, in connection with this offering.
Plan administration. The 2006 Equity Plans are administered by the Committee (except for awards of stock options granted to independent directors, which are administered by the Board of Directors) (the “Administrator”). The Administrator has the authority to, among other things, interpret the 2006 Equity Plans, select eligible persons to receive grants of awards and determine the terms of awards under the 2006 Equity Plans.
Authorized shares. Subject to adjustment, the maximum number of shares of our common stock that may be delivered in satisfaction of awards under the 2006 Equity Plans is 136,000,000 (113,000,000 under the 2006 Senior Executive Incentive Award Plan and 23,000,000 under the 2006 Key Management Incentive Award Plan). As of January 31, 2015, awards with respect to 127,550,840 shares of our common stock have been granted under the 2006 Equity Plans.
Eligibility. The Administrator selects participants from among our employees, non-employee directors, or consultants.
121
Table of Contents
Types of awards; vesting. The 2006 Equity Plans provide for grants of stock options (including incentive stock options, which are referred to herein as ISOs), stock appreciation rights, restricted and unrestricted stock and stock units, deferred stock awards, dividend equivalents, and performance awards.
Vesting. The Administrator has the authority to determine the vesting schedule applicable to each award, and to accelerate the vesting or exercisability of any award.
Termination of employment or service. The Administrator may determine the effect of termination of employment or service on an award. Unless otherwise provided by the Administrator, upon a termination of employment or service all unvested stock options and other awards requiring exercise will terminate and all other unvested awards will be forfeited. Vested options will remain exercisable for 12 months following death or disability or three months following a termination of employment for any reason other than death or disability (or, if shorter, for the remaining term of the option). Upon the expiration of the applicable periods set forth above, any unexercised portion of the option shall immediately terminate.
Transferability. Awards under 2006 Equity Plans may not be transferred except by will or the laws of descent and distribution, unless otherwise provided by the Administrator.
Change in control; corporate transactions. In the event of a change in control of the Company or any unusual or nonrecurring transactions or events affecting the Company, any affiliate of the Company, or the financial statements of the Company or any affiliate, or of changes in applicable laws, regulations or accounting principles, the Administrator may, for example, provide for the cash-out or replacement of awards, accelerated vesting or delivery of shares under the awards, or continuation or assumption of outstanding awards.
Adjustment. In the event of certain corporation transactions (including a stock dividend or other distribution, recapitalization, reclassification, stock split, reverse stock split, reorganization, merger, consolidation, split-up, spin-off, combination, repurchase, liquidation, dissolution, or sale, transfer, exchange or other disposition of all or substantially all of the assets of the Company, or exchange of common stock or other securities of the Company, issuance of warrants or other rights to purchase common stock or other securities of the Company, or other similar corporate transaction or event), the Administrator will, in a manner it determines to be equitable, adjust any or all of the number and kind of shares of common stock with respect to which awards may be granted or awarded, the number and kind of shares of common stock subject to outstanding awards, and the grant or exercise price with respect to any award, in each case in order to prevent dilution or enlargement of the benefits or potential benefits intended to be made available under the 2006 Equity Plans or with respect to an award.
Amendment and Termination. The Administrator may amend, suspend or terminate the 2006 Equity Plans, except that no such amendment, suspension or termination may, without the consent of the participant, alter or impair any rights or obligations under any award (unless expressly provided for in the award).
2015 Equity Incentive Plan
In connection with this offering, our board of directors intends to adopt the Petco Holdings, Inc. 2015 Equity Incentive Plan, or the 2015 Equity Plan, and, following this offering, all equity-based awards will be granted under the 2015 Equity Plan. The following summary describes what we anticipate to be the material terms of the 2015 Equity Plan. This summary of the 2015 Equity Plan is
122
Table of Contents
not a complete description of all provisions of the 2015 Equity Plan and is qualified in its entirety by reference to the 2015 Equity Plan, a form of which will be filed as an exhibit to the registration statement of which this prospectus is a part.
Administration. The 2015 Equity Plan is administered by our compensation committee. Our compensation committee has the authority to, among other things, interpret the 2015 Equity Plan, determine eligibility for, grant and determine the terms of awards under the 2015 Equity Plan, determine the form of settlement of awards (whether in cash, shares of our common stock or other property), and do all things necessary or appropriate to carry out the purposes of the 2015 Equity Plan. Our compensation committee’s determinations under the 2015 Equity Plan are conclusive and binding.
Eligibility. Our key employees, directors, consultants and advisors are eligible to participate in the 2015 Equity Plan.
Authorized Shares. Subject to adjustment, as described below, the maximum number of shares of our common stock that may be delivered in satisfaction of awards under the 2015 Equity Plan is shares. Any shares of common stock underlying awards that are settled in cash, expire or become unexercisable without having been exercised or that are forfeited to, or repurchased by, us will again be available for issuance under the 2015 Equity Plan. In addition, the number of shares of our common stock delivered in satisfaction of awards will be determined net of shares of our common stock withheld by us in payment of the exercise price or purchase price of an award or in satisfaction of tax withholding requirements with respect to an award.
Individual Limits. The maximum number of shares of our common stock subject to stock options and the maximum number of shares of our common stock subject to stock appreciation rights, or SARs, that may be granted to any participant in the 2015 Equity Plan in any calendar year is each shares. The maximum number of shares of our common stock subject to other awards that may be granted to any participant in the 2015 Equity Plan in any calendar year is shares. In addition, in the case of a non-employee director, an additional limit applies such that the maximum grant-date fair value of awards granted under the 2015 Equity Plan in any fiscal year during any part of which the director is then eligible under such plan is , except that such limit for a non-employee chairman of our board of directors or lead director is .
Types of Awards. The 2015 Equity Plan provides for awards of stock options, SARs, restricted stock, unrestricted stock, stock units, performance awards and other awards convertible into or otherwise based on shares of our common stock. Eligibility for stock options intended to be incentive stock options, or ISOs, is limited to our employees. Dividend equivalents may also be provided in connection with an award under the 2015 Equity Plan on terms and subject to conditions established by our compensation committee.
| • | Stock options and SARs. The exercise price of a stock option, and the base price against which a SAR is to be measured, may not be less than the fair market value (or, in the case of an ISO granted to a ten percent shareholder, 110% of the fair market value) of a share of our common stock on the date of grant. Our compensation committee will determine the time or times at which stock options or SARs become exercisable and the terms on which such awards remain exercisable. |
| • | Restricted and unrestricted stock. A restricted stock award is an award of shares of our common stock subject to forfeiture restrictions, while an unrestricted stock award is not subject to such restrictions. |
| • | Stock units. A stock unit award is an award denominated in shares of our common stock that entitles the participant to receive shares of our common stock or cash measured by the value |
123
Table of Contents
| of shares of our common stock in the future. The delivery of shares of our common stock or cash under a stock unit may be subject to the satisfaction of performance conditions or other vesting conditions. |
| • | Performance awards. A performance award is an award the vesting, settlement or exercisability of which is subject to specified performance criteria. |
| • | Other awards. Other awards are awards that are convertible into or otherwise based on shares of our common stock. |
Performance Awards. The 2015 Equity Plan provides for the grant of performance awards that are made based upon, and subject to achieving, performance objectives. Performance objectives with respect to those awards that are intended to qualify as “performance-based compensation” for purposes of Section 162(m) of the Internal Revenue Code, or Section 162(m), to the extent applicable, are limited to an objectively determinable measure or measures of performance relating to any or any combination of the following (measured either absolutely or comparatively (including, without limitation, by reference to an index or indices or a specified peer group) and determined either on a consolidated basis or, as the context permits, on a divisional, subsidiary, line of business, project or geographical basis or in combinations thereof and subject to such adjustments, if any, as our compensation committee specifies, consistent with the requirements of Section 162(m)): sales; revenues; assets; expenses; earnings before or after deduction for all or any portion of interest, taxes, depreciation, or amortization or equity expense, whether or not on a continuing operations or an aggregate or per share basis; return on equity, investment, capital, capital employed or assets; one or more operating ratios; operating income or profit, including on an after tax basis; borrowing levels, leverage ratios or credit rating; market share; capital expenditures; cash flow; stock price; stockholder return; comparison with various stock market or industry indices; reduction in costs; sales of particular products or services; customer acquisition or retention; store closures; gross or net same store openings; new store first year sales; same store sales; acquisitions and divestitures (in whole or in part); joint ventures and strategic alliances; spin-offs, split-ups and the like; reorganizations; or recapitalizations, restructurings, financings (issuance of debt or equity) or refinancings.
To the extent consistent with the requirements for satisfying the performance-based compensation exception under Section 162(m), to the extent applicable, our compensation committee may provide, by the deadline that otherwise applies to the establishment of the terms of any award intended to qualify for such exception, that one or more of the performance objectives applicable to an award will be adjusted in an objectively determinable manner to reflect events (for example, the impact of charges for restructurings, discontinued operations, mergers, acquisitions and other unusual or infrequently occurring items, and the cumulative effects of tax or accounting changes, each as defined by U.S. generally accepted accounting principles) occurring during the performance period that affect the applicable performance objectives.
Performance-based awards granted under the 2015 Equity Plan will not be required to comply with the provisions of the 2015 Equity Plan applicable to performance-based compensation under Section 162(m) if they are eligible for exemption from such provisions by reason of the transition relief for newly-public companies under Section 162(m).
Vesting; Termination of Employment or Service. Our compensation committee has the authority to determine the vesting schedule applicable to each award, and to accelerate the vesting or exercisability of any award. Our compensation committee will determine the effect of a termination of employment or service on an award. Unless otherwise provided by our compensation committee, upon a termination of a participant’s employment or service, all unvested stock options and SARs then held by the participant will terminate and all other unvested awards will be forfeited and all vested stock options and SARs then held by the participant will remain outstanding for three months following such
124
Table of Contents
termination, or 12 months in the case of the cessation of the participant’s employment due to his or her death or the termination of the participant’s employment by us due to his or her disability, or, in each case, until the applicable expiration date, if earlier. All stock options and SARs held by a participant immediately prior to the participant’s termination of employment or service will immediately terminate if such termination is for cause, as defined in the 2015 Equity Plan, or occurs in circumstances that would have constituted grounds for the participant’s employment or service to be terminated for cause.
Non-Transferability of Awards. Awards under the 2015 Equity Plan may not be transferred other than by the laws of descent and distribution, unless, for awards other than ISOs, otherwise provided by our compensation committee.
Recovery of Compensation. Our compensation committee may cancel, rescind, withhold or otherwise limit or restrict any award at any time under the 2015 Equity Plan if the participant is not in compliance with the provisions of the 2015 Equity Plan or any award thereunder or if the participant breaches any agreement with us with respect to non-competition, non-solicitation or confidentiality. Our compensation committee also may recover any award or payments or gain in respect of any award under the 2015 Equity Plan in accordance with any applicable company clawback or recoupment policy, or as otherwise required by applicable law or applicable stock exchange listing standards.
Certain Transactions; Certain Adjustments. In the event of a consolidation, merger or similar transaction or series of related transactions, including a sale or other disposition of shares of our common stock, in which our company is not the surviving corporation or that results in the acquisition of all or substantially all of our then outstanding shares of common stock by a single person or entity or by a group of persons and/or entities acting in concert, a sale of all or substantially all of our assets or our dissolution or liquidation, our compensation committee may, among other things, provide for the continuation or assumption of outstanding awards, for new grants in substitution of outstanding awards, for the accelerated vesting or delivery of shares under awards or for a cash-out of outstanding awards, in each case on such terms and with such restrictions as it deems appropriate. Except as our compensation committee may otherwise determine, awards not assumed in connection with such a transaction will terminate automatically and, in the case of outstanding restricted stock, will be forfeited automatically upon the consummation of such covered transaction.
In the event of a stock dividend, stock split or combination of shares, including a reverse stock split, recapitalization or other change in our capital structure that constitutes an equity restructuring within the meaning of FASB ASC Topic 718, our compensation committee will make appropriate adjustments to the maximum number of shares of our common stock that may be delivered under, and the ISO and individual share limits included in, the 2015 Equity Plan, and will also make appropriate adjustments to the number and kind of shares or securities subject to awards, the exercise prices of such awards or any other terms of awards affected by such change. Our compensation committee will also make the types of adjustments described above to take into account distributions and other events other than those listed above if it determines that such adjustments are appropriate to avoid distortion in the operation of the 2015 Equity Plan.
Amendment; Termination. Our compensation committee will be able to amend the 2015 Equity Plan or outstanding awards, or terminate the 2015 Equity Plan as to future grants of awards, except that our compensation committee will not be able to alter the terms of an award if it would affect materially and adversely a participant’s rights under the award without the participant’s consent (unless expressly provided in the 2015 Equity Plan or the right to alter the terms of an award was expressly reserved by our compensation committee at the time the award was granted). Shareholder approval will be required for any amendment to the 2015 Equity Plan to the extent such approval is required by law, including applicable stock exchange requirements.
125
Table of Contents
Cash Incentive Plan
In connection with this offering, our board of directors intends to adopt the Petco Holdings, Inc. Cash Incentive Plan, or the Cash Incentive Plan. Starting with our 2016 fiscal year, annual cash award opportunities for our named executive officers and other key employees will be granted under the Cash Incentive Plan. The following summary describes what we anticipate to be the material terms of the Cash Incentive Plan. This summary is not a complete description of all provisions of the Cash Incentive Plan and is qualified in its entirety by reference to the Cash Incentive Plan, a form of which will be filed as an exhibit to the registration statement of which this prospectus is a part.
Administration. The Cash Incentive Plan will be administered by our compensation committee. Our compensation committee has authority to interpret the Cash Incentive Plan and awards granted under it, to determine eligibility for awards and to do all things necessary to administer the Cash Incentive Plan. Any interpretation or decision by our compensation committee will be final and conclusive on all participants.
Participants; Individual Limit. Our executive officers and other key employees will be selected from time to time by our compensation committee to participate in the Cash Incentive Plan. The maximum payment to any participant pursuant to an award intended to qualify as performance-based compensation under Section 162(m) under the Cash Incentive Plan in any fiscal year will in no event exceed .
Awards. With respect to each award granted under the Cash Incentive Plan, our compensation committee will establish the performance criteria applicable to the award, the amount or amounts payable if the performance criteria are achieved, and such other terms and conditions as the compensation committee deems appropriate. The Cash Incentive Plan permits the grant of awards that are intended to qualify as exempt performance-based compensation under Section 162(m), to the extent applicable, as well as awards that are not intended to so qualify. Any awards that are intended to qualify as performance-based compensation will be administered in accordance with the requirements of Section 162(m), to the extent applicable. Awards under the Cash Incentive Plan will not be required to comply with the provisions of the plan applicable to performance-based compensation under Section 162(m) if they are eligible for exemption from such provisions by reason of the transition relief for newly-public companies under Section 162(m).
Performance Criteria. Awards under the Cash Incentive Plan will be made based on, and subject to achieving, performance criteria established by our compensation committee, which may be applied to a participant or participants on an individual basis, to a business unit or division, or to the company as a whole. Performance criteria for awards intended to qualify as performance-based compensation for purposes of Section 162(m), to the extent applicable, are limited to the objectively determinable measures of performance relating to any or any combination of the following (measured either absolutely or comparatively (including, without limitation, by reference to an index or indices or a specified peer group) and determined either on a consolidated basis or, as the context permits, on a divisional, subsidiary, line of business, project or geographical basis or in combinations thereof and subject to such adjustments, if any, as our compensation committee specifies, consistent with the requirements of Section 162(m)): sales; revenues; assets; expenses; earnings before or after deduction for all or any portion of interest, taxes, depreciation, or amortization or equity expense, whether or not on a continuing operations or an aggregate or per share basis; return on equity, investment, capital, capital employed or assets; one or more operating ratios; operating income or profit, including on an after tax basis; borrowing levels, leverage ratios or credit rating; market share; capital expenditures; cash flow; stock price; stockholder return; comparison with various stock market or industry indices; reduction in costs; sales of particular products or services; customer acquisition or retention; store closures; gross or net same store openings; new store first year sales; same store
126
Table of Contents
sales; acquisitions and divestitures (in whole or in part); joint ventures and strategic alliances; spin-offs, split-ups and the like; reorganizations; or recapitalizations, restructurings, financings (issuance of debt or equity) or refinancings.
To the extent consistent with the requirements of Section 162(m), to the extent applicable, our compensation committee may establish, by the deadline that otherwise applies to the establishment of the terms of an award intended to qualify as exempt performance-based compensation under Section 162(m), that one or more of the performance criteria applicable to such award be adjusted in an objectively determinable manner to reflect events (for example, the impact of charges for restructurings, discontinued operations, mergers, acquisitions and other unusual or infrequently occurring items, and the cumulative effects of tax or accounting changes, each as defined by U.S. generally accepted accounting principles) occurring during the performance period of such award that affect the applicable performance criteria.
Payment under an Award. A participant will be entitled to payment under an award only if all conditions to payment have been satisfied in accordance with the Cash Incentive Plan and the terms of the award. Our compensation committee will determine the payment date or dates for awards under the Cash Incentive Plan. Following the close of the performance period, our compensation committee will determine (and, to the extent required by Section 162(m), certify) whether and to what extent the applicable performance criteria have been satisfied. Our compensation committee will then determine the actual payment, if any, under each award. Our compensation committee has the sole and absolute discretion to reduce the actual payment to be made under any award.
Recovery of Compensation. Awards under the Cash Incentive Plan will be subject to forfeiture, termination and rescission, and a participant who receives a payment pursuant to the Cash Incentive Plan will be obligated to return such payment to us, to the extent provided by our compensation committee in connection with a breach by the participant of an award agreement under the Cash Incentive Plan or any non-competition, non-solicitation, confidentiality or similar covenant or agreement with our company or an overpayment of incentive compensation due to inaccurate financial data. Our compensation committee also may recover any award or payments under any award under the Cash Incentive Plan in accordance with any applicable company clawback or recoupment policy, or as otherwise required by applicable law or applicable stock exchange listing standards.
Amendment; Termination. Our compensation committee may amend the Cash Incentive Plan at any time, provided that any amendment will be approved by our shareholders if required by Section 162(m). Our compensation committee may terminate the Cash Incentive Plan at any time.
127
Table of Contents
CERTAIN RELATIONSHIPS AND RELATED PARTY TRANSACTIONS
Management Services Agreement and Transfer Agreement
Petco Animal Supplies and Petco Stores entered into a management services agreement on October 26, 2006 with certain affiliates of our Sponsors and certain co-investors (together with their transferees, the “Managers”), under which the Managers’ affiliates provide certain management and advisory services to Petco Animal Supplies and its operating subsidiaries. These services include investment banking services, management, consulting and financial planning services, and financial advisory services in connection with major financial transactions that may be undertaken from time to time. We agreed to provide customary indemnification to the Sponsors’ affiliates. As compensation for the general services under the agreement, Petco Animal Supplies agreed to pay the Managers’ affiliates an ongoing annual fee of $7 million, plus reimbursement of reasonable out-of-pocket expenses incurred in connection with the services rendered. As compensation for financial advisory and investment banking services that may be rendered from time to time in connection with major financial transactions, Petco Animal Supplies agreed to pay TPG and LGP normal and customary fees for services of like kind to be agreed upon, taking into consideration factors such as the size and complexity of the transaction, the time devoted to providing such services and the value of their investment banking expertise and relationships within the business and financial community.
On December 24, 2012, the Managers entered into a transfer agreement pursuant to which they directed the Company to pay a portion of all payments and fees payable to the Managers pursuant to the management services agreement to an affiliate of certain of our stockholders, in an amount equal to such stockholder’s pro rata ownership interest in the Company on the date of any such payment.
We paid the Managers a total of $6.1 million, $6.1 million and $6.9 million in aggregate management fees pursuant to the management services agreement and transfer agreement in fiscal years 2014, 2013 and 2012, respectively.
The management services agreement will terminate in connection with this offering, and upon termination we will pay an aggregate of $ to the Managers.
Stockholders’ Agreement
Our stockholders are the Sponsors, their affiliates and certain co-investors and financing investors, and certain members of management. On December 24, 2012, we entered into an amended and restated stockholders’ agreement with our stockholders, including the Sponsors and certain directors, officers and other holders, which sets forth certain provisions relating to their respective rights and obligations with respect to their capital stock, including with respect to the designation of certain director nominees, preemptive rights, rights of first refusal and first offer upon disposition of shares, permitted transferees, demand and piggyback registration rights, tag along rights, drag along rights, certain protective provisions and actions requiring the approval of stockholders.
Pursuant to the registration rights provisions of the amended and restated stockholders’ agreement, following this offering certain of our stockholders will have demand registration rights, including shelf registration rights, in respect of any shares of common stock held by them, subject to certain conditions. In addition, in the event that we register additional shares of common stock for sale to the public following the completion of this offering, we will be required to give notice of such registration to certain of our stockholders, and, subject to certain limitations, include shares of common stock held by them in such registration. We have agreed to pay certain expenses related to any such registration and to indemnify these stockholders against certain liabilities that may arise under the Securities Act.
128
Table of Contents
In connection with this offering, certain of the provisions in the amended and restated stockholders’ agreement are likely to be further amended.
Indemnification Agreements
Prior to the completion of this offering, we expect to enter into indemnification agreements with each of our directors. These agreements will require us to indemnify these individuals and, in certain cases, affiliates of such individuals, to the fullest extent permissible under Delaware law against liabilities that may arise by reason of their service to us or at our direction, and to advance expenses incurred as a result of any proceeding against them as to which they could be indemnified. Insofar as indemnification for liabilities arising under the Securities Act may be permitted, we have been informed that in the opinion of the SEC such indemnification is against public policy and is therefore unenforceable.
Related Person Transactions Policy
In connection with this offering, we have adopted a policy with respect to the review, approval and ratification of related person transactions. Under the policy, our nominating and governance committee is responsible for reviewing and approving related person transactions. In the course of its review and approval of related person transactions, our nominating and governance committee will consider the relevant facts and circumstances to decide whether to approve such transactions. Related person transactions must be approved or ratified by the nominating and governance committee based on full information about the proposed transaction and the related person’s interest.
We did not have a written policy regarding the review and approval of related person transactions immediately prior to this offering. Nevertheless, with respect to related person transactions, it was our policy for our Board of Directors to consider the nature of and business reason for these transactions, how the terms of these transactions compared to those which might be obtained from unaffiliated third parties and whether these transactions were otherwise fair to and in the best interests of, or not contrary to, our best interests.
129
Table of Contents
PRINCIPAL AND SELLING STOCKHOLDERS
The following table sets forth information relating to the beneficial ownership of our common stock as of August 1, 2015, by:
| • | each person, or group of affiliated persons, known by us to beneficially own more than 5% of our outstanding shares of common stock, which includes each of the selling stockholders; |
| • | each of our directors; |
| • | each of our named executive officers; and |
| • | all directors and executive officers as a group. |
Beneficial ownership is determined in accordance with SEC rules. In general, under these rules a beneficial owner of a security includes any person who, directly or indirectly, through any contract, arrangement, understanding, relationship or otherwise has or shares voting power or investment power with respect to the security. A person is also deemed to be a beneficial owner of a security if that person has the right to acquire beneficial ownership of the security within 60 days. Except as otherwise indicated, and subject to applicable community property laws, the persons named in the table have sole voting and investment power with respect to all shares of common stock held by that person.
The percentage of shares beneficially owned is computed on the basis of 806,977,944 shares of our common stock outstanding as of August 1, 2015. Shares of our common stock that a person has the right to acquire within 60 days of August 1, 2015 are deemed outstanding for purposes of computing the percentage ownership of that person’s holdings, but are not deemed outstanding for purposes of computing the percentage ownership of any other person, except with respect to the percentage ownership of all directors and executive officers as a group. Unless otherwise indicated below, the address for each beneficial owner listed is c/o Petco Holdings, Inc., 10850 Via Frontera, San Diego, California 92127.
130
Table of Contents
| Name and address of beneficial owners |
Shares beneficially owned prior to this offering |
Number of shares being offered |
Number of shares subject to option |
Shares beneficially owned after this offering (without option) |
Shares beneficially owned after this offering (with option) |
|||||||||||||||||||
| Number | Percent | Number | Percent | Number | Percent | |||||||||||||||||||
| 5% stockholders: |
||||||||||||||||||||||||
| TPG Funds(1) |
377,654,293 | 46.8 | % | % | % | |||||||||||||||||||
| Green Equity Investors IV, L.P. and affiliates(2) |
302,257,585 | 37.5 | % | % | % | |||||||||||||||||||
| Abu Dhabi Investment Authority(3) |
100,000,000 | 12.4 | % | |||||||||||||||||||||
| FS Equity Partners V, L.P. |
56,707,733 | 7.0 | % | % | % | |||||||||||||||||||
| Directors and named executive officers: |
|
|||||||||||||||||||||||
| James Myers(5) |
17,312,943 | 2.1 | % | % | % | |||||||||||||||||||
| Brad Weston(6) |
4,850,000 | * | % | % | ||||||||||||||||||||
| Tom Farello(7) |
3,621,688 | * | % | % | ||||||||||||||||||||
| Charles Piscitello(8) |
3,017,819 | * | % | % | ||||||||||||||||||||
| Elisabeth Charles(9) |
1,314,500 | * | ||||||||||||||||||||||
| Larry Rutkowski(10) |
— | — | ||||||||||||||||||||||
| John Baumer(11) |
— | — | % | % | ||||||||||||||||||||
| Jonathan Coslet(12) |
— | — | % | % | ||||||||||||||||||||
| John Danhakl(11) |
— | — | % | % | ||||||||||||||||||||
| Brian K. Devine(13) |
14,359,511 | 1.8 | % | % | % | |||||||||||||||||||
| Lawrence Hayward(14) |
128,802 | * | % | % | ||||||||||||||||||||
| Gary Kusin(15) |
1,616,371 | * | % | % | ||||||||||||||||||||
| Colm Lanigan |
— | — | % | % | ||||||||||||||||||||
| Fred Simmons(4) |
— | — | % | % | ||||||||||||||||||||
| Michael Solomon(11) |
— | — | % | % | ||||||||||||||||||||
| Peter Starrett |
— | — | % | % | ||||||||||||||||||||
| Carrie Wheeler(12) |
— | — | % | % | ||||||||||||||||||||
| All executive officers and directors as a group (25 persons)(16) |
51,160,293 | 6.3 | % | % | % | |||||||||||||||||||
| * | Less than 1%. |
| (1) | Shares shown as beneficially owned by TPG Partners IV, L.P. and its affiliates include the following: 137,043,689 shares held by TPG Partners IV, L.P., a Delaware limited partnership, 136,399,137 shares held by TPG Partners V, L.P., a Delaware limited partnership, 356,820 shares held by TPG FOF V-A, L.P., a Delaware limited partnership, 287,730 shares held by TPG FOF V-B, L.P., a Delaware limited partnership, 1,134,154 shares held by TPG Rover Coinvest, LLC, a Delaware limited liability company; and 102,432,763 shares held by Cavalier Coinvestors, L.P. (“Cavalier”) (collectively, the “TPG Funds”). The general partner of TPG Partners IV, L.P. is TPG GenPar IV, L.P., a Delaware limited partnership, whose general partner is TPG GenPar IV Advisors, LLC. The general partner of each of TPG Partners V, L.P., TPG FOF V-A, L.P. and TPG FOF V-B, L.P. is TPG GenPar V, L.P., a Delaware limited partnership, whose general partner is TPG GenPar V Advisors, LLC, a Delaware limited liability company. The managing member of TPG Rover Coinvest, LLC is TPG Advisors V, Inc., a Delaware corporation. The sole member of each of TPG GenPar IV Advisors, LLC and TPG GenPar V Advisors, LLC is TPG Holdings I, L.P., a Delaware limited partnership, whose general partner is TPG Holdings I-A, LLC, a Delaware limited liability company, whose sole member is TPG Group Holdings (SBS), L.P., a |
131
Table of Contents
| Delaware limited partnership, whose general partner is TPG Group Holdings (SBS) Advisors, Inc., a Delaware corporation. The general partner of Cavalier is King Charles LLC, a Delaware limited liability company, whose members are TPG Advisors V, Inc. and an affiliate of Leonard Green & Partners, L.P. (“LGP”). David Bonderman and James G. Coulter are officers and sole stockholders of TPG Group Holdings (SBS) Advisors, Inc. and TPG Advisors V, Inc., and may therefore be deemed to be the beneficial owners of the shares held by the TPG Funds. Messrs. Bonderman and Coulter disclaim beneficial ownership of the shares held by the TPG Funds except to the extent of their pecuniary interest therein. The address of TPG Group Holdings (SBS) Advisors, Inc., TPG Advisors V, Inc. and Messrs. Bonderman and Coulter is c/o TPG Global, LLC, 301 Commerce Street, Suite 3300, Fort Worth, TX 76102. |
| (2) | Shares shown as beneficially owned by Green Equity Investors IV, L.P. and affiliates include the following: 150,678,119 shares held by Green Equity Investors IV, L.P., a Delaware limited partnership (“GEI IV”); 15,122,063 shares held by Rover Coinvest I, LLC, a Delaware limited liability company; 15,122,063 shares held by Rover Coinvest II, LLC, a Delaware limited liability company; 9,451,288 shares held by Rover Coinvest III, LLC, a Delaware limited liability company; 7,561,031 shares held by Rover Coinvest IV, LLC, a Delaware limited liability company; 1,890,258 shares held by Rover Coinvest V, LLC, a Delaware limited liability company, all of which are managed by LGP; and 102,432,763 shares held by Cavalier, as described above (collectively, the “LGP Funds”). Voting and investment power with respect to the LGP Funds may be deemed to be shared by certain affiliated entities. GEI Capital IV, LLC (“GEIC”), is the general partner of GEI IV. Green IV Holdings, LLC (“Holdings”), is a limited partner of GEI IV. Each of the LGP Funds, GEIC and Holdings disclaims such shared beneficial ownership of the shares. The general partner of Cavalier is King Charles LLC, a Delaware limited liability company, whose members are TPG Advisors V, Inc. and Leonard Green & Partners, L.P. Each of Messrs. Danhakl, Jonathan D. Sokoloff, Jonathan A. Seiffer, John M. Baumer, Timothy J. Flynn, James D. Halper, Todd M. Purdy, Michael S. Solomon, W. Christian McCollum, Usama N. Cortas, J. Kristofer Galashan, and Ms. Alyse M. Wagner either directly (whether through ownership interest or position) or through one or more intermediaries, may be deemed to control GEIC and LGP. As such, these individuals may be deemed to have shared voting and investment power with respect to all shares beneficially owned by the LGP Funds. These individuals each disclaim beneficial ownership of the securities held by the LGP Funds except to the extent of their pecuniary interest therein. The address for each of the foregoing individuals and the LGP Funds is c/o Leonard Green & Partners, L.P., 11111 Santa Monica Blvd., Suite 1900, Los Angeles, CA 90025. |
| (3) | The Investment Committee of Abu Dhabi Investment Authority (“ADIA”), which is chaired by its Managing Director, is responsible for managing and overseeing investment-related matters for ADIA, including authority over the exercise of investment and voting powers with respect to investments. The Investment Committee consists of: H.H. Sheikh Hamed Bin Zayed Al Nahyan (Managing Director), H.E. Khalil Mohammed Sharif Foulathi, H.E. Hareb Masood Hamad Rashed Aldarmaki, H.H. Sheikh Mohammed Bin Khalifa bin Zayed Al Nahhyan, H.E. Hamad Mohammed Al Hurr Al Suwaidi, Mohamed Ahmed M. Bandouq Alqamzi, Obaid Murad Hassan Abdulla Alsuwaidi, Nasser Shotait Salem Rashed Al Ketbi, Khalifa Matar Khalifa Qaroona Almheiri, Majed Salem Khalifa Rashed Alromaithi, Hamad Shahwan Surour Shahwan Aldhaheri, Juma Khamis Mugheer Jaber Alkhyeli and Salem Mohamed Helal Rashed Almazrouei. The address for ADIA is 211 Corniche Street, P.O. Box 3600, Abu Dhabi UAE. |
| (4) | Shares shown as beneficially owned by FS Equity Partners V, L.P. and affiliates include the following: 55,959,191 shares held by FS Equity Partners V, L.P. and 748,542 shares held by FS Affiliates V, L.P. Mr. Simmons is a general partner of FS Equity Partners V, L.P. and/or its affiliates, and therefore may be deemed to have beneficial ownership of the shares beneficially owned by FS Equity Partners V, L.P. and affiliates. Mr. Simmons disclaims beneficial ownership of such shares. The address for FS Equity Partners V, L.P. is 11100 Santa Monica Blvd., Suite 1900, Los Angeles, CA 90025. |
132
Table of Contents
| (5) | Includes (i) 6,124,755 shares held by the Myers Family Trust, for which Mr. Myers has voting and investment control, (ii) 2,000,000 shares held by the The Myers Family 2007 Irrevocable Trust dated April 24, 2007, for which Mr. Myers has voting and investment control, and (iii) 9,188,188 shares subject to options which are currently exercisable or exercisable within 60 days after August 1, 2015. |
| (6) | Includes 3,950,000 shares which are currently exercisable or exercisable within 60 days after August 1, 2015. |
| (7) | Includes 1,957,904 shares which are currently exercisable or exercisable within 60 days after August 1, 2015. |
| (8) | Includes 2,467,819 shares which are currently exercisable or exercisable within 60 days after August 1, 2015. |
| (9) | Includes 406,165 shares which are currently exercisable. Ms. Charles served as Senior Vice President, Chief Marketing Officer until her termination of employment on August 22, 2014. Although she is a former employee, she is included as a named executive officer pursuant to SEC rules. |
| (10) | Mr. Rutkowski served as Executive Vice President & Chief Financial Officer from April 28, 2014, until his termination of employment on December 1, 2014. Although he is a former employee, he is included as a named executive officer pursuant to SEC rules. |
| (11) | Does not include shares held by the LGP Funds. John Baumer, John Danhakl and Michael Solomon are partners of LGP and may be deemed to beneficially own shares held by the LGP Funds. The address for each of the foregoing individuals is c/o Leonard Green & Partners, L.P., 11111 Santa Monica Blvd., Suite 1900, Los Angeles, CA 90025. |
| (12) | Jonathan J. Coslet is a TPG Senior Partner and Carrie A. Wheeler is a TPG Partner. Neither Mr. Coslet nor Ms. Wheeler has voting or investment power over and each disclaims beneficial ownership of the shares of common stock owned by the TPG Funds. The address of Mr. Coslet and Ms. Wheeler is c/o TPG Global, LLC, 301 Commerce Street, Suite 3300, Fort Worth, TX 76102. |
| (13) | Includes (i) 6,632,379 shares held by The Devine Family Trust, for which Mr. Devine and his wife share voting and investment power, (ii) 2,171,821 shares held by the Brian Devine Jr. Irrevocable Trust, 2,927,922 shares held by the Brooke Devine Irrevocable Trust, and 1,415,717 held by the Devine Descendants’ Irrevocable Trust for which Mr. Devine has voting and investment power, (iii) 20 shares held by Devine Investments, LLC, for which Mr. Devine has voting and investment power, and (iv) 1,211,652 shares subject to options which are currently exercisable or exercisable within 60 days after August 1, 2015. |
| (14) | Includes 12,000 shares which are currently exercisable or exercisable within 60 days after August 1, 2015. |
| (15) | Includes 1,395,832 shares held by the Karleen Kusin Investment Trust, for which Mr. Kusin’s spouse has voting and investment power and 220,539 shares held in Mr. Kusin’s name. |
| (16) | Includes 23,030,117 shares subject to stock options which are currently exercisable or exercisable within 60 days after August 1, 2015 held by our executive officers and directors. |
133
Table of Contents
We summarize below the principal terms of the agreements that govern our existing indebtedness. We refer you to the exhibits to the registration statement of which this prospectus forms a part for copies of agreements governing the indebtedness described below. The below descriptions are qualified in their entirety by reference to these exhibits.
Senior Secured Credit Facilities
Petco Animal Supplies has a $1,225.0 million ($1,212.8 million, net of original issue discount) senior secured term loan facility (the “term loan facility”), maturing on November 24, 2017, which was most recently amended on February 5, 2013, and a senior secured asset-based revolving credit facility (the “revolving credit facility”), providing for senior secured financing of up to $400.0 million, subject to a borrowing base, expiring on April 19, 2018 (subject to a springing maturity 91 days inside the term loan facility maturity), which was most recently amended on November 21, 2014. The term loan facility and the revolving credit facility are collectively referred to as the “senior secured credit facilities.”
The obligations under our senior secured credit facilities are unconditionally guaranteed by each of Petco Animal Supplies’ domestic material subsidiaries (the “Guarantors”) and secured, subject to certain exceptions, by substantially all assets of Petco Animal Supplies and the Guarantors.
The credit agreements governing the senior secured credit facilities contain certain customary affirmative and negative covenants that relate to indebtedness, liens, fundamental changes in the business, investments, restricted payments and agreements, among other things. The credit agreement governing the revolving credit facility requires Petco Animal Supplies to comply with a minimum fixed charge coverage ratio if excess availability falls below a specified threshold. Under the credit agreement governing the revolving term loan facility, compliance with a minimum fixed charge coverage is a condition to Petco Animal Supplies taking certain corporate actions. These covenants apply to Petco Animal Supplies and its restricted subsidiaries.
The credit agreements governing the senior secured credit facilities contain customary default provisions including, among others, the failure to make payments when due, defaults under other material indebtedness, non-compliance with covenants, change of control and bankruptcy, the occurrence of any of which would limit our ability to draw on the revolving credit facility and could result in the lenders under our senior secured credit facilities accelerating the maturity of such indebtedness and foreclosing upon the collateral pledged thereunder. Under the credit agreements governing our senior secured credit facilities, we are and will be permitted to enter into certain additional borrowing arrangements, subject to certain limitations. At August 1, 2015, we were in compliance with all of the covenants under the credit agreements governing the senior secured credit facilities.
Revolving Credit Facility
Our revolving credit facility was most recently amended on November 21, 2014 to increase the aggregate amount of commitments available thereunder from $300.0 million to $400.0 million. The original revolving commitments were increased from $300.0 million to $360.0 million (“Tranche A”), and a new $40.0 million first in-last out revolving commitment (the “FILO commitment”) was added. The terms of the revolving credit facility remain substantially unchanged. In the fourth quarter of fiscal 2014 we drew the full amount of the FILO commitment to partially finance the asset acquisition of Drs. Foster and Smith. As of August 1, 2015, $71.0 million was outstanding under our revolving credit facility.
134
Table of Contents
The revolving credit facility has availability up to $400.0 million and a $150.0 million letter of credit sub-facility. The availability is limited to a borrowing base, which allows us to borrow up to 90.0% of eligible credit card receivables plus the lesser of 85.0% of eligible inventory and 90.0% of the net orderly liquidation value of the inventory, net of certain reserves, for Tranche A. The FILO commitment borrowing base is incremental to the Tranche A borrowing base and is 10.0% of the eligible credit card receivables plus 10.0% of the net orderly liquidation value of eligible inventory (which advance rates will be reduced to 7.5% and 5% on November 21, 2015 and November 21, 2016, respectively). Letters of credit reduce the amount available to borrow under the revolving credit facility by their face value.
Interest on the revolving credit facility is based on either the bank’s alternate base rate payable quarterly in arrears or the London Interbank Offered Rate (“LIBOR”) payable upon maturity of the LIBOR contract, in either case plus a spread. The spread rates are dependent on average historical excess availability under the revolving credit facility and are currently calculated as follows:
| FILO Commitment | Tranche A | |||||||||||||||
| Average Historical Excess Availability |
LIBOR Spread |
Alternate Bank Rate Spread (typically prime rate) |
LIBOR Spread |
Alternate Bank Rate Spread (typically prime rate) |
||||||||||||
| Less than $120.0 million |
3.00 | % | 2.00 | % | 1.75 | % | 0.75 | % | ||||||||
| From $120.0 million to $240.0 million |
2.75 | % | 1.75 | % | 1.50 | % | 0.50 | % | ||||||||
| In excess of $240.0 million |
2.50 | % | 1.50 | % | 1.25 | % | 0.25 | % | ||||||||
The rate in effect on unused commitments is 0.25% and is not dependent upon excess availability. The FILO commitment reduces by $10.0 million on each of November 21, 2015 and November 21, 2016, and Petco Animal Supplies is required to prepay outstanding FILO loans to the extent these loans exceed the lower commitment level. The FILO loans may be prepaid at any time without penalty and any amounts prepaid cannot be reborrowed.
At August 1, 2015, $280.6 million remains available under the revolving credit facility. This amount is net of $48.4 million of outstanding letters of credit.
Term Loan Facility
At August 1, 2015, the outstanding principal balance of our term loan facility was $1,169.9 million ($1,166.8 million, net of the unamortized discount). Interest under the term loan facility is at our option of the bank’s alternative base rate, payable quarterly in arrears, or LIBOR (subject to a 1.00% floor), payable upon maturity of the LIBOR contract, plus the applicable rate in either case. The alternative base rate is the greater of the bank prime rate, federal funds effective rate plus 0.5% or adjusted LIBOR plus 1.0%. The applicable rate is either 2.00% per annum for an alternative base rate loan or 3.00% per annum for a LIBOR loan.
Principal payments under the term loan facility are $3.1 million quarterly and are due as follows (in thousands):
| Fiscal years |
Principal payment due |
|||
| 2015 |
$ | 12,250 | ||
| 2016 |
12,250 | |||
| 2017 |
1,151,500 | |||
|
|
|
|||
| Total payments |
$ | 1,176,000 | ||
|
|
|
|||
135
Table of Contents
Senior Notes
Petco Animal Supplies issued unsecured senior notes (the “senior notes”) maturing on December 1, 2018 in a private offering on November 24, 2010. The senior notes bear interest at the rate of 9.25% per annum, payable semi- annually in arrears on June 1 and December 1. There are no registration rights associated with the senior notes. At August 1, 2015, the outstanding principal balance of the senior notes was $500.0 million and the carrying amount was $494.9 million, net of unamortized discount.
The senior notes are guaranteed on an unsecured basis by Petco Stores and each of Petco Animal Supplies’ other subsidiaries that guarantee the senior secured credit facilities.
Petco Animal Supplies may redeem the senior notes at its option, in whole or in part, based on the following agreed-upon schedule of redemption prices if redeemed during the 12-month period beginning on December 1 of each of the years indicated below:
| Year |
Percentage | |||
| 2014 |
104.625 | % | ||
| 2015 |
102.313 | % | ||
| 2016 and thereafter |
100.000 | % | ||
The indenture governing the senior notes contains negative covenants substantially similar to, but less restrictive than, those in our senior secured credit facilities. In addition, the indenture governing the senior notes contains a number of events of default (many of which are subject to applicable cure periods), including, among others, the failure to make payments when due, defaults under other agreements or instruments of indebtedness and non-compliance with covenants. Upon the occurrence of an event of default, the holders of the senior notes may declare all amounts outstanding to be immediately due and payable. Under the indenture governing our senior notes, we are and will be permitted to enter into certain additional borrowing arrangements, subject to certain limitations. At August 1, 2015, we were in compliance with all of the covenants under the indenture governing the senior notes.
Senior PIK Toggle Notes
On October 10, 2012, we issued $550.0 million in aggregate principal amount of unsecured senior PIK toggle notes maturing on October 15, 2017 in a private offering at a 0.5% original issue discount (the “PIK toggle notes”). There are no registration rights associated with the PIK toggle notes. At August 1, 2015, the aggregate principal amount of our PIK toggle notes was $550.0 million ($548.6 million, net of the unamortized discount).
The PIK toggle notes bear interest at the rate of 8.50% per annum for cash interest and 9.25% for PIK interest, payable semi-annually in arrears on April 15 and October 15. For each interest payment (other than for the final interest period ending at stated maturity, which is to be paid in cash), we are required to pay interest on the PIK toggle notes entirely in cash, unless certain conditions are satisfied, in which case we are entitled to pay, to a certain extent, interest for that period by either increasing the principal amount of the notes or by issuing new notes for the amount of the interest payment.
We may redeem the PIK toggle notes at our option, in whole or in part, based on the following agreed-upon schedule of redemption prices if redeemed during the 12-month period beginning on October 15 of each of the years indicated below:
| Year |
Percentage | |||
| 2014 |
103.000 | % | ||
| 2015 |
101.500 | % | ||
| 2016 and thereafter |
100.000 | % | ||
136
Table of Contents
The indenture governing the PIK toggle notes contains negative covenants substantially similar to, but less restrictive than, those in our senior secured credit facilities. In addition, the indenture governing the PIK toggle notes contains a number of events of default (many of which are subject to applicable cure periods), including, among others, the failure to make payments when due, defaults under other agreements or instruments of indebtedness and non-compliance with covenants. Upon the occurrence of an event of default, the holders of the PIK toggle notes may declare all amounts outstanding to be immediately due and payable. Under the indenture governing our PIK toggle notes, we are and will be permitted to enter into certain additional borrowing arrangements, subject to certain limitations. At August 1, 2015, we were in compliance with all of the covenants under the indenture governing the PIK toggle notes.
Construction Loan
On March 20, 2015, one of our indirect wholly owned subsidiaries entered into a secured construction loan agreement for $42.7 million, to partially finance the construction of our new San Diego, California co-headquarters facility. Once construction on the facility is completed, which is to be no later than August 1, 2016, the construction loan will convert into a term loan and will mature 102 months following the conversion date. The note bears interest at 3.75% per year. During the construction loan period, interest incurred will be added to the principal balance on a monthly basis. During the term loan period, interest and principal will be paid monthly based on an amortization period of 162 months. On the term loan maturity date, all principal and unpaid interest will be payable in full. We may prepay the loan in part or in full during the loan period subject to certain conditions and fees. On May 4, 2015, the first draw on the construction loan of $19.8 million was made, and as of August 1, 2015 there was $20.3 million outstanding.
137
Table of Contents
General
Upon completion of this offering, our authorized capital stock will consist of shares of common stock, par value $0.001 per share, and shares of preferred stock, par value $0.001 per share. As of August 1, 2015, we had 806,977,944 shares of common stock outstanding held by 118 shareholders of record and no shares of preferred stock outstanding. After consummation of this offering, we expect to have 806,977,944 shares of our common stock outstanding and zero shares of our preferred stock outstanding. This excludes:
| • | shares of common stock issuable upon exercise of stock options outstanding as of , 2015 at a weighted average exercise price of $ per share; |
| • | shares of common stock underlying RSUs subject to future vesting requirements as of , 2015; |
| • | shares of common stock reserved for future issuance under our equity incentive plans as of , 2015; and |
| • | that number of shares of common stock issuable upon exercise of a warrant to purchase shares of common stock, exercisable in connection with this offering, determined by dividing $ by the average closing price of a share of our common stock as reported on for the first 30 consecutive trading days commencing on the effective date of this offering. |
The following description of our capital stock is intended as a summary only and is qualified in its entirety by reference to our certificate of incorporation and bylaws to be in effect at the closing of this offering, which are filed as exhibits to the registration statement of which this prospectus forms a part, and to the applicable provisions of the DGCL.
Common Stock
Dividend rights. Subject to preferences that may apply to shares of preferred stock outstanding at the time, holders of outstanding shares of common stock will be entitled to receive dividends out of assets legally available at the times and in the amounts as the Board of Directors may determine from time to time. See “Dividend Policy.”
Voting rights. Each outstanding share of common stock will be entitled to one vote on all matters submitted to a vote of stockholders. Holders of shares of our common stock will have no cumulative voting rights.
Preemptive rights. Our common stock will not be entitled to preemptive or other similar subscription rights to purchase any of our securities.
Conversion or redemption rights. Our common stock will be neither convertible nor redeemable.
Liquidation rights. Upon our liquidation, the holders of our common stock will be entitled to receive pro rata our assets that are legally available for distribution, after payment of all debts and other liabilities and subject to the prior rights of any holders of preferred stock then outstanding.
Preferred Stock
Our Board of Directors may, without further action by our stockholders, from time to time, direct the issuance of shares of preferred stock in series and may, at the time of issuance, determine the
138
Table of Contents
designations, powers, preferences, privileges and relative participating, optional or special rights, as well as the qualifications, limitations or restrictions thereof, including dividend rights, conversion rights, voting rights, terms of redemption and liquidation preferences, any or all of which may be greater than the rights of the common stock. Satisfaction of any dividend preferences of outstanding shares of preferred stock would reduce the amount of funds available for the payment of dividends on shares of our common stock. Holders of shares of preferred stock may be entitled to receive a preference payment in the event of our liquidation before any payment is made to the holders of shares of our common stock. Under certain circumstances, the issuance of shares of preferred stock may render more difficult or tend to discourage a merger, tender offer or proxy contest, the assumption of control by a holder of a large block of our securities or the removal of incumbent management. Upon the affirmative vote of a majority of the total number of directors then in office, our Board of Directors, without stockholder approval, may issue shares of preferred stock with voting and conversion rights which could adversely affect the holders of shares of our common stock and the market value of our common stock. Upon consummation of this offering, there will be no shares of preferred stock outstanding, and we have no present intention to issue any shares of preferred stock.
Anti-Takeover Effects of Our Certificate of Incorporation and Our Bylaws
Our certificate of incorporation and our bylaws contain provisions that may delay, defer or discourage another party from acquiring control of us. We expect that these provisions will discourage coercive takeover practices or inadequate takeover bids. These provisions are also designed to encourage persons seeking to acquire control of us to first negotiate with the Board of Directors, which we believe may result in an improvement of the terms of any such acquisition in favor of our stockholders. However, these provisions may also discourage acquisitions that some stockholders may favor.
Corporate Opportunities
Our certificate of incorporation provides that we renounce any interest or expectancy in the business opportunities of the Sponsors and of their affiliates, subsidiaries, officers, directors, agents, stockholders, members, managers, employees, partners, and principals, including any of the foregoing who serves as a director or officer of our company, and each such party will not have, to the fullest extent permitted by applicable law, any obligation to offer us those opportunities unless presented to one of our directors or officers in his or her capacity as a director or officer.
Limitations on Liability and Indemnification of Directors and Officers
Our certificate of incorporation limits the liability of our directors to the fullest extent permitted by the DGCL and provides that we may indemnify them. Our amended and restated stockholders’ agreement requires us to enter into indemnification agreements with directors who serve as representatives of the Sponsors, and we expect to enter into customary indemnification agreements with each of our directors that provide them, in general, with customary indemnification in connection with their service to us or on our behalf. We also maintain officers’ and directors’ liability insurance that insures against liabilities that our officers and directors may incur in such capacities.
Transfer Agent and Registrar
The transfer agent and registrar for our common stock is American Stock Transfer & Trust Company, LLC.
Listing
We have applied to list our common stock on under the symbol “ .”
139
Table of Contents
SHARES ELIGIBLE FOR FUTURE SALE
Before this offering, there has been no public market for our common stock. As described below, only a limited number of shares currently outstanding will be available for sale immediately after this offering due to contractual and legal restrictions on resale. Nevertheless, future sales of substantial amounts of our common stock, including shares issued upon the exercise of outstanding options or warrants, in the public market after this offering, or the perception that those sales may occur, could cause the prevailing market price for our common stock to fall or impair our ability to raise capital through sales of our equity securities.
Upon the closing of this offering, we will have outstanding shares of our common stock, assuming no exercise of options or the warrant outstanding as of , 2015, and without giving effect to shares of common stock underlying RSUs subject to future vesting requirements as of , 2015.
Of the shares that will be outstanding immediately after the closing of this offering, we expect that the shares to be sold in this offering will be freely tradable without restriction under the Securities Act unless purchased by our “affiliates,” as that term is defined in Rule 144 under the Securities Act. Shares purchased by our affiliates may not be resold except pursuant to an effective registration statement or an exemption from registration, including the safe harbor under Rule 144 of the Securities Act described below. In addition, following this offering, shares of common stock issuable pursuant to awards granted under certain of our equity plans that are covered by a registration statement on Form S-8 will be freely tradable in the public market, subject to certain contractual and legal restrictions described below.
The remaining shares of our common stock outstanding after this offering will be “restricted securities,” as that term is defined in Rule 144 of the Securities Act, and we expect that substantially all of these restricted securities will be subject to the lock-up agreements described below. These restricted securities may be sold in the public market only if the sale is registered or pursuant to an exemption from registration, such as the safe harbor provided by Rule 144.
Lock-Up Restrictions
Our officers, directors and certain holders of our common stock, including the selling stockholders, who collectively own shares of our common stock following this offering, have agreed that, without the prior written consent of certain of the underwriters, we and they will not, subject to limited exceptions, directly or indirectly sell or dispose of any shares of common stock or any securities convertible into or exchangeable or exercisable for shares of common stock for a period of 180 days after the date of this prospectus, unless extended pursuant to its terms. The lock-up restrictions and specified exceptions are described in more detail under “Underwriting.”
Rule 144
In general, under Rule 144, beginning 90 days after the date of this prospectus, any person who is not our affiliate and has held their shares for at least six months, including the holding period of any prior owner other than one of our affiliates, may sell shares without restriction, subject to the availability of current public information about us. In addition, under Rule 144, any person who is not our affiliate and has not been our affiliate at any time during the preceding three months and has held their shares for at least one year, including the holding period of any prior owner other than one of our affiliates, would be entitled to sell an unlimited number of shares immediately upon the closing of this offering without regard to whether current public information about us is available.
140
Table of Contents
Beginning 90 days after the date of this prospectus, a person who is our affiliate or who was our affiliate at any time during the preceding three months and who has beneficially owned restricted securities for at least six months, including the holding period of any prior owner other than one of our affiliates, is entitled to sell a number of shares within any three-month period that does not exceed the greater of: (i) 1% of the number of shares of our common stock outstanding, which will equal approximately shares immediately after this offering; and (ii) the average weekly trading volume of our common stock on during the four calendar weeks preceding the filing of a notice on Form 144 with respect to the sale.
Sales under Rule 144 by our affiliates are also subject to certain manner of sale provisions, notice requirements and the availability of current public information about us.
Rule 701
In general, under Rule 701 under the Securities Act, beginning 90 days after we become subject to the public company reporting requirements of the Exchange Act, any of our employees, directors, officers, consultants or advisors who acquired shares of common stock from us in connection with a written compensatory stock or option plan or other written agreement in compliance with Rule 701 is entitled to sell such shares in reliance on Rule 144 but without compliance with certain of the requirements contained in Rule 144. Accordingly, subject to any applicable lock-up restrictions, beginning 90 days after we become subject to the public company reporting requirements of the Exchange Act, under Rule 701 persons who are not our affiliates may resell those shares without complying with the minimum holding period or public information requirements of Rule 144, and persons who are our affiliates may resell those shares without compliance with Rule 144’s minimum holding period requirements.
Equity Incentive Plans
Following this offering, we intend to file with the SEC a registration statement on Form S-8 under the Securities Act covering the shares of common stock that are subject to outstanding options and other awards issuable pursuant to our equity incentive plans. Shares covered by such registration statement will be available for sale in the open market following its effective date, subject to certain Rule 144 limitations applicable to affiliates and the terms of lock-up restrictions applicable to those shares.
Registration Rights
Subject to the lock-up restrictions described above, certain holders of our common stock may demand that we register the sale of their shares under the Securities Act or, if we file another registration statement under the Securities Act other than a Form S-8 covering securities issuable under our equity plans or on Form S-4, may elect to include their shares of common stock in such registration. Following such registered sales, the shares will be freely tradable without restriction under the Securities Act, unless held by our affiliates. If these registration rights are exercised and current holders of our common stock sell a large number of shares, the market price of our common stock could decline. See “Certain Relationships and Related Party Transactions—Stockholders Agreement.”
141
Table of Contents
CERTAIN MATERIAL UNITED STATES FEDERAL INCOME TAX CONSIDERATIONS FOR NON-U.S. HOLDERS
The following is a summary of certain material U.S. federal income and estate tax considerations relating to the purchase, ownership and disposition of shares of our common stock issued pursuant to this offering by Non-U.S. Holders (defined below). This summary is not a complete analysis of all the potential tax considerations relevant to Non-U.S. Holders of shares of our common stock. This summary is based upon the Internal Revenue Code of 1986, as amended (the “Internal Revenue Code”), the Treasury regulations promulgated or proposed thereunder and administrative and judicial interpretations thereof, all as of the date hereof and all of which are subject to change or differing interpretations at any time, possibly with retroactive effect.
This summary assumes that shares of our common stock are held by Non-U.S. Holders as “capital assets” within the meaning of Section 1221 of the Internal Revenue Code (generally, property held for investment). This summary does not purport to deal with all aspects of U.S. federal income and estate taxation that might be relevant to particular Non-U.S. Holders in light of their particular investment circumstances or status, nor does it address specific tax considerations that may be relevant to particular persons who are subject to special treatment under U.S. federal income tax laws (including, for example, financial institutions, broker-dealers, insurance companies, tax-exempt organizations, non-U.S. governments, entities or arrangements treated for U.S. federal income tax purposes as partnerships or disregarded entities, certain U.S. expatriates or former long-term residents of the United States, tax-exempt organizations, pension plans, “controlled foreign corporations,” “passive foreign investment companies,” corporations that accumulate earnings to avoid U.S. federal income tax, persons in special situations, such as those who have elected to mark securities to market or those who hold shares of our common stock as part of a straddle, hedge, conversion transaction, synthetic security or other integrated investment, or persons that have a “functional currency” other than the U.S. dollar). In addition, except as explicitly addressed herein with respect to estate tax, this summary does not address certain estate and any gift tax considerations, and it does not address considerations arising under the tax laws of any state, local or non-U.S. jurisdiction or any considerations relating to the alternative minimum tax or the Medicare tax on net investment income.
For purposes of this summary, a “Non-U.S. Holder” means a beneficial owner of shares of our common stock that for U.S. federal income tax purposes, is an individual, corporation, estate or trust other than:
| • | an individual who is a citizen or resident of the United States; |
| • | a corporation, or any other organization taxable as a corporation for U.S. federal income tax purposes, that is created or organized in or under the laws of the United States, any state thereof or the District of Columbia; |
| • | an estate, the income of which is included in gross income for U.S. federal income tax purposes regardless of its source; or |
| • | a trust if (1) a U.S. court is able to exercise primary supervision over the trust’s administration and one or more United States persons (as defined in the Internal Revenue Code) have the authority to control all of the trust’s substantial decisions or (2) the trust has a valid election in effect under applicable U.S. Treasury regulations to be treated as a United States person. |
A modified definition of Non-U.S. Holder applies for U.S. federal estate tax purposes (as discussed below).
If an entity that is classified as a partnership for U.S. federal income tax purposes holds shares of our common stock, the tax treatment of persons treated as its partners for U.S. federal income tax purposes will generally depend upon the status of the partner and the activities of the partnership.
142
Table of Contents
Partnerships and other entities that are classified as partnerships for U.S. federal income tax purposes and persons holding our common stock through a partnership or other entity classified as a partnership for U.S. federal income tax purposes are urged to consult their own tax advisors.
There can be no assurance that the Internal Revenue Service (“IRS”) will not challenge one or more of the tax consequences described herein, and we have not obtained, nor do we intend to obtain, a ruling from the IRS or an opinion of counsel with respect to the U.S. federal income or estate tax consequences to a Non-U.S. Holder of the purchase, ownership or disposition of shares of our common stock.
THIS SUMMARY IS NOT INTENDED TO BE TAX ADVICE. PROSPECTIVE INVESTORS ARE URGED TO CONSULT THEIR OWN TAX ADVISORS CONCERNING THE U.S. FEDERAL INCOME AND ESTATE TAXATION AND OTHER TAX CONSEQUENCES TO THEM OF THE PURCHASE, OWNERSHIP AND DISPOSITION OF SHARES OF OUR COMMON STOCK, AS WELL AS THE APPLICATION OF STATE, LOCAL AND NON-U.S. INCOME AND OTHER TAX LAWS.
Distributions on Shares of Our Common Stock
As discussed under “Dividend Policy” above, we do not currently anticipate paying cash dividends on shares of our common stock in the foreseeable future. In the event that we do make a distribution of cash or property with respect to shares of our common stock, any such distributions generally will constitute dividends for U.S. federal income tax purposes to the extent of our current or accumulated earnings and profits as determined under U.S. federal income tax principles, and will be subject to withholding as described in the next paragraph below. If a distribution exceeds our current or accumulated earnings and profits, the excess will be treated as a tax-free return of the Non-U.S. Holder’s investment, up to such holder’s adjusted tax basis in its shares of our common stock. Any remaining excess will be treated as capital gain, subject to the tax treatment described below in “—Gain on Sale, Exchange or Other Taxable Disposition of our Common Stock.” Any distribution described in this paragraph would also be subject to the to the Foreign Account Tax Compliance Act (defined below), as discussed below.
Any dividends paid to a Non-U.S. Holder with respect to shares of our common stock generally will be subject to a 30% U.S. federal withholding tax unless such Non-U.S. Holder provides us or our agent, as the case may be, with an appropriate IRS Form W-8, such as:
| • | IRS Form W-8BEN (or successor form) or IRS Form W-8BEN-E (or successor form) certifying, under penalties of perjury, that such Non-U.S. Holder is entitled to a reduction in withholding under an applicable income tax treaty; or |
| • | IRS Form W-8ECI (or successor form) certifying, under penalties of perjury, that a dividend paid on shares of our common stock is not subject to withholding tax because it is effectively connected with conduct of a trade or business in the United States of the Non-U.S. Holder (in which case such dividend generally will be subject to regular graduated U.S. federal income tax rates on a net income basis as described below). |
The certifications described above must be provided to us or our agent prior to the payment of dividends and must be updated periodically. The certification also may require a Non-U.S. Holder that provides an IRS form or that claims treaty benefits to provide its U.S. taxpayer identification number. Special certification and other requirements apply in the case of certain Non-U.S. Holders that are intermediaries or pass-through entities for U.S. federal income tax purposes.
Each Non-U.S. Holder is urged to consult its own tax advisor about the specific methods for satisfying these requirements. A claim for exemption will not be valid if the person receiving the applicable form has actual knowledge or reason to know that the statements on the form are false.
143
Table of Contents
If dividends are effectively connected with the conduct of a trade or business in the United States of the Non-U.S. Holder (and, if required by an applicable income tax treaty, are attributable to a permanent establishment or fixed base maintained by such Non-U.S. Holder in the United States), the Non-U.S. Holder, although exempt from the withholding tax described above (provided that the certifications described above are satisfied), will generally be subject to U.S. federal income tax on such dividends on a net income basis in the same manner as if it were a resident of the United States. In addition, if such Non-U.S. Holder is taxable as a corporation for U.S. federal income tax purposes, such Non-U.S. Holder may be subject to an additional “branch profits tax” equal to 30% of its effectively connected earnings and profits for the taxable year, unless an applicable income tax treaty provides otherwise.
Non-U.S. Holders that do not timely provide us or our agent with the required certification, but which are eligible for a reduced rate of U.S. federal withholding tax pursuant to an applicable income tax treaty may obtain a refund or credit of any excess amount withheld by timely filing an appropriate claim for refund with the IRS. Non-U.S. Holders should consult their tax advisors regarding their entitlement to benefits under a tax treaty.
If at the time a distribution is made we are not able to determine whether or not it will be treated as a dividend for U.S. federal income tax purposes (as opposed to being treated as a return of capital or capital gain), we or a financial intermediary may withhold tax on all or a portion of such distribution at the rate applicable to dividends. However, a Non-U.S. Holder may obtain a refund of any excess withholding by timely filing an appropriate claim for refund with the IRS.
Gain on Sale, Exchange or Other Taxable Disposition of Shares of Our Common Stock
Subject to the discussion below regarding backup withholding and the Foreign Account Tax Compliance Act, in general, a Non-U.S. Holder will not be subject to U.S. federal income tax or withholding tax on any gain realized upon such holder’s sale, exchange or other disposition of shares of our common stock unless (i) such Non-U.S. Holder is an individual who is present in the United States for 183 days or more in the taxable year of disposition, and certain other conditions are met, (ii) we are or have been a “United States real property holding corporation,” as defined in the Internal Revenue Code (a “USRPHC”), at any time within the shorter of the five-year period preceding the disposition and the Non-U.S. Holder’s holding period with respect to the applicable shares of our common stock (the “relevant period”), or (iii) such gain is effectively connected with the conduct by such Non-U.S. Holder of a trade or business in the United States (and, if required by an applicable income tax treaty, is attributable to a permanent establishment or fixed base maintained by such Non-U.S. Holder in the United States).
If the first exception applies, the Non-U.S. Holder generally will be subject to U.S. federal income tax at a rate of 30% (unless an applicable income tax treaty provides otherwise) on the amount by which such Non-U.S. Holder’s capital gains allocable to U.S. sources exceed capital losses allocable to U.S. sources during the taxable year of the disposition.
With respect to the second exception above, although there can be no assurance, we believe we are not, and we do not currently anticipate becoming, a USRPHC. However, because the determination of whether we are a USRPHC depends on the fair market value of our U.S. real property relative to the fair market value of other business assets, there can be no assurance that we are not currently or will not become a USRPHC in the future. Generally, a corporation is a USRPHC only if the fair market value of its United States real property interests (as defined in the Internal Revenue Code) equals or exceeds 50% of the sum of the fair market value of its worldwide real property interests plus certain other assets used or held for use in a trade or business. Even if we are or become a USRPHC, a Non-U.S. Holder would not be subject to U.S. federal income tax on a sale, exchange or other
144
Table of Contents
taxable disposition of our common stock by reason of our status as a USRPHC so long as (a) our common stock is regularly traded on an established securities market (within the meaning of Internal Revenue Code Section 897(c)(3)) during the calendar year in which such sale, exchange or other taxable disposition of our common stock occurs and (b) such Non-U.S. Holder does not own and is not deemed to own (directly, indirectly or constructively) more than 5% of our common stock at any time during the relevant period. If we are a USRPHC and the requirements of (a) or (b) are not met, gain on the disposition of shares of our common stock generally will be taxed in the same manner as gain that is effectively connected with the conduct of a U.S. trade or business, except that the “branch profits tax” generally will not apply. Prospective investors are urged to consult their own tax advisors regarding the possible consequences to them if we are, or were to become, a USRPHC.
If the third exception applies, the Non-U.S. Holder generally will be subject to U.S federal income tax on a net income basis with respect to such gain in the same manner as if such holder were a resident of the United States, unless otherwise provided in an applicable income tax treaty, and a Non-U.S. Holder that is a corporation for U.S federal income tax purposes may also be subject to a “branch profits tax” on its effectively connected earnings and profits at a rate of 30%, unless an applicable income tax treaty provides otherwise.
Foreign Account Tax Compliance Act
Sections 1471 to 1474 of the Internal Revenue Code, as modified by Treasury regulations and subject to any official interpretations thereof, any applicable intergovernmental agreement between the United States and a non-U.S. government to implement these rules and improve international tax compliance, or any fiscal or regulatory legislation or rules adopted pursuant to any such agreement (collectively, the “Foreign Account Tax Compliance Act” or “FATCA”), impose a U.S. federal withholding tax at a rate of 30% on payments of dividends on, or gross proceeds from the sale or other disposition of, our common stock paid to certain foreign entities, unless generally (i) if the foreign entity is a “foreign financial institution,” such foreign entity undertakes certain due diligence, reporting, withholding, and certification obligations, (ii) if the foreign entity is not a “foreign financial institution,” such foreign entity identifies certain of its U.S. investors, if any, or (iii) the foreign entity is otherwise exempt from the taxes imposed under FATCA. The withholding rules under FATCA generally currently apply to payments of dividends on our common stock and generally will apply to payments of gross proceeds from the sale or other disposition of our common stock made after December 31, 2016. Non-U.S. rules that implement intergovernmental agreements between the United States and other countries in which a Non-U.S. Holder or intermediary is located may modify the FATCA rules described above. Prospective investors should consult their own tax advisors regarding the possible implications of FATCA (or non-U.S. rules that implement intergovernmental agreements) on their investment in our common stock, and the entities (including financial intermediaries) through which they hold our common stock, including, without limitation, the process and deadlines for meeting the applicable requirements to prevent the imposition of the 30% withholding tax under FATCA.
Backup Withholding and Information Reporting
We must report annually to the IRS and to each Non-U.S. Holder the gross amount of the distributions on shares of our common stock paid to each such holder and the tax withheld, if any, with respect to such distributions. These information reporting requirements apply even if withholding was not required. This information also may be made available under a specific treaty or agreement with the tax authorities in the country in which the non-U.S. holder resides or is established. In addition to the FATCA requirements described above, a non-U.S. holder will be subject to backup withholding at the then applicable rate with respect to dividends paid to such holder on our common stock unless such holder furnishes a valid IRS Form W-8BEN or W-8BEN-E (or such other applicable form and documentation as required by the Internal Revenue Code or the Treasury regulations) certifying under
145
Table of Contents
penalties of perjury that it is a non-U.S. holder (and the payor does not have actual knowledge or reason to know that such holder is a U.S. person as defined under the Internal Revenue Code), or otherwise establishes an exemption. Dividends paid to Non-U.S. Holders subject to the U.S. federal withholding tax, as described above in “—Distributions on Shares of our Common Stock,” generally will be exempt from U.S. backup withholding.
Information reporting and backup withholding generally will apply to the payment of the proceeds of a disposition of shares of our common stock by a Non-U.S. Holder effected by or through the U.S. office of any broker, U.S. or non-U.S., unless the holder certifies that it is not a United States person (as defined in the Internal Revenue Code) and satisfies certain other requirements, or otherwise establishes an exemption. For information reporting purposes, dispositions effected through a non-U.S. office of a broker with substantial U.S. ownership or operations generally will be treated in a manner similar to dispositions effected through a U.S. office of a broker, and dispositions otherwise effected through a non-U.S. office generally will not be subject to information reporting. Generally, backup withholding will not apply to a payment of disposition proceeds to a Non-U.S. Holder where the transaction is effected through a non-U.S. office of a U.S. broker or non-U.S. office of a non-U.S broker. Prospective investors are urged to consult their own tax advisors regarding the application of the information reporting and backup withholding rules to them.
Copies of information returns may be made available to the tax authorities of the country in which the Non-U.S. Holder resides or is incorporated, under the provisions of a specific treaty or agreement.
Backup withholding is not an additional tax. Any amounts withheld under the backup withholding rules from a payment made to a Non-U.S. Holder can be refunded or credited against such Non-U.S. Holder’s U.S. federal income tax liability, if any, provided that an appropriate claim is timely filed with the IRS.
Federal Estate Tax
Shares of our common stock held (or treated as held) by an individual who is not a U.S. citizen or resident (as defined for U.S. federal estate tax purposes) at the time of such individual’s death will be subject to U.S. federal estate tax, unless an applicable estate tax treaty provides otherwise.
146
Table of Contents
We, the selling stockholders and the underwriters named below have entered into an underwriting agreement with respect to the shares being offered. Subject to certain conditions, each underwriter has severally agreed to purchase from the selling stockholders the number of shares indicated in the following table. Goldman, Sachs & Co., Merrill Lynch, Pierce, Fenner & Smith Incorporated and J.P. Morgan Securities LLC are the representatives of the underwriters.
| Underwriters |
Number of Shares | |||
| Goldman, Sachs & Co. |
||||
| Merrill Lynch, Pierce, Fenner & Smith |
||||
| Incorporated |
||||
| J.P. Morgan Securities LLC |
||||
| Credit Suisse Securities (USA) LLC |
||||
| Deutsche Bank Securities Inc. |
||||
| Morgan Stanley & Co. LLC |
||||
| Wells Fargo Securities, LLC |
||||
| Jefferies LLC TPG Capital BD, LLC |
||||
| Piper Jaffray & Co. |
||||
| Stifel, Nicolaus & Company, Incorporated |
||||
| Cantor Fitzgerald & Co. |
||||
| Guggenheim Securities, LLC |
||||
| Nomura Securities International, Inc. |
||||
|
|
|
|||
| Total |
||||
|
|
|
The underwriters are committed to take and pay for all of the shares being offered, if any are taken, other than the shares covered by the option described below unless and until that option is exercised.
The underwriters have an option to buy up to an additional shares from the selling stockholders to cover sales by the underwriters of a greater number of shares than the total number set forth in the table above. They may exercise that option for 30 days. If any shares are purchased pursuant to this option, the underwriters will severally purchase shares in approximately the same proportion as set forth in the table above.
The following tables show the per share and total underwriting discounts and commissions to be paid to the underwriters by the selling stockholders. Such amounts are shown assuming both no exercise and full exercise of the underwriters’ option to purchase additional shares.
| Paid by the Selling Stockholders |
||||||||
| No Exercise | Full Exercise | |||||||
| Per Share |
$ | $ | ||||||
| Total |
$ | $ | ||||||
Shares sold by the underwriters to the public will initially be offered at the initial public offering price set forth on the cover of this prospectus. Any shares sold by the underwriters to securities dealers may be sold at a discount of up to $ per share from the initial public offering price. After the initial offering of the shares, the representatives may change the offering price and the other selling terms. The offering of the shares by the underwriters is subject to receipt and acceptance and subject to the underwriters’ right to reject any order in whole or in part. Certain of the underwriters may also offer and sell shares of common stock through certain of their respective affiliates.
147
Table of Contents
We have agreed with the underwriters, subject to certain exceptions, not to offer, sell, contract to sell, pledge, grant any option to purchase, make any short sale or otherwise transfer or dispose of, directly or indirectly, or file with the SEC a registration statement under the Securities Act relating to, our common stock or any of our securities that are substantially similar to our common stock, including but not limited to any options or warrants to purchase shares of our common stock or any securities that are convertible into or exchangeable for, or that represent the right to receive, common stock or any substantially similar securities, or publicly disclose the intention to make any offer, sale, pledge, disposition or filing or (ii) enter into any swap or other agreement that transfers, in whole or in part, any of the economic consequences of ownership of our common stock or any other securities, whether any transaction described in clause (i) or (ii) above is to be settled by delivery of common stock or other securities, in cash or otherwise (other than the shares of our common stock to be sold hereunder or pursuant to employee stock option plans existing on, or upon the conversion or exchange of convertible or exchangeable securities outstanding as of, the date of this prospectus), during the period from the date of this prospectus continuing through the date 180 days after the date of this prospectus, except with the prior written consent of the representatives. See “Shares Available for Future Sale” for a discussion of certain transfer restrictions.
Our officers, directors, and certain holders of our common stock, including the selling stockholders, have agreed with the underwriters, subject to certain exceptions, not to offer, sell, contract to sell, pledge, grant any option to purchase, make any short sale or otherwise transfer or dispose, directly or indirectly, of any of our common stock or securities that are substantially similar to our common stock, or any options or warrants to purchase any shares of or our common stock, or any securities convertible into, exchangeable for or that represent the right to receive shares of our common stock, whether owned at the date of this prospectus or acquired later, owned directly by the officer, director or stockholder (including holding as a custodian), or with respect to which the officer, director or stockholder has beneficial ownership within the rules and regulations of the SEC (collectively the “Lock-up Shares”), or publicly disclose the intention to make any offer, sale, pledge or disposition. The foregoing restriction precludes each officer, director or stockholder from engaging in any hedging or other transaction which is designed to or which reasonably could be expected to lead to or result in a sale or disposition of the Lock-up Shares even if those Lock-up Shares would be disposed of by someone other than the officer, director or stockholder. The prohibited hedging or other transactions include any swap, any short sale or any purchase, sale or grant of any right (including any put or call option) with respect to any of the Lock-up Shares or with respect to any security that includes, relates to, or derives any significant part of its value from the Lock-up Shares. The foregoing agreement will not apply to transfers made (i) as a bona fide gift or gifts, provided that the donee or donees agree to be bound in writing by the restrictions in the lock-up agreement, or (ii) to any trust for the direct or indirect benefit of the officer, director or stockholder or the immediate family of the officer, director or stockholder, provided that the trustee of the trust agrees to be bound in writing by the restrictions in the lock-up agreement, and provided further that any transfer does not involve a disposition for value.
The 180-day restricted period described in the preceding two paragraphs will be automatically extended if: (1) during the last 17 days of the 180-day restricted period we issue an earnings release or announce material news or a material event; or (2) prior to the expiration of the 180-day restricted period, we announce that we will release earnings results during the 15-day period following the last day of the 180-day period, in which case the restrictions described in the preceding paragraph will continue to apply until the expiration of the 18-day period beginning on the issuance of the earnings release of the announcement of the material news or material event.
Prior to the offering, there has been no public market for our shares. The initial public offering price has been negotiated among the selling stockholders and the representatives. Among the factors to be considered in determining the initial public offering price of the shares, in addition to prevailing
148
Table of Contents
market conditions, will be our historical performance, estimates of our business potential and earnings prospects, an assessment of our management and the consideration of the above factors in relation to market valuation of companies in related businesses.
An application has been made to list our common stock on under the symbol “ ”.
In connection with the offering, the underwriters may purchase and sell shares of our common stock in the open market. These transactions may include short sales, stabilizing transactions and purchases to cover positions created by short sales. Short sales involve the sale by the underwriters of a greater number of shares than they are required to purchase in the offering, and a short position represents the amount of sales that have not been covered by subsequent purchases. A “covered short position” is a short position that is not greater than the amount of additional shares for which the underwriters’ option described above may be exercised. The underwriters may cover any covered short position by either exercising their option to purchase additional shares or purchasing shares in the open market. In determining the source of shares to cover the covered short position, the underwriters will consider, among other things, the price of shares available for purchase in the open market as compared to the price at which they may purchase additional shares pursuant to the option described above. “Naked” short sales are any short sales that create a short position greater than the amount of additional shares for which the option described above may be exercised. The underwriters must cover any such naked short position by purchasing shares in the open market. A naked short position is more likely to be created if the underwriters are concerned that there may be downward pressure on the price of our common stock in the open market after pricing that could adversely affect investors who purchase in the offering. Stabilizing transactions consist of various bids for or purchases of common stock made by the underwriters in the open market prior to the completion of the offering.
The underwriters may also impose a penalty bid. This occurs when a particular underwriter repays to the underwriters a portion of the underwriting discount received by it because the representatives have repurchased shares sold by or for the account of that underwriter in stabilizing or short covering transactions.
Purchases to cover a short position and stabilizing transactions, as well as other purchases by the underwriters for their own accounts, may have the effect of preventing or retarding a decline in the market price of our common stock, and together with the imposition of the penalty bid, may stabilize, maintain or otherwise affect the market price of our common stock. As a result, the price of our common stock may be higher than the price that otherwise might exist in the open market. The underwriters are not required to engage in these activities and may end any of these activities at any time. These transactions may be effected on , in the over-the-counter market or otherwise.
We estimate that our share of the total expenses of the offering, excluding underwriting discounts and commissions, will be approximately $ . We have agreed to reimburse the underwriters for underwriter’s counsel fees of up to $ .
We and the selling stockholders have agreed to indemnify the several underwriters against certain liabilities, including liabilities under the Securities Act.
The underwriters and their respective affiliates are full service financial institutions engaged in various activities, which may include sales and trading, commercial and investment banking, advisory, investment management, investment research, principal investment, hedging, market making, brokerage and other financial and non-financial activities and services. Certain of the underwriters and their respective affiliates have provided, and may in the future provide, a variety of these services to the issuer and to persons and entities with relationships with the issuer, for which they received or will receive customary fees and expenses. The underwriters or their affiliates are acting, and will continue
149
Table of Contents
to act, as arrangers, agents or lenders under our various credit facilities and other debt agreements, including as administrative agent and co-collateral agent under our revolving credit facility.
In the ordinary course of their various business activities, the underwriters and their respective affiliates, officers, directors and employees may purchase, sell or hold a broad array of investments and actively trade securities, derivatives, loans, commodities, currencies, credit default swaps and other financial instruments for their own account and for the accounts of their customers, and these investment and trading activities may involve or relate to assets, securities and/or instruments of the company (directly, as collateral securing other obligations or otherwise) and/or persons and entities with relationships with us. The underwriters and their respective affiliates may also communicate independent investment recommendations, market color or trading ideas and/or publish or express independent research views in respect of such assets, securities or instruments and may at any time hold, or recommend to clients that they should acquire, long and/or short positions in such assets, securities and instruments.
Certain affiliates of TPG Capital BD, LLC, an underwriter in this offering, will own in excess of 10% of our issued and outstanding common stock following this offering. In addition, these affiliates of TPG Capital BD, LLC, as selling stockholders, will receive more than 5% of the net proceeds of this offering. As a result of the foregoing relationships, TPG Capital BD, LLC is deemed to have a “conflict of interest” within the meaning of FINRA Rule 5121. Accordingly, this offering will be made in compliance with the applicable provisions of FINRA Rule 5121. Pursuant to that rule, the appointment of a qualified independent underwriter is not necessary in connection with this offering. In accordance with FINRA Rule 5121(c), no sales of the shares will be made to any discretionary account over which TPG Capital BD, LLC exercises discretion without the prior specific written approval of the account holder.
Notice to Prospective Investors
European Economic Area
In relation to each Member State of the European Economic Area which has implemented the Prospectus Directive (each, a Relevant Member State), an offer of shares to the public may not be made in that Relevant Member State, except that an offer of shares to the public may be made at any time under the following exemptions under the Prospectus Directive, if they have been implemented in that Relevant Member State:
(a) to any legal entity which is a qualified investor as defined in the Prospectus Directive;
(b) to fewer than 100 or, if the Relevant Member State has implemented the relevant provisions of the 2010 Amending Directive, 150, natural or legal persons (other than qualified investors as defined in the Prospectus Directive) subject to obtaining the prior consent of the representatives for any such offer; or
(c) in any other circumstances falling within Article 3(2) of the Prospectus Directive,
provided that no offer of shares shall result in a requirement for the publication of a prospectus pursuant to Article 3 of the Prospectus Directive or any measure implementing the Prospectus Directive in a Relevant Member State and each person who initially acquires any shares or to whom an offer is made will be deemed to have represented, warranted and agreed to and with
150
Table of Contents
the underwriters that it is a qualified investor within the meaning of the law in that Relevant Member State implementing Article 2(1)(e) of the Prospectus Directive.
For the purposes of this provision, the expression an “offer of shares to the public” in relation to any shares in any Relevant Member State means the communication in any form and by any means of sufficient information on the terms of the offer and the shares to be offered so as to enable an investor to decide to purchase or subscribe the shares, as the same may be varied in that Relevant Member State by any measure implementing the Prospectus Directive in that Relevant Member State, the expression Prospectus Directive means Directive 2003/71/EC (and amendments thereto, including the 2010 PD Amending Directive, to the extent implemented in the Relevant Member State) and includes any relevant implementing measure in each Relevant Member State.
In the case of any shares being offered to a financial intermediary as that term is used in Article 3(2) of the Prospectus Directive, the financial intermediary will also be deemed to have represented, acknowledged and agreed that the shares acquired by it in the offer have not been acquired on a non-discretionary basis on behalf of, nor have they been acquired with a view to their offer or resale to, persons in circumstances which may give rise to an offer of shares to the public other than their offer or resale in a Relevant Member State to qualified investors as so defined or in circumstances in which the prior consent of the underwriters has been obtained to each such proposed offer or resale.
United Kingdom
In the United Kingdom, this prospectus is only addressed to and directed as qualified investors who are (i) investment professionals falling within Article 19(5) of the Financial Services and Markets Act 2000 (Financial Promotion) Order 2005 (the Order); or (ii) high net worth entities and other persons to whom it may lawfully be communicated, falling within Article 49(2)(a) to (d) of the Order (all such persons together being referred to as “relevant persons”). Any investment or investment activity to which this prospectus relates is available only to relevant persons and will only be engaged with relevant persons. Any person who is not a relevant person should not act or relay on this prospectus or any of its contents.
Hong Kong
The shares may not be offered or sold in Hong Kong by means of any document other than (i) in circumstances which do not constitute an offer to the public within the meaning of the Companies (Winding Up and Miscellaneous Provisions) Ordinance (Cap. 32 of the Laws of Hong Kong) (“Companies (Winding Up and Miscellaneous Provisions) Ordinance”) or which do not constitute an invitation to the public within the meaning of the Securities and Futures Ordinance (Cap. 571 of the Laws of Hong Kong) (“Securities and Futures Ordinance”), or (ii) to “professional investors” as defined in the Securities and Futures Ordinance and any rules made thereunder, or (iii) in other circumstances which do not result in the document being a “prospectus” as defined in the Companies (Winding Up and Miscellaneous Provisions) Ordinance, and no advertisement, invitation or document relating to the shares may be issued or may be in the possession of any person for the purpose of issue (in each case whether in Hong Kong or elsewhere), which is directed at, or the contents of which are likely to be accessed or read by, the public in Hong Kong (except if permitted to do so under the securities laws of Hong Kong) other than with respect to shares which are or are intended to be disposed of only to persons outside Hong Kong or only to “professional investors” in Hong Kong as defined in the Securities and Futures Ordinance and any rules made thereunder.
151
Table of Contents
Singapore
This prospectus has not been registered as a prospectus with the Monetary Authority of Singapore. Accordingly, this prospectus and any other document or material in connection with the offer or sale, or invitation for subscription or purchase, of the shares may not be circulated or distributed, nor may the shares be offered or sold, or be made the subject of an invitation for subscription or purchase, whether directly or indirectly, to persons in Singapore other than (i) to an institutional investor (as defined under Section 4A of the Securities and Futures Act, Chapter 289 of Singapore (the “SFA”)) under Section 274 of the SFA, (ii) to a relevant person (as defined in Section 275(2) of the SFA) pursuant to Section 275(1) of the SFA, or any person pursuant to Section 275(1A) of the SFA, and in accordance with the conditions specified in Section 275 of the SFA or (iii) otherwise pursuant to, and in accordance with the conditions of, any other applicable provision of the SFA, in each case subject to conditions set forth in the SFA.
Where the shares are subscribed or purchased under Section 275 of the SFA by a relevant person which is a corporation (which is not an accredited investor (as defined in Section 4A of the SFA)) the sole business of which is to hold investments and the entire share capital of which is owned by one or more individuals, each of whom is an accredited investor, the shares (as defined in Section 239(1) of the SFA) of that corporation shall not be transferable for 6 months after that corporation has acquired the shares under Section 275 of the SFA except: (1) to an institutional investor under Section 274 of the SFA or to a relevant person (as defined in Section 275(2) of the SFA), (2) where such transfer arises from an offer in that corporation’s shares pursuant to Section 275(1A) of the SFA, (3) where no consideration is or will be given for the transfer, (4) where the transfer is by operation of law, (5) as specified in Section 276(7) of the SFA, or (6) as specified in Regulation 32 of the Securities and Futures (Offers of Investments) (Shares and Debentures) Regulations 2005 of Singapore (“Regulation 32”)
Where the shares are subscribed or purchased under Section 275 of the SFA by a relevant person which is a trust (where the trustee is not an accredited investor (as defined in Section 4A of the SFA)) whose sole purpose is to hold investments and each beneficiary of the trust is an accredited investor, the beneficiaries’ rights and interest (howsoever described) in that trust shall not be transferable for 6 months after that trust has acquired the shares under Section 275 of the SFA except: (1) to an institutional investor under Section 274 of the SFA or to a relevant person (as defined in Section 275(2) of the SFA), (2) where such transfer arises from an offer that is made on terms that such rights or interest are acquired at a consideration of not less than S$200,000 (or its equivalent in a foreign currency) for each transaction (whether such amount is to be paid for in cash or by exchange of securities or other assets), (3) where no consideration is or will be given for the transfer, (4) where the transfer is by operation of law, (5) as specified in Section 276(7) of the SFA, or (6) as specified in Regulation 32.
Japan
The shares have not been and will not be registered under the Financial Instruments and Exchange Act of Japan (Act No. 25 of 1948, as amended), or the FIEA. The shares may not be offered or sold, directly or indirectly, in Japan or to or for the benefit of any resident of Japan (including any person resident in Japan or any corporation or other entity organized under the laws of Japan) or to others for reoffering or resale, directly or indirectly, in Japan or to or for the benefit of any resident of Japan, except pursuant to an exemption from the registration requirements of the FIEA and otherwise in compliance with any relevant laws and regulations of Japan.
152
Table of Contents
Australia
No placement document, prospectus, product disclosure statement or other disclosure document has been lodged with the Australian Securities and Investments Commission, in relation to the offering. This prospectus does not constitute a prospectus, product disclosure statement or other disclosure document under the Corporations Act 2001 (the “Corporations Act”), and does not purport to include the information required for a prospectus, product disclosure statement or other disclosure document under the Corporations Act.
Any offer in Australia of the shares may only be made to persons (the “Exempt Investors”) who are “sophisticated investors” (within the meaning of section 708(8) of the Corporations Act), “professional investors” (within the meaning of section 708(11) of the Corporations Act) or otherwise pursuant to one or more exemptions contained in section 708 of the Corporations Act so that it is lawful to offer the shares without disclosure to investors under Chapter 6D of the Corporations Act.
The shares applied for by Exempt Investors in Australia must not be offered for sale in Australia in the period of 12 months after the date of allotment under the offering, except in circumstances where disclosure to investors under Chapter 6D of the Corporations Act would not be required pursuant to an exemption under section 708 of the Corporations Act or otherwise or where the offer is pursuant to a disclosure document which complies with Chapter 6D of the Corporations Act. Any person acquiring the shares must observe such Australian on-sale restrictions.
This prospectus contains general information only and does not take account of the investment objectives, financial situation or particular needs of any particular person. It does not contain any securities recommendations or financial product advice. Before making an investment decision, investors need to consider whether the information in this prospectus is appropriate to their needs, objectives and circumstances, and, if necessary, seek expert advice on those matters.
Dubai International Financial Centre
This prospectus relates to an Exempt Offer in accordance with the Offered Securities Rules of the Dubai Financial Services Authority (“DFSA”). This prospectus is intended for distribution only to persons of a type specified in the Offered Securities Rules of the DFSA. It must not be delivered to, or relied on by, any other person. The DFSA has no responsibility for reviewing or verifying any documents in connection with Exempt Offers. The DFSA has not approved this prospectus nor taken steps to verify the information set forth herein and has no responsibility for the prospectus. The shares to which this prospectus relates may be illiquid and/or subject to restrictions on their resale. Prospective purchasers of the shares offered should conduct their own due diligence on the shares. If you do not understand the contents of this prospectus you should consult an authorized financial advisor.
Switzerland
We have not and will not register with the Swiss Financial Market Supervisory Authority (“FINMA”) as a foreign collective investment scheme pursuant to Article 119 of the Federal Act on Collective Investment Scheme of 23 June 2006, as amended (“CISA”), and accordingly the shares being offered pursuant to this prospectus have not and will not be approved, and may not be licenseable, with FINMA. Therefore, the shares have not been authorized for distribution by FINMA as a foreign collective investment scheme pursuant to Article 119 CISA and the shares offered hereby may not be offered to the public (as this term is defined in Article 3 CISA) in or from Switzerland. The shares may solely be offered to “qualified investors,” as this term is defined in Article 10 CISA, and in the circumstances set out in Article 3 of the Ordinance on Collective Investment Scheme of 22
153
Table of Contents
November 2006, as amended (“CISO”), such that there is no public offer. Investors, however, do not benefit from protection under CISA or CISO or supervision by FINMA. This prospectus and any other materials relating to the shares are strictly personal and confidential to each offeree and do not constitute an offer to any other person. This prospectus may only be used by those qualified investors to whom it has been handed out in connection with the offer described herein and may neither directly or indirectly be distributed or made available to any person or entity other than its recipients. It may not be used in connection with any other offer and shall in particular not be copied and/or distributed to the public in Switzerland or from Switzerland. This prospectus does not constitute an issue prospectus as that term is understood pursuant to Article 652a and/or 1156 of the Swiss Federal Code of Obligations. We have not applied for a listing of the shares on the SIX Swiss Exchange or any other regulated securities market in Switzerland, and consequently, the information presented in this prospectus does not necessarily comply with the information standards set out in the listing rules of the SIX Swiss Exchange and corresponding prospectus schemes annexed to the listing rules of the SIX Swiss Exchange.
Canada
The shares may be sold only to purchasers purchasing, or deemed to be purchasing, as principal that are accredited investors, as defined in National Instrument 45-106 Prospectus Exemptions or subsection 73.3(1) of the Securities Act (Ontario), and are permitted clients, as defined in National Instrument 31-103 Registration Requirements, Exemptions and Ongoing Registrant Obligations. Any resale of the shares must be made in accordance with an exemption from, or in a transaction not subject to, the prospectus requirements of applicable securities laws.
Securities legislation in certain provinces or territories of Canada may provide a purchaser with remedies for rescission or damages if this prospectus (including any amendment thereto) contains a misrepresentation, provided that the remedies for rescission or damages are exercised by the purchaser within the time limit prescribed by the securities legislation of the purchaser’s province or territory. The purchaser should refer to any applicable provisions of the securities legislation of the purchaser’s province or territory for particulars of these rights or consult with a legal advisor.
Pursuant to section 3A.3 (or, in the case of securities issued or guaranteed by the government of a non-Canadian jurisdiction, section 3A.4) of National Instrument 33-105 Underwriting Conflicts (NI 33-105), the underwriters are not required to comply with the disclosure requirements of NI 33-105 regarding underwriter conflicts of interest in connection with this offering.
154
Table of Contents
The validity of the issuance of our common stock offered in this prospectus will be passed upon for us by Ropes & Gray LLP, San Francisco, CA. Ropes & Gray LLP and some of its attorneys are limited partners of RGIP, LP, which is an investor in certain investment funds advised by certain of the Sponsors and often a co-investor with such funds. Upon the consummation of the offering, RGIP, LP will directly or indirectly own less than 1% of the outstanding shares of our common stock. Cleary Gottlieb Steen & Hamilton LLP, New York, NY, will act as counsel to the underwriters.
The financial statements as of January 31, 2015 and February 1, 2014 and for each of the three fiscal years ended January 31, 2015, February 1, 2014 and February 2, 2013, respectively, included in this prospectus have been so included in reliance on the reports of KPMG LLP, an independent registered public accounting firm, given on the authority of said firm as experts in auditing and accounting.
WHERE YOU CAN FIND MORE INFORMATION
We have filed with the SEC a registration statement on Form S-1 under the Securities Act with respect to the shares of common stock offered hereby. This prospectus, which constitutes a part of the registration statement, does not contain all of the information set forth in the registration statement or the exhibits and schedules filed therewith. For further information with respect to us and the common stock offered hereby, please refer to the registration statement and the exhibits and schedules filed therewith. Statements contained in this prospectus regarding the contents of any contract or any other document that is filed as an exhibit to the registration statement are not necessarily complete, and each such statement is qualified in all respects by reference to the full text of such contract or other document filed as an exhibit to the registration statement. A copy of the registration statement and the exhibits and schedules filed therewith may be inspected without charge at the public reference room maintained by the SEC, located at 100 F Street N.E., Washington, D.C. 20549, and copies of all or any part of the registration statement may be obtained from such offices upon the payment of the fees prescribed by the SEC. Please call the SEC at 1-800-SEC-0330 for further information about the public reference room. The SEC also maintains a website that contains reports, proxy and information statements and other information regarding registrants that file electronically with the SEC. The SEC’s website address is www.sec.gov.
Upon completion of this offering, we will become subject to the information and periodic reporting requirements of the Exchange Act and, in accordance therewith, we will file periodic reports, proxy statements and other information with the SEC. Such periodic reports, proxy statements and other information will be available for inspection and copying at the public reference room and website of the SEC referred to above.
155
Table of Contents
INDEX TO CONSOLIDATED FINANCIAL STATEMENTS AND FINANCIAL STATEMENT SCHEDULES
| Page | ||||
| Audited consolidated financial statements |
||||
| F-2 | ||||
| Consolidated Balance Sheets as of January 31, 2015 and February 1, 2014 |
F-3 | |||
| F-4 | ||||
| F-5 | ||||
| F-6 | ||||
| Notes to Consolidated Financial Statements |
||||
| Unaudited interim consolidated financial statements |
||||
| Condensed Consolidated Balance Sheets (Unaudited) as of August 1, 2015 and |
F-37 | |||
| F-38 | ||||
| F-39 | ||||
| Notes to Condensed Consolidated Financial Statements (Unaudited) |
||||
F-1
Table of Contents
Report of Independent Registered Public Accounting Firm
The Board of Directors
Petco Holdings, Inc.:
We have audited the accompanying consolidated balance sheets of Petco Holdings, Inc. and subsidiaries (the Company) as of January 31, 2015 and February 1, 2014, and the related consolidated statements of income and comprehensive income, stockholders’ deficit, and cash flows for each of the years in the three-year period ended January 31, 2015. These consolidated financial statements are the responsibility of the Company’s management. Our responsibility is to express an opinion on these consolidated financial statements based on our audits.
We conducted our audits in accordance with the standards of the Public Company Accounting Oversight Board (United States). Those standards require that we plan and perform the audit to obtain reasonable assurance about whether the financial statements are free of material misstatement. An audit includes examining, on a test basis, evidence supporting the amounts and disclosures in the financial statements. An audit also includes assessing the accounting principles used and significant estimates made by management, as well as evaluating the overall financial statement presentation. We believe that our audits provide a reasonable basis for our opinion.
In our opinion, the consolidated financial statements referred to above present fairly, in all material respects, the financial position of Petco Holdings, Inc. and subsidiaries as of January 31, 2015 and February 1, 2014, and the results of their operations and their cash flows for each of the years in the three-year period ended January 31, 2015, in conformity with U.S. generally accepted accounting principles.
/s/ KPMG LLP
San Diego, California
August 17, 2015
F-2
Table of Contents
CONSOLIDATED BALANCE SHEETS
(In thousands, except par value)
| January 31, 2015 |
February 1, 2014 |
|||||||
| ASSETS |
||||||||
| Current assets: |
||||||||
| Cash and cash equivalents |
$ | 191,265 | $ | 135,793 | ||||
| Receivables, net |
27,874 | 36,792 | ||||||
| Merchandise inventories |
393,808 | 386,240 | ||||||
| Deferred tax assets |
49,836 | 48,433 | ||||||
| Prepaid expenses |
55,644 | 31,522 | ||||||
| Other current assets |
17,915 | 17,938 | ||||||
|
|
|
|
|
|||||
| Total current assets |
736,342 | 656,718 | ||||||
| Fixed assets, net |
591,812 | 513,877 | ||||||
| Goodwill |
1,007,285 | 1,006,857 | ||||||
| Other intangible assets, net |
282,270 | 284,850 | ||||||
| Other assets |
89,272 | 81,452 | ||||||
|
|
|
|
|
|||||
| Total assets |
$ | 2,706,981 | $ | 2,543,754 | ||||
|
|
|
|
|
|||||
| LIABILITIES AND STOCKHOLDERS’ DEFICIT |
||||||||
| Current liabilities: |
||||||||
| Accounts payable and book overdrafts |
$ | 198,543 | $ | 169,588 | ||||
| Accrued salaries and employee benefits |
88,658 | 90,383 | ||||||
| Accrued expenses and other liabilities |
175,140 | 148,095 | ||||||
| Current portion of long-term debt and capital lease obligations |
23,675 | 13,371 | ||||||
|
|
|
|
|
|||||
| Total current liabilities |
486,016 | 421,437 | ||||||
| Senior secured credit facilities, net, excluding current portion |
1,189,989 | 1,170,989 | ||||||
| Senior notes, net |
494,266 | 493,087 | ||||||
| Senior PIK toggle notes, net |
548,365 | 547,853 | ||||||
| Capital lease obligations, excluding current portion |
11,916 | 12,748 | ||||||
| Deferred tax liabilities |
113,116 | 112,811 | ||||||
| Deferred rents and other liabilities |
193,651 | 195,100 | ||||||
|
|
|
|
|
|||||
| Total liabilities |
3,037,319 | 2,954,025 | ||||||
|
|
|
|
|
|||||
| Commitments and contingencies (Notes 2, 6, 7, 8 and 16) |
||||||||
| Stockholders’ deficit: |
||||||||
| Common stock, $0.001 par value, 895,000 shares authorized, 806,803 and 805,211 shares issued and outstanding (Note 1) at January 31, 2015 and February 1, 2014, respectively |
807 | 805 | ||||||
| Returned capital and dividends in excess of earnings |
(451,559 | ) | (456,765 | ) | ||||
| Retained earnings |
116,304 | 43,595 | ||||||
| Accumulated other comprehensive income |
4,110 | 2,094 | ||||||
|
|
|
|
|
|||||
| Total stockholders’ deficit |
(330,338 | ) | (410,271 | ) | ||||
|
|
|
|
|
|||||
| Total liabilities and stockholders’ deficit |
$ | 2,706,981 | $ | 2,543,754 | ||||
|
|
|
|
|
|||||
See accompanying notes to consolidated financial statements.
F-3
Table of Contents
CONSOLIDATED STATEMENTS OF INCOME AND COMPREHENSIVE INCOME
(In thousands, except per share data)
| Fiscal years ended | ||||||||||||
| January 31, 2015 (52 weeks) |
February 1, 2014 (52 weeks) |
February 2, 2013 (53 weeks) |
||||||||||
| Net sales |
$ | 3,995,368 | $ | 3,785,153 | $ | 3,528,030 | ||||||
| Cost of sales and occupancy costs |
2,778,427 | 2,601,855 | 2,403,065 | |||||||||
|
|
|
|
|
|
|
|||||||
| Gross profit |
1,216,941 | 1,183,298 | 1,124,965 | |||||||||
| Selling, general and administrative expenses |
928,684 | 884,991 | 837,681 | |||||||||
| Goodwill impairment charges |
7,753 | — | — | |||||||||
|
|
|
|
|
|
|
|||||||
| Operating income |
280,504 | 298,307 | 287,284 | |||||||||
| Interest income |
(422 | ) | (119 | ) | (372 | ) | ||||||
| Interest expense |
159,292 | 157,143 | 128,123 | |||||||||
| Loss on extinguishment of debt |
— | 3,810 | — | |||||||||
| Other expenses |
— | 1,364 | 642 | |||||||||
|
|
|
|
|
|
|
|||||||
| Income before income taxes and (income) loss from equity method investees |
121,634 | 136,109 | 158,891 | |||||||||
| Income tax expense |
46,398 | 50,836 | 60,070 | |||||||||
| (Income) loss from equity method investees |
(106 | ) | 508 | — | ||||||||
|
|
|
|
|
|
|
|||||||
| Net income |
75,342 | 84,765 | 98,821 | |||||||||
| Other comprehensive income (loss), net of tax: |
||||||||||||
| Unrealized (loss) gain on available-for-sale securities |
(941 | ) | 9,013 | — | ||||||||
| Foreign currency translation adjustment |
(352 | ) | — | — | ||||||||
| Interest rate swaps: |
||||||||||||
| Change in fair value of derivatives |
— | — | (3,149 | ) | ||||||||
| Losses on derivatives reclassified to income |
3,309 | 2,231 | 546 | |||||||||
|
|
|
|
|
|
|
|||||||
| Total other comprehensive income (loss), net of tax |
2,016 | 11,244 | (2,603 | ) | ||||||||
|
|
|
|
|
|
|
|||||||
| Comprehensive income |
$ | 77,358 | $ | 96,009 | $ | 96,218 | ||||||
|
|
|
|
|
|
|
|||||||
| Basic earnings per share |
$ | 0.09 | $ | 0.11 | $ | 0.12 | ||||||
| Diluted earnings per share |
0.09 | 0.10 | 0.12 | |||||||||
| Weighted-average shares outstanding: |
||||||||||||
| Basic |
805,900 | 803,522 | 794,033 | |||||||||
| Diluted |
828,148 | 824,037 | 822,694 | |||||||||
See accompanying notes to consolidated financial statements.
F-4
Table of Contents
CONSOLIDATED STATEMENTS OF STOCKHOLDERS’ DEFICIT
(In thousands)
|
Common stock |
Additional paid-in capital (returned capital and dividends in excess of earnings) |
Retained earnings (accumulated deficit) |
Accumulated other comprehensive income (loss) |
Total stockholders’ deficit |
||||||||||||||||||||
| Shares | Amount | |||||||||||||||||||||||
| Balance at January 28, 2012 |
788,493 | $ | 788 | $ | 125,822 | $ | (132,820 | ) | $ | (6,547 | ) | $ | (12,757 | ) | ||||||||||
| Equity awards vested and issued and exercised |
16,952 | 17 | 10,566 | — | — | 10,583 | ||||||||||||||||||
| Tax benefit from stock option exercises |
— | — | 4,710 | — | — | 4,710 | ||||||||||||||||||
| Repurchase of common stock |
(3,177 | ) | (3 | ) | — | (5,643 | ) | — | (5,646 | ) | ||||||||||||||
| Cash settlement for vested stock options anti-dilution modification (Note 13) |
— | — | (16,604 | ) | — | — | (16,604 | ) | ||||||||||||||||
| Tax benefit for vested stock options anti-dilution modification |
— | — | 6,605 | — | — | 6,605 | ||||||||||||||||||
| Unvested stock options anti-dilution modification liability (Note 13) |
— | — | (7,884 | ) | — | — | (7,884 | ) | ||||||||||||||||
| Return of capital (Note 11) |
— | — | (402,779 | ) | — | — | (402,779 | ) | ||||||||||||||||
| Dividends paid (Note 11) |
— | — | (186,647 | ) | — | — | (186,647 | ) | ||||||||||||||||
| Stock-based compensation expense (Note 13) |
— | — | 2,078 | — | — | 2,078 | ||||||||||||||||||
| Net income |
— | — | — | 98,821 | — | 98,821 | ||||||||||||||||||
| Change in fair value of derivatives, net of tax of $(2,002) |
— | — | — | — | (3,149 | ) | (3,149 | ) | ||||||||||||||||
| Losses on derivatives reclassified to income, net of tax of $357 |
— | — | — | — | 546 | 546 | ||||||||||||||||||
|
|
|
|
|
|
|
|
|
|
|
|
|
|||||||||||||
| Balance at February 2, 2013 |
802,268 | $ | 802 | $ | (464,133 | ) | $ | (39,642 | ) | $ | (9,150 | ) | $ | (512,123 | ) | |||||||||
| Equity awards vested and issued and exercised |
3,707 | 4 | 1,454 | — | — | 1,458 | ||||||||||||||||||
| Tax benefit from stock option exercises |
— | — | 2,255 | — | — | 2,255 | ||||||||||||||||||
| Repurchase of common stock |
(764 | ) | (1 | ) | — | (1,528 | ) | — | (1,529 | ) | ||||||||||||||
| Excess tax benefit for vested stock options anti-dilution modification |
— | — | 1,924 | — | — | 1,924 | ||||||||||||||||||
| Stock-based compensation expense (Note 13) |
— | — | 2,857 | — | — | 2,857 | ||||||||||||||||||
| Stock option repurchase |
— | — | (1,783 | ) | — | — | (1,783 | ) | ||||||||||||||||
| Unvested stock options deferred bonus accrual adjustments |
— | — | 661 | — | — | 661 | ||||||||||||||||||
| Net income |
— | — | — | 84,765 | — | 84,765 | ||||||||||||||||||
| Losses on derivatives reclassified to income, net of tax of $(1,455) |
— | — | — | — | 2,231 | 2,231 | ||||||||||||||||||
| Unrealized gain on available-for-sale securities, net of tax of $(5,884) |
— | — | — | — | 9,013 | 9,013 | ||||||||||||||||||
|
|
|
|
|
|
|
|
|
|
|
|
|
|||||||||||||
| Balance at February 1, 2014 |
805,211 | $ | 805 | $ | (456,765 | ) | $ | 43,595 | $ | 2,094 | $ | (410,271 | ) | |||||||||||
| Equity awards vested and issued and exercised |
3,139 | 3 | 1,411 | — | — | 1,414 | ||||||||||||||||||
| Tax benefit from stock option exercises |
— | — | 800 | — | — | 800 | ||||||||||||||||||
| Repurchase of common stock |
(1,547 | ) | (1 | ) | — | (2,633 | ) | — | (2,634 | ) | ||||||||||||||
| Excess tax benefit for vested stock options anti-dilution modification |
— | — | 414 | — | — | 414 | ||||||||||||||||||
| Stock-based compensation expense (Note 13) |
— | — | 2,973 | — | — | 2,973 | ||||||||||||||||||
| Stock option repurchase |
— | — | (566 | ) | — | — | (566 | ) | ||||||||||||||||
| Unvested stock options deferred bonus accrual adjustments |
— | — | 174 | — | — | 174 | ||||||||||||||||||
| Net income |
— | — | — | 75,342 | — | 75,342 | ||||||||||||||||||
| Losses on derivatives reclassified to income, net of tax of $(2,146) |
— | — | — | — | 3,309 | 3,309 | ||||||||||||||||||
| Unrealized loss on available-for-sale securities, net of tax of $(610) |
— | — | — | — | (941 | ) | (941 | ) | ||||||||||||||||
| Foreign currency translation adjustment, net of tax of $(229) |
— | — | — | — | (352 | ) | (352 | ) | ||||||||||||||||
|
|
|
|
|
|
|
|
|
|
|
|
|
|||||||||||||
| Balance at January 31, 2015 |
806,803 | $ | 807 | $ | (451,559 | ) | $ | 116,304 | $ | 4,110 | $ | (330,338 | ) | |||||||||||
|
|
|
|
|
|
|
|
|
|
|
|
|
|||||||||||||
See accompanying notes to consolidated financial statements.
F-5
Table of Contents
CONSOLIDATED STATEMENTS OF CASH FLOWS
(In thousands)
| Fiscal years ended | ||||||||||||
| January 31, 2015 (52 weeks) |
February 1, 2014 (52 weeks) |
February 2, 2013 (53 weeks) |
||||||||||
| Cash flows from operating activities: |
||||||||||||
| Net income |
$ | 75,342 | $ | 84,765 | $ | 98,821 | ||||||
| Adjustments to reconcile net income to net cash provided by operating activities: |
||||||||||||
| Depreciation and amortization |
122,065 | 114,336 | 108,054 | |||||||||
| Amortization of debt discounts and issuance costs |
9,771 | 9,122 | 7,841 | |||||||||
| Provision for deferred taxes |
(2,051 | ) | (4,792 | ) | (20,417 | ) | ||||||
| Non-cash stock-based compensation |
2,973 | 2,857 | 2,078 | |||||||||
| Impairments and write-offs of fixed and other assets |
8,884 | 2,335 | 261 | |||||||||
| Loss on extinguishment of debt |
— | 3,810 | — | |||||||||
| Gain on bargain purchase |
— | — | (395 | ) | ||||||||
| (Income) loss from equity method investees |
(106 | ) | 508 | — | ||||||||
| Goodwill impairment charges |
7,753 | — | — | |||||||||
| Changes in assets and liabilities, net of effects of acquisitions: |
||||||||||||
| Receivables |
8,918 | (3,493 | ) | (4,834 | ) | |||||||
| Merchandise inventories |
(6,908 | ) | (51,719 | ) | (34,604 | ) | ||||||
| Prepaid expenses and other assets |
(27,030 | ) | 16,585 | (3,381 | ) | |||||||
| Accounts payable and book overdrafts |
28,955 | 10,099 | 35,262 | |||||||||
| Accrued salaries and employee benefits |
(3,855 | ) | (10,231 | ) | 24,894 | |||||||
| Accrued expenses and other liabilities |
12,978 | (14,925 | ) | 24,223 | ||||||||
| Deferred rents and other liabilities |
7,743 | 5,296 | 10,620 | |||||||||
|
|
|
|
|
|
|
|||||||
| Net cash provided by operating activities |
245,432 | 164,553 | 248,423 | |||||||||
|
|
|
|
|
|
|
|||||||
| Cash flows from investing activities: |
||||||||||||
| Cash paid for fixed assets |
(191,627 | ) | (136,008 | ) | (160,160 | ) | ||||||
| Increase in restricted cash |
(611 | ) | (1,384 | ) | (131 | ) | ||||||
| Insurance recoveries |
314 | 49 | — | |||||||||
| Cash paid for acquisitions |
(9,452 | ) | — | (15,145 | ) | |||||||
| Cash paid for officers’ life insurance |
— | (1,815 | ) | (425 | ) | |||||||
| Cash paid for investments and loans |
(12,352 | ) | (6,595 | ) | (2,555 | ) | ||||||
|
|
|
|
|
|
|
|||||||
| Net cash used in investing activities |
(213,728 | ) | (145,753 | ) | (178,416 | ) | ||||||
|
|
|
|
|
|
|
|||||||
| Cash flows from financing activities: |
||||||||||||
| Proceeds from issuance of long-term debt |
— | — | 550,000 | |||||||||
| Borrowings under amended revolving credit facility |
40,000 | — | — | |||||||||
| Repayments of long-term debt |
(12,250 | ) | (9,188 | ) | (3,063 | ) | ||||||
| Debt issuance costs and original issue discount |
(1,074 | ) | (1,638 | ) | (15,190 | ) | ||||||
| Payments for capital lease obligations |
(1,454 | ) | (1,988 | ) | (2,071 | ) | ||||||
| Net proceeds from issuance of common stock |
1,414 | 1,458 | 10,583 | |||||||||
| Excess tax benefit of stock options exercised |
963 | 2,588 | 4,796 | |||||||||
| Excess tax benefit for fiscal 2012 anti-dilution stock option modifications for cash settlements on options vesting in fiscal 2014, 2013 and 2012 |
414 | 1,924 | 6,605 | |||||||||
| Return of capital to stockholders |
— | — | (402,779 | ) | ||||||||
| Repurchase of common stock and stock options |
(3,200 | ) | (3,312 | ) | (5,646 | ) | ||||||
| Cash dividends paid to stockholders |
— | — | (186,647 | ) | ||||||||
| Cash settlements for fiscal 2012 anti-dilution stock option modifications for options vesting in fiscal 2014, 2013 and 2012 |
(1,045 | ) | (3,218 | ) | (18,247 | ) | ||||||
|
|
|
|
|
|
|
|||||||
| Net cash provided by (used in) financing activities |
23,768 | (13,374 | ) | (61,659 | ) | |||||||
|
|
|
|
|
|
|
|||||||
| Net increase in cash and cash equivalents |
55,472 | 5,426 | 8,348 | |||||||||
| Cash and cash equivalents at beginning of year |
135,793 | 130,367 | 122,019 | |||||||||
|
|
|
|
|
|
|
|||||||
| Cash and cash equivalents at end of year |
$ | 191,265 | $ | 135,793 | $ | 130,367 | ||||||
|
|
|
|
|
|
|
|||||||
| Supplemental cash flow disclosures: |
||||||||||||
| Interest paid |
$ | 147,692 | $ | 146,951 | $ | 100,593 | ||||||
| Capitalized interest |
$ | 1,748 | $ | 893 | $ | 926 | ||||||
| Income taxes paid |
$ | 35,555 | $ | 68,156 | $ | 82,435 | ||||||
| Supplemental non-cash investing and financing activities disclosures: |
||||||||||||
| Reclassification of cost method investment to available-for-sale security and unrealized (loss) gain on available-for-sale security |
$ | — | $ | 14,897 | $ | — | ||||||
| Accounts payable and accrued expenses for capital expenditures |
$ | 30,240 | $ | 15,740 | $ | 16,824 | ||||||
| Unvested stock options and restricted stock unit fiscal 2012 anti-dilution modification liability |
$ | 174 | $ | 614 | $ | (7,884 | ) | |||||
| Assets acquired under capital leases |
$ | 812 | $ | 4,868 | $ | 2,776 | ||||||
See accompanying notes to consolidated financial statements.
F-6
Table of Contents
1. Summary of Significant Accounting Policies
Description of Business and Basis of Presentation
Petco Holdings, Inc., a Delaware corporation, and its subsidiaries (collectively, the “Company” or “Petco”), is a national specialty retailer of premium pet consumables, supplies and companion animals, and services with 1,383 retail locations in 50 states, the District of Columbia and Puerto Rico as of January 31, 2015. The Company also offers an expanded range of consumables and supplies through its www.petco.com website.
All operating activities of the Company are conducted by the subsidiaries. Petco Holdings, Inc. has no operations other than to service its debt, consisting of $550 million Senior PIK Toggle Notes (Note 8), and make shareholder dividend distributions. The ability of Petco Holdings, Inc. to service its debt is dependent upon receiving capital contributions from its subsidiaries. The terms of the Company’s Senior Notes (Note 7) held by Petco Animal Supplies, Inc., a wholly owned subsidiary of Petco Holdings, Inc., restrict the amount of funds available for transfer to Petco Holdings, Inc. As of January 31, 2015, the amount of restricted net assets was $49.6 million. As of January 31, 2015, on a stand-alone basis and excluding intercompany balances, the total assets (consisting primarily of debt issuance costs), total liabilities (consisting primarily of debt and related accrued interest) and total stockholders’ deficit of Petco Holdings, Inc. were $7.2 million, $564.1 million and $556.9 million, respectively. As of February 1, 2014, on a stand-alone basis and excluding intercompany balances, total assets, total liabilities and total stockholders’ deficit of Petco Holdings, Inc. were $9.4 million, $563.0 million and $553.6 million, respectively. For the three years ended January 31, 2015, the net loss of Petco Holdings’ Inc. was $31.3 million, $30.2 million and $10.6 million, respectively, consisting primarily of interest expense, net of tax. For the three years ended January 31, 2015, Petco Holdings, Inc. made interest payments of $46.7 million, $47.4 million and $0, respectively, which were funded through capital distributions received from Petco Animal Supplies, Inc. In addition, in fiscal 2012, concurrently with the issuance of the Senior PIK Toggle Notes and a capital distribution of $69 million received from Petco Animal Supplies, Inc., Petco Holdings, Inc. paid a cash dividend of $589.4 million.
During the fiscal year ended January 31, 2015, the Company acquired the assets of one pet-related business for approximately $9.5 million and accounted for the transaction under the acquisition method. The principal assets acquired were inventory, fixed assets and intangible assets. The Company recorded goodwill of approximately $8.2 million, which is deductible for tax purposes over the period of amortization, which is 15 years. During the fiscal year ended February 1, 2014, the Company did not acquire any businesses. During the fiscal year ended February 2, 2013, the Company acquired the assets of one national and two regional pet-related businesses for approximately $13.7 million and accounted for the transactions under the acquisition method. The principal assets acquired were inventory, store related fixed assets and intangible assets. The Company recorded goodwill of approximately $7.9 million, which is deductible for tax purposes over the period of amortization, which is 15 years. The pro forma results of operations have not been presented, as the acquisitions were not material to the Company’s consolidated financial statements.
Principles of Consolidation
The accompanying consolidated financial statements include the accounts of Petco Holdings, Inc. and its wholly owned subsidiaries. All intercompany accounts and transactions have been eliminated in consolidation.
Use of Estimates
The preparation of these consolidated financial statements in conformity with accounting principles generally accepted in the United States of America requires management to make estimates and assumptions that affect the reported amounts of assets and liabilities, disclosure of contingent assets and liabilities at the date of the consolidated financial statements and the reported amounts of
F-7
Table of Contents
revenues and expenses during the reporting periods. These estimates are based on information that is currently available and on various other assumptions that are believed to be reasonable under the circumstances. Actual results could vary from those estimates under different assumptions or conditions.
Fiscal Year
The Company’s fiscal year ends on the Saturday closest to January 31, resulting in years of either 52 or 53 weeks. All references to a fiscal year refer to the fiscal year ending on the Saturday closest to January 31 of the following year. For example, references to fiscal 2014 refer to the fiscal year beginning on February 2, 2014 and ending on January 31, 2015. Fiscal 2014 and 2013 included 52 weeks, and fiscal 2012 included 53 weeks.
Segment Reporting
Operating segments are components of an enterprise about which separate financial information is available and is evaluated regularly by the chief operating decision maker (“CODM”) in deciding how to allocate resources and in assessing performance. The Company’s Executive Committee, which consists of a select group of senior officers, collectively serves as the Company’s CODM. The Company manages its business as one reportable operating segment which is designed to sell pet food, supplies and companion animals, and services to pet parents across store and online channels.
Net sales by product type and services were as follows (in thousands):
| Fiscal years | ||||||||||||
| 2014 (52 weeks) |
2013 (52 weeks) |
2012 (53 weeks) |
||||||||||
| Supplies and companion animals |
$ | 2,169,385 | $ | 2,096,205 | $ | 1,993,760 | ||||||
| Dog and cat food |
1,511,240 | 1,414,218 | 1,286,975 | |||||||||
| Services and other |
314,743 | 274,730 | 247,295 | |||||||||
|
|
|
|
|
|
|
|||||||
| Net sales |
$ | 3,995,368 | $ | 3,785,153 | $ | 3,528,030 | ||||||
|
|
|
|
|
|
|
|||||||
Cash and Cash Equivalents
Cash equivalents represent all liquid investments with original maturities of three months or less and include money market mutual funds. The Company maintains cash and cash equivalent balances with financial institutions that exceed federally insured limits. The Company has not experienced any losses related to these balances. Included in the Company’s cash and cash equivalents are credit and debit card receivables from banks, which typically settle within five business days, of $28.1 million and $26.1 million at January 31, 2015 and February 1, 2014, respectively.
Restricted cash was $7.1 million and $6.5 million at January 31, 2015 and February 1, 2014, respectively, and is included in other current assets in the consolidated balance sheets. Restricted cash is held in a trust used for certain employee benefit costs.
Outstanding checks in excess of funds on deposit (book overdrafts) totaled $46.1 million and $20.1 million at January 31, 2015 and February 1, 2014, respectively, and are reflected in accounts payable and book overdrafts in the consolidated balance sheets.
Vendor Rebates and Allowances
Most of the Company’s receivables are due from vendors. Receivables are stated net of an allowance for doubtful accounts for estimated losses resulting from the inability to collect these receivables, which is determined by continually evaluating individual receivables, the vendor’s financial
F-8
Table of Contents
condition and current economic conditions. The allowance for doubtful accounts was $1.2 million at January 31, 2015 and $1.0 million at February 1, 2014. The additions and deductions to the allowance for doubtful accounts were not material for fiscal 2014, 2013 and 2012.
The Company receives vendor allowances, primarily in the form of cooperative advertising reimbursements and rebate incentives pursuant to agreements with certain vendors. Vendor rebates and allowances are initially deferred as a reduction of the cost of inventory purchased. Vendor rebates and allowances that are not specific, incremental and identifiable are classified as a reduction of cost of sales and occupancy costs in the consolidated statements of income and comprehensive income as the related inventory is sold. Vendor rebates and allowances that are identified as specific, incremental and identifiable costs incurred by the Company in selling the vendors’ products are classified as a reduction of selling, general and administrative expenses in the consolidated statements of income and comprehensive income as the costs are incurred.
Merchandise Inventories
Merchandise inventories represent finished goods and are stated at the lower of cost or market. Cost is determined by the average-cost method and includes inbound freight charges. Physical inventories are performed on a regular basis at store locations, and cycle counts are performed for inventory at distribution centers. During the period between counts at store and distribution center locations, the Company accrues for estimated losses related to inventory shrinkage based on historical inventory shrinkage results and current trends in the business. Inventory shrinkage may occur due to theft, loss, or the deterioration of goods, among other reasons. The Company assesses its inventory for estimated obsolescence or unmarketable inventory and writes down the difference between the cost of inventory and the estimated market value based upon historical mark-downs, supply on-hand and assumptions about future sales.
Fixed Assets
Fixed assets are stated at cost, less accumulated depreciation and amortization. Store facilities and equipment under capital leases are recorded at the present value of minimum lease payments at the inception of the lease. Maintenance and minor repairs are expensed as incurred.
Buildings, equipment, furniture and fixtures are depreciated using the straight-line method over the estimated useful life of the asset. Leasehold and building improvements are amortized using the straight-line method over the term of the lease or the estimated useful life of the improvement, whichever is shorter. Land is not amortized. Amortization of fixed assets financed through capital leases is included in depreciation expense.
The Company’s fixed assets are generally depreciated or amortized using the following estimated useful lives:
| Buildings |
30 years | |||
| Equipment |
3 to 7 years | |||
| Furniture and fixtures |
4 to 7 years | |||
| Leasehold and building improvements |
5 to 10 years |
Costs incurred to develop internal-use software during the application development stage, which includes costs to design the software configuration and interfaces, coding, installation and testing, are capitalized and reported at cost, less accumulated amortization. Costs of significant upgrades and enhancements that result in additional functionality are also capitalized, whereas costs incurred for maintenance and minor upgrades and enhancements are expensed as incurred. Software and capitalized development costs are included in the Company’s equipment fixed asset category and are amortized using the straight-line method over the estimated useful life of the asset.
F-9
Table of Contents
The Company assesses its fixed assets, including internal use software, for impairment whenever events or changes in circumstances indicate that the carrying value may not be recoverable. The review of recoverability is based on estimates of the undiscounted future cash flows expected to be generated by an asset (or group of assets) at a store level. If impairment exists due to the inability to recover the asset’s carrying value, impairment losses are measured as the amount by which the asset’s carrying value exceeds its fair value using the income approach and are recorded as a reduction of the related asset and charged to the consolidated statements of income and comprehensive income.
Goodwill
Goodwill represents the excess of the cost of acquired businesses over the fair value of the tangible and identifiable intangible assets acquired and liabilities assumed. Goodwill is not amortized; rather, the Company performs its annual impairment test during the third quarter of each year and performs additional impairment tests whenever events or changes in circumstances indicate that the carrying value of goodwill may not be recoverable. The Company has the option to first perform a qualitative assessment of its goodwill to determine whether it is necessary to perform a quantitative impairment test. If the Company concludes it is more likely than not that its goodwill is impaired, management evaluates the recoverability of goodwill by comparing the carrying value of the Company’s reporting units to their respective fair values. The fair value of the Company’s reporting units is estimated utilizing a combination of the income and market approaches through the application of discounted cash flow and market comparable methods. If the fair value is less than the carrying value, a second step is required, which involves allocating the fair value of the specific reporting unit derived in the first step to the fair value of that reporting unit’s net assets. Any fair value in excess of amounts allocated to such net assets represents the implied fair value of goodwill. If the calculated fair value of the implied goodwill resulting from this allocation is lower than the carrying value of either reporting unit’s goodwill, the difference is recognized as a non-cash impairment charge. The Company has three reporting units for assessing goodwill impairment consisting of vaccination services, pet hotels and all other retail locations. In fiscal 2014, the goodwill associated with the pet hotels reporting unit was deemed to be fully impaired (Note 4).
Other Intangible Assets
Other intangible assets represent the Company’s trade name, proprietary technology, non-compete agreements, in-place leases, service marks and favorable lease rights. All other intangibles, with the exception of the Company’s trade name, have finite lives and are amortized using the straight-line method over their estimated useful lives, ranging from two to 27 years. The Company’s trade name is a non-amortizable intangible asset.
The Company reviews its amortizable intangible assets with finite lives for impairment whenever events or changes in circumstances indicate that the carrying value of its intangible assets may not be recoverable. The amount of impairment, if any, is measured based on fair value, which is determined using future projected discounted operating cash flows.
The Company evaluates its indefinite-lived trade name for impairment annually during the third quarter, or whenever events or changes in circumstances indicate the carrying value may not be recoverable, by comparing its estimated fair value, measured using a royalty savings method, with its carrying value. The Company also has the option to first perform a qualitative assessment of its indefinite-lived intangible assets to determine whether it is necessary to perform a quantitative impairment test.
Available-for-Sale Securities
Equity investments that have readily determinable fair values are classified as available-for-sale and are included in other long-term assets in the Company’s consolidated balance sheets. They are
F-10
Table of Contents
recorded at fair value, with unrealized gains and losses, net of tax, included in accumulated other comprehensive income (loss) (“AOCI”).
The Company evaluates whether declines in the fair value of its investments below their cost are other-than-temporary each reporting period or whenever events or changes in circumstances indicate that the cost may not be recoverable. Factors the Company evaluates in making the determination of whether a decline in fair value below cost is other-than-temporary include the amount of time the fair value of the security has been below its cost and the anticipated ability to recover the cost of the investment.
Equity Method Investments
Certain of the Company’s investments are accounted for using the equity method of accounting. The Company’s share of the investees’ results is presented as either income or loss from equity method investees in the accompanying consolidated statements of income and comprehensive income.
The Company has a joint venture with a Mexico-based partner to establish Petco locations in Mexico. The joint venture purchases certain inventory items and store assets from the Company, and the Company receives royalties from the joint venture for the use of its trademarks, which have not been material to-date. The cumulative unrealized foreign currency adjustment on the translation of the Company’s investment and the foreign currency translation impact of the royalty receivable are included in AOCI, net of tax. The Company also has an investment in a pet specialty company. The joint venture and the pet specialty company are in their early stages and are not material to the Company’s consolidated financial statements.
Fair Value Measurements
Fair value represents the price that would be received to sell an asset or paid to transfer a liability in an orderly transaction between market participants on the measurement date. When determining fair value, the Company considers the principal or most advantageous market in which the Company would conduct a transaction, in addition to the assumptions that market participants would use when pricing the related assets or liabilities, including non-performance risk.
A three-level hierarchy prioritizes the inputs to valuation techniques used to measure fair value. The hierarchy gives the highest priority to unadjusted quoted prices in active markets for identical assets or liabilities (Level 1 measurements) and the lowest priority to measurements involving significant unobservable inputs (Level 3 measurements). The three levels of the fair value hierarchy are as follows:
| Level 1 |
— | Quoted prices (unadjusted) in active markets for identical assets or liabilities that the Company has the ability to access at the measurement date. | ||||
| Level 2 |
— | Inputs other than quoted prices included within Level 1 that are observable for the asset or liability, either directly or indirectly. | ||||
| Level 3 |
— | Unobservable inputs for the asset or liability. | ||||
Refer to Notes 6, 7, 8, 9 and 10 for fair value disclosures for the senior secured term credit facilities, senior notes, payment in kind (“PIK”) toggle notes, derivatives, and other types of assets and liabilities measured at fair value, respectively.
Self-Insurance Reserves
The Company is self-insured for workers’ compensation, general, auto liability and employee-related health care benefits, a portion of which is paid by the Company’s employees. Additionally, the Company has insurance coverage to limit its exposure above a per occurrence retention limit. These
F-11
Table of Contents
insurance policies have stated maximum coverage limits after which the Company bears the risk of loss. The Company determines the related liabilities using a number of factors including historical experience and trends related to claims and payments, information provided by the Company’s insurance brokers and actuaries, an estimate of incurred but not reported claims and industry experience and trends. Estimates of future claim costs for workers’ compensation, general, auto liability and employee-related health care benefits are recorded on an undiscounted basis. All estimates of ultimate loss and loss adjustment expense and resulting reserves are subject to inherent variability caused by the nature of the insurance process. The potentially long period of time between the reporting of an occurrence of an incident and the final resolution of a claim and the possible effects of changes in the legal, social and economic environments contribute to this variability. The current portion of the Company’s self-insurance liabilities, included in accrued salaries and employee benefits and accrued expenses and other liabilities, is reported net of insurance recoveries of $5.1 million and $4.4 million as of January 31, 2015 and February 1, 2014, respectively. The long-term portion of the Company’s self-insurance liabilities, included in deferred rents and other liabilities, is reported net of insurance recoveries of $14.3 million and $15.7 million as of January 31, 2015 and February 1, 2014, respectively.
Self-insurance reserves are reflected in the consolidated balance sheets as follows (in thousands):
| January 31, 2015 |
February 1, 2014 |
|||||||
| Current: |
||||||||
| Workers’ compensation and employee-related health care benefits |
$ | 18,656 | $ | 16,167 | ||||
| General and auto liability reserves |
5,521 | 4,648 | ||||||
|
|
|
|
|
|||||
| $ | 24,177 | $ | 20,815 | |||||
|
|
|
|
|
|||||
| Non-current: |
||||||||
| Workers’ compensation reserve |
$ | 35,494 | $ | 38,755 | ||||
| General and auto liability reserves |
14,007 | 13,443 | ||||||
|
|
|
|
|
|||||
| $ | 49,501 | $ | 52,198 | |||||
|
|
|
|
|
|||||
The current portion and non-current portion of self-insurance reserves for workers’ compensation and employee-related health care benefits are included in accrued salaries and employee benefits and deferred rents and other liabilities, respectively, in the consolidated balance sheets. The current portion and non-current portion of self-insurance reserves for general and auto liability costs are included in accrued expenses and other liabilities and deferred rents and other liabilities, respectively, in the consolidated balance sheets.
Reserve for Closed Stores
The Company continually evaluates the performance of its stores and periodically closes stores that are underperforming. Costs associated with exit or disposal activities are recognized when they are incurred, which is when the Company ceases using a property. The reserve for closed stores consists of lease obligations, property taxes, common area maintenance costs and other costs, net of expected sublease income. The reserve for closed stores is calculated using the net present value method, at the Company’s incremental borrowing rate, over the remaining life of the respective leases. The current portion of the reserve for closed stores is included in accrued expenses and other liabilities in the consolidated balance sheets. The non-current portion of the reserve for closed stores is included in deferred rents and other liabilities in the consolidated balance sheets. Store closing costs, changes in sublease assumptions, and other occupancy payments are included in cost of sales and occupancy costs in the accompanying consolidated statements of income and comprehensive income. The Company can make no assurances that additional charges related to closed stores will not be required based on the changing real estate environment and estimates made for sublease income assumptions.
F-12
Table of Contents
Revenue Recognition
Revenue from sales of the Company’s products is recognized at the point of sale for retail locations. For merchandise shipped to customers from the Company’s ecommerce website, title and risk of loss pass, and revenue, including outbound shipping charges, is recognized at the time the customer receives the product. Revenue from pet grooming, training and other services is recognized when services are rendered. Revenue is recorded net of certain discounts and promotions offered to customers, including those offered under the Company’s customer loyalty programs. Allowances are recorded for the estimated cost of these customer volume-based loyalty programs as a reduction of sales in the consolidated statements of income and comprehensive income in the period the Company sells the products. Such amounts are estimated based on historical experience and contractual terms and have not been material to-date. Shipping and handling amounts billed to customers are included in net sales, and the related costs are reflected in cost of sales in the accompanying consolidated statements of income and comprehensive income. The Company records an allowance for estimated returns based on historical return patterns in the period of sale, which to-date have not been material.
The Company recognizes revenue from gift cards when gift cards are redeemed by the customer, as well as an estimated unredeemed liability (“breakage”). Gift card breakage income, which to-date has not been material, is recognized based upon historical redemption patterns and represents the balance of gift cards for which the likelihood of redemption is remote and for which the Company has determined that it does not have a legal obligation to remit the value to the relevant jurisdictions. Gift card breakage is included in the consolidated statements of income and comprehensive income as a reduction of selling, general and administrative expenses.
Revenue is recognized net of applicable sales tax in the consolidated statements of income and comprehensive income. Sales tax liability is included in accrued expenses and other liabilities in the consolidated balance sheets.
Cost of Sales and Occupancy Costs
Cost of sales and occupancy costs include the following types of expenses:
| • | Direct costs (net of vendor rebates, allowances and discounts for products sold, which to-date have not been material) including inbound freight charges; |
| • | Shipping and handling costs; |
| • | Inventory shrinkage costs and write-downs; |
| • | Payroll costs of pet groomers and trainers and other direct costs of services; |
| • | Store occupancy and utilities costs including rent, common area maintenance and real estate taxes; |
| • | Merchandise purchasing costs; |
| • | Internal transfer costs, warehousing and receiving costs and other costs of the Company’s distribution network including depreciation |
Selling, General and Administrative Expenses
Selling, general and administrative expenses include the following types of expenses: payroll costs of store employees and management; other costs associated with store operations; credit card fees; store pre-opening and remodeling costs; advertising expenses; and general and administrative costs, including payroll and other costs associated with management and other support functions.
F-13
Table of Contents
Advertising Expenses
The Company records advertising expense as incurred and classifies advertising costs within selling, general and administrative expenses in the consolidated statements of income and comprehensive income. Advertising expenses, net of cooperative advertising reimbursements, were $82.4 million for fiscal 2014, $84.7 million for fiscal 2013 and $84.1 million for fiscal 2012. Vendor cooperative advertising reimbursements reduced total advertising expense by $32.4 million, $10.6 million and $6.4 million for fiscal 2014, 2013 and 2012, respectively.
Operating Leases
Rent expense under operating leases is recognized on a straight-line basis over the terms of the leases, which generally range from five to 15 years for distribution center sites, 10 to 15 years for stores and three to eight years for equipment. Reimbursements from lessors of tenant improvement costs are recorded as deferred rents and amortized on a straight-line basis over the term of the lease. The lease term commences on the date when the Company has the right to control the use of the leased property.
The Company records contractual obligations associated with the retirement of long-lived assets at their fair value at the time the obligations are incurred. These obligations arise from certain leases and primarily relate to the cost of removing leasehold improvements and certain fixtures from such lease sites and restoring the sites to their original condition. Upon initial recognition of the liability, that cost is capitalized as part of the related long-lived asset and depreciated on a straight-line basis over the estimated useful life of the asset. The Company’s asset retirement obligation was $3.4 million and $3.1 million at January 31, 2015 and February 1, 2014, respectively, and is included in deferred rents and other liabilities in the consolidated balance sheets.
Income Taxes
Deferred tax assets and liabilities are recognized for the future tax consequences attributable to differences between the financial statement carrying amounts of existing assets and liabilities and their respective tax bases and operating loss and tax credit carryforwards. Deferred tax assets and liabilities are measured using enacted tax rates expected to apply to taxable income in the years in which those temporary differences are expected to be recovered or settled. The effect on deferred tax assets and liabilities of a change in tax rates is recognized in the consolidated statements of income and comprehensive income in the period that includes the enactment date. Valuation allowances, if any, are recorded against net deferred tax assets when it is considered more likely than not that some portion or all of a deferred tax asset may not be recoverable.
Management regularly evaluates the likelihood of recognizing the benefit for income tax positions it has taken in various federal and state filings by considering relevant facts, circumstances and information available. The authoritative guidance clarifies the accounting for income taxes by prescribing a minimum probability threshold that a tax position must meet before a financial statement benefit is recognized. The minimum threshold for recognizing benefit of a tax position is that such position is more likely than not to be sustained upon examination by the taxing authority, including resolution of any related appeals or litigation processes, and is based on the technical merits of the position.
Stock-Based Compensation
Stock-based compensation cost is measured at the grant date, based on the estimated fair value of the award, and is recognized as expense using the straight-line method over the vesting period of the award, which is also the requisite service period. Management estimates expected pre-vesting
F-14
Table of Contents
forfeitures for share-based awards and only recognizes expense for those awards that are expected to vest. The Company’s stock-based compensation charges relate to stock options and restricted stock units.
Common Stock Valuation
The per share fair value of common stock is determined by the Company’s board of directors based in part on enterprise valuations performed by management with the assistance of a third-party valuation firm, taking into consideration any recent market transactions involving the Company’s common stock. The valuation of the equity of any private company involves various estimates and assumptions that may differ from actual values. The Company utilizes a combination of three valuation approaches to determine the equity value of the business:
Income Approach—estimates the fair value based on the present value of the company’s future estimated cash flows and the residual value of the company beyond the forecast period. These future cash flows, including the cash flows beyond the forecast period for the residual value, are discounted to their present values using an appropriate discount rate, to reflect the risks inherent in the Company achieving these estimated cash flows.
Market Approach (specifically, the guideline public company method) — estimates fair value based upon the observed valuation multiples of comparable public companies, the equity of which is freely-traded by investors in the public securities markets.
Actual Transaction Price—per share price of any recent market transactions involving the Company’s common stock, such as the fiscal 2012 minority stock sale to two unrelated third-party investors (Note 2).
The results of the three valuation approaches are weighted based on a variety of factors including: current macroeconomic environment, current industry conditions and length of time since arms-length market transaction events. Additionally, a discount for lack of marketability is applied to account for the lack of access to an active public market. The resulting value is then allocated to shares of common stock, restricted stock units and stock options using an option-pricing model.
Pre-Opening Costs
Costs incurred in connection with opening new stores are expensed as incurred and are included in selling, general and administrative expenses in the Company’s consolidated statements of income and comprehensive income. Such costs include advertising, payroll, initial store supplies and utilities.
Derivative Instruments
In August 2011, the Company entered into a total of six forward-starting interest rate swap agreements to limit its future exposure to variable rate interest payments with respect to $600.0 million of its Amended Term Loan Facility (Note 6), which qualified for hedge accounting. Interest rate swaps are recorded at fair value, with unrealized gains and losses, net of tax, recorded in AOCI through February 5, 2013, and as a component of interest expense thereafter. In connection with the February 5, 2013 Amended Term Loan Facility (Note 6), the Company elected to discontinue hedge accounting for the outstanding interest rate swaps. Accordingly, the cumulative unrealized loss balance in AOCI as of February 5, 2013 will be reclassified into income as a component of interest expense during the periods in which the hedged forecasted transaction affects income, which is as interest on the Amended Term Loan Facility is incurred. Refer to Note 9 for further disclosures of the Company’s derivative instruments and hedging activities.
F-15
Table of Contents
Recent Accounting Pronouncements
In May 2014, the Financial Accounting Standards Board (“FASB”) issued updated guidance on revenue recognition that requires an entity to recognize the amount of revenue to which it expects to be entitled for the transfer of promised goods or services to customers. The new standard will be effective for the Company’s fiscal year 2017, and early application is not permitted. The standard permits the use of either the retrospective or cumulative effect transition method. The Company is currently evaluating the impact the new standard and adoption methods will have on its consolidated financial statements and related disclosures. The Company has not yet selected a transition method, nor has it determined the effect of the standard on its ongoing financial reporting. Although management is still evaluating the impact of the new standard on the Company’s consolidated financial statements, the impact is not expected to be material.
2. Related-Party Transactions
Management Services Agreement
On October 26, 2006, the date of acquisition of the Company by private equity funds TPG Partners V, L.P. and Green Equity Investors IV, L.P. and their affiliates (collectively, the “Investors”), the Company entered into a management services agreement with certain affiliates of the Investors, under which the Investors’ affiliates provide certain management and advisory services to the Company and its operating subsidiaries. The services include investment banking services, management, consulting and financial planning services, and financial advisory services in connection with major financial transactions that may be undertaken from time to time. As compensation for management, consulting and financial planning services, the Company agreed to pay the Investors’ affiliates an annual fee of $7.0 million plus reimbursement of reasonable out-of-pocket expenses incurred in connection with the services rendered. As compensation for financial advisory and investment banking services in connection with major financial transactions, the Company agreed to pay the Investors normal and customary fees for services of like kind to be agreed upon. The Company also agreed to provide customary indemnification to the Investors’ affiliates. The agreement has a term of ten years, and is automatically renewed in one-year increments thereafter, unless otherwise earlier terminated. Upon a change of control or public offering, the agreement terminates and all amounts otherwise payable during the term, discounted to present value, become due.
In December 2012, certain stockholders of the Company sold a minority interest in the Company to two unrelated third-party investors. In connection with the minority stock sale, the Investors (i) transferred and assigned to an affiliate of the first new investor the right to receive from the Company a pro rata portion of future management fees equal to the first new investor’s pro rata ownership interest in the Company and (ii) waived their right to receive from the Company a pro rata portion of future management fees equal to the second new investor’s pro rata ownership interest in the Company. The second new investor was issued a warrant to purchase shares of the Company’s common stock intended to compensate the investor for the loss in value in its investment attributable to the fees that are payable by the Company or its subsidiaries to the Investors and their affiliates from time to time under the management services agreement. The warrant is not material to the Company’s consolidated financial statements.
The Company recorded management fees of $6.1 million for fiscal 2014 and fiscal 2013 and $6.9 million for fiscal 2012, which are included in selling, general and administrative expenses in the accompanying consolidated statements of income and comprehensive income.
Stockholders Agreement
The stockholders of the Company are the Investors, certain co-investors and certain members of management. On October 26, 2006, the Company and its stockholders entered into a stockholders
F-16
Table of Contents
agreement, which set forth certain provisions relating to their respective rights and obligations with respect to their capital stock. These provisions included board composition and director nomination rights, major transaction approval rights, restrictions on transfer of any security, tag along and drag along rights, the Investors’ right of first refusal, preemptive rights, management stockholders’ repurchase option, demand and piggyback registration rights, information rights and indemnification of the Investors. Effective June 8, 2011, the stockholders agreement was amended to include a call right provision that enables the Company to repurchase management stockholder shares acquired after June 8, 2011 at its discretion upon the occurrence of certain triggering events.
Effective December 24, 2012, the stockholders agreement was amended and restated in connection with the Company’s minority stock sale to provide certain rights to the new investors, including board nomination and observation rights, approval of certain transactions, rights of first refusal, registration rights and information rights, among other things. Certain provisions of the agreement terminate upon a qualified public offering event, including the rights relating to the board, approval of certain transactions, restrictions on transfer, and rights of first refusal, preemptive rights, and tag along and drag along rights.
Other
The Company incurred and recorded expenses related to certain of the Investors’ affiliates’ legal and other costs that were not material in fiscal 2014, 2013 and 2012. These costs were included in selling, general and administrative expenses in the consolidated statements of income and comprehensive income.
3. Composition of Balance Sheet Accounts
Prepaid Expenses
Prepaid expenses consisted of the following (in thousands):
| January 31, 2015 |
February 1, 2014 |
|||||||
| Prepaid occupancy |
$ | 37,721 | $ | 10,870 | ||||
| Other prepaid expenses |
17,923 | 20,652 | ||||||
|
|
|
|
|
|||||
| $ | 55,644 | $ | 31,522 | |||||
|
|
|
|
|
|||||
Fixed Assets, Net
Fixed assets, net, consisted of the following (in thousands):
| January 31, 2015 |
February 1, 2014 |
|||||||
| Buildings and related improvements |
$ | 85,737 | $ | 64,621 | ||||
| Land |
48,864 | 18,421 | ||||||
| Equipment |
491,760 | 421,761 | ||||||
| Furniture and fixtures |
322,221 | 295,746 | ||||||
| Leasehold improvements |
463,178 | 417,836 | ||||||
|
|
|
|
|
|||||
| 1,411,760 | 1,218,385 | |||||||
| Less accumulated depreciation |
(819,948 | ) | (704,508 | ) | ||||
|
|
|
|
|
|||||
| $ | 591,812 | $ | 513,877 | |||||
|
|
|
|
|
|||||
The Company’s depreciation expense was $120.8 million for fiscal 2014, $110.9 million for fiscal 2013 and $106.2 million for fiscal 2012.
F-17
Table of Contents
Other Intangible Assets, Net
Components of other intangible assets were as follows (dollar amounts in thousands):
| January 31, 2015 | ||||||||||||||||||||
| Estimated useful lives (years) |
Weighted average remaining estimated life (years) |
Gross amount |
Accumulated amortization |
Net amount | ||||||||||||||||
| Proprietary technology |
2-5 | 2.5 | $ | 6,848 | $ | (6,246 | ) | $ | 602 | |||||||||||
| Non-compete agreements |
5 | 1.2 | 55 | (42 | ) | 13 | ||||||||||||||
| Favorable lease rights |
4-27 | 8.4 | 23,076 | (12,089 | ) | 10,987 | ||||||||||||||
| Service marks |
5 | 3.0 | 1,000 | (416 | ) | 584 | ||||||||||||||
| In-place leases |
3-15 | 3.4 | 197 | (113 | ) | 84 | ||||||||||||||
|
|
|
|
|
|
|
|||||||||||||||
| Total intangible assets subject to amortization |
— | 6.4 | 31,176 | (18,906 | ) | 12,270 | ||||||||||||||
| Indefinite-lived intangible trade name |
— | — | 270,000 | — | 270,000 | |||||||||||||||
|
|
|
|
|
|
|
|||||||||||||||
| Total intangible assets |
$ | 301,176 | $ | (18,906 | ) | $ | 282,270 | |||||||||||||
|
|
|
|
|
|
|
|||||||||||||||
| February 1, 2014 | ||||||||||||||||||||
| Estimated useful lives (years) |
Weighted average remaining estimated life (years) |
Gross amount |
Accumulated amortization |
Net amount | ||||||||||||||||
| Proprietary technology |
2-5 | 2.5 | $ | 6,750 | $ | (6,196 | ) | $ | 554 | |||||||||||
| Non-compete agreements |
5 | 2.2 | 55 | (31 | ) | 24 | ||||||||||||||
| Favorable lease rights |
2-27 | 9.3 | 23,942 | (11,114 | ) | 12,828 | ||||||||||||||
| Service marks |
2-5 | 2.4 | 2,143 | (828 | ) | 1,315 | ||||||||||||||
| In-place leases |
2-15 | 3.8 | 235 | (106 | ) | 129 | ||||||||||||||
|
|
|
|
|
|
|
|||||||||||||||
| Total intangible assets subject to amortization |
— | 7.0 | 33,125 | (18,275 | ) | 14,850 | ||||||||||||||
| Indefinite-lived intangible trade name |
— | — | 270,000 | — | 270,000 | |||||||||||||||
|
|
|
|
|
|
|
|||||||||||||||
| Total intangible assets |
$ | 303,125 | $ | (18,275 | ) | $ | 284,850 | |||||||||||||
|
|
|
|
|
|
|
|||||||||||||||
Amortization expense for other intangible assets, net was $2.2 million for fiscal 2014, $3.6 million for fiscal 2013 and $2.1 million for fiscal 2012. Amortization for proprietary technology, service marks and non-compete agreements is included in selling, general and administrative expenses in the accompanying consolidated statements of income and comprehensive income, and amortization for favorable lease rights and in-place leases is included in cost of sales and occupancy expenses in the accompanying consolidated statements of income and comprehensive income.
F-18
Table of Contents
At January 31, 2015, estimated intangible asset amortization expense is expected to be as follows (in thousands):
| Fiscal years |
Amortization expense |
|||
| 2015 |
$ | 2,038 | ||
| 2016 |
1,735 | |||
| 2017 |
1,629 | |||
| 2018 |
1,305 | |||
| 2019 |
1,128 | |||
| Thereafter |
4,435 | |||
|
|
|
|||
| Total estimated intangible asset amortization |
$ | 12,270 | ||
|
|
|
|||
Accrued Salaries and Employee Benefits
Accrued salaries and employee benefits consisted of the following (in thousands):
| January 31, 2015 |
February 1, 2014 |
|||||||
| Accrued compensation |
$ | 42,468 | $ | 47,619 | ||||
| Accrued paid time-off |
27,534 | 26,597 | ||||||
| Other accrued employee benefits |
18,656 | 16,167 | ||||||
|
|
|
|
|
|||||
| $ | 88,658 | $ | 90,383 | |||||
|
|
|
|
|
|||||
Accrued Expenses and Other Liabilities
Accrued expenses and other liabilities consisted of the following (in thousands):
| January 31, 2015 |
February 1, 2014 |
|||||||
| Sales taxes payable |
$ | 18,233 | $ | 17,448 | ||||
| Accrued real estate taxes |
19,196 | 18,895 | ||||||
| Accrued capital expenditures |
30,240 | 15,740 | ||||||
| Accrued interest |
26,240 | 26,213 | ||||||
| Accrued advertising expenses |
3,850 | 9,773 | ||||||
| Accrued federal income taxes |
9,458 | — | ||||||
| Other accrued expenses and liabilities |
67,923 | 60,026 | ||||||
|
|
|
|
|
|||||
| $ | 175,140 | $ | 148,095 | |||||
|
|
|
|
|
|||||
Deferred rents and other liabilities consisted of the following (in thousands):
| January 31, 2015 |
February 1, 2014 |
|||||||
| Deferred rent |
$ | 103,187 | $ | 98,471 | ||||
| Accrued insurance expense |
49,501 | 52,198 | ||||||
| Other liabilities |
40,963 | 44,431 | ||||||
|
|
|
|
|
|||||
| $ | 193,651 | $ | 195,100 | |||||
|
|
|
|
|
|||||
F-19
Table of Contents
4. Goodwill
The changes in the carrying amount of the Company’s goodwill were as follows (in thousands):
| January 31, 2015 |
February 1, 2014 |
|||||||
| Beginning balance: |
||||||||
| Goodwill |
$ | 1,289,857 | $ | 1,289,857 | ||||
| Accumulated impairment charges |
(283,000 | ) | (283,000 | ) | ||||
|
|
|
|
|
|||||
| Goodwill, net |
$ | 1,006,857 | $ | 1,006,857 | ||||
|
|
|
|
|
|||||
| Additions from acquisitions |
$ | 8,181 | $ | — | ||||
| Impairment charges |
$ | (7,753 | ) | $ | — | |||
| Ending balance: |
||||||||
| Goodwill |
$ | 1,298,038 | $ | 1,289,857 | ||||
| Accumulated impairment charges |
(290,753 | ) | (283,000 | ) | ||||
|
|
|
|
|
|||||
| Goodwill, net |
$ | 1,007,285 | $ | 1,006,857 | ||||
|
|
|
|
|
|||||
The Company performed its annual goodwill impairment test in the third quarter of fiscal 2014. The Company assessed the totality of events and circumstances as of third quarter of fiscal 2014 and determined that a quantitative goodwill impairment test was not necessary, and no goodwill impairment had occurred.
During the fourth quarter of fiscal 2014, the Company revised its go-forward strategy for the Company’s pet hotels reporting unit, which is expected to result in a decline in the reporting unit’s future earnings. Upon this change in strategy management determined that a quantitative impairment test was necessary for the pet hotels reporting unit, as it was more-likely-than-not that the fair value of the pet hotels reporting unit was less than its carrying amount. As a result of the quantitative impairment test performed, a goodwill impairment charge of $7.8 million was recognized in the pet hotels reporting unit, since the carrying amount of the reporting unit was greater than the fair value of the reporting unit (as determined using the expected present value of future cash flows), and the carrying amount of the reporting unit goodwill exceeded the zero implied fair value of that goodwill. There were no goodwill impairment charges recorded in fiscal 2013 or fiscal 2012.
5. Reserve for Closed Stores
The reserve for closed stores is reflected in the Company’s consolidated balance sheets as follows (in thousands):
| January 31, 2015 |
February 1, 2014 |
|||||||
| Current portion of the reserve for closed stores |
$ | 2,558 | $ | 2,428 | ||||
| Non-current portion of the reserve for closed stores |
4,614 | 4,933 | ||||||
|
|
|
|
|
|||||
| Total reserve for closed stores |
$ | 7,172 | $ | 7,361 | ||||
|
|
|
|
|
|||||
Payments relating to the reserve for closed stores are expected to be made through 2025, coinciding with the expiration of the longest lease being reserved.
The components of the reserve for closed stores were as follows (in thousands):
| January 31, 2015 |
February 1, 2014 |
|||||||
| Total remaining gross occupancy costs |
$ | 17,716 | $ | 13,579 | ||||
| Less: |
||||||||
| Expected sublease income |
(9,393 | ) | (4,918 | ) | ||||
| Interest costs |
(1,151 | ) | (1,300 | ) | ||||
|
|
|
|
|
|||||
| Reserve for closed stores |
$ | 7,172 | $ | 7,361 | ||||
|
|
|
|
|
|||||
F-20
Table of Contents
The activity related to the reserve for closed stores was as follows (in thousands):
| Fiscal years | ||||||||||||
| 2014 (52 weeks) |
2013 (52 weeks) |
2012 (53 weeks) |
||||||||||
| Beginning balance |
$ | 7,361 | $ | 8,385 | $ | 12,390 | ||||||
|
|
|
|
|
|
|
|||||||
| Reserve for new store closures |
3,653 | 1,330 | 526 | |||||||||
| Changes in sublease income assumptions |
(187 | ) | 363 | 824 | ||||||||
| Other |
(41 | ) | 258 | 513 | ||||||||
|
|
|
|
|
|
|
|||||||
| Charges, net |
3,425 | 1,951 | 1,863 | |||||||||
| Payments, net |
(3,614 | ) | (2,975 | ) | (5,868 | ) | ||||||
|
|
|
|
|
|
|
|||||||
| Ending balance |
$ | 7,172 | $ | 7,361 | $ | 8,385 | ||||||
|
|
|
|
|
|
|
|||||||
6. Senior Secured Credit Facilities
The Company has a $1.225 billion ($1.213 billion, net of discount) senior secured term loan facility maturing on November 24, 2017, most recently amended on February 5, 2013 (“Amended Term Loan Facility”), and a senior secured asset-based revolving credit facility expiring on April 19, 2018 (subject to a springing maturity 91 days inside the Amended Term Loan Facility maturity), most recently amended on November 21, 2014 to increase the commitments from $300.0 million (“Revolving Credit Facility”) to $400.0 million (“Amended Revolving Credit Facility”). The Amended Term Loan Facility and the Amended Revolving Credit Facility are collectively referred to as the “Senior Secured Credit Facilities.”
As of January 31, 2015, the outstanding principal balance of the Amended Term Loan Facility was $1.176 billion ($1.172 billion, net of the unamortized discount), and the weighted average interest rate on the principal borrowings outstanding was 4.1%. As of January 31, 2015 and February 1, 2014, the estimated fair value of the Amended Term Loan Facility was approximately $1.165 billion and $1.195 billion, respectively, based on current industry market yields, which are considered Level 2 fair value hierarchy inputs (Note 1).
As of January 31, 2015, $40.0 million was outstanding under the Amended Revolving Credit Facility, of which $10.0 million was included in current portion of long-term debt and capital lease obligations in the consolidated balance sheets. The weighted average interest rate on the borrowings outstanding was 2.7%. Due to the close proximity in which the amendment and borrowings took place to fiscal 2014 year-end, the fair value of the Amended Revolving Credit Facility approximates its carrying value as of January 31, 2015. At January 31, 2015, $282.5 million was available under the Amended Revolving Credit Facility, which is net of $48.8 million of outstanding letters of credit issued in the normal course of business and a $28.7 million reduction for a shortfall in qualifying assets, net of reserves.
The Company’s obligations under the Senior Secured Credit Facilities are secured by substantially all of the personal property assets of the Company with differing priority rights to the various personal property assets ascribed to each facility. Both credit facility agreements, while not identical, contain certain affirmative and negative covenants related to indebtedness, liens, fundamental changes in the business, investments, restricted payments and agreements and a fixed charge coverage ratio, among other things. The Senior Secured Credit Facilities specify a number of events of default (some of which are subject to applicable cure periods), including, among others, the failure to make payments when due, defaults under other agreements or instruments of indebtedness, non-compliance with covenants, change of control and bankruptcy. Upon the occurrence of an event of default, the lenders of each facility may terminate their respective facility and declare all amounts outstanding to be immediately due and payable.
F-21
Table of Contents
Amended Term Loan Facility
Interest under the Amended Term Loan Facility is, at the Company’s option, the bank’s alternative base rate payable quarterly in arrears or LIBOR (subject to a 1.00% floor) payable upon maturity of the LIBOR contract, plus the applicable rate in either case. The alternative base rate is the greater of the bank prime rate, federal funds effective rate plus 0.5% or adjusted LIBOR plus 1.0%. The applicable rate is either 3.00% per annum for a LIBOR loan or 2.00% per annum for an alternative base rate loan. Principal payments under the Amended Term Loan Facility are $3.1 million quarterly and are due as follows (in thousands):
| Fiscal years |
Principal payment due |
|||
| 2015 |
$ | 12,250 | ||
| 2016 |
12,250 | |||
| 2017 |
1,151,500 | |||
|
|
|
|||
| Total payments |
$ | 1,176,000 | ||
|
|
|
|||
Amended Revolving Credit Facility
The Company amended its senior secured asset-based revolving credit facility on November 21, 2014 to increase the commitments under the Revolving Credit Facility from $300.0 million to $400.0 million. The current revolving commitments (“Tranche A”) were increased from $300.0 million to $360.0 million, and a new $40.0 million first-in, last-out (“FILO”) revolving commitment was added. The terms of the Amended Revolving Credit Facility remain substantially unchanged. The Company incurred arranger fees and other third-party expenses of $0.9 million, which were capitalized as debt issuance costs and are included in other assets in the accompanying consolidated balance sheets.
The Amended Revolving Credit Facility has availability up to $400.0 million and a $150.0 million letter of credit sub-facility. The availability under the Amended Revolving Credit Facility is limited to a borrowing base, which allows the Company to borrow up to 90.0% of eligible credit card receivables plus the lesser of 85.0% of eligible inventory and 90.0% of the net orderly liquidation value of the inventory, net of certain reserves, for Tranche A. The FILO borrowing base is incremental to the Tranche A borrowing base and is 10.0% of the eligible credit card receivables plus 10.0% of the net orderly liquidation value of eligible inventory. Letters of credit reduce the amount available to borrow by their face value.
Interest on the Amended Revolving Credit Facility is based on either the bank’s alternate base rate payable quarterly in arrears or LIBOR payable upon maturity of the LIBOR contract, in either case plus a spread. The bank spread rates are dependent on average historical excess availability as follows:
Rates in effect under the Revolving Credit Facility through November 21, 2014 were as follows:
| Average Historical Excess Availability |
LIBOR Spread | Alternate Bank Rate Spread (typically prime rate) |
||||||
| Less than $100.0 million |
1.75 | % | 0.75 | % | ||||
| From $100.0 million to $200.0 million |
1.50 | % | 0.50 | % | ||||
| In excess of $200.0 million |
1.25 | % | 0.25 | % | ||||
F-22
Table of Contents
Rates in effect under the Amended Revolving Credit Facility are as follows:
| FILO Loans | Tranche A Loans | |||||||||||||||
| Average Historical Excess Availability |
LIBOR Spread |
Alternate Bank Rate Spread (typically prime rate) |
LIBOR Spread |
Alternate Bank Rate Spread (typically prime rate) |
||||||||||||
| Less than $120.0 million |
3.00 | % | 2.00 | % | 1.75 | % | 0.75 | % | ||||||||
| From $120.0 million to $240.0 million |
2.75 | % | 1.75 | % | 1.50 | % | 0.50 | % | ||||||||
| In excess of $240.0 million |
2.50 | % | 1.50 | % | 1.25 | % | 0.25 | % | ||||||||
The rate in effect under the Amended Revolving Credit Facility on unused commitments is 0.25% and is not dependent upon excess availability. The FILO commitment reduces by $10.0 million on each of the first and second year anniversaries, and requires a reduction in borrowings to the lower commitment level. The FILO loans may be prepaid at any time without penalty and any amounts prepaid cannot be reborrowed.
7. Senior Notes
On November 24, 2010, the Company issued unsecured senior notes maturing on December 1, 2018 at a 2% original issue discount (“OID”) in a private offering (the “Senior Notes”). OID and debt issuance costs related to the Senior Notes are being amortized over the contractual term to interest expense using the effective interest rate in effect at issuance. There are no associated registration rights with the Senior Notes.
The Senior Notes bear interest at the rate of 9.25% per annum, payable semi-annually in arrears on June 1 and December 1. At January 31, 2015, the outstanding principal balance of the Senior Notes was $500.0 million and the carrying amount was $494.3 million, net of the unamortized discount. As of January 31, 2015 and February 1, 2014, the estimated fair value of the Senior Notes was approximately $519.2 million and $531.0 million, respectively, based on current industry market yields, credit spreads and the redemption option, which are considered Level 2 fair value hierarchy inputs (Note 1).
The Company may redeem the Senior Notes at its option, in whole or in part, based on the following agreed-upon schedule of redemption prices if redeemed during the 12-month period beginning on December 1 of each of the years indicated below:
| Year |
Percentage | |||
| 2014 |
104.625 | % | ||
| 2015 |
102.313 | % | ||
| 2016 and thereafter |
100.000 | % | ||
The indenture governing the Senior Notes specifies a number of events of default (many of which are subject to applicable cure periods), including, among others, the failure to make payments when due, defaults under other agreements or instruments of indebtedness and non-compliance with covenants. Upon the occurrence of an event of default, the holders of the Senior Notes may declare all amounts outstanding to be immediately due and payable.
8. Senior PIK Toggle Notes
On October 10, 2012, the Company issued $550.0 million in principal amount of unsecured senior PIK toggle notes maturing on October 15, 2017 in a private offering at a 0.5% OID (the “PIK Toggle Notes”). OID and debt issuance costs related to the PIK Toggle Notes are being amortized over the contractual term to interest expense using the effective interest rate in effect at issuance. There are no registration rights associated with the PIK Toggle Notes.
F-23
Table of Contents
The PIK Toggle Notes bear interest at the rate of 8.50% per annum for cash interest and 9.25% for PIK interest, payable semi-annually in arrears on April 15 and October 15. For each interest payment (other than for the final interest period ending at stated maturity, which is to be paid in cash), the Company is required to pay interest on the PIK Toggle Notes entirely in cash, unless certain conditions are satisfied, in which case the Company is entitled to pay, to a certain extent, interest for such period by either increasing the principal amount of the notes or by issuing new notes for the amount of the interest payment.
At January 31, 2015, the outstanding principal balance of the PIK Toggle Notes was $550.0 million and the carrying amount was $548.4 million, net of the unamortized discount. As of January 31, 2015 and February 1, 2014, the estimated fair value of the PIK Toggle Notes was approximately $566.5 million and $554.0 million, respectively, based on current industry market yields, credit spreads and the redemption option, which are considered Level 2 fair value hierarchy inputs (Note 1).
The Company may redeem the PIK Toggle Notes at its option, in whole or in part, based on the following agreed-upon schedule of redemption prices if redeemed during the 12-month period beginning on October 15 of each of the years indicated below:
| Year |
Percentage | |||
| 2014 |
103.000 | % | ||
| 2015 |
101.500 | % | ||
| 2016 and thereafter |
100.000 | % | ||
The indenture governing the PIK Toggle Notes specifies a number of events of default (many of which are subject to applicable cure periods), including, among others, the failure to make payments when due, defaults under other agreements or instruments of indebtedness and non-compliance with covenants. Upon the occurrence of an event of default, the holders of the PIK Toggle Notes may declare all amounts outstanding to be immediately due and payable.
9. Derivative Instruments
In August 2011, the Company entered into six interest rate swap agreements in connection with $600.0 million of its amended term loan facility to fix the variable portion of its LIBOR loan and limit its exposure to interest rate variability. The interest rate swaps were forward-starting with effective dates of September 28, 2012 and September 30, 2013 and are based on three-month LIBOR contracts subject to a 1.25% floor.
Terms of the Company’s interest rate swaps and their fair values are as follows (dollar amounts in thousands):
| Derivative liability fair value | ||||||||||||||||||||||
| Notional amount |
Strike rate |
Effective date | Expiration date |
January 31, 2015 |
February 1, 2014 |
|||||||||||||||||
| $ | 100,000 | 2.06 | % | September 28, 2012 | September 30, 2016 | $ | 1,325 | $ | 1,770 | |||||||||||||
| 100,000 | 2.07 | % | September 28, 2012 | September 30, 2016 | 1,345 | 1,783 | ||||||||||||||||
| 100,000 | 2.15 | % | September 28, 2012 | September 30, 2016 | 1,475 | 2,013 | ||||||||||||||||
| 100,000 | 2.31 | % | September 30, 2013 | September 30, 2016 | 1,765 | 2,462 | ||||||||||||||||
| 100,000 | 2.31 | % | September 30, 2013 | September 30, 2016 | 1,763 | 2,437 | ||||||||||||||||
| 100,000 | 2.40 | % | September 30, 2013 | September 30, 2016 | 1,912 | 2,697 | ||||||||||||||||
|
|
|
|
|
|
|
|||||||||||||||||
| Total |
$ | 600,000 | $ | 9,585 | $ | 13,162 | ||||||||||||||||
|
|
|
|
|
|
|
|||||||||||||||||
F-24
Table of Contents
Interest rate swaps are reflected in the consolidated balance sheets as follows (in thousands):
| Balance sheet location |
January 31, 2015 |
February 1, 2014 |
||||||||
| Current portion of interest rate swaps |
Accrued expenses and other liabilities | $ | 5,862 | $ | 5,880 | |||||
| Non-current portion of interest rate swaps |
Deferred rents and other liabilities |
3,723 | 7,282 | |||||||
|
|
|
|
|
|||||||
| Total interest rate swaps |
$ | 9,585 | $ | 13,162 | ||||||
|
|
|
|
|
|||||||
Although the Company is exposed to credit loss on its interest rate swaps in the event of nonperformance by its counterparties, credit risk is considered limited due to the credit ratings of the counterparties and the use of a master netting agreement, which permits the netting of derivative payables and receivables. The Company has not historically incurred, and does not expect to incur in the future, any losses as a result of counterparty default. Further, the notional amount of the Company’s outstanding derivatives is not an indicator of the magnitude of potential exposure.
The interest rate swap agreements contain provisions that would be triggered in the event the Company defaults on its debt agreements (Note 6), which in turn could cause termination of the underlying swap agreements. As of January 31, 2015, no events of default have occurred. There is no collateral posting requirement outside of the provisions in the debt agreements.
In connection with the February 5, 2013 amendment to the term loan facility (Note 6), the Company elected to discontinue hedge accounting for the outstanding interest rate swaps. As such, unrealized losses in AOCI will be reclassified into income as a component of interest expense during the periods in which the hedged forecasted transaction affects income, which is as interest on the Amended Term Loan Facility is incurred. All prospective changes in fair value are recorded as a component of interest expense in the consolidated statements of income and comprehensive income in the period of change.
Unrealized losses included in AOCI and amounts reclassified from AOCI into income were as follows (in thousands):
| Fiscal years | ||||||||||||
| 2014 (52 weeks) |
2013 (52 weeks) |
2012 (53 weeks) |
||||||||||
| Amount of loss recognized in AOCI, net of tax |
$ | — | $ | — | $ | (2,603 | ) | |||||
| Amount reclassified from AOCI into the consolidated statements of income and comprehensive income |
$ | 5,455 | $ | 3,686 | $ | 903 | ||||||
As of January 31, 2015, the Company estimates $4.4 million of pre-tax losses related to its interest rate swaps that are currently deferred in AOCI will be reclassified to the consolidated statements of income and comprehensive income within the next 12 months.
F-25
Table of Contents
10. Fair Value Measurements
Assets and Liabilities Measured on a Recurring Basis
The following tables present information about assets and liabilities that are measured at fair value on a recurring basis and indicate the fair value hierarchy of the valuation techniques utilized to determine such fair value (in thousands):
| January 31, 2015 | February 1, 2014 | |||||||||||||||||||||||
| Level 1 | Level 2 | Level 3 | Level 1 | Level 2 | Level 3 | |||||||||||||||||||
| Assets (liabilities): |
||||||||||||||||||||||||
| Money market mutual funds |
$ | 43,104 | $ | — | $ | — | $ | 9,812 | $ | — | $ | — | ||||||||||||
| Interest rate swaps |
$ | — | $ | (9,585 | ) | $ | — | $ | — | $ | (13,162 | ) | $ | — | ||||||||||
| Available-for-sale securities |
$ | 19,776 | $ | — | $ | — | $ | 19,897 | $ | — | $ | — | ||||||||||||
| Non-qualified deferred compensation plan |
$ | (18,323 | ) | $ | — | $ | — | $ | (16,068 | ) | $ | — | $ | — | ||||||||||
The fair value of money market funds is based on quoted market prices, such as quoted net asset values published by the fund as supported in an active market. As of January 31, 2015 and February 1, 2014, $36.0 million and $3.3 million, respectively, in money market mutual funds was included in cash and cash equivalents in the Company’s consolidated balance sheets. Also included in the money market mutual funds balances is $7.1 million and $6.5 million at January 31, 2015 and February 1, 2014, respectively, which relates to the Company’s restricted cash, and is included in other current assets in the consolidated balance sheets.
The fair values of the Company’s interest rate swaps are determined using a discounted cash flow analysis on the expected cash flows of each interest rate swap (Note 9). This analysis reflects the contractual terms, including the period to maturity, and uses observable market-based inputs, including interest rate curves. The fair values of interest rate swaps are determined by netting the discounted future fixed cash receipts payments and the discounted expected variable cash receipts. The variable cash receipts are based on an expectation of future interest rates (forward curves) derived from observable market interest rate yield curves. The Company qualitatively assesses both its own nonperformance risk and the respective counterparties’ nonperformance risk in the fair value measurements. The valuations also consider credit risk adjustments that are necessary to reflect the probability of default by the counterparty or the Company, which are considered Level 3 inputs; however, as of January 31, 2015 and February 1, 2014, the credit risk adjustments, including nonperformance risk, were considered insignificant to the total fair value of the interest rate swaps.
The fair value of the Company’s available-for-sale equity securities, which consists of the Company’s ownership interest in a publicly traded company, is determined using quoted prices in active markets for identical assets. The available-for-sale securities are included in other long-term assets in the Company’s consolidated balance sheets. The cost basis for this investment was $6.4 million and $5.0 million as of January 31, 2015 and February 1, 2014, respectively, and the total unrealized gain included in AOCI was $13.3 million ($8.1 million, net of tax) and $14.9 million ($9.0 million, net of tax) at January 31, 2015 and February 1, 2014, respectively.
The Company maintains a fully funded deferred compensation plan for key executives and other members of management. The fair value of this obligation is based on the closing market prices of the participants’ elected investments.
Assets Measured on a Non-Recurring Basis
The Company’s non-financial assets, which primarily consist of goodwill, other intangible assets, fixed assets and equity and cost method investments, are reported at carrying value and are not
F-26
Table of Contents
required to be measured at fair value on a recurring basis. However, on a periodic basis (at least annually for indefinite-lived intangibles or whenever events or changes in circumstances indicate that the carrying value of an asset may not be recoverable), non-financial assets are assessed for impairment. If impaired, the carrying values of the assets are written down to fair value using Level 3 inputs.
In fiscal 2014, the Company fully impaired the goodwill associated with its pet hotels reporting unit and recorded an impairment charge of $7.8 million (Note 4). There were no triggering events identified and no indication of impairment of the Company’s indefinite-lived trade name, other intangible assets or equity and cost method investments in fiscal 2014. There were no triggering events identified and no indication of impairment of the Company’s goodwill, indefinite-lived trade name, other intangible assets or equity and cost method investments in fiscal 2013 or 2012. Fixed assets with carrying values of $8.2 million, $2.2 million and $0.2 million in fiscal years 2014, 2013 and 2012, respectively, were triggered and deemed to be fully impaired, which includes fixed asset impairments of $2.6 million in fiscal 2014 related to the pet hotels reporting unit. Impairment charges related to non-store assets are included in selling, general and administrative expense, whereas charges related to underperforming locations are included in cost of sales and occupancy costs in the accompanying consolidated statements of income and comprehensive income.
11. Stockholders’ Equity
Common Stock
The Company is authorized to issue 895.0 million shares of common stock with a par value of $0.001 per share. Holders of common stock have the right to vote. The indenture governing the PIK Toggle Notes limits the Company’s ability to pay dividends or make other distributions with respect to its common stock.
The Company, at its discretion, can repurchase shares of common stock, subject to certain limitations under the stockholders agreement and the indenture governing the PIK Toggle Notes. During fiscal 2014, 2013 and 2012, the Company repurchased 1.5 million, 0.8 million and 3.2 million shares of its common stock from former employees, respectively.
Earnings per Share
The reconciliations of the weighted average shares outstanding used in earnings per share calculations are as follows (in thousands):
| Fiscal years ended | ||||||||||||
| January 31, 2015 |
February 1, 2014 |
February 2, 2013 |
||||||||||
| Basic |
805,900 | 803,522 | 794,033 | |||||||||
| Dilutive stock-based compensation awards |
22,248 | 20,515 | 28,661 | |||||||||
|
|
|
|
|
|
|
|||||||
| Dilutive |
828,148 | 824,037 | 822,694 | |||||||||
|
|
|
|
|
|
|
|||||||
| Antidilutive shares |
15,440 | 16,305 | 1,080 | |||||||||
Return of Capital and Dividend Payments
During fiscal 2012, the Company made a cash payment of $0.7355 per outstanding common stock share on November 2, 2012 to its stockholders of record as of October 29, 2012, totaling $589.4 million, of which $402.8 million was a return of capital and $186.6 million was a dividend payment.
F-27
Table of Contents
12. Employee Benefit Plans
The Company has employee savings plans that permit eligible participants to make contributions by salary reduction pursuant to either section 401(k) of the Internal Revenue Code or under the Company’s non-qualified deferred compensation plan. At its discretion, the Company matches 50.0% of the first 6.0% of compensation that is contributed by each participating employee to one 401(k) plan and the non-qualified deferred compensation plan. The Company has a second 401(k) plan for which it matches, at its discretion, 100.0% of the first 3% plus 50% of the next 2% of compensation that is contributed by each participating employee to the plan. In connection with the required matches, the Company’s contributions to the plans were $4.2 million for fiscal year 2014, $3.6 million for fiscal year 2013 and $3.2 million for fiscal year 2012.
13. Stock-Based Compensation
Incentive Compensation Plans
In fiscal 2006, the Company’s board of directors authorized the 2006 Key Management Incentive Award Plan and the 2006 Senior Executive Incentive Award Plan (collectively, the “2006 Incentive Plans”). The 2006 Incentive Plans provide for the granting of stock-based compensation awards, including stock options, stock appreciation rights, restricted stock, restricted stock units, deferred stock, dividend equivalents, and other stock-related benefits to eligible employees, consultants and directors.
On March 20, 2013, the Company’s board of directors and stockholders approved an increase to the aggregate share limit under the 2006 Incentive Plans of 40.0 million shares of common stock, bringing the total share limit under the plans to 136.0 million, of which 98.4 million are reserved for the granting of stock options and 37.6 million are reserved for the granting of other equity instruments. Also on March 20, 2013, the board of directors’ previously established operational limit on the number of shares of common stock issued or issuable at any given time pursuant to stock options granted under the 2006 Incentive Plans was increased by 9.4 million shares from 89.0 million to 98.4 million, thereby reducing the operational limit for granting other equity awards by the same amount.
On March 19, 2014, the board of directors’ previously established operational limit on the number of shares of common stock issued or issuable at any given time pursuant to stock options granted under the 2006 Incentive Plans was increased by 6.0 million shares from 98.4 million to 104.4 million, thereby reducing the operational limit for granting other equity awards to 31.6 million. As of January 31, 2015, 9.9 million shares of common stock remained available for future stock option grants, and 30.3 million shares remained available for future grants of other equity instruments, pursuant to the operational limits established by the board of directors.
Stock Options
Stock options granted under the 2006 Incentive Plans generally vest in five equal annual installments beginning one year from the date of grant, expire 10 years from the date of grant and have an exercise price that is a fixed amount not less than the fair market value of the underlying common stock on the date of grant.
The weighted average fair value per share of the stock options granted during fiscal years 2014, 2013 and 2012 was estimated to be $0.53, $0.68 and $0.46, respectively. The per share fair value of common stock is determined by the Company’s board of directors based in part on enterprise valuations performed by management with the assistance of a third-party valuation firm, taking into consideration any recent market transactions involving the Company’s common stock. The weighted
F-28
Table of Contents
average fair value per option was calculated at the date of grant using the Black-Scholes option pricing model with the following weighted average assumptions:
| Fiscal years | ||||||||||||
| 2014 | 2013 | 2012 | ||||||||||
| Dividend yield |
0.0 | % | 0.0 | % | 0.0 | % | ||||||
| Expected volatility(1) |
27.8 | % | 32.9 | % | 33.7 | % | ||||||
| Risk-free interest rate(2) |
1.7 | % | 1.1 | % | 1.1 | % | ||||||
| Expected term(3) |
5.5 years | 6.0 years | 6.0 years | |||||||||
| (1) | The expected volatility is estimated based on the historical volatility of a select peer group of similar publicly traded companies for a term that is consistent with the expected term of the stock options. |
| (2) | The risk-free interest rates are based on the U.S. Treasury constant maturity interest rate whose term is consistent with the expected term of the stock options. |
| (3) | The expected term of stock options is estimated based on projected exercise patterns for outstanding stock options. |
The total intrinsic value of stock options exercised during fiscal years 2014, 2013 and 2012 was $3.1 million, $5.7 million and $17.3 million, respectively. The Company uses authorized and unissued shares to satisfy stock option exercises.
Stock option activity under the 2006 Incentive Plans was as follows (shares and intrinsic value in thousands):
| Shares | Weighted average exercise price |
Weighted average remaining contractual term (years) |
Aggregate intrinsic value |
|||||||||||||
| Stock options outstanding, January 28, 2012 |
67,975 | 0.82 | 6.85 | 7,694 | ||||||||||||
| Granted |
2,075 | 1.45 | — | — | ||||||||||||
| Exercised |
(16,702 | ) | 0.63 | — | — | |||||||||||
| Forfeited |
(1,837 | ) | 0.51 | — | — | |||||||||||
| Expired |
(336 | ) | 0.99 | — | — | |||||||||||
|
|
|
|||||||||||||||
| Stock options outstanding, February 2, 2013 |
51,175 | 0.64 | 6.32 | 69,446 | ||||||||||||
| Granted |
9,677 | 2.00 | — | — | ||||||||||||
| Exercised |
(3,566 | ) | 0.41 | — | — | |||||||||||
| Forfeited |
(4,939 | ) | 0.89 | — | — | |||||||||||
| Expired |
(2,415 | ) | 1.09 | — | — | |||||||||||
|
|
|
|||||||||||||||
| Stock options outstanding, February 1, 2014 |
49,932 | 0.88 | 5.89 | 55,785 | ||||||||||||
| Granted |
12,940 | 2.00 | — | — | ||||||||||||
| Exercised |
(2,614 | ) | 0.54 | — | — | |||||||||||
| Forfeited |
(6,855 | ) | 1.68 | — | — | |||||||||||
| Expired |
(1,661 | ) | 1.20 | — | — | |||||||||||
|
|
|
|||||||||||||||
| Stock options outstanding, January 31, 2015 |
51,742 | $ | 1.07 | 5.55 | $ | 36,360 | ||||||||||
|
|
|
|||||||||||||||
| Stock options exercisable, January 31, 2015 |
30,305 | $ | 0.83 | 3.82 | $ | 26,015 | ||||||||||
|
|
|
|||||||||||||||
| Stock options vested and expected to vest |
49,398 | $ | 1.07 | 5.41 | $ | 34,713 | ||||||||||
|
|
|
|||||||||||||||
F-29
Table of Contents
Fiscal 2012 Stock Option Modifications
On October 29, 2012 (the modification date), the Company effected an option modification for all outstanding stock options in order to provide stock option holders with the substantial equivalent of the economic benefit of an exercise price reduction for each vested option award to reflect the effect of the dividend payment (Note 11) in accordance with the anti-dilution provision in the 2006 Incentive Plans. For all stock options that were vested on the modification date, a cash payment of $0.7355 per underlying share in lieu of modification was paid on November 2, 2012. The distribution totaled $19.3 million and resulted in $2.7 million of additional stock compensation expense recognized in the consolidated statements of income and comprehensive income for the fiscal year ended February 2, 2013, which represents the value provided to stock option holders in excess of this required equitable adjustment under the terms of the 2006 Incentive Plans. The difference of $16.6 million was the equitable adjustment and was recorded as a reduction to additional paid-in capital.
For all stock options that were unvested on the modification date, an equitable adjustment was made to reduce the exercise price of the stock options to reflect the effect of the dividend payment on the Company’s equity interests, subject to a $0.20 exercise price floor, with the remaining equitable adjustment of $7.7 million to be paid on the vesting dates for the related stock options. As of January 31, 2015, $0.7 million and $0.5 million of this equitable adjustment remains in accrued salaries and employee benefits and accrued payroll and other long-term liabilities, respectively, in the accompanying consolidated balance sheet. No other terms of the stock options were modified, and no additional stock compensation expense was recognized as a result of the adjustment.
Restricted Stock Units
Restricted stock unit awards (“RSUs”) are issued and measured at fair value on the date of grant and become vested over various terms of one to three years beginning one year from the date of grant. During fiscal 2014, the Company issued 0.03 million restricted stock units with a weighted average grant date fair value of $1.87, and 0.5 million restricted stock units vested and released. During fiscal 2013, the Company issued 0.05 million RSUs with a weighted average grant date fair value of $2.00, and 0.1 million restricted stock units vested and released. The Company did not issue any RSUs during fiscal 2012. 0.3 million restricted stock units vested and released during fiscal 2012. As of January 31, 2015, the Company had 0.03 million RSUs outstanding, of which 0.02 million were vested.
Fiscal 2012 Restricted Stock Unit Modification
On October 29, 2012 (the modification date), the Company effected an RSU modification for all outstanding vested and unvested RSUs in order to provide the holders with the substantial equivalent of the economic benefit of an adjustment in the number of shares underlying the outstanding award, to reflect the effect of the dividend payment in accordance with the anti-dilution provision in the 2006 Incentive Plans. For all RSUs that were outstanding on the modification date, a cash payment of $0.7355 per underlying share in lieu of modification was declared and payable on October 29, 2012, with such payment subject to the restrictions, vesting period and delivery as in effect for the original award. The modification resulted in $0.1 million of additional compensation expense recognized in the consolidated statements of income and comprehensive income for the fiscal year ended February 2, 2013, which represents the value provided to the RSU holders in excess of the required equitable adjustment under the terms of the 2006 Incentive Plans.
F-30
Table of Contents
Stock-Based Compensation Expense
Stock-based compensation expense and the related income tax benefit consisted of the following (in thousands):
| Fiscal years |
Stock-based compensation expense(a) |
Income tax benefit from stock-based compensation expense |
||||||
| 2014 (52 weeks) |
$ | 3,095 | $ | 1,180 | ||||
| 2013 (52 weeks) |
$ | 3,083 | $ | 1,156 | ||||
| 2012 (53 weeks) |
$ | 4,940 | $ | 1,868 | ||||
| (a) | Includes cash-based stock compensation paid in connection with the stock option modifications in the amounts of $0.1 million, $0.2 million and $2.7 million in fiscal 2014, 2013 and 2012, respectively. |
As of January 31, 2015, unrecognized compensation expense related to the unvested portion of the Company’s stock options was $8.1 million, which is expected to be recognized over a weighted average period of 2.5 years. Unrecognized compensation expense related to the Company’s unvested RSUs was $0.01 million, and is expected to be recognized over a weighted average period of 0.1 years.
14. Income Taxes
Income taxes consisted of the following (in thousands):
| Fiscal years | ||||||||||||
| 2014 (52 weeks) |
2013 (52 weeks) |
2012 (53 weeks) |
||||||||||
| Current: |
||||||||||||
| Federal |
$ | 38,988 | $ | 47,000 | $ | 70,001 | ||||||
| State |
9,461 | 8,628 | 10,486 | |||||||||
|
|
|
|
|
|
|
|||||||
| $ | 48,449 | $ | 55,628 | $ | 80,487 | |||||||
|
|
|
|
|
|
|
|||||||
| Deferred: |
||||||||||||
| Federal |
$ | (1,542 | ) | $ | (3,964 | ) | $ | (18,945 | ) | |||
| State |
(509 | ) | (828 | ) | (1,472 | ) | ||||||
|
|
|
|
|
|
|
|||||||
| (2,051 | ) | (4,792 | ) | (20,417 | ) | |||||||
|
|
|
|
|
|
|
|||||||
| Income taxes |
$ | 46,398 | $ | 50,836 | $ | 60,070 | ||||||
|
|
|
|
|
|
|
|||||||
A reconciliation of income taxes at the federal statutory rate of 35% with the provision for income taxes is as follows (in thousands):
| Fiscal years | ||||||||||||||||||||||||
| 2014 (52 weeks) |
2013 (52 weeks) |
2012 (53 weeks) |
||||||||||||||||||||||
| Income taxes at federal statutory rate |
$ | 42,572 | 35.0 | % | $ | 47,638 | 35.0 | % | $ | 55,612 | 35.0 | % | ||||||||||||
| Non-deductible expenses |
506 | 0.4 | 35 | 0.1 | 12 | 0.0 | ||||||||||||||||||
| State taxes, net of federal tax benefit |
5,848 | 4.8 | 5,096 | 3.8 | 5,933 | 3.7 | ||||||||||||||||||
| Changes in tax reserves |
(573 | ) | (0.5 | ) | (669 | ) | (0.5 | ) | (602 | ) | (0.4 | ) | ||||||||||||
| Tax credits |
(1,264 | ) | (1.0 | ) | (663 | ) | (0.5 | ) | (655 | ) | (0.4 | ) | ||||||||||||
| Other |
(691 | ) | (0.6 | ) | (601 | ) | (0.4 | ) | (230 | ) | (0.1 | ) | ||||||||||||
|
|
|
|
|
|
|
|
|
|
|
|
|
|||||||||||||
| $ | 46,398 | 38.1 | % | $ | 50,836 | 37.5 | % | $ | 60,070 | 37.8 | % | |||||||||||||
|
|
|
|
|
|
|
|
|
|
|
|
|
|||||||||||||
F-31
Table of Contents
Deferred income taxes reflect the tax effect of temporary differences between the carrying amount of assets and liabilities for financial reporting purposes and the amounts used for income tax purposes. Significant components of the Company’s deferred tax assets and liabilities were as follows (in thousands):
| January 31, 2015 |
February 1, 2014 |
|||||||
| Deferred tax assets: |
||||||||
| Inventory |
$ | 13,580 | $ | 14,362 | ||||
| Deferred rent |
22,327 | 22,011 | ||||||
| Accrued employee benefits |
51,409 | 54,399 | ||||||
| Store closing costs |
2,818 | 2,905 | ||||||
| Lease-related items |
409 | 985 | ||||||
| Deferred revenue |
392 | 188 | ||||||
| State taxes |
327 | 1,425 | ||||||
| Bad debts |
386 | 343 | ||||||
| Other |
8,143 | 9,130 | ||||||
|
|
|
|
|
|||||
| Total deferred tax assets |
99,791 | 105,748 | ||||||
| Valuation allowance |
(120 | ) | (120 | ) | ||||
|
|
|
|
|
|||||
| Net deferred tax assets |
99,671 | 105,628 | ||||||
|
|
|
|
|
|||||
| Deferred tax liabilities: |
||||||||
| Depreciation |
(39,225 | ) | (40,213 | ) | ||||
| Intangible assets |
(108,518 | ) | (111,555 | ) | ||||
| Debt restructuring |
(6,394 | ) | (7,147 | ) | ||||
| Accrued expenses |
883 | (2,241 | ) | |||||
| Lease-related items |
(4,349 | ) | (5,081 | ) | ||||
| Other comprehensive income |
(2,764 | ) | (1,466 | ) | ||||
| Other |
(2,584 | ) | (2,303 | ) | ||||
|
|
|
|
|
|||||
| Total deferred tax liabilities |
(162,951 | ) | (170,006 | ) | ||||
|
|
|
|
|
|||||
| $ | (63,280 | ) | $ | (64,378 | ) | |||
|
|
|
|
|
|||||
Deferred taxes are reflected in the Company’s consolidated balance sheets as follows (in thousands):
| January 31, 2015 |
February 1, 2014 |
|||||||
| Current—deferred tax assets |
$ | 49,836 | $ | 48,433 | ||||
| Non-current—deferred tax liability |
(113,116 | ) | (112,811 | ) | ||||
|
|
|
|
|
|||||
| $ | (63,280 | ) | $ | (64,378 | ) | |||
|
|
|
|
|
|||||
In assessing the realizability of deferred tax assets, management considers whether it is more likely than not that some portion or all of the deferred tax assets will not be realized. With regard to the deferred tax asset related to capital losses recognized for financial statement purposes, management believes there is insufficient evidence to conclude that realization of the benefit is more likely than not, and therefore the Company has provided a valuation allowance of $0.1 million against this asset in the current year.
With regard to all other deferred tax assets, management believes that it is more likely than not that the Company will realize the benefits of these deductible differences. This is based upon the level of historical taxable income and projections for future taxable income over the periods in which the deferred tax assets are deductible. Management considers the scheduled reversal of deferred tax liabilities, projected future taxable income, and tax planning strategies in making this assessment.
F-32
Table of Contents
Changes in unrecognized tax benefits, excluding interest and penalties, were as follows (in thousands):
| January 31, 2015 |
February 1, 2014 |
February 2, 2013 |
||||||||||
| Beginning balance |
$ | 1,183 | $ | 2,197 | $ | 4,795 | ||||||
| Increases related to prior year tax positions |
— | — | 17 | |||||||||
| Decreases related to prior year tax positions |
— | (357 | ) | (1,967 | ) | |||||||
| Increases related to current year tax positions |
— | 10 | — | |||||||||
| Decreases related to settlements with taxing authorities |
— | — | (21 | ) | ||||||||
| Decreases related to lapse of statute of limitation |
(847 | ) | (667 | ) | (627 | ) | ||||||
|
|
|
|
|
|
|
|||||||
| Ending balance |
$ | 336 | $ | 1,183 | $ | 2,197 | ||||||
|
|
|
|
|
|
|
|||||||
Included in the balance of total unrecognized tax benefits at January 31, 2015, is $0.2 million of tax benefits that if recognized, would affect the Company’s effective tax rate. The Company recognized approximately $0.1 million, $0.3 million and $0.2 million in interest and penalties for fiscal 2014, 2013 and 2012, respectively. Accrued interest and penalties related to uncertain tax positions were $0.2 million and $0.5 million at January 31, 2015 and February 1, 2014, respectively. The Company recognizes interest and penalties related to unrecognized tax benefits as a component of income tax expense.
The Company is no longer subject to examination for U.S. federal income tax for periods prior to January 30, 2011. The Company is no longer subject to examination by state tax authorities for fiscal years prior to 2008. The Company is currently under audit by various state jurisdictions for various years. Though the estimated completion dates of these audits are not known, it is possible that these audits will be completed within the next 12 months. In addition, the Company does not foresee other material changes to the federal or state uncertain tax positions affecting income tax expense within the next 12 months. The Company has no material foreign operations.
15. Accumulated Other Comprehensive Income
Changes in the balances of each component included in AOCI are presented below (net of tax, in thousands):
| Derivatives | Available-for-sale securities |
Foreign currency translation adjustment |
Total | |||||||||||||
| Balance at January 28, 2012 |
(6,547 | ) | — | — | (6,547 | ) | ||||||||||
| Other comprehensive (loss)/income before reclassifications |
(3,149 | ) | — | — | (3,149 | ) | ||||||||||
| Amounts reclassified from AOCI |
546 | — | — | 546 | ||||||||||||
|
|
|
|
|
|
|
|
|
|||||||||
| Balance at February 2, 2013 |
(9,150 | ) | — | — | (9,150 | ) | ||||||||||
| Other comprehensive (loss)/income before reclassifications |
— | 9,013 | — | 9,013 | ||||||||||||
| Amounts reclassified from AOCI |
2,231 | — | — | 2,231 | ||||||||||||
|
|
|
|
|
|
|
|
|
|||||||||
| Balance at February 1, 2014 |
(6,919 | ) | 9,013 | — | 2,094 | |||||||||||
| Other comprehensive (loss)/income before reclassifications |
— | (941 | ) | (352 | ) | (1,293 | ) | |||||||||
| Amounts reclassified from AOCI |
3,309 | — | — | 3,309 | ||||||||||||
|
|
|
|
|
|
|
|
|
|||||||||
| Balance at January 31, 2015 |
(3,610 | ) | 8,072 | (352 | ) | 4,110 | ||||||||||
|
|
|
|
|
|
|
|
|
|||||||||
F-33
Table of Contents
16. Commitments and Contingencies
Leases
The Company leases store facilities, distribution centers and equipment under operating and capital leases. These leases generally have terms from three to 15 years. The Company’s rent expense, excluding sublease income, under operating leases is recognized on a straight-line basis over the term of each lease and totaled $354.3 million, $335.0 million and $322.2 million for fiscal years 2014, 2013 and 2012, respectively.
The Company finances certain fixed assets and store facilities under capital leases. The Company had approximately $22.7 million and $21.7 million in fixed assets financed through capital leases at January 31, 2015 and February 1, 2014, respectively, and related accumulated amortization of $10.7 million and $9.1 million, respectively.
The future minimum lease payments schedule includes open locations, closed stores, locations to be opened in the future and distribution centers. The future minimum annual payments have not been reduced by amounts expected to be received from subtenants, which are not material.
At January 31, 2015, future minimum lease payments under non-cancelable operating and capital leases are as follows (in thousands):
| Fiscal years |
Capital leases | Operating leases | ||||||
| 2015 |
$ | 2,176 | $ | 374,615 | ||||
| 2016 |
1,829 | 356,372 | ||||||
| 2017 |
1,476 | 314,678 | ||||||
| 2018 |
1,549 | 275,043 | ||||||
| 2019 |
1,626 | 227,857 | ||||||
| Thereafter |
9,434 | 697,639 | ||||||
|
|
|
|
|
|||||
| Total minimum payments |
$ | 18,090 | $ | 2,246,204 | ||||
|
|
|
|||||||
| Less amount representing interest |
(4,749 | ) | ||||||
|
|
|
|||||||
| Present value of capital lease payments |
13,341 | |||||||
| Less current portion of capital leases |
(1,425 | ) | ||||||
|
|
|
|||||||
| Capital lease obligations, excluding current portion |
$ | 11,916 | ||||||
|
|
|
|||||||
Baseball Stadium Naming Rights Commitment
On March 10, 2003, the Company entered into an agreement with San Diego Ballpark Funding LLC and Padres L.P. to name the San Diego Padres’ new stadium Petco Park. The naming rights include signage, advertising and other promotional benefits. The agreement term is 22 years. Pursuant to the agreement, the Company pays an annual contract fee. Fees for fiscal 2014 and 2013 were $3.5 million and for fiscal 2012 were $3.4 million, and are included in selling, general and administrative expenses in the consolidated statements of income and comprehensive income. Fees will be adjusted by the maximum annual change related to the San Diego consumer price index per year through 2026.
Litigation
The Company is involved in the legal proceedings described below and is subject to other claims and litigation arising in the ordinary course of its business. The Company has made accruals with respect to certain of these matters, where appropriate, which are reflected in the Company’s condensed consolidated financial statements but are not, individually or in the aggregate, considered
F-34
Table of Contents
material. For other matters, the Company has not made accruals because management has not yet determined that a loss is probable or because the amount of loss cannot be reasonably estimated. While the ultimate outcome of the matters described below cannot be determined, the Company currently does not expect that these matters will have a material adverse effect on its condensed consolidated financial statements. The outcome of any litigation is inherently uncertain, however, and if decided adversely to the Company, or if the Company determines that settlement of particular litigation is appropriate, the Company may be subject to liability that could have a material adverse effect on its condensed consolidated financial statements.
In March 2013, a suit was filed against the Company in the United States District Court for the Southern District of California by a former employee. The plaintiff filed the suit individually and as a purported class action on behalf of other assistant managers alleging violation(s) of the federal Fair Labor Standards Act in classification of employees. The Company responded to the initial complaint by filing a Motion to Dismiss, which was partially granted. Subsequently, the plaintiff filed an amended complaint, to which the Company responded by filing a second Motion to Dismiss in October 2013, which was denied. Briefing on the plaintiff’s motion for conditional class certification will be complete in April 2015. Although there is a reasonable possibility that this matter could result in a material loss, management is unable to estimate the range of such loss. As a result, no amount of loss has been accrued. Management believes that strong defenses exist to this claim and intends to defend against this action vigorously.
In March 2014, a suit was filed against the Company in the Los Angeles Superior Court by a current employee. The plaintiff filed the suit individually and as a purported class action on behalf of other current and former employees alleging that the Company failed to pay hourly employees for all hours worked, failed to provide hourly employees with paid rest periods as required by California law, failed to properly reimburse employees for business expenses and failed to provide accurate wage statements. Subsequently, a first amended complaint was filed, adding Petco Animal Supplies, Inc. as a defendant, and adding an additional cause of action alleging violation of the itemized wage statement law. A second amended complaint has also been filed, adding two additional plaintiffs as well as new causes of action alleging violations of the overtime and meal period laws. The lawsuit seeks compensatory damages, statutory penalties and other relief, including interest, attorneys’ fees, costs and injunctive relief. On February 4, 2015, the parties agreed to a mediator’s proposal to settle this matter. The settlement is subject to Court approval. The Company has recorded an accrual in regards to this settlement, which is not material and is reflected in accrued expenses and other liabilities in the accompanying consolidated balance sheets.
In December 2014, a suit was filed against the Company in the United States District Court of the Southern District of New York, by several former employees. The plaintiffs filed the suit individually and on behalf of pet stylists, groomers and bathers. The suit alleges violations including failure to pay minimum wages, failure to pay statutory / contractual wages, failure to provide paid rest periods, failure to reimburse business expenses, failure to provide itemized wage statements and violation of federal and state laws in four states. A first amended complaint was filed on February 17, 2015; the Company filed its answer on March 17, 2015. Although there is a reasonable possibility that this matter could result in a material loss, due to the preliminary nature of this matter, management is unable to estimate the range of such loss. As a result, no amount of loss has been accrued.
17. Subsequent Events
On February 2, 2015, the Company acquired the assets of Drs. Foster & Smith, an online pet specialty retailer, for $158.8 million, and an earn-out payment of up to $25.0 million based on fiscal 2017 Drs. Foster & Smith performance. The preliminary purchase accounting for the acquisition
F-35
Table of Contents
included the recognition of intangibles of $33.4 million and goodwill of $107.6 million. The primary reason for this acquisition is to expand the Company’s online presence and range of offerings in order to better serve pet parents.
On March 20, 2015, the Company entered into a secured construction loan agreement for $42.7 million, to partially finance the construction of a new San Diego, California co-headquarters facility. Once construction on the facility is completed, which is to be no later than August 1, 2016, the construction loan will convert into a term loan and will mature 102 months following the conversion date. The note bears interest at 3.75% per year. During the construction loan period, interest incurred will be added to the principal balance on a monthly basis. During the term loan period, interest and principal will be paid monthly based on an amortization period of 162 months. On the term loan maturity date, all principal and unpaid interest will be payable in full. The Company may prepay the loan in part or in full during the loan period subject to certain conditions and fees.
F-36
Table of Contents
CONDENSED CONSOLIDATED BALANCE SHEETS
(Unaudited, in thousands, except par value)
| August 1, 2015 |
January 31, 2015 |
|||||||
| ASSETS |
||||||||
| Current assets: |
||||||||
| Cash and cash equivalents |
$ | 57,948 | $ | 191,265 | ||||
| Receivables, net |
31,703 | 27,874 | ||||||
| Merchandise inventories |
453,497 | 393,808 | ||||||
| Deferred tax assets |
50,625 | 49,836 | ||||||
| Prepaid expenses |
59,434 | 55,644 | ||||||
| Other current assets |
52,464 | 17,915 | ||||||
|
|
|
|
|
|||||
| Total current assets |
705,671 | 736,342 | ||||||
| Fixed assets |
1,485,872 | 1,411,760 | ||||||
| Less accumulated depreciation |
(864,162 | ) | (819,948 | ) | ||||
|
|
|
|
|
|||||
| Fixed assets, net |
621,710 | 591,812 | ||||||
| Goodwill |
1,114,838 | 1,007,285 | ||||||
| Other intangible assets |
333,591 | 301,176 | ||||||
| Less accumulated amortization |
(21,830 | ) | (18,906 | ) | ||||
|
|
|
|
|
|||||
| Other intangible assets, net |
311,761 | 282,270 | ||||||
| Other assets |
81,817 | 89,272 | ||||||
|
|
|
|
|
|||||
| Total assets |
$ | 2,835,797 | $ | 2,706,981 | ||||
|
|
|
|
|
|||||
| LIABILITIES AND STOCKHOLDERS’ DEFICIT |
||||||||
| Current liabilities: |
||||||||
| Accounts payable and book overdrafts |
$ | 213,001 | $ | 198,543 | ||||
| Accrued salaries and employee benefits |
110,828 | 88,658 | ||||||
| Accrued expenses and other liabilities |
174,762 | 175,140 | ||||||
| Current portion of long-term debt and capital lease obligations |
23,567 | 23,675 | ||||||
|
|
|
|
|
|||||
| Total current liabilities |
522,158 | 486,016 | ||||||
| Senior secured credit facilities, net, excluding current portion |
1,215,505 | 1,189,989 | ||||||
| Senior notes, net |
494,900 | 494,266 | ||||||
| Senior PIK toggle notes, net |
548,635 | 548,365 | ||||||
| Construction loan |
20,273 | — | ||||||
| Capital lease obligations, excluding current portion |
13,373 | 11,916 | ||||||
| Deferred tax liabilities |
103,360 | 113,116 | ||||||
| Deferred rents and other liabilities |
203,110 | 193,651 | ||||||
|
|
|
|
|
|||||
| Total liabilities |
3,121,314 | 3,037,319 | ||||||
|
|
|
|
|
|||||
| Commitments and contingencies (Notes 6, 7, 8, 9, 12 and 15) |
||||||||
| Stockholders’ deficit: |
||||||||
| Common stock, $0.001 par value, 895,000 shares authorized; 806,978 and 806,803 shares issued and outstanding at August 1, 2015 and January 31, 2015, respectively |
807 | 807 | ||||||
| Returned capital and dividends in excess of earnings |
(449,377 | ) | (451,559 | ) | ||||
| Retained earnings |
162,239 | 116,304 | ||||||
| Accumulated other comprehensive income |
814 | 4,110 | ||||||
|
|
|
|
|
|||||
| Total stockholders’ deficit |
(285,517 | ) | (330,338 | ) | ||||
|
|
|
|
|
|||||
| Total liabilities and stockholders’ deficit |
$ | 2,835,797 | $ | 2,706,981 | ||||
|
|
|
|
|
|||||
See accompanying notes to condensed consolidated financial statements.
F-37
Table of Contents
CONDENSED CONSOLIDATED STATEMENTS OF INCOME AND COMPREHENSIVE INCOME
(Unaudited, in thousands, except per share data)
| Thirteen weeks ended | Twenty-six weeks ended | |||||||||||||||
| August 1, 2015 | August 2, 2014 | August 1, 2015 | August 2, 2014 | |||||||||||||
| Net sales |
$ | 1,084,605 | $ | 971,062 | $ | 2,168,705 | $ | 1,941,408 | ||||||||
| Cost of sales and occupancy costs |
757,854 | 679,478 | 1,514,751 | 1,351,611 | ||||||||||||
|
|
|
|
|
|
|
|
|
|||||||||
| Gross profit |
326,751 | 291,584 | 653,954 | 589,797 | ||||||||||||
| Selling, general and administrative expenses |
248,751 | 228,487 | 498,539 | 455,558 | ||||||||||||
|
|
|
|
|
|
|
|
|
|||||||||
| Operating income |
78,000 | 63,097 | 155,415 | 134,239 | ||||||||||||
| Interest income |
(98 | ) | (85 | ) | (199 | ) | (134 | ) | ||||||||
| Interest expense |
38,941 | 39,761 | 78,345 | 79,955 | ||||||||||||
|
|
|
|
|
|
|
|
|
|||||||||
| Income before income taxes and (income) loss from equity method investees |
39,157 | 23,421 | 77,269 | 54,418 | ||||||||||||
| Income tax expense |
15,498 | 9,222 | 30,588 | 21,531 | ||||||||||||
| (Income) loss from equity method investees |
(72 | ) | (18 | ) | (327 | ) | 96 | |||||||||
|
|
|
|
|
|
|
|
|
|||||||||
| Net income |
23,731 | 14,217 | 47,008 | 32,791 | ||||||||||||
| Other comprehensive (loss) income, net of tax: |
||||||||||||||||
| Available-for-sale securities: |
||||||||||||||||
| Unrealized (loss) gain on available-for-sale securities |
(1,416 | ) | 3,562 | (4,196 | ) | 3,538 | ||||||||||
| Gains on available-for-sale securities reclassified to income |
— | — | (257 | ) | — | |||||||||||
| Foreign currency translation adjustment |
(159 | ) | — | (365 | ) | — | ||||||||||
| Losses on derivatives reclassified to income |
705 | 838 | 1,522 | 1,777 | ||||||||||||
|
|
|
|
|
|
|
|
|
|||||||||
| Total other comprehensive (loss) income, net of tax |
(870 | ) | 4,400 | (3,296 | ) | 5,315 | ||||||||||
|
|
|
|
|
|
|
|
|
|||||||||
| Comprehensive income |
$ | 22,861 | $ | 18,617 | $ | 43,712 | $ | 38,106 | ||||||||
|
|
|
|
|
|
|
|
|
|||||||||
| Basic earnings per share |
$ | 0.03 | $ | 0.02 | $ | 0.06 | $ | 0.04 | ||||||||
| Diluted earnings per share |
$ | 0.03 | $ | 0.02 | $ | 0.06 | $ | 0.04 | ||||||||
| Weighted-average shares outstanding: |
||||||||||||||||
| Basic |
806,799 | 805,668 | 806,887 | 805,538 | ||||||||||||
| Diluted |
830,306 | 830,355 | 830,393 | 830,869 | ||||||||||||
See accompanying notes to condensed consolidated financial statements.
F-38
Table of Contents
CONDENSED CONSOLIDATED STATEMENTS OF CASH FLOWS
(Unaudited, in thousands)
| Twenty-six weeks ended | ||||||||
| August 1, 2015 | August 2, 2014 | |||||||
| Cash flows from operating activities: |
||||||||
| Net income |
$ | 47,008 | $ | 32,791 | ||||
| Adjustments to reconcile net income to net cash provided by operating activities: |
||||||||
| Depreciation and amortization |
67,935 | 58,451 | ||||||
| Amortization of debt discounts and issuance costs |
5,179 | 4,808 | ||||||
| Provision for deferred taxes |
(8,695 | ) | (8,234 | ) | ||||
| Stock-based compensation |
1,465 | 1,444 | ||||||
| Impairments and write-offs of fixed and other assets |
1,768 | 2,665 | ||||||
| (Income) loss from equity method investees |
(327 | ) | 96 | |||||
| Change in contingent consideration obligation (Note 2) |
322 | — | ||||||
| Changes in assets and liabilities, net of effects of acquisition: |
||||||||
| Receivables |
(3,738 | ) | (2,654 | ) | ||||
| Merchandise inventories |
(41,579 | ) | (22,516 | ) | ||||
| Prepaid expenses and other assets |
(468 | ) | (30,646 | ) | ||||
| Accounts payable and book overdrafts |
13,458 | 14,648 | ||||||
| Accrued salaries and employee benefits |
928 | (5,841 | ) | |||||
| Accrued expenses and other liabilities |
6,894 | 8,206 | ||||||
| Deferred rents and other liabilities |
2,353 | 4,967 | ||||||
|
|
|
|
|
|||||
| Net cash provided by operating activities |
92,503 | 58,185 | ||||||
|
|
|
|
|
|||||
| Cash flows from investing activities: |
||||||||
| Cash paid for fixed assets |
(106,778 | ) | (101,810 | ) | ||||
| Cash paid for acquisition (Note 2) |
(158,800 | ) | — | |||||
| Insurance recoveries |
145 | 238 | ||||||
| Increase in restricted cash |
(1,332 | ) | (621 | ) | ||||
| Cash paid for investments |
(3,180 | ) | (6,930 | ) | ||||
| Proceeds from sale of investment |
518 | — | ||||||
|
|
|
|
|
|||||
| Net cash used in investing activities |
(269,427 | ) | (109,123 | ) | ||||
|
|
|
|
|
|||||
| Cash flows from financing activities: |
||||||||
| Borrowings under long-term debt agreements |
159,273 | — | ||||||
| Repayments of long-term debt |
(114,125 | ) | (6,125 | ) | ||||
| Debt issuance costs |
(272 | ) | (69 | ) | ||||
| Payments for capital lease obligations |
(697 | ) | (751 | ) | ||||
| Repurchase of common stock and stock options |
(1,073 | ) | (1,350 | ) | ||||
| Net proceeds from issuance of common stock |
391 | 701 | ||||||
| Excess tax benefit of stock options exercised |
260 | 264 | ||||||
| Excess tax benefit for fiscal 2012 anti-dilution stock option modifications for cash settlements on options vesting in fiscal 2015 and 2014 |
98 | 224 | ||||||
| Cash settlements for fiscal 2012 anti-dilution stock option modifications for options vesting in fiscal 2015 and 2014 |
(248 | ) | (566 | ) | ||||
|
|
|
|
|
|||||
| Net cash provided by (used in) financing activities |
43,607 | (7,672 | ) | |||||
|
|
|
|
|
|||||
| Net decrease in cash and cash equivalents |
(133,317 | ) | (58,610 | ) | ||||
| Cash and cash equivalents at beginning of period |
191,265 | 135,793 | ||||||
|
|
|
|
|
|||||
| Cash and cash equivalents at end of period |
$ | 57,948 | $ | 77,183 | ||||
|
|
|
|
|
|||||
| Supplemental cash flow disclosures: |
||||||||
| Interest paid |
$ | 74,118 | $ | 73,686 | ||||
| Capitalized interest |
$ | 1,855 | $ | 583 | ||||
| Income taxes paid |
$ | 40,575 | $ | 32,768 | ||||
| Supplemental non-cash investing and financing activities disclosure: |
||||||||
| Accounts payable and accrued expenses for capital expenditures |
$ | 16,331 | $ | 13,241 | ||||
| Assets acquired under capital leases |
$ | 2,045 | $ | 617 | ||||
See accompanying notes to condensed consolidated financial statements.
F-39
Table of Contents
Description of Business and Basis of Presentation
Petco Holdings, Inc. (together with its consolidated subsidiaries, “the Company”) is a national specialty retailer of premium pet consumables, supplies and companion animals, and services with 1,409 retail locations in 50 states, the District of Columbia and Puerto Rico as of August 1, 2015. In addition, the Company has ten pet hotel locations that were held for sale as of August 1, 2015 (Note 3). The Company also offers an expanded range of consumables and supplies through its www.petco.com and www.drsfostersmith.com websites.
The accompanying condensed consolidated financial statements have been prepared by the Company without audit and do not include all information and footnotes required by accounting principles generally accepted in the United States of America (“GAAP”) for a complete set of financial statements. These condensed consolidated financial statements and notes thereto should be read in conjunction with the Company’s consolidated financial statements and notes thereto for the fiscal year ended January 31, 2015. In the opinion of management of the Company, the unaudited condensed consolidated financial statements presented herein contain all adjustments, consisting of normal recurring adjustments, necessary for the fair presentation of the interim periods presented.
Principles of Consolidation
The accompanying condensed consolidated financial statements include the accounts of Petco Holdings, Inc. and its wholly owned subsidiaries. All intercompany accounts and transactions have been eliminated in consolidation.
Use of Estimates
The preparation of these condensed consolidated financial statements in conformity with GAAP requires management to make estimates and assumptions that affect the reported amounts of assets and liabilities, disclosure of contingent assets and liabilities at the date of the condensed consolidated financial statements and the reported amounts of revenues and expenses during the reporting periods. These estimates are based on information that is currently available and on various other assumptions that are believed to be reasonable under the circumstances. Actual results could vary from those estimates under different assumptions or conditions.
Fiscal Year
Operating results for interim periods are not necessarily indicative of operating results for an entire fiscal year. The Company’s fiscal year ends on the Saturday closest to January 31, resulting in years of either 52 or 53 weeks. All references to a fiscal year refer to the fiscal year ending on the Saturday closest to January 31 of the following year. For example, references to fiscal 2015 refer to the fiscal year beginning on February 1, 2015 and ending on January 30, 2016.
Recent Accounting Pronouncements
In April 2014, the Financial Accounting Standards Board (the “FASB”) issued updated guidance on the presentation of financial statements and property, plant and equipment related to reporting discontinued operations and disclosures of disposals of components of an entity. The new guidance amends the criteria for reporting discontinued operations and includes additional disclosure requirements. The new standard is effective for annual periods beginning in the Company’s fiscal year 2015 and for interim periods beginning in the Company’s fiscal year 2016, with early adoption
F-40
Table of Contents
permitted for disposals or classifications as held for sale that have not been reported in financial statements previously available for issuance. The Company elected to early adopt this guidance, and it did not have a material impact on the Company’s condensed consolidated financial statements.
In May 2014, the FASB issued updated guidance on revenue recognition that requires an entity to recognize the amount of revenue to which it expects to be entitled for the transfer of promised goods or services to customers. The FASB has finalized a one year deferral of the effective date; the standard will be effective for the Company’s fiscal year 2018. The standard permits the use of either the retrospective or cumulative effect transition method. The Company is currently evaluating the impact the new standard and adoption methods will have on its consolidated financial statements and related disclosures. The Company has not yet selected a transition method, nor has it determined the effect of the standard on its ongoing financial reporting. The impact of the new standard on the Company’s consolidated financial statements is not expected to be material.
In April 2015, the FASB issued updated guidance on the presentation of debt issuance costs, which requires that debt issuance costs related to a recognized debt liability be presented in the balance sheet as a direct deduction from the carrying amount of the corresponding debt liability, consistent with the presentation of debt discounts. The new guidance will be effective for the Company’s fiscal year 2016, and early adoption is permitted. The Company plans to early adopt this accounting policy as of the end of fiscal year 2015. The guidance will be applied on a retrospective basis, wherein the balance sheet of each individual period presented will be adjusted to reflect the period-specific effects of applying the new guidance. The Company has $19.0 million and $22.3 million in debt issuance costs included in other assets in the condensed consolidated balance sheets as of August 1, 2015 and January 31, 2015, respectively.
In July 2015, the FASB issued updated guidance on inventory measurement that applies to inventory that is measured using any method other than the last-in, first out (“LIFO”) or retail inventory method. The new guidance requires inventory to be measured at the lower of cost and net realizable value. The new standard is effective for interim and annual periods beginning in the Company’s fiscal year 2017. The Company is currently evaluating the impact the new standard will have on its consolidated financial statements and related disclosures. The impact of the new standard on the Company’s consolidated financial statements is not expected to be material.
2. Acquisition of Drs. Foster and Smith
On February 2, 2015, the Company acquired the assets of online retailer Drs. Foster and Smith (“DFS”) for approximately $158.8 million and an earn-out payment of up to $25.0 million based on fiscal 2017 revenues. The primary reason for this acquisition was to expand the Company’s online presence and range of offerings in order to better serve pet parents. The Company recorded the earn-out as a contingent consideration obligation at fair value for $11.2 million as of the acquisition date, and the contingent consideration obligation is included in deferred rents and other liabilities in the condensed consolidated balance sheet. The contingent consideration obligation will be remeasured each reporting period until it is paid, and changes in fair value will be included in selling, general and administrative expenses in the condensed consolidated statements of income and comprehensive income.
F-41
Table of Contents
The Company accounted for the transaction under the acquisition method. The purchase price for the acquisition has been preliminarily allocated based on estimated fair values of the assets acquired and liabilities assumed at the acquisition date, pending the completion of appraisals and other valuations. Fair values of the assets acquired and liabilities assumed on the date of acquisition, based on the preliminary purchase price allocation, are as follows (in thousands):
| Merchandise inventories |
$ | 18,108 | ||
| Current assets |
1,496 | |||
| Fixed assets |
10,456 | |||
| Other intangible assets |
33,400 | |||
| Goodwill |
107,552 | |||
| Current liabilities |
(1,000 | ) | ||
|
|
|
|||
| Total consideration |
$ | 170,012 | ||
|
|
|
The other intangible assets were assigned as follows (dollar amounts in thousands):
| Weighted-average amortization period (years) |
Gross amount |
|||||||
| Proprietary technology |
5 | $ | 1,300 | |||||
| Service marks |
10 | 21,600 | ||||||
| Customer lists |
7 | 10,500 | ||||||
|
|
|
|||||||
| Total other intangible assets acquired |
8.5 | $ | 33,400 | |||||
|
|
|
|||||||
The Company recorded goodwill of approximately $107.6 million, which is deductible for tax purposes over the 15 year period of amortization.
Since the acquisition date and for the twenty-six weeks ended August 1, 2015, the Company recorded $108.1 million in net sales and a $1.5 million net loss, which includes amortization of the other intangible assets and one-time integration expenses, related to the operations of DFS in the condensed consolidated statements of income and comprehensive income. Had we acquired DFS on February 2, 2014, the Company’s reported net sales and net income during the twenty-six weeks ended August 2, 2014 would have been increased by approximately $117.6 million, and decreased by approximately $1.0 million, respectively. In addition, reported EPS for the twenty-six weeks ended August 2, 2014 would not have been impacted had we acquired DFS on February 2, 2014.
3. Assets Held for Sale
During the fourth quarter of fiscal 2014, the Company revised its go-forward strategy for the pet hotels reporting unit, which resulted in a goodwill impairment charge and a fixed assets impairment charge being recorded in fiscal 2014. In the second quarter of fiscal 2015, the pet hotels reporting unit satisfied the criteria to be considered held for sale. As of August 1, 2015, total assets and liabilities held for sale included in other current assets and accrued expenses and other liabilities, respectively, in the accompanying condensed consolidated balance sheet are not material.
F-42
Table of Contents
4. Stock-Based Compensation
Stock-Based Compensation Expense
Stock-based compensation expense and the related income tax benefit consisted of the following (in thousands):
| Thirteen weeks ended | Twenty-six weeks ended | |||||||||||||||
| August 1, 2015 | August 2, 2014 | August 1, 2015 | August 2, 2014 | |||||||||||||
| Stock-based compensation expense |
$ | 987 | $ | 804 | $ | 1,465 | $ | 1,444 | ||||||||
| Income tax benefit from stock-based compensation expense |
$ | 390 | $ | 316 | $ | 578 | $ | 572 | ||||||||
As of August 1, 2015, unrecognized compensation expense related to the unvested portion of the Company’s stock options was $11.9 million, which is expected to be recognized over a weighted-average period of 3.0 years. Unrecognized compensation expense related to the Company’s unvested restricted stock units was $0.4 million and is expected to be recognized over a weighted-average period of 1.7 years.
Stock Option Grants
During the thirteen week period ended August 1, 2015, the Company granted options to purchase an aggregate of 6.1 million shares of common stock at a weighted-average exercise price of $2.09 per share, and during the twenty-six week period ended August 1, 2015, the Company granted options to purchase an aggregate of 15.4 million shares of common stock at a weighted-average exercise price of $2.08 per share. During the thirteen week period ended August 2, 2014, the Company granted no options, and during the twenty-six week period ended August 2, 2014, the Company granted options to purchase an aggregate of 12.6 million shares of common stock at a weighted-average exercise price of $2.00 per share.
5. Reserve for Closed Stores
The reserve for closed stores is reflected in the Company’s condensed consolidated balance sheets as follows (in thousands):
| August 1, 2015 | January 31, 2015 | |||||||
| Current portion of the reserve for closed stores |
$ | 2,040 | $ | 2,558 | ||||
| Non-current portion of the reserve for closed stores |
3,833 | 4,614 | ||||||
|
|
|
|
|
|||||
| Total reserve for closed stores |
$ | 5,873 | $ | 7,172 | ||||
|
|
|
|
|
|||||
The current portion of the reserve for closed stores is included in accrued expenses and other liabilities in the accompanying condensed consolidated balance sheets. The non-current portion is included in deferred rents and other liabilities in the accompanying condensed consolidated balance sheets. Store closing costs, changes in sublease assumptions and other occupancy payments are included in cost of sales and occupancy costs in the accompanying condensed consolidated statements of income and comprehensive income. Payments relating to the reserve for closed stores are expected to be made through 2025, coinciding with the expiration of the longest lease being reserved.
F-43
Table of Contents
The components of the reserve for closed stores were as follows (in thousands):
| August 1, 2015 | January 31, 2015 | |||||||
| Total remaining gross occupancy costs |
$ | 14,984 | $ | 17,716 | ||||
| Less: |
||||||||
| Expected sublease income |
(8,210 | ) | (9,393 | ) | ||||
| Interest costs |
(901 | ) | (1,151 | ) | ||||
|
|
|
|
|
|||||
| Reserve for closed stores |
$ | 5,873 | $ | 7,172 | ||||
|
|
|
|
|
|||||
The activity related to the reserve for closed stores was as follows (in thousands):
| Thirteen weeks ended | Twenty-six weeks ended | |||||||||||||||
| August 1, 2015 | August 2, 2014 | August 1, 2015 | August 2, 2014 | |||||||||||||
| Beginning balance |
$ | 6,793 | $ | 5,569 | $ | 7,172 | $ | 7,361 | ||||||||
|
|
|
|
|
|
|
|
|
|||||||||
| New reserves |
— | — | 956 | — | ||||||||||||
| Changes in sub-lease income assumptions |
59 | (196 | ) | 233 | (187 | ) | ||||||||||
| Other |
(184 | ) | 104 | (138 | ) | 78 | ||||||||||
|
|
|
|
|
|
|
|
|
|||||||||
| Charges, net |
(125 | ) | (92 | ) | 1,051 | (109 | ) | |||||||||
| Payments, net |
(795 | ) | (570 | ) | (2,350 | ) | (2,345 | ) | ||||||||
|
|
|
|
|
|
|
|
|
|||||||||
| Ending balance |
$ | 5,873 | $ | 4,907 | $ | 5,873 | $ | 4,907 | ||||||||
|
|
|
|
|
|
|
|
|
|||||||||
6. Senior Secured Credit Facilities
The Company has a $1.225 billion ($1.213 billion, net of discount) senior secured term loan facility maturing on November 24, 2017, most recently amended on February 5, 2013 (“Amended Term Loan Facility”) and a senior secured asset-based revolving credit facility expiring on April 19, 2018 (subject to a springing maturity 91 days inside the Amended Term Loan Facility maturity), most recently amended on November 21, 2014 to increase the commitments from $300.0 million to $400.0 million (“Amended Revolving Credit Facility”). The Amended Term Loan Facility and the Amended Revolving Credit Facility are collectively referred to as the “Senior Secured Credit Facilities.”
As of August 1, 2015, the outstanding principal balance of the Amended Term Loan Facility was $1.170 billion ($1.167 billion, net of the unamortized discount), and the weighted-average interest rate on the principal borrowings outstanding was 4.1%. As of August 1, 2015 and January 31, 2015, the estimated fair value of the Amended Term Loan Facility was approximately $1.176 billion and $1.165 billion, respectively, based on current industry market yields, which are considered Level 2 fair value hierarchy inputs.
As of August 1, 2015, $71.0 million was outstanding under the Amended Revolving Credit Facility, of which $10.0 million was included in current portion of long-term debt and capital lease obligations in the condensed consolidated balance sheets. The weighted-average interest rate on the borrowings outstanding was 2.2%. Due to the short maturity and the variable interest rate of the Amended Revolving Credit Facility, its fair value approximates its carrying value as of August 1, 2015 and January 31, 2015. At August 1, 2015, $280.6 million was available under the Amended Revolving Credit Facility, which is net of $48.4 million of outstanding letters of credit issued in the normal course of business.
The Company’s obligations under the Senior Secured Credit Facilities are secured by substantially all of the personal property assets of the Company with differing priority rights to the
F-44
Table of Contents
various personal property assets ascribed to each facility. Both credit facility agreements, while not identical, contain certain affirmative and negative covenants related to indebtedness, liens, fundamental changes in the business, investments, restricted payments and agreements and a fixed charge coverage ratio, among other things. The Senior Secured Credit Facilities specify a number of events of default (some of which are subject to applicable cure periods), including, among others, the failure to make payments when due, defaults under other agreements or instruments of indebtedness, non-compliance with covenants, change of control and bankruptcy. Upon the occurrence of an event of default, the lenders of each facility may terminate their respective facility and declare all amounts outstanding to be immediately due and payable.
Amended Term Loan Facility
Interest under the Amended Term Loan Facility is, at the Company’s option, the bank’s alternative base rate payable quarterly in arrears or the London Interbank Offered Rate (“LIBOR”) (subject to a 1.00% floor) payable upon maturity of the LIBOR contract, plus the applicable rate in either case. The alternative base rate is the greater of the bank prime rate, federal funds effective rate plus 0.5% or adjusted LIBOR plus 1.0%. The applicable rate is either 3.00% per annum for a LIBOR loan or 2.00% per annum for an alternative base rate loan. Principal payments under the Amended Term Loan Facility are $3.1 million quarterly.
Amended Revolving Credit Facility
The Company amended its senior secured asset-based revolving credit facility on November 21, 2014 to increase the commitments from $300.0 million to $400.0 million. The current revolving commitments (“Tranche A”) were increased from $300.0 million to $360.0 million, and a new $40.0 million first-in, last-out (“FILO”) revolving commitment was added. The terms of the Amended Revolving Credit Facility remain substantially unchanged. The Company incurred arranger fees and other third-party expenses of $0.9 million, which were capitalized as debt issuance costs and are included in other assets in the accompanying condensed consolidated balance sheets.
The Amended Revolving Credit Facility has availability up to $400.0 million and a $150.0 million letter of credit sub-facility. The availability under the Amended Revolving Credit Facility is limited to a borrowing base, which allows the Company to borrow up to 90.0% of eligible credit card receivables plus the lesser of 85.0% of eligible inventory and 90.0% of the net orderly liquidation value of the inventory, net of certain reserves, for Tranche A. The FILO borrowing base is incremental to the Tranche A borrowing base and is 10.0% of the eligible credit card receivables plus 10.0% of the net orderly liquidation value of eligible inventory. Letters of credit reduce the amount available to borrow by their face value.
Interest on the Amended Revolving Credit Facility is based on either the bank’s alternate base rate payable quarterly in arrears or LIBOR payable upon maturity of the LIBOR contract, in either case plus a spread. The bank spread rates are dependent on average historical excess availability as follows:
| FILO Loans | Tranche A Loans | |||||||||||||||
| Average Historical Excess Availability |
LIBOR Spread |
Alternate Bank Rate Spread (typically prime rate) |
LIBOR Spread |
Alternate Bank Rate Spread (typically prime rate) |
||||||||||||
| Less than $120.0 million |
3.00 | % | 2.00 | % | 1.75 | % | 0.75 | % | ||||||||
| From $120.0 million to $240.0 million |
2.75 | % | 1.75 | % | 1.50 | % | 0.50 | % | ||||||||
| In excess of $240.0 million |
2.50 | % | 1.50 | % | 1.25 | % | 0.25 | % | ||||||||
F-45
Table of Contents
The rate in effect under the Amended Revolving Credit Facility on unused commitments is 0.25% and is not dependent upon excess availability. The FILO commitment reduces by $10.0 million on each of the first and second year anniversaries, and requires a reduction in borrowings to the lower commitment level. The FILO loans may be prepaid at any time without penalty and any amounts prepaid cannot be reborrowed.
7. Senior Notes
On November 24, 2010, the Company issued unsecured senior notes maturing on December 1, 2018 at a 2% original issue discount (“OID”) in a private offering (the “Senior Notes”). OID and debt issuance costs related to the Senior Notes are being amortized over the contractual term to interest expense using the effective interest rate in effect at issuance. There are no associated registration rights with the Senior Notes.
The Senior Notes bear interest at the rate of 9.25% per annum, payable semi-annually in arrears on June 1 and December 1. At August 1, 2015, the outstanding principal balance of the Senior Notes was $500.0 million and the carrying amount was $494.9 million, net of the unamortized discount. At January 31, 2015, the outstanding principal balance of the Senior Notes was $500.0 million and the carrying amount was $494.3 million, net of the unamortized discount. As of August 1, 2015 and January 31, 2015, the estimated fair value of the Senior Notes was approximately $518.1 million and $519.2 million, respectively, based on current industry market yields, credit spreads and the redemption option, which are considered Level 2 fair value hierarchy inputs.
The Company may redeem the Senior Notes at its option, in whole or in part, based on the following agreed-upon schedule of redemption prices if redeemed during the 12-month period beginning on December 1 of each of the years indicated below:
| Year |
Percentage | |||
| 2014 |
104.625 | % | ||
| 2015 |
102.313 | % | ||
| 2016 and thereafter |
100.000 | % | ||
The indenture governing the Senior Notes specifies a number of events of default (many of which are subject to applicable cure periods), including, among others, the failure to make payments when due, defaults under other agreements or instruments of indebtedness and non-compliance with covenants. Upon the occurrence of an event of default, the holders of the Senior Notes may declare all amounts outstanding to be immediately due and payable.
8. PIK Toggle Notes
On October 10, 2012, the Company issued $550.0 million in principal amount of unsecured senior payment in kind (“PIK”) toggle notes maturing on October 15, 2017 in a private offering at a 0.5% OID (the “PIK Toggle Notes”). OID and debt issuance costs related to the PIK Toggle Notes are being amortized over the contractual term to interest expense using the effective interest rate in effect at issuance. There are no registration rights associated with the PIK Toggle Notes.
The PIK Toggle Notes bear interest at the rate of 8.50% per annum for cash interest and 9.25% for PIK interest, payable semi-annually in arrears on April 15 and October 15. For each interest payment (other than for the final interest period ending at stated maturity, which is to be paid in cash), the Company is required to pay interest on the PIK Toggle Notes entirely in cash, unless certain conditions are satisfied, in which case the Company is entitled to pay, to a certain extent, interest for such period by either increasing the principal amount of the notes or by issuing new notes for the amount of the interest payment.
F-46
Table of Contents
At August 1, 2015, the outstanding principal balance of the PIK Toggle Notes was $550.0 million and the carrying amount was $548.6 million, net of the unamortized discount. At January 31, 2015, the outstanding principal balance was $550.0 million and the carrying amount was $548.4 million, net of the unamortized discount. As of August 1, 2015 and January 31, 2015, the estimated fair value of the PIK Toggle Notes was approximately $566.5 million, based on current industry market yields, credit spreads and the redemption option, which are considered Level 2 fair value hierarchy inputs.
The Company may redeem the PIK Toggle Notes at its option, in whole or in part, based on the following agreed-upon schedule of redemption prices if redeemed during the 12-month period beginning on October 15 of each of the years indicated below:
| Year |
Percentage | |||
| 2014 |
103.000 | % | ||
| 2015 |
101.500 | % | ||
| 2016 and thereafter |
100.000 | % | ||
The indenture governing the PIK Toggle Notes specifies a number of events of default (many of which are subject to applicable cure periods), including, among others, the failure to make payments when due, defaults under other agreements or instruments of indebtedness and non-compliance with covenants. Upon the occurrence of an event of default, the holders of the PIK Toggle Notes may declare all amounts outstanding to be immediately due and payable.
9. Construction Loan
On March 20, 2015, the Company entered into a secured construction loan agreement for $42.7 million, to partially finance the construction of a new San Diego, California co-headquarters facility. Once construction on the facility is completed, which is to be no later than August 1, 2016, the construction loan will convert into a term loan and will mature 102 months following the conversion date. The note bears interest at 3.75% per year. During the construction loan period, interest incurred will be added to the principal balance on a monthly basis. During the term loan period, interest and principal will be paid monthly based on an amortization period of 162 months. On the term loan maturity date, all principal and unpaid interest will be payable in full. The Company may prepay the loan in part or in full during the loan period subject to certain conditions and fees. As of August 1, 2015 the outstanding loan balance was $20.3 million.
10. Derivative Instruments
In August 2011, the Company entered into six interest rate swap agreements in connection with $600.0 million of its amended term loan facility to fix the variable portion of its LIBOR loan and limit its exposure to interest rate variability. The interest rate swaps were forward-starting with effective dates of September 28, 2012 and September 30, 2013 and are based on three-month LIBOR contracts subject to a 1.25% floor.
F-47
Table of Contents
Terms of the Company’s interest rate swaps and their fair values are as follows (dollar amounts in thousands):
| Derivative liability fair value | ||||||||||||||||||||||||
| Notional amount |
Strike rate |
Effective date | Expiration date | August 1, 2015 |
January 31, 2015 |
|||||||||||||||||||
| $ | 100,000 | 2.06 | % | September 28, 2012 | September 30, 2016 | $ | 998 | $ | 1,325 | |||||||||||||||
| 100,000 | 2.07 | % | September 28, 2012 | September 30, 2016 | 1,012 | 1,345 | ||||||||||||||||||
| 100,000 | 2.15 | % | September 28, 2012 | September 30, 2016 | 1,105 | 1,475 | ||||||||||||||||||
| 100,000 | 2.31 | % | September 30, 2013 | September 30, 2016 | 1,311 | 1,765 | ||||||||||||||||||
| 100,000 | 2.31 | % | September 30, 2013 | September 30, 2016 | 1,315 | 1,763 | ||||||||||||||||||
| 100,000 | 2.40 | % | September 30, 2013 | September 30, 2016 | 1,418 | 1,912 | ||||||||||||||||||
|
|
|
|
|
|
|
|||||||||||||||||||
| Total |
$ | 600,000 | $ | 7,159 | $ | 9,585 | ||||||||||||||||||
|
|
|
|
|
|
|
|||||||||||||||||||
Interest rate swaps are reflected in the condensed consolidated balance sheets as follows (in thousands):
| Balance sheet location |
August 1, 2015 | January 31, 2015 | ||||||||
| Current portion of interest rate swaps |
Accrued expenses and other liabilities | $ | 5,833 | $ | 5,862 | |||||
| Non-current portion of interest rate swaps |
Deferred rents and other liabilities | 1,326 | 3,723 | |||||||
|
|
|
|
|
|||||||
| Total interest rate swaps |
$ | 7,159 | $ | 9,585 | ||||||
|
|
|
|
|
|||||||
Although the Company is exposed to credit loss on its interest rate swaps in the event of nonperformance by its counterparties, credit risk is considered limited due to the credit ratings of the counterparties and the use of a master netting agreement, which permits the netting of derivative payables and receivables. The Company has not historically incurred, and does not expect to incur in the future, any losses as a result of counterparty default. Further, the notional amount of the Company’s outstanding derivatives is not an indicator of the magnitude of potential exposure.
The interest rate swap agreements contain provisions that would be triggered in the event the Company defaults on its debt agreements (Note 6), which in turn could cause termination of the underlying swap agreements. As of August 1, 2015, no events of default have occurred. There is no collateral posting requirement outside of the provisions in the debt agreements.
In connection with the February 5, 2013 amendment to the term loan facility (Note 6), the Company elected to discontinue hedge accounting for the outstanding interest rate swaps. As such, unrealized losses in accumulated other comprehensive income (“AOCI”) will be reclassified into income as a component of interest expense during the periods in which the hedged forecasted transaction affects income, which is as interest on the Amended Term Loan Facility is incurred (Note 14). All prospective changes in fair value are recorded as a component of interest expense in the condensed consolidated statements of income and comprehensive income in the period of change. Approximately $1.2 million ($0.7 million, net of tax) and $2.4 million ($1.5 million, net of tax) were reclassified from AOCI to interest expense during the thirteen and twenty-six week periods ended August 1, 2015, respectively. Approximately $1.4 million ($0.8 million, net of tax) and $2.8 million ($1.8 million, net of tax) were reclassified from AOCI to interest expense during the thirteen and twenty-six week periods ended August 2, 2014, respectively.
As of August 1, 2015, the Company estimates $3.5 million of pre-tax losses related to its interest rate swaps that are currently deferred in AOCI will be reclassified to the condensed consolidated statements of income and comprehensive income within the next 12 months.
F-48
Table of Contents
11. Fair Value Measurements
Assets and Liabilities Measured on a Recurring Basis
The following table presents information about assets and liabilities that are measured at fair value on a recurring basis and indicate the fair value hierarchy of the valuation techniques utilized to determine such fair value (in thousands):
| August 1, 2015 | January 31, 2015 | |||||||||||||||||||||||
| Level 1 | Level 2 | Level 3 | Level 1 | Level 2 | Level 3 | |||||||||||||||||||
| Assets (liabilities): |
||||||||||||||||||||||||
| Money market mutual funds |
$ | 25,443 | $ | — | $ | — | $ | 43,104 | $ | — | $ | — | ||||||||||||
| Interest rate swaps |
$ | — | $ | (7,159 | ) | $ | — | $ | — | $ | (9,585 | ) | $ | — | ||||||||||
| Available-for-sale securities |
$ | 12,215 | $ | — | $ | — | $ | 19,776 | $ | — | $ | — | ||||||||||||
| Non-qualified deferred compensation plan |
$ | (19,391 | ) | $ | — | $ | — | $ | (18,323 | ) | $ | — | $ | — | ||||||||||
| Contingent consideration obligation |
$ | — | $ | — | $ | (11,522 | ) | $ | — | $ | — | $ | — | |||||||||||
The fair value of money market mutual funds is based on quoted market prices, such as quoted net asset values published by the fund as supported in an active market. As of August 1, 2015, $17.0 million in money market mutual funds was included in cash and cash equivalents in the Company’s condensed consolidated balance sheet. As of January 31, 2015, $36.0 million in money market mutual funds was included in cash and cash equivalents in the Company’s consolidated balance sheet. Also included in the money market mutual funds balances is $8.4 million and $7.1 million at August 1, 2015 and January 31, 2015, respectively, which relates to the Company’s restricted cash, and is included in other current assets in the condensed consolidated balance sheets.
The fair values of the Company’s interest rate swaps are determined using a discounted cash flow analysis on the expected cash flows of each interest rate swap (Note 10). This analysis reflects the contractual terms, including the period to maturity, and uses observable market-based inputs, including interest rate curves. The fair values of interest rate swaps are determined by netting the discounted future fixed cash receipts payments and the discounted expected variable cash receipts. The variable cash receipts are based on an expectation of future interest rates (forward curves) derived from observable market interest rate yield curves. The Company qualitatively assesses both its own nonperformance risk and the respective counterparties’ nonperformance risk in the fair value measurements. The valuations also consider credit risk adjustments that are necessary to reflect the probability of default by the counterparty or the Company, which are considered Level 3 inputs; however, as of August 1, 2015 and January 31, 2015, the credit risk adjustments, including nonperformance risk, were considered insignificant to the total fair value of the interest rate swaps.
The fair value of the Company’s available-for-sale equity securities, which consists of the Company’s ownership interest in a publicly traded company, is determined using quoted prices in active markets for identical assets. The available-for-sale securities are included in other long-term assets in the Company’s condensed consolidated balance sheets. The cost basis for this investment was $6.2 million and $6.4 million as of August 1, 2015 and January 31, 2015, respectively, and the total unrealized gain included in AOCI was $6.0 million ($3.6 million, net of tax) and $13.3 million ($8.1 million, net of tax) at August 1, 2015 and January 31, 2015, respectively. Realized gains reclassified out of accumulated other comprehensive income were $0.4 million ($0.3 million, net of tax) as of August 1, 2015, and were determined based on average cost (Note 14). There were no realized gains from the sales of available-for-sale securities included in income for the thirteen weeks ended August 1, 2015. Realized gains from the sales of available-for-sale securities included in income were $0.3 million for the twenty-six weeks ended August 1, 2015.
F-49
Table of Contents
The Company maintains a fully funded deferred compensation plan for key executives and other members of management. The fair value of this obligation is based on the closing market prices of the participants’ elected investments.
The fair value of the contingent consideration obligation related to the DFS earn-out (Note 2) is based on DFS’s fiscal 2017 performance using probability-weighted revenue projections. The resulting liability is remeasured each period based on the current probability assessment and the amount of time until the payout of the liability. The fair value measurement is based on significant inputs not observable in the market, which are considered Level 3 inputs. At August 1, 2015, the key assumptions in applying the probability-weighted approach include a 5.8% discount rate and an estimated payout range of $0 to $25.0 million based on estimated DFS revenue growth ranging from approximately 35% to 60% for fiscal 2017 as compared to fiscal 2014. Using different valuation assumptions could result in significant differences in the fair value of the contingent consideration obligation and accretion expense in the current or future periods.
Assets Measured on a Non-Recurring Basis
The Company’s non-financial assets, which primarily consist of goodwill, other intangible assets, fixed assets and equity and cost method investments, are reported at carrying value and are not required to be measured at fair value on a recurring basis. However, on a periodic basis (at least annually for indefinite-lived intangibles or whenever events or changes in circumstances indicate that the carrying value of an asset may not be recoverable), non-financial assets are assessed for impairment. If impaired, the carrying values of the assets are written down to fair value using Level 3 inputs.
There were no triggering events identified and no indication of impairment of the Company’s goodwill, indefinite lived trade name, other intangible assets or equity and cost method investments during the twenty-six weeks ended August 1, 2015 and August 2, 2014. During the thirteen and twenty-six weeks ended August 1, 2015, fixed assets with carrying values of $0.4 million and $1.4 million, respectively, were triggered and deemed to be fully impaired. During the thirteen and twenty-six weeks ended August 2, 2014, fixed assets with carrying values of $2.3 million and $2.4 million, respectively, were triggered and deemed to be fully impaired. Impairment charges related to non-store assets are recorded in selling, general and administrative expense, whereas charges related to underperforming locations are recorded in cost of sales and occupancy costs in the accompanying condensed consolidated statements of income and comprehensive income.
12. Related-Party Transactions
Management Services Agreement
On October 26, 2006, the date of acquisition of the Company by private equity funds TPG Partners V, L.P. and Green Equity Investors IV, L.P. and their affiliates (collectively, the “Investors”), the Company entered into a management services agreement with certain affiliates of the Investors, under which the Investors’ affiliates provide certain management and advisory services to the Company and its operating subsidiaries. The services include investment banking services, management, consulting and financial planning services and financial advisory services in connection with major financial transactions that may be undertaken from time to time. As compensation for management, consulting and financial planning services, the Company agreed to pay the Investors’ affiliates an annual fee of $7.0 million plus reimbursement of reasonable out-of-pocket expenses incurred in connection with the services rendered. As compensation for financial advisory and investment banking services in connection with major financial transactions, the Company agreed to pay the Investors normal and customary fees for services of like kind to be agreed upon. The Company
F-50
Table of Contents
also agreed to provide customary indemnification to the Investors’ affiliates. The agreement has a term of ten years, and is automatically renewed in one-year increments thereafter, unless otherwise earlier terminated. Upon a change of control or public offering, the agreement terminates and all amounts otherwise payable during the term, discounted to present value, become due.
In December 2012, certain stockholders of the Company sold a minority interest in the Company to two unrelated third-party investors. In connection with the minority stock sale, the Investors (i) transferred and assigned to an affiliate of the first new investor the right to receive from the Company a pro rata portion of future management fees equal to the first new investor’s pro rata ownership interest in the Company and (ii) waived their right to receive from the Company a pro rata portion of future management fees equal to the second new investor’s pro rata ownership interest in the Company. The second new investor was issued a warrant to purchase shares of the Company’s common stock intended to compensate the investor for the loss in value in its investment attributable to the fees that are payable by the Company or its subsidiaries to the Investors and their affiliates from time to time under the management services agreement. The warrant is not material to the Company’s condensed consolidated financial statements.
During each of the thirteen week periods ended August 1, 2015 and August 2, 2014, the Company recorded management fees of $1.5 million, and during each of the twenty-six week periods ended August 1, 2015 and August 2, 2014, the Company recorded management fees of $3.1 million, which are included in selling, general and administrative expenses in the accompanying condensed consolidated statements of income and comprehensive income.
Stockholders Agreement
The stockholders of the Company are the Investors, certain co-investors and certain members of management. On October 26, 2006, the Company and its stockholders entered into a stockholders agreement, which set forth certain provisions relating to their respective rights and obligations with respect to their capital stock. These provisions included board composition and director nomination rights, major transaction approval rights, restrictions on transfer of any security, tag along and drag along rights, the Investors’ right of first refusal, preemptive rights, management stockholders’ repurchase option, demand and piggyback registration rights, information rights and indemnification of the Investors. Effective June 8, 2011, the stockholders agreement was amended to include a call right provision that enables the Company to repurchase management stockholder shares acquired after June 8, 2011 at its discretion upon the occurrence of certain triggering events.
Effective December 24, 2012, the stockholders agreement was amended and restated in connection with the Company’s minority stock sale to provide certain rights to the new investors, including board nomination and observation rights, approval of certain transactions, rights of first refusal, registration rights and information rights, among other things. Certain provisions of the agreement terminate upon a qualified public offering event, including the rights relating to the board, approval of certain transactions, restrictions on transfer, rights of first refusal, preemptive rights, and tag along and drag along rights.
Other
The Company incurred and recorded expenses related to certain of the Investors’ affiliates’ legal and other costs that were not material for the thirteen and twenty-six weeks ended August 1, 2015 and August 2, 2014. These costs were included in selling, general and administrative expenses in the condensed consolidated statements of income and comprehensive income.
F-51
Table of Contents
13. Stockholders’ Equity
Common Stock
The Company is authorized to issue 895.0 million shares of common stock with a par value of $0.001 per share. Holders of common stock have the right to vote. The indenture governing the PIK Toggle Notes limits the Company’s ability to pay dividends or make other distributions with respect to its common stock.
Earnings per Share
The reconciliations of the weighted average shares outstanding used in the Company’s earnings per share calculations are as follows (in thousands):
| Thirteen weeks ended | Twenty-six weeks ended | |||||||||||||||
| August 1, 2015 | August 2, 2014 | August 1, 2015 | August 2, 2014 | |||||||||||||
| Basic |
806,799 | 805,668 | 806,887 | 805,538 | ||||||||||||
| Dilutive stock-based compensation awards |
23,507 | 24,687 | 23,506 | 25,331 | ||||||||||||
|
|
|
|
|
|
|
|
|
|||||||||
| Dilutive |
830,306 | 830,355 | 830,393 | 830,869 | ||||||||||||
|
|
|
|
|
|
|
|
|
|||||||||
| Antidilutive |
28,850 | 20,782 | 28,850 | 20,782 | ||||||||||||
14. Accumulated Other Comprehensive Income
Changes in the balances of each component included in AOCI are presented below (net of tax, in thousands):
Twenty-six weeks ended August 1, 2015:
| Derivatives | Available-for-sale securities |
Foreign currency translation adjustment |
Total | |||||||||||||
| Balance at January 31, 2015 |
(3,610 | ) | 8,072 | (352 | ) | 4,110 | ||||||||||
| Other comprehensive (loss)/income before reclassifications |
— | (4,196 | ) | (365 | ) | (4,561 | ) | |||||||||
| Amounts reclassified from AOCI |
1,522 | (257 | ) | — | 1,265 | |||||||||||
|
|
|
|
|
|
|
|
|
|||||||||
| Balance at August 1, 2015 |
(2,088 | ) | 3,619 | (717 | ) | 814 | ||||||||||
|
|
|
|
|
|
|
|
|
|||||||||
Twenty-six weeks ended August 2, 2014:
| Derivatives | Available-for-sale securities |
Foreign currency translation adjustment |
Total | |||||||||||||
| Balance at February 1, 2014 |
(6,919 | ) | 9,013 | — | 2,094 | |||||||||||
| Other comprehensive (loss)/income before reclassifications |
— | 3,538 | — | 3,538 | ||||||||||||
| Amounts reclassified from AOCI |
1,777 | — | — | 1,777 | ||||||||||||
|
|
|
|
|
|
|
|
|
|||||||||
| Balance at August 2, 2014 |
(5,142 | ) | 12,551 | — | 7,409 | |||||||||||
|
|
|
|
|
|
|
|
|
|||||||||
F-52
Table of Contents
15. Contingencies
The Company is involved in the legal proceedings described below and is subject to other claims and litigation arising in the ordinary course of its business. The Company has made accruals with respect to certain of these matters, where appropriate, which are reflected in the Company’s condensed consolidated financial statements but are not, individually or in the aggregate, considered material. For other matters, the Company has not made accruals because management has not yet determined that a loss is probable or because the amount of loss cannot be reasonably estimated. While the ultimate outcome of the matters described below cannot be determined, the Company currently does not expect that these matters will have a material adverse effect on its condensed consolidated financial statements. The outcome of any litigation is inherently uncertain, however, and if decided adversely to the Company, or if the Company determines that settlement of particular litigation is appropriate, the Company may be subject to liability that could have a material adverse effect on its condensed consolidated financial statements.
In March 2013, a suit was filed against the Company in the United States District Court for the Southern District of California by a former employee. The plaintiff filed the suit individually and as a purported class action on behalf of other assistant managers alleging violation(s) of the federal Fair Labor Standards Act in classification of employees. The Company responded to the initial complaint by filing a Motion to Dismiss, which was partially granted. Subsequently, the plaintiff filed an amended complaint, to which the Company responded by filing a second Motion to Dismiss in October 2013, which was denied. Briefing on the plaintiff’s motion for conditional class certification is complete, and a hearing on the motion was held in May 2015. A decision on the motion is not expected for several months. Although there is a reasonable possibility that this matter could result in a material loss, due to the preliminary nature of this matter, management is unable to estimate the range of such loss. Management believes that strong defenses exist to this claim and intends to defend against this action vigorously.
In March 2014, a suit was filed against the Company in the Los Angeles Superior Court by a current employee. The plaintiff filed the suit individually and as a purported class action on behalf of other current and former employees alleging that the Company failed to pay hourly employees for all hours worked, failed to provide hourly employees with paid rest periods as required by California law, failed to properly reimburse employees for business expenses and failed to provide accurate wage statements. Subsequently, a first amended complaint was filed, adding Petco Animal Supplies, Inc. as a defendant, and adding an additional cause of action alleging violation of the itemized wage statement law. A second amended complaint has also been filed, adding two additional plaintiffs as well as new causes of action alleging violations of the overtime and meal period laws. The lawsuit seeks compensatory damages, statutory penalties and other relief, including interest, attorneys’ fees, costs and injunctive relief. On February 4, 2015, the parties agreed to a mediator’s proposal to settle this matter. The settlement is subject to final Court approval, and a hearing on the settlement is currently scheduled for September 2015. The Company recorded an accrual in regards to this settlement in fiscal 2014, which was not material and is reflected in accrued expenses and other liabilities in the accompanying consolidated balance sheets.
In December 2014, a suit was filed against the Company in the United States District Court of the Southern District of New York, by several former employees. The plaintiffs filed the suit individually and on behalf of pet stylists, groomers, and bathers. The suit alleges violations including failure to pay minimum wages, failure to pay statutory / contractual wages, failure to provide paid rest periods, failure to reimburse business expenses, failure to provide itemized wage statements and violation of federal and state laws in four states. A First Amended Complaint was filed on February 17, 2015, to which the Company filed an Answer. Although there is a reasonable possibility that this matter could result in a material loss, due to the preliminary nature of this matter, management is unable to estimate the range of such loss.
F-53
Table of Contents
Shares
Petco Holdings, Inc.
Common Stock
Prospectus
| Goldman, Sachs & Co. | BofA Merrill Lynch | J.P. Morgan | ||
| Credit Suisse | Deutsche Bank Securities | Morgan Stanley | Wells Fargo Securities | Jefferies | ||||
| TPG Capital BD, LLC | Piper Jaffray | Stifel | Cantor Fitzgerald & Co. | Guggenheim Securities | Nomura | |||||
, 2015
Through and including , (25 days after the commencement of this offering), all dealers that effect transactions in shares of our common stock, whether or not participating in this offering, may be required to deliver a prospectus. This delivery is in addition to a dealer’s obligation to deliver a prospectus when acting as an underwriter and with respect to their unsold allotments or subscriptions.
Table of Contents
PART II
INFORMATION NOT REQUIRED IN PROSPECTUS
Item 13. Other Expenses of Issuance and Distribution
The following table sets forth the costs and expenses, other than the underwriting discounts and commissions, payable by the registrant in connection with the sale of common stock being registered. All amounts are estimates except for the SEC registration fee, the FINRA filing fee and listing fee.
| Item |
Amount to be paid | |||
| SEC registration fee |
$ | 11,620 | ||
| FINRA filing fee |
15,500 | |||
| listing fee |
* | |||
| Blue sky fees and expenses |
* | |||
| Printing and engraving expenses |
* | |||
| Legal fees and expenses |
* | |||
| Accounting fees and expenses |
* | |||
| Transfer Agent fees and expenses |
* | |||
| Miscellaneous expenses |
* | |||
|
|
|
|||
| Total |
$ | * | ||
|
|
|
|||
| * | To be completed by amendment. |
Item 14. Indemnification of Directors and Officers
Section 145(a) of the General Corporation Law of the State of Delaware (the “DGCL”) grants each corporation organized thereunder the power to indemnify any person who was or is a party or is threatened to be made a party to any threatened, pending or completed action, suit or proceeding, whether civil, criminal, administrative or investigative (other than an action by or in the right of the corporation), by reason of the fact that such person is or was a director, officer, employee or agent of the corporation, or is or was serving at the request of the corporation as a director, officer, employee or agent of another corporation, partnership, joint venture, trust or other enterprise, against expenses (including attorneys’ fees), judgments, fines and amounts paid in settlement actually and reasonably incurred by such person in connection with such action, suit or proceeding if such person acted in good faith and in a manner such person reasonably believed to be in or not opposed to the best interests of the corporation, and, with respect to any criminal action or proceeding, had no reasonable cause to believe such person’s conduct was unlawful. The termination of any action, suit or proceeding by judgment, order, settlement, conviction or upon a plea of nolo contendere or its equivalent shall not, of itself, create a presumption that such person did not act in good faith and in a manner which such person reasonably believed to be in or not opposed to the best interests of the corporation, and, with respect to any criminal action or proceeding, had reasonable cause to believe that such person’s conduct was unlawful.
Section 145(b) of the DGCL grants each corporation organized thereunder the power to indemnify any person who was or is a party or is threatened to be made a party to any threatened, pending or completed action or suit by or in the right of the corporation to procure a judgment in its favor by reason of the fact that the person is or was a director, officer, employee or agent of the corporation, or is or was serving at the request of the corporation as a director, officer, employee or agent of another corporation, partnership, joint venture, trust or other enterprise, against expenses (including attorneys’ fees) actually and reasonably incurred by such person in connection with the
II-1
Table of Contents
defense or settlement of such action or suit if the person acted in good faith and in a manner the person reasonably believed to be in or not opposed to the best interests of the corporation and except that no indemnification shall be made in respect of any claim, issue or matter as to which such person shall have been adjudged to be liable to the corporation unless and only to the extent that the Delaware Court of Chancery or the court in which such action or suit was brought shall determine upon application that, despite the adjudication of liability but in view of all the circumstances of the case, such person is fairly and reasonably entitled to indemnity for such expenses which the Court of Chancery or such other court shall deem proper.
Section 102(b)(7) of the DGCL enables a corporation in its certificate of incorporation or an amendment thereto to eliminate or limit the personal liability of a director to the corporation or its stockholders of monetary damages for violations of the director’s fiduciary duty, except (i) for any breach of the director’s duty of loyalty to the corporation or its stockholders, (ii) for acts or omissions not in good faith or that involve intentional misconduct or a knowing violation of law, (iii) pursuant to Section 174 of the DGCL (providing for liability of directors for unlawful payment of dividends or unlawful stock purchases or redemptions) or (iv) for any transaction from which a director derived an improper personal benefit. Our certificate of incorporation includes a provision that eliminates the personal liability of directors for monetary damages for actions taken as a director to the fullest extent authorized by the DGCL.
We have also entered into indemnification agreements with certain of our directors. Such agreements generally provide for indemnification by reason of being our director, as the case may be. These agreements are in addition to the indemnification provided by our certificate of incorporation and bylaws. Insofar as indemnification for liabilities arising under the Securities Act may be permitted to directors, we have been informed that in the opinion of the SEC such indemnification is against public policy and is therefore unenforceable.
The underwriting agreement provides that the underwriters are obligated, under certain circumstances, to indemnify our directors, officers and controlling persons against certain liabilities, including liabilities under the Securities Act. Please see the form of underwriting agreement filed as Exhibit 1.1 hereto.
Our amended and restated bylaws indemnify the directors and officers to the full extent of the DGCL and also allow the board of directors to indemnify all other employees. Such right of indemnification is not exclusive of any right to which such officer or director may be entitled as a matter of law and shall extend and apply to the estates of deceased officers and directors. Section 145(f) of the DGCL further provides that a right to indemnification or to advancement of expenses arising under a provision of the bylaws shall not be eliminated or impaired by an amendment to such provision after the occurrence of the act or omission which is the subject of the civil, criminal, administrative or investigative action, suit or proceeding for which indemnification or advancement of expenses is sought.
We also maintain a directors’ and officers’ insurance policy. The policy insures directors and officers against unindemnified losses arising from certain wrongful acts in their capacities as directors and officers and reimburses us for those losses for which we have lawfully indemnified the directors and officers. The policy contains various exclusions that are normal and customary for policies of this type. Section 145(g) of the DGCL provides that a corporation shall have power to purchase and maintain insurance on behalf of any person who is or was a director or officer of the corporation, or is or was serving at the request of the corporation as a director or officer of another corporation, partnership, joint venture, trust or other enterprise, against any liability asserted against such person and incurred by such person in any such capacity, or arising out of such person’s status as such, whether or not the corporation would have the power to indemnify such person against such liability under that section.
II-2
Table of Contents
Item 15. Recent Sales of Unregistered Securities
In the three years preceding the filing of this registration statement, we have issued the following securities that were not registered under the Securities Act. Except as noted below, no underwriters were involved in any of the following transactions.
Equity Securities
On December 27, 2012, we issued a warrant to purchase shares of common stock in reliance on the exemptions afforded by Section 4(a)(2) of the Securities Act. The warrant is exercisable at an exercise price determined by dividing $ by the average closing price of a share of our common stock on for the 30 consecutive trading days commencing on the first day of trading following the date of the prospectus forming a part of this registration statement.
During the period from January 29, 2012 to February 2, 2013, we issued a total of 16,701,989 shares of our common stock in connection with the exercise of stock options previously granted under our 2006 Key Management Incentive Award Plan and 2006 Senior Executive Incentive Award Plan (collectively, the “2006 Incentive Plans”). We also granted options to purchase a total of 2,075,000 shares of our common stock at a weighted average exercise price of $1.45 per share to certain eligible participants under our 2006 Incentive Plans. During this period, we also issued a total of 250,000 shares of our common stock in connection with the vesting and release of previously issued restricted stock unit awards (“RSUs”). These securities were issued without registration in reliance on the exemptions afforded by Sections 3(a)(9) and 4(a)(2) of the Securities Act and Rule 701 promulgated under the Securities Act.
During the period from February 3, 2013 to February 1, 2014, we issued a total of 3,566,354 shares of our common stock in connection with the exercise of stock options previously granted under our 2006 Incentive Plans. We also granted options to purchase a total of 9,677,000 shares of our common stock at a weighted average exercise price of $2.00 per share to certain eligible participants under our 2006 Incentive Plans. During this period, we also issued a total of 140,450 shares of our common stock in connection with the vesting and release of previously issued RSUs. We also issued 50,000 RSUs with a weighted average grant date fair value of $2.00. These securities were issued without registration in reliance on the exemptions afforded by Sections 3(a)(9) and 4(a)(2) of the Securities Act and Rule 701 promulgated under the Securities Act.
During the period from February 2, 2014 to January 31, 2015, we issued a total of 2,613,997 shares of our common stock in connection with the exercise of stock options previously granted under our 2006 Incentive Plans. We also granted options to purchase a total of 12,940,000 shares of our common stock at a weighted average exercise price of $2.00 per share to certain eligible participants under our 2006 Incentive Plans. During this period, we also issued a total of 525,000 shares of our common stock in connection with the vesting and release of previously issued RSUs. We also issued 25,000 RSUs with a weighted average grant date fair value of $1.87. These securities were issued without registration in reliance on the exemptions afforded by Sections 3(a)(9) and 4(a)(2) of the Securities Act and Rule 701 promulgated under the Securities Act.
During the period from February 1, 2015 to August 1, 2015, we issued a total of 702,420 shares of our common stock in connection with the exercise of stock options previously granted under our 2006 Incentive Plans. We also granted options to purchase a total of 15,359,000 shares of our common stock at a weighted average exercise price of $2.08 per share to certain eligible participants under our 2006 Incentive Plans. During this period, we also issued a total of 25,000 shares of our common stock in connection with the vesting and release of previously issued RSUs. We also issued 275,000 RSUs with a weighted average grant date fair value of $1.95. These securities were issued without registration in reliance on the exemptions afforded by Sections 3(a)(9) and 4(a)(2) of the Securities Act and Rule 701 promulgated under the Securities Act.
II-3
Table of Contents
Debt Securities
On October 10, 2012, Petco Holdings, Inc. issued an aggregate principal amount of $550.0 million of Senior PIK Toggle Notes due 2017 (the “PIK toggle notes”), which was used to fund a distribution to the stockholders of Petco Holdings, Inc. The initial purchasers for the PIK toggle notes were J.P. Morgan Securities LLC, Credit Suisse Securities (USA) LLC, Goldman, Sachs & Co., Merrill Lynch, Pierce, Fenner & Smith Incorporated, Morgan Stanley & Co. LLC and Wells Fargo Securities, LLC. The PIK toggle notes were offered and sold to qualified institutional buyers pursuant to Rule 144A under the Securities Act or to non-U.S. investors outside the United States in compliance with Regulation S of the Securities Act.
Item 16. Exhibits and Financial Statement Schedules
(a) Exhibits
See Exhibit Index following the signature page.
(b) Financial statement schedules
Schedules not listed above have been omitted because the information required to be set forth therein is not applicable or is shown in the financial statements or notes thereto.
Item 17. Undertakings
The undersigned Registrant hereby undertakes:
(1) That for purposes of determining any liability under the Securities Act of 1933, the information omitted from the form of prospectus filed as part of this registration statement in reliance upon Rule 430A and contained in a form of prospectus filed by the Registrant pursuant to Rule 424(b)(1) or (4) or 497(h) under the Securities Act of 1933 shall be deemed to be part of this registration statement as of the time it was declared effective.
(2) That for the purpose of determining any liability under the Securities Act of 1933, each post-effective amendment that contains a form of prospectus shall be deemed to be a new registration statement relating to the securities offered therein, and the offering of such securities at that time shall be deemed to be the initial bona fide offering thereof.
(3) For the purpose of determining liability under the Securities Act of 1933 to any purchaser, if the registrant is subject to Rule 430C, each prospectus filed pursuant to Rule 424(b) as part of a registration statement relating to an offering, other than registration statements relying on Rule 430B or other than prospectuses filed in reliance on Rule 430A, shall be deemed to be part of and included in the registration statement as of the date it is first used after effectiveness. Provided, however, that no statement made in a registration statement or prospectus that is part of the registration statement or made in a document incorporated or deemed incorporated by reference into the registration statement or prospectus that is part of the registration statement will, as to a purchaser with a time of contract of sale prior to such first use, supersede or modify any statement that was made in the registration statement or prospectus that was part of the registration statement or made in any such document immediately prior to such date of first use.
(4) The undersigned registrant undertakes that in a primary offering of securities of the undersigned registrant pursuant to this registration statement, regardless of the underwriting method used to sell the securities to the purchaser, if the securities are offered or sold to such purchaser by
II-4
Table of Contents
means of any of the following communications, the undersigned registrant will be a seller to the purchaser and will be considered to offer or sell such securities to such purchaser:
(i) Any preliminary prospectus or prospectus of the undersigned registrant relating to the offering required to be filed pursuant to Rule 424;
(ii) Any free writing prospectus relating to the offering prepared by or on behalf of the undersigned registrant or used or referred to by the undersigned registrant;
(iii) The portion of any other free writing prospectus relating to the offering containing material information about the undersigned registrant or its securities provided by or on behalf of the undersigned registrant; and
(iv) Any other communication that is an offer in the offering made by the undersigned registrant to the purchaser.
(5) Insofar as indemnification for liabilities arising under the Securities Act of 1933 may be permitted to directors, officers and controlling persons of the registrant pursuant to the foregoing provisions, or otherwise, the registrant has been advised that in the opinion of the Securities and Exchange Commission such indemnification is against public policy as expressed in the Act and is, therefore, unenforceable. In the event that a claim for indemnification against such liabilities (other than the payment by the registrant of expenses incurred or paid by a director, officer or controlling person of the registrant in the successful defense of any action, suit or proceeding) is asserted by such director, officer or controlling person in connection with the securities being registered, the registrant will, unless in the opinion of its counsel the matter has been settled by controlling precedent, submit to a court of appropriate jurisdiction the question whether such indemnification by it is against public policy as expressed in the Act and will be governed by the final adjudication of such issue.
(6) To provide to the underwriters at the closing specified in the underwriting agreement certificates in such denominations and registered in such names as required by the underwriters to permit prompt delivery to each purchaser.
II-5
Table of Contents
SIGNATURES
Pursuant to the requirements of the Securities Act of 1933, the registrant has duly caused this registration statement to be signed on its behalf by the undersigned, thereunto duly authorized, in the city of San Diego, California on September 24, 2015.
| PETCO HOLDINGS, INC. | ||
| By: | /s/ James Myers | |
| Name: | James Myers | |
| Title: | Chief Executive Officer & Chairman of the Board of Directors | |
***
Pursuant to the requirements of the Securities Act of 1933, this registration statement has been signed by the following persons in the capacities and on the dates indicated.
| Signature |
Title |
Date | ||
| /s/ James Myers James Myers |
Chief Executive Officer & Chairman of the Board of Directors (Principal Executive Officer) |
September 24, 2015 | ||
| /s/ Michael Nuzzo Michael Nuzzo |
Executive Vice President and Chief Financial Officer (Principal Financial Officer) |
September 24, 2015 | ||
| /s/ Patricia Ward Patricia Ward |
Vice President, Finance and Controller (Principal Accounting Officer) | September 24, 2015 | ||
| * Brian Devine |
Director, Chairman Emeritus of the Board of Directors |
September 24, 2015 | ||
| * Jonathan Coslet |
Director | September 24, 2015 | ||
| * Carrie Wheeler |
Director | September 24, 2015 | ||
II-6
Table of Contents
| Signature |
Title |
Date | ||||||
| * Gary Kusin |
Director | September 24, 2015 | ||||||
| * John Baumer |
Director | September 24, 2015 | ||||||
| * John Danhakl |
Director | September 24, 2015 | ||||||
| * Michael Solomon |
Director | September 24, 2015 | ||||||
| * Fred Simmons |
Director | September 24, 2015 | ||||||
| * Peter Starrett |
Director | September 24, 2015 | ||||||
| * Lawrence Hayward |
Director | September 24, 2015 | ||||||
| * Colm Lanigan
|
Director | September 24, 2015 | ||||||
| * | By: | /s/ Michael Nuzzo |
September 24, 2015 | |||||
| Name: | Michael Nuzzo | |||||||
| Title: | Attorney-in-fact |
|||||||
II-7
Table of Contents
EXHIBIT INDEX
| Exhibit number |
Description of exhibit | |
| 1.1* | Form of Underwriting Agreement | |
| 3.1* | Restated Certificate of Incorporation of Petco Holdings, Inc. | |
| 3.2* | Amended and Restated By-laws of Petco Holdings, Inc. | |
| 4.1* | Form of Common Stock Certificate | |
| 4.2** | Indenture, dated as of November 24, 2010, among Petco Animal Supplies, Inc., the Guarantors named on the signature pages thereto, and Wells Fargo Bank, National Association, as Trustee | |
| 4.3** | Supplemental Indenture, dated as of October 3, 2012, among Petco Animal Supplies, Inc., the Guaranteeing Subsidiaries named therein, and Wells Fargo Bank, National Association, as Trustee | |
| 4.4** | Indenture, dated October 10, 2012, between Petco Holdings, Inc., and Wells Fargo Bank, National Association, as Trustee | |
| 4.5** | Promissory Note, dated April 28, 2015, of Petco Real Estate Holdings III, LLC as Debtor, with MUFG Union Bank, N.A. as Payee and Agent thereunder | |
| 4.6** | Promissory Note, dated April 28, 2015, of Petco Real Estate Holdings III, LLC as Debtor, with California Bank and Trust as Payee and MUFG Union Bank, N.A.as Agent thereunder | |
| 4.7* | Amended and Restated Stockholders’ Agreement, by and among Petco Holdings, Inc. and the Stockholders set forth therein | |
| 5.1* | Opinion of Ropes & Gray LLP | |
| 10.1** | Management Services Agreement, dated as of October 26, 2006, by and among Rover Holding Corp., Petco Animal Supplies Stores, Inc., Leonard Green & Partners, L.P., TPG GenPar IV, L.P., and Freeman Spogli & Co. V, L.P. | |
| 10.2** | Term Loan Agreement, dated as of November 24, 2010, among Petco Animal Supplies, Inc., as Borrower, the Lenders party thereto, Credit Suisse AG, as Administrative Agent and Collateral Agent, and the subsidiaries of Petco Animal Supplies, Inc. from time to time party thereto | |
| 10.3** | Amendment No. 1, dated as of February 25, 2011, to the Term Loan Agreement, originally dated as of November 24, 2010, among Petco Animal Supplies, Inc., as Borrower, the Lenders party thereto, Credit Suisse AG, as Administrative Agent and Collateral Agent, and the subsidiaries of Petco Animal Supplies, Inc. from time to time party thereto | |
| 10.4** | Amendment No. 2, dated October 9, 2012, to the Term Loan Agreement, originally dated as of November 24, 2010, among Petco Animal Supplies, Inc., as Borrower, the Lenders party thereto, Credit Suisse AG, as Administrative Agent and Collateral Agent, and the subsidiaries of Petco Animal Supplies, Inc. from time to time party thereto | |
| 10.5** | Amendment No. 3, dated February 5, 2013, to the Term Loan Agreement, originally dated as of November 24, 2010, among Petco Animal Supplies, Inc., as Borrower, the Lenders party thereto, Credit Suisse AG, as Administrative Agent and Collateral Agent, and the subsidiaries of Petco Animal Supplies, Inc. from time to time party thereto | |
| 10.6** | Pledge and Security Agreement, dated as of November 24, 2010, among Petco Animal Supplies, Inc., the subsidiaries of Petco Animal Supplies, Inc. from time to time party thereto, and Credit Suisse, AG, as Collateral Agent | |
II-8
Table of Contents
| Exhibit number |
Description of exhibit | |
| 10.7** | ABL Credit Agreement, dated as of April 19, 2013, among Petco Animal Supplies, Inc., the Lenders party thereto, Credit Suisse AG, as Administrative Agent, Wells Fargo Bank, National Association, as Collateral Agent, and the subsidiaries of Petco Animal Supplies, Inc. from time to time party thereto | |
| 10.8** | First Amendment, dated as of November 21, 2014, to the ABL Credit Agreement, originally dated April 19, 2013, among Petco Animal Supplies, the Lenders party thereto, Bank of America, N.A., as Administrative Agent (as the successor to Credit Suisse AG) and Co-Collateral Agent, Wells Fargo Bank, National Association, as Collateral Agent, and the subsidiaries of Petco Animal Supplies, Inc. from time to time party thereto | |
| 10.9** | Pledge and Security Agreement, dated as of April 19, 2013, among Petco Animal Supplies, Inc., the subsidiaries of Petco Animal Supplies, Inc. from time to time party thereto, Wells Fargo Bank, National Association, as Collateral Agent, and Credit Suisse AG, as Administrative Agent | |
| 10.10** | Construction Loan Agreement, dated March 20, 2015, by and between Petco Real Estate Holdings III, LLC and MUFG Union Bank, N.A. | |
| 10.11** | Deferred Compensation Plan (effective January 1, 2005) | |
| 10.12** | 2006 Key Management Incentive Award Plan (effective November 17, 2006) | |
| 10.13** | First Amendment to the 2006 Key Management Incentive Award Plan (effective September 21, 2011) | |
| 10.14** | Form of Non-Qualified Stock Option Agreement under the 2006 Key Management Incentive Award Plan | |
| 10.15** | 2006 Senior Executive Incentive Award Plan (effective November 17, 2006) | |
| 10.16** | First Amendment to the 2006 Senior Executive Incentive Award Plan (effective September 21, 2011) | |
| 10.17** | Form of Non-Qualified Stock Option Agreement under the 2006 Senior Executive Incentive Award Plan | |
| 10.18* | Form of Director Indemnification Agreement | |
| 10.19* | 2015 Equity Incentive Plan | |
| 10.20* | Cash Incentive Plan | |
| 21.1** | Subsidiaries of the Registrant | |
| 23.1 | Consent of KPMG LLP, Independent Registered Public Accounting Firm | |
| 23.2* | Consent of Ropes & Gray LLP (included in Exhibit 5.1) | |
| 24.1 | Power of Attorney (included in the signature pages to this Registration Statement) | |
| * | To be filed by amendment. |
| ** | Previously filed. |
II-9