Attached files
| file | filename |
|---|---|
| 8-K - FORM 8-K - FIFTH THIRD BANCORP | d88304d8k.htm |
 Fifth
Third Bank | All Rights Reserved Barclays
Global Financial Services Conference
Tayfun Tuzun Executive Vice President & Chief Financial Officer September 17, 2015 Exhibit 99.1 |
 Fifth
Third Bank Fifth Third Bank | All Rights Reserved
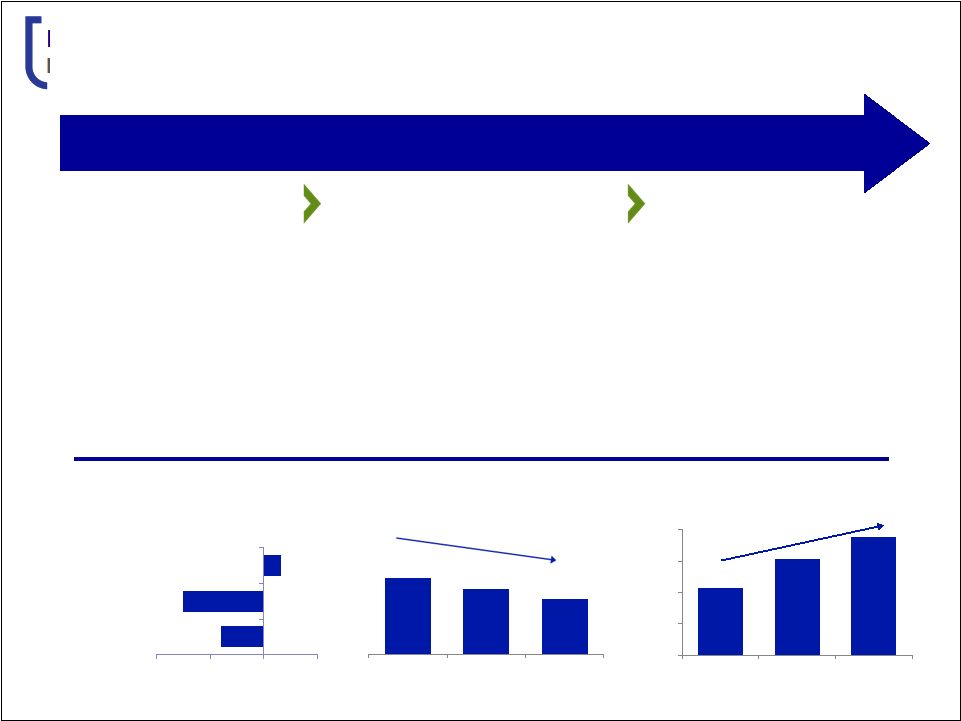
Through the Cycle Top Performance
2 Strong Core Performance Historical Strength of Fifth Third Balancing Shareholder Return with Growth Operational Excellence Building Infrastructure to meet New Regulatory Expectations Aggressively Managing Expenses across the Company Investing for the Future Accelerating Adaptation of Technology across the Company Identifying Opportunities to Expand Product & Service Offerings Balance Sheet Positioning Balanced Risk Management with Focus on Downside Risks Maintain Optimal Flexibility in Expectation for Continued Uncertainty |
 Fifth
Third Bank Fifth Third Bank | All Rights Reserved
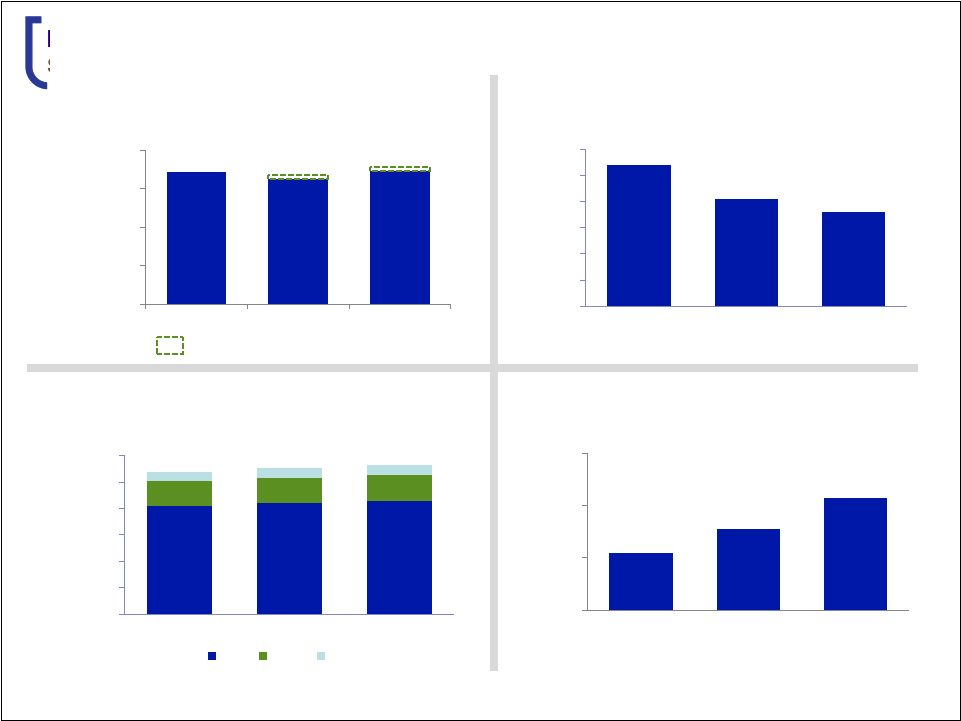
$41 $42 $43 $- $10 $20 $30 $40 $50 $60 4Q14 1Q15 2Q15 C&I CRE Lease Net Interest Income ($MM) Net Charge-offs ($MM) 1 1 4Q14 excludes an $87 million charge-off resulting from the transfer of certain residential mortgage loans to held for sale
2 Includes loans held for sale Commercial Loan Growth ($B) 2 Core Deposit Growth ($B) Lost Deposit Advance Revenue Strong Core Performance 3 $54 $55 $96 $98 $101 $92 $96 $100 $104 4Q14 1Q15 2Q15 $888 $852 $892 $22 $25 $200 $400 $600 $800 $1,000 4Q14 1Q15 2Q15 $104 $91 $86 $50 $60 $70 $80 $90 $100 $110 4Q14 1Q15 2Q15 $57 |
 Fifth
Third Bank Fifth Third Bank | All Rights Reserved
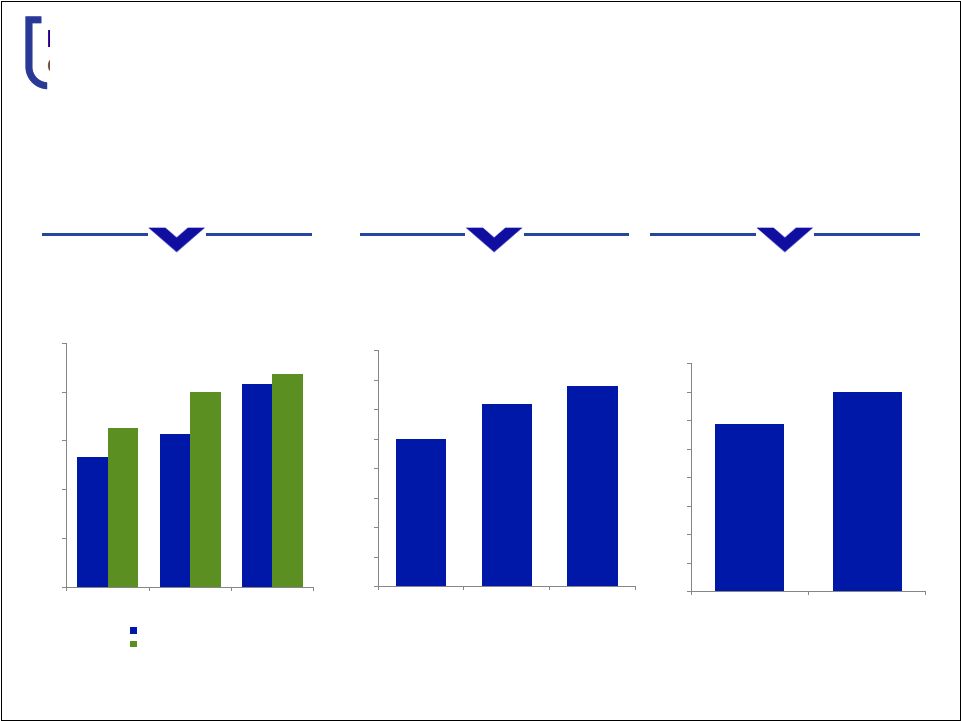
- 100 200 300 400 500 600 700 800 2Q13 2Q14 2Q15 $109 +10% 1H15 2H15 Estimated Source: SNL Financial; Fifth Third and Peer Average reflects average annual reported efficiency ratios for given time periods
Peer Average includes BBT, COF, CMA, HBAN, KEY, MTB, PNC, RF, STI, USB , WFC, and ZION
Operational Excellence
Historical Focus on Expense Management Investments in Risk & Compliance to meet New Regulatory Guidelines Increasing Technology Investment to Build Future Shareholder Value Compliance and Risk FTE Technology and Communications Expense ($MM) Efficiency Ratio Comparison 4 40% 45% 50% 55% 60% 65% 2003 - 2007 2008 - 2010 2011 - 2015 Fifth Third Bancorp Peer Average $50 $60 $70 $80 $90 $100 $110 $120 $130 |
 Fifth
Third Bank Fifth Third Bank | All Rights Reserved
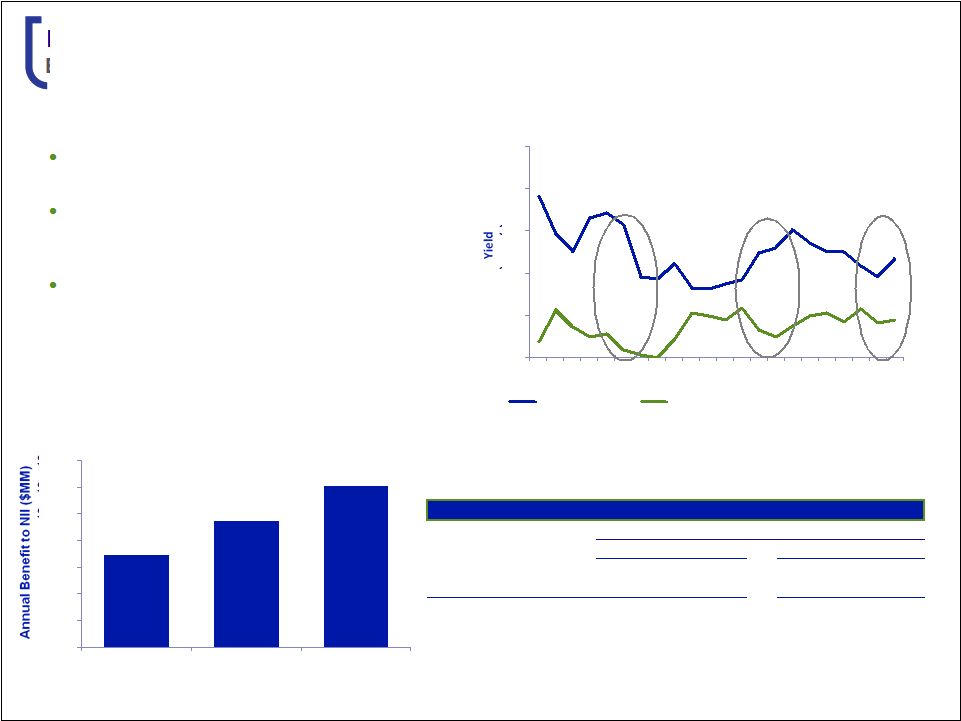
0% 1% 2% 3% 4% 5% 1Q10 4Q10 3Q11 2Q12 1Q13 4Q13 3Q14 2Q15 Balanced Interest Rate Risk Management 10yr Treasury Year 1 +100 bps ramp NII % change Deposit beta sensitivity Balance Sheet Positioned Well for Current Environment $69 $95 $121 $0 $20 $40 $60 $80 $100 $120 $140 70% 50% 30% Deposit Betas 5 Post-crisis balanced interest rate risk management Balance achieved by managing investment portfolio duration in conjunction with high portion of LIBOR-indexed loans Transparent disclosures about deposit rate sensitivity — Conservative deposit assumptions — No modeled re-pricing lag Change in Interest Rates +200 bps Ramp 1.63% 6.65% 4.63% +100 bps Ramp 0.89% 4.23% 2.39% Percent Change in NII (FTE) Betas 25% Lower 12.65% 7.23% 12 Months 13 to 24 Months 12 Months 13 to 24 Months ESTIMATED NII SENSITIVITY PROFILE 25 bps move in Fed Funds |
 Fifth
Third Bank Fifth Third Bank | All Rights Reserved
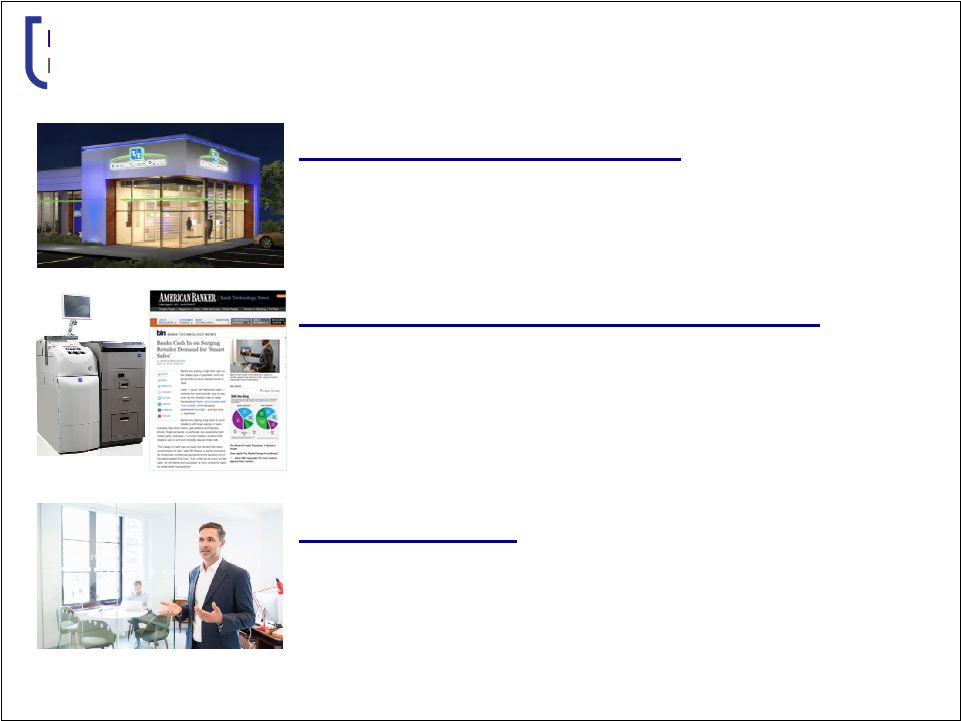
Investing for the Future
Transforming the Core Business
Building Capabilities in Commercial Banking
Talent Acquisition • Optimizing branch network – addressing evolving customer behavior, preferences and expectations • Supporting physical presence with advanced digital capabilities • Becoming a full solutions provider to our clients • Investing in products and services to widen the scope of our banking offers in retail and healthcare sectors • Adding deep industry expertise in both sales and credit 6 |
 Fifth
Third Bank Fifth Third Bank | All Rights Reserved
7.0 6.4 5.9 2Q13 2Q14 2Q15 • Drove digital adaption through mobile and ATM • Redefined staffing models & modified roles Optimize Re-engineer • Redesigning branch formats and changes in branch network • Launching universal bankers for sales and service • Expanding use of self-service (Smart ATMs) • Introducing new banking center technology Digitize • Build out marketing and analytics expertise • Leverage physical, virtual, and digital touch points to drive sales opportunities • Create paperless branch operations Retail Evolution 2012 Future of Fifth Third (16%) (30%) 7% (40%) (20%) 0% 20% Total Banking Center Staff Total Service FTE Total Sales FTE Retail Banking Headcount (Dec. 2012 - June 2015) Branch transactions Average monthly trans. in millions Transaction volume by ATM and Mobile channels 7 22% 31% 38% 0% 10% 20% 30% 40% 2Q13 2Q14 2Q15 |
 Fifth
Third Bank Fifth Third Bank | All Rights Reserved
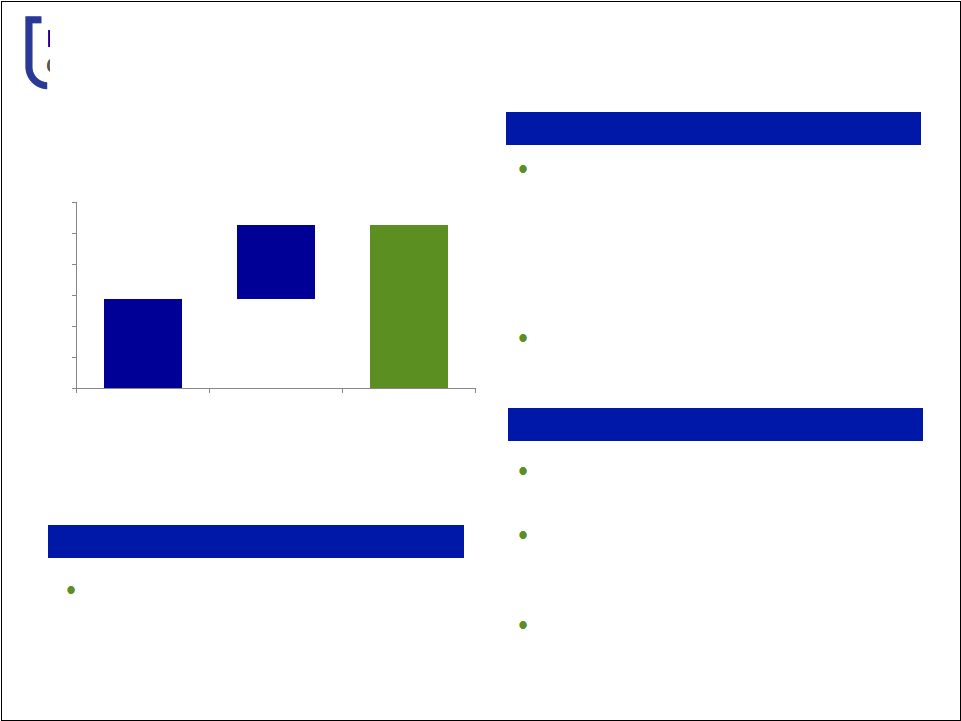
Expected Annual Expense Savings
$65MM expense savings from
changes to branch network to be
fully executed by mid-2016
Selection Criteria for Consolidations
Future Initiatives Digital self service center – faster, cheaper, better experience Integrated customer relationship data, offer, and omni-channel delivery Digitize branch sales and service operations Consumer Bank: State of the Art Banking Scorecard over 50 variables — Production volume trend — Transaction volume trend — Overlap with nearby branches — Customer loyalty scores Recent consolidation experience shows no material increase in household attrition 8 0 20 40 60 80 100 120 By Year-End By Mid-2016 Total Timeline of Branch Network Changes |
 Fifth
Third Bank Fifth Third Bank | All Rights Reserved
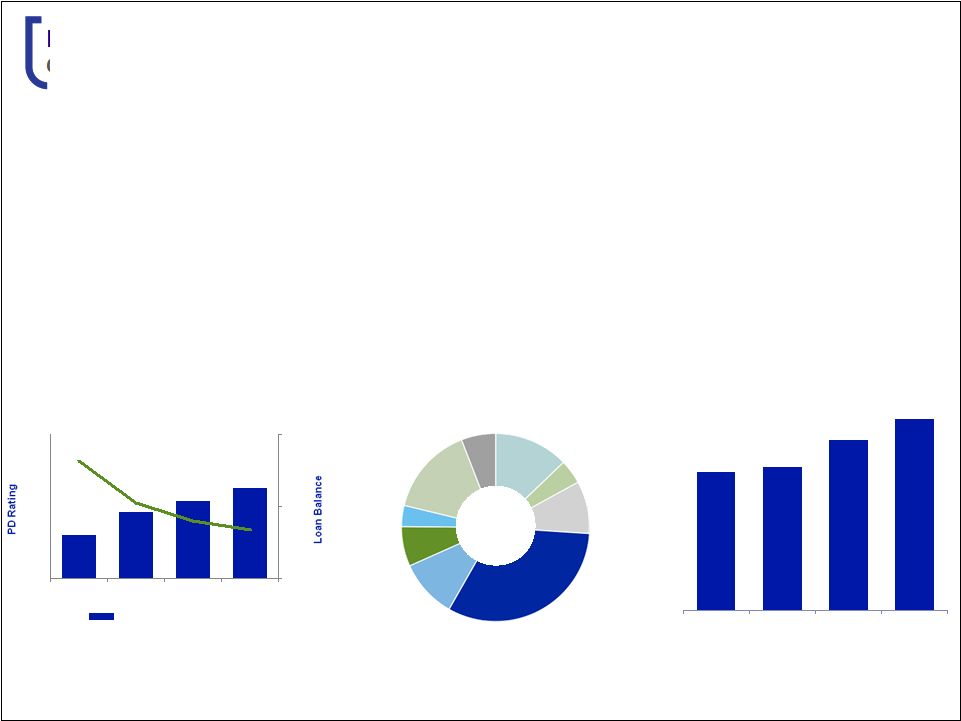
$30 $40 $50 5.0 5.5 6.0 6.5 2012 2013 2014 Jul-15 C&I Loan Balances ($B) Commercial Bank: Scale and Scope 10% 32% 9% 4% 13% 6% 15% 4% 7% International Large Corporate Mid Corporate Healthcare Middle Market CRE PD Improvement with C&I Growth Growth in Lead Relationships² CAGR +10% Equipment Finance Specialty Learning Industry Verticals & Other 1 9 • #9 in C&I loans, #9 in treasury management, #10 in commercial deposits nationally
• Diversified revenue composition • Focus on verticals and industry-specific solutions via dedicated solution specialists
• Changing credit profile post-crisis in-line with our risk appetite and increased focus on mid-
and large-corporate relationships
• Increased use of technology and data analytics for product and business profitability
• Driving lead relationships by delivering expert advice via a coordinated team of sales, credit,
and specialized services and solutions
$1.2B
1H15 Revenue 1 Other includes energy and retail verticals 2 Does not reflect segmentation changes in prior periods Source: SNL, E&Y 2014 National Rankings 26% 27% 32% 36% 2012 2013 2014 Jul-15 |
 Fifth
Third Bank Fifth Third Bank | All Rights Reserved
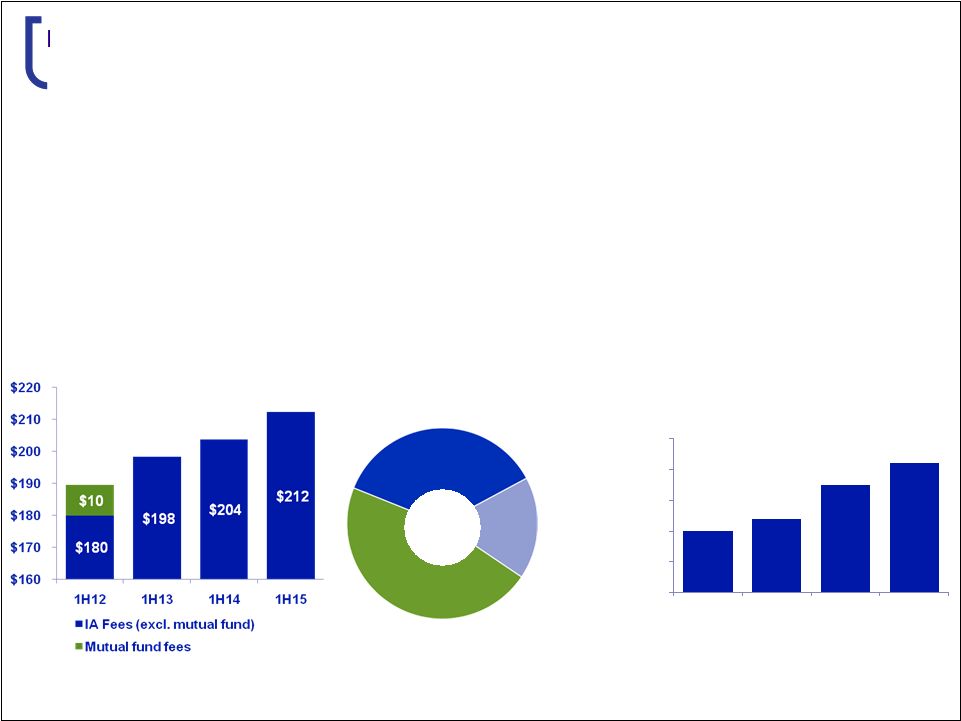
Diversified Business Mix
1 Institutional services provides investment management, 401(k), and custody services for corporations, financial institutions and not-for profits Wealth Management Fee Growth ($MM) Revenue per Household ($K) Private Bank 47% Institutional Services 1 17% Retail Brokerage 36% $270 MM 1H15 Revenue 10 • Provides for significant cross-sell opportunity with growth that outpaces the retail channel
• Focus on superior client experience — Use of digital transformation — Building a higher touch model • Innovating estate planning and settlement business for future wealth transfer opportunities • Expanding our portfolio of capabilities $5 $10 $15 $20 $25 $30 1H12 1H13 1H14 1H15 Wealth Management: Capitalizing on Retail & Commercial Partnerships |
 Fifth
Third Bank Fifth Third Bank | All Rights Reserved
2.5% 5.2% Industry Fifth Third 1 Excludes earnings credit Source: Industry information from Oliver Wyman Treasury management fees 1 (2012–2014 CAGR) 2x Credit Card 37% 38% 11% 14% Debit Card Commercial Card & Other TM Consumer Payments (51%) Commercial Payments (49%) 1H15 Revenue 11 • Traditional strength of Fifth Third • Diversified revenue streams in consumer and commercial businesses • Industry leading payments revenue • Increasing specialized expertise in healthcare and retail verticals • Targeted third party investments to enhance product offers $400 $410 $420 $430 $440 $450 $460 $470 $480 1H13 1H14 1H15 Total Payments Revenue ($MM) Payments & Commerce Solutions: Capital Efficient Relationship Profitability Growth |
 Fifth
Third Bank Fifth Third Bank | All Rights Reserved
22.8% ownership stake; Market value net of carrying value 1 1 Market value as of 9/15/15 2 As of 6/30/15 Note: Incremental TRA generated by future share sales assumes a 36% tax rate and $45 per share
Potential remaining TRA-related gross cash flows TRA-related gross cash flows recorded by Vantiv 12 Significant Unrealized Value $597M 2 $1.6B Vantiv, Inc: Hidden Value |
 Fifth
Third Bank Fifth Third Bank | All Rights Reserved
Through the Cycle Top Performance
13 Strong Core Performance Operational Excellence Well-managed balance sheet positioning Investing for the Future |
 Fifth
Third Bank Fifth Third Bank | All Rights Reserved
This release contains statements that we believe are “forward-looking statements” within the meaning of Section 27A of the Securities Act of 1933, as amended, and Rule 175
promulgated thereunder, and Section 21E of the Securities Exchange Act of 1934,
as amended, and Rule 3b-6 promulgated thereunder. These statements relate to our financial condition, results of operations, plans, objectives, future performance or business. They usually can be identified by the use of
forward-looking language such as “will likely result,” “may,”
“are expected to,”
“anticipates,” “potential,
” “estimate,” “forecast,
” “projected,” “intends
to,” or may include other similar words or phrases
such as “believes,” “plans,”
“trend,” “objective,
” “continue,” “remain,”
or similar expressions, or future or conditional verbs such as “will,” “would,”
“should,” “could,”
“might,” “can,”
or similar verbs. You should not place
undue reliance on these statements, as they are subject to risks and
uncertainties, including but not limited to the risk factors set forth in our most recent Annual Report on Form 10-K as updated from time to time by our Quarterly Reports on Form 10-Q. When considering these forward-looking statements, you should
keep in mind these risks and uncertainties, as well as any
cautionary statements we may make. Moreover, you should treat these statements as speaking only as of the date they are made and based only on information then actually known to us. There is a risk that additional information may arise during the
company’s close process or as a result of subsequent events that would require the company to make adjustments to the financial information contained herein. There are a number of important factors that could cause future results to differ materially from historical performance and these
forward-looking statements. Factors that might cause such a
difference include, but are not limited to: (1) general economic conditions and weakening in the economy, specifically the real estate market, either nationally or in the states in which Fifth Third, one or more acquired entities and/or the combined company do business, are less favorable than expected; (2)
deteriorating credit quality; (3) political developments, wars or
other hostilities may disrupt or increase volatility in securities markets or other economic conditions; (4) changes in the interest rate environment reduce interest margins; (5) prepayment speeds, loan origination and sale volumes, charge-offs and loan loss provisions; (6) Fifth Third’s ability to maintain required capital levels and adequate sources of funding and liquidity; (7) maintaining capital requirements and adequate sources of funding and liquidity may limit Fifth Third’s operations and potential growth; (8) changes and trends in capital markets; (9) problems encountered by larger or similar financial institutions may adversely affect the banking industry and/or Fifth
Third; (10) competitive pressures among depository institutions
increase significantly; (11) effects of critical accounting policies and judgments; (12) changes in accounting policies or procedures as may be required by the Financial Accounting Standards Board (FASB) or other regulatory agencies; (13) legislative or regulatory changes or actions, or significant
litigation, adversely affect Fifth Third, one or more acquired
entities and/or the combined company or the businesses in which Fifth Third, one or more acquired entities and/or the combined company are engaged, including the Dodd-Frank Wall Street Reform and Consumer Protection Act; (14) ability to maintain favorable ratings from rating agencies; (15) fluctuation of
Fifth Third’s stock price; (16) ability to attract and retain key personnel; (17) ability to receive dividends from its subsidiaries; (18) potentially dilutive effect of future acquisitions on
current shareholders’ ownership of Fifth Third; (19) effects of accounting or financial results of one or more acquired entities; (20) difficulties from Fifth Third’s investment in, relationship with, and nature of the operations of Vantiv, LLC; (21) loss of income from any sale or potential sale of businesses that could have an adverse effect on Fifth Third’s earnings and future growth; (22) difficulties in separating the operations of any branches or other assets divested; (23) inability to achieve expected benefits from branch consolidations and planned sales within
desired timeframes, if at all; (24) ability to secure
confidential information and deliver products and services through the use of
computer systems and telecommunications networks; and (25) the impact of reputational risk created by these developments on such matters as business generation and retention, funding and liquidity.
You should refer to our periodic and current reports filed with the Securities
and Exchange Commission, or “SEC,” for further information on other factors, which could cause actual results
to be significantly different from those expressed or implied by these
forward-looking statements. Cautionary Statement
14 |