Attached files
| file | filename |
|---|---|
| EX-32.2 - EXHIBIT 32.2 - Emerge Energy Services LP | a10ka141231-q4xex322.htm |
| EX-23.3 - EXHIBIT 23.3 - Emerge Energy Services LP | a10ka141231-q4xex233.htm |
| EX-23.2 - EXHIBIT 23.2 - Emerge Energy Services LP | a10ka141231-q4xex232.htm |
| EX-32.1 - EXHIBIT 32.1 - Emerge Energy Services LP | a10ka141231-q4xex321.htm |
| EX-23.1 - EXHIBIT 23.1 - Emerge Energy Services LP | a10ka141231-q4xex231.htm |
| EX-31.1 - EXHIBIT 31.1 - Emerge Energy Services LP | a10ka141231-q4xex311.htm |
| EX-31.2 - EXHIBIT 31.2 - Emerge Energy Services LP | a10ka141231-q4xex312.htm |
Use these links to rapidly review the document
UNITED STATES
SECURITIES AND EXCHANGE COMMISSION
Washington, D.C. 20549
Form 10-K/A
(Amendment No. 1)
ý ANNUAL REPORT PURSUANT TO SECTION 13 OR 15(d) OF THE SECURITIES EXCHANGE ACT OF 1934
For the fiscal year ended December 31, 2014
OR
¨ TRANSITION REPORT PURSUANT TO SECTION 13 OR 15(d) OF THE SECURITIES EXCHANGE ACT OF 1934
For the transition period from to
Commission File No. 001-35912
EMERGE ENERGY SERVICES LP
(Exact name of registrant as specified in its charter)
Delaware | 90-0832937 | |
(State or other jurisdiction of incorporation or organization) | (I.R.S. Employer Identification No.) | |
180 State Street, Suite 225, Southlake, Texas 76092 | (817) 865-5830 | |
(Address of principal executive offices) | (Registrant’s telephone number, including area code) | |
Securities registered pursuant to Section 12(b) of the Act:
Title of Each Class | Name of Each Exchange On Which Registered | |
Common Units Representing Limited Partner Interests | New York Stock Exchange | |
Securities registered pursuant to Section 12(g) of the Act: None
Indicate by check mark if the registrant is a well-known seasoned issuer, as defined in Rule 405 of the Securities Act. ý Yes o No
Indicate by check mark if the registrant is not required to file reports pursuant to Section 13 or Section 15(d) of the Act. o Yes ý No
Indicate by check mark whether the registrant (1) has filed all reports required to be filed by Section 13 or 15(d) of the Securities Exchange Act of 1934 during the preceding 12 months (or for such shorter period that the registrant was required to file such reports), and (2) has been subject to such filing requirements for the past 90 days. ý Yes o No
Indicate by check mark whether the registrant has submitted electronically and posted on its corporate Web site, if any, every Interactive Data File required to be submitted and posted pursuant to Rule 405 of Regulation S-T (§ 232.405 of this chapter) during the preceding 12 months (or for such shorter period that the registrant was required to submit and post such files). ý Yes o No
Indicate by check mark if disclosure of delinquent filers pursuant to Item 405 of Regulation S-K is not contained herein, and will not be contained, to the best of registrant's knowledge, in definitive proxy or information statements incorporated by reference in Part III of this Form 10-K or any amendment to this Form 10-K. o
Indicate by check mark whether the registrant is a large accelerated filer, an accelerated filer, a non-accelerated filer, or a smaller reporting company. See the definitions of “large accelerated filer,” “accelerated filer,” and “smaller reporting company” in Rule 12b-2 of the Exchange Act. (Check one)
Large-Accelerated Filer x | Accelerated Filer o | Non-Accelerated Filer o | Smaller Reporting Company o | |||
Indicate by check mark whether the registrant is a shell company (as defined in Rule 12b-2 of the Exchange Act). o Yes ý No
As of June 30, 2014, the last business day of the registrant's second fiscal quarter of 2014, the aggregate market value of the registrant's common units held by non-affiliates of the registrant was $1,644,038,050 based on the closing price as reported on the New York Stock Exchange composite tape on that date.
As of February 23, 2015, 23,718,961 common units were outstanding.
DOCUMENTS INCORPORATED BY REFERENCE: None
EXPLANATORY NOTE
The Registrant has prepared this Amendment No. 1 (“Amendment”) on Form 10-K/A to amend its Annual Report on Form 10-K for the fiscal year ended December 31, 2014 (the “Original Form 10-K”), which was originally filed on March 2, 2015. The Registrant is filing this Amendment in response to a comment letter received from the Securities and Exchange Commission (the “SEC”). This Amendment is being filed solely to (i) amend Item 9A. Controls and Procedures to include the certifying officers’ conclusions as to the effectiveness of disclosure controls and procedures as required under Item 307 of Regulation S-K, (ii) revise the certifications on Exhibits 31.1 and 31.2 to include additional language in paragraph 4 as required by Item 601(b)(31) of Regulation S-K and (iii) revise the certifications on Exhibits 31.1, 31.2, 32.1 and 32.2 to refer to the Registrant’s Annual Report on Form 10-K.
Except as described above, the Registrant has not modified or updated disclosures made in the Original Form 10-K in this Amendment. Accordingly, this Amendment does not reflect events occurring after the filing of the Registrant's Original Form 10-K or modify or update any disclosures affected by subsequent events. Accordingly, this Amendment should be read in conjunction with the Original Form 10-K and the Registrant’s other filings with the SEC.
TABLE OF CONTENTS | ||
Page | ||
2
CAUTIONARY STATEMENT ABOUT FORWARD-LOOKING STATEMENTS
Certain statements and information in this Annual Report on Form 10-K may constitute “forward-looking statements.” The words “believe,” “expect,” “anticipate,” “plan,” “intend,” “foresee,” “should,” “would,” “could” or other similar expressions are intended to identify forward-looking statements, which are generally not historical in nature. These forward-looking statements are based on our current expectations and beliefs concerning future developments and their potential effect on us. While management believes that these forward-looking statements are reasonable as and when made, there can be no assurance that future developments affecting us will be those that we anticipate. All comments concerning our expectations for future revenues and operating results are based on our forecasts for our existing operations and do not include the potential impact of any future acquisitions. Our forward-looking statements involve significant risks and uncertainties (some of which are beyond our control) and assumptions that could cause actual results to differ materially from our historical experience and our present expectations or projections. Known material factors that could cause our actual results to differ from those in the forward-looking statements are those described in Part I, Item 1A. Risk Factors.
Readers are cautioned not to place undue reliance on forward-looking statements, which speak only as of the date hereof. We undertake no obligation to publicly update or revise any forward-looking statements after the date they are made, whether as a result of new information, future events or otherwise.
3
GLOSSARY OF SELECTED TERMS
16/30 frac sand: Sand that passes through a sieve with 16 holes per linear inch (16 mesh) and is retained by a sieve with 30 holes per linear inch (30 mesh).
20/40 frac sand: Sand that passes through a sieve with 20 holes per linear inch (20 mesh) and is retained by a sieve with 40 holes per linear inch (40 mesh).
30/50 frac sand: Sand that passes through a sieve with 30 holes per linear inch (30 mesh) and is retained by a sieve with 50 holes per linear inch (50 mesh).
40/70 frac sand: Sand that passes through a sieve with 40 holes per linear inch (40 mesh) and is retained by a sieve with 70 holes per linear inch (70 mesh).
100 mesh frac sand: Sand that passes through a sieve with 100 holes per linear inch (100 mesh).
Acid solubility: A measure of how easily a substance dissolves into a low pH liquid solvent. Generally, the lower the acid solubility of a proppant, the more likely it is to retain its integrity when subjected to a low pH environment, which is often encountered in hydraulic fracturing of high-sulfur crude oil and natural gas deposits.
API: American Petroleum Institute.
Backwardation: A market situation in which the futures price of a commodity is below the expected future spot price. Contango is the opposite market condition.
Barrel: An amount equal to 42 gallons.
Biodiesel: A domestic, renewable fuel for diesel engines derived from natural oils, and which is comprised of mono-alkyl esters of long chain fatty acids derived from vegetable oils or animal fats, designated B-100 and meeting the requirements of ASTM D 6751, “Standard Specification for Biodiesel Fuel (B-100) Blend Stock for Distillate Fuels.”
Ceramics: Artificially manufactured proppants of consistent size and sphere shape that offers a high crush strength.
Contango: A market situation in which the futures price of a commodity is higher than the expected future spot price. The opposite market condition is backwardation.
Crush strength: Ability to withstand high pressures. Crush strength is measured according to the pounds per square inch of pressure that can be withstood before the proppant breaks down into finer granules.
Conductivity: A measure of how well a substance travels in a liquid medium. Generally, the smoother the surface of a proppant, the further it can travel when carried in a fracking solution to penetrate fissures in the source rock.
Dry plant: An industrial site where slurried sand product is fed through a dryer and screening system to be dried and screened in varying size gradations. The finished product that emerges from the dry plant is then stored in silos or stockpiles before being transported to customers or is immediately loaded onto a conveyance for transportation.
Frac sand: A proppant used in the completion and re-completion of oil and natural gas wells to stimulate and maintain oil and natural gas production through the process of hydraulic fracturing.
GAAP: Generally accepted accounting principles in the United States.
Hydraulic fracturing: The process of pumping fluids, mixed with granular proppants, into a geological formation at pressures sufficient to create fractures in the hydrocarbon-bearing rock.
Hydrotreater: A processing unit that removes sulfur and other impurities from raw or refined hydrocarbons through a catalyst or other means that combines the impurities with hydrogen. The resulting byproducts are then removed from the hydrocarbon stream, through a combination of temperature and pressure, and recycled.
ISO: International Organization for Standardization.
Low sulfur diesel: Diesel fuel that has a sulfur content of greater than 15 ppm and a maximum sulfur content of 500 ppm.
Mesh size: Measurement of the size of a grain of sand indicating it will pass through a sieve of a certain size.
Northern White sand: A monocrystalline sand with greater sphericity, roundness and low acid solubility, enabling higher crush strengths and conductivity, which is found primarily in Wisconsin's Jordan, Mt. Simon, St. Peter and Wonewoc formations.
Overburden: Layers of soil, clay and other waste covering a mineral deposit.
ppm: Parts per million.
4
Proppant: A sized particle mixed with fracturing fluid to hold fractures open after a hydraulic fracturing treatment.
Renewable Identification Numbers (“RINs”): Serial numbers assigned to batches of biofuel for the purpose of tracking its production, use, and trading as required under Energy Independence and Security Act of 2007.
Reserves: Natural resources, including sand, that can be economically extracted or produced at the time of determination based on relevant legal, economic and technical considerations.
Resin-coated sand: Raw sand that is coated with a flexible resin that increases the sand's crush strength and prevents crushed sand from dispersing throughout the fracture.
Roundness: A measure of how round the curvatures of an object are. The opposite of round is angular. It is possible for an object to be round but not spherical (e.g., an egg-shaped particle is round, but not spherical). When used to describe proppant, roundness is a reference to having a curved shape which promotes hydrocarbon flow, as the curvature creates a space through which the hydrocarbons can flow.
Sphericity: A measure of how well an object is formed in a shape where all points are equidistant from the center. The more spherical a proppant, the more highly conductive it is because it creates larger gaps that promote maximum hydrocarbon flow.
Shale Play: A geological formation that contains petroleum and/or natural gas in nonporous rock that requires special drilling and completion techniques.
Transmix: The liquid interface, or fuel mixture, that forms in refined product pipelines between batches of different fuel types.
Turbidity: A measure of the level of contaminants, such as silt and clay, in a sample.
Ultra low sulfur diesel: Diesel Fuel that has a maximum sulfur content of 15 ppm.
Unit train: A train in which all of its cars are shipped from the same origin to the same destination, without being split up or stored en route.
Wet plant: An industrial site where quarried sand is fed through a stone breaking machine, crusher system and then slurried into the plant. The sand ore is then scrubbed and hydrosized by log washers or rotary scrubbers to remove the deleterious materials from the ore, and then separated using a vibrating screen and waterway system to generate separate 100 mesh and +70 mesh stockpiles, providing a uniform feedstock for the dryer. The ultra-fine materials are typically sent to a mechanical thickener, and eventually to settling ponds.
5
PART I
ITEM 1. BUSINESS
Emerge Energy Services LP (“Emerge”) is a Delaware limited partnership that completed its initial public offering (“IPO”) on May 14, 2013 to become a publicly traded partnership. The combined entities of Superior Silica Sands LLC (“SSS”), a Texas limited liability company, and Allied Energy Company LLC (“AEC”), an Alabama limited liability company, represent the predecessor for accounting purposes (the “Predecessor”) of Emerge.
Immediately prior to the closing of the IPO, Insight Equity Management Company LLC and its affiliated investment funds and its controlling equity owners, Ted W. Beneski and Victor L. Vescovo (collectively “Insight Equity”) conveyed all of the interests in SSS and AEC to the Partnership as a capital contribution, and the Partnership conveyed its interests in SSS and AEC to the Partnership's subsidiary Emerge Energy Services Operating LLC (“Emerge Operating”), a Delaware limited liability company. In addition, the Partnership formed Emerge Energy Distributors Inc. (“Distributor”), a Delaware corporation, and purchased Direct Fuels LLC (“Direct Fuels”), a Delaware limited liability company, through a combination of cash, issuance of common units, and assumption of debt, and the Partnership conveyed all of the interest in Direct Fuels to Emerge Operating. Therefore, the historical financial statements contained in this Form 10-K reflect the combined assets, liabilities and operations of the Partnership, SSS and AEC for periods ending before May 14, 2013 and the assets, liabilities and operations of the Partnership and all of its subsidiaries for periods beginning on or after May 14, 2013.
References to the “Partnership,” “we,” “our” or “us” when used for dates or periods ended prior to the IPO, refer collectively to the Predecessor. References to the “Partnership,” “we,” “our” or “us” when used for dates or periods ended on or after the IPO, refer collectively to Emerge and all of its subsidiaries.
Overview
We are a publicly-traded limited partnership formed in 2012 by management and affiliates of Insight Equity to own, operate, acquire and develop a diversified portfolio of energy service assets.
Our current operations are organized into two service-oriented business segments: our Sand segment and our Fuel segment. Through our Sand segment, we are engaged in the businesses of mining, processing, and distributing silica sand, a key input for the hydraulic fracturing of oil and natural gas wells. Our Fuel segment processes transmix, distributes refined motor fuels and renewable fuels, operates bulk motor fuel storage terminals, and provides complementary services. We believe this diverse set of operations provides a stable cash flow profile when compared to companies with only one line of business.
We conduct our Sand operations through our subsidiary SSS and our Fuel operations through our subsidiaries Direct Fuels, AEC and Distributor. We believe that our subsidiary brands, especially our SSS brand, have significant name recognition and a strong reputation with our customers.
Our principal offices are located at 180 State Street, Suite 225, Southlake, Texas 76092. Our telephone number is (817) 865-5830 and our website address is www.emergelp.com.
Business Strategies
The primary components of our business strategy are:
• | Focus on business results and total distributions. We focus on optimizing our business results and maximizing total distributions. The board of directors of our general partner adopted a policy under which distributions for each quarter are equal to the amount of available cash we generate each quarter. In addition, our general partner has a non-economic general partner interest and no incentive distribution rights, and, accordingly, all of our unitholders, including our sponsor, receive 100% of our cash distributions on a pro rata basis. |
• | Seek contractual cash flow stability. In our Sand segment, we intend to continue securing long-term take-or-pay, fixed-volume, and efforts-based contracts with existing and new customers in order to cover the substantial majority of our production capacity. Currently, 100% of our permitted production capacity at our four operating dry plant facilities is covered by long-term contracts, and 77% of our sales in the year ended December 31, 2014 were to customers currently under contract. As of December 31, 2014, we had 6.9 million tons under long-term contract with a weighted average remaining term of four years at our existing facilities, and an additional 1.5 million tons under contract that are committed to future facilities. In our Fuel segment, our contract structure is designed to capture a stable margin, as the price differential between the refined products indices at which we purchase transmix and wholesale fuel and the sales price of the refined products fluctuates in a narrow range. In addition, we typically resell our refined products within 7 to 10 days after acquiring our transmix, wholesale fuel and other feedstock supply, which reduces our exposure to fluctuations in the |
1
underlying indices. We also seek to lease additional space in our terminal tanks to refiners and large fuel wholesalers, where we can capture both fixed monthly margins and fixed per-gallon throughput margins that are independent of the underlying commodity price. In addition, we enter into financial hedging arrangements to partially mitigate our direct exposure to commodity price and market index fluctuations.
• | Capitalize on compelling industry fundamentals. We believe the frac sand market offers attractive long-term growth fundamentals, and we expect to continue to position ourselves as a producer of coarse, high-quality “Northern White” frac sand located in Wisconsin's Jordan, St. Peter, Mt. Simon and Wonewoc formations. Over the past several years, the demand for frac sand in the United States and Canada has grown significantly, primarily as a result of increased horizontal drilling, technological advances that allowed for the development of many unconventional resource formations, increased proppant use per well and cost advantages over other proppants such as resin coated sand and ceramic alternatives. In particular, the demand for coarse Northern White sand, such as the type we mine and sell from our Wisconsin facilities, is very strong among end users who are focused on the extraction of oil and liquids-rich natural gas. We believe frac sand supply will continue to be constrained by a variety of factors, including but not limited to: (i) the difficulty in finding reserves suitable for use as frac sand, which are largely limited to select areas of the United States and which must meet the technical specifications of the American Petroleum Institute (“API”); (ii) challenges associated with locating contiguous reserves of frac sand sufficient to justify the capital investment required to develop a mine and processing plant; (iii) securing necessary local, state and federal permits required for operations; and (iv) the ability of producers to provide comprehensive logistics and delivery solutions for customers. We further believe that as customers continue to refine their approach to the frac sand market, they will continue to gravitate toward the leading producers of frac sand, including Emerge Energy, which should give us the opportunity to strengthen our market position. |
• | Capitalize on organic growth opportunities and optimize existing assets. We intend to focus on organic growth opportunities that complement our existing asset base or provide attractive returns in new geographic areas or business lines. In our Sand segment, we have three Northern White dry plant facilities operating at or near capacity, while our facility in Kosse, Texas is running at well over half capacity. We are also constructing a fifth production complex in Wisconsin from which we expect to begin selling sand in the second half of 2015. In addition, we continue to work on other greenfield expansion opportunities. In our Fuel segment, we believe there are several opportunities to contract additional transmix supplies, which we can process using existing excess capacity, and increase both wholesale and terminal volumes. We are also planning to build hydrotreaters at our two fuel terminals to allow us to process low sulfur transmix into ultra-low sulfur diesel. |
• | Access new and adjacent markets using existing capabilities. We are exploring and will continue to explore opportunities to expand our businesses into new markets by leveraging our existing operations and our historical experiences. In our Sand segment, we will continue to pursue opportunities created by the demand for our reserves and to use available surplus processing and storage capacity in order to meet the needs of our customers. We also developed a total supply chain solution for our customers, designed to deliver sand anywhere from the railcar at the plant to within 60 miles of the wellhead. We believe this supply chain solution provides our customers with a streamlined order process that yields a lower total delivered product cost while generating incremental earnings for us and enabling us to reach a broader set of customers. For example, given our multiple railroad, trucking and barging logistics capabilities, we have started to explore potential sales opportunities in Central and South American countries. We have also partnered with dedicated logistics partners in Mexico in anticipation of that market opening up to Northern White frac sand over the next several years. If such opportunities materialize, we would expect to select our customers in those countries by employing the same disciplined financial criteria that we have used with respect to our existing customers. In our Fuel segment, we built the capability to blend additives into our refined products, which allows us to handle branded petroleum products in addition to unbranded products, and which we believe was critical to allow us to source new terminaling customers in the past two years. We also intend to leverage our existing customer relationships to expand our footprint in Dallas-Fort Worth and Birmingham and their adjacent markets. |
• | Grow business through strategic and accretive business or asset acquisitions. We plan to selectively pursue accretive acquisitions in our areas of operation that we believe will allow us to realize operational efficiencies by capitalizing on our existing infrastructure, personnel and commercial relationships in energy services, and we may also seek acquisitions in new geographic areas or complementary business lines. For example, in 2014 we acquired a mine and wet plant from a supplier that have both significantly decreased our operating costs and allowed us to take market share from our competition. We have identified several highly attractive frac sand deposits and developments in properties adjacent to or in close proximity to our existing Wisconsin operations, allowing for the opportunity to contract additional reserves and additional finished product capacity. We also believe that we can replicate our transmix, wholesale and terminal business activities successfully in other regions of the United States. |
• | Maintain financial strength and flexibility. We intend to maintain financial strength and flexibility to enable us to pursue our growth strategy, including acquisitions, organic growth and asset optimization opportunities as they arise. As of |
2
December 31, 2014, we had $6.9 million of cash on hand and $120.4 million of additional liquidity available under our revolving credit facility. We plan to spend $110 million of capital expenditures in 2015, which we intend to fund with our existing credit facilities and cash from operations, including utilizing an unexercised $150 million accordion under our revolving credit facility.
Competitive Strengths
We believe that we are well positioned to successfully execute our business strategies because of the following competitive strengths:
• | High quality, strategically located assets. We currently operate several scalable frac sand production facilities in and around Barron County, Wisconsin and Kosse, Texas. Our facilities in Wisconsin are supported by approximately 105.5 million tons of proven recoverable sand reserves and our facility in Texas is supported by approximately 27.8 million tons of proven recoverable sand reserves. We believe that our Wisconsin reserves provide us access to a disproportionate amount of coarse sand (16/30, 20/40 and 30/50 mesh sands) compared to other Northern White deposits located in Wisconsin's Jordan, Mt. Simon, St. Peter and Wonewoc formations. Our sample boring data and production data indicated that our Wisconsin reserves contain deposits of nearly 35% 40 mesh or coarser substrate, with our Barron reserves being comprised of more than 60% 50 mesh or coarser substrate. We are also one of a select number of mine operators that can offer commercial amounts of 16/30 mesh sand, the coarsest grade of widely-used frac sand on the market, of which we believe we are the market's largest supplier. Our access to coarse sand provides us with lower processing costs relative to mines with finer sand reserves and enables us to better serve the current levels of high demand for coarse frac sand that is related to increased hydraulic fracturing activities focused on the recovery of oil and liquids-rich gas in the United States. |
Our transmix facilities are centrally located in the Dallas-Fort Worth and Birmingham metropolitan areas. The population in these areas is forecasted to increase at a weighted growth rate greater than the national average between 2010 and 2030, which is expected to drive incremental demand for the products and services we offer through our Fuel segment. Because pipelines typically represent the most economical means of transporting petroleum products, proximity to refined products pipelines is critical to the economic success of our transmix, wholesale and terminal operations. We are able to receive products via two different pipelines owned by the Explorer Pipeline Company and one owned by a major independent refiner at our facility in the Dallas-Fort Worth metropolitan area and via the Plantation and Colonial pipelines at our Birmingham facility.
• | Stable cash flows. In our Sand segment, we currently sell our products primarily under long-term supply agreements under which our customers commit for a specified term to purchase a minimum volume of sand annually at a pre-determined price. A portion of our supply agreements are take-or-pay contracts under which the customer will be obligated to pay us an amount designed to compensate us for lost margins for the applicable contract year on any minimum annual volumes that are not purchased by that customer. Total sales to customers currently under long-term contracts, including take-or-pay, fixed-volume and efforts-based contracts, accounted for 77% of our total Sand segment sales in 2014. |
In our Fuel segment, our contract structure is designed to capture a stable margin, as the price differential between the refined products indices at which we purchase transmix and wholesale supply and the sales price of the refined products fluctuate in a fairly narrow range. While a meaningful portion of our transmix purchases is conducted on a spot basis, we currently purchase 69% of our supply of transmix pursuant to contracts with terms ranging from 12 to 48 months, with a volume-weighted average remaining duration of 22 months as of December 31, 2014. We use a hedging program that is designed to further mitigate the effects of our holding period, which is typically 7-10 days. In addition, we have throughput agreements with major refining and fuel marketing companies with terms of up to 33 months, which provide stable, fee-based revenue.
• | Intrinsic logistics advantage. In our Sand segment, the logistics capabilities of our Wisconsin facilities enable us to serve all major United States and Canadian oil and natural gas producing basins, as well as provide us with economical access to Mexico and South America. Our New Auburn facility has 4.5 miles of on-site rail track linked to a rail line owned by Union Pacific and our Barron facility has nearly nine miles of on-site rail track tied into a Canadian National rail line. Between our two Wisconsin rail yards, we have storage space for over 1,100 railcars. We also utilize a third rail loadout facility near our production facilities that has direct access to four class one rail lines: the BNSF, the Canadian National, the Canadian Pacific, and the Union Pacific. As of December 31, 2014, we had a total of 5,099 railcars in our fleet, including 1,764 dedicated customer cars and 3,335 railcars under lease with a weighted average remaining term of 4.4 years. We have another 2,423 railcars under order for delivery in 2015 and an additional 2,459 railcars on order for delivery in 2016 and early 2017. As of December 31, 2014, we had 13 transload facilities in North America, each of which is positioned to serve a number of our target markets, and over half of which are capable of receiving unit trains. |
Our logistics capabilities enable efficient loading of sand and minimize railcar turnaround times, and our Wisconsin dry plant facilities are able to accommodate unit trains. Our production facilities are able to accommodate and stage multiple
3
unit trains, and five of our transload facilities are capable of receiving unit trains. In addition to our transload facilities, we also deliver to our customers’ transload facilities. We believe we are one of a small number of frac sand producers connected to more than one Class One rail line, and this provides us with the capability to serve virtually all North American shale plays economically using a single‑line haul, which reduces transit time and freight cost for our customers. We also have economical means to transload from one production facility to another, allowing us additional flexibility to utilize our access to multiple Class One rail lines.
• | Low cost operating structure. We believe that our operations are characterized by an overall low cost structure, which permits us to capture attractive margins in the industries in which we operate. Our low cost structure is a result of the following key attributes: |
• | close proximity of our silica reserves to our processing plants, which reduces operating costs; |
• | recovery rates as high as 99% at our mines and plants, which also reduces operating costs; |
• | expertise in designing, building, maintaining and operating advanced frac sand processing, storage and loading facilities and transmix processing and storage assets; |
• | a large proportion of the costs we incur in our Sand segment are only incurred when we produce saleable frac sand; |
• | proximity to major sand and fuel logistics infrastructure, minimizing transportation and fuel costs and headcount needs; |
• | mineral royalty expenses that were less than 1% of our Sand revenues in 2014; |
• | enclosed dry plant operations which allow full run rates in winter months, increasing plant utilization; and |
• | a diversified and growing customer base spread across nearly every major shale play in North America. |
In addition to these capabilities, we are taking a number of proactive steps to further lower our operating costs, including de-bottlenecking our Kosse, Texas facilities, refining our mining techniques at our Barron county mines and wet plants, and incentivizing customers to put more volumes through our transload locations.
• | Significant organic growth capacity. We commenced operations at our Arland facility in December 2014, and plan to bring another facility in Wisconsin online in the second half of 2015. Once this facility is online, we will have 9.4 million tons of permitted production capacity, of which 87% is currently under contract. We expect to produce and sell the remaining capacity to continue to establish new customer relationships through new long‑term contracts and to enter into spot sales at favorable market prices. We will also continue to add additional capacity as market conditions and specific customer demand build. We believe that this capacity will continue to position us well to attract customers currently relying on other frac sand producers when those customers have the opportunity to renegotiate their sand supply contracts or seek out a new supplier. |
• | Strong reputation with our customers, suppliers and other constituencies. Our management and operating teams have developed longstanding relationships with our customers, suppliers and other constituencies. We currently sell to the twelve largest North American hydraulic fracturing service providers. Based on our track record of dependability, timely delivery and high-quality products that consistently meet customer specifications, we believe that we are well positioned to secure additional contracted commitments in the future, and that our product mix and customer service will continue to benefit our reputation within the frac sand industry. Further, we believe that these relationships will continue to benefit us in weaker markets relative to our peers. In our Fuel segment, we have established long-term supply relationships with major refining, midstream and marketing companies that provide us with a steady source of supply at competitive prices. |
• | Ability to identify and respond to changing market dynamics. We believe we have designed our assets and business model to permit us to adapt to changing market conditions. In our Sand segment, we have historically sought coarser reserves of Northern White sand than those sought by our competition, while our production at our Wisconsin facilities can optimize our production mix so that up to 20% of our production volume can fluctuate between coarse and fine sands. This optimization does not significantly impact our production yields or costs, yet we can still meet all API specifications, thereby allowing us the flexibility to respond efficiently to shifts in pricing and customer demand dynamics. We have also identified opportunities to utilize excess dry plant capacity at our Kosse, Texas frac sand processing facility to provide additional product offerings to our customers in the southwestern United States. We have significant reserves of fine mesh sand and believe that we will be well positioned to capture opportunities created by changing market trends in the relative prices of crude oil and dry natural gas. We have concentrated our frac sand sales efforts in the most economical plays for producers, which should allow us to better withstand environments when oil and gas prices fall. Finally, we use a partnering model in our transload facilities, which allows us to relocate our transload facilities, often with the same operator, to remain close to the epicenter of drilling without necessitating large capital investment. |
4
• | Experienced management team with industry specific operating and technical expertise. The top three management team members of our Sand segment have more than 75 years of combined industry experience. They have managed numerous frac sand mining and processing plants, successfully led acquisitions in the industry and developed multiple greenfield industrial minerals mining and processing operations. Most recently, this management team identified our existing Wisconsin facilities and designed, permitted and commenced each facility's operations within 12 months. We believe that our customers value our dedication to customer service, our reliable delivery, and our focus on high-quality product and that these give us a competitive advantage in the market. In addition, because of the experience of our staff, we believe that we are able to operate our sand facilities at a much lower per-ton overhead than our competition. |
The top five management team members of our Fuel segment have significant experience and complementary skills in the areas of transmix processing, acquiring, integrating, financing and managing refined product terminals and biodiesel manufacturing and have in excess of 100 years of combined industry experience.
Our Business Segments
Sand Segment
Our Sand segment mines, processes and distributes high quality silica sand, a key input for the hydraulic fracturing of oil and gas wells. Our facilities consist of three dry plants located in Arland, Barron and New Auburn, Wisconsin with a total permitted capacity of 6.3 million finished tons per year, and five wet plants and mine complexes that supply the dry plants with Northern White silica sand, which we believe is the highest‑ quality raw frac sand available. We also have a fourth dry plant in Kosse, Texas, with a capacity of 600,000 tons per year that is supplied by a separate mine and wet plant that processes local Texas sand. We have planned two additional 2.5 million ton per year dry plants, each backed by significant reserves and wet plant operations, at least one of which we intend to bring online some time in the second half of 2015. As of December 31, 2014, we also had thirteen transload facilities located throughout North America in the key basins where we deliver our sand, as well as a fleet of 5,099 railcars. In 2015, we expect to continue increasing both the number of transload sites in our network and the railcars in our fleet.
Our Sand segment has experienced rapid growth over the past several years due to technological advances in horizontal drilling and the hydraulic fracturing process that have made the extraction of large volumes of oil and natural gas from domestic unconventional hydrocarbon formations economically feasible. We believe that the premium geologic characteristics of our Wisconsin sand reserves, the strategic location of our sand mines, our location on multiple Class One rail lines, our extensive transload and logistics network, the industry experience of our senior management team, and the reputation that SSS has with our customers have positioned us as a highly attractive source of frac sand to the oil and natural gas industry.
The production of our sand consists of three basic processes: mining, wet plant operations, and dry plant operations. All mining activities take place on the surface and above the water table. We mine our sand using an open pit process, wherein we remove the topsoil, which is set aside, and then remove other non-economic minerals, or “overburden,” to expose the sand deposits. We then “bump” the sand using explosives on the mine face, which causes the sand to fall into the pit, where it is then carried by truck to the wet plant operations. Once we have mined out a portion of the reserves, we then either return the land to its previous contours or to a more usable contour, and then replace the topsoil. At our wet plant, the mined sand goes through a series of processes designed to separate the sand to individual grains, cleanse it of impurities and unusable materials, and remove sand particles too fine to be of commercial use. The resulting wet sand is then conveyed to a wet sand stockpile, where most of the water is allowed to drain into our on-site recycling facility, while the remaining fine grains and other materials, if any, are separated through a series of settlement ponds. We re-use all of the water in our wet process that does not evaporate. Wet sand from our stockpile is then conveyed or trucked to our dry plants, where the sand is dried, screened into specific mesh categories, and stored in silos. From the silos, we load sand directly into railcars or trucks, which we then ship to one of our transload facilities or directly to one of our customers.
Our frac sand facilities are located in Barron County, Wisconsin and Kosse, Texas. Based on the reports of our third-party engineers, we have approximately 133.3 million tons of proven recoverable ISO and API quality sand reserves, including approximately 105.5 million tons of proven recoverable reserves that will supply our Wisconsin facilities. We are currently capable of producing up to 8.6 million tons and 6.9 million tons of wet and dry sand per year, respectively, from our current facilities. We believe that the coarseness, conductivity, sphericity, acid-solubility and crush-resistant properties of our Wisconsin reserves and our facilities' interconnectivity to rail and other transportation infrastructure afford us a cost advantage over our competitors and make us one of a select group of sand producers capable of delivering high volumes of frac sand that is optimal for oil and natural gas production to all major unconventional resource basins currently producing throughout North America and abroad.
Our Wisconsin sand reserves give us access to a wide range of high-quality sand that meets or exceeds all API specifications and includes a significant concentration of 16/30, 20/40 and 30/50 mesh sands, which have become the preferred sand for oil and liquids-rich gas drilling applications. We believe that our Wisconsin reserves provide us access to a disproportionate amount of coarse sand (16/30, 20/40 and 30/50 mesh sands) compared to other Northern White deposits located in Wisconsin's Jordan,
5
St. Peter and Wonewoc formations. Our sample boring data and our historical production data have indicated that our Wisconsin reserves contain deposits of nearly 35% 40 mesh or coarser substrate, with our Arland, Church Road, LP Mine and Thompson Hills reserves being comprised of more than 60% 50 mesh or coarser substrate. We are also one of a select number of mine operators that can offer commercial amounts of 16/30 mesh sand, the coarsest grade of widely-used frac sand on the market, which along with other coarse sands is currently subject to high demand from our customers and which we believe commands a significant price premium. The coarseness of our reserves also provides us with a meaningful cost advantage, as companies with a low concentration of coarse sand must typically expend the resources necessary to mine a large amount of fine grain sand that currently has less commercial value. Our Wisconsin dry plants are fully enclosed, which means that we have three of the very few plants in Wisconsin that are capable of running year-round, regardless of the weather. We operate our Wisconsin plants with work crews of four to six employees. These crews work 40-hour weeks, with shifts between eight and twelve hours, depending on the employee's function. Because raw sand cannot be wet-processed during extremely cold temperatures, we typically mine and wet-process frac sand eight months out of the year at our Wisconsin locations. We did initiate a pilot program this most recent winter wherein we successfully operated a select number of our wet plants in temperatures as low as negative 20 degrees Fahrenheit through a proprietary enclosure process that we believe will allow us to run our wet plant facilities year round if required.
Our mine, wet plant and dry plant in Kosse, Texas operate year-round. We operate our Kosse facilities with crews of four to six employees who work twelve-hour shifts and average 40 hours per week. This allows us to optimize facility utilization.
Each of our facilities undergoes regular maintenance to minimize unscheduled downtime and to ensure that the quality of our frac sand meets applicable ISO and API standards and our customers' specifications. In addition, we make capital investments in our facilities as required to support customer demand and our internal performance goals.
The following table provides information regarding our frac sand production facilities as of December 31, 2014.
Wet Plant Location (1) | Proven Recoverable Reserves (Millions of Tons) (2) | Lease Expiration Date (3) | Plant Capacity (Thousands of Tons) | 2014 Production (Thousands of Tons) | ||||
New Auburn | 27.8 | March 2036 | 2,000 | 1,332 | ||||
Thompson Hills | 49.6 | December 2037 | 1,600 | 322 | ||||
FLS Mine | 13.7 | July 2037 | 1,200 | 1,189 | ||||
Church Road | 7.0 | N/A | 1,200 | 378 | ||||
LP Mine | 7.4 | March 2038 | 1,000 | 1,005 | ||||
Kosse, TX | 27.8 | N/A | 1,600 | 306 | ||||
Dry Plant Location (1) | On-site Railcar Storage Capacity (4) | Plant Capacity (Thousands of Tons) | 2014 Production Volumes (Thousands of Tons) | |||
Arland | N/A | 2,500 | 124 | |||
Barron | 650 cars | 2,400 | 2,224 | |||
New Auburn | 420 cars | 1,400 | 1,394 | |||
Kosse, TX | N/A | 600 | 299 | |||
(1) | All facilities are located in Wisconsin, except for our Kosse facility. |
(2) | Reserves are estimated as of December 31, 2014 by third-party independent engineering firms based on core drilling results and in accordance with the SEC's definitions of proven recoverable reserves and related rules for companies engaged in significant mining activities and represent marketable finished product. |
(3) | We own the land and mineral rights at our Church Road mine and the mineral rights at our Kosse mine. |
(4) | We transload sand produced at Arland to rail loadouts at New Auburn, Barron, and a third location in Minnesota. |
Mineral Reserves
We believe that our strategically located mines and facilities provide us with a large and high-quality mineral reserve base. Were we to operate our existing wet plants at full capacity, our reserves would supply us with fifteen years of Northern White frac sand and seventeen years of native Texas sand. We have information on several mineral deposits near and adjacent to our existing Northern White deposits that we believe we can economically mine as we deplete the reserves we currently lease.
The coarseness and conductivity of the Northern White frac sand that we mine in Wisconsin significantly enhances recovery of oil and liquids-rich gas by allowing hydrocarbons to flow more freely than would be possible with smaller, finer frac sands. The
6
low acid-solubility increases the integrity of the Northern White sand relative to other proppants with higher acid-solubility, especially in shales where hydrogen sulfide and other acidic chemicals are co-mingled with the targeted hydrocarbons. In addition, its crush resistant properties enable Northern White frac sand to be used in deeper drilling applications than the frac sand produced from mineral deposits located in Texas, Arkansas or other southern United States locations. We believe the higher crush strength properties of our Northern White sand provides us with a significant competitive advantage in supplying frac sand.
We categorize our reserves as proven recoverable in accordance with SEC definitions and have further limited the definition to apply only to sand reserves that we believe could be extracted at an average cost that is economically feasible. According to such a definition, we estimate that we had a total of approximately 133.3 million tons of proven recoverable mineral reserves as of December 31, 2014. The quantity and nature of the mineral reserves at each of our properties are estimated first by third-party geologists and mining engineers and we internally track the depletion rate on an interim basis. Cooper Engineering Company, Inc. (“Cooper Engineering”) prepared estimates of our proven mineral reserves at our Wisconsin mine locations, while Westward Environmental, Inc. (“Westward”) prepared estimates of our proven mineral reserves at our Kosse facility, each as of December 31, 2014. Our external geologists and engineers update our reserve estimates annually, making necessary adjustments for operations at each location during the year and additions or surveying, drill core analysis and other tests to confirm the quantity and quality of the acquired reserves.
As of December 31, 2014, we owned 100% of our mineral reserves in Texas and 6.6% of our reserves in Wisconsin. We lease the remainder of our reserves in Wisconsin from third-party landowners, with leases expiring at various times between 2036 and 2038. We do not anticipate any issues in renewing these leases should we decide to do so. Consistent with industry practice, we conduct only limited investigations of title to our properties prior to leasing. Title to lands and reserves of the lessors or grantors and the boundaries of our leased properties are not completely verified until we prepare to mine those reserves.
To opine as to the economic viability of our reserves, our independent third-party engineers reviewed our operations at the time of their proven recoverable reserve determination. Their findings were then incorporated into their reserve calculations and the reserve estimates reflect the quantity of sand that can be recovered under a similar cost structure. The cutoff grade used in estimating our reserves considers only sand that will not pass through a 65 mesh screen as proven recoverable reserves, meaning that only sands with mesh sizes coarser than 65 are included in their estimates of our proven recoverable reserves. Cooper Engineering's estimate of our proven recoverable reserves considers only the proportion of sand grains falling between 20 and 70 mesh API sizes. As we sell sand with mesh sizes smaller than 65 from our Wisconsin facilities, the sum of our current year reserves and tons sold less our reserves acquired may exceed the reserves presented in prior periods.
The cutoff grade used by Westward in estimating our reserves considers only sand that falls between 20 and 140 mesh API sizes as proven recoverable reserves.
Mines and Wet Plants
The deposits found in our open‑pit Wisconsin-based mines are Cambrian quartz sandstone deposits that produce high‑quality Northern White frac sand and have a minimum silica content of 99%. We typically use heavy equipment to mine the loose sandstone deposit from wooded lands up to approximately 180 feet in elevation above surrounding seasonally farmed crops. The knoll from which we mine sand can contain up to 90 feet of unsalable overburden but yields pay zones that are up to 105 feet deep and that contain material that is predominately in the 20/60 grain size distribution.
Mining takes place in phases lasting from six months to one year in duration, after which the property is reclaimed in a manner that typically provides the landowners with additional cropland. We typically mine and wet-process sand from mid-March through mid-November as temperatures from mid-November through mid-March typically are too cold to run our wet processes, as the wet process will not operate efficiently if the water freezes. We have developed systems to heat those outdoor systems through which we use and recycle water that allows us to operate in weather that is below the freezing point of water, but we typically over-produce wet sand during the warmer months to ensure sufficient sand for the non-operating months.
New Auburn
Our New Auburn wet plant was constructed and commenced operations in 2011. The facility is a steel structure and relies primarily on industrial grade aggregate processing equipment to scrub and process up to 2.0 million tons per year of wet sand. It is strategically located approximately 12 miles from our New Auburn dry plant, to which we have year-round trucking access.
We lease the mineral rights to a 418-acre mine site adjacent to our New Auburn wet plant. As of December 31, 2014, the mine site contained approximately 27.8 million tons of proven recoverable reserves, of which substantially all were coarser than 70 mesh according to our third-party engineers. These leases expire in 2036.
As of December 31, 2014, excavating activities consisting of mining, overburden removal and reclamation had taken place on approximately 39 of the 418 acres of our New Auburn property.
7
In 2011, we awarded Fred Weber, Inc. (“Fred Weber”) a five-year contract for the entirety of our New Auburn mining operations and for a portion of our wet processing needs at that facility. Under this contract, Fred Weber financed and built the wet plant at our New Auburn facility. We amended and extended this contract January 1, 2015, which now expires in December 31, 2021. Fred Weber now mines the sand reserves, creates stockpiles of washed sand and maintains the plant and equipment at New Auburn. We agreed, under a take-or-pay arrangement, to purchase 500,000 tons of washed sand from Fred Weber each year that the plant is in operation. We pay Fred Weber a set price per ton of washed sand, subject to adjustments each operational year for diesel prices, the quality of the sand mined and the quantity of sand purchased. During the term of the agreement Fred Weber will own the wet plant along with the equipment and other temporary structures used for mining on the property. At the end of the term of the agreement or following a default under the contract by Fred Weber, we have the right to take ownership of the wet plant and other mining equipment without charge. Subject to certain conditions, ownership of the plant and equipment will transfer from Fred Weber to us at the expiration of the term.
Thompson Hills
Our Thompson Hills mine consists of a series of seven leases in Barron County, Wisconsin, that together account for 580 acres and that contain approximately 49.6 million tons of proven recoverable sand reserves, based on the report of our third‑party independent mining engineers. This facility also includes a wet plant with the capacity to process 1.6 million tons per year. This mine is located approximately 25.5 miles from our Barron dry plant and approximately 15 miles from our New Auburn dry plant.
We completed construction of the mine and wet plant in September 2014. We incorporated two features into the wet plant that we believe provides the plant with higher quality sand within a more environmentally sound footprint. The first is that we wash our sand both before and after we run the wet sand through the hydrosizer. The resulting sand has turbidity that is the lowest of any wet plant with which we are familiar, which results in less fugitive dust both at our facilities and at the drilling site for our customers. The second is that we separate our fines and other unusable material without the use of settling ponds, which requires that we use less water in our wet plant. As of December 31, 2014, excavating activities consisting of mining, overburden removal and reclamation had taken place on approximately160 acres of our Thompson Hills property.
FLS mine
Our FLS mine, formerly referred to as our FLS/Arland mine, consists of five adjacent mineral deposits in Barron, Wisconsin that together account for 364 acres and that contain approximately 13.7 million tons of proven recoverable sand reserves, based on the report of our third-party independent mining engineers. This facility also includes a wet plant with the capacity to process 1.2 million tons per year. This mine is located approximately 11.5 miles from our Barron dry plant. As of December 31, 2014, excavating activities consisting of mining, overburden removal and reclamation had taken place on approximately 95 acres of our FLS property.
Church Road
In July 2014, we acquired certain assets and obligations of Midwest Frac and Sands LLC (“Midwest”), which includes 130 acres that contain approximately 7.0 million tons of provable recoverable sand reserves, based on the report of our third‑party independent mining engineers. The property also contains a wet plant that we constructed for Midwest in 2012 that has the capacity to process 1.2 million tons per year. The mine is located less than one mile from our Arland dry plant. As of December 31, 2014, excavating activities consisting of mining, overburden removal and reclamation had taken place on approximately 35 acres of our Church Road property, including activities that had taken place prior to our acquisition.
LP Mine
In 2013, we entered into a series of leases in Barron, Wisconsin, adjacent to our FLS Mine. These account for 145 acres and contain approximately 7.4 million tons of proven recoverable sand reserves, based on the report of our third‑party independent mining engineers. In 2014, we built a wet plant at this site that has the capacity to process 1 million tons per year. The mine is located approximately two miles from our Arland dry plant. As of December 31, 2014, excavating activities consisting of mining, overburden removal and reclamation had taken place on approximately 42 acres of our LP Mine.
Kosse
We own the mineral rights to a 225-acre mineral deposit located in Kosse, Texas, adjacent to our Kosse dry plant. The deposit has a minimum silica content of 99% and controlling attributes that include sand grain crush strength and size distribution. As of December 31, 2014, the Kosse mineral deposit contained approximately 27.8 million tons of proven recoverable reserves, which we process into a high-quality, 100 mesh frac sand that is particularly well suited to drilling for dry natural gas. The wet plant at our Kosse facility is capable of producing up to 2 million tons per year of wet sand. We are not obligated to make any royalty payments in connection with our mining operations at this location. We use heavy equipment to mine sand from the open-pit. The current mining area of our Kosse property covers approximately 95 acres and no reclamation has been performed.
8
Dry Plant Facilities
Arland
Our Arland dry plant is located in the township of Arland, Wisconsin in Barron County on 22 acres of land that we own. The facility is strategically located on a county road, which gives us year‑round trucking access, and is situated approximately 11 miles from our Barron facility and 37 miles from our New Auburn facility. Our Arland dry plant is an enclosed facility that has a rated production capacity of 8,800 tons per day year‑round and regardless of weather conditions, or roughly 80 railcars. Our current air permit allows us to produce up to 2.5 million tons per year of finished product. The facility has a 300 ton per hour natural gas fired rotary dryer as well as twelve high capacity gyratory mineral separators, or “screeners,” manufactured by Rotex. We load sand produced at Arland into trucks that we then transload to either our Barron and New Auburn facilities or to a third-party rail loadout approximately 75 miles from our Arland facility. We completed construction of the Arland facility in November 2014, and brought the facility online in December of that year.
For the year ended December 31, 2014, our Arland facility produced approximately 124,000 tons of Northern White sand.
Barron
Our Barron dry plant is located in the township of Clinton, Wisconsin in Barron County on 83 acres of land that we own. The facility is strategically located on a county road, which gives us year‑round trucking access, and is situated along a spur owned by the Canadian National (“CN”) railway that connects to the CN main line. Our Barron dry plant is an enclosed facility that has a rated production capacity of 8,800 tons per day year-round and regardless of weather conditions, or roughly 80 railcars, and has on-site railcar loading facilities capable of loading up to approximately 10,000 tons of frac sand into railcars per day. Our current air permit allows us to produce up to 2.4 million tons per year of finished product. The facility has a 300 ton per hour natural gas fired rotary dryer as well as twelve high capacity Rotex screeners. Our railyard at Barron consists of 18 spur tracks and is capable of storing up to 650 railcars. We completed construction of the Barron facility in 2012, and brought the facility online in the last two weeks of that year.
At Barron, we utilize approximately nine miles of existing rail track that connects our facility to the rail line owned by CN, making this facility one of only three active Wisconsin-based frac sand mines located on the CN line. Our direct connection to the CN line allows us to offer direct access to the rapidly growing oil and gas shale plays in northwestern Canada and the northeastern United States, including the Western Canadian Sedimentary Basin, the Marcellus Shale and the Utica Shale plays. The CN also presents us with access to emerging plays in the southern United States as well as the port of New Orleans, which provides us access to emerging markets in Latin America. We are currently one of only two frac sand providers in Wisconsin located on CN’s high‑capacity rail line, which is designed for railcars with a 286,000 pound capacity. This allows us to transport heavier loads and results in reduced transportation costs relative to competitors that only have access to lower capacity infrastructure.
For the year ended December 31, 2014, our Barron facility produced approximately 2.2 million tons of Northern White sand.
New Auburn
Our New Auburn dry plant is located approximately 12 miles from our New Auburn mine and is strategically located near a county road that provides year-round trucking access. The facility is on 37 acres of land that we own in the town of New Auburn, Wisconsin along a short line that connects with the mainline of the Union Pacific (“UP”) railway. Our New Auburn dry plant is an enclosed facility that has a rated production capacity of 4,400 tons per day year-round and regardless of weather conditions, or roughly 50 railcars, and has on-site railcar loading facilities capable of loading up to approximately 10,000 tons of frac sand into railcars per day. Our current air permit allows us to produce up to 1.4 million tons per year of finished product. The facility has a 175 ton per hour natural gas fired fluid bed dryer as well as six Rotex screeners. We constructed the facility and brought it online in late 2011, and fully enclosed the facility in mid-2012. In 2013 we completed the installation of our sixth Rotex screener that allowed us to increase our capacity to 1.4 million tons per year, the maximum allowable under our air permit.
Once processed and dried, sand from our New Auburn facility is stored in one of five on-site silos with a combined storage capacity of 4,500 tons. In addition to the 4,500 tons of silo capacity, we possess 4.5 miles of on-site rail track (3.0 miles of which is owned and 1.5 miles of which we access through a long term lease) that is tied into a rail line owned by UP and that is used to stage and store empty or recently loaded customer railcars. Because of the cost efficiencies of shipping frac sand by rail, our strategic location adjacent to a UP short rail line provides our customers with the ability to transport Northern White frac sand from our New Auburn facility to all major unconventional oil and natural gas basins currently producing in the United States and Canada with direct access to high-activity areas of oil production in Texas, Oklahoma, Colorado and the western United States. Our location in Wisconsin also provides our customers with economical access to barging terminals on the Mississippi River as well as access to Duluth, Minnesota, for loading onto ocean going vessels for international delivery.
For the year ended December 31, 2014, our New Auburn facility produced approximately 1.4 million tons of Northern White sand.
9
Kosse
Our Kosse dry plant is located adjacent to our Kosse mine and wet plant on land we own in Kosse, Texas. The facility has a rated production capacity of 1,650 tons per day year-round. The dry plant utilizes a 200 ton per hour natural gas fired rotary dryer that is capable of producing up to 600,000 tons per year of dry native Texas frac sand, and has an air permit that allows us to produce up to 1.2 million tons per year of finished product. We upgraded the facility in 2009, and later redeployed some of its components to build our New Auburn facility. We are currently engaged in a second upgrade designed to de-bottleneck our production process.
The plant produces 100-mesh native Texas sand and is capable of producing a higher-cut 40/70 frac sand as well. In the past, we have also shipped washed Northern White sand from our Wisconsin operations in unit trains to Kosse where it was dried, screened and resold to oil field service companies servicing unconventional resource plays located in south and west Texas. The Kosse facility has three dedicated on-site 1,000-ton storage silos designed for loading trucks for delivery to local and regional markets.
For the year ended December 31, 2014, our Kosse facility produced and sold approximately 299,000 tons of frac sand. We also sell the sand to non-energy end users, specifically as sports sand for golf courses and stadiums.
Additional Projects
We are currently developing two other dry plants in Wisconsin near our existing facilities and outside Barron County. The first project is in Independence, Wisconsin, which is located in Trempeleau County. This project, which has been in development since the late first quarter of 2014, is designed as a 2.5 million ton per year dry plant, supported by a wet plant and mine. As of December 31, 2014, we had invested a total of $17.4 million in the Independence project, including leveling and preparation of the building site and pre-ordering longer lead-time equipment. We are also working to develop another 2.5 million ton per year dry plant, supported by multiple mines and wet plants. Based on the contracts we have in place and continued customer demand, we intend to bring at least one of these facilities online during the second half of 2015 and the other online during 2016, subject to market conditions. The equipment that we pre-ordered for the Independence facility can be used in either of the two dry plants, as their design is substantially identical to our existing Arland and Barron facilities, as well as to one another.
Transportation Logistics and Infrastructure
We sell our sand both free-on-board (“FOB”) at our plants as well as at transload facilities that are closer to the wellhead. As the frac sand market has evolved, the point of sale between producers and purchasers of frac sand continues to move away from the FOB plant model and closer to the wellhead. For the year ended December 31, 2014, we sold approximately 78% of our sand FOB mine and 22% FOB transload and/or FOB wellhead. At our Kosse, Texas plant, orders are picked up by truck because most orders are transported 200 miles or less from our plant site. Because nearly all product from our Wisconsin plants is transported in excess of 200 miles and transportation costs typically represent more than 50% of our customers' overall cost for delivered Northern White sand, the majority of our Wisconsin shipments are transported by rail to a transload and storage location in close proximity to the customer's intended end use destination.
While several of our customers still purchase FOB plant, we offer our customers a total supply chain solution pursuant to which we manage every aspect of the supply chain from mining and manufacturing to delivery within 60 miles of the wellhead. Given the relative weight of transportation and logistics expenditures as a percentage of total delivered frac sand cost, we believe such a service offering has allowed, and will continue to allow, us to generate incremental revenue and reach a broader set of customers while providing our customers with a streamlined order process and a lower total delivered product cost. Currently, we have built a fleet of company-leased and customer-committed railcars, created a network of leased transload and terminal storage sites located near major shale plays and designed a supply chain management system that allow us the ability to flexibly and efficiently coordinate rail, truck and storage assets with customer order information. Several customers currently utilize our total supply chain solution and pay us fees for the service.
We believe that the connectivity of our Barron facility to the CN, combined with our connection with the UP at our New Auburn facility and our connection with four Class One rail lines in Minnesota, provide us enhanced flexibility to accommodate customers located in shale plays throughout North America. We also believe that access to these four rail lines allows us to provide single line hauls to most shale plays, resulting in fast transit times and a low delivered cost per ton. Using our existing on-site rail track, we have shipped sand in unit trains, which are dedicated trains (typically 80 to 120 railcars in length) chartered for a single delivery destination that usually receive priority scheduling and result in a more cost-effective method of shipping than standard rail shipment, out of both our Barron and New Auburn facilities. In addition, we have the capability to transload product from any of our Wisconsin facilities to either Barron or New Auburn, allowing us to fulfill special orders in an expedited basis regardless of the optimal rail line.
Transload Facilities
Due to limited storage capacity at or near the wellhead, our customers generally find it impractical to store frac sand in large quantities near their job sites. As a result, customers place a premium on a frac sand supplier's ability to maintain predictable and efficient product shipping schedules. The integrated nature of our production planning, railcar staging and product loading
10
operations, combined with our more than seven miles of on-site rail infrastructure, provide us with a competitive advantage in serving customer needs as we can service manifest rail deliveries or unit train shipments and minimize product fulfillment lead times through the simultaneous handling of multiple customers' railcars.
In order to continue to service the customer further down the supply chain, we developed a network of transload facilities within a number of the major basins that we serve. As of December 31, 2014, we had agreements with operators of thirteen transload storage facilities in North America. Below is a summary of the transload sites that we operate out of at December 31, 2014.
Transload Location by Basin | Transload Sites as of December 31, 2014 | Transload Sites Capable of Receiving Unit Trains | 2014 Volume Sold (Thousands of Tons) | ||||||
Bakken Shale | 1 | 1 | 154.1 | ||||||
Eagle Ford Shale | 1 | 1 | 83.6 | ||||||
Haynesville Shale | 1 | 1 | — | ||||||
Marcellus / Utica Shales | 4 | — | 339.6 | ||||||
Mid-Continent Basin | 1 | 1 | 46.9 | ||||||
Permian Basin | 2 | — | 92.7 | ||||||
Western Canadian Sedimentary Basin | 3 | 1 | 284.8 | ||||||
Total | 13 | 5 | 1,001.7 | ||||||
In selecting transload sites, we focus on a number of factors, including distance to the wellhead and customer needs that are specific to the basin and drilling activity, as well as whether or not the site is capable of receiving unit trains. Where available, we use silos to store our sand and work with the transload operators to ensure that in those locations where our sand is not the only sand sold that our sand is not co-mingled with that of our competitors; we refer to this as vertical storage. Where practical, we also utilize rolling storage, in which the sand remains in the railcar until it is loaded directly into a truck that will deliver the sand to the drill site. In general, we seek long-term relationships with existing transload operators that have multiple sites in and near the basins that we serve.
To maintain the maximum flexibility and respond promptly to customer needs, we have focused on enhancing our railcar fleet. As the frac sand industry has evolved, so have the railcars that serve the industry, which means that we seek to have our fleet comprised, as much as possible, of dedicated 286,000 pound railcars designed specifically for loading and unloading of frac sand. As of December 31, 2014, we had a total of 5,099 railcars in our fleet, including 1,764 railcars that are owned or leased by our customers but dedicated to us, and 3,335 railcars that we lease with a weighted average remaining term of 4.4 years. We anticipate that we will be able to renew these leases at favorable terms when they expire. We also have ordered an additional 4,882 railcars which we intend to lease, 2,423 of which have been or are expected to be delivered during 2015.
Permits
In order to conduct our sand operations, we are required to obtain permits from various local, state and federal government agencies. The various permits we must obtain address such issues as mining, construction, air quality, water discharge and quality, noise, dust and reclamation. Prior to receiving these permits, we must comply with the regulatory requirements imposed by the issuing governmental authority. In some cases, we also must have certain plans pre-approved, such as site reclamation plans, prior to obtaining the required permits. A decision by a governmental agency to deny or delay issuing a new or renewed permit or approval, or to revoke or substantially modify an existing permit or approval, could have a material adverse effect on our ability to continue operations at the affected facility. Expansion of our existing operations also is predicated upon securing the necessary environmental and other permits and approvals.
We have obtained all permits required for the operation of our existing facilities, and are in the process of obtaining the remaining necessary permits for facilities under construction.
Fuel Segment
Our Fuel segment consists of our facilities in the Dallas-Fort Worth metropolitan area and in Birmingham, Alabama, which are operated by Direct Fuels and AEC, respectively. Through this segment, we acquire and process transmix, which is a blend of different refined petroleum products that have become co-mingled in the pipeline transportation process; sell wholesale petroleum products; provide third-party terminaling services; and provide other complementary products and services. In these two markets, we are able to offer our customers gasoline and diesel at market rates, 24 hours a day, seven days a week. A selected summary of our fuel capacity and volumes for the year ended December 31, 2014 follows:
11
Plant Location | Transmix Processing Capacity | Fuel From Transmix Sold | Wholesale Fuel Volume Sold | Terminal Tankage Capacity | Terminal Throughput Volume | ||||||||||
(Volumes in thousands of gallons) | |||||||||||||||
Dallas-Fort Worth, TX | 107,310 | 78,515 | 27,418 | 11,990 | 102,942 | ||||||||||
Birmingham, AL | 76,650 | 38,096 | 120,335 | 21,966 | 107,723 | ||||||||||
In our transmix business, we acquire transmix from terminal operators and others which is delivered by pipeline or truck to our facilities. We then process the transmix into refined products such as conventional gasoline and low sulfur diesel, which we sell over our truck rack to third party distributors as well as off-road customers such as railroad operators. While a meaningful portion of our transmix business is conducted on a spot basis, we currently purchase approximately 69% of our supply of transmix pursuant to contracts having a volume-weighted average remaining duration of 22 months as of December 31, 2014. We design our contract structure to capture a stable margin, as the price differential between the indices at which we purchase transmix supply and the sales price of the corresponding refined products tends to be stable.
In our wholesale fuel business, we purchase fuel which is delivered to our tanks via pipeline, and which we then subsequently sell over our truck rack. We are also a shipper on the Colonial Pipeline and Plantation Pipeline, which allows us to bring refined products to our Birmingham facility from Gulf Coast refineries without paying third parties separate shipping charges. Our average holding period for transmix and wholesale gallons is 7-10 days, which serves to minimize the effects of daily fluctuations in fuel price.
In our terminaling business, we lease our terminal space to third parties who use our facilities to store refined petroleum products. We are able to charge customers for the storage, intake, and/or outtake of refined products. In 2013, we installed additive systems, which allow us to sell branded gasoline in addition to the unbranded gasoline we have historically sold, which we believe continue to increase our terminal customers and revenue base over time.
Other services include blending of renewable fuels into petroleum products, the manufacture of biodiesel at our Birmingham facility and certain reclamation services, which consist primarily of tank cleaning services. We also are a net producer of Renewable Identification Numbers, or RINs, which we sell to reduce our cost of goods sold.
In both our transmix and wholesale businesses, we analyze our business by looking at three components of margin contribution. Our base margin is the difference between the price our customers pay for a refined product less the price we pay and any processing costs, viewed as if both the purchase and sale occurred simultaneously. This base margin is usually the largest component of our gross margin per ton. This base margin tends to be greatest in periods of contango and lowest in periods of backwardation. The other two components are (1) the combined effects of holding cost (the price volatility during the 7-10 days we have possession of the refined product) and our hedging program and (2) the combined effects of the cost of RINs and the costs to blend off-spec product to acceptable standards. Because we are a net producer of RINs and because our blending program takes advantage of market imbalances wherever possible, this second component tends to be positive in most periods.
In our transmix business, we produce both low sulfur diesel and ultra-low sulfur diesel, depending on the incoming stream of transmix. Low sulfur diesel (“LSD”) contains no more than 500 parts per million, or ppm, of sulfur, and it is used primarily for locomotives and marine applications. Ultra-low sulfur diesel (“ULSD”), which began replacing low sulfur diesel in 2006 for on-highway applications, contains no more than 15 ppm of sulfur. ULSD meets Environment Protection Agency (“EPA”) standards for on-highway diesel fuel sold at retail locations in the United States and can also be used in all on or off-road applications.
Under the EPA's regulations, all on-road and off-road diesel had to meet a 15 ppm sulfur standard as of June 2010. A settlement agreement with the EPA indicates that the agency will allow use of 500 ppm diesel produced by transmix processors in locomotive engines as long as there is a market for it. However, beginning in 2015, all new locomotives purchased by railroads will be Tier 4, meaning that they cannot accept 500 ppm diesel. Railroads are permitted to continue utilizing Tier 3 and prior locomotives, but over time, their fleets will transition more and more towards equipment that cannot utilize LSD. As a result, 500 ppm sulfur diesel will be phased out of the locomotive market over a several year period beginning in the middle of 2015. However, the settlement agreement allows us and other transmix process to sell 500 ppm diesel produced to certain marine markets with no phase-out date. Regardless, as mentioned above, we are taking steps to ensure that all of the diesel we sell is eventually 15 ppm or less.
Jet fuel continues to contain sulfur levels well in excess of 15 ppm because the sulfur acts as a lubricant for jet engines. As a result, when jet fuel is part of a shipment of transmix, the diesel that results from the transmix separation process has a sulfur content that exceeds ULSD standards and can approach, or even exceed, 200 ppm. Because of this, we and other transmix processors are working to implement solutions to maximize the value of the LSD produced from transmix containing jet fuel. One option is to continue to find non-traditional customers, including small railroads and marine applications that can still use LSD. Another solution is to truck LSD to a refinery that has a hydrotreater that can remove sulfur efficiently from the diesel. Both of these options involve additional transportation costs that could lower the per-gallon base margin of the processed transmix. We have
12
elected to build our own hydrotreaters at both our DFW and Birmingham facilities in order to ensure all the diesel we produce is ULSD. Once these hydrotreaters are completed, which we expect to be early 2016, we believe that we will be able to both increase our per-gallon base margin as well as source additional supplies of transmix and off-spec fuel that is lower cost because of the higher sulfur content.
We believe we have several other attractive opportunities to continue to grow our transmix, wholesale, terminaling and other operations. We are seeking to enter into contracts for additional transmix supplies, which we could process using existing excess capacity. While our Dallas-Fort Worth facility ran its transmix tower at approximately 75% of capacity, our Birmingham transmix tower, which is the newest transmix tower in the United States, was running at half of its design capacity at the end of 2014. In addition, we believe that our transmix business model can be replicated successfully in other regions of the United States, and we actively evaluate potential acquisitions of bulk fuel terminals that have similar characteristics to our existing operations in Texas and Alabama. We also continue to seek additional terminaling customers, and regularly analyze our wholesale customers to maximize profitability.
Dallas-Fort Worth Facility
At our Dallas-Fort Worth facility, we offer our customers a diverse, high-quality product mix, including conventional gasoline and low sulfur diesel from our transmix processing and ultra-low sulfur diesel from both our transmix processing and bulk purchases. Our Dallas-Fort Worth facility is strategically located in the Dallas-Fort Worth metropolitan area on approximately 20 acres of land that we own and provides us access to an attractive market for our fuel products and direct connections to third-party refined products pipelines directly serving our transmix processing units and adjacent storage tanks. Specifically, we can receive transmix and bulk fuel product via three different pipelines at our Dallas-Fort Worth facility: the 28-inch and 10-inch pipelines owned by Explorer Pipeline Company and a major independent refiner's proprietary products pipeline. The 10-inch Explorer and independent refiner's pipelines terminate within a mile of our Dallas-Fort Worth facility. Additionally, we can receive inbound product via truck.
We own two transmix processing units at our Dallas-Fort Worth facility. These transmix processors were constructed in 1996 and 2003 and have a combined processing capacity of approximately 7,000 barrels of transmix per day. We purchased and refurbished our second processor in 2005. We sold an average of 5,122 barrels per day of refined products processed from transmix during the year ended December 31, 2014.
We purchase an average of nearly 48,000 barrels of ultra-low sulfur diesel each month under short-term purchase contracts. In addition, we receive throughput fees from two customers who store their own refined fuel products at our terminal.
We have 49 storage tanks at our Dallas-Fort Worth facility with total storage capacity of approximately 250,000 barrels. Additionally, we lease approximately 25,000 barrels of storage space at a fuel terminal that is connected to us by pipeline. While we continually strive to minimize inventory, our significant storage capacity provides us with the ability to receive large inbound batches of transmix from our transmix suppliers and allows us to offer our customers a wide range of fuel products.
We are able to distribute our fuel products efficiently through a truck rack at our Dallas-Fort Worth facility that is connected to our storage tanks. Our two-lane truck rack has a maximum daily capacity of 144 full-sized tank-trucks with an average utilization of 84 trucks per day. The truck rack at our Dallas-Fort Worth facility is fully automated so that drivers can quickly and easily select the specific blend of fuel that meets their needs.
Birmingham Facility
At our Birmingham facility, we also offer our customers a diverse, high-quality product mix, including conventional gasoline and low sulfur diesel from our transmix processing as well as gasoline and ultra-low sulfur diesel in connection with our wholesale fuel distribution operations. In addition, we provide a suite of complementary fuel products and services, including third-party terminaling, renewable fuel blending and reclamation services.
Our Birmingham facility is strategically located on approximately 40 acres of land that we own and provides us access to an attractive market for our fuel products and direct connections to third-party refined product pipelines directly serving our transmix processing units and adjacent storage tanks. Specifically, we can receive transmix and bulk fuel product via spurs from the Colonial and Plantation Pipelines, on both of which we are also shippers. Additionally, we can receive inbound product via truck.
We own one transmix processing unit at our Birmingham facility that has a processing capacity of approximately 5,000 barrels of transmix per day. This unit was constructed and placed in service during 2009. We sold an average of approximately 2,485 barrels per day of refined products processed from transmix at this facility during the year ended December 31, 2014.
We have 44 storage tanks at our Birmingham facility with total storage capacity of approximately 523,000 barrels, which is one of the largest volumes of storage capacity of any market participant in Birmingham, Alabama. While we continually strive to minimize inventory, our significant storage capacity provides us with the ability to receive large inbound batches of transmix from
13
our transmix suppliers and wholesale bulk purchases, which allows us to offer our customers a wide range of fuel products in connection with our wholesale fuel distribution operations.
We are able to distribute our fuel products efficiently through a truck rack that is connected to our storage tanks. Our Birmingham facility's four-lane truck rack has a maximum daily capacity of 384 full-sized tank-trucks with an average utilization of approximately 100 trucks per day. In addition to gasoline and diesel, we also offer our customers biodiesel, ethanol and other additive blending at the rack. The terminal and truck rack at our Birmingham facility are fully automated so that drivers can quickly and easily select the specific blend of fuel that meets their needs. Pursuant to month-to-month contracts with several of our customers, we also receive tolling fees on their gasoline and diesel that are sold across our truck rack.
In December 2012, we placed an idled biodiesel refinery at our Birmingham facility back into service and began commercial sales. Biodiesel contains no petroleum products and can be blended with petroleum-based diesel to create a biodiesel blend. Biodiesel is a clean-burning fuel that produces approximately 80% lower greenhouse gas emissions than petroleum diesel when each is separately combusted. Large refining companies are required to blend biodiesel with a portion of their ultra-low sulfur diesel or to purchase and retire a comparable volume of RINs. It is generally more economical to purchase and blend biodiesel than to purchase and retire RINs. This refinery has a practical capacity of producing approximately 2 million gallons of biodiesel fuel annually, and produced 0.9 million gallons during the year ended December 31, 2014.
We also operate equipment at our Birmingham facility that allows us to offer customers a unique alternative for the disposal of refined petroleum tank bottoms and petroleum contact waters (“PCW”). By reclaiming fuels from these wastes and placing them back into fuel service, our reclamation services eliminate the need for hazardous waste disposal. We also have 17 petroleum tank trailers and 13 vacuum trucks, which enable us to assist in tank cleanings and PCW transportation that range in size and scope.
Corporate
Certain items are reviewed by our management on a consolidated basis, and are therefore presented as corporate operations rather than segment operations:
• | general and administrative costs related to corporate overhead, such as headquarters facilities and personnel, as well as equity-based compensation; |
• | certain other operating costs such as IPO transaction-related; and |
• | non-operating items such as interest, other income and income taxes. |
Customers
Sand
We sell substantially all of the sand we produce to customers in the oil and gas proppants market. Our customers include major oilfield services companies that are engaged in hydraulic fracturing. Sales to the oil and gas proppants market comprised approximately 99% of our total Sand segment sales in 2014.
The sand in our reserves is, we believe, among the coarsest Northern White sand available. Typically, coarser sand is used in oil and liquids rich hydraulic fracturing, while natural gas extraction typically utilizes a finer grade of sand. Generally, oil field equipment requires less maintenance and provides more efficient operations when utilizing coarser frac sand, which, we believe, makes coarser sand generally preferred over finer sands. For the year ended December 31, 2014, approximately 1% of our sand sales were of our 16/30 product, 19% were of our 20/40 product, 37% were of our 30/50 product, 33% were of our 40/70 product, and 9% were of our 100 mesh product. These percentages include specialty cuts, such as our 20/30 “high cut,”, which would be included in our 20/40 percentage and which often results in a higher price on a FOB plant equivalent basis.
In 2014, total sales to customers currently under long-term contracts, including take-or-pay, fixed-volume and efforts-based contracts, accounted for 77% of our total Sand segment sales. As of December 31, 2014, we have 6.9 million tons under long-term contract with a weighted average remaining term of four years. Over the next 18 months, only three contracts for 700,000 tons are scheduled to expire or renew. Of the product we have under long-term contract, 21% is under take-or-pay contract, 6% is under a fixed-volume contract, and 73% is under an efforts-based contract. All three of these contracts have minimum volumes that the customer must purchase from us at an agreed-upon price. If a customer fails to perform under these contracts, each contract type has a different remedy: under take-or-pay, there is a specific remedy stated in the contract's liquidated damages clause; under a fixed-volume or efforts-based contract, damages are usually determined in arbitration. Efforts-based contracts also have certain market-out clauses wherein a customer may be relieved of his purchase obligation if he is unable to re-sell or use the sand because of adverse market conditions, such as a moratorium on the use of raw sand to fracture-stimulate a hydrocarbon well. Contracts also have a number of mechanisms that will allow the contracted price to fluctuate, subject to certain ceilings and floors. The majority of our contracts have annual escalators tied to the change in the Producer Price Index (“PPI”) as published by the United States Bureau of Labor Statistics. A limited number of our contracts may be adjusted to move the contracted price closer to the
14
spot market price. As all of our contracts were made at a price that was below the spot market price at the time of the contract, we believe that our downside on these contracts is limited relative to our upside.
Two customers represented 29% and 16% of our total sand sales for the year ended December 31, 2014.
Due to recent expansions in the supply of frac sand and processing capacity and the expectation of continued expansions, as well as uncertainty surrounding the future price of crude oil and natural gas, we believe that frac sand customers are increasingly reluctant to enter into take-or-pay contracts that expose them to pre-determined financial liability for failure to take delivery of minimum volumes of frac sand. Customers increasingly pursue efforts-based contracts over take-or-pay or fixed-volume contracts, and tend to contract at significantly lower levels than they ultimately plan to purchase. We also believe customers will be increasingly focused upon the relative quality of sand reserves, logistics capabilities and service level provided by the frac sand provider. As a consequence, we believe that we will be able to secure significant orders from customers over and above their contract minimums.
We believe that we will continue to sell a majority portion of our uncontracted tons to contract customers, and we will continue to seek additional long-term contracts with both existing contract customers and customers who are currently purchasing sand through a purchase order or spot basis. In the event that one or more of our current contract customers decides not to continue purchasing our frac sand following the expiration of its contract with us, we believe that we will be able to sell the volume of sand that they previously purchased to other customers through long-term contracts or sales on the spot market. We also intend to continue in our efforts to diversify our customer base. During the year ended December 31, 2014, we converted eight customers from purchase order-only to contract customers, increased contracted commitments from five customers and added twenty new customers.
Fuel
Our primary fuel processing and distribution markets are the Dallas-Fort Worth metropolitan area and Birmingham, Alabama. Combined, these markets contain approximately 6.4 million people.
We are a key seller to unbranded retailers and petroleum wholesalers, and act as a key supplier of terminaling services to various fuel refiners and large fuel marketing companies. The unbranded gasoline market has seen high growth in recent years due to a decline in the willingness of consumers to pay a premium for branded fuel. Many unbranded retailers have difficulty purchasing from the major distributors due to the restrictive supply relationship between such distributors and their franchised retailers. As unbranded retailers have expanded in recent years, we have acted as a key supplier to this market. We have capitalized on supplying the unbranded gasoline market because only limited quantities of unbranded fuel are stored in the regions in which we operate.
We also have terminaling contracts with major marketers of branded gasoline at our Dallas-Fort Worth and Birmingham facilities. These contracts were made possible because of the branded fuel additive systems that were installed in at each facility.
Suppliers and Service Providers
Sand
We believe frac sand companies differentiate themselves, from a cost and service perspective, based on their ability to wash, screen, dry and ship product efficiently. Mineral extraction is an important component of frac sand operations, but is viewed as a less differentiated skill set that can be performed efficiently by specialized third party providers. We mine our own frac sand reserves at our Kosse facility, and have engaged experienced mining contractors to manage excavation activities at our Wisconsin facilities.
We have engaged Fred Weber to mine and process wet sand at our New Auburn wet plant facility under a contract that expires at the end of 2021, at which time title and operations of the facility will revert to us. Fred Weber has mined and processed wet sand at New Auburn since we commenced operations in 2011. In July 2014 we closed on the acquisition of Midwest, which had been a supplier to us prior to the acquisition. During 2014, we purchased wet sand from other third parties in order to ensure sufficient wet sand for our dry plant operations. Because of significant investment in new mines and wet sand facilities in 2014, we do not believe we will need to purchase any material wet sand from third parties in 2015, which should significantly reduce the cost to produce sand on a per ton basis in 2015.
Fuel
We purchase transmix from pipeline or terminal operators, primarily under contractual arrangements that benefit us and our suppliers. Generally, we structure our supply contracts so that we receive all of our suppliers' transmix volume, regardless of regulatory changes, expansions of operations, higher utilization rates or other factors that may increase their supply. This helps assure our suppliers that their transmix will be removed on a timely basis so that their operations will not be interrupted. Major refineries prefer not to process transmix because it is less economical than processing crude oil due to the relatively lower volumes, decreased efficiency and concerns associated with the impact that fuel additives may have on expensive catalysts. We enable refiners to remain focused on crude oil processing by providing an economical and reliable solution for their transmix processing.
15
We currently purchase approximately 69% of our supply of transmix pursuant to contracts with terms ranging from 12 to 48 months, with a volume-weighted average remaining duration of 22 months as of December 31, 2014. The remainder of our supply of transmix is purchased on a spot basis. For the year ended December 31, 2014, our three largest suppliers of transmix accounted for approximately 25%, 19% and 12% of our total transmix purchases. The contract with our largest supplier for 2014 expires on September 30, 2017.
We receive transmix by truck and pipeline, depending upon the geographic location of each of our supply points. In general, truck shipments are more expensive but they allow us to receive small batches on a frequent basis. As a result, truck receipts are generally lower margin than pipeline receipts but inventory requirements are minimal. Conversely, pipeline shipments generally have to be aggregated to make shipments that meet minimum batch sizes for pipeline companies but the transportation cost is lower than for truck shipments.
Our wholesale fuel suppliers include major oil companies that ship us wholesale fuel via scheduled pipeline tenders or through in-tank transfers at our Birmingham facility.
Competition
Sand
The frac sand market is a highly competitive market that is comprised of a small number of large, national producers, which we also refer to as “Tier 1” producers, and a larger number of small, regional or local producers. Competition in the frac sand industry has increased in recent years due to favorable pricing and demand trends, and we expect competition to continue to increase if those trends continue. Suppliers compete based on price, consistency and quality of product, site location, distribution capability, customer service, reliability of supply, breadth of product offering and technical support.
Based on management's internal estimates, we believe we are one of the five largest producer of frac sand in 2014 by production capacity and quality, together with FMSA Holdings, Inc., Hi-Crush Proppants LLC, U.S. Silica Holdings, Inc., and Unimin Corporation. In recent years there has also been an increase in the number of small producers servicing the frac sand market due to an increased demand for hydraulic fracturing services and related proppant supplies. Due to this increased demand, existing or new frac sand producers could expand their frac sand production capacity, thereby increasing competition. We believe, however, that the relative inexperience of many management teams operating in the frac sand industry coupled with the costs, length of time and operational challenges associated with identifying attractive frac sand reserves, obtaining necessary permits and regulatory approvals and constructing a sand processing facility has prevented these smaller competitors from prospering in the market on a long-term basis. Further, the large capital requirements to locate storage and transload facilities into the various North American shale plays, as well as to assemble and maintain a significant fleet of railcars and other logistics capabilities, creates a significant additional barrier to entry for those considering whether to enter the market. We believe that industry consolidation and the exit from the market by less successful competitors will continue in the near term and should benefit the pricing environment for SSS and the remaining frac sand producers.
Fuel
We are the only transmix processor operating in the Dallas-Fort Worth and Birmingham markets. In general, transmix shipped by truck is less competitive than transmix shipped by pipeline, and these logistical considerations typically lead a transmix producer to the conclusion that there is only one appropriate location for processing its transmix in a geographic region. In cases where transmix can be transported economically by pipeline to several different transmix processing locations, the level of competition is significantly greater. In addition to price, suppliers of transmix also consider storage capacity, which minimizes the risk that transmix will not be removed on a timely basis, financial strength and operational history when evaluating potential transmix processors.
We compete with other wholesale distributors of refined products in our markets. Our competitors include large, integrated, major or independent oil companies operating in our markets. Because these competitors have more diverse operations and stronger capitalization, they may be better positioned than we are to withstand changing industry conditions, including shortages or excesses of petroleum products or intense price competition at the wholesale level.
Fuel terminal customers make their purchasing decisions based on several criteria. The most important criteria are price, location, service and product breadth/consistency. The price of fuel is generally a customer's primary focus, but that price must also take into account the cost of transportation. Terminals closer to sub-markets that are the largest consumers of fuel have an economic advantage over more remote terminals. Our Dallas-Fort Worth terminal is centrally located so we can economically serve most major sub-markets in Dallas-Fort Worth. Our Birmingham terminal is located in the same area as all other major fuel terminals in the market. The most important elements in providing quality service to terminal customers are speed of throughput and efficient back-office operations. Customers rarely have to wait to load at our truck racks, given our significant excess rack capacity. We also believe we have a system that provides us with a high degree of accuracy when billing our customers. Additionally, a broad product offering is important because customers generally prefer to be able to obtain multiple types of fuel from one supplier.
16
Finally, our customers prefer suppliers who are capable of providing product every day. The addition of wholesale product to supplement the products resulting from our own transmix processing operations provides us with a broad product line for our core customers and makes it more likely that we will have product available for sale every day.
Seasonality
Because it is challenging to process raw sand during sub-zero temperatures, frac sand is typically washed only eight months out of the year at our Wisconsin operations. This results in a seasonal build-up of inventory as we excavate excess sand to build a stockpile to feed the dry plant during the winter months, causing the average inventory balance to increase from a few weeks in early spring to more than 100 days in early winter and resulting in seasonal variations in our cash flow. We may also be selling frac sand for use in oil and gas basins where severe winter weather conditions may curtail drilling activities and, as a result, our sales volumes to those areas may be adversely affected. For example, we could experience a decline in volumes sold and segment income for the second quarter relative to the first quarter each year due to seasonality of frac sand sales into western Canada because sales volumes are generally lower during April and May due to limited drilling activity resulting from that region's annual thaw.
Our Fuel operations have not historically reflected any material seasonality. However, as we do hold refined petroleum products in our terminals and may take title to the product as it is shipped to our terminals, we expect to experience marginally higher earnings in periods where refined product prices are in contango, and marginally lower earnings in periods where refined product prices are in backwardation.
Insurance
We believe that our insurance coverage is customary for the industries in which we operate and adequate for our business. We periodically review insurance plans to address most, but not all, of the risks against our business. Losses and liabilities not covered by insurance would increase our costs. To address the hazards inherent in our business, we maintain insurance coverage that includes physical damage coverage, third-party general liability insurance, employer's liability, environmental and pollution and other coverage, although coverage for environmental and pollution-related losses is subject to significant limitations.
Environmental and Occupational Health and Safety Regulations
We are subject to stringent and complex federal, state and local laws and regulations governing the discharge of materials into the environment or otherwise relating to protection of worker health, safety and the environment. These regulations include compliance obligations for air emissions, water quality, wastewater discharges and solid and hazardous waste disposal, as well as regulations designed for the protection of worker health and safety and threatened or endangered species. Compliance with these environmental laws and regulations may expose us to significant costs and liabilities and cause us to incur significant capital expenditures in our operations. We are often obligated to obtain permits or approvals in our operations from various federal, state and local authorities. These permits and approvals can be denied or delayed, which may cause us to lose potential and current customers, interrupt our operations and limit our growth and revenue. Moreover, failure to comply with these laws and regulations may result in the assessment of administrative, civil and criminal penalties, imposition of remedial obligations, and the issuance of injunctions delaying or prohibiting operations. Private parties may also have the right to pursue legal actions to enforce compliance as well as to seek damages for non-compliance with environmental laws and regulations or for personal injury or property damage. While we believe that our operations are in substantial compliance with applicable environmental laws and regulations and that continued compliance with current requirements would not have a material adverse effect on us, there is no assurance that this degree of compliance will continue in the future. In addition, the clear trend in environmental regulation is to place more restrictions on activities that may affect the environment, and thus, any changes in, or more stringent enforcement of, these laws and regulations that result in more stringent and costly pollution control equipment, waste handling, storage, transport, disposal or remediation requirements could have a material adverse effect on our operations and financial position.
We do not believe that compliance with federal, state or local environmental laws and regulations will have a material adverse effect on our business, financial position or results of operations or cash flows. We cannot assure you, however, that future events, such as changes in existing laws or enforcement policies, the promulgation of new laws or regulations or the development or discovery of new facts or conditions adverse to our operations will not cause us to incur significant costs. The following is a discussion of material environmental and worker health and safety laws that relate to our operations. We believe that we are in substantial compliance with all of these environmental laws and regulations.
Air emissions. Our operations are subject to the Clean Air Act, as amended (the “CAA”), and comparable state and local laws, which restrict the emission of air pollutants from many sources and also impose various monitoring and reporting requirements. Compliance with these laws and regulations may require us to obtain pre-approval for the construction or modification of certain projects or facilities expected to produce or significantly increase air emissions, obtain and strictly comply with stringent air emissions permit requirements or utilize specific equipment or technologies to control emissions. Obtaining air emissions permits has the potential to delay the development or continued performance of our operations. Amendments to the CAA, including, among others, the CAA Amendments of 1990, require most industrial operations in the United States to incur capital expenditures
17
to meet the air emission control standards that are developed and implemented by the EPA and state environmental agencies. Over the next several years, we may be required to incur certain capital expenditures for air pollution control equipment or to address other air emissions-related issues such as, by way of example, the capture of increased amounts of fine sands matter emitted from produced sands. Moreover, facilities that emit volatile organic compounds or nitrogen oxides face increasingly stringent regulations, including requirements to install various levels of control technology on sources of pollutants. In addition, the petroleum processing sector is subject to stringent and evolving EPA and state regulations that establish standards to reduce emissions of certain listed hazardous air pollutants. While the hazardous air pollutant emissions from our facilities are below the threshold levels for the stringent maximum achievable control technology, or MACT, standards to apply, our Dallas-Fort Worth facility is an “area source” subject to the less stringent generally achievable control technology standards for gasoline distribution terminals that were promulgated by EPA in January 2011. In addition, air permits are required for our processing and terminal operations, and our frac sand mining operations that result in the emission of regulated air contaminants. These permits incorporate the various control technology requirements that apply to our operations and are subject to extensive review and periodic renewal. While we believe that we are in substantial compliance with the CAA and its implementing regulations, as well as similar state and local laws and regulations, frequently changing and increasingly stricter requirements, future non-compliance, or failure to maintain necessary permits or other authorizations could require us to incur substantial costs or suspend or terminate our operations.
The CAA also requires states to draft State Implementation Plans (“SIPs”) designed to attain national health-based ambient air quality standards (“NAAQS”) in primarily major metropolitan and/or industrial areas. SIPs frequently regulate emissions from stationary sources such as our operations. The Dallas-Fort Worth area is currently in nonattainment with the ozone NAAQS. We believe that we are in substantial compliance with applicable SIP requirements. New regulations designed to bring the Dallas-Fort Worth area into attainment with the ozone NAAQS were adopted by the Texas Commission on Environmental Quality (the “TCEQ”) in late 2011. We believe, based upon the adopted regulations, that no material capital expenditures beyond those currently contemplated and no material increase in costs are likely to be required.
The CAA authorizes the EPA to require modifications in the formulation of the refined transportation fuel products we manufacture in order to limit the emissions associated with the fuel product's final use. For example, in December 1999, the EPA promulgated regulations limiting the sulfur content allowed in gasoline. These regulations required the phase-in of gasoline sulfur standards beginning in 2004, with special provisions for small refiners and for refiners serving those Western states exhibiting lesser air quality problems and, more recently, the EPA finalized on March 3, 2014, rules to further reduce the sulfur content of gasoline beginning in 2017. Similarly, the EPA promulgated regulations that limited the sulfur content of on-road diesel fuel beginning in 2006 from its current level of no more than 500 ppm to no more than 15 ppm. A portion of our transmix consists of jet fuel, which currently is not subject to the EPA regulations that limit the sulfur content of most categories of motor fuels. However, the sulfur content of various types of diesel fuel is subject to a decreasing series of sulfur concentration limits, for example a 15 ppm maximum sulfur concentration in all categories of diesel fuel except for locomotive and marine diesel that is sold after May 31, 2014. If the transmix we receive after May 2014 contains sufficient quantities of jet fuel, the sulfur content of the diesel fuel we produce from our transmix may exceed the 15 ppm level and, if it does, we will be prohibited from marketing this fuel for any uses other than locomotive or marine, or for any use within the Northeast and Mid-Atlantic regions of the United States. Further, as EPA emissions standards for locomotives grow more stringent through 2020, certain locomotives will be required to move to lower sulfur diesel, limiting sales of diesel with sulfur above 15 ppm to certain old locomotives and marine sources only.
On August 16, 2012, the EPA published final rules that establish new air emission controls and practices for oil and natural gas production wells, including wells that are the subject of hydraulic fracturing operations and natural gas processing operations. These rules will require, among other things, the reduction of volatile organic compounds from certain natural gas wells through the use of reduced emission completions or “green completions” in all hydraulically fractured or re-fractured wells after January 1, 2015. For subject well completion operations occurring at such well sites before January 1, 2015, the final regulations will allow operators to capture and direct flowback emissions to completion combustion devices, such as flares in lieu of performing green completions. These regulations also establish specific new requirements regarding emissions from dehydrators, storage tanks and other production equipment. The EPA later updated the storage tank standards on August 5, 2013 to phase in emission controls more gradually. Compliance with these rules could result in significant costs to our customers, which may have an indirect adverse impact on our business.
The CAA also requires an increasing percentage of vehicle fuels to come from renewable sources, including biodiesel. The regulations implementing this “Renewable Fuel Standard” or RFS, may be adjusted by the EPA administrator, or reduced or eliminated as a result of litigation challenging the RFS, if sufficient quantities of renewable fuels are not available. Uncertainty surrounding the potential for the EPA or a court to lower the standards for biodiesel or other renewable fuels could affect our business.
There can be no assurance that future requirements compelling the installation of more sophisticated emission control equipment would not have a material adverse impact on our business, financial condition or results of operations.
18
Climate change. Methane, a primary component of natural gas, and carbon dioxide, a byproduct of the burning of natural gas, are examples of greenhouse gases (“GHGs”). In recent years, the U.S. Congress has considered legislation to reduce emissions of GHGs. It presently appears unlikely that comprehensive climate legislation will be passed by either house of Congress in the near future, although energy legislation and other regulatory initiatives are expected to be proposed that may be relevant to GHG emissions issues. In addition, almost half of the states have begun to address GHG emissions, primarily through the planned development of emission inventories or regional GHG cap and trade programs. Depending on the particular program, we could be required to control GHG emissions or to purchase and surrender allowances for GHG emissions resulting from our operations.
Independent of Congress, the EPA is beginning to adopt regulations controlling GHG emissions under its existing authority under the CAA. For example, on December 15, 2009, the EPA officially published its findings that emissions of carbon dioxide, methane and other GHGs present an endangerment to human health and the environment because emissions of such gases are, according to the EPA, contributing to warming of the earth's atmosphere and other climatic changes. These findings by the EPA allow the agency to proceed with the adoption and implementation of regulations that would restrict emissions of GHGs under existing provisions of the CAA. In 2009, the EPA adopted rules regarding regulation of GHG emissions from motor vehicles. In addition, on September 22, 2009, the EPA issued a final rule requiring the reporting of GHG emissions in the United States beginning in 2011 for emissions occurring in 2010 from specified large GHG emission sources. On November 30, 2010, the EPA published a final rule expanding its existing GHG emissions reporting rule for certain petroleum and natural gas facilities that emit 25,000 metric tons or more of carbon dioxide equivalent per year. The rule, which went into effect on December 30, 2010, requires reporting of GHG emissions by such regulated facilities to the EPA by September 2012 for emissions during 2011 and annually thereafter. In 2010, the EPA also issued a final rule, known as the “Tailoring Rule,” that makes certain large stationary sources and modification projects subject to permitting requirements for GHG emissions under the CAA. Several of the EPA's GHG rules are being challenged in court and, depending on the outcome of these proceedings, such rules may be modified or rescinded or the EPA could develop new rules.
Although it is not currently possible to predict how any such proposed or future GHG legislation or regulation by Congress, the EPA, the states or multi-state regions will impact our business, any legislation or regulation of GHG emissions that may be imposed in areas in which we conduct business could result in increased compliance costs or additional operating restrictions or reduced demand for our services, and could have a material adverse effect on our business, financial condition and results of operations.
Water discharge. The Clean Water Act, as amended (the “CWA”), and analogous state laws impose restrictions and strict controls with respect to the discharge of pollutants, including spills and leaks of oil and other substances, into state waters or waters of the United States. The discharge of pollutants into regulated waters is prohibited, except in accordance with the terms of a permit issued by the EPA or an analogous state agency. The CWA and regulations implemented thereunder also prohibit the discharge of dredge and fill material into regulated waters, including jurisdictional wetlands, unless authorized by an appropriately issued permit. The CWA also requires the development and implementation of spill prevention, control and countermeasures, including the construction and maintenance of containment berms and similar structures, if required, to help prevent the contamination of navigable waters in the event of a petroleum hydrocarbon tank spill, rupture or leak at such facilities. In addition, the CWA and analogous state laws require individual permits or coverage under general permits for discharges of storm water runoff from certain types of facilities. Federal and state regulatory agencies can impose administrative, civil and criminal penalties as well as other enforcement mechanisms for non-compliance with discharge permits or other requirements of the CWA and analogous state laws and regulations. We believe we are in substantial compliance with the CWA and similar state laws.
Safe Drinking Water Act. Although we do not directly engage in hydraulic fracturing activities, our customers purchase our frac sand for use in their hydraulic fracturing operations. Hydraulic fracturing involves the injection of water, sand and chemicals under pressure into the formation to stimulate gas production. Legislation to amend the Safe Drinking Water Act (the “SDWA”) to repeal the exemption for hydraulic fracturing from the definition of “underground injection” and require federal permitting and regulatory control of hydraulic fracturing, as well as legislative proposals to require disclosure of the chemical constituents of the fluids used in the fracturing process, were proposed in recent sessions of Congress and Congress continues to consider legislation to amend the SDWA. We cannot predict whether any such legislation will ever be enacted and, if so, what its provisions would be. Scrutiny of hydraulic fracturing activities continues in other ways, with the EPA having commenced a multi-year study of the potential environmental impacts of hydraulic fracturing, with initial results released in December of 2012 and final results expected to be available by 2014 and, more recently, the EPA has announced that it will develop effluent limitations for the treatment and discharge of wastewater resulting from hydraulic fracturing activities by 2014. Other governmental agencies, including the U.S. Department of Energy and the U.S. Department of the Interior (the “DOI”), are evaluating various other aspects of hydraulic fracturing, with the DOI announcing draft proposed rules on May 4, 2012 that, if adopted, would require disclosure of chemicals used in hydraulic fracturing activities upon federal and Indian lands and also would strengthen standards for well-bore integrity and the management of fluids that return to the surface during and after fracturing operations on federal and Indian lands but subsequently announcing on January 18, 2013, that it will issue a revised draft proposal in replacement of the May 2012 draft in 2013. These ongoing or proposed studies, depending on their degree of pursuit and any meaningful results obtained, could spur initiatives to further regulate hydraulic fracturing under the SDWA or other regulatory mechanisms. The EPA also has announced
19
that it believes hydraulic fracturing using fluids containing diesel fuel can be regulated under the SDWA notwithstanding the SDWA's general exemption for hydraulic fracturing and, more recently on May 4, 2012, the EPA issued draft guidance for SDWA permits issued to oil and natural gas exploration and production operators using diesel fuel during hydraulic fracturing. At the state level, some states, including Texas, have adopted, and other states are considering adopting, legal requirements that could impose more stringent permitting, public disclosure or well construction requirements on hydraulic fracturing activities. If additional levels of regulation and permits were required through the adoption of new laws and regulations at the federal or state level, that could lead to delays, increased operating costs and process prohibitions that could make it more difficult to complete natural gas wells in shale formations, increasing our customers' costs of compliance and doing business and otherwise adversely affect the hydraulic fracturing services they perform, which could negatively impact demand for our frac sand products. In addition, heightened political, regulatory and public scrutiny of hydraulic fracturing practices could potentially expose us or our customers to increased legal and regulatory proceedings, and any such proceedings could be time-consuming, costly or result in substantial legal liability or significant reputational harm. Any such developments could have a material adverse effect on our business, financial condition and results of operations, whether directly or indirectly. For example, we could be directly affected by adverse litigation involving us, or indirectly affected if the cost of compliance limits the ability of our customers to operate in the geographic areas we serve.
Solid waste. The Resource Conservation and Recovery Act, as amended (the “RCRA”), and comparable state laws control the management and disposal of hazardous and non-hazardous waste. These laws and regulations govern the generation, storage, treatment, transfer and disposal of wastes that we generate including, but not limited to, used oil, antifreeze, filters, sludges, paint, solvents and sandblast materials. The EPA and various state agencies have limited the approved methods of disposal for these types of wastes. In the course of our operations, we generate waste that may be regulated as non-hazardous wastes or even hazardous wastes, obligating us to comply with applicable RCRA standards relating to the management and disposal of such wastes.
Site remediation. The Comprehensive Environmental Response, Compensation and Liability Act, as amended (“CERCLA”), and comparable state laws impose strict, joint and several liability without regard to fault or the legality of the original conduct on certain classes of persons that contributed to the release of a hazardous substance into the environment. These persons include the owner and operator of a disposal site where a hazardous substance release occurred and any company that transported, disposed of, or arranged for the transport or disposal of hazardous substances released at the site. Under CERCLA, such persons may be liable for the costs of remediating the hazardous substances that have been released into the environment, for damages to natural resources, and for the costs of certain health studies. In addition, where contamination may be present, it is not uncommon for the neighboring landowners and other third parties to file claims for personal injury, property damage and recovery of response costs. On November 21, 2013, the EPA issued a General Notice Letter and Information Request (“Notice”) under Section 104(e) of CERCLA to one of our subsidiaries operating within the Fuel segment. The Notice provides that the subsidiary may have incurred liability with respect to the Reef Environmental site in Alabama, and requested certain information in accordance with Section 107(a) of CERCLA. The subsidiary timely responded to the Notice. At this time, no specific claim for cost recovery has been made by the EPA (or any other potentially responsible party) against the Partnership. There is uncertainty relating to our share of environmental remediation liability, if any, because our allocable share of wastewater is unknown and the total remediation cost is also unknown. Consequently, management is unable to estimate the possible loss or range of loss, if any. We have not recorded a loss contingency accrual in our financial statements. In the opinion of management, the outcome of such matters will not have a material adverse effect on our financial position, liquidity or results of operations.
The soil and groundwater associated with and adjacent to our former Dallas-Fort Worth terminal property have been affected by prior releases of petroleum products or other contaminants. A past owner and operator of the terminal property, ConocoPhillips, has been working with TCEQ to address this contamination. We, ConocoPhillips and owners and operators of adjacent industrial properties undertaking unrelated remediation obtained a Municipal Setting Designation (“MSD”) from the City of Fort Worth, which is an ordinance prohibiting the use of groundwater as drinking water in the area of our former terminal property. Following the certification of this MSD by the TCEQ, ConocoPhillips obtained approval of a remedial action plan for the property, which now only requires recordation of a restrictive covenant to comply with the TCEQ requirements. In connection with the sale of this facility, we have agreed to hold our successor harmless from any claims arising from this contamination, none of which has been asserted to our knowledge. We do not believe this former facility is likely to present any material liability to us.
Endangered Species. The Endangered Species Act (“ESA”), restricts activities that may affect endangered or threatened species or their habitats. While some of our facilities may be located in areas that are designated as habitats for endangered or threatened species, we believe that we are in substantial compliance with the ESA. However, the designation of previously unidentified endangered or threatened species could cause us to incur additional costs or become subject to operating restrictions or bans or limit future development activity in the affected areas. Moreover, as a result of a settlement approved by the U.S. District Court for the District of Columbia on September 9, 2011, the U.S. Fish and Wildlife Service is required to consider listing more than 250 species as endangered under the Endangered Species Act. Under the September 9, 2011 settlement, the U.S. Fish and Wildlife Service is required to review and address the needs of more than 250 species on the candidate list before the completion of the agency's 2017 fiscal year. The designation of previously unprotected species as threatened or endangered in areas where our
20
exploration and production customers operate could cause us or our customers to incur increased costs arising from species protection measures and could result in delays or limitations in our customers' performance of operations, which could reduce demand for our services.
Mining and Workplace Safety. Our sand mining operations are subject to mining safety regulation. The U.S. Mine Safety and Health Administration (“MSHA”) is the primary regulatory organization governing the frac sand industry. Accordingly, MSHA regulates quarries, surface mines, underground mines and the industrial mineral processing facilities associated with quarries and mines. The mission of MSHA is to administer the provisions of the Federal Mine Safety and Health Act of 1977 and to enforce compliance with mandatory worker safety and health standards. MSHA works closely with the Industrial Minerals Association, a trade association in which we have a significant leadership role, in pursuing this mission. As part of MSHA's oversight, representatives perform at least two unannounced inspections annually for each aboveground facility. To date these inspections have not resulted in any citations for material violations of MSHA standards.
We also are subject to the requirements of the U.S. Occupational Safety and Health Act (“OSHA”), and comparable state statutes that regulate the protection of the health and safety of workers. In addition, the OSHA Hazard Communication Standard requires that information be maintained about hazardous materials used or produced in operations and that this information be provided to employees, state and local government authorities and the public. OSHA regulates the customers and users of frac sand and provides detailed regulations requiring employers to protect employees from overexposure to silica through the enforcement of permissible exposure limits and the OSHA Hazard Communication Standard.
Local Regulation. As demand for frac sand in the oil and natural gas industry has driven a significant increase in current and expected future production of frac sand, some local communities have expressed concern regarding silica sand mining operations. These concerns have generally included exposure to ambient silica sand dust, truck traffic, water usage and blasting. In response, certain state and local communities have developed or are in the process of developing regulations or zoning restrictions intended to minimize dust from becoming airborne, control the flow of truck traffic, significantly curtail the amount of practicable area for mining activities, provide compensation to local residents for potential impacts of mining activities and, in some cases, ban issuance of new permits for mining activities. To date, we have not experienced any material impact to our existing mining operations or planned capacity expansions as a result of these types of concerns. We are not aware of any proposals for significant increased scrutiny on the part of state or local regulators in the jurisdictions in which we operate or community concerns with respect to our operations that would reasonably be expected to have a material adverse effect on our business, financial condition or results of operations going forward.
Employees
We have no employees. All of our management, administrative and operating functions are performed by employees of Emerge Energy Services GP, LLC, which is our general partner. As of December 31, 2014, our general partner employed 282 full-time employees who provide these services for us. None of these employees are subject to collective bargaining agreements. We consider our employee relations to be good.
Available Information
We file annual, quarterly and current reports and other documents with the SEC under the Securities and Exchange Act of 1934. We provide access free of charge to all of our SEC filings, as soon as practicable after they are filed or furnished, through our Internet website located at www.emergelp.com. References to our website addressed in this Annual Report on Form 10-K are provided as a convenience and do not constitute, and should not be viewed as, an incorporation by reference of the information contained on, or available through, the website.
You may also read and copy any of these materials at the SEC's Public Reference Room at 100 F. Street, NE, Room 1580, Washington, D.C. 20549. Information on the operation of the Public Reference Room is available by calling the SEC at 1-800-SEC-0330. Alternatively, the SEC maintains an Internet site (www.sec.gov) that contains reports, proxy and information statements, and other information regarding issuers that file electronically with the SEC.
Investors and others should note that we announce material financial information to investors using investor relations websites, press releases, SEC filings and public conference calls and webcasts. We also intend to also use Twitter (https://twitter.com/emergelp) as a means of disclosing information about our company, services and other matters. It is possible that the information we disclose could be deemed to be material information. Therefore, we encourage investors, the media and others interested in our company to review the information we post on Twitter.
21
ITEM 1A. RISK FACTORS
Limited partner interests are inherently different from capital stock of a corporation, although many of the business risks to which we are subject are similar to those that would be faced by a corporation engaged in the frac sand or refined products businesses. You should consider carefully the following risk factors together with all of the other information included in this report in evaluating an investment in our common units.
If any of the following risks were to occur, our business, financial condition or results of operations could be materially adversely affected. In that case, we may be unable to make distributions on our common units, the trading price of our common units could decline and you could lose all or part of your investment.
Risks Related to Our Business
We may not have sufficient available cash to pay any quarterly distribution on our common units.
We may not have sufficient available cash each quarter to enable us to pay any distributions to our unitholders. Furthermore, our partnership agreement does not require us to pay distributions on a quarterly basis or otherwise. The amount of cash we can distribute to our unitholders principally depends upon the amount of cash we generate from our operations, which fluctuates from quarter to quarter based on, among other things:
• | the level of production of, demand for, and price of frac sand and oil, natural gas, gasoline, diesel, biodiesel and other refined products, particularly in the markets we serve; |
• | the fees we charge, and the margins we realize, from our frac sand and fuel products sales and the other services we provide; |
• | changes in laws and regulations (or the interpretation thereof) related to the mining and oil and natural gas industries, silica dust exposure or the environment; |
• | the level of competition from other companies; |
• | the cost and time required to execute organic growth opportunities; |
• | difficulty collecting receivables; and |
• | prevailing global and regional economic and regulatory conditions, and their impact on our suppliers and customers. |
In addition, the actual amount of cash we have available for distribution depends on other factors, including:
• | the levels of our maintenance capital expenditures and growth capital expenditures; |
• | the level of our operating costs and expenses; |
• | our debt service requirements and other liabilities; |
• | fluctuations in our working capital needs; |
• | restrictions contained in our revolving credit facility and other debt agreements to which we are a party; |
• | the cost of acquisitions, if any; |
• | fluctuations in interest rates; |
• | our ability to borrow funds and access capital markets; and |
• | the amount of cash reserves established by our general partner. |
Our partnership agreement does not require us to pay a minimum quarterly distribution. The amount of distributions that we pay, if any, and the decision to pay any distribution at all, are determined by the board of directors of our general partner. Our quarterly distributions, if any, are subject to significant fluctuations based on the above factors.
The amount of cash we have available for distribution to unitholders depends primarily on our cash flow and not solely on profitability.
You should be aware that the amount of cash we have available for distribution depends primarily upon our cash flow, including cash flow from financial reserves and working capital borrowings, and not solely on profitability, which is affected by non-cash items. As a result, we may not be able to make cash distributions during periods in which we record net income.
22
The amount of our quarterly cash distributions, if any, may vary significantly both quarterly and annually and will be directly dependent on the performance of our business. Unlike most publicly traded partnerships, we do not have a minimum quarterly distribution or employ structures intended to consistently maintain or increase distributions over time.
Investors who are looking for an investment that will pay regular and predictable quarterly distributions should not invest in our common units. We expect our business performance may be more volatile, and our cash flows may be less stable, than the business performance and cash flows of most publicly traded partnerships. As a result, our quarterly cash distributions may be volatile and may vary quarterly and annually. Unlike most publicly traded partnerships, we do not have a minimum quarterly distribution or employ structures intended to consistently maintain or increase distributions over time. The amount of our quarterly cash distributions are directly dependent on the performance of our business. Because our quarterly distributions will significantly correlate to the cash we generate each quarter after payment of our fixed and variable expenses, quarterly distributions paid to our unitholders may vary significantly from quarter to quarter and may be zero.
The board of directors of our general partner may modify or revoke our cash distribution policy at any time at its discretion. Our partnership agreement does not require us to make any distributions at all.
The board of directors of our general partner adopted a cash distribution policy pursuant to which we distribute all of the available cash we generate each quarter to unitholders of record on a pro rata basis. However, the board may change such policy at any time at its discretion and could elect not to make distributions for one or more quarters. Our partnership agreement does not require us to make any distributions at all. Accordingly, investors are cautioned not to place undue reliance on the permanence of such a policy in making an investment decision. Any modification or revocation of our cash distribution policy could substantially reduce or eliminate the amounts of distributions to our unitholders.
Our operations are subject to the cyclical nature of our customers' businesses and depend upon the continued demand for crude oil and natural gas.
Our frac sand sales are to customers in the oil and natural gas industry, a historically cyclical industry. This industry was adversely affected by the uncertain global economic climate in the second half of 2008 and in 2009. Beginning in the fourth quarter of 2014 and continuing into 2015, the prices of crude oil and related products have dropped substantially. Natural gas prices have generally remained below $4.50 per mcf for the past six years. Worldwide economic, political and military events, including war, terrorist activity, events in the Middle East and initiatives by the Organization of the Petroleum Exporting Countries have contributed, and are likely to continue to contribute, to commodity price volatility. Additionally, warmer than normal winters in North America and other weather patterns may adversely impact the short-term demand for oil and natural gas and, therefore, demand for our products.
During periods of economic slowdown and long-term reductions in oil and natural gas prices, oil and natural gas exploration and production companies often reduce their oil and natural gas production rates and also reduce capital expenditures and defer or cancel pending projects, which results in decreased demand for our frac sand. Such developments occur even among companies that are not experiencing financial difficulties. Similarly, demand for our refined fuel products is lower during times of economic slowdown. A continued or renewed economic downturn in one or more of the industries or geographic regions that we serve, or in the worldwide economy, could adversely affect our results of operations. In addition, any future decreases in the rate at which oil and natural gas reserves are discovered or developed, whether due to increased governmental regulation, limitations on exploration and drilling activity, a sustained decline in oil and natural gas prices, or other factors, could have a material adverse effect on our business, even in a stronger natural gas and oil price environment.
Our Sand operations are subject to operating risks that are often beyond our control and could adversely affect production levels and costs.
Our mining, processing and production facilities are subject to risks normally encountered in the frac sand industry. These risks include:
• | changes in the price and availability of transportation; |
• | inability to obtain necessary production equipment or replacement parts; |
• | inclement or hazardous weather conditions, including flooding, and the physical impacts of climate change; |
• | unusual or unexpected geological formations or pressures; |
• | unanticipated ground, grade or water conditions; |
• | inability to acquire or maintain necessary permits or mining or water rights; |
• | labor disputes and disputes with our excavation contractors; |
• | late delivery of supplies; |
23
• | changes in the price and availability of natural gas or electricity that we use as fuel sources for our frac sand plants and equipment; |
• | technical difficulties or failures; |
• | cave-ins or similar pit wall failures; |
• | environmental hazards, such as unauthorized spills, releases and discharges of wastes, tank ruptures and emissions of unpermitted levels of pollutants; |
• | industrial accidents; |
• | changes in laws and regulations (or the interpretation thereof) related to the mining and oil and natural gas industries, silica dust exposure or the environment; |
• | inability of our customers or distribution partners to take delivery; |
• | reduction in the amount of water available for processing; |
• | fires, explosions or other accidents; and |
• | facility shutdowns in response to environmental regulatory actions. |
Any of these risks could result in damage to, or destruction of, our mining properties or production facilities, personal injury, environmental damage, delays in mining or processing, losses or possible legal liability. Any prolonged downtime or shutdowns at our mining properties or production facilities could have a material adverse effect on us.
Not all of these risks are reasonably insurable, and our insurance coverage contains limits, deductibles, exclusions and endorsements. Our insurance coverage may not be sufficient to meet our needs in the event of loss, and any such loss may have a material adverse effect on us.
A large portion of our sales in each of our Sand segment and our Fuel segment is generated by a few large customers, and the loss of our largest customers or a significant reduction in purchases by those customers could adversely affect our operations.
During 2014, our top five Sand customers represented 65% of sales from our Sand operations. During 2014, our top five Fuel customers represented 42% of sales from our Fuel operations. In our Fuel segment, we derive a significant portion of our revenues from sales to contract customers and the terms of our contracts are typically for one year or less. Our customers who are not subject to firm contractual commitments may not continue to purchase the same levels of our products in the future due to a variety of reasons. For example, some of our top customers could go out of business or, alternatively, be acquired by other companies that purchase the same products and services provided by us from other third-party providers. Our Sand customers could also seek to capture and develop their own sources of frac sand. In addition, some of our customers may be highly leveraged and subject to their own operating and regulatory risks. If any of our major customers substantially reduces or altogether ceases purchasing our products, we could suffer a material adverse effect on our business, financial condition, results of operations, cash flows and prospects. In addition, upon the expiration or termination of our existing contracts, we may not be able to enter into new contracts at all or on terms as favorable as our existing contracts. We may also choose to renegotiate our existing contracts on less favorable terms (including with respect to price and volumes) in order to preserve relationships with our customers.
In addition, the long-term sales agreements we have for our frac sand may negatively impact our results of operations. Certain of our long-term agreements are for sales at fixed prices that are adjusted only for certain cost increases. As a result, in periods with increasing frac sand prices, our contract prices may be lower than prevailing industry spot prices. Our long-term sales agreements also contain provisions that allow prices to be adjusted downwards in the event of falling industry prices.
Any material nonpayment or nonperformance by any of our key customers could have a material adverse effect on our business and results of operations and our ability to make cash distributions to our unitholders.
Any material nonpayment or nonperformance by any of our key customers could have a material adverse effect on our revenue and cash flows and our ability to make cash distributions to our unitholders. Our long-term take-or-pay sales agreements with select customers contain provisions designed to compensate us, in part, for our lost margins on any unpurchased volumes; accordingly, in such circumstances, we would be paid less than the price per ton we would receive if our customers purchased the contractual tonnage amounts. Certain of our other long-term frac sand sales agreements provide for minimum tonnage orders by our customers but do not contain pre-determined liquidated damage penalties in the event the customers fail to purchase designated volumes. Instead, we would seek legal remedies against the non-performing customer or seek new customers to replace our lost sales volumes. Certain of our other long-term frac sand supply contracts are efforts-based and therefore do not require the customer to purchase minimum volumes of frac sand from us or contain take-or-pay provisions.
Our different types of contracts with our frac sand customers provide for different potential remedies to us in the event a customer fails to purchase the minimum contracted amount of frac sand in a given period. If we were to pursue legal remedies in the event
24
a customer failed to purchase the minimum contracted amount of sand under a fixed-volume contract or failed to satisfy the take-or-pay commitment under a take-or-pay contract, we may receive significantly less in a judgment or settlement of any claimed breach than we would have received had the customer fully performed under the contract. In the event of any customer's breach, we may also choose to renegotiate any disputed contract on less favorable terms (including with respect to price and volumes) to us to preserve the relationship with that customer. Accordingly, any material nonpayment or performance by our customers could have a material adverse effect on our revenue and cash flows and our ability to make distributions to our unitholders.
Certain of our contracts contain provisions requiring us to meet minimum obligations to our customers and suppliers. If we are unable to meet our minimum requirements under these contracts, we may be required to pay penalties or the contract counterparty may be able to terminate the agreement.
In certain instances, we commit to deliver products to our customers prior to production, under penalty of nonperformance. Depending on the contract, our inability to deliver the requisite tonnage of frac sand may permit our customers to terminate the agreement or require us to pay our customers a fee, the amount of which would be based on the difference between the amount of tonnage contracted for and the amount delivered. We have significant long-term operating leases for railcars, both currently in service and yet to be delivered, under which we would still be obligated to pay despite any future decrease in the number of railcars needed to conduct our operations. Further, our agreement with Canadian National requires us to provide minimum volumes of frac sand for shipping on the Canadian National line. If we do not provide the minimum volume of frac sand for shipping, we will be required to pay a per-ton shortfall penalty, subject to certain exceptions. In addition, under our agreements with sand suppliers, we are obligated to order a minimum amount of wet sand per year or pay fees on the difference between the minimum and the amount we actually order. Similarly, we would be required to make minimum payments to mineral rights owners at certain of our mines in the event we purchase less than the minimum volumes of sand specified under the particular royalty agreement in place. If we are unable to meet our obligations under any of these agreements, we may have to pay substantial penalties or the agreements may become subject to termination, as applicable. In such events, our business, financial condition and results of operations may be materially adversely affected.
We may be adversely affected by a reduction in horizontal drilling activity or the development of either effective alternative proppants or new processes to replace hydraulic fracturing.
Frac sand is a proppant used in the completion and re-completion of natural gas and oil wells through the process of hydraulic fracturing. Frac sand is the most commonly used proppant and is less expensive than ceramic and resin coated proppants, which are also used in the hydraulic fracturing process to stimulate and maintain oil and natural gas production. A significant shift in demand from frac sand to other proppants, such as resin coated sand and ceramic alternatives, could have a material adverse effect on our business, financial condition and results of operations. In addition, demand for frac sand is substantially higher in the case of horizontally drilled wells, which allow for multiple hydraulic fractures within the same well bore but are more expensive to develop than vertically drilled wells. The development and use of a cheaper, more effective alternative proppant, a reduction in horizontal drilling activity or the development of new processes to replace hydraulic fracturing altogether, could also cause a decline in demand for the frac sand we produce and could have a material adverse effect on our business, financial condition and results of operations. A reduction in demand for the frac sand we produce may cause our contractual arrangements to become economically unattractive and could have a material adverse effect on our business, financial condition and results of operations.
Fuel prices and costs are volatile, and we have unhedged commodity price exposure between the time we purchase fuel supplies and the time we sell our product that may reduce our profit margins.
Our financial results from our Fuel segment are strongly affected by the relationship, or margin, between the prices we charge our customers for fuel and the prices we pay for transmix, wholesale fuel and other feedstocks. We purchase our transmix, wholesale fuel and other feedstocks based on several different regional refined product price indices, the most important of which are the Platts Gulf Coast gasoline and diesel price postings. The costs of our purchases are generally set on the day that we purchase the products. We typically sell our fuel products within 7 to 10 days of our supply purchases at then prevailing market prices; however, the length of time that we hold inventory may increase due to events beyond our control, such as adverse economic conditions or a slowdown in pipeline transit times. During the period we have title to products that are held in inventory for processing and/or resale, we will be exposed to commodity price risk. Furthermore, the longer our fuel products remain in our inventory, the greater our exposure to commodity price risk. If the market price for our fuel products declines during this period or generally does not increase commensurate with any increases in our supply and processing costs, our margins will fall and the amount of cash we will have available for distribution will decrease. In addition, because our inventory is valued at the lower of cost or market value, if the market value of our inventory were to decline to an amount less than our cost, we would record a write-down of inventory and a non-cash charge to cost of sales. In a period of decreasing transmix or refined product prices, our inventory valuation methodology may result in decreases in our reported net income and cash available for distribution to unitholders.
We also follow a financial hedging program whereby we hedge a portion of our gasoline and diesel inventory, which is intended to reduce our commodity price exposure on some of our activities in our Fuel segment. Even though we enter into hedging
25
arrangements to reduce our commodity price exposure, we cannot guarantee that such arrangements will provide sufficient price protection or that our counterparties will be able to perform under them, such as in the case of a counterparty's insolvency.
Failure to maintain effective quality control systems at our mining, processing and production facilities could have a material adverse effect on our business and operations.
The performance, quality and safety of our products are critical to the success of our business. For instance, our frac sand must meet stringent International Organization for Standardization, or ISO, and API technical specifications, including sphericity, grain size, crush resistance, acid solubility, purity and turbidity, as well as customer specifications, in order to be suitable for hydraulic fracturing purposes. If our frac sand fails to meet such specifications or our customers' expectations, we could be subject to significant contractual damages or contract terminations and face serious harm to our reputation, and our sales could be negatively affected. The performance, quality and safety of our products depend significantly on the effectiveness of our quality control systems, which, in turn, depends on a number of factors, including the design of our quality control systems, our quality-training program and our ability to ensure that our employees adhere to our quality control policies and guidelines. Any significant failure or deterioration of our quality control systems could have a material adverse effect on our business, financial condition, results of operations and reputation.
Increasing costs or a lack of dependability or availability of transportation services or infrastructure could have an adverse effect on our ability to deliver our frac sand products at competitive prices.
Because of the relatively low cost of producing frac sand, transportation and handling costs tend to be a significant component of the total delivered cost of sales. The bulk of our currently contracted sales involve our customers also contracting with truck and rail services to haul our frac sand to end users. If there are increased costs under those contracts, and our customers are not able to pass those increases along to end users, our customers may find alternative providers. We have provided fee-based transportation and logistics (including railcar procurement, freight management and product storage) services for both our spot market and contract customers. Should we fail to properly manage the customer's logistics needs under those instances where we have agreed to provide them, we may face increased costs and our customers may choose to purchase sand from other suppliers. Labor disputes, derailments, adverse weather conditions or other environmental events, tight railcar leasing markets and changes to rail freight systems could interrupt or limit available transportation services. A significant increase in transportation service rates, a reduction in the dependability or availability of transportation services or relocation of our customers' businesses to areas that are not served by the rail systems accessible from our production facilities could impair our customers' ability to access our products and our ability to expand our markets.
We face significant competition that may cause us to lose market share and reduce our ability to make distributions to our unitholders.
The frac sand and refined products industries are highly competitive. The frac sand market is characterized by a small number of large, national producers and a larger number of small, regional or local producers. Competition in this industry is based on price, consistency and quality of product, site location, distribution capability, customer service, reliability of supply, breadth of product offering and technical support.
Some of our competitors have greater financial and other resources than we do. In addition, our larger competitors may develop technology superior to ours or may have production facilities that offer lower-cost transportation to certain specific customer locations than we do. In recent years there has been an increase in the number of small, regional producers servicing the frac sand market due to an increased demand for hydraulic fracturing services and to the growing number of unconventional resource formations being developed in the United States. Should the demand for hydraulic fracturing services decrease or the supply of frac sand available in the market increase, prices in the frac sand market could materially decrease as less-efficient producers exit the market, selling frac sand at below market prices. Furthermore, oil and natural gas exploration and production companies and other providers of hydraulic fracturing services have acquired and in the future may acquire their own frac sand reserves to fulfill their proppant requirements, and these other market participants may expand their existing frac sand production capacity, all of which would negatively impact demand for our frac sand products. In addition, increased competition in the frac sand industry could have an adverse impact on our ability to enter into long-term contracts or to enter into contracts on favorable terms.
Our competitors in the refined products industry include large, integrated, major or independent oil companies that, because of their more diverse operations and stronger capitalization, may be better positioned than we are to withstand volatile industry conditions, including shortages or excesses of crude oil, transmix or refined products or intense price competition at the wholesale level. Additionally, the two largest processors of transmix have substantial financial and operational resources. These processors may choose to invest in additional transmix processing capacity and compete with us directly in our core markets.
Our cash flows fluctuate on a seasonal basis and severe weather conditions could have a material adverse effect on our business.
Because raw sand cannot be wet-processed during extremely cold temperatures, frac sand is typically washed only eight months out of the year at our Wisconsin operations. Our inability to wash frac sand year round in Wisconsin results in a seasonal build-
26
up of inventory as we excavate excess sand to build a stockpile that will feed the dry plant during the winter months. This seasonal build-up of inventory causes our average inventory balance to fluctuate from a few weeks in early spring to more than 100 days in early winter. As a result, the cash flows of our Sand operations fluctuate on a seasonal basis based on the length of time Wisconsin wet plant operations must remain shut down due to harsh winter weather conditions. We may also be selling frac sand for use in oil and gas-producing basins where severe weather conditions may curtail drilling activities and, as a result, our sales volumes to customers in those areas may be adversely affected. For example, we could experience a decline in volumes sold for the second quarter relative to the first quarter each year due to seasonality of frac sand sales to customers in western Canada as sales volumes are generally lower during the months of April and May due to limited drilling activity as a result of that region's annual thaw. Unexpected winter conditions (if winter comes earlier than expected or lasts longer than expected) may lead to us not having a sufficient sand stockpile to supply feedstock for our dry plant during winter months and result in us being unable to meet our contracted sand deliveries during such time, or may drive frac sand sales volumes down by affecting drilling activity among our customers, each of which could lead to a material adverse effect on our business, financial condition, results of operation and reputation. The inability of our logistics partners, including rail companies, to manage their own operations efficiently during inclement weather could have an effect on our ability to serve our customers where we are relying on our logistics partners to provide certain transportation services.
Diminished access to water may adversely affect our operations and the operations of our customers.
While much of our process water is recycled and recirculated, the mining and processing activities in which we engage at our wet plant facilities require significant amounts of water. During extreme drought conditions, some of our facilities are located in areas that can become water-constrained. We have obtained water rights and have installed high capacity wells on our properties that we currently use to service the activities on our properties, and we plan to obtain all required water rights to service other properties we may develop or acquire in the future. However, the amount of water that we are entitled to use pursuant to our water rights must be determined by the appropriate regulatory authorities in the jurisdictions in which we operate. Such regulatory authorities may amend the regulations regarding such water rights, increase the cost of maintaining such water rights or eliminate our current water rights, and we may be unable to retain all or a portion of such water rights. Such changes in laws, regulations or government policy and related interpretations pertaining to water rights may alter the environment in which we do business, which may negatively affect our financial condition and results of operations.
Similarly, our customers' performance of hydraulic fracturing activities may require the use of large amounts of water. The ability of our customers' to obtain the necessary amounts of water sufficient to perform hydraulic fracturing activities may well depend on those customers ability to acquire water by means of contract, permitting, or spot purchase. The ability of our customers to obtain and maintain sufficient levels of water for these fracturing activities are similarly subject to regulatory authority approvals, changes in applicable laws or regulations, potentially differing interpretations of contract terms, increases in costs to provide such water, and even changes in weather that could make such water resources more scarce.
We depend on certain transmix and wholesale fuels suppliers for a significant portion of our transmix and wholesale fuels, and the loss of any of these key suppliers or a material decrease in the supply of transmix or wholesale fuels generally available to us could materially reduce our ability to make distributions to unitholders.
We purchase transmix from major oil companies, brokers and local retailers in Texas and Alabama. We currently purchase approximately 69% of our supply of transmix pursuant to contracts with terms ranging from 12 to 48 months and a volume-weighted average remaining duration of approximately 22 months as of December 31, 2014. For the year ended December 31, 2014, our three largest suppliers of transmix accounted for 25%, 19% and 12% of our total transmix purchases. The contract with our largest supplier for the year ended December 31, 2014 expires in September 2017; purchases from our second largest supplier are made pursuant to a month-to-month contract; and the contract with our third largest supplier expires in December 2015. To the extent that our suppliers reduce the volumes of transmix and wholesale fuels that they supply us as a result of declining production, other changes in refinery output or refining transportation and marketing strategies, competition or otherwise, or if our suppliers decide not to renew our supply contracts, our revenues, net income and cash available for distribution could decline unless we were able to acquire comparable supplies of transmix and wholesale fuels on comparable terms from other suppliers. In addition, our earnings would be adversely affected if a significant supply of transmix was no longer available due to refinery or pipeline closings or interruptions or other force majeure events.
We are dependent on certain third-party pipelines for transportation of our wholesale products, and if these pipelines become unavailable to us, our revenues and cash available for distribution could decline.
Our processing facilities in Texas and Alabama are each interconnected to two pipelines that supply all of our wholesale products. Additionally, we periodically receive transmix at our Texas facility on an additional pipeline. Since we do not own or operate any of these pipelines, their continuing operation is not within our control. If any of these third-party pipelines were to become partially or fully unavailable to transport products because of accidents, extreme weather conditions, government regulation, terrorism or other events, or if the rates or terms and conditions of service of any of these third-party pipelines were to change materially, our revenues, net income and cash available for distribution could decline.
27
Increases in the price of diesel fuel may adversely affect our results of operations.
Diesel fuel costs generally fluctuate with increasing and decreasing world crude oil prices, and accordingly are subject to political, economic and market factors that are outside of our control. Our operations are dependent on earthmoving equipment, railcars and tractor-trailers, and diesel fuel costs are a significant component of the operating expense of these vehicles. We contract with a third party industrial mining expert to excavate raw frac sand from our New Auburn mine, deliver the raw frac sand to our processing facility and move the sand from our wet plant to our dry plant, and pay a fixed price per ton of sand delivered to our wet plant, subject to a fuel surcharge based on the price of diesel fuel. Accordingly, increased diesel fuel costs could have an adverse effect on our results of operations and cash flows.
We may be unable to grow our cash flows if we are unable to expand our business, which could limit our ability to increase distributions to our unitholders.
A principal focus of our strategy is to continue to grow the per unit distribution on our units by expanding our businesses, particularly our frac sand business. Our future growth will depend upon a number of factors, some of which we cannot control. These factors include our ability to:
• | develop new business and enter into contracts with new customers; |
• | retain our existing customers and maintain or expand the level of services we provide them; |
• | identify and obtain additional frac sand reserves; |
• | recruit and train qualified personnel and retain valued employees; |
• | expand our geographic presence; |
• | effectively manage our costs and expenses, including costs and expenses related to growth; |
• | consummate accretive acquisitions; |
• | obtain required debt or equity financing for our existing and new operations; |
• | meet customer-specific contract requirements or pre-qualifications; |
• | obtain permits from federal, state and local regulatory authorities; and |
• | make assumptions about mineral reserves, future production, sales, capital expenditures, operating expenses and costs, including synergies. |
If we do not achieve our expected growth, we may not be able to achieve our estimated results and, as a result, we would not be able to pay the estimated annual distribution, in which event the market price of our common units will likely decline materially.
We may be unable to grow successfully through future acquisitions, and we may not be able to integrate effectively the businesses we may acquire, which may impact our operations and limit our ability to increase distributions to our unitholders.
From time to time, we may choose to make business acquisitions to pursue market opportunities, increase our existing capabilities and expand into new areas of operations. While we have reviewed acquisition opportunities in the past and will continue to do so in the future, we may not be able to identify attractive acquisition opportunities or successfully acquire identified targets. In addition, we may not be successful in integrating any future acquisitions into our existing operations, which may result in unforeseen operational difficulties or diminished financial performance or require a disproportionate amount of our management's attention. Even if we are successful in integrating future acquisitions into our existing operations, we may not derive the benefits, such as operational or administrative synergies, that we expected from such acquisitions, which may result in the commitment of our capital resources without the expected returns on such capital. Furthermore, competition for acquisition opportunities may escalate, increasing our cost of making acquisitions or causing us to refrain from making acquisitions. Our inability to make acquisitions, or to integrate successfully future acquisitions into our existing operations, may adversely impact our operations and limit our ability to increase distributions to our unitholders.
Growing our business by constructing new plants and facilities subjects us to construction risks as well as market risks relating to insufficient demand for the services of such plants and facilities upon completion thereof.
One of the ways we intend to grow our business is through the construction of new dry plants, wet plants and transload facilities in our Sand segment. The construction of such facilities requires the expenditure of significant amounts of capital, which may exceed our resources, and involves numerous regulatory, environmental, political and legal uncertainties. If we undertake these projects, we may not be able to complete them on schedule or at all or at the budgeted cost. Moreover, our revenues may not increase upon the expenditure of funds on a particular project. For instance, if we build a new plant or facility, the construction will occur over an extended period of time, and we will not receive any material increases in revenues until at least after completion of the project, if at all. Moreover, we may construct new plants or facilities to capture anticipated future demand in a region in
28
which anticipated market conditions do not materialize or for which we are unable to acquire new customers. As a result, new plants or facilities may not be able to attract enough demand to achieve our expected investment return, which could materially and adversely affect our results of operations and financial condition.
Our ability to grow in the future is dependent on our ability to access external growth capital.
We will distribute all of our available cash after expenses and prudent operating reserves to our unitholders. We expect that we will rely primarily upon external financing sources, including borrowings under our revolving credit facility and the issuance of debt and equity securities, to maintain our asset base and fund growth capital expenditures. However, we may not be able to obtain equity or debt financing on terms favorable to us, or at all. To the extent we are unable to efficiently finance growth externally, our cash distribution policy will significantly impair our ability to grow. In addition, because we distribute all of our available cash, we may not grow as quickly as businesses that reinvest their available cash to expand ongoing operations. To the extent we issue additional units in connection with other growth capital expenditures, such issuances may result in significant dilution to our existing unitholders and the payment of distributions on those additional units may increase the risk that we will be unable to maintain or increase our per unit distribution level. There are no limitations in our partnership agreement on our ability to issue additional units, including units ranking senior to the common units. The incurrence of borrowings or other debt by us to finance our growth strategy would result in interest expense, which in turn would affect the available cash that we have to distribute to our unitholders.
Our debt levels may limit our flexibility in obtaining additional financing, pursuing other business opportunities and paying distributions.
We have a $350 million revolving credit facility with outstanding borrowings of $221.9 million million as of December 31, 2014. Our facility also has an accordion feature for an additional $150 million. Our ability to incur additional debt is subject to limitations under our revolving credit facility. Our level of debt has important consequences to us, including the following:
• | our ability to obtain additional financing, if necessary, for operating working capital, capital expenditures, acquisitions or other purposes may be impaired by our debt level, or such financing may not be available on favorable terms; |
• | we need a portion of our cash flow to make payments on our indebtedness, reducing the funds that would otherwise be available for operations, future business opportunities and distributions; and |
• | our debt level makes us more vulnerable than our competitors with less debt to competitive pressures or a downturn in our business or the economy generally. |
Our ability to service our debt depends upon, among other things, our future financial and operating performance, which is affected by prevailing economic conditions and financial, business, regulatory and other factors, some of which are beyond our control. In addition, our ability to service our debt under our revolving credit facility depends on market interest rates, since we the interest rates applicable to our borrowings fluctuate with movements in interest rate markets. If our operating results are not sufficient to service our current or future indebtedness, we will be forced to take actions such as reducing distributions, reducing or delaying our business activities, acquisitions, investments or capital expenditures, selling assets, restructuring or refinancing our debt, or seeking additional equity capital. We may be unable to effect any of these actions on satisfactory terms, or at all.
Restrictions in our revolving credit facility limit our ability to capitalize on acquisition and other business opportunities.
The operating and financial restrictions and covenants in our revolving credit facility and any future financing agreements could restrict our ability to finance future operations or capital needs or to expand or pursue our business activities. For example, our revolving credit facility restricts or limits our ability to:
• | grant liens; |
• | incur additional indebtedness; |
• | engage in a merger, consolidation or dissolution; |
• | enter into transactions with affiliates; |
• | sell or otherwise dispose of assets, businesses and operations; |
• | materially alter the character of our business as conducted at the closing of this offering; and |
• | make acquisitions, investments and capital expenditures. |
Furthermore, our revolving credit facility contains certain operating and financial covenants. Our ability to comply with the covenants and restrictions contained in the revolving credit facility may be affected by events beyond our control, including prevailing economic, financial and industry conditions. If market or other economic conditions deteriorate, our ability to comply with these covenants may be impaired. If we violate any of the restrictions, covenants, ratios or tests a significant portion of our
29
indebtedness may become immediately due and payable, our lenders' commitment to make further loans to us may terminate, and we will be prohibited from making distributions to our unitholders. We might not have, or be able to obtain, sufficient funds to make these accelerated payments. Any subsequent replacement of our revolving credit facility or any new indebtedness could have similar or greater restrictions.
Our ability to manage and grow our business effectively may be adversely affected if we lose management or operational personnel.
We depend on the continuing efforts of our executive officers. The departure of any of our executive officers could have a significant negative effect on our business, operating results, financial condition and on our ability to compete effectively in the marketplace.
Additionally, our ability to hire, train and retain qualified personnel will continue to be important and will become more challenging as we grow and if energy industry market conditions continue to be positive. When general industry conditions are good, the competition for experienced operational and field technicians increases as other energy and manufacturing companies' needs for the same personnel increase. Our ability to grow or even to continue our current level of service to our current customers will be adversely impacted if we are unable to successfully hire, train and retain these important personnel.
Inaccuracies in our estimates of mineral reserves could result in lower than expected sales and higher than expected costs.
We base our mineral reserve estimates on engineering, economic and geological data assembled and analyzed by our engineers and geologists, which are reviewed by outside firms. However, sand reserve estimates are necessarily imprecise and depend to some extent on statistical inferences drawn from available drilling data, which may prove unreliable. There are numerous uncertainties inherent in estimating quantities and qualities of mineral reserves and in estimating costs to mine recoverable reserves, including many factors beyond our control. Estimates of recoverable mineral reserves necessarily depend on a number of factors and assumptions, all of which may vary considerably from actual results, such as:
• | geological and mining conditions and/or effects from prior mining that may not be fully identified by available data or that may differ from experience; |
• | assumptions concerning future prices of frac sand products, operating costs, mining technology improvements, development costs and reclamation costs; and |
• | assumptions concerning future effects of regulation, including our ability to obtain required permits and the imposition of taxes by governmental agencies. |
Any inaccuracy in our estimates related to our mineral reserves could result in lower than expected sales and higher than expected costs and have an adverse effect on our cash available for distribution.
Our Sand operations are dependent on our rights and ability to mine our properties and on our having renewed or received the required permits and approvals from governmental authorities and other third parties.
We hold numerous governmental, environmental, mining and other permits, water rights and approvals authorizing operations at each of our Sand facilities. A decision by a governmental agency or other third party to deny or delay issuing a new or renewed permit, water right or approval, or to revoke or substantially modify an existing permit, water right or approval, could have a material adverse effect on our ability to continue operations at the affected facility. Expansion of our existing operations is also predicated on securing the necessary environmental or other permits, water rights or approvals, which we may not receive in a timely manner or at all.
We are subject to compliance with stringent environmental laws and regulations that may expose us to substantial costs and liabilities.
Our processing, terminal and mining operations are subject to increasingly stringent and complex federal, state and local environmental laws, regulations and standards governing the discharge of materials into the environment or otherwise relating to environmental protection. These laws, regulations and standards impose numerous obligations that are applicable to our operations, including the acquisition of permits to conduct regulated activities; the incurrence of significant capital expenditures to limit or prevent releases of materials from our processors, terminals, and related facilities; and the imposition of remedial actions or other liabilities for pollution conditions caused by our operations or attributable to former operations. Numerous governmental authorities, such as the EPA, and similar state agencies, have the power to enforce compliance with these laws, regulations and standards and the permits issued under them, often requiring difficult and costly actions.
Failure to comply with environmental laws, regulations, standards, permits and orders may result in the assessment of administrative, civil and criminal penalties, the imposition of remedial obligations, and the issuance of injunctions limiting or preventing some or all of our operations. Certain environmental laws impose strict liability for the remediation of spills and releases of oil and hazardous substances that could subject us to liability without regard to whether we were negligent or at fault. In addition, changes in environmental laws and regulations occur frequently, and any such changes that result in more stringent and costly waste
30
handling, storage, transport, disposal or remediation requirements with respect to our operations or more stringent or costly well drilling, construction, completion or water management activities with respect to our customers' operations could adversely affect our operations, financial results and cash available for distribution.
There is inherent risk of incurring significant environmental costs and liabilities in the operation of our facilities due to our handling of petroleum hydrocarbons, biodiesel, ethanol and wastes, air emissions and water discharges related to our operations, and historical operations and waste disposal practices by prior owners and operators. We currently own or operate properties that for many years have been used for industrial activities, including processing or terminal storage operations. Petroleum hydrocarbons, hazardous substances or wastes have been released on or under the properties owned or operated by us. Joint and several strict liability may be incurred in connection with such releases of petroleum hydrocarbons and wastes on, under or from our properties and facilities. Private parties, including the owners or operators of properties adjacent to our operations and facilities where our petroleum hydrocarbons or wastes are taken for reclamation or disposal, may also have the right to pursue legal actions to enforce compliance as well as to seek damages for non-compliance with environmental laws and regulations or for personal injury or property damage. We may not be able to recover some or any of these costs from insurance or other sources of indemnity.
Increasingly stringent environmental laws and regulations, unanticipated remediation obligations or emissions control expenditures and claims for penalties or damages could result in substantial costs and liabilities, and our ability to make distributions to our unitholders could suffer as a result. Neither the owners of our general partner nor their affiliates will indemnify us for any environmental liabilities, including those arising from non-compliance or pollution, that may be discovered at, on or under, or arise from, our operations or assets. As such, we can expect no economic assistance from any of them in the event that we are required to make expenditures to investigate, correct or remediate any petroleum hydrocarbons, hazardous substances, wastes or other materials.
The effect of the renewable fuel standard program in the Energy Independence and Security Act of 2007 is uncertain.
The domestic market for biodiesel is largely dictated by federal mandates for blending renewable fuels with gasoline and diesel. The EPA has proposed a level for biomass-based diesel for 2014 of 1.28 billion gallons under the RFS in the Energy Independence and Security Act of 2007, but has not yet finalized that level. Future demand will be largely dependent upon the capacity available to meet the RFS, and the economic incentives to blend based upon the relative value of traditional diesel versus biomass-based diesel. Any significant increase in production capacity beyond the RFS level could have a negative impact on biodiesel prices. An administrative or court-ordered reduction or waiver of the RFS mandate could also negatively affect biodiesel prices and our future performance.
We may be unable to sell some of our transmix-derived diesel fuel in the off-road markets because it may contain sulfur concentrations above levels allowed by EPA regulations.
In mid-2006, the EPA promulgated regulations requiring a reduction in the sulfur content of diesel fuel. Using a phased-in approach through 2014, these regulations require that the maximum allowable sulfur content of diesel fuels used in a variety of off-road applications, excluding locomotive and marine uses, be reduced to 15 ppm (referred to as “ultra-low sulfur diesel”). The diesel fuel produced from our transmix operations is sold for use in off-road applications and is subject to these phased-in regulations, except for diesel fuel used in locomotive and marine applications outside of the Northeast and Mid-Atlantic regions of the United States. Because a portion of our transmix consists of jet fuel, which currently is not subject to EPA regulations limiting its maximum sulfur content, the diesel fuel produced from such transmix may exceed the 15 ppm level. In the event that diesel fuel produced from transmix exceeds the 15 ppm level, we would be prohibited from marketing this fuel for any uses other than locomotive or marine outside of the Northeast and Mid-Atlantic regions. If this were to occur, we would have to find new customers for our transmix diesel, find economic means of reducing sulfur levels or stop sourcing higher sulfur transmix that is mixed with jet fuel. Further, changes in emissions regulations for locomotives will likely mean only marine customers will be able to use fuel that exceeds the 15 ppm level at some time between 2015 and 2020. A number of our rail customers have indicated to us that they are planning to accept only diesel fuel with less than 15 ppm as they phase in a new generation of locomotives. There can be no assurance that we would be able to find sufficient marine customers or economic means for reducing sulfur levels without an adverse effect on our financial condition, results of operations, or ability to make distributions to our unitholders.
Our sales of petroleum products, and any related hedging activities, expose us to potential regulatory risks.
The Federal Trade Commission and the Commodity Futures Trading Commission hold statutory authority to regulate conduct in certain physical energy commodities markets and in markets for energy commodities futures, options on futures and swaps that may be relevant to our business. These agencies have imposed broad regulations prohibiting fraud and manipulation in the markets over which they have statutory authority. With regard to our physical sales of fuel products, and any related hedging activities, we may be required to observe the market-related regulations enforced by these agencies, which hold substantial enforcement authority. Failure to comply with such regulations, as interpreted and enforced, could materially and adversely affect our financial condition or results of operations.
31
Government action on climate change could result in increased compliance costs for us and our customers.
Methane, a primary component of natural gas, and carbon dioxide, a byproduct of the burning of natural gas, are examples of greenhouse gases, or GHGs. At the federal level, regulatory actions are already underway to reduce GHGs from the oil and gas sector, and further administrative actions are likely to continue. While in recent years, the U.S. Congress has considered legislation to reduce emissions of GHGs, it presently appears unlikely that comprehensive climate legislation will be passed by either house of Congress in the near future. In addition, almost half of the states have begun to address GHG emissions, primarily through the planned development of emission inventories or regional GHG cap and trade programs. Depending on the particular program, we could be required to control GHG emissions or to purchase and surrender allowances for GHG emissions resulting from our operations.
Independent of Congress, the EPA has adopted regulations controlling GHG emissions under its existing authority under the federal Clean Air Act, as amended, or the CAA. In 2009, the EPA officially published its findings that emissions of carbon dioxide, methane and other GHGs present an endangerment to human health and the environment because emissions of such gases are, according to the EPA, contributing to warming of the earth's atmosphere and other climatic changes. These findings by the EPA allow the agency to proceed with the adoption and implementation of regulations that would restrict emissions of GHGs under existing provisions of the CAA. For example, in 2009, the EPA issued a final rule requiring the reporting of GHG emissions in the United States beginning in 2011 for emissions occurring in 2010 from specified large GHG emission sources. In 2010, the EPA published a final rule expanding its existing GHG emissions reporting rule for certain petroleum and natural gas facilities that emit 25,000 metric tons or more of carbon dioxide equivalent per year. The rule requires reporting of GHG emissions by such regulated facilities to the EPA annually. In 2010, the EPA also issued a final rule, known as the “Tailoring Rule,” that makes certain large stationary sources and modification projects subject to permitting requirements for GHG emissions under the CAA.
Although it is not currently possible to predict how any such proposed or future GHG legislation or regulation by Congress, the states or multi-state regions will impact our business, any legislation or regulation of GHG emissions that may be imposed in areas in which we conduct business could result in increased compliance costs or additional operating restrictions or reduced demand for our services, and could have a material adverse effect on our business, financial condition and results of operations.
Mine closures entail substantial costs, and if we close one or more of our mines sooner than anticipated, our results of operations may be adversely affected.
We base our assumptions regarding the life of our mines on detailed studies that we perform from time to time, but our studies and assumptions do not always prove to be accurate. If we close any of our mines sooner than expected, sales will decline unless we are able to increase production at any of our other mines, which may not be possible.
Applicable statutes and regulations require that mining property be reclaimed following a mine closure in accordance with specified standards and an approved reclamation plan. The plan addresses matters such as decommissioning and removal of facilities and equipment, re-grading, prevention of erosion and other forms of water pollution, re-vegetation and post-mining monitoring and land use. We may be required to post a surety bond or other form of financial assurance equal to the cost of reclamation as set forth in the approved reclamation plan. The establishment of the final mine closure reclamation liability is based on permit requirements and requires various estimates and assumptions, principally associated with reclamation costs and production levels. If our accruals for expected reclamation and other costs associated with mine closures for which we will be responsible were later determined to be insufficient, or if we were required to expedite the timing for performance of mine closure activities as compared to estimated timelines, our business, results of operations and financial condition could be adversely affected.
Federal, state and local legislative and regulatory initiatives relating to hydraulic fracturing and the potential for related regulatory action or litigation could result in increased costs and additional operating restrictions or delays for our customers, which could negatively impact our business, financial condition and results of operations and cash flows.
A significant portion of our business supplies frac sand to oil and natural gas industry customers performing hydraulic fracturing activities. Increased regulation of hydraulic fracturing may adversely impact our business, financial condition and results of operations.
The federal Safe Drinking Water Act, or the SDWA, regulates the underground injection of substances through the Underground Injection Control Program, or the UIC Program. Currently, with the exception of certain hydraulic fracturing activities involving the use of diesel, hydraulic fracturing is exempt from federal regulation under the UIC Program, and the hydraulic fracturing process is typically regulated by state or local governmental authorities. Although we do not directly engage in hydraulic fracturing activities, our oil and natural gas industry customers purchase our frac sand for use in their hydraulic fracturing operations. The EPA has taken the position that hydraulic fracturing with fluids containing diesel is subject to regulation under the UIC Program, specifically as “Class II” UIC wells and, in 2012, the EPA issued draft guidance for federal SDWA permits issued to oil and natural gas exploration and production operators using diesel during hydraulic fracturing activities. Also in 2012, the EPA published final rules that establish new air emission controls for oil and natural gas production and natural gas processing operations. The final rule requires new standards on certain hydraulically-fractured wells constructed or re-fractured after January 1, 2015. At the same
32
time, the EPA has commenced a study of the potential environmental impacts of hydraulic fracturing activities and released initial results in December 2012 and a subcommittee of the Secretary of Energy Advisory Board (the “SEAB”) of the U.S. Department of Energy was tasked with recommending steps to improve the safety and environmental performance of hydraulic fracturing. As part of these studies, the EPA and the SEAB subcommittee have requested that certain companies provide them with information concerning the chemicals used in the hydraulic fracturing process. In other investigatory activities, the EPA has announced plans to propose standards for the treatment and discharge of waste water resulting from hydraulic fracturing in 2015 and the DOI, announced draft proposed rules on May 4, 2012 that, if adopted, would require disclosure of chemicals used in hydraulic fracturing activities upon federal and Indian lands and also would strengthen standards for well-bore integrity and the management of fluids that return to the surface during and after fracturing operations on federal and Indian lands. The DOI published a supplemental notice of proposed rulemaking on May 24, 2013 which replaced the proposed rulemaking issued by the agency in May 2012. These studies and initiatives, depending on their results, could spur proposals to regulate hydraulic fracturing under the SDWA or otherwise. The SEAB subcommittee issued a final report in November 2011 recommending, among other things, measures to improve and protect air and water quality, improvements in communication among state and federal regulators, reduction of diesel fuel in shale gas production, disclosure of fracturing fluid composition and the creation of a publicly accessible database organizing all publicly disclosed information with respect to hydraulic fracturing operations. Congress previously considered legislation to provide for federal regulation of hydraulic fracturing under the SDWA and to require disclosure of the chemicals used in the hydraulic fracturing process. If this or similar legislation becomes law, the legislation could establish an additional level of regulation that may lead to additional permitting requirements or other operating restrictions, making it more difficult to complete natural gas wells in shale formations. This could increase our customers' costs of compliance and doing business or otherwise adversely affect the hydraulic fracturing services they perform, which may negatively impact demand for our frac sand products.
In addition, various state, local and foreign governments have implemented, or are considering, increased regulatory oversight of hydraulic fracturing through additional permitting requirements, operational restrictions, disclosure requirements and temporary or permanent bans on hydraulic fracturing in certain areas, such as environmentally sensitive watersheds. For example, many states - including the major oil and gas producing states of North Dakota, Ohio, Oklahoma, Pennsylvania, Texas, and West Virginia - have imposed disclosure requirements on hydraulic fracturing well owners and operators. The availability of public information regarding the constituents of hydraulic fracturing fluids could make it easier for third parties opposing the hydraulic fracturing process to initiate individual or class action legal proceedings based on allegations that specific chemicals used in the hydraulic fracturing process could adversely affect groundwater and drinking water supplies or otherwise cause harm to human health or the environment. Moreover, disclosure to third parties or to the public, even if inadvertent, of our customers' proprietary chemical formulas could diminish the value of those formulas and result in competitive harm to our customers, which could indirectly impact our business, financial condition and results of operations. The adoption of new laws or regulations at the federal, state, local or foreign levels imposing reporting obligations on, or otherwise limiting or delaying, the hydraulic fracturing process could make it more difficult to complete natural gas wells in shale formations, increase our customers' costs of compliance and doing business and otherwise adversely affect the hydraulic fracturing services they perform, which could negatively impact demand for our frac sand products. In addition, heightened political, regulatory and public scrutiny of hydraulic fracturing practices could potentially expose us or our customers to increased legal and regulatory proceedings, and any such proceedings could be time-consuming, costly or result in substantial legal liability or significant reputational harm. Any such developments could have a material adverse effect on our business, financial condition and results of operations, whether directly or indirectly. For example, we could be directly by affected adverse litigation involving us, or indirectly affected if the cost of compliance limits the ability of our customers to operate in the geographic areas we serve.
We are subject to the Federal Mine Safety and Health Act of 1977, which imposes stringent health and safety standards on numerous aspects of our operations.
Our operations are subject to the Federal Mine Safety and Health Act of 1977, as amended by the Mine Improvement and New Emergency Response Act of 2006, which imposes stringent health and safety standards on numerous aspects of mineral extraction and processing operations, including the training of personnel, operating procedures and operating equipment. We are also subject to standards imposed by MSHA and other federal and state agencies relating to workplace exposure to crystalline silica. Our failure to comply with such standards, or changes in such standards or the interpretation or enforcement thereof, could have a material adverse effect on our business and financial condition or otherwise impose significant restrictions on our ability to conduct mineral extraction and processing operations.
We and our customers are subject to other extensive regulations, including licensing, protection of plant and wildlife endangered and threatened species, and reclamation regulation, that impose, and will continue to impose, significant costs and liabilities. In addition, future regulations, or more stringent enforcement of existing regulations, could increase those costs and liabilities, which could adversely affect our results of operations.
In addition to the regulatory matters described above, we and our customers are subject to extensive governmental regulation on matters such as permitting and licensing requirements, plant and wildlife threatened and endangered species protection, jurisdictional wetlands protection, reclamation and restoration activities at mining properties after mining is completed, the
33
discharge of materials into the environment and the effects that mining and hydraulic fracturing have on groundwater quality and availability. Our future success depends, among other things, on the quantity of our frac sand and other mineral deposits and our ability to extract these deposits profitably, and our customers being able to operate their businesses as they currently do.
In order to obtain permits and renewals of permits in the future, we may be required to prepare and present data to governmental authorities pertaining to the potential adverse impact that any proposed mining and processing activities may have on the environment, individually or in the aggregate, including on public lands. Certain approval procedures may require preparation of archaeological surveys, endangered species studies and other studies to assess the environmental impact of new sites or the expansion of existing sites. Compliance with these regulatory requirements is expensive and significantly lengthens the time needed to develop a site. Finally, obtaining or renewing required permits is sometimes delayed or prevented due to community opposition and other factors beyond our control. The denial of a permit essential to our operations or the imposition of conditions with which it is not practicable or feasible to comply could impair or prevent our ability to develop or expand a site. Significant opposition to a permit by neighboring property owners, members of the public or non-governmental organizations, or other third parties or delay in the environmental review and permitting process also could impair or delay our ability to develop or expand a site. New legal requirements, including those related to the protection of the environment, could be adopted that could materially adversely affect our mining operations (including our ability to extract or the pace of extraction of mineral deposits), our cost structure or our customers' ability to use our frac sand products. Such current or future regulations could have a material adverse effect on our business and we may not be able to obtain or renew permits in the future.
Terrorist attacks, the threat of terrorist attacks, hostilities in the Middle East, or other sustained military campaigns may adversely impact our results of operations.
The long-term impact of terrorist attacks, such as the attacks that occurred on September 11, 2001, and the magnitude of the threat of future terrorist attacks on the energy industry in general and on us in particular are not known at this time. Uncertainty surrounding hostilities in the Middle East or other sustained military campaigns may affect our operations in unpredictable ways, including disruptions of markets for frac sand and refined products and the possibility that infrastructure facilities and pipelines could be direct targets of, or indirect casualties of, an act of terror. Changes in the insurance markets attributable to terrorist attacks may make certain types of insurance more difficult for us to obtain. Moreover, the insurance that may be available to us may be significantly more expensive than our existing insurance coverage. Instability in the financial markets as a result of terrorism or war could also affect our ability to raise capital.
Risks Inherent in an Investment in Us
Holders of our common units have limited voting rights and are not entitled to elect our general partner or its directors.
Unlike the holders of common stock in a corporation, unitholders have only limited voting rights on matters affecting our business and, therefore, limited ability to influence management's decisions regarding our business. Unitholders have no right on an annual or ongoing basis to elect our general partner or its board of directors. Insight Equity is the majority owner of our general partner and has the right to appoint our general partner's entire board of directors, including our independent directors. If the unitholders are dissatisfied with the performance of our general partner, they have little ability to remove our general partner. As a result of these limitations, the price at which the common units trade may be diminished because of the absence or reduction of a takeover premium in the trading price. Our partnership agreement also contains provisions limiting the ability of unitholders to call meetings or to acquire information about our operations, as well as other provisions limiting the unitholders' ability to influence the manner or direction of management.
Insight Equity owns the majority of and controls our general partner, which has sole responsibility for conducting our business and managing our operations. Our general partner and its affiliates, including Insight Equity, have conflicts of interest with us and limited duties, and they may favor their own interests to the detriment of us and our common unitholders.
Insight Equity owns the majority of and controls our general partner and appoints all of the officers and directors of our general partner, some of whom are officers and directors of Insight Equity. Although our general partner has a duty to manage us in a manner that is beneficial to us and our unitholders, the directors and officers of our general partner have a fiduciary duty to manage our general partner in a manner that is beneficial to its owners. Conflicts of interest may arise between Insight Equity and our general partner, on the one hand, and us and our unitholders, on the other hand. In resolving these conflicts of interest, our general partner may favor its own interests and the interests of Insight Equity and the other owners of our general partner over our interests and the interests of our common unitholders. These conflicts include the following situations, among others:
• | neither our partnership agreement nor any other agreement requires Insight Equity to pursue a business strategy that favors us or utilizes our assets or dictates what markets to pursue or grow; |
• | our general partner is allowed to take into account the interests of parties other than us, such as Insight Equity, in resolving conflicts of interest; |
34
• | our partnership agreement replaces the fiduciary duties that would otherwise be owed by our general partner with contractual standards governing its duties, limits our general partner's liabilities and restricts the remedies available to our unitholders for actions that, without these limitations, might constitute breaches of its fiduciary duty; |
• | our partnership agreement provides that whenever our general partner makes a determination or takes, or declines to take, any other action in its capacity as our general partner, our general partner is required to make such determination, or take or decline to take such other action, in good faith, meaning that it subjectively believed that the decision was in the best interests of our partnership, and, except as specifically provided by our partnership agreement, will not be subject to any other or different standard imposed by our partnership agreement, Delaware law, or any other law, rule or regulation, or at equity; |
• | except in limited circumstances, our general partner has the power and authority to conduct our business without unitholder approval; |
• | our general partner determines the amount and timing of asset purchases and sales, capital expenditures, borrowings, issuances of additional partnership securities and the creation, reduction or increase of reserves, each of which can affect the amount of cash that is distributed to our unitholders; |
• | our general partner determines which of the costs it incurs on our behalf are reimbursable by us; |
• | our partnership agreement does not restrict our general partner from causing us to pay it or its affiliates for any services rendered to us or from entering into additional contractual arrangements with any of these entities on our behalf; |
• | our general partner intends to limit its liability regarding our obligations; |
• | our general partner may exercise its right to call and purchase all of the common units not owned by it and its affiliates if they own more than 80% of the common units; |
• | our general partner controls the enforcement of its and its affiliates' obligations to us; and |
• | our general partner decides whether to retain separate counsel, accountants or others to perform services for us. |
Our general partner limits its liability regarding our obligations.
Our general partner limits its liability under contractual arrangements so that the counterparties to such arrangements have recourse only against our assets, and not against our general partner or its assets. Our general partner may therefore cause us to incur indebtedness or other obligations that are nonrecourse to our general partner. Our partnership agreement provides that any action taken by our general partner to limit its liability is not a breach of our general partner's duties, even if we could have obtained more favorable terms without the limitation on liability. In addition, we are obligated to reimburse or indemnify our general partner to the extent that it incurs obligations on our behalf. Any such reimbursement or indemnification payments would reduce the amount of cash otherwise available for distribution to our unitholders.
Our partnership agreement replaces our general partner's fiduciary duties to holders of our common units with contractual standards governing its duties.
Our partnership agreement contains provisions that eliminate the fiduciary standards to which our general partner would otherwise be held by state fiduciary duty law and replace those duties with several different contractual standards. For example, our partnership agreement permits our general partner to make a number of decisions in its individual capacity, as opposed to in its capacity as our general partner, free of any duties to us and our unitholders other than the implied contractual covenant of good faith and fair dealing, which means that a court will enforce the reasonable expectations of the partners where the language in the partnership agreement does not provide for a clear course of action. This provision entitles our general partner to consider only the interests and factors that it desires and relieves it of any duty or obligation to give any consideration to any interest of, or factors affecting, us, our affiliates or our limited partners. Examples of decisions that our general partner may make in its individual capacity include:
• | how to allocate business opportunities among us and its affiliates; |
• | whether to exercise its limited call right; |
• | whether to seek approval of the resolution of a conflict of interest by the conflicts committee of the board of directors of our general partner; |
• | how to exercise its voting rights with respect to the units it owns; and |
• | whether or not to consent to any merger or consolidation of the partnership or amendment to the partnership agreement. |
Our common unitholders have agreed to become bound by the provisions in the partnership agreement, including the provisions discussed above.
35
Our partnership agreement restricts the remedies available to holders of our common units for actions taken by our general partner that might otherwise constitute breaches of fiduciary duty.
Our partnership agreement contains provisions that restrict the remedies available to unitholders for actions taken by our general partner that might otherwise constitute breaches of fiduciary duty under state fiduciary duty law. For example, our partnership agreement:
• | provides that whenever our general partner makes a determination or takes, or declines to take, any other action in its capacity as our general partner, our general partner is required to make such determination, or take or decline to take such other action, in good faith, meaning it subjectively believed that the decision was in the best interest of our partnership, and except as specifically provided by our partnership agreement, will not be subject to any other or different standard imposed by our partnership agreement, Delaware law, or any other law, rule or regulation, or at equity; |
• | provides that our general partner will not have any liability to us or our unitholders for decisions made in its capacity as a general partner so long as such decisions are made in good faith; |
• | provides that our general partner and its officers and directors will not be liable for monetary damages to us, our limited partners or their assignees resulting from any act or omission unless there has been a final and non-appealable judgment entered by a court of competent jurisdiction determining that our general partner or its officers and directors, as the case may be, acted in bad faith or engaged in fraud or willful misconduct or, in the case of a criminal matter, acted with knowledge that the conduct was unlawful; and |
• | provides that our general partner will not be in breach of its obligations under our partnership agreement (including any duties to us or our unitholders) if a transaction with an affiliate or the resolution of a conflict of interest is: |
• | approved by the conflicts committee of the board of directors of our general partner, although our general partner is not obligated to seek such approval; |
• | approved by the vote of a majority of the outstanding common units, excluding any common units owned by our general partner or any of its affiliates; |
• | determined by the board of directors of our general partner to be on terms no less favorable to us than those generally being provided to or available from unrelated third parties; or |
• | determined by the board of directors of our general partner to be “fair and reasonable” to us, taking into account the totality of the relationships among the parties involved, including other transactions that may be particularly favorable or advantageous to us. |
In connection with a situation involving a transaction with an affiliate or a conflict of interest, any determination by our general partner must be made in good faith. If an affiliate transaction or the resolution of a conflict of interest is not approved by our common unitholders or the conflicts committee and the board of directors of our general partner determines that the resolution or course of action taken with respect to the affiliate transaction or conflict of interest satisfies either of the standards set forth in bullets three and four above, then it will be presumed that, in making its decision, the board of directors acted in good faith, and in any proceeding brought by or on behalf of any limited partner or the partnership, the person bringing or prosecuting such proceeding will have the burden of overcoming such presumption. In this context, members of the board of directors of our general partner will be conclusively deemed to have acted in good faith if it subjectively believed that either of the standards set forth in bullets three and four above was satisfied.
Our partnership agreement restricts the voting rights of unitholders owning 20% or more of our common units.
Unitholders' voting rights are further restricted by a provision of our partnership agreement providing that any units held by a person that owns 20% or more of any class of units then outstanding, other than our general partner, its affiliates, their direct transferees and their indirect transferees approved by our general partner (which approval may be granted in its sole discretion) and persons who acquired such units with the prior approval of our general partner, cannot vote on any matter.
Our general partner interest or the control of our general partner may be transferred to a third party without unitholder consent.
Our general partner may transfer its general partner interest to a third party in a merger or in a sale of all or substantially all of its assets without the consent of the unitholders. Furthermore, our partnership agreement does not restrict the ability of Insight Equity to transfer all or a portion of its ownership interest in our general partner to a third party. The new owner of our general partner would then be in a position to replace the board of directors and officers of our general partner with its own designees and thereby exert significant control over the decisions made by the board of directors and officers.
36
An increase in interest rates may cause the market price of our common units to decline.
Like all equity investments, an investment in our common units is subject to certain risks. In exchange for accepting these risks, investors may expect to receive a higher rate of return than would otherwise be obtainable from lower-risk investments. Accordingly, as interest rates rise, the ability of investors to obtain higher risk-adjusted rates of return by purchasing government-backed debt securities may cause a corresponding decline in demand for riskier investments generally, including yield-based equity investments such as publicly traded partnership interests. Reduced demand for our common units resulting from investors seeking other more favorable investment opportunities may cause the trading price of our common units to decline.
We may issue additional units without your approval, which would dilute your existing ownership interests.
Our partnership agreement does not limit the number of additional limited partner interests that we may issue at any time without the approval of our unitholders. The issuance by us of additional common units or other equity securities of equal or senior rank will have the following effects:
• | our existing unitholders' proportionate ownership interest in us will decrease; |
• | the amount of cash available for distribution on each unit may decrease; |
• | the ratio of taxable income to distributions may increase; |
• | the relative voting strength of each previously outstanding unit may be diminished; and |
• | the market price of the common units may decline. |
Our general partner has a call right that may require you to sell your units at an undesirable time or price.
If at any time our general partner and its affiliates own more than 80% of the common units, our general partner will have the right, which it may assign to any of its affiliates or to us, but not the obligation, to acquire all, but not less than all, of the common units held by unaffiliated persons at a price that is not less than their then-current market price, as calculated pursuant to the terms of our partnership agreement. As a result, you may be required to sell your common units at an undesirable time or price and may not receive any return or a negative return on your investment. You may also incur a tax liability upon a sale of your units.
Your liability may not be limited if a court finds that unitholder action constitutes control of our business.
A general partner of a partnership generally has unlimited liability for the obligations of the partnership, except for those contractual obligations of the partnership that are expressly made without recourse to the general partner. Our partnership is organized under Delaware law, and we conduct business in a number of other states. The limitations on the liability of holders of limited partner interests for the obligations of a limited partnership have not been clearly established in some of the other states in which we do business. You could be liable for any and all of our obligations as if you were a general partner if a court or government agency were to determine that:
• | we were conducting business in a state but had not complied with that particular state's partnership statute; or |
• | your right to act with other unitholders to remove or replace our general partner, to approve some amendments to our partnership agreement or to take other actions under our partnership agreement constitute “control” of our business. |
Unitholders may have liability to repay distributions that were wrongfully distributed to them.
Under certain circumstances, unitholders may have to repay amounts wrongfully returned or distributed to them. Under Section 17-607 of the Delaware Revised Uniform Limited Partnership Act, we may not make a distribution to you if the distribution would cause our liabilities to exceed the fair value of our assets. Delaware law provides that for a period of three years from the date of an impermissible distribution, limited partners who received the distribution and who knew at the time of the distribution that it violated Delaware law will be liable to the limited partnership for the distribution amount. Substituted limited partners are liable both for the obligations of the assignor to make contributions to the partnership that were known to the substituted limited partner at the time it became a limited partner and for those obligations that were unknown if the liabilities could have been determined from the partnership agreement. Neither liabilities to partners on account of their partnership interest nor liabilities that are non-recourse to the partnership are counted for purposes of determining whether a distribution is permitted.
The New York Stock Exchange, or NYSE, does not require a publicly traded partnership like us to comply with certain of its corporate governance requirements.
Because we are a publicly traded partnership, the NYSE does not require us to have a majority of independent directors on our general partner's board of directors or to establish a compensation committee or a nominating and corporate governance committee. Accordingly, unitholders do not have the same protections afforded to certain corporations that are subject to all of the NYSE corporate governance requirements.
37
We have material weaknesses in our internal control over financial reporting. These material weaknesses are attributable, in part, to the rapid growth and expanding complexity of our Sand segment. If one or more material weakness persists or if we fail to establish and maintain effective internal control over financial reporting, our ability to accurately report our financial results could be adversely affected.
In connection with the audit of our consolidated financial statements for the year ended December 31, 2014, we and our independent registered public accounting firm identified material weaknesses in our internal controls over financial reporting. These material weaknesses relate to our inability to effectively perform, complete, document and track various information technology general control activities and our inability to effectively perform and document certain daily recurring activity controls in our Sand segment. Both material weaknesses stem, in part, from our inability to staff, train and monitor a sufficient number of accounting and technology personnel in response to the rapid growth of sales volume and operational complexity in our Sand segment.
We are in the process of dedicating resources and effort to remediate these material weaknesses and improve our internal control in these areas. Our remediation plan includes (i) performing an administrative headcount and competency gap analysis to determine the appropriate level of staffing, (ii) hiring qualified accounting, monitoring and information technology staff, (iii) incorporating training of information technology and accounting personnel where appropriate to improve competencies and understanding of our policies and (iv) increasing managerial monitoring activities over remediation efforts in areas of particular weakness. However, there can be no assurance that we will remediate these material weaknesses or avoid future weaknesses or deficiencies.
Any failure to remediate these material weaknesses and any future weaknesses or deficiencies or any failure to implement required new or improved controls or difficulties encountered in their implementation could cause us to fail to meet our reporting obligations or result in material misstatements in our financial statements. If our management were to conclude in future reports that our internal control over financial reporting was not effective, investors could lose confidence in our reported financial information, and the trading price of our common units could be impacted. Failure to comply with Section 404 of Sarbanes-Oxley could potentially subject us to sanctions or investigations by the SEC, FINRA or other regulatory authorities, as well as increasing the risk of liability arising from litigation based on securities law.
If we fail to develop or maintain an effective system of internal controls, we may not be able to accurately report our financial results or prevent fraud. As a result, current and potential unitholders could lose confidence in our financial reporting, which would harm our business and the trading price of our units.
Effective internal controls are necessary for us to provide reliable financial reports, prevent fraud and operate successfully as a public company. If we cannot provide reliable financial reports or prevent fraud, our reputation and operating results would be harmed. We cannot be certain that our efforts to develop and maintain our internal controls will be successful, that we will be able to maintain adequate controls over our financial processes and reporting in the future or that we will be able to comply with our obligations under Section 404 of the Sarbanes Oxley Act of 2002. Any failure to develop or maintain effective internal controls, or difficulties encountered in implementing or improving our internal controls, could harm our operating results or cause us to fail to meet our reporting obligations. Ineffective internal controls could also cause investors to lose confidence in our reported financial information, which would likely have a negative effect on the trading price of our units.
Tax Risks to Common Unitholders
Our tax treatment depends on our status as a partnership for federal income tax purposes. If the IRS were to treat us as a corporation for federal income tax purposes, which would subject us to entity-level taxation, then our cash available for distribution to our unitholders would be substantially reduced.
The anticipated after-tax economic benefit of an investment in the common units depends largely on our being treated as a partnership for federal income tax purposes. Despite the fact that we are a limited partnership under Delaware law, it is possible in certain circumstances for a partnership such as ours to be treated as a corporation for federal income tax purposes. Although we do not believe based upon our current operations that we will be so treated, a change in our business or a change in current law could cause us to be treated as a corporation for federal income tax purposes or otherwise subject us to taxation as an entity.
If we were treated as a corporation for federal income tax purposes, we would pay federal income tax on our taxable income at the corporate tax rate, which is currently a maximum of 35%, and would likely pay state and local income tax at varying rates. Distributions would generally be taxed again as corporate dividends (to the extent of our current and accumulated earnings and profits), and no income, gains, losses, deductions, or credits would flow through to you. Because a tax would be imposed upon us as a corporation, our cash available for distribution to you would be substantially reduced. Therefore, if we were treated as a corporation for federal income tax purposes, there would be a material reduction in the anticipated cash flow and after-tax return to our unitholders, likely causing a substantial reduction in the value of our common units.
38
If we were subjected to a material amount of additional entity-level taxation by individual states, it would reduce our cash available for distribution to our unitholders.
Changes in current state law may subject us to additional entity-level taxation by individual states. Because of widespread state budget deficits and other reasons, several states are evaluating ways to subject partnerships to entity-level taxation through the imposition of state income, franchise and other forms of taxation. Imposition of any such taxes may substantially reduce the cash available for distribution to you and, therefore, negatively impact the value of and investment in our common units.
The tax treatment of publicly traded partnerships or an investment in our common units could be subject to potential legislative, judicial or administrative changes and differing interpretations, possibly on a retroactive basis.
The present federal income tax treatment of publicly traded partnerships, including us, or an investment in our common units may be modified by administrative, legislative or judicial interpretation at any time. For example, from time to time, members of the U.S. Congress propose and consider substantive changes to the existing federal income tax laws that affect publicly traded partnerships, including the elimination of the qualifying income exception upon which we rely for our treatment as a partnership for federal income tax purposes. Any modification to the federal income tax laws and interpretations thereof may or may not be retroactively applied and could make it more difficult or impossible to meet the exception for us to be treated as a partnership for federal income tax purposes. We are unable to predict whether any of these changes or other proposals will ultimately be enacted. However, it is possible that a change in law could affect us, and any such changes could negatively impact the value of an investment in our common units.
Our unitholders' share of our income is taxable to them for federal income tax purposes even if they do not receive any cash distributions from us.
Because a unitholder is treated as a partner to whom we allocate taxable income which could be different in amount than the cash we distribute, a unitholder's allocable share of our taxable income is taxable to it, which may require the payment of federal income taxes and, in some cases, state and local income taxes, on its share of our taxable income even if it receives no cash distributions from us. Our unitholders may not receive cash distributions from us equal to their share of our taxable income or even equal to the actual tax liability that results from that income.
If the IRS contests the federal income tax positions we take, the market for our common units may be adversely impacted and the cost of any IRS contest will reduce our cash available for distribution to our unitholders.
The IRS has made no determination with respect to our treatment as a partnership for federal income tax purposes or any other matter affecting us. The IRS may adopt positions that differ from the positions we take, and the IRS's positions may ultimately be sustained. It may be necessary to resort to administrative or court proceedings to sustain some or all of the positions we take and such positions may not ultimately be sustained. A court may not agree with some or all the positions we take. Any contest with the IRS, and the outcome of any IRS contest, may have a materially adverse impact on the market for our common units and the price at which they trade. In addition, our costs of any contest with the IRS will be borne indirectly by our unitholders because the costs will reduce our cash available for distribution.
We have a subsidiary that is treated as a corporation for federal income tax purposes and subject to corporate-level income taxes.
Even though we (as a partnership for U.S. federal income tax purposes) are not subject to federal income tax, some of our operations are currently conducted through a subsidiary that is organized as a corporation for federal income tax purposes. The taxable income, if any, of a subsidiary that is treated as a corporation for U.S. federal income tax purposes, is subject to corporate-level federal income taxes, which may reduce the cash available for distribution to us and, in turn, to our unitholders. If the IRS or other state or local jurisdictions were to successfully assert that this corporation has more tax liability than we anticipate or legislation was enacted that increased the corporate tax rate, the cash available for distribution could be further reduced. The income tax return filings positions taken by this corporate subsidiary require significant judgment, use of estimates, and the interpretation and application of complex tax laws. Significant judgment is also required in assessing the timing and amounts of deductible and taxable items. Despite our belief that the income tax return positions taken by this subsidiary are fully supportable, certain positions may be successfully challenged by the IRS, state or local jurisdictions.
Tax gain or loss on the disposition of our common units could be more or less than expected.
If you sell your common units, you will recognize a gain or loss for federal income tax purposes equal to the difference between the amount realized and your tax basis in those common units. Because distributions in excess of your allocable share of our net taxable income decrease your tax basis in your common units, the amount, if any, of such prior excess distributions with respect to the common units you sell will, in effect, become taxable income to you if you sell such common units at a price greater than your tax basis in those common units, even if the price you receive is less than your original cost. Furthermore, a substantial
39
portion of the amount realized on any sale of your common units, whether or not representing gain, may be taxed as ordinary income due to potential recapture items, including depreciation and depletion recapture. In addition, because the amount realized includes a unitholder's share of our nonrecourse liabilities, if you sell your common units, you may incur a tax liability in excess of the amount of cash you receive from the sale.
Tax-exempt entities and non-U.S. persons face unique tax issues from owning our common units that may result in adverse tax consequences to them.
Investment in common units by tax-exempt entities, such as employee benefit plans and individual retirement accounts (known as IRAs), and non-U.S. persons raises issues unique to them. For example, virtually all of our income allocated to organizations that are exempt from federal income tax, including IRAs and other retirement plans, is unrelated business taxable income and is taxable to them.
Distributions to non-U.S. persons are reduced by withholding taxes at the highest applicable effective tax rate, and non-U.S. persons are required to file federal income tax returns and pay tax on their share of our taxable income. If you are a tax-exempt entity or a non-U.S. person, you should consult a tax advisor before investing in our common units.
We treat each purchaser of common units as having the same tax benefits without regard to the actual common units purchased. The IRS may challenge this treatment, which could adversely affect the value of the common units.
Because we cannot match transferors and transferees of common units and because of other reasons, we have adopted depreciation and amortization positions that may not conform to all aspects of existing Treasury Regulations. A successful IRS challenge to those positions could adversely affect the amount of tax benefits available to you. It also could affect the timing of these tax benefits or the amount of gain or loss from your sale of common units and could have a negative impact on the value of our common units or result in audit adjustments to your tax returns.
We prorate our items of income, gain, loss and deduction for federal income tax purposes between transferors and transferees of our units each month based upon the ownership of our units on the first day of each month, instead of on the basis of the date a particular unit is transferred. The IRS may challenge this treatment, which could change the allocation of items of income, gain, loss and deduction among our unitholders.
We prorate our items of income, gain, loss and deduction for federal income tax purposes between transferors and transferees of our units each month based upon the ownership of our units on the first day of each month, instead of on the basis of the date a particular unit is transferred. The use of this proration method may not be permitted under existing Treasury Regulations. The U.S. Treasury Department has issued proposed regulations that provide a safe harbor pursuant to which publicly traded partnerships may use a similar monthly simplifying convention to allocate tax items among transferor and transferee unitholders. Nonetheless, the proposed regulations do not specifically authorize the use of the proration method we have adopted. If the IRS were to challenge this method or new Treasury Regulations were issued, we may be required to change the allocation of items of income, gain, loss and deduction among our unitholders.
A unitholder whose common units are loaned to a “short seller” to effect a short sale of common units may be considered as having disposed of those common units. If so, he would no longer be treated for federal income tax purposes as a partner with respect to those common units during the period of the loan and may recognize gain or loss from the disposition.
Because a unitholder whose common units are loaned to a “short seller” to effect a short sale of common units may be considered as having disposed of the loaned common units, he may no longer be treated for federal income tax purposes as a partner with respect to those common units during the period of the loan to the short seller and the unitholder may recognize gain or loss from such disposition. Moreover, during the period of the loan to the short seller, any of our income, gain, loss or deductions with respect to those common units may not be reportable by the unitholder, and any cash distributions received by the unitholder as to those common units could be fully taxable as ordinary income. Our unitholders desiring to assure their status as partners and avoid the risk of gain recognition from a loan to a short seller are urged to consult a tax advisor to discuss whether it is advisable to modify any applicable brokerage account agreements to prohibit their brokers from loaning their common units.
The sale or exchange of 50% or more of our capital and profits interests during any twelve-month period will result in the termination of our partnership for federal income tax purposes.
We will be considered to have technically terminated our partnership for federal income tax purposes if there is a sale or exchange of 50% or more of the total interests in our capital and profits within a twelve-month period. For purposes of determining whether the 50% threshold has been met, multiple sales of the same interest will be counted only once. Our technical termination would, among other things, result in the closing of our taxable year for all unitholders, which would result in us filing two tax returns (and our unitholders could receive two Schedules K-1 if relief was not available, as described below) for one fiscal year and could result in a deferral of depreciation deductions allowable in computing our taxable income. In the case of a unitholder reporting on a taxable year other than a fiscal year ending December 31, the closing of our taxable year may also result in more than twelve months of our taxable income or loss being includable in his taxable income for the year of termination. Our termination currently
40
would not affect our classification as a partnership for federal income tax purposes, but instead we would be treated as a new partnership for tax purposes. If treated as a new partnership, we must make new tax elections and could be subject to penalties if we are unable to determine that a termination occurred. The IRS has announced a publicly traded partnership technical termination relief program whereby, if a publicly traded partnership that technically terminated requests publicly traded partnership technical termination relief and such relief is granted by the IRS, among other things, the partnership will only have to provide one Schedule K-1 to unitholders for the year in which the termination occurs, notwithstanding two partnership tax years.
We may become a resident of Canada and be required to pay tax in Canada on our worldwide income, which could reduce our earnings, and unitholders could then become taxable in Canada in respect of their ownership of our common units.
Under the Income Tax Act (Canada), or the Canadian Tax Act, a company that is resident in Canada is subject to tax in Canada on its worldwide income, and unitholders of a company resident in Canada may be subject to Canadian capital gains tax on a disposition of its units and to Canadian withholding tax on dividends paid in respect of such units.
Under Canadian law, our place of residence would generally be determined based on the location where our central management and control is exercised. Although our central management and control is currently exercised in the United States and we intend to continue to conduct our affairs and operate in such a manner, if we were nonetheless to be considered a Canadian resident for purposes of the Canadian Tax Act, our worldwide income would become subject to Canadian income tax under the Canadian Tax Act. Further, unitholders who are non-residents of Canada may become subject under the Canadian Tax Act to tax in Canada on any gains realized on the disposition of our units and would become subject to Canadian withholding tax on dividends paid or deemed to be paid by us, subject to any relief that may be available under a tax treaty or convention.
As a result of investing in our common units, you may become subject to state and local taxes and return filing requirements in jurisdictions where we operate or own or acquire properties.
In addition to federal income taxes, our unitholders could be subject to other taxes, including state and local taxes, unincorporated business taxes and estate, inheritance or intangible taxes that are imposed by the various jurisdictions in which we conduct business or control property now or in the future, even if they do not live in any of those jurisdictions. Our unitholders will likely be required to file state and local income tax returns and pay state and local income taxes in some or all of these various jurisdictions. Further, our unitholders may be subject to penalties for failure to comply with those requirements. We currently own property or conduct business in many states, most of which impose an income tax on individuals, corporations and other entities. As we make acquisitions or expand our business, we may control assets or conduct business in additional states that impose a personal income tax. It is your responsibility to file all federal, state and local tax returns. Please consult your tax advisor.
41
ITEM 1B. UNRESOLVED STAFF COMMENTS
None.
ITEM 2. PROPERTIES
Please see Item 1. Business above for descriptions and discussion of our segments' principal properties:
• | Mineral Reserves; |
• | Mines and Wet Plants; |
• | Dry Plant Facilities; |
• | Transportation Logistics and Infrastructure; |
• | Dallas-Fort Worth Facility; and |
• | Birmingham Facility. |
In addition to these properties used in operations, we lease office space for subsidiary and corporate administrative staff:
• | Sand segment - Ft. Worth, Texas; |
• | Fuel Segment - Birmingham, Alabama and Arlington, Texas; and |
• | Corporate - Southlake, Texas. |
ITEM 3. LEGAL PROCEEDINGS
Although we are, from time to time, involved in litigation and claims arising out of our operations in the normal course of business, we do not believe that we are a party to any litigation that could have a material adverse impact on our financial condition or results of operations. We are not aware of any undisclosed significant legal or governmental proceedings against us, or contemplated to be brought against us. We maintain such insurance policies with insurers in amounts and with coverage and deductibles as our general partner believes are reasonable and prudent. However, we cannot assure you that this insurance will be adequate to protect us from all material expenses related to potential future claims for personal and property damage or that these levels of insurance will be available in the future at economical prices.
Environmental Matter
On November 21, 2013, the EPA issued a General Notice Letter and Information Request (“Notice”) under Section 104(e) of CERCLA to one of our subsidiaries operating within the Fuel segment. The Notice provides that the subsidiary may have incurred liability with respect to the Reef Environmental site in Alabama, and requested certain information in accordance with Section 107(a) of CERCLA. We timely responded to the Notice. At this time, no specific claim for cost recovery has been made by the EPA (or any other potentially responsible party) against us. There is uncertainty relating to our share of environmental remediation liability, if any, because our allocable share of wastewater is unknown and the total remediation cost is also unknown. Consequently, management is unable to estimate the possible loss or range of loss, if any. We have not recorded a loss contingency accrual in our financial statements. In the opinion of management, the outcome of such matters will not have a material adverse effect on our financial position, liquidity or results of operations.
ITEM 4. MINE SAFETY DISCLOSURES
We adhere to a strict occupational health program aimed at controlling exposure to silica dust, which includes dust sampling, a respiratory protection program, medical surveillance, training and other components. We designed our safety program to ensure compliance with the standards of our Occupational Health and Safety Manual and U.S. Federal Mine Safety and Health Administration (“MSHA”) regulations. For both health and safety issues, extensive training is provided to employees. We have organized safety committees at our plants made up of both salaried and hourly employees. We perform annual internal health and safety audits and conduct semi-annual crisis management drills to test our abilities to respond to various situations. Our corporate health and safety department administers the health and safety programs with the assistance of plant environmental, health and safety coordinators.
42
All of our production facilities are classified as mines and are subject to regulation by MSHA under the Federal Mine Safety and Health Act of 1977 (the “Mine Act”). MSHA inspects our mines on a regular basis and issues various citations and orders when it believes a violation has occurred under the Mine Act. Following passage of The Mine Improvement and New Emergency Response Act of 2006, MSHA significantly increased the numbers of citations and orders charged against mining operations. The dollar penalties assessed for citations issued has also increased in recent years. Information concerning mine safety violations or other regulatory matters required by Section 1503(a) of the Dodd-Frank Wall Street Reform and Consumer Protection Act and Item 104 of Regulation S-K (17 CFR 229.104) is included in Exhibit 95.1 to this Annual Report on Form 10-K.
43
PART II
ITEM 5. MARKET FOR REGISTRANT'S COMMON EQUITY, RELATED UNITHOLDER MATTERS AND ISSUER PURCHASES OF EQUITY SECURITIES
Our common units are listed on the NYSE under the symbol “EMES” and began trading on May 14, 2013 on a “when-issued” basis. Prior to May 14, 2013, our common units were not listed on any exchange or traded in any public market. On February 23, 2015, the closing market price for the common units was $54.00 per unit. As of February 23, 2015, there were 23,718,961 common units outstanding. There were approximately 34,744 record holders of common units on December 31, 2014. This number does not include unitholders whose units are held in trust by other entities. The actual number of unitholders is greater than the number of holders of record.
The following table sets forth, for each period indicated, the high and low sales prices per common unit, as reported on the NYSE, and the cash distributions declared and paid per common unit during each quarter since our initial public offering:
Quarter Ended | High Price | Low Price | Distributions Declared Per Unit | |||||||
June 30, 2013 | $ | 21.44 | $ | 16.44 | N/A | |||||
September 30, 2013 | $ | 33.00 | $ | 20.06 | $0.37 | |||||
December 31, 2013 | $ | 45.03 | $ | 29.99 | $0.86 | |||||
March 31, 2014 | $ | 62.69 | $ | 42.28 | $1.00 | |||||
June 30, 2014 | $ | 116.99 | $ | 59.60 | $1.13 | |||||
September 30, 2014 | $ | 145.72 | $ | 101.11 | $1.17 | |||||
December 31, 2014 | $ | 118.71 | $ | 39.90 | $1.38 | |||||
Cash Distribution Policy
Our partnership agreement requires that we distribute all of our available cash quarterly, as defined by the Board. The actual distributions we declare are subject to our operating performance, prevailing market conditions, the impact of unforeseen events, and the approval of our Board of Directors in a manner consistent with our distribution policy. Under our Cash Distribution Policy, available cash is generally defined to mean, for each quarter, the amount of cash generated during the quarter that the Board determines is available for distribution to unitholders. The Board may consider the advice of management, the amount of cash needed for maintenance capital expenditures, debt service and other of our contractual obligations and any future operating or capital needs that the Board deems necessary or appropriate. The Board may also consider our ability to comply with the financial tests and covenants contained in our credit agreement and any other debt instrument under which we have similar obligations. The Board may establish cash reserves for the prudent conduct of our business.
There is no guarantee that we will distribute quarterly cash distributions to our unitholders. Our cash distribution policy is subject to restrictions on cash distributions under our credit facility. Specifically, our credit facility contains financial tests and covenants that we must satisfy before quarterly cash distributions can be paid. In addition, our ability to pay quarterly cash distributions will be restricted if an event of default has occurred under our credit facility. See Item 7. Management's Discussion and Analysis of Financial Condition and Results of Operation — Liquidity and Capital Resources — Credit Facility.
Issuer Purchases of Equity Securities
None.
Performance Graph
The following graph compares the performance of our common units since the IPO to the Standard & Poor's 500 Index (the “S&P 500 Index”) and the Alerian MLP Total Return Index (the “Alerian MLP Index”) by assuming $100 was invested in each investment option as of May 14, 2013, the date of the IPO, and reinvestment of all dividends and distributions. The Alerian MLP Index is a composite of the 50 most prominent energy master limited partnerships, or MLPs, and is calculated using a float-adjusted, capitalization-weighted methodology. The results shown in the graph are based on historical data and should not be considered indicative of future performance.
44
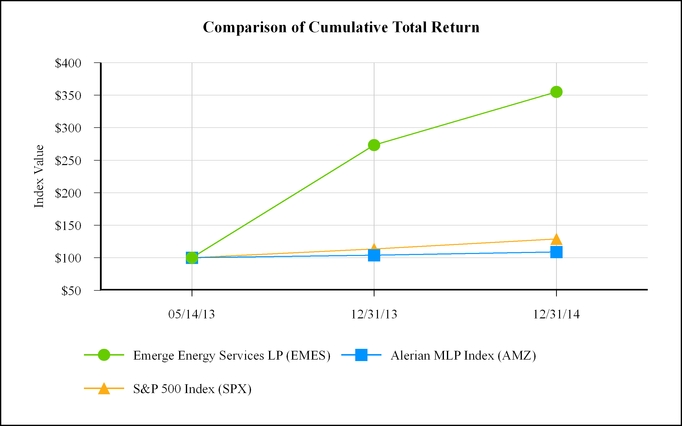
ITEM 6. SELECTED FINANCIAL DATA
The following table presents our selected financial and operating data as of the dates and for the periods indicated. The following table should be read in conjunction with Item 7. Management's Discussion and Analysis of Financial Condition and Results of Operations.
Our historical results of operations for the periods presented below may not be comparable either from period to period or going forward due to the following significant transactions:
• | Our IPO in May 2013 resulted in: |
• | net proceeds of $116.2 million; |
• | non-recurring charges of $11.0 million; |
• | our ability to repay substantially all of our pre-existing long-term debt at that time and refinance at more favorable terms; and |
• | on-going general and administrative costs subsequent to our IPO related to compliance with statutory and other requirements of a publicly traded limited partnership. |
• | The financial position and results of operations of Direct Fuels were included in the consolidated financial statements from and as of the date of acquisition, May 14, 2013. Our acquisition of Direct Fuels expanded our Fuel segment's operations, gained new customers, improved our earnings, and increased our markets through a larger geographical presence. |
• | During 2012 and 2014, our Sand segment incurred significant growth capital expenditures to keep pace with rapidly increasing demand for our Northern White frac sand. |
45
Year Ended December 31, | |||||||||||||||
2014 | 2013 | 2012 | 2011 | ||||||||||||
($ in thousands, except per unit data) | |||||||||||||||
Statement of Operations Data: | |||||||||||||||
Revenues | $ | 1,111,254 | $ | 873,255 | $ | 624,096 | $ | 377,488 | |||||||
Cost of goods sold (excluding depreciation, depletion and amortization) | 950,006 | 767,911 | 575,408 | 359,822 | |||||||||||
Depreciation, depletion and amortization | 24,803 | 20,828 | 9,119 | 6,880 | |||||||||||
Selling, general and administrative expenses | 38,723 | 26,835 | 10,256 | 9,221 | |||||||||||
IPO transaction-related costs | — | 10,966 | — | — | |||||||||||
Impairment charges | — | — | — | 762 | |||||||||||
Income from operations | 97,722 | 46,715 | 29,313 | 803 | |||||||||||
Interest expense, net | 7,394 | 10,586 | 11,055 | 3,371 | |||||||||||
Loss (gain) on extinguishment of debt | — | 907 | 377 | (472 | ) | ||||||||||
Gain on extinguishment of trade payable | — | — | — | (1,212 | ) | ||||||||||
Other | 611 | (334 | ) | 605 | (300 | ) | |||||||||
Income (loss) before provision for income taxes | 89,717 | 35,556 | 17,276 | (584 | ) | ||||||||||
Provision for income taxes | 638 | 386 | 81 | 101 | |||||||||||
Net income (loss) | 89,079 | 35,170 | $ | 17,195 | $ | (685 | ) | ||||||||
Less Predecessor net income before May 14, 2013 | — | 13,124 | |||||||||||||
Post-IPO net income | $ | 89,079 | $ | 22,046 | |||||||||||
Earnings per common unit (basic) | $ | 3.70 | $ | 0.92 | |||||||||||
Earnings per common unit (diluted) | $ | 3.70 | $ | 0.92 | |||||||||||
Balance Sheet Data (at year end): | |||||||||||||||
Property, plant and equipment, net | $ | 238,657 | $ | 146,131 | $ | 131,414 | $ | 88,056 | |||||||
Total assets | $ | 436,968 | $ | 323,016 | $ | 195,789 | $ | 127,580 | |||||||
Long-term debt | $ | 222,904 | $ | 97,511 | $ | 145,938 | $ | 99,506 | |||||||
Statement of Cash Flow Data: | |||||||||||||||
Net cash provided by (used in): | |||||||||||||||
Operating activities | $ | 86,161 | $ | 58,036 | $ | 1,137 | $ | (3,606 | ) | ||||||
Investing activities | $ | (88,172 | ) | $ | (38,009 | ) | $ | (39,075 | ) | $ | (14,754 | ) | |||
Financing activities | $ | 6,720 | $ | (19,327 | ) | $ | 32,884 | $ | 19,617 | ||||||
Capital expenditures: | |||||||||||||||
Maintenance (1) | $ | (3,240 | ) | $ | (2,394 | ) | $ | (2,520 | ) | $ | (974 | ) | |||
Growth (2) | (74,644 | ) | (18,975 | ) | (37,945 | ) | (14,204 | ) | |||||||
Total | $ | (77,884 | ) | $ | (21,369 | ) | $ | (40,465 | ) | $ | (15,178 | ) | |||
Other Financial Data: | |||||||||||||||
Cash dividends declared per common unit | $ | 4.68 | $ | 1.23 | |||||||||||
Adjusted EBITDA (3) | $ | 131,866 | $ | 85,191 | $ | 38,574 | $ | 9,281 | |||||||
(1) | Maintenance capital expenditures are capital expenditures required to maintain, over the long term, our asset base, operating income or operating capacity. The maintenance capital expenditure amounts set forth above are unaudited. |
(2) | Growth capital expenditures are capital expenditures made to increase, over the long term, our asset base, operating income or operating capacity. The growth capital expenditure amounts set forth above are unaudited. |
(3) | See “Adjusted EBITDA” below for a definition of Adjusted EBITDA and a reconciliation to net income (loss). |
46
Quarterly Data
Quarter | |||||||||||||||
First | Second | Third | Fourth | ||||||||||||
($ in thousands, except per unit data) | |||||||||||||||
2014: | |||||||||||||||
Revenues | $ | 274,081 | $ | 298,273 | $ | 296,338 | $ | 242,562 | |||||||
Operating income | 20,040 | 22,173 | 28,592 | 26,917 | |||||||||||
Net income | 18,486 | 20,092 | 26,083 | 24,418 | |||||||||||
Earnings per common unit (basic) (2) | $ | 0.77 | $ | 0.84 | $ | 1.08 | $ | 1.01 | |||||||
Earnings per common unit (diluted) (2) | $ | 0.77 | $ | 0.84 | $ | 1.08 | $ | 1.01 | |||||||
Cash dividends declared per common unit (3) | $ | 1.00 | $ | 1.13 | $ | 1.17 | $ | 1.38 | |||||||
2013: | |||||||||||||||
Revenues | $ | 152,055 | $ | 204,929 | $ | 270,241 | $ | 246,030 | |||||||
Operating income | 14,114 | 197 | 17,102 | 15,302 | |||||||||||
Net income (loss) | 9,913 | (4,138 | ) | 15,404 | 13,991 | ||||||||||
Net income through May 14, 2013 (1) | $ | 9,913 | $ | 3,211 | |||||||||||
Net income (loss) subsequent to May 14, 2013 (1) | $ | (7,349 | ) | $ | 15,404 | $ | 13,991 | ||||||||
Earnings per common unit (basic) (2) | $ | (0.32 | ) | $ | 0.64 | $ | 0.58 | ||||||||
Earnings per common unit (diluted) (2) | $ | (0.32 | ) | $ | 0.64 | $ | 0.58 | ||||||||
Cash dividends declared per common unit (3) | $ | — | $ | 0.37 | $ | 0.86 | |||||||||
(1) | Prior to May 14, 2013, our financial statements consist of the combined results of SSS and AEC. Subsequent to the IPO, we have also included the operations of Direct Fuels, which was purchased on May 14, 2013. We accounted for this acquisition as a business combination. |
(2) | Earnings per common unit are based on the results of operations subsequent to our IPO on May 14, 2013. |
(3) | Distributions related to the earnings of one quarter are declared and paid in the subsequent quarter. |
ADJUSTED EBITDA
Adjusted EBITDA is a non-GAAP financial measure we define generally as: net income plus interest expense, tax expense, depreciation, depletion and amortization expense, non-cash charges and unusual or non-recurring charges less interest income, tax benefits and selected gains that are unusual or non-recurring. Adjusted EBITDA is used as a supplemental financial measure by our management and external users of our financial statements, such as investors and commercial banks, to assess:
• | the financial performance of our assets without regard to the impact of financing methods, capital structure or historical cost basis of our assets; |
• | the viability of capital expenditure projects and the overall rates of return on alternative investment opportunities; |
• | our liquidity position and the ability of our assets to generate cash sufficient to make debt payments and to make distributions; and |
• | our operating performance as compared to those of other companies in our industry without regard to the impact of financing methods and capital structure. |
We believe that Adjusted EBITDA provides useful information to investors because, when viewed with our GAAP results and the accompanying reconciliations, it provides a more complete understanding of our performance than GAAP results alone. We also believe that external users of our financial statements benefit from having access to the same financial measures that management uses in evaluating the results of our business. In addition, the lenders under our credit facility use a metric similar to Adjusted EBITDA to measure our compliance with certain financial covenants.
Adjusted EBITDA should not be considered an alternative to, or more meaningful than, net income, operating income, cash flows from operating activities or any other measure of financial performance presented in accordance with GAAP. Moreover, our Adjusted EBITDA as presented may not be comparable to similarly titled measures of other companies.
47
Reconciliation of Net Income (Loss) to Adjusted EBITDA
The following tables present a reconciliation of net income (loss) to Adjusted EBITDA for each segment, corporate, and in total.
Year Ended December 31, 2014 | |||||||||||||||
Sand Segment | Fuel Segment | Corporate | Total | ||||||||||||
($ in thousands) | |||||||||||||||
Net income (loss) | $ | 108,956 | $ | 6,377 | $ | (26,254 | ) | $ | 89,079 | ||||||
Interest expense, net | — | — | 7,394 | 7,394 | |||||||||||
Other loss | — | — | 611 | 611 | |||||||||||
Provision for income taxes | — | — | 638 | 638 | |||||||||||
Operating income (loss) | 108,956 | 6,377 | (17,611 | ) | 97,722 | ||||||||||
Depreciation, depletion and amortization | 12,777 | 11,998 | 28 | 24,803 | |||||||||||
Equity-based compensation expense | — | — | 9,042 | 9,042 | |||||||||||
Loss (gain) on disposal of equipment | 19 | (11 | ) | — | 8 | ||||||||||
Provision for doubtful accounts | 103 | 150 | — | 253 | |||||||||||
Accretion of asset retirement obligations | 38 | — | — | 38 | |||||||||||
Adjusted EBITDA | $ | 121,893 | $ | 18,514 | $ | (8,541 | ) | $ | 131,866 | ||||||
Year Ended December 31, 2013 | |||||||||||||||
Sand Segment | Fuel Segment | Corporate | Total | ||||||||||||
($ in thousands) | |||||||||||||||
Net income (loss) | $ | 55,338 | $ | 12,566 | $ | (32,734 | ) | $ | 35,170 | ||||||
Interest expense, net | — | — | 10,586 | 10,586 | |||||||||||
Loss on extinguishment of debt | — | — | 907 | 907 | |||||||||||
Other income | — | — | (334 | ) | (334 | ) | |||||||||
Provision for income taxes | — | — | 386 | 386 | |||||||||||
Operating income (loss) | 55,338 | 12,566 | (21,189 | ) | 46,715 | ||||||||||
Depreciation, depletion and amortization | 10,458 | 10,369 | 1 | 20,828 | |||||||||||
IPO transaction-related costs | — | — | 10,966 | 10,966 | |||||||||||
Equity-based compensation expense | — | — | 5,734 | 5,734 | |||||||||||
Loss (gain) on disposal of equipment | 773 | (18 | ) | — | 755 | ||||||||||
Provision for doubtful accounts | 51 | 139 | — | 190 | |||||||||||
Accretion of asset retirement obligations | 3 | — | — | 3 | |||||||||||
Adjusted EBITDA | $ | 66,623 | $ | 23,056 | $ | (4,488 | ) | $ | 85,191 | ||||||
48
Year Ended December 31, 2012 | |||||||||||||||
Sand Segment | Fuel Segment | Corporate | Total | ||||||||||||
($ in thousands) | |||||||||||||||
Net income (loss) | $ | 27,384 | $ | 2,011 | $ | (12,200 | ) | $ | 17,195 | ||||||
Interest expense, net | — | — | 11,055 | 11,055 | |||||||||||
Loss on extinguishment of debt | — | — | 377 | 377 | |||||||||||
Other income | — | — | 605 | 605 | |||||||||||
Provision for income taxes | — | — | 81 | 81 | |||||||||||
Operating income (loss) | 27,384 | 2,011 | (82 | ) | 29,313 | ||||||||||
Depreciation, depletion and amortization | 6,377 | 2,742 | — | 9,119 | |||||||||||
Loss (gain) on disposal of equipment | (33 | ) | 5 | — | (28 | ) | |||||||||
Provision for doubtful accounts | 57 | 113 | — | 170 | |||||||||||
Adjusted EBITDA | $ | 33,785 | $ | 4,871 | $ | (82 | ) | $ | 38,574 | ||||||
Year Ended December 31, 2011 | |||||||||||||||
Sand Segment | Fuel Segment | Corporate | Total | ||||||||||||
($ in thousands) | |||||||||||||||
Net income (loss) | $ | (1,846 | ) | $ | 2,649 | $ | (1,488 | ) | $ | (685 | ) | ||||
Interest expense, net | — | — | 3,371 | 3,371 | |||||||||||
Loss on extinguishment of debt | — | — | (472 | ) | (472 | ) | |||||||||
Other income | — | — | (300 | ) | (300 | ) | |||||||||
Provision for income taxes | — | — | 101 | 101 | |||||||||||
Gain on extinguishment of trade payable | — | — | (1,212 | ) | (1,212 | ) | |||||||||
Operating income (loss) | (1,846 | ) | 2,649 | — | 803 | ||||||||||
Depreciation, depletion and amortization | 4,022 | 2,858 | — | 6,880 | |||||||||||
Loss (gain) on disposal of equipment | 364 | (111 | ) | — | 253 | ||||||||||
Impairment of assets | 762 | — | — | 762 | |||||||||||
Provision for doubtful accounts | 11 | — | — | 11 | |||||||||||
Equipment relocation costs | 572 | — | — | 572 | |||||||||||
Adjusted EBITDA | $ | 3,885 | $ | 5,396 | $ | — | $ | 9,281 | |||||||
49
ITEM 7. MANAGEMENT'S DISCUSSION AND ANALYSIS OF FINANCIAL CONDITION AND RESULTS OF OPERATIONS
The following discussion analyzes our financial condition and results of operations and should be read in conjunction with our historical consolidated financial statements and notes included elsewhere in this Annual Report.
Acquisition of Direct Fuels
On May 14, 2013, we completed the acquisition of Direct Fuels' net assets for $98.3 million. Direct Fuels operates a motor fuel terminal and transmix processing facility in Texas. The acquisition of Direct Fuels expands our geographic presence into the Dallas-Fort Worth, Texas market. Direct Fuels is part of our Fuel segment.
Acquisition of Mineral Reserves
On July 25, 2014, we completed an acquisition of mineral reserves and related assets to help manage the supply and cost of raw sand to our Wisconsin sand processing plants. See Note 3 to our Consolidated Financial Statements for further information.
How We Evaluate Our Operations
Our management uses a variety of financial and operational metrics to analyze our performance. We evaluate the performance of our Sand and Fuel segments based on their volumes sold, revenues, operating income and Adjusted EBITDA. We view these metrics as important factors in evaluating our profitability and review these measurements frequently to analyze trends and make decisions.
Sales volumes
We view the total volume of frac sand and refined products that we sell as an important measure of our ability to effectively utilize our assets. Higher volumes improve profitability through the spreading of fixed costs over greater volumes. Our sales volumes are subject to seasonality, particularly in our Sand segment. Please see Part I, Item 1. Business.
Adjusted EBITDA
Adjusted EBITDA, a non-GAAP financial measure, is used as supplemental measures by our management and by external users of our financial statements such as investors, commercial banks, research analysts and others, to assess:
• | the financial performance of our assets without regard to the impact of financing methods, capital structure or historical cost basis of our assets; |
• | the viability of capital expenditure projects and the overall rates of return on alternative investment opportunities; and |
• | our operating performance as compared to those of other companies in our industry without regard to the impact of financing methods and capital structure. |
See Item 6. Selected Financial and Operating Data—Adjusted EBITDA for a discussion of Adjusted EBITDA and a reconciliation to net income (loss).
Recent Trends
Sand Segment
There are a number of factors that have contributed to the increased use of frac sand over the past several years, many of which continue to drive toward increased future consumption as well. These factors, which include the increased drilling of horizontal wells over vertical and directional wells, increased drilling efficiencies, and increased use of sand per well, have driven demand for frac sand and we expect these trends to continue. However, during June of 2014, the price of West Texas Intermediate peaked at approximately $107 per barrel and fell over 50% by year end. This has resulted in a number of announcements by producers in the oil and gas industry that they intend to decrease their capital spending budgets in 2015, and the subsequent and rapid decline of rigs and personnel that were being utilized in North American oil and gas extraction. In general, producers and pressure pumpers are both looking to reduce their overall costs, as well as the cost of proppant.
Based on these factors, there are a number of trends that have emerged recently in the market. Demand for sand remains strong, as the technological improvements in drilling techniques continue to be adopted and are resulting in increased sand intensity per well. Even as the number of rigs decline, we do not expect the total amount of proppant required by the market to fall nearly as much and believe that it is likely that total proppant demand may actually increase in 2015 over 2014, if crude oil prices recover in the second half of 2015. However, as cost and efficiency continue to be the focus of our customers and their customers, we believe that Tier 1 suppliers of sand, such as SSS, will be in the most competitive advantage because of our low operating cost, logistics capabilities, transload network, high quality of sand, focus on customer service, and strong customer relationships. Based on conversations with customers and our knowledge of the industry, purchasers of proppant are increasing their purchases of raw
50
frac sand, especially Northern White frac sand, relative to more expensive alternatives (resin-coated sand and ceramics) while decreasing the number of suppliers from whom they purchase sand to primarily the Tier 1 suppliers.
While there have been a number of announcements of proposed and planned new capacity additions in the frac sand space, we believe that any additions will be much fewer in number and total scope for a variety of reasons. Permitting continues to be increasingly difficult as more communities are being more deliberate in their permitting processes. There is also a vocal minority that opposes frac sand mining for a variety of reasons, few of which are actually related to the frac sand companies themselves. When new capacity actually does get permitted, often that capacity does not get built. In markets such as those that exist as of December 31, 2014, companies are either reluctant to bring on new capacity without sufficient contracts for supply or may not be able to get funding to do so given caution by capital providers. We have also found that even when capacity gets built, operator inefficiencies, poor management, poor quality of product and inability to provide sufficient logistics solutions often mean that stated capacity is underutilized, regardless of the market.
For Tier 1 providers such as SSS, we believe that while the current market environment will be challenging, we are much better prepared to meet our financial and customer obligations than those companies that lack, either separately or in combinations, our contract portfolio, our logistics capabilities, our low cost and flexible operating structure and our favorable capital structure.
Fuel Segment
Total consumption of liquid fuels in the United States, including both fossil fuels and biofuels, is expected to remain relatively stable from 18.5 million barrels per day in 2012 to 18.8 million barrels per day in 2040, according to the Annual Energy Outlook 2014 published by the Energy Information Administration in May 2014. The transportation sector is expected to continue to account for the largest percentage of demand for liquid fuels (as measured by energy content) through 2040.
We believe that transmix processing volumes generally increase or decrease at approximately the same rate as the consumption of liquid fuels in the United States. Transmix processing volumes are also driven by changes in governmental regulations. We believe the only pending regulatory changes that will impact the volume of transmix produced in the United States are the regulations promulgated by the EPA in mid-2006 that required a reduction in the sulfur content of diesel fuel. Under these regulations, which resulted in significant increases in transmix volumes following their promulgation in 2006, the maximum allowable sulfur content for on-road diesel fuel was reduced on a phased basis from 500 ppm (low sulfur diesel) to 15 ppm (ultra-low sulfur diesel). In order to prevent contamination of the lower-sulfur fuels traveling through pipelines, pipeline operators had to reconfigure the way fuel was transported, which resulted in more interfaces between products and deeper “cuts” in those interfaces. Under the EPA's regulations, all on-road and off-road diesel had to meet a 15 ppm sulfur standard as of June 2010. A settlement agreement with the EPA indicates that the agency will allow use of 500 ppm diesel produced by transmix processors in locomotive engines as long as there is a market for it; however, railroads must begin purchasing Tier 4 locomotives, which only accept 15 ppm sulfur diesel, starting in 2015. As a result, 500 ppm sulfur diesel is expected to be phased out of the railroad market beginning in the middle of 2015. However, the settlement agreement allows us and other transmix process to sell 500 ppm diesel produced to certain marine markets with no phase-out date. Regardless, as mentioned above, we are taking steps to ensure that all of the diesel we sell is eventually 15 ppm or less.
2015 Outlook
We expect that demand for frac sand will continue to grow, although we expect the first half of 2015 to be a period of relative growth stagnation for the industry as increased sand intensity per well is countered by a dramatically lower rig count. Recent decreases in spot market prices for crude oil and natural gas have led to a corresponding decrease in spot market prices for proppant that we believe will continue into the first several months of 2015. However, we also believe, based both on historical precedent and conversations with our customers and producers of oil and gas, that there will be a rebound in demand as early as the second half of 2015. We expect that the secular trends of the industry will make any cyclical recovery very strong. Further, we believe that our strong logistics network and capabilities will continue to help us differentiate ourselves from those that lack critical infrastructure. In addition, we believe that the trend of industry consolidation that we saw commence in the summer of 2014 will continue.
We believe that our Fuel segment will contribute incrementally to 2015 results. While our 2015 Fuel segment expectation is generally positive, we anticipate that the current backwardated market will continue in the first quarter and maybe the first half of 2015 before market pricing allows Fuel margins to return to more historic levels. We continue to look for alternative markets for our diesel that contains over 15 ppm of sulfur, as well as alternative treatment methods to increase diesel margins from transmix.
51
Results of Operations
The following table summarizes our consolidated operating results for 2014, 2013 and 2012.
Year Ended December 31, | |||||||||||
2014 | 2013 | 2012 | |||||||||
($ in thousands) | |||||||||||
Revenues | $ | 1,111,254 | $ | 873,255 | $ | 624,096 | |||||
Operating expenses: | |||||||||||
Cost of goods sold (excluding depreciation, depletion and amortization) | 950,006 | 767,911 | 575,408 | ||||||||
Depreciation, depletion and amortization | 24,803 | 20,828 | 9,119 | ||||||||
Selling, general and administrative expenses | 38,723 | 26,835 | 10,256 | ||||||||
IPO transaction-related costs | — | 10,966 | — | ||||||||
Total operating expenses | 1,013,532 | 826,540 | 594,783 | ||||||||
Operating income | 97,722 | 46,715 | 29,313 | ||||||||
Other expense (income): | |||||||||||
Interest expense | 7,394 | 10,586 | 11,055 | ||||||||
Loss on extinguishment of debt | — | 907 | 377 | ||||||||
Other expense (income) | 611 | (334 | ) | 605 | |||||||
Total other expense | 8,005 | 11,159 | 12,037 | ||||||||
Income before provision income for taxes | 89,717 | 35,556 | 17,276 | ||||||||
Provision for income taxes | 638 | 386 | 81 | ||||||||
Net income | $ | 89,079 | $ | 35,170 | $ | 17,195 | |||||
Adjusted EBITDA (a) | $ | 131,866 | $ | 85,191 | $ | 38,574 | |||||
(a) | See Item 6. Selected Financial and Operating Data—Adjusted EBITDA for a discussion of Adjusted EBITDA and a reconciliation to net income (loss). |
Consolidated Summary
Our company has experienced significant change over the past three years, growing from a net income of $17.2 million in 2012 to a net income of $89.1 million in 2014. Most notable are the following events:
• | substantial growth of our Sand segment through addition of a dry plant in Wisconsin in each of 2011, 2012 and 2014, which significantly increased our overall production and profitability; |
• | the acquisition of Direct Fuels to substantially increase our Fuel segment in 2013; |
• | our IPO in 2013, which brought these two segments together for the first time and allowed us to refinance our debt at more favorable terms going forward; |
• | development of a network of sand transload sites in 2013 and 2014; and |
• | a steep decline in the market prices for fuel in late 2014, impacting our Sand and Fuel segments. |
52
Sand Segment
Year Ended December 31, | |||||||||||
2014 | 2013 | 2012 | |||||||||
($ in thousands) | |||||||||||
Revenues | $ | 341,836 | $ | 167,768 | $ | 66,697 | |||||
Operating expenses: | |||||||||||
Cost of goods sold (excluding depreciation, depletion and amortization) | 204,282 | 91,416 | 27,405 | ||||||||
Depreciation, depletion and amortization | 12,777 | 10,458 | 6,377 | ||||||||
Selling, general and administrative expenses | 15,821 | 10,556 | 5,531 | ||||||||
Operating income | $ | 108,956 | $ | 55,338 | $ | 27,384 | |||||
Adjusted EBITDA (a) | $ | 121,893 | $ | 66,623 | $ | 33,785 | |||||
Total tons of sand sold (in thousands) | 4,306 | 2,651 | 1,222 | ||||||||
Tons of sand produced by dry plant (in thousands): | |||||||||||
Arland, Wisconsin facility | 124 | — | — | ||||||||
Barron, Wisconsin facility | 2,224 | 1,334 | 18 | ||||||||
New Auburn, Wisconsin facility | 1,394 | 1,330 | 1,171 | ||||||||
Kosse, Texas facility | 299 | 115 | 149 | ||||||||
Total | 4,041 | 2,779 | 1,338 | ||||||||
(a) | See Item 6. Selected Financial and Operating Data—Adjusted EBITDA for a discussion of Adjusted EBITDA and a reconciliation to net income (loss). |
Overview
The operating income for our sand segment has seen substantial growth from an operating income of $27.4 million in 2012 to $55.3 million in 2013 and $109.0 million in 2014. Management has focused on growing this segment of our business by adding the Barron plant in late 2012 and the Arland plant in late 2014, as well as developing our distribution and logistics services to better serve our customers through additional transload sites in 2013 and 2014. At year-end 2014, we had thirteen transload sites in the U.S. and Canada. Many of these sites are considerably distant from our processing facilities in Wisconsin. Due to the distance to these markets, we charge higher prices to recover freight and handling. This condition increases our revenues and margin, but the margin percentage at our transload sites is lower than for sand sold directly from our Wisconsin plants due to lower markups on the incremental transportation costs.
We currently plan to construct two more dry plants in Barron County, WI which should be operational by the end of 2016.
Year Ended December 31, 2014 Compared to Year Ended December 31, 2013
Revenues
Sand revenues increased by $174.1 million, or 104%, from 2013 to 2014. This increase is attributable primarily to a 62% increase in total volumes sold, due primarily to the full utilization of our Barron dry plant in 2014 and, to a lesser extent, increased sales of native Texas sand and the opening of our Arland facility in December 2014. We also expanded our logistics and distribution network with the addition of transload facilities in the U.S. and Canada to serve our customers in various shale plays and basins. We generally charge higher prices at our transload sites in order to cover the additional costs for transportation from our plants to the transload sites. Management continues to focus on initiatives to strengthen and improve logistics service, including increased storage capacity and access to remote transload sites. These logistics-based initiatives are intended to complement and enhance customer support.
The major changes from 2013 to 2014 are as follows:
• | an estimated $88.4 million increase for higher markups related to transportation for increased sales through transload sites; |
• | $78.6 million increase in sales of Northern White sand (excluding estimated transportation markups), relating primarily to a 58% increase in volumes sold; and |
• | $7.1 million increase in sales of native Texas sand (from our Kosse plant) due to a 160% increase in volumes sold. |
53
Cost of goods sold (excluding depreciation, depletion and amortization)
Our cost of goods sold consists primarily of direct costs such as purchased sand, transportation to the plant or to transload facilities, mining and processing costs, and plant wages as well as indirect costs such as plant repairs and maintenance. All major components of our direct costs increased with our increased production and with the operations of our new plants, particularly transportation costs as we expanded our distribution network with new transload sites. The plant maintenance and repairs did not increase significantly, as the Wisconsin plants are still quite new. The most significant components of the $112.9 million increase from 2013 to 2014 are:
• | $81.8 million increased cost of transportation of finished sand, due to expansion of our transload system and significant shipments to these distant locations, and primarily including: |
• | $56.7 million increased rail shipping costs; |
• | $15.5 million increased railcar lease expense; and |
• | $9.4 million increased transload service expense; |
• | $22.5 million increased cost of produced sand, due to a 62.4% increase in total sand sold; and |
• | $3.2 million increased utilities expenses for higher utilization of our various plants. |
Depreciation, depletion and amortization
The $2.3 million increase in depreciation, depletion and amortization is due primarily to $1.1 million of depletion expense for the new Wisconsin sand reserves purchased in July 2014 as well as depreciation on other assets placed in service for wet plants and the Arland dry plant throughout the year.
Selling, general and administrative expense
The $5.3 million increase in selling, general and administrative expense is attributable to support for our expanded operations, including:
• | $3.4 million increase for employee-related costs, primarily incentive compensation due to greatly increased segment profits; and |
• | $1.4 million increase for insurance and professional services; and |
• | $0.4 million increase for software support and other information technology needs; |
Year Ended December 31, 2013 Compared to Year Ended December 31, 2012
Revenues
Sand revenues increased by $101.1 million, or 152%, from 2012 to 2013. This increase is attributable primarily to a 117% increase in total volumes sold with the addition of our Barron facility in December 2012 and volume increases from the New Auburn facility, which began operating in October 2011. We also expanded our logistics and distribution network with the addition of transload facilities in the U.S. and Canada to serve our customers in various shale plays and basins.
The major changes from 2012 to 2013 are as follows:
• | $97.0 million increase for the Barron plant due to: |
• | a full year of production after its December 2012 opening; and |
• | an estimated $34 million for higher markups related to sales from transload sites; and |
• | $5.5 million increase for the New Auburn plant due to: |
• | a production capacity increase with installation of an additional screen deck in 2013; |
• | partially offset by select customer discounts. |
• | $1.4 million decrease for the Kosse plant due primarily to decreased volumes as drilling activity shifted away from the nearby shale plays. |
Cost of goods sold (excluding depreciation, depletion and amortization)
Our cost of goods sold consists primarily of direct costs such as purchased sand, transportation to the plant or to transload facilities, mining and processing costs, and plant wages as well as indirect costs such as plant repairs and maintenance. All major components of our direct costs increased with our increased production and with the operations of our new plants, particularly transportation costs as we expanded our distribution network with new transload sites. The plant maintenance and repairs did not increase
54
significantly, as the Wisconsin plants are still quite new. The most significant components of the $64.0 million increase from 2012 to 2013 are:
• | $28.9 million increase in cost of produced sand, due to purchasing sand for the new Wisconsin plants; |
• | $28.6 million increase in cost of transportation of sand, mainly for rail freight and additional railcars to transport sand from our plants to the transload sites; and |
• | $3.6 million increase in mining costs related to the new Arland mine. |
Depreciation, depletion and amortization
The $4.1 million increase in depreciation, depletion and amortization is due primarily to a full year of depreciation for the Barron facility that was placed in service at the end of 2012. The major changes from 2012 to 2013 are:
• | $3.2 million increase for the Barron facility; |
• | $0.5 million increase for SSS corporate office, which was established in 2012; and |
• | $0.4 million increase for the New Auburn facility. |
Selling, general and administrative expense
Increased selling, general and administrative expense is attributable primarily to the addition of new sales and administrative employees as well as additional insurance coverage for our expanded operations.
Fuel Segment
Year Ended December 31, | |||||||||||
2014 | 2013 | 2012 | |||||||||
($ in thousands) | |||||||||||
Revenues | $ | 769,418 | $ | 705,487 | $ | 557,399 | |||||
Operating expenses: | |||||||||||
Cost of goods sold (excluding depreciation, depletion and amortization) | 745,724 | 676,495 | 548,003 | ||||||||
Depreciation, depletion and amortization | 11,998 | 10,369 | 2,742 | ||||||||
Selling, general and administrative expenses | 5,319 | 6,057 | 4,643 | ||||||||
Operating income | $ | 6,377 | $ | 12,566 | $ | 2,011 | |||||
Adjusted EBITDA (a) | $ | 18,514 | $ | 23,056 | $ | 4,871 | |||||
Volume of refined fuels sold (gallons in thousands) | 264,364 | 224,484 | 176,451 | ||||||||
Volume of terminal throughput (gallons in thousands) | 210,665 | 207,280 | 182,573 | ||||||||
Volume of transmix refined (gallons in thousands) | 116,611 | 91,813 | 23,992 | ||||||||
Refined transmix as a percent of total refined fuels sold | 44.1 | % | 40.9 | % | 13.6 | % | |||||
(a) | See Item 6. Selected Financial and Operating Data—Adjusted EBITDA for a discussion of Adjusted EBITDA and a reconciliation to net income (loss). |
Overview
After considerable growth in operating income for our Fuel segment from $2.0 million in 2012 to $12.6 million in 2013, we saw a decrease to $6.4 million in 2014. The 2013 increase is attributable primarily to the purchase of Direct Fuels on May 14, 2013, combined with improved fuel margins. The 2014 decrease occurred in the last half of 2014 when precipitous declines in fuel prices led to extended market backwardation, greatly eroding margins on fuel and outstripping the increased sales resulting from inclusion of a full year of sales for Direct Fuels.
Year Ended December 31, 2014 Compared to Year Ended December 31, 2013
Revenues
The $63.9 million, or 9%, increase in Fuel segment revenues is attributable to an 18% increase in total volumes sold. The increase in volume relates directly to incremental sales derived from Direct Fuels after the purchase on May 14, 2013 as well as modest increases in fuel sales in the Birmingham, AL market. Direct Fuels recorded approximately $130.0 million of revenues from January 1, 2014 through May 13, 2014, for which there are no corresponding 2013 sales reported. These incremental revenues in the first half of 2014 were more than offset by revenue decreases in the last half of 2014 due to market volatility.
55
The major components of the total $63.9 million increase in revenues are:
• | $115.9 million increase due to increased volumes, mainly for inclusion of a full year of Direct Fuels’ operations in 2014, offset by lower volumes sold in the last half of 2014 when prices had dropped; |
• | $54.7 million decrease in sales prices due primarily to drastic reduction in the market price of fuel late in 2014; and |
• | $3.1 million increase in excise and similar taxes. |
Fuel segment revenues includes excise and similar taxes. These taxes are offset on a one-to-one basis with excise and similar taxes in cost of goods sold.
Cost of goods sold (excluding depreciation, depletion and amortization)
Our cost of goods sold consists primarily of direct costs associated with the purchase of refined fuels, transmix feedstock, plant labor and burden, and costs to operate our transmix and terminal facilities. Direct Fuels incurred approximately $124.6 million of cost of goods sold from January 1, 2014 through May 13, 2014, for which there are no corresponding 2013 amounts reported. These incremental costs were more than offset by the steep price declines in the second half of 2014.
The major components of the $69.2 million total increase from 2013 to 2014 are:
• | $109.6 million increase due to increased volumes, mainly for inclusion of a full year of Direct Fuels’ operations in 2014; |
• | $44.3 million decrease in fuel purchase prices due primarily to drastic reduction in the market price of fuel late in 2014, particularly in the fourth quarter; and |
• | $3.1 million increase in excise and similar taxes. |
Fuel segment cost of goods sold include excise and similar taxes. These taxes are offset on a one-to-one basis with excise and similar taxes in revenues.
Depreciation, depletion and amortization
The $1.6 million increase in depreciation, depletion and amortization is due primarily to recognizing a full year of expense in 2014 for the assets acquired with our purchase of Direct Fuels on May 14, 2013.
Selling, general and administrative expense
Our selling, general and administrative expenses decreased $0.7 million, due primarily to decreased incentive compensation.
Year Ended December 31, 2013 Compared to Year Ended December 31, 2012
Revenues
The $148.1 million, or 27%, increase in Fuel segment revenues is attributable to a 27% increase in total volumes sold. The increase in volume relates directly to incremental sales derived from Direct Fuels after the purchase on May 14, 201.3, partially offset by reduced gasoline sales in the Birmingham, Alabama market. The Birmingham market experienced constrained gasoline supplies for much of 2013 due to pipeline allocations. Major changes from 2012 to 2013 are as follows:
• | $218.2 million for Direct Fuels' incremental revenues (May 14, 2013 through December 31, 2013); |
• | $25.8 million increased sales of diesel fuel; and |
• | $5.8 million increase in excise and similar taxes; offset by |
• | $101.0 million reduced revenues due to constrained gasoline supplies in the Birmingham market. |
Cost of goods sold (excluding depreciation, depletion and amortization)
Our cost of goods sold consists primarily of direct costs associated with the purchase of refined fuels, transmix feedstock, plant labor and burden, and costs to operate our transmix and terminal facilities. Our cost of goods sold increased 23% in 2013 as compared to 2012. This net increase results from incremental costs associated with Direct Fuels partially offset by reduced purchases of gasoline and a higher percentage of refined fuels derived from transmix refining. The major components of the $128.5 million increase from 2012 to 2013 are as follows:
• | $209.1 million of Direct Fuels' incremental cost of goods sold (May 14, 2013 through December 31, 2013); |
• | $23.9 million increase in diesel fuel costs; |
• | $5.8 million increase in excise and similar taxes; and |
• | $1.3 million increase in costs associated with plant operations; offset by |
56
• | $109.6 million decrease for reduced gasoline purchases due to constrained supplies in the Birmingham market. |
Depreciation, depletion and amortization
The $7.6 million increase in depreciation, depletion and amortization is due to the incremental costs associated with our purchase of Direct Fuels on May 14, 2013, specifically:
• | $6.8 million in amortization of intangible assets; and |
• | $0.8 million of depreciation. |
Selling, general and administrative expense
Our selling, general and administrative expenses increased $1.4 million. The prime driver to this increase is the purchase of Direct Fuels on May 14, 2013.
Corporate
Year Ended December 31, | |||||||||||
2014 | 2013 | 2012 | |||||||||
($ in thousands) | |||||||||||
Depreciation, depletion and amortization | $ | 28 | $ | 1 | $ | — | |||||
Selling, general and administrative expenses | 17,583 | 10,222 | 82 | ||||||||
IPO transaction-related costs | — | 10,966 | — | ||||||||
Operating loss | (17,611 | ) | (21,189 | ) | (82 | ) | |||||
Other expense (income): | |||||||||||
Interest expense, net | 7,394 | 10,586 | 11,055 | ||||||||
Loss on extinguishment of debt | — | 907 | 377 | ||||||||
Other | 611 | (334 | ) | 605 | |||||||
Income (loss) before provision for income taxes | (25,616 | ) | (32,348 | ) | (12,119 | ) | |||||
Provision for income taxes | 638 | 386 | 81 | ||||||||
Unallocated corporate loss | $ | (26,254 | ) | $ | (32,734 | ) | $ | (12,200 | ) | ||
Adjusted EBITDA (a) | $ | (8,541 | ) | $ | (4,488 | ) | $ | (82 | ) | ||
(a) | See Item 6. Selected Financial and Operating Data—Adjusted EBITDA for a discussion of Adjusted EBITDA and a reconciliation to net income (loss). |
Overview
All of our IPO transaction-related costs, equity-based compensation and other overhead items not allocated to our two segments are included in corporate. As the Sand and Fuel segments were operated separately without consolidated EMES management oversight prior to our IPO in May 2013, and other costs such as equity-based compensation and costs of being a publicly traded limited partnership began at that same time, corporate expenses increased significantly in 2013 compared to any prior year and continued to increase in 2014 due to a full year of results for the expanded corporate oversight activities.
Year Ended December 31, 2014 Compared to Year Ended December 31, 2013
Selling, general and administrative expenses
The largest component of the $7.4 million increase in corporate selling, general and administrative expenses is the $3.3 million increase in equity-based compensation recorded subsequent to our IPO. See Note 11 to our Consolidated Financial Statements for further discussion of equity-based compensation. The remaining increase is primarily for professional fees, salaries and other related costs necessary to manage our newly combined business and provide the incremental services necessary for a publicly traded partnership (such as compliance with SEC, Sarbanes-Oxley, and NYSE requirements, additional insurance coverage and director fees). We incurred and recorded these costs for a full year in 2014 versus only the portion of 2013 subsequent to our IPO.
IPO transaction-related costs
We incurred generally non-recurring expenses related directly to the IPO 2013. These costs consisted primarily of incentive compensation and payroll-related costs paid to management. In addition, we incurred indirect legal, accounting, and other professional fees associated with the IPO transaction not related to the issuance of equity and debt. See Note 12 to our Consolidated Financial Statements for further details.
57
Interest expense, net
Our net interest expense decreased $3.2 million due to much lower average interest rates despite having higher average balances of interest-bearing obligations in 2014 than in 2013. In the last half of 2012, we had added a substantial amount of long-term debt, which was incurring interest expense at relatively high interest rates until we refinanced substantially all of our debt with the proceeds from our IPO on May 2013. Beginning in May 2013, we are subject to much more favorable terms, which we expect to continue during the term of our current credit agreement. See Note 8 to our Consolidated Financial Statements for a discussion of long-term debt.
Other
The net change from 2013 to 2014 is due primarily to a non-recurring $0.7 million loss on settlement of pre-existing agreements in connection with our acquisition of mining assets in 2014.
Year Ended December 31, 2013 Compared to Year Ended December 31, 2012
Selling, general and administrative expenses
Most of the $10.1 million increase in corporate selling, general and administrative expenses is attributable to the $5.7 million of equity-based compensation recorded subsequent to our IPO. See Note 11 to our Consolidated Financial Statements for further discussion of equity-based compensation. The remaining increase is primarily for professional fees, salaries and other related costs necessary to manage our newly combined business and provide the incremental services necessary for a publicly traded partnership (such as compliance with SEC, Sarbanes-Oxley, and NYSE requirements, additional insurance coverage and director fees).
Interest expense, net
In the last half of 2012, we had added a substantial amount of long-term debt, which was incurring interest expense until we refinanced substantially all of our debt with the proceeds from our IPO on May 2013. Beginning in May 2013, we have lower overall levels of debt with more favorable terms, which we expect to continue during the term of our current credit agreement. The combination of these events resulted in a relatively flat net expense from 2012 to 2013. See Note 8 to our Consolidated Financial Statements for a discussion of long-term debt.
Loss (gain) on extinguishment of debt
At the time of our IPO in May 2013, all of our existing debt was retired, for a net $0.9 million loss on extinguishment of debt. In 2012, SSS refinanced a portion of its previous debt and recorded $0.4 million in loss on extinguishment of debt related to the proportional amount of deferred financing costs on the retired debt. See Note 8 to our Consolidated Financial Statements for a discussion of long-term debt.
Other
The net change from 2012 to 2013 is due primarily to a non-recurring litigation settlement expense of $0.8 million in 2012.
Liquidity and Capital Resources
Our principal liquidity requirements are to finance current operations, fund capital expenditures, including acquisitions from time to time, to service our debt and to pay distributions to partners. Our sources of liquidity generally include cash generated by our operations, borrowings under our revolving line of credit and issuances of equity and debt securities. We believe that cash generated from these sources will be sufficient to meet our short-term working capital requirements and long-term capital expenditure requirements for at least the next twelve months.
Equity Offering (IPO)
On May 8, 2013, the Partnership priced its initial public offering of 7,500,000 common units at a price to the public of $17.00 per unit ($15.85 per common unit, net of underwriting discounts and structuring fee). On May 20, 2013, the underwriters exercised their option to purchase an additional 209,906 common units. The net proceeds from the IPO of $122.2 million (including over commitment allocation of $3.3 million), after deducting the underwriting discount and the structuring fee, were used to: (i) repay existing subsidiary debt, in the amount of $87.6 million, (ii) pay offering expenses of $10.6 million, (iii) pay cash-based compensation awards to senior management of $8.9 million, (iv) provide the Partnership with working capital of $11.5 million and (v) provide a distribution to equity holders of $3.6 million.
Credit Agreement
On May 14, 2013, we entered into a $150 million revolving credit and security agreement (as amended and restated, the “Credit Agreement”) among Emerge Energy Services LP, as parent guarantor, each of its subsidiaries, as borrowers (the “Borrowers”),
58
and PNC Bank, National Association, as administrative agent and collateral agent. Substantially all of the assets of the Borrowers are pledged as collateral under the Credit Agreement.
On December 10, 2013, we amended the Credit Agreement to revise certain definitions and to increase the commitment amount for our revolving loan credit facility to $200 million.
On June 27, 2014, we amended and restated the Credit Agreement to:
• | increase our revolving credit facility (the “Credit Facility”) to $350 million, which we may increase from time to time upon our satisfaction of certain conditions by up to an aggregate of $150 million; |
• | revise the interest rates applicable to borrowings under the Credit Facility as follows (at our option); |
• | a Base Rate (as defined in the Credit Agreement), which will be the base commercial lending rate of PNC Bank, as publicly announced to be in effect from time to time, plus an applicable margin ranging from 1.25% to 2% based on our total leverage ratio; or |
• | LIBOR plus an applicable margin ranging from 2.25% to 3% based on our total leverage ratio; |
• | increase the sublimit for the issuance of letters of credit to $30 million; |
• | revise financial covenants as discussed below; and |
• | extend the maturity date to June 27, 2019. |
We also incur a commitment fee of 0.375% on committed amounts that are neither used for borrowings nor under letters of credit.
In May 2013, we initially borrowed $112.7 million to (i) make distributions of $17.0 million to Superior Silica Holdings LLC (“SSH”) and to fund the cash payment in the Direct Fuels acquisition amounting to $22.2 million; and, (ii) repay $73.5 million of existing SSH debt. As part of the original Credit Agreement, we incurred $3.6 million of direct financing costs for professional and legal fees, which we recorded as deferred financing cost. We subsequently incurred $0.1 million and $2.3 million in deferred financing costs related to amendments in 2013 and 2014, respectively.
The Credit Agreement contains various covenants and restrictive provisions and requires maintenance of financial covenants as follows:
• | an interest coverage ratio (as defined in the Credit Agreement) of not less than 3.00 to 1.00; and |
• | a total leverage ratio (as defined in the Credit Agreement) of not greater than 3.00 to 1.00. The requirement to maintain the total leverage ratio is subject an increase to 3.50 to 1.00 in connection with certain permitted acquisitions. |
At December 31, 2014, we were in compliance with our loan covenants and had undrawn availability under the Credit Facility totaling $120.4 million. At December 31, 2014, our outstanding borrowings under the Credit Agreement bore interest at a weighted-average rate of 2.78%.
Cash Flow Summary
The table below summarizes our cash flows for the years ended December 31, 2014, 2013 and 2012.
Year Ended December 31, | |||||||||||
2014 | 2013 | 2012 | |||||||||
($ in thousands) | |||||||||||
Cash flows from operating activities | $ | 86,161 | $ | 58,036 | $ | 1,137 | |||||
Cash flows from investing activities | $ | (88,172 | ) | $ | (38,009 | ) | $ | (39,075 | ) | ||
Cash flows from financing activities | $ | 6,720 | $ | (19,327 | ) | $ | 32,884 | ||||
Cash and cash equivalents at beginning of period | $ | 2,167 | $ | 1,467 | $ | 6,521 | |||||
Cash and cash equivalents at end of period | $ | 6,876 | $ | 2,167 | $ | 1,467 | |||||
Operating Cash Flows
Net cash provided by operating activities has generally trended the same as our net income adjusted for non-cash items such as depreciation, depletion and amortization, equity-based compensation, and interest paid in-kind. These were offset by changes in our net operating assets and liabilities, which decreased during times of lower profitability in 2012, but has improved significantly subsequent to our IPO in May 2013. In 2014, our operating assets were significantly impacted by a $30.4 million increase in our Sand segment’s accounts receivable, due mainly to much higher sales at the end of 2014 than at the end of 2013, and an $11.4 million increase in our aggregate prepaid railcar lease assets as we build our railcar fleet. Due mainly to the rapid decline in fuel
59
prices in late 2014, our Fuel segments’ net working capital decreased $7.7 million in 2014, as the lower fuel prices decreased the Fuel segment’s inventory balances as well as its accounts receivable and fuel purchase liabilities.
Investing Cash Flows
Capital expenditures for the Barron and Arland dry plants required significant cash outlays in 2012 and 2014. We completed construction on the Arland plant in 2014 as well as beginning the Independence plant project, which we have subsequently delayed. We plan to spend $110 million of capital expenditures in 2015, which we intend to fund with our existing credit facilities and cash from operations, including utilizing an unexercised $150 million accordion under our revolving credit facility.
Financing Cash Flows
The main categories of our financing cash flows can be summarized as follows:
Year Ended December 31, | |||||||||||
2014 | 2013 | 2012 | |||||||||
($ in thousands) | |||||||||||
Proceeds from IPO, net of offering costs | $ | — | $ | 116,574 | $ | (354 | ) | ||||
Net debt proceeds (payments) | 127,874 | (71,523 | ) | 33,454 | |||||||
Distributions to owners | (112,992 | ) | (49,167 | ) | — | ||||||
Distribution to Direct Fuels' owners | — | (11,500 | ) | — | |||||||
Other | (8,162 | ) | (3,711 | ) | (216 | ) | |||||
Total | $ | 6,720 | $ | (19,327 | ) | $ | 32,884 | ||||
The most significant differences in our financing cash flows came about as a result of our May 2013 IPO. Not only did we receive $116.6 million in net proceeds (after exercise of the overallotment and payment of offering costs), but we were able to reduce our overall debt amounts and will now be making distributions to our unitholders on a quarterly basis. In addition, we paid a one-time distribution to Direct Fuels' prior owners in relation to our purchase of Direct Fuels in May 2013.
Management Incentive Plans
Effective May 14, 2013, we established long-term incentive plans for our employees, directors, and consultants. These plans include the issuance of restricted and phantom units which are dilutive to common unit holders.
Contingencies
In the opinion of management, there are no contingencies that are likely to have a material adverse impact on our financial condition, liquidity or reported results.
Contractual Obligations
We have long-term contractual obligations that are required to be settled in cash. The amounts of our minimum contractual obligations as of December 31, 2014 were as follows:
Payments Due By Period | |||||||||||||||||||
Total | < 1 Year | 1 - 3 Years | 3 - 5 Years | > 5 Years | |||||||||||||||
($ in thousands) | |||||||||||||||||||
Long-term debt (1) | $ | 252,181 | $ | 7,485 | $ | 13,697 | $ | 230,999 | $ | — | |||||||||
Railcar leases (2) | 383,350 | 45,474 | 111,488 | 95,558 | 130,830 | ||||||||||||||
Other operating leases (3) | 6,263 | 1,745 | 2,113 | 667 | 1,738 | ||||||||||||||
Purchase commitments (4) | 172,351 | 22,114 | 42,548 | 38,402 | 69,287 | ||||||||||||||
Minimum royalty payments (5) | 28,413 | 1,180 | 2,392 | 2,435 | 22,406 | ||||||||||||||
Capital lease obligations | 1,030 | 968 | 62 | — | — | ||||||||||||||
Total | $ | 843,588 | $ | 78,966 | $ | 172,300 | $ | 368,061 | $ | 224,261 | |||||||||
(1) | Assumes balances outstanding as of 12/31/14 will be paid at maturity and includes interest using interest rates in effect at 12/31/14. |
60
(2) | Includes minimum amounts payable under various operating leases for railcars as well as estimated costs to transport leased railcars from the manufacturer to our site for initial placement in service. |
(3) | Includes lease agreements for land, facilities and equipment. |
(4) | Includes minimum amounts payable under a business acquisition agreement, long-term rail transportation agreements, and other purchase commitments. |
(5) | Represents minimum royalty payments for various sand mining locations. The amounts paid will differ based on amounts extracted. |
Off-Balance Sheet Arrangements
As of December 31, 2014, our Sand segment had outstanding letters of credit totaling $7.1 million that support various railcar lease obligations as well as reclamation obligations for sand mining properties. We do not believe these letters of credit could have a material effect on our financial condition, changes in financial condition, revenues or expenses, results of operations, liquidity, capital expenditures or capital resources.
Critical Accounting Policies and Estimates
The preparation of financial statements in conformity with GAAP requires management to make estimates and assumptions. These estimates and assumptions affect the amounts reported in our Consolidated Financial Statements and notes. We base our estimates on historical experience and various other assumptions that we believe to be reasonable under the circumstances. Actual results may differ from these estimates, and estimates are subject to change due to modifications in the underlying conditions or assumptions. Currently, we do not foresee any reasonably likely changes to our current estimates and assumptions that would materially affect amounts reported in the financial statements and notes. Below are expanded discussions of our more significant accounting policies, estimates and judgments, i.e., those that reflect more significant estimates and assumptions used in the preparation of our financial statements. See Note 2 to our Consolidated Financial Statements for details about additional accounting policies and estimates made by management.
Depreciation and Depletion Methods and Estimated Useful Lives of Property, Plant and Equipment
In general, depreciation is the systematic and rational allocation of an asset's cost, less its residual value (if any), to the periods it benefits. We depreciate all of our property, plant and equipment other than mineral reserves using the straight-line method, which results in depreciation expense being incurred evenly over the life of an asset. Our estimate of depreciation expense incorporates management assumptions regarding the useful economic lives and residual values of our assets. When we place our assets in-service, we believe such assumptions are reasonable; however, circumstances may develop that would cause us to change these assumptions, which would change our depreciation amounts prospectively. Examples of such circumstances include:
• | changes in laws and regulations that limit the estimated economic life of an asset; |
• | changes in technology that render an asset obsolete; |
• | changes in expected salvage values; or |
• | significant changes in the forecast life of proved reserves of applicable oil- and gas-producing basins, if any. |
Our mineral reserves are initially recognized at cost and are depleted using the units-of-production method. Under this method, we compute the depletion expense by multiplying the number of tons of sand produced by a rate arrived at by dividing the physical units of sand produced during the period by the total estimated sand reserves volume at the beginning of the period.
Asset Retirement Obligations
We follow the provisions of Financial Accounting Standards Board (“FASB”) Accounting Standards Codification (“ASC”) 410-20, Asset Retirement Obligations, which generally applies to legal obligations associated with the retirement of long-lived assets that result from the acquisition, construction, development and/or the normal operation of owned or leased long-lived assets.
We recognize the fair value of any liability for conditional asset retirement obligations, including environmental remediation liabilities when incurred, which is generally upon acquisition, construction or development and/or through the normal operation of our mineral reserves, if sufficient information exists to reasonably estimate the fair value of the liability. These obligations generally include the estimated net future costs of dismantling, restoring and reclaiming operating mines and related mine sites, in accordance with federal, state and local regulatory requirements. The estimated liability is based on historical industry experience in reclaiming mine sites, including estimated economic lives, external estimates as to the cost to bringing back the land to federal and state regulatory requirements. In calculating this estimate, we use a discount rate reflecting management's best estimate of our credit-adjusted risk-free rate.
61
The liability is accreted over time through periodic charges to earnings. In addition, the asset retirement cost is capitalized as part of the asset's carrying value and amortized over the life of the related asset. Reclamation costs are periodically adjusted to reflect changes in the estimated present value resulting from the passage of time and revisions to the estimates of either the timing or amount of the reclamation and abandonment costs. The reclamation obligation is based on when spending for an existing environmental disturbance is expected to occur. If the asset retirement obligation is settled for other than the carrying amount of the liability, a gain or loss will be recognized on settlement. We review, on an annual basis, unless otherwise deemed necessary, the reclamation obligation at each mine site in accordance with ASC guidance for accounting reclamation obligations.
Impairment of Goodwill
In accordance with FASB ASC 350, Intangibles – Goodwill and Other, goodwill is tested no less than annually unless indicators of impairment exist in interim periods. The impairment test uses a two-step process, which is performed at the reporting unit level. Step one compares the fair value of the reporting unit to its carrying value. We calculate the fair value using the enterprise value-market capitalization approach. This approach uses estimates and assumptions that are believed to be reasonable at the time of the calculation. If the carrying value exceeds the fair value, there is a potential impairment and step two must be performed. Step two compares the carrying value of the reporting unit's goodwill to the implied fair value (i.e., the fair value of the reporting unit less the fair value of the unit's assets and liabilities, including identifiable intangible assets). If the carrying value of goodwill exceeds its implied fair value, we record the excess as an impairment charge to earnings. We performed our annual assessment of goodwill in the fourth quarter of 2014, and determined during step one that the fair value of the reporting unit (our Fuel segment) exceeds its carrying value. Therefore, it was not necessary to perform step two of the analysis.
Impairment of Long-Lived Assets
In accordance with FASB ASC 360, long-lived assets are reviewed for impairments whenever events or changes in circumstances indicate that the related carrying amount may not be recoverable. If circumstances require a long-lived asset to be tested for possible impairment, we first compare undiscounted cash flows expected to be generated by an asset to the carrying value of the asset. If the carrying value of the long-lived asset is not recoverable on an undiscounted cash flow basis, impairment is recognized to the extent that the carrying value exceeds its fair value. Assets to be disposed of are reported at the lower of the carrying amount or fair value less selling costs. The recoverability of intangible assets subject to amortization is evaluated whenever events or changes in circumstances indicate that the carrying value of the assets may not be recoverable.
Business Combinations
We use the acquisition method of accounting for acquired businesses. Under the acquisition method, our financial statements reflect the operations of an acquired business starting from the completion of the acquisition. The assets acquired and liabilities assumed are recorded at their respective estimated fair values at the date of the acquisition. Any excess of the purchase price over the estimated fair values of the identifiable net assets acquired is recorded as goodwill. Significant judgment is often required in estimating the fair value of assets acquired, particularly intangible assets. As a result, in the case of significant or complex acquisitions, we normally obtain the assistance of a third-party valuation specialist in estimating fair values of tangible and intangible assets. The fair value estimates are based on available historical information and on expectations and assumptions about the future, considering the perspective of marketplace participants. While we believe those expectations and assumptions are reasonable, they are inherently uncertain. Unanticipated market or macroeconomic events and circumstances may occur, which could affect the accuracy or validity of the estimates and assumptions.
Accounting for Contingencies
Our financial results may be affected by judgments and estimates related to loss contingencies. Litigation contingencies may require significant judgment in estimating amounts to accrue. We accrue liabilities for litigation contingencies when such liabilities are considered probable of occurring and the amount is reasonably estimable.
ITEM 7A. QUANTITATIVE AND QUALITATIVE DISCLOSURES ABOUT MARKET RISK
We are exposed to market risk, including the effects of adverse changes in commodity prices and interest rates as described below. We use derivative financial instruments and commodity instruments, where appropriate, to manage these risks. As a matter of policy, we do not engage in trading or speculative transactions. We also do not designate these derivatives for hedge accounting under FASB ASC 815, Derivatives and Hedging, even though these hedging transactions serve the same risk management purposes whether designated for hedge accounting treatment or not. We record the fair values of derivatives on our consolidated balance sheets, with any changes in these fair values reflected in current earnings on our consolidated statements of operations.
62
Commodity Price Risks
We are exposed to market risk with respect to the pricing that we receive for our sand production. Realized pricing for sand is primarily driven by a combination of take-or-pay contracts, fixed volume, and efforts-based agreements in addition to sales on the spot market. Prices under all of our supply agreements are generally fixed and are subject to adjustment, within limitations, in response to certain cost increases. As a result, our realized prices for frac sand may not grow or decline at rates consistent with broader industry pricing. During periods of rapid price growth, our realized prices may grow more slowly than those of competitors, and during periods of price decline, our realized prices may outperform industry averages. We do not enter into commodity price hedging agreements with respect to sand production.
We are also exposed to market risk with respect to the prices we charge for refined fuels products and that we pay for transmix, wholesale fuel and other feedstocks. Realized margins for our refined fuel products are determined by the relationship between the prices charged for fuel and the prices paid for transmix, wholesale fuel and other feedstocks. We purchase transmix, wholesale fuel and other feedstocks based on several different regional price indices, the most important of which are the Platt's Gulf Coast gasoline and diesel price postings. The costs of these purchases are generally set on the day of purchase. We typically sell fuel products within seven to ten days of supply purchases at then prevailing market prices. If the market price for our fuel products declines during this period or generally does not increase commensurate with any increases in supply and processing costs, our margins will fall and the amount of cash available for distribution will decrease. In addition, because we value our inventory at the lower of cost or market value, if the market value of our inventory were to decline to an amount less than our cost, we would record a write-down of inventory and a non-cash charge to cost of sales. In a period of declining prices for transmix or refined products, our inventory valuation methodology may result in decreases in reported net income.
We utilize financial hedging arrangements (mainly futures traded on the New York Mercantile Exchange) to hedge a portion of our gasoline and diesel inventory, which reduces commodity price exposure on some of these activities. We record these commodity derivatives at fair value on the consolidated balance sheet with resulting gains and losses reflected in cost of fuel as reported in the consolidated statements of operations. We derive fair values principally from published market quotes. The precise level of open position derivatives is dependent on inventory levels, expected inventory purchase patterns and market price trends.
A hypothetical $0.01 increase or decrease in the average gross margin between the price we charge for fuel and its cost would have changed our fuel segment operating income by $2.6 million for the year ended December 31, 2014.
Interest Rate Risk
We are exposed to fluctuations in interest rates charged on our variable rate debt. We enter into certain interest rate swap agreements in accordance with our risk management strategy. As of December 31, 2012 and 2011, we were not a party to any interest rate swap agreements. During 2013, we entered into interest rate swap agreements that will effectively convert $70 million notional amount of our variable rate debt to a fixed rate, effective October 14, 2014. We account for the interest rate swap agreements on a mark-to-market basis through current earnings even though they were not acquired for trading purposes. We recorded aggregate realized and unrealized losses of $0.8 million in 2014 and gains of $0.2 million in 2013.
A hypothetical increase or decrease in interest rates by 100 basis points would have changed the interest incurred on our variable rate debt by $1.5 million for the year ended December 31, 2014.
Customer Credit Risk
We are subject to risks of loss resulting from nonpayment or nonperformance by our customers. We examine the creditworthiness of third-party customers to whom we extend credit and manage exposure to credit risk through credit analysis, credit approval, credit limits and monitoring procedures. Our top three customer balances accounted for 48% and 31% of our net accounts receivable at December 2014 and 2013, respectively.
63
ITEM 8. FINANCIAL STATEMENTS AND SUPPLEMENTARY DATA
EMERGE ENERGY SERVICES LP
INDEX TO FINANCIAL STATEMENTS
Emerge Energy Services LP Consolidated Financial Statements: | |
64
REPORT OF INDEPENDENT REGISTERED PUBLIC ACCOUNTING FIRM
Board of Directors of Emerge Energy Services GP LLC, as General Partner of Emerge Energy Services LP and the Partners of Emerge Energy Services LP
Southlake, Texas
We have audited the accompanying consolidated balance sheets of Emerge Energy Services LP (the “Partnership”) as of December 31, 2014 and 2013 and the related consolidated statements of operations, partners’ equity, and cash flows for each of the three years in the period ended December 31, 2014. These financial statements are the responsibility of the Partnership’s management. Our responsibility is to express an opinion on these financial statements based on our audits.
We conducted our audits in accordance with the standards of the Public Company Accounting Oversight Board (United States). Those standards require that we plan and perform the audit to obtain reasonable assurance about whether the financial statements are free of material misstatement. An audit includes examining, on a test basis, evidence supporting the amounts and disclosures in the financial statements, assessing the accounting principles used and significant estimates made by management, as well as evaluating the overall financial statement presentation. We believe that our audits provide a reasonable basis for our opinion.
In our opinion, the consolidated financial statements referred to above present fairly, in all material respects, the financial position of Emerge Energy Services LP at December 31, 2014 and 2013, and the results of its operations and its cash flows for each of the three years in the period ended December 31, 2014, in conformity with accounting principles generally accepted in the United States of America.
We also have audited, in accordance with the standards of the Public Company Accounting Oversight Board (United States), Emerge Energy Services LP's internal control over financial reporting as of December 31, 2014, based on criteria established in Internal Control - Integrated Framework (2013) issued by the Committee of Sponsoring Organizations of the Treadway Commission (COSO) and our report dated March 2, 2015 expressed an adverse opinion thereon.
/s/ BDO USA, LLP
Dallas, Texas
March 2, 2015
65
EMERGE ENERGY SERVICES LP
CONSOLIDATED BALANCE SHEETS
($ in thousands, except unit data)
December 31, | |||||||
2014 | 2013 | ||||||
ASSETS | |||||||
Current assets: | |||||||
Cash and cash equivalents | $ | 6,876 | $ | 2,167 | |||
Restricted cash and equivalents | — | 6,188 | |||||
Trade and other receivables, net | 75,708 | 49,645 | |||||
Inventories | 32,278 | 41,320 | |||||
Direct financing lease receivable | — | 555 | |||||
Prepaid expenses and other current assets | 9,262 | 4,157 | |||||
Total current assets | 124,124 | 104,032 | |||||
Property, plant and equipment, net | 238,657 | 146,131 | |||||
Intangible assets, net | 31,158 | 39,415 | |||||
Goodwill | 29,264 | 29,264 | |||||
Other assets, net | 13,765 | 4,174 | |||||
Total assets | $ | 436,968 | $ | 323,016 | |||
LIABILITIES AND PARTNERS’ EQUITY | |||||||
Current liabilities: | |||||||
Accounts payable | $ | 21,341 | $ | 36,096 | |||
Accrued liabilities | 24,411 | 17,274 | |||||
Current portion of long-term debt | 53 | 233 | |||||
Current portion of capital lease liability | 930 | 3,469 | |||||
Total current liabilities | 46,735 | 57,072 | |||||
Long-term debt, net of current portion | 221,864 | 93,809 | |||||
Business acquisition obligation, net of current portion | 10,737 | — | |||||
Capital lease liability, net of current portion | 57 | — | |||||
Asset retirement obligations | 2,386 | 1,414 | |||||
Total liabilities | 281,779 | 152,295 | |||||
Commitments and contingencies | |||||||
Partners’ equity: | |||||||
General partner | — | — | |||||
Limited partner common units (issued and outstanding 23,718,961 units and 23,219,680 units as of December 31, 2014 and 2013, respectively) | 155,189 | 170,721 | |||||
Total partners’ equity | 155,189 | 170,721 | |||||
Total liabilities and partners’ equity | $ | 436,968 | $ | 323,016 | |||
See accompanying notes to consolidated financial statements.
66
EMERGE ENERGY SERVICES LP
CONSOLIDATED STATEMENTS OF OPERATIONS
($ in thousands, except per unit data)
Year Ended December 31, | |||||||||||
2014 | 2013 | 2012 | |||||||||
Revenues (1) | $ | 1,111,254 | $ | 873,255 | $ | 624,096 | |||||
Operating expenses: | |||||||||||
Cost of goods sold (excluding depreciation, depletion and amortization) (1) | 950,006 | 767,911 | 575,408 | ||||||||
Depreciation, depletion and amortization | 24,803 | 20,828 | 9,119 | ||||||||
Selling, general and administrative expenses | 38,723 | 26,835 | 10,256 | ||||||||
IPO transaction-related costs | — | 10,966 | — | ||||||||
Total operating expenses | 1,013,532 | 826,540 | 594,783 | ||||||||
Income from operations | 97,722 | 46,715 | 29,313 | ||||||||
Other expense (income): | |||||||||||
Interest expense, net | 7,394 | 10,586 | 11,055 | ||||||||
Loss on extinguishment of debt | — | 907 | 377 | ||||||||
Other expense (income) | 611 | (334 | ) | 605 | |||||||
Total other expense | 8,005 | 11,159 | 12,037 | ||||||||
Income before provision for income taxes | 89,717 | 35,556 | 17,276 | ||||||||
Provision for income taxes | 638 | 386 | 81 | ||||||||
Net income | 89,079 | 35,170 | $ | 17,195 | |||||||
Less Predecessor net income before May 14, 2013 | — | 13,124 | |||||||||
Post-IPO net income | $ | 89,079 | $ | 22,046 | |||||||
Earnings per common unit (basic) (2) | $ | 3.70 | $ | 0.92 | |||||||
Earnings per common unit (diluted) (2) | $ | 3.70 | $ | 0.92 | |||||||
Weighted average number of common units outstanding including participating securities (basic) (2) | 24,070,418 | 24,015,562 | |||||||||
Weighted average number of common units outstanding (diluted) (2) | 24,076,437 | 24,021,957 | |||||||||
(1) Fuel revenues and cost of goods sold include excise taxes and similar taxes | $ | 50,116 | $ | 47,007 | $ | 37,849 | |||||
(2) See Note 14. | |||||||||||
See accompanying notes to consolidated financial statements.
67
EMERGE ENERGY SERVICES LP
CONSOLIDATED STATEMENTS OF PARTNERS’ EQUITY
($ in thousands)
Limited Partner Common Units | General Partner (non-economic interest) | Predecessor | Total Partners' Equity | ||||||||||||
Balance at December 31, 2011 | $ | — | $ | — | $ | (7,780 | ) | $ | (7,780 | ) | |||||
Capital contributions | 2 | — | — | 2 | |||||||||||
Net income (loss) | (81 | ) | — | 17,276 | 17,195 | ||||||||||
Balance at December 31, 2012 | (79 | ) | — | 9,496 | 9,417 | ||||||||||
Net income (loss) from January 1, 2013 through May 13, 2013 | (97 | ) | — | 13,221 | 13,124 | ||||||||||
Balance at May 13, 2013 | (176 | ) | — | 22,717 | 22,541 | ||||||||||
Net income from May 14, 2013 through December 31, 2013 | 22,046 | — | — | 22,046 | |||||||||||
Proceeds from IPO, net of offering costs | 116,220 | — | — | 116,220 | |||||||||||
Contribution of Predecessor net assets in exchange for common units | 22,717 | — | (22,717 | ) | — | ||||||||||
Common units issued for business acquired | 53,721 | — | — | 53,721 | |||||||||||
Equity-based compensation expense | 5,734 | — | — | 5,734 | |||||||||||
Distribution to prior owners including over commitment proceeds | (19,628 | ) | — | — | (19,628 | ) | |||||||||
Redemption of original limited partner interest | (2 | ) | — | — | (2 | ) | |||||||||
Distributions paid | (29,539 | ) | — | — | (29,539 | ) | |||||||||
Distribution equivalent rights accrued | (372 | ) | — | — | (372 | ) | |||||||||
Balance at December 31, 2013 | 170,721 | — | — | 170,721 | |||||||||||
Net income | 89,079 | — | — | 89,079 | |||||||||||
Equity-based compensation | 9,194 | — | — | 9,194 | |||||||||||
Distributions paid | (112,651 | ) | — | — | (112,651 | ) | |||||||||
Distribution equivalent rights accrued | (1,164 | ) | — | — | (1,164 | ) | |||||||||
Other | 10 | — | — | 10 | |||||||||||
Balance at December 31, 2014 | $ | 155,189 | $ | — | $ | — | $ | 155,189 | |||||||
See accompanying notes to consolidated financial statements.
68
EMERGE ENERGY SERVICES LP
CONSOLIDATED STATEMENTS OF CASH FLOWS
($ in thousands)
Year Ended December 31, | |||||||||||
2014 | 2013 | 2012 | |||||||||
Cash flows from operating activities: | |||||||||||
Net income | $ | 89,079 | $ | 35,170 | $ | 17,195 | |||||
Adjustments to reconcile net income to net cash provided by operating activities: | |||||||||||
Depreciation, depletion and amortization | 24,803 | 20,828 | 9,119 | ||||||||
Equity-based compensation expense | 9,042 | 5,734 | — | ||||||||
Interest paid in-kind | — | 3,202 | 743 | ||||||||
Loss on extinguishment of debt | — | 907 | 377 | ||||||||
Provision for doubtful accounts | 253 | 190 | 170 | ||||||||
Loss (gain) on disposal of assets | 8 | 755 | (28 | ) | |||||||
Amortization of debt discount/premium and deferred financing costs | 969 | 937 | 636 | ||||||||
Loss on termination of sand supply agreement | 689 | — | — | ||||||||
Unrealized loss on derivative instruments | 669 | (247 | ) | — | |||||||
Other non-cash | 38 | (244 | ) | — | |||||||
Changes in operating assets and liabilities, net of business acquired: | |||||||||||
Restricted cash and equivalents | 6,188 | (6,188 | ) | — | |||||||
Accounts receivable | (26,328 | ) | (17,374 | ) | (19,815 | ) | |||||
Inventories | 9,044 | (11,451 | ) | (11,751 | ) | ||||||
Prepaid expenses and other current assets | (5,104 | ) | 5,064 | (1,863 | ) | ||||||
Accounts payable and accrued liabilities | (14,971 | ) | 20,871 | 6,354 | |||||||
Other assets | (8,218 | ) | (118 | ) | — | ||||||
Net cash provided by operating activities | 86,161 | 58,036 | 1,137 | ||||||||
Cash flows from investing activities: | |||||||||||
Purchases of property, plant and equipment | (77,884 | ) | (21,369 | ) | (40,465 | ) | |||||
Business acquisitions, net of cash acquired | (11,000 | ) | (16,687 | ) | — | ||||||
Proceeds from disposals of assets | 335 | 35 | 1,378 | ||||||||
Collection of notes receivable | 377 | 12 | 12 | ||||||||
Net cash used in investing activities | (88,172 | ) | (38,009 | ) | (39,075 | ) | |||||
Cash flows from financing activities: | |||||||||||
Proceeds from IPO including over commitment | — | 122,221 | — | ||||||||
IPO offering costs | — | (5,647 | ) | (354 | ) | ||||||
Proceeds from line of credit borrowings | 371,657 | 134,180 | 56,150 | ||||||||
Repayments of line of credit borrowings | (243,603 | ) | (61,619 | ) | (49,000 | ) | |||||
Repayment of Direct Fuels' debt | — | (21,673 | ) | — | |||||||
Proceeds from other long-term debt | — | 81 | 31,290 | ||||||||
Repayments of other long-term debt | (180 | ) | (118,640 | ) | (3,591 | ) | |||||
Distributions to unitholders | (112,992 | ) | (29,539 | ) | — | ||||||
Distributions to Predecessor owners | — | (19,628 | ) | — | |||||||
Pre-IPO dividends paid (Direct Fuels) | — | (11,500 | ) | — | |||||||
Payment of financing costs | (2,342 | ) | (3,709 | ) | (216 | ) | |||||
Payments on capital lease obligation | (5,831 | ) | (3,507 | ) | (1,395 | ) | |||||
Repayments of other debt | — | (345 | ) | — | |||||||
Redemption of general partner interest | — | (2 | ) | — | |||||||
Other financing activities | 11 | — | — | ||||||||
Net cash provided by (used in) financing activities | 6,720 | (19,327 | ) | 32,884 | |||||||
Cash and cash equivalents: | |||||||||||
Net increase (decrease) | 4,709 | 700 | (5,054 | ) | |||||||
Balance at beginning of year | 2,167 | 1,467 | 6,521 | ||||||||
Balance at end of year | $ | 6,876 | $ | 2,167 | $ | 1,467 | |||||
See accompanying notes to consolidated financial statements.
69
EMERGE ENERGY SERVICES LP
NOTES TO CONSOLIDATED FINANCIAL STATEMENTS
1. ORGANIZATION AND BASIS OF PRESENTATION
Organization
Emerge Energy Services LP (“Emerge”) is a Delaware limited partnership that completed its initial public offering (“IPO”) on May 14, 2013 to become a publicly traded partnership. The combined entities of Superior Silica Sands LLC (“SSS”), a Texas limited liability company, Allied Energy Company LLC (“AEC”), an Alabama limited liability company, and Emerge Energy Services Operating LLC (“Emerge Operating”), a Delaware limited liability company, represent the predecessor for accounting purposes (the “Predecessor”) of Emerge.
References to the “Partnership,” “we,” “our” or “us” when used for dates or periods ended prior to the IPO, refer collectively to the Predecessor. References to the “Partnership,” “we,” “our” or “us” when used for dates or periods ended on or after the IPO, refer collectively to Emerge and all of its subsidiaries, including Direct Fuels LLC (“Direct Fuels”), which was acquired in a business combination concurrent with our IPO.
We are a growth-oriented energy services company engaged in: (i) the business of mining, producing, and distributing silica sand that is a key input for the hydraulic fracturing of oil and gas wells; and, (ii) the business of distributing refined motor fuels, refining transportation mixture (“transmix”) and biodiesel, operating bulk motor fuel storage terminals, and providing complementary services. We report silica sand activities through the Sand segment and motor fuel operations through the Fuel segment. We report items of income (if any) and expense that cannot be directly associated with the Sand and Fuel segments as “corporate.”
The Sand segment conducts mining and processing operations from facilities located in Wisconsin and Texas. In addition to mining and processing silica sand for the oil and gas industry, the Sand segment sells its product for use in building products and foundry operations. The Fuel segment operates transmix processing facilities located in the Dallas-Fort Worth area and in Birmingham, Alabama. The Fuel segment also offers third-party bulk motor fuel storage and terminal services, biodiesel refining, sale and distribution of wholesale motor fuels, reclamation services (which consists primarily of cleaning bulk storage tanks used by other petroleum terminal and others) and blending of renewable fuels.
Initial Public Offering of Emerge Energy Services LP
On May 8, 2013, the Partnership priced an initial public offering of 7,500,000 limited partner common units (“common units”) at a price of $17.00 per common unit ($15.85 per common unit, net of underwriting discounts and structuring fee). The IPO was conducted pursuant to a registration statement on Form S-1 originally filed on March 22, 2013, as amended (Registration No. 333-187487) that was declared effective by the U.S. Securities and Exchange Commission (“SEC”) on May 8, 2013. On May 20, 2013, the underwriters exercised their option to purchase an additional 209,906 common units. The net proceeds from the IPO of $122.2 million (including net proceeds of $3.3 million from the exercise of the underwriters’ over-allotment option), after deducting the underwriting discount and the structuring fee, were used to: (i) repay existing subsidiary debt, in the amount of $87.6 million, (ii) pay offering expenses of $10.6 million, (iii) pay and fund cash-based compensation awards to senior management of $8.9 million, (iv) provide the Partnership with working capital of $11.5 million, (v) provide a distribution to pre-IPO equity holders of $3.3 million ($2.6 million to predecessors’ owners and $0.7 million to Direct Fuels’ owners as part of the original purchase price), and (vi) pay certain prepaid items of $0.3 million.
Secondary Offering
On June 20, 2014, we and our general partner, along with certain selling unitholders named therein (the “Selling Unitholders”) entered into an Underwriting Agreement with underwriters named therein (the “Underwriters”), with respect to the offer and sale (the “Secondary Offering”) by the Selling Unitholders of 3,515,388 common units at a price to the public of $109.06 per common unit ($105.2429 per common unit, net of underwriting discounts and commissions). On June 25, 2014, the Selling Unitholders completed the Secondary Offering. We did not receive any proceeds from the Secondary Offering. Pursuant to the Underwriting Agreement, the Selling Unitholders also granted the Underwriters an option for a period of 30 days to purchase up to an additional 527,307 common units on the same terms, and on July 18, 2014, the Underwriters partially exercised the option to purchase 165,635 common units. Following the closing of this transaction and as of December 31, 2014, Insight Equity Management Company LLC and its affiliated investment funds and its controlling equity owners (collectively “Insight Equity”) held approximately 30% of all of our outstanding common units.
Basis of Presentation and Consolidation
Prior to completion of our IPO, Superior Silica Holdings LLC and AEC Holdings LLC, which together constitute our Predecessor for accounting purposes, were under the common control of a private equity fund managed and controlled by Insight Equity. As
70
a result, their contribution to the Partnership was recorded as a combination of entities under common control, whereby the assets contributed and liabilities assumed are recorded based on their historical carrying values. After the contribution of the Predecessor's business and net assets on May 14, 2013, we have retroactively reported our financial statements to include the historical results of our Predecessor. We accounted for the purchase of Direct Fuels under Financial Accounting Standards Board Accounting Standards Codification (FASB ASC), Statement 805, Business Combinations, whereby the net assets acquired are recorded at fair value on the date of acquisition. The acquisition of Direct Fuels was accounted for as a business combination using the acquisition method of accounting. The financial position and results of operations of Direct Fuels are included in our consolidated financial statements from and as of the date of acquisition. We acquired Direct Fuels to expand our operations, gain new customers, improve earnings, and increase our markets through a larger geographical presence. After completing the acquisition on May 14, 2013, the Partnership owned 100% of Direct Fuels. We funded the acquisition with a combination of cash, issuance of common units and assumption of debt.
For periods prior to our IPO, the accompanying consolidated financial statements and related notes present the historical accounts of the Predecessor. To the extent they relate to periods prior to the IPO, the results are not necessarily indicative of the actual results of operations that might have occurred if we had operated as a combined entity during that pre-IPO period.
These consolidated financial statements have been prepared in accordance with accounting principles generally accepted in the United States (“GAAP”) and include the accounts of all of our subsidiaries. All significant intercompany transactions and balances have been eliminated in consolidation.
2. SIGNIFICANT ACCOUNTING POLICIES
Use of Estimates
The preparation of financial statements in conformity with GAAP requires management to make estimates and assumptions that affect the reported amounts of assets and liabilities and disclosure of contingent assets and liabilities at the date of the financial statements and the reported amounts of revenues and expenses during the reported period. We evaluate our estimates and assumptions on a regular basis. We base our estimates on historical experience and various other assumptions that we believe to be reasonable under the circumstances, the results of which form the basis for making judgments about the carrying values of assets and liabilities that are not readily apparent from other sources. Actual results could differ from those estimates, and such differences could be material.
Restricted Cash and Equivalents
We were required under agreements with our chief executive officer (“CEO”) and an officer in our Sand segment (the “Sand Officer”) to establish and maintain Rabbi Trusts used to fund deferred compensation as described in the agreements. Restricted cash and equivalents were invested in short-term instruments at market rates; therefore the carrying values approximated fair value. In May 2014, all funds in the Rabbi Trusts were distributed to our CEO and Sand Officer and the Rabbi Trusts were terminated.
Accounts Receivable and Allowance for Doubtful Accounts
Trade accounts receivable are recognized at their invoiced amounts and do not bear interest. We maintain an allowance for doubtful accounts for estimated losses resulting from the inability of our customers to make required payments. We estimate our allowances for doubtful accounts based on specifically identified amounts that are believed to be uncollectible. If the financial condition of our customers were to deteriorate, resulting in an impairment of their ability to make payments, additional allowances for doubtful accounts might be required. After all attempts to collect a receivable have failed, the receivable is written off against the allowance for doubtful accounts. The allowance for doubtful accounts was $0.4 million at December 31, 2014, and $0.3 million at December 31, 2013.
Inventories
Finished goods inventories consist of dried sand and refined motor fuel products. Finished sand costs include all transportation costs necessary to transport the finished sand to the point of sale. All inventories are stated at the lower of cost or market using the average cost method. Raw materials inventories consist of unprocessed sand, transmix feedstock, and supplies. Raw materials inventories are stated at the lower of cost or market using the average cost method. Wet sand is included in work in process. Overhead in our Sand segment is capitalized at an average rate per unit based on actual costs incurred. Our Fuel segment does not capitalize overhead to its refined transmix inventory because turnover is high and the quantities are generally modest in comparison to our finished fuel inventories we purchase from third party refiners.
Accounting for Renewable Identification Numbers
The Fuel segment is required to comply with federal laws that regulate biofuels and renewable identification numbers (“RINs”). RINs are serial numbers assigned to biofuels for the purpose of tracking its production, use, and trading as required by the U.S.
71
Environmental Protection Agency (the “EPA”) under its Renewable Fuel Standard implemented according to the Energy Policy Act of 2005. Generally, companies that refine petroleum-based fuels are obligated to meet certain quotas based on the volume of fuel they introduce into the marketplace. We are required to satisfy these obligations to the extent previously non-certified fuels are included or introduced into transmix feedstock. We account for these direct obligations as a liability until satisfied. As of December 31, 2014 and 2013, accrued liabilities include $0.6 million and $0.1 million, respectively, for obligations under the Energy Policy Act of 2005.
The Fuel segment routinely purchases ethanol for blending with gasoline. To a lesser extent, the Fuel segment purchases biodiesel for blending with diesel. We have the option to purchase these biofuels with or without RINs, but most biofuels are only available for purchase with RINs. The price suppliers charge to us for biofuels with RINs is somewhat higher than a price that would be charged for product without RINs. We generally purchase the biofuels with RINs. We account for RINs in a manner similar to the purchase of conventional fuels. On a monthly basis, we sell most of our RINs under a contractual arrangement with a major refiner. For RINs that remain unsold at the end of an accounting period, we value this asset at an amount that approximates net realizable value, recording the offset as a reduction in cost of goods sold. When these RINs are sold, we record the sale as a reduction of costs of goods sold instead of additional revenue, effectively offsetting the charge to cost of goods sold when the RINs asset is relieved. As of December 31, 2014 and 2013, prepaid expenses and other current assets include RINs valued at $1.0 million and $0.4 million, respectively.
Direct Financing Lease Receivable
In July 2012, we entered into an agreement with a third party in which we built and paid for a wet sand processing plant and the third party agreed to operate the plant for the purpose of processing wet sand. We paid a specified fee per ton of processed sand purchased by us for the ten-year term of the agreement, and the full amount is recorded as raw materials cost. In turn, we withheld a fixed fee per ton as payment by the third party for eventual transfer of ownership of the plant. The initial cost of the plant totaling $2.7 million was recognized as a direct financing lease receivable in September 2012. The fee from the third party was fully recovered, including interest at 6.0% per annum, during 2014.
Property, Plant and Equipment, net
We recognize purchases of property, plant and equipment at cost, including any capitalized interest. Maintenance, repairs and renewals are expensed when incurred. Additions and significant improvements are capitalized. Disposals are removed at cost less accumulated depreciation and any gain or loss from dispositions is recognized in income. We capitalized $0.6 million, $0 and $1.0 million of interest on construction of assets for the years ended December 31, 2014, 2013 and 2012, respectively.
Depreciation of property, plant and equipment other than mineral reserves is provided for on a straight-line basis over their estimated useful lives. We recognized $15.2 million, $13.7 million and $8.8 million of depreciation expense for 2014, 2013 and 2012, respectively.
Mineral reserves are initially recognized at cost, which approximates the estimated fair value as of the date of acquisition. The provision for depletion of the cost of mineral resources is computed on the units-of-production method. Under this method, we compute the provision by multiplying the total cost of the mineral resources by a rate arrived at dividing the physical units of sand produced during the period by the total estimated mineral resources at the beginning of the period. Depletion expense for 2014, 2013 and 2012 totaled $1.2 million, $29,070 and $46,221, respectively.
Following are the estimated useful lives of our property, plant and equipment:
Useful Lives (in Years) | |
Building and land improvements including assets under capital lease | 10 – 39 |
Mineral reserves | N/A* |
Tanks and equipment | 7 – 40 |
Railroad and related improvements | 20 – 40 |
Machinery and equipment | 5 – 10 |
Plant equipment including assets under capital lease | 5 – 7 |
Industrial vehicles | 3 – 7 |
Furniture, office equipment and software | 3 – 7 |
Leasehold improvements | 3 – 5 or lease term, whichever is less |
* Depletion calculated using units-of-production method
72
Impairment or Disposal of Long-Lived Assets
In accordance with FASB ASC 360-10-05, Impairment or Disposal of Long-Lived Assets, long-lived assets such as property, plant and equipment, and intangible assets subject to amortization are reviewed for impairments whenever events or changes in circumstances indicate that the related carrying amount may not be recoverable. If circumstances require a long-lived asset be tested for possible impairment, we first compare undiscounted cash flows expected to be generated by an asset to the carrying value of the asset. If the carrying value of the long-lived asset is not recoverable on an undiscounted cash flow basis, impairment is recognized to the extent that the carrying value exceeds its fair value. Assets to be disposed of are reported at the lower of the carrying amount or fair value less selling costs. The recoverability of intangible assets subject to amortization is also evaluated whenever events or changes in circumstances indicate that the carrying value of the assets may not be recoverable. In management's opinion, no impairment of long-lived assets exists at December 31, 2014 and 2013.
Intangible Assets Other Than Goodwill
Intangible assets consist of trade names, customer relationships, supply and transportation arrangements, and non-compete agreements. Trade names are amortized on a straight-line basis over 15 years; customer relationships are amortized using an accelerated amortization method over 15 years; supply and transportation arrangements are amortized using the straight-line method over varying periods up to 54 months, depending on the contract terms; and the non-compete agreements are amortized on a straight-line basis over the terms of the agreements.
We recognized $8.4 million, $7.1 million and $0.3 million of amortization expense for 2014, 2013 and 2012, respectively.
Goodwill
Goodwill is not amortized and represents the excess purchase price of the Direct Fuels acquisition over the estimated fair value of the net identifiable assets acquired. As of December 31, 2014 and 2013, goodwill is associated with our Fuel segment. In accordance with GAAP, we perform impairment testing of goodwill assets annually, or more frequently if indicators of impairment exist in interim periods. The impairment test for goodwill uses a two-step process, which is performed at the entity level (the reporting unit). Step one compares the fair value of the reporting unit (calculated using the enterprise value-market capitalization approach) to its carrying value. If the carrying value exceeds the fair value, there is a potential impairment and step two must be performed. Step two compares the carrying value of the reporting unit's goodwill to the implied fair value (i.e., the fair value of the reporting unit less the fair value of the unit's assets and liabilities, including identifiable intangible assets). If the carrying value of goodwill exceeds its implied fair value, we record the excess as an impairment charge to earnings.
We performed our annual assessment of goodwill in the fourth quarter of 2014, and determined during Step one that the fair value of the reporting unit (our Fuel segment) exceeds its carrying value. Therefore, it was not necessary to perform Step two of the analysis.
Other Assets, Net
Deferred financing costs
Financing costs that are directly and incrementally associated with new borrowings are capitalized and amortized over the term of the related debt using the straight-line method, which approximates the effective interest method. The balances of net deferred financing costs were $4.8 million and $3.5 million as of December 31, 2014 and 2013, respectively.
Prepaid lease assets
The cost to transport leased railcars from the manufacturer to our site for initial placement in service is capitalized and amortized over the term of the lease (typically five to seven years). The non-current portion of these capitalized costs totaled $8.3 million and $0.4 million as of December 31, 2014 and 2013, respectively.
Derivative Instruments and Hedging Activities
We account for derivatives and hedging activities in accordance with FASB ASC 815, Derivatives and Hedging, which requires entities to recognize all derivative instruments as either assets or liabilities in the balance sheet at their respective fair values. For derivative instruments that do not qualify as an accounting hedge, changes in fair value of the assets and liabilities are recognized in earnings. Our policy is to not hold or issue derivative instruments for trading or speculative purposes.
Mining and Wet Sand Processing Agreement
In April 2014, a five-year contract with a sand processor (“Processor”) became effective to support our sand business in Wisconsin. Under this contract, the Processor financed and built a wet wash processing plant near our Wisconsin operations. As part of the agreement, the Processor wet washes our sand, creates stockpiles of washed sand and maintains the plant and equipment. During the term of the agreement the Processor will own the wet plant along with the equipment and other temporary structures used to support this activity. At the end of the five-year term of the agreement or following a default under the contract by the Processor,
73
we have the right to take ownership of the wet plant and other equipment without charge. Subject to certain conditions, ownership of the plant and equipment will transfer to us at the expiration of the term. We accounted for the wet plant as a capital lease obligation. The original capitalized lease asset and corresponding capital lease obligation totaled $3.3 million.
Asset Retirement Obligations
We follow the provisions of FASB ASC 410-20, Asset Retirement Obligations, which generally applies to legal obligations associated with the retirement of long-lived assets that result from the acquisition, construction, development and/or the normal operation of a long-lived asset. The standard requires us to recognize an estimated liability for costs associated with the future reclamation of sand mining properties, whether leased or owned, whenever we have a legal obligation to restore the site in the future.
A liability for the fair value of an asset retirement obligation with a corresponding increase to the carrying value of the related long-lived asset is recognized at the time the land is mined. The asset is depleted using the straight-line method, and the discounted liability is increased through accretion over the remaining life of the mine site.
The estimated liability is based on historical industry experience in abandoning mine sites, including estimated economic lives, external estimates as to the cost to bringing back the land to federal and state regulatory requirements. We have utilized a discounted rate reflecting management's best estimate of our credit-adjusted risk-free rate. Revisions to the liability could occur due to changes in the estimated costs, changes in the mine's economic life or if federal or state regulators enact new requirements regarding the abandonment of mine sites.
Changes in the asset retirement obligations are as follows:
Year Ended December 31, | |||||||
2014 | 2013 | ||||||
($ in thousands) | |||||||
Beginning balance | $ | 1,414 | $ | 690 | |||
Additions | 934 | 721 | |||||
Accretion | 38 | 3 | |||||
Ending balance | $ | 2,386 | $ | 1,414 | |||
Revenue Recognition
Our revenue is recognized when persuasive evidence of an arrangement exists, delivery of products has occurred, the sales price charged is fixed or determinable, and collectability is reasonably assured. This generally means that we recognize revenue when our products leave our facilities. Sand and fuel are generally transported via railcar or trucking companies hired by the customer.
We sell some of our Sand segment products under short-term price agreements or at prevailing market rates. A significant portion of our Sand segment revenues are realized through take-or-pay supply agreements with large oilfield services companies. The initial terms of these contracts expire between 2015 and 2021. These agreements define, among other commitments, the volume of product that our customers must purchase, the volume we must provide and the price that we will charge, as well as the rate that our customers will pay. Prices under these agreements are generally fixed and subject to adjustment, upward or downward, only for certain changes in published producer cost indices or market factors. With respect to the take-or-pay arrangements, if the customer is unable to carry forward minimum quantity deficiencies, we recognize Sand segment revenues to the extent of the minimum contracted quantity, assuming payment has been received or is reasonably assured. If deficiencies can be carried forward, receipts in excess of actual sales are recognized as deferred revenues until product is actually delivered or the right to carry forward minimum quantities expires.
We recognize Fuel segment revenue related to our terminals, reclamation, transportation services, and sales of motor fuels, net of trade discounts and allowances, in the reporting period in which the services are performed and motor fuel products are transferred from our terminals, title and risk of ownership pass to the customer, collection of the relevant receivable is probable, persuasive evidence of an arrangement exists and the sales price is fixed or determinable. Purchases and sales of fuel with the same counterparty that are entered into in contemplation of one another are considered to be a single nonmonetary transaction. Therefore, we record the net effect of such transactions as revenues.
Motor Fuel Taxes
We report excise taxes on motor fuels on a gross basis. For the years ended December 31, 2014, 2013 and 2012, excise taxes included in fuel revenues and cost of fuel totaled $50.1 million, $47.0 million and $37.8 million, respectively.
74
Equity-Based Compensation and Equity Incentive Plan
We recognize expenses for equity-based compensation based on the fair value method, which requires that a fair value be assigned to a unit grant on its grant date and that this value be amortized over the grantees' required service period. Restricted and phantom units have a fair value equal to the closing market price of the common units on the date of the grant. We amortize the fair value of the restricted and phantom units over the vesting period using the straight-line method. The fair value of a certain equity award to a key employee was determined using a Monte Carlo simulation. We calculate a forfeiture rate to estimate the equity-based awards that will ultimately vest based on types of awards and historical experience. For performance-based awards, we make estimates as to the probability of the underlying performance being achieved and record expense if the performance will probably be achieved.
Environmental Costs
Environmental costs are expensed or capitalized depending on their future economic benefit. Expenditures that relate to an existing condition caused by past operations and that have no future economic benefits are expensed. We capitalize expenditures that extend the life of the related property or mitigate or prevent future environmental risk. We record liabilities when site restoration and environmental remediation, cleanup and other obligations are either known or considered probable and can be reasonably estimated. Such estimates require judgment with respect to costs, time frame and extent of required remedial and clean-up activities and are subject to periodic adjustments based on currently available information. At December 31, 2014 and 2013, we had no accrued expenses related to environmental costs.
Provision for Income Taxes
For federal income tax purposes, we report our income, expenses, gains, and losses as a partnership not subject to income taxes. As such, each partner is responsible for his or her share of federal and state income tax. Net earnings for financial statement purposes may differ significantly from taxable income reportable to each partner as a result of differences between the tax basis and financial reporting basis of assets and liabilities.
We are responsible for our portion of the Texas margin tax that is included in our subsidiaries' consolidated Texas franchise tax returns. The margin tax qualifies as an income tax under GAAP, which requires us to recognize the impact of this tax on the temporary differences between the financial statement assets and liabilities and their tax basis attributable to such tax.
Emerge Energy Distributors Inc. (“Distributor”), our subsidiary that supports the Fuel segment, reports its income, expenses, gains, and losses as a corporation and is subject to both federal and state income taxes. Our provision for income taxes relates to: (i) Texas margin taxes for the Partnership and for Distributor, as well as (ii) federal and state income taxes for Distributor.
Fair Value of Financial Instruments
Fair value is an exit price that would be received to sell an asset or paid to transfer a liability in an orderly transaction between market participants. Hierarchy Levels 1, 2, or 3 are terms for the priority of inputs to valuation techniques used to measure fair value. Hierarchy Level 1inputs are quoted prices in active markets for identical assets or liabilities. Hierarchy Level 2 inputs are inputs other than quoted prices included with Level 1 that are directly or indirectly observable for the asset or liability. Hierarchy Level 3 inputs are inputs that are not observable in the market.
Our financial instruments consist primarily of cash and cash equivalents, restricted cash and equivalents, accounts receivable, accounts payable and debt instruments. The carrying amounts of cash and cash equivalents, restricted cash and cash equivalents, accounts receivable and accounts payable are representative of their fair values due to their short maturities. As of December 31, 2014 and 2013, the carrying amount for our $350 million senior secured revolving credit facility approximates fair value because the underlying instrument includes provisions that adjust our interest rates based on current market rates.
Concentration of Credit Risk
Financial instruments that potentially subject us to concentration of credit risk are cash and cash equivalents and trade accounts receivable. Cash deposits with banks are federally insured up to $250,000 per depositor at each financial institution; and certain of our cash balances did exceed federally insured limits as of December 31, 2014. We maintain our cash and cash equivalents in financial institutions we consider to be of high credit quality.
We provide credit, in the normal course of business, to customers located throughout the United States and Canada. We perform ongoing credit evaluations of our customers and generally do not require collateral. In addition, we regularly evaluate our credit accounts for loss potential.
Our two largest customer balances represented 24% and 15% of our net accounts receivable balance as of December 31, 2014, while our largest customer balance represented 14% of our net accounts receivable balance as of December 31, 2013. No other customer balances exceeded 10% of the total net accounts receivable balance as of December 31, 2014 and 2013.
75
No individual customer represented more than 10% of revenues for the years ended December 31, 2014 and 2013, while one customer individually represented 15% of revenues for the year ended December 31, 2012.
Segments
We operate our business in two reportable segments.
• | The Sand segment consists of the production and sale of various grades of industrial sand primarily used in the extraction of oil and natural gas, as well as the production of building products and foundry materials. |
• | The Fuel segment operates two terminals and two transmix processing facilities that are located in the Dallas-Fort Worth, Texas area and Birmingham, Alabama. In addition to refining transmix, the Fuel segment sells a suite of complementary fuel products and services, including third-party terminaling services, the sale of wholesale petroleum products, certain reclamation services (which consist primarily of tank cleaning services) and blending of renewable fuels. |
For operations and other Partnership activities not managed through our two operating segments, these items of income, if any, and costs are presented herein as “corporate.” Our chief operating decision maker (“CODM”) is our chief executive officer. The CODM allocates resources and assesses performance of the business based on segment income or loss as presented in Note 15.
Seasonality
For our Sand segment, winter weather affects the months during which we can wash and wet-process sand in Wisconsin. Seasonality is not a significant factor in determining our ability to supply sand to our customers because we accumulate a stockpile of wet sand feedstock during non-winter months. During the winter, we process the stockpiled sand to meet customer requirements. However, we sell sand for use in oil and natural gas production basins where severe weather conditions may curtail drilling activities. This is particularly true in drilling areas located in the northern U.S. and western Canada. If severe winter weather precludes drilling activities, our frac sand sales volume may be adversely affected. Generally, severe weather episodes affect production in the first quarter with possible effect continuing into the second quarter. Generally, our Fuel segment does not experience dramatic seasonal shifts in quantities delivered to its customers.
Other Reclassifications
Certain reclassifications have been made to prior period amounts to conform to the current period presentation. These reclassifications do not impact net income and do not reflect a material change in the information previously presented in our consolidated financial statements.
Recent Accounting Pronouncements
In May 2014, the Financial Accounting Standards Board (“FASB”) issued Accounting Standards Update 2014-09, Revenue from Contracts with Customers, as a new Topic, Accounting Standards Codification Topic 606. The new revenue recognition standard provides a five-step analysis of transactions to determine when and how revenue is recognized. The core principle is that a company should recognize revenue to depict the transfer of promised goods or services to customers in an amount that reflects the consideration to which the entity expects to be entitled in exchange for those goods or services. This guidance is effective for annual periods beginning after December 15, 2016 and shall be applied retrospectively to each period presented or as a cumulative-effect adjustment as of the date of adoption. Early adoption is not permitted. We are evaluating the effect of adopting this new accounting guidance but do not expect adoption will have a material impact on our financial position, results of operations or cash flows.
3. ACQUISITIONS
Acquisition of Direct Fuels
Concurrent with our IPO on May 14, 2013, we acquired Direct Fuels from Direct Fuels Partners, L.P. for $98.3 million, in order to expand our operations, gain new customers, improve earnings, and increase our markets through a larger geographical presence. Direct Fuels operates a motor fuel terminal and transmix processing facilities in Texas. Direct Fuels’ identifiable assets acquired and liabilities assumed by us were recognized based upon the fair values determined on the date of acquisition.
We determined the fair values of Direct Fuels property, plant and equipment as well as its identifiable intangible assets with assistance from an independent third-party appraisal specialist. Our assessment of the fair value of the assets acquired and liabilities assumed as of May 14, 2013 indicates that the consideration given exceeded the fair value of net identifiable assets acquired. Our assessment indicated that goodwill, the excess of consideration over the fair value of net identifiable assets acquired, is $29.3 million. The primary factor that gives rise to goodwill is the premium we were willing to pay to expand our operations into the geographical territories currently served by Direct Fuels. The ability to expand our operations encompasses gaining access to new customers combined with the improved margins attainable through increased market exposure. Additionally, the goodwill is
76
attributable to the value of Direct Fuels’ assembled workforce, including a management team, as well as synergies that arose through the streamlining of operations.
The reconciliation of fair values of the assets acquired and liabilities assumed related to the Direct Fuel purchase price follows ($ in thousands):
Total purchase price | $ | 98,277 | |
Fair value of assets and liabilities acquired: | |||
Cash | 6,197 | ||
Accounts receivable | 9,845 | ||
Other current assets | 13,146 | ||
Property, plant and equipment | 14,897 | ||
Intangible assets | 45,080 | ||
Goodwill | 29,264 | ||
Total assets acquired | 118,429 | ||
Less accounts payable and accrued liabilities | 8,652 | ||
Less dividend payable | 11,500 | ||
Total current liabilities | 20,152 | ||
Net assets acquired | $ | 98,277 | |
The consideration for the Direct Fuels acquisition included payment of $22.9 million in cash, issuance of 3,180,612 common units with a fair value totaling $53.7 million, and assumption of $21.7 million in long-term debt. The accounts receivable acquired represent the gross contractual amounts and are stated at fair value. Subsequent to May 14, 2013, we have collected the accounts receivable in the table above. Prior to the acquisition, Direct Fuels declared a cash dividend totaling $11.5 million which was paid after the acquisition.
We attributed $45.1 million to intangible assets associated with Direct Fuels’ customer relationships, long-term supply and transportation contracts, and a non-compete agreement. We amortize the customer relationships using an accelerated method (based on expected future cash flows) and the other intangibles using straight-line method over their estimated useful lives. The useful lives range as follows: (i) customer relationships, 15 years; (ii) long-term supply and transportation assets, 3 to 54 months; and (iii) non-compete agreement, 4 years.
In 2013, we expensed $1.5 million of transaction costs associated with the acquisition of Direct Fuels. We reported these costs as IPO transaction-related costs within operating expenses. For the period May 14, 2013 (date of acquisition) through December 31, 2013, Direct Fuels’ revenues totaled $218.2 million and it reported a net loss of $1.5 million.
The financial position and results of operations of Direct Fuels are included in our consolidated financial statements from and as of the date of acquisition. The following unaudited pro forma financial information presents the combined results of operations of the Partnership and Direct Fuels as if the transaction had occurred on January 1, 2012. The pro forma information is not necessarily indicative of what the results of operations actually would have been had the acquisition been completed on January 1, 2012. In addition, the unaudited pro forma financial information is not indicative of, nor does it purport to project, our future operating results. The unaudited financial information excludes acquisition and integration costs and does not give effect to any estimated and potential cost savings or other operating efficiencies, if any, that might result from the acquisition.
Year Ended December 31, | |||||||
2013 | 2012 | ||||||
($ in thousands) | |||||||
Revenues | $ | 996,587 | $ | 956,863 | |||
Net income | $ | 38,258 | $ | 19,432 | |||
Acquisition from Midwest
On July 25, 2014, we acquired certain assets and obligations of Midwest Frac and Sands LLC (“Midwest”) in order to expand access to high quality sand reserves near our Wisconsin processing plants, improve earnings, and exert greater control over our sand feedstock supply. Midwest operated a sand mine and wet wash facility in Barron County, Wisconsin. The assets include, but are not limited to, mineral reserves, real estate, buildings, land improvements, wet wash processing and conveying equipment, fixtures and office equipment, permits, and a non-compete agreement with the seller. The liabilities assumed include accounts
77
payable and a local government highway repair and maintenance agreement. We have accounted for the acquisition as a business combination under ASC 805, Business Combinations.
The purchase agreement specifies a total cash purchase price of $24.0 million plus contingent consideration, if any. The agreement required an advance payment of $11.0 million in June 2014. The additional $13.0 million is being paid over time as sand is removed from the reserves, with a minimum of $2.0 million paid each year. After repayment of $13.0 million, we will continue to pay contingent consideration for any additional sand we remove, for as long as the sand reserves remain economically viable. We used a discounted cash flow analysis to estimate the present value of the contingent consideration and other liabilities assumed as of the purchase date, using management’s estimates of the volumes and timing of sand extraction. We estimate that the entire obligation will be repaid within 7 - 8 years after acquisition, assuming production of approximately 850,000 tons of wet washed sand per year. The seller can repurchase the land when we determine the property is no longer viable for our sand mining and processing activities.
As part of the agreement, we cancelled an existing tolling agreement whereby we agreed to convert Midwest’s wet washed sand to dry sand as well as an existing supply contract whereby Midwest agreed to supply and deliver wet washed sand. We recorded a $0.7 million loss on settlement of pre-existing agreements as a component of “Other” expense on our Consolidated Statements of Operations. We estimated the fair values of the terminated agreements using a discounted cash flow analysis.
We retained a third-party expert to assist in determining the volumes and quality of the in-place mineral reserves. With assistance from a third-party valuations expert, we then used this data in our determination of the fair values of identifiable net assets, using the income approach. Our assessment of the fair values of the assets acquired and liabilities assumed as of July 25, 2014 indicates that there was no goodwill associated with the acquisition. We recognized the assets acquired and liabilities assumed based upon the fair values determined on the date of acquisition, using significant inputs that are not observable in the market (i.e., Level 3 inputs). Such values are preliminary and may be revised as we complete our analysis of the fair values of the assets acquired and liabilities assumed, but will be finalized no later than one year from the acquisition date.
Following is a reconciliation of the total consideration to the assets acquired and liabilities assumed as of the acquisition date ($ in thousands):
Consideration: | ||||
Cash deposit | $ | 11,000 | ||
Present value of purchase obligation | 11,226 | |||
Present value of contingent consideration | 853 | |||
Loss on settlement of pre-existing agreements | (689 | ) | ||
Total consideration | $ | 22,390 | ||
Assets acquired: | ||||
Mineral reserves | $ | 19,381 | ||
Other property, plant and equipment | 4,403 | |||
Non-compete agreement | 100 | |||
Total assets acquired | 23,884 | |||
Less liabilities assumed: | ||||
Governmental highway improvement obligation | 1,128 | |||
Asset retirement obligation | 227 | |||
Accounts payable | 139 | |||
Net assets acquired | $ | 22,390 | ||
In our Consolidated Balance Sheets, we have classified the non-current portion of the purchase obligation in “Business acquisition obligation, net of current portion.” The governmental highway improvement obligation and the current portion of the purchase obligation are classified as “Accrued liabilities.”
We incurred approximately $0.1 million in transaction costs, which were recorded as “Selling, general and administrative expenses” as incurred.
The historical financial information for the assets acquired was impractical to obtain, and inclusion of pro forma information would require us to make estimates and assumptions regarding these assets’ historical financial results that may not be reasonable or accurate. As a result, supplemental pro forma results are not presented. This acquisition is not expected to impact our consolidated
78
revenues. It is impractical to determine net income included in our consolidated statements of operations relating to Midwest since the date of acquisition because Midwest has been fully integrated into our sand segment operations and the operating results. For this reason, the operating results of Midwest cannot be separately identified.
4. INVENTORIES
Inventories consisted of the following:
As of December 31, | |||||||
2014 | 2013 | ||||||
($ in thousands) | |||||||
Sand work in process | $ | 14,413 | $ | 9,523 | |||
Refined fuels | 8,031 | 15,049 | |||||
Sand finished goods | 7,582 | 4,431 | |||||
Fuel raw materials and supplies | 2,157 | 12,304 | |||||
Sand raw materials and supplies | 95 | 13 | |||||
Total inventory | $ | 32,278 | $ | 41,320 | |||
5. PROPERTY, PLANT AND EQUIPMENT
Property, plant and equipment consisted of the following:
As of December 31, | |||||||
2014 | 2013 | ||||||
($ in thousands) | |||||||
Machinery and equipment (1) | $ | 146,951 | $ | 115,629 | |||
Buildings and improvements (1) | 51,027 | 31,819 | |||||
Land and improvements (1) | 37,461 | 20,314 | |||||
Mineral reserves | 30,181 | 10,800 | |||||
Construction in progress | 24,172 | 3,405 | |||||
Capitalized reclamation costs | 2,332 | 1,398 | |||||
Total cost | 292,124 | 183,365 | |||||
Accumulated depreciation and depletion | 53,467 | 37,234 | |||||
Net property, plant and equipment | $ | 238,657 | $ | 146,131 | |||
(1) | Includes assets under capital lease |
6. INTANGIBLE ASSETS OTHER THAN GOODWILL
Our intangible assets other than goodwill consisted of the following at December 31, 2014 and 2013:
79
Cost | Accumulated Amortization | Net | |||||||||
($ in thousands) | |||||||||||
December 31, 2014: | |||||||||||
Trade names | $ | 46 | $ | 20 | $ | 26 | |||||
Customer relationships | 43,922 | 15,293 | 28,629 | ||||||||
Supply and transportation agreements | 3,330 | 1,769 | 1,561 | ||||||||
Non-compete agreement | 1,550 | 608 | 942 | ||||||||
Total | $ | 48,848 | $ | 17,690 | $ | 31,158 | |||||
December 31, 2013: | |||||||||||
Trade names | $ | 46 | $ | 17 | $ | 29 | |||||
Customer relationships | 43,922 | 8,187 | 35,735 | ||||||||
Supply and transportation agreements | 3,330 | 887 | 2,443 | ||||||||
Non-compete agreement | 1,450 | 242 | 1,208 | ||||||||
Total | $ | 48,748 | $ | 9,333 | $ | 39,415 | |||||
The following table presents the estimated future amortization expense related to intangible assets through 2019:
Year Ending December 31, | ($ in thousands) | ||
2015 | $ | 6,958 | |
2016 | 5,804 | ||
2017 | 4,382 | ||
2018 | 3,165 | ||
2019 | 2,520 | ||
7. ACCRUED LIABILITIES
Accrued liabilities consisted of the following:
As of December 31, | |||||||
2014 | 2013 | ||||||
($ in thousands) | |||||||
Sales, excise, property and income taxes | $ | 5,002 | $ | 2,659 | |||
Salaries and other employee-related | 4,048 | 2,701 | |||||
Construction | 3,379 | — | |||||
Logistics | 3,185 | 860 | |||||
Current portion of business acquisition obligations | 2,702 | — | |||||
Deferred compensation | 1,341 | 6,740 | |||||
Deferred revenue | 127 | 3,131 | |||||
Other | 4,627 | 1,183 | |||||
Total accrued liabilities | $ | 24,411 | $ | 17,274 | |||
80
8. LONG-TERM DEBT
Following is a summary of our long-term debt:
As of December 31, | |||||||
2014 | 2013 | ||||||
($ in thousands) | |||||||
Revolving credit facility | $ | 221,864 | $ | 93,809 | |||
Other notes | 53 | 233 | |||||
Total debt | 221,917 | 94,042 | |||||
Less current portion | 53 | 233 | |||||
Long-term portion | $ | 221,864 | $ | 93,809 | |||
Revolving Credit Facility
On May 14, 2013, we entered into a $150 million revolving credit and security agreement (as amended and restated, the “Credit Agreement”) among Emerge Energy Services LP, as parent guarantor, each of its subsidiaries, as borrowers (the “Borrowers”), and PNC Bank, National Association, as administrative agent and collateral agent. Substantially all of the assets of the Borrowers are pledged as collateral under the Credit Agreement.
On December 10, 2013, we amended the Credit Agreement to revise certain definitions and to increase the commitment amount for our revolving loan credit facility to $200 million.
On June 27, 2014, we amended and restated the Credit Agreement to:
• | increase our revolving credit facility (the “Credit Facility”) to $350 million, which we may increase from time to time upon our satisfaction of certain conditions by up to an aggregate of $150 million; |
• | revise the interest rates applicable to borrowings under the Credit Facility as follows (at our option); |
• | a Base Rate (as defined in the Credit Agreement), which will be the base commercial lending rate of PNC Bank, as publicly announced to be in effect from time to time, plus an applicable margin ranging from 1.25% to 2% based on our total leverage ratio; or |
• | LIBOR plus an applicable margin ranging from 2.25% to 3% based on our total leverage ratio; |
• | increase the sublimit for the issuance of letters of credit to $30 million; |
• | revise financial covenants as discussed below; and |
• | extend the maturity date to June 27, 2019. |
We also incur a commitment fee of 0.375% on committed amounts that are neither used for borrowings nor under letters of credit.
In May 2013, we initially borrowed $112.7 million to (i) make distributions of $17.0 million to Superior Silica Holdings LLC (“SSH”) and to fund the cash payment in the Direct Fuels acquisition amounting to $22.2 million; and, (ii) repay $73.5 million of existing SSH debt. As part of the original Credit Agreement, we incurred $3.6 million of direct financing costs for professional and legal fees, which we recorded as deferred financing cost. We subsequently incurred $0.1 million and $2.3 million in deferred financing costs related to amendments in 2013 and 2014, respectively.
The Credit Agreement contains various covenants and restrictive provisions and requires maintenance of financial covenants as follows:
• | an interest coverage ratio (as defined in the Credit Agreement) of not less than 3.00 to 1.00; and |
• | a total leverage ratio (as defined in the Credit Agreement) of not greater than 3.00 to 1.00. The requirement to maintain the total leverage ratio is subject an increase to 3.50 to 1.00 in connection with certain permitted acquisitions. |
At December 31, 2014, we were in compliance with our loan covenants and had undrawn availability under the Credit Facility totaling $120.4 million. At December 31, 2014, our outstanding borrowings under the Credit Agreement bore interest at a weighted-average rate of 2.78%.
81
9. COMMITMENTS AND CONTINGENCIES
Contractual Obligations
The following table presents the minimum contractual obligations for contractual commitments as of December 31, 2014.
Railcar Leases (1) | Other Operating Leases | Royalty Commitments | Purchase Commitments (2) | Capital Lease Obligations | |||||||||||||||
($ in thousands) | |||||||||||||||||||
Year ending December 31, | |||||||||||||||||||
2015 | $ | 45,474 | $ | 1,745 | $ | 1,180 | $ | 22,114 | $ | 968 | |||||||||
2016 | 57,637 | 1,337 | 1,191 | 23,168 | 62 | ||||||||||||||
2017 | 53,851 | 776 | 1,201 | 19,380 | — | ||||||||||||||
2018 | 50,509 | 419 | 1,212 | 19,560 | — | ||||||||||||||
2019 | 45,049 | 248 | 1,223 | 18,842 | — | ||||||||||||||
Thereafter | 130,830 | 1,738 | 22,406 | 69,287 | — | ||||||||||||||
Total | $ | 383,350 | $ | 6,263 | $ | 28,413 | 172,351 | 1,030 | |||||||||||
Less amount representing interest | (1,865 | ) | (43 | ) | |||||||||||||||
Total less interest | $ | 170,486 | $ | 987 | |||||||||||||||
(1) | Includes minimum amounts payable under various operating leases as well estimated costs necessary to transport leased railcars from the manufacturer to our site for initial placement in service for those railcars to be delivered in the future. |
(2) | Includes various obligations for services as well as estimated payments for business acquisition obligation, inclusive of expected contingent consideration, based on forecasted volumes. |
Operating Leases
We lease railcars, rail track, locomotives, office and terminal facilities, land, and equipment with various terms in connection with our daily operations. Operating lease expense for the years ended December 31, 2014, 2013 and 2012 totaled $21.5 million, $6.0 million and $0.9 million, respectively.
Royalty Commitments
We maintain various royalty agreements related to the extraction of sand in Wisconsin, of which certain agreements require minimum payments if minimum volumes are not extracted on an annual basis. For the years ended December 31, 2014, 2013, and 2012, we met or exceeded our minimum commitment requirements under all of our royalty agreements.
Purchase Commitments
We entered into several transload services agreements in 2014 with terms from five to ten years with minimum annual commitments. In May 2012, we entered into a railway shipping agreement requiring us to pay a shortfall penalty if minimum annual tonnage levels are not shipped for a term of 10 years commencing on December 1, 2012. We maintain minimum annual purchase commitments with a third-party wet sand supplier with an original term of five years. In addition, we acquired certain sand mining and processing assets in a business acquisition for which we will pay the consideration, including estimated contingent consideration, over five to seven years based on volumes of sand extracted (see Note 3 above for further discussion). For the years ended December 31, 2014, 2013 and 2012, we met or exceeded our minimum commitment requirements under all of our purchase agreements.
Capital Lease Obligations
In April 2014, a five-year contract with a sand processor (“Processor”) became effective to support our sand business in Wisconsin. Under this contract, the Processor financed and built a wet wash processing plant near our Wisconsin operations. As part of the agreement, the Processor wet washes our sand, creates stockpiles of washed sand and maintains the plant and equipment. During the term of the agreement the Processor will own the wet plant along with the equipment and other temporary structures used to support this activity. At the end of the five-year term of the agreement or following a default under the contract by the Processor, we have the right to take ownership of the wet plant and other equipment without charge. Subject to certain conditions, ownership of the plant and equipment will transfer to us at the expiration of the term. We accounted for the wet plant as a capital lease obligation. The original capitalized lease asset and corresponding capital lease obligation totaled $3.3 million. Due to higher than anticipated purchase volumes during 2014, we anticipate we will extinguish the capital lease earlier than originally planned. However, we will still be subject to minimum sand purchase obligations after the capital lease is repaid.
82
Other Commitments and Contingencies
Excise Tax Penalty
In 2012, we received an IRS notice of a penalty totaling $340,000 due to failure to file terminal operator reports in electronic format. We filed these returns in paper format. Management protested the audit findings through IRS appeal channels. Management placed the IRS on notice that it plans to claim exception from penalty due to reasonable cause. The IRS appeal conference has not been scheduled. In the opinion of management, the outcome of such matters will not have a material adverse effect on our financial position, liquidity or results of operations.
Property Value Assurance
On May 13, 2013, we entered into a mining agreement with the Town of Sioux Creek, Wisconsin (“Sioux Creek”) that addresses local regulations related to the operation of our future facility in Sioux Creek. The agreement expires at the end of twenty years. The agreement covers hours and days of operation, royalty payments, control of light and noise, and a property value guaranty or assurance (“PVA”). The PVA provision requires our guaranty of certain owners' property values, as defined in Sioux Creek's ordinance which could require us to make future payments to the specified property owners, if any. The ordinance states that any adjoining property owner, that was an owner prior to commencement of operations, that markets their property for third-party sale subsequent to commencement of operations may have their property appraised by a real estate appraiser in the State of Wisconsin to determine fair market value as if the mining operation did not exist (if the mine operator and land owner do not agree on the appraiser both may chose an appraiser and the average of the two appraisals shall determine fair market value). Certain provisions allow the mine operator to purchase the property or to reimburse the landowner for any shortfall between the selling price and the fair market value established by appraisal within a six months timeframe.
On November 9, 2013, we entered into a mining agreement with the Town of Auburn, Wisconsin (“Auburn”) that addresses local regulations related to sand mining and sand processing activities at our New Auburn, Wisconsin facility. The agreement expires on December 31, 2043. The agreement covers hours of operation, use of roads, control of light and noise, air quality and fugitive dust, control of waste materials, groundwater standards, and a PVA. The PVA provisions include our guaranty of certain owners' property values, as defined in the agreement, and set forth the terms by which we could be required to make future payments to the specified property owners, if any. We are required to pay the property owner the excess of fair market value over selling price, if any. In addition, if the owner's property fails to sell after 270 days from the date listed for sale, we are obligated to purchase the property for fair market value. The agreement defines fair market value using one of two methods: (i) the value identified in the Town's 2011 tax rolls plus 10%; or, in the event the property owner believes the other method does not accurately reflect fair market value, (ii) a then current appraisal prepared by a third party expert using comparable values for similar properties not located within one-quarter mile of a mine site. In the event the property owner sells the property for an amount exceeding fair market value, we are under no obligation to make payment. The PVA provision runs with the land and is binding on the property owners, us, and their heirs, grantees, representatives, successors, and assigns.
We have not accrued a liability related to the PVAs noted above as management does not believe a future payment is probable or reasonably estimable as of December 31, 2014. We have paid less than $0.1 million for these guarantees to date.
Letters of Credit
As of December 31, 2014, we had various letters of credit outstanding totaling $7.1 million. These letters of credit support various railcar lease obligations as well as reclamation obligations for sand mining properties.
Litigation and Potentially Uninsured Liabilities
We are subject to various claims and litigation arising in the ordinary course of business. We maintain general liability insurance with limits and deductibles that management believes prudent in light of our exposure to loss and the cost of insurance. We had recognized no liabilities as of December 31, 2014 and 2013 related to uninsured claims and litigation, and current uninsured litigation matters are not expected to have a material adverse effect on our financial position, liquidity or results of operations. We expense legal costs related to claims and litigation in the period incurred.
Environmental Matter
On November 21, 2013, the EPA issued a General Notice Letter and Information Request (“Notice”) under Section 104(e) of the Comprehensive Environmental Response, Compensation, and Liability Act of 1980, as amended (“CERCLA”), to one of our subsidiaries operating within the Fuel segment. The Notice provides that the subsidiary may have incurred liability with respect to the Reef Environmental site in Alabama, and requested certain information in accordance with Section 107(a) of CERCLA. We timely responded to the Notice. At this time, no specific claim for cost recovery has been made by the EPA (or any other potentially responsible party) against us. There is uncertainty relating to our share of environmental remediation liability, if any, because our allocable share of wastewater is unknown and the total remediation cost is also unknown. Consequently, management is unable to estimate the possible loss or range of loss, if any. We have not recorded a loss contingency accrual as of December 31,
83
2014 and 2013. In the opinion of management, the outcome of such matters is not expected to have a material adverse effect on our financial position, liquidity or results of operations.
10. RELATED PARTY TRANSACTIONS
Related party transactions included in our Consolidated Balance Sheets and Consolidated Statements of Operations are summarized in the following table:
2014 | 2013 | 2012 | |||||||||
($ in thousands) | |||||||||||
Balances for the year ended December 31: | |||||||||||
Wages and employee-related costs (1) | $ | 26,875 | $ | 17,366 | $ | — | |||||
Interest expense (2) | — | 1,915 | 1,379 | ||||||||
IPO transaction-related cost reimbursements (3) | — | 1,643 | — | ||||||||
General and administrative expense reimbursements (3) | 75 | 180 | 186 | ||||||||
Consulting services (4) | — | 112 | 374 | ||||||||
Lease expense | 25 | 24 | 24 | ||||||||
Balances as of December 31: | |||||||||||
Accounts receivable | $ | 181 | $ | 124 | $ | — | |||||
Accounts payable and accrued liabilities | 704 | 515 | 370 | ||||||||
Long-term debt (2) | — | — | 25,036 | ||||||||
(1) | We do not have any employees. Prior to May 14, 2013, our Predecessor and Direct Fuels had employees assigned directly to their respective operations. On May 14, 2013, our general partner hired all employees of the Predecessor and Direct Fuels. After this date, our general partner manages our human resource assets, including fringe benefits and other employee-related charges. We routinely and regularly reimburse our general partner for any employee-related costs paid on our behalf, and report such costs as operating expenses. |
(2) | Debt payable to related parties was repaid using proceeds of our IPO in May 2013. |
(3) | We paid Insight Equity certain IPO transaction-related costs and other general and administrative costs. |
(4) | Prior to May 14, 2013, our Fuel segment paid an affiliated company for leadership services at an annual amount of $250,000 plus bonus for financial performance, if any. Beginning May 14, 2013, these services are being performed by Insight Equity employees and are charged to us through the reimbursement process described in (1) above. |
Agreements with Affiliates
Registration Rights Agreement. In connection with closing of the IPO, we entered into a Registration Rights Agreement, dated as of May 14, 2013 (the “Registration Rights Agreement”), by and between AEC Resources LLC, Ted W. Beneski, Superior Silica Resources LLC, Kayne Anderson Development Company and LBC Sub V, LLC. Pursuant to the Registration Rights Agreement, we agreed to register for resale the restricted common units of the Partnership (the “Restricted Units”) issued to the other parties to the Registration Rights Agreement. We also agreed, subject to certain limitations, to allow the holders to sell Restricted Units in connection with certain registered offerings that we may conduct in the future and to provide holders of a specified number of Restricted Units the right to demand that we conduct an underwritten public offering of Restricted Units under certain circumstances. The Registration Rights Agreement contains representations, warranties, covenants and indemnities that are customary for private placements by public companies.
Services Agreement. On May 14, 2013, in connection with the closing of the IPO, we entered into an administrative services agreement with Insight Equity, pursuant to which Insight Equity provides specific general and administrative services to us. Under this agreement, we reimburse Insight Equity based on agreed upon formulas for actual travel and other expenses on our behalf. In addition, an executive employee of Insight Equity is the head of the Fuel segment. We pay this executive for services rendered to the Fuel segment and record these costs as a charge to earnings. The administrative services agreement will remain in force until (i) the date we and Insight Equity mutually agree to terminate it; (ii) the final distribution in liquidation of the Partnership or our subsidiaries; or (iii) the date on which either Insight Equity or its affiliates collectively controls less than 51% of equity of our general partner.
84
11. EQUITY-BASED COMPENSATION
Effective May 14, 2013, we adopted our 2013 Long-Term Incentive Plan (the “LTIP”) for providing long-term incentives for employees, directors, and consultants who provide services to us, and provides for the issuance of an aggregate of up to 2,321,968 common units to be granted either as options, restricted units, phantom units, distribution equivalent rights, unit appreciation rights, unit award, profits interest units, or other unit-based award granted under the plan. All of our outstanding grants will be settled through issuance of limited partner common units.
On May 14, 2013, we granted 530,588 and 265,294 phantom units to our CEO and Sand Officer, respectively. Half of these phantom units vested after one year, and the remaining half will vest one year later. The agreements covering the CEO and the Sand Officer entitle them to receive dividends in an amount equal to any distributions to our common unitholders whether or not such phantom units are vested. For other employees granted phantom units in 2013, we assumed a 30-month vesting period for phantom unit grants, which represents management’s estimate of the amount of time until all vesting conditions have been met. Concurrent with the closing of a secondary offering in June 2014 and the exercise of the underwriters’ over-allotment in July 2014, 90,686 of these phantom units vested and common units were issued. Independent director restricted units vest on the following anniversary of our IPO. Regarding distributions for independent directors and other employees, distributions are credited to a distribution equivalent rights account for the benefit of each participant and become payable generally within 45 days following the date of vesting. As of December 31, 2014, the unpaid liability for distribution equivalent rights totaled $1.2 million.
The following table summarizes awards granted during the year ended December 31, 2014.
Total Units | Phantom Units | Restricted Units | Fair Value per Unit at Award Date | |||||||||
Outstanding at December 31, 2013 | 1,098,235 | 1,087,648 | 10,587 | $ | 17.00 | |||||||
Granted | 6,710 | 3,815 | 2,895 | 118.49 | ||||||||
Vested | (499,281 | ) | (488,627 | ) | (10,654 | ) | 17.01 | |||||
Forfeitures | — | — | — | — | ||||||||
Outstanding at December 31, 2014 | 605,664 | 602,836 | 2,828 | $ | 18.12 | |||||||
For the years ended December 31, 2014 and 2013, we recorded non-cash compensation expense relating to equity-based compensation of $9.0 million and $5.7 million, respectively, in selling, general and administrative expenses. As of December 31, 2014, the unrecognized compensation expense related to the grants discussed above amounted to $4.6 million to be recognized over a weighted average of 0.54 year.
12. IPO TRANSACTION-RELATED COSTS
We incurred generally non-recurring expenses related directly to the IPO. These costs consist primarily of incentive compensation and payroll-related costs paid to management. In addition, we incurred indirect legal, accounting, and other professional fees associated with the IPO transaction not related to the issuance of equity and debt. We reported these amounts as an operating expense for the year ended December 31, 2013. The following table summarizes these costs (in thousands):
Year Ended December 31, 2013 | |||
Incentive compensation: | |||
Compensation and payroll-related costs for termination of LTIC plan | $ | 6,512 | |
Incentive compensation and payroll-related costs to other management employees | 2,853 | ||
Other IPO-related costs | 1,601 | ||
Total IPO transaction-related expenses | $ | 10,966 | |
85
13. INCOME TAXES
Provision for Income Taxes
Our provision for income taxes relates to: (i) Texas margin taxes for the Partnership and for Emerge Energy Distributors Inc. (“Distributor”), as well as (ii) federal and state income taxes for Distributor. For federal income tax purposes, we report our income, expenses, gains, and losses as a partnership not subject to income taxes. As such, each partner is responsible for his or her share of federal and state income tax. Net earnings for financial statement purposes may differ significantly from taxable income reportable to each partner because of differences between the tax basis and financial reporting basis of assets and liabilities. Distributor reports its income, expenses, gains, and losses as a corporation and is subject to both federal and state income taxes.
The composition of our provision for income taxes follows:
Year Ended December 31, | |||||||||||
2014 | 2013 | 2012 | |||||||||
($ in thousands) | |||||||||||
Federal and state income tax expense for Distributor | $ | 378 | $ | 188 | $ | — | |||||
Texas margin tax | 260 | 198 | 81 | ||||||||
Total provision for income taxes | $ | 638 | $ | 386 | 81 | ||||||
Effective Income Tax Rate
Distributor began operations in May 2013. For the year ended December 31, 2014, Distributor’s effective income tax rate was 35%. For Distributor, there were no significant differences between book and taxable income. We are responsible for our portion of the Texas margin tax that is included in our subsidiaries’ consolidated Texas franchise tax returns. For our operations in Texas, the effective margin tax rate is approximately 0.975% as defined by applicable state law. The margin tax qualifies as an income tax under GAAP, which requires us to recognize the impact of this tax on the temporary differences between the financial statement assets and liabilities and their tax basis attributable to such tax.
14. EARNINGS PER COMMON UNIT
We compute basic earnings per unit by dividing net income by the weighted-average number of common units outstanding including participating securities. Participating securities include unvested equity-based payment awards that contain non-forfeitable rights to distributions. For these purposes, unvested grants to our CEO and the Sand Officer are deemed participating securities.
Diluted earnings per unit is computed by dividing net income by the weighted-average number of common units outstanding, including participating securities, and increased further to include the number of common units that would have been outstanding had potential dilutive units been exercised. The dilutive effect of restricted units is reflected in diluted net income per unit by applying the treasury stock method. Under FASB ASC 260-10-45, Contingently Issuable Shares, 201,080 of our outstanding phantom units are not included in basic or diluted earnings per common unit calculations as of December 31, 2014. At December 31, 2014, there were no anti-dilutive units outstanding.
Basic and diluted earnings per unit are computed as follows:
86
Year ended December 31, | |||||||
2014 | 2013 | ||||||
($ in thousands except per unit data) | |||||||
Post-IPO net income | $ | 89,079 | $ | 22,046 | |||
Basic earnings per unit: | |||||||
Weighted average common units outstanding | 23,527,469 | 23,219,680 | |||||
Weighted average phantom units deemed participating securities | 542,949 | 795,882 | |||||
Total | 24,070,418 | 24,015,562 | |||||
Earnings per common unit (basic) | $ | 3.70 | $ | 0.92 | |||
Diluted earnings per unit: | |||||||
Weighted average common units outstanding | 23,527,469 | 23,219,680 | |||||
Weighted average phantom units deemed participating securities | 542,949 | 795,882 | |||||
Weighted average potentially dilutive units outstanding | 6,019 | 6,395 | |||||
Total | 24,076,437 | 24,021,957 | |||||
Earnings per common unit (diluted) | $ | 3.70 | $ | 0.92 | |||
15. SEGMENT INFORMATION AND GEOGRAPHICAL DATA
Segment Information
We operate our business through two reportable business segments:
• | Sand - the production and sale of various grades of sand primarily used in the extraction of oil and natural gas and the production of numerous building products and foundry materials. |
• | Fuel - the refining of transmix, distribution of finished fuel products, terminal and reclamation activities, and refining of biodiesel. |
Segments have been identified based on how management makes operating decisions, assesses performance and allocates resources. Certain items are reviewed by our management on a consolidated basis, and are therefore presented as corporate income rather than segment income:
• | general and administrative costs related to corporate overhead, such as headquarters facilities and personnel, as well as equity-based compensation; |
• | certain other operating costs such as IPO transaction-related; and |
• | non-operating items such as interest, other income and income taxes. |
Although not used by management in its performance monitoring activities, asset information is included in the following tables together with financial information concerning our reportable segments for the years ended December 31, 2014, 2013 and 2012.
87
Year Ended December 31, 2014 | |||||||||||||||
Sand Segment | Fuel Segment | Corporate | Total | ||||||||||||
($ in thousands) | |||||||||||||||
Revenues | $ | 341,836 | $ | 769,418 | $ | — | $ | 1,111,254 | |||||||
Cost of goods sold (excluding depreciation, depletion and amortization) | 204,282 | 745,724 | — | 950,006 | |||||||||||
Depreciation, depletion and amortization | 12,777 | 11,998 | 28 | 24,803 | |||||||||||
Selling, general and administrative expenses | 15,821 | 5,319 | 17,583 | 38,723 | |||||||||||
Operating income (loss) | $ | 108,956 | $ | 6,377 | $ | (17,611 | ) | $ | 97,722 | ||||||
Capital expenditures | $ | 76,473 | $ | 1,086 | $ | 325 | $ | 77,884 | |||||||
Total assets (at year end) | $ | 284,330 | $ | 142,354 | $ | 10,284 | $ | 436,968 | |||||||
Year Ended December 31, 2013 | |||||||||||||||
Sand Segment | Fuel Segment | Corporate | Total | ||||||||||||
($ in thousands) | |||||||||||||||
Revenues | $ | 167,768 | $ | 705,487 | $ | — | $ | 873,255 | |||||||
Cost of goods sold (excluding depreciation, depletion and amortization) | 91,416 | 676,495 | — | 767,911 | |||||||||||
Depreciation, depletion and amortization | 10,458 | 10,369 | 1 | 20,828 | |||||||||||
Selling, general and administrative expenses | 10,556 | 6,057 | 10,222 | 26,835 | |||||||||||
IPO transaction-related costs | — | — | 10,966 | 10,966 | |||||||||||
Operating income (loss) | $ | 55,338 | $ | 12,566 | $ | (21,189 | ) | $ | 46,715 | ||||||
Capital expenditures | $ | 20,406 | $ | 931 | $ | 32 | $ | 21,369 | |||||||
Total assets (at year end) | $ | 138,847 | $ | 172,833 | $ | 11,336 | $ | 323,016 | |||||||
Year Ended December 31, 2012 | |||||||||||||||
Sand Segment | Fuel Segment | Corporate | Total | ||||||||||||
($ in thousands) | |||||||||||||||
Revenues | $ | 66,697 | $ | 557,399 | $ | — | $ | 624,096 | |||||||
Cost of goods sold (excluding depreciation, depletion and amortization) | 27,405 | 548,003 | — | 575,408 | |||||||||||
Depreciation, depletion and amortization | 6,377 | 2,742 | — | 9,119 | |||||||||||
Selling, general and administrative expenses | 5,531 | 4,643 | 82 | 10,256 | |||||||||||
Operating income (loss) | $ | 27,384 | $ | 2,011 | $ | (82 | ) | $ | 29,313 | ||||||
Capital expenditures | $ | 39,062 | $ | 1,403 | $ | — | $ | 40,465 | |||||||
Total assets (at year end) | $ | 121,498 | $ | 74,289 | $ | 2 | $ | 195,789 | |||||||
Geographical Data
Although we own no long-term assets outside the United States, our Sand segment began selling product in Canada during 2013. We recognized $42.8 million and $13.6 million of revenues in Canada for the year ended December 31, 2014 and 2013, respectively. All other sales have occurred in the United States.
16. DERIVATIVE INSTRUMENTS AND HEDGING ACTIVITIES
We follow FASB ASC 820, Fair Value Measurement, which defines fair value, establishes a framework for measuring fair value, and specifies disclosures about fair value measurements. This guidance establishes a hierarchy for disclosure of the inputs to valuations used to measure fair value. The hierarchy prioritizes the inputs into three broad levels as follows.
• | Level 1 inputs are quoted prices (unadjusted) in active markets for identical assets or liabilities. |
• | Level 2 inputs are quoted prices for similar assets and liabilities in active markets or inputs that are observable for the asset or liability, either directly or indirectly through market corroboration, for substantially the full term of the financial instrument. |
88
• | Level 3 inputs are measured based on prices or valuation models that require inputs that are both significant to the fair value measurement and less observable from objective sources. |
Our valuation models consider various inputs including (a) mark to market valuations, (b) time value and, (c) credit worthiness of valuation of the underlying measurement.
A financial asset or liability’s classification within the hierarchy is determined based on the lowest level of input that is significant to the fair value measurement.
The following table shows the three interest rate swap agreements we entered into during 2013 to manage interest rate risk associated with our variable rate borrowings.
Agreement Date | Effective Date | Maturity Date | Notional Amount | Fixed Rate | Variable Rate | |||||
Nov. 1, 2013 | Oct. 14, 2014 | Oct. 16, 2017 | $25,000,000 | 1.33200% | 1 Month LIBOR | |||||
Nov. 7, 2013 | Oct. 14, 2014 | Oct. 16, 2017 | $25,000,000 | 1.25500% | 1 Month LIBOR | |||||
Nov. 21, 2013 | Oct. 14, 2014 | Oct. 16, 2017 | $20,000,000 | 1.21875% | 1 Month LIBOR | |||||
Our Fuel segment utilizes financial hedging arrangements whereby we hedge a portion of our gasoline and diesel inventory, which reduces our commodity price exposure on some of our activities. The derivative commodity instruments we utilize consist mainly of futures traded on the New York Mercantile Exchange. As of December 31, 2014 and 2013, we had 0 and 40 open commodity derivative contracts, respectively, to manage fuel price risk.
We do not designate our derivative instruments as hedges under GAAP. As a result, we recognize derivatives at fair value on the consolidated balance sheet with resulting gains and losses reflected in interest expense (for interest rate swap agreements) and cost of goods sold (for derivative commodity instruments), as reported in the consolidated statements of operations. Our derivative instruments serve the same risk management purpose whether designated as a hedge or not. We derive fair values from published market interest rates and fuel price quotes (Level 2 inputs). The precise level of open position commodity derivatives is dependent on inventory levels, expected inventory purchase patterns and market price trends. We do not use derivative financial instruments for trading or speculative purposes.
The fair values of outstanding derivative instruments and their classifications within our Consolidated Balance Sheets are summarized as follows:
December 31, 2014 | December 31, 2013 | Classification | |||||||
($ in thousands) | |||||||||
Derivative assets: | |||||||||
Interest rate swaps | $ | — | $ | 247 | Prepaid expenses and other current assets | ||||
Commodity derivative contracts | $ | — | $ | 66 | Prepaid expenses and other current assets | ||||
Derivative liabilities: | |||||||||
Interest rate swaps | $ | 422 | $ | — | Accrued liabilities | ||||
The effect of derivative instruments, none of which has been designated for hedge accounting, on our Consolidated Statements of Operations was as follows:
Year Ended December 31, | ||||||||||||||
2014 | 2013 | 2012 | Classification | |||||||||||
(income (expense), $ in thousands) | ||||||||||||||
Interest rate swaps | $ | (804 | ) | $ | 247 | $ | — | Interest expense, net | ||||||
Commodity derivative contracts | 1,819 | 540 | (1,383 | ) | Cost of goods sold | |||||||||
$ | 1,015 | $ | 787 | $ | (1,383 | ) | ||||||||
17. RETIREMENT PLAN
We sponsor 401(k) plans for substantially all employees. At December 31, 2014, we maintained legacy plans from our predecessor and the legacy plan from Direct Fuels. The plans are comparable generally in terms of employee eligibility, participation, and benefits. Through June 30, 2014, the plans provided for us to match 100% of the participants' contributions up to a range of 4% to 5% of the participant's pay. Effective July 1, 2014, all participants became eligible for a maximum of 5% matching under a single plan. Additionally, we can make discretionary contributions as deemed appropriate by management. Our employer
89
contributions to these plans totaled $0.7 million, $0.4 million, and $0.2 million for the years ended December 31, 2014, 2013, and 2012, respectively.
18. SUPPLEMENTAL CASH FLOW DISCLOSURES
The following supplemental disclosures may assist in the understanding of our Consolidated Statements of Cash Flows:
Year Ended December 31, | |||||||||||
2014 | 2013 | 2012 | |||||||||
($ in thousands) | |||||||||||
Cash paid for interest | $ | 5,972 | $ | 6,058 | $ | 10,889 | |||||
Cash paid for income taxes, net of refunds | $ | 423 | $ | 159 | $ | 68 | |||||
Purchases of PP&E accrued but not paid at year-end | $ | 5,238 | $ | 1,641 | $ | 9,455 | |||||
Purchases of PP&E accrued in a prior period and paid in the current period | $ | 1,641 | $ | 9,455 | $ | — | |||||
Distribution equivalent rights accrued, net of payments | $ | 1,164 | $ | 372 | $ | — | |||||
Capitalized reclamation costs, net of amounts acquired in business combination | $ | 706 | $ | 721 | $ | 258 | |||||
Deferred compensation expense | $ | 122 | $ | 6,368 | $ | — | |||||
Issuance of common units to acquire Direct Fuels | $ | — | $ | 53,721 | $ | — | |||||
Customer advances offset against accounts receivable | $ | — | $ | 4,043 | $ | 10,091 | |||||
Costs and long-term debt paid directly by lenders | $ | — | $ | — | $ | 44,541 | |||||
Public offering costs accrued and not paid | $ | — | $ | — | $ | 2,787 | |||||
Recognition of a direct financing lease receivable | $ | — | $ | — | $ | 2,700 | |||||
19. SUBSEQUENT EVENT
On January 23, 2015, the Board of Directors approved a quarterly distribution of $1.41 per common unit. We paid $33.4 million on February 13, 2015 to holders of record as of February 5, 2015. We also distributed $0.6 million to phantom unitholders pursuant to terms of the LTIP.
90
ITEM 9. | CHANGES IN AND DISAGREEMENTS WITH ACCOUNTANT ON ACCOUNTING AND FINANCIAL DISCLOSURE |
None.
ITEM 9A. | CONTROLS AND PROCEDURES |
Evaluation of Disclosure Controls and Procedures
As of the end of the period covered by this report, we carried out an evaluation, under the supervision and with the participation of our management, including our Chief Executive Officer and our Chief Financial Officer, of the effectiveness of the design and operation of our disclosure controls and procedures, as such term is defined under Rule 13a-15(e) and 15d-15(e) of the Securities Exchange Act of 1934, as amended, or the Exchange Act. Based on that evaluation, our management, including our Chief Executive Officer and our Chief Financial Officer, has identified material weaknesses in our internal control over financial reporting. As a result of these material weaknesses, the Chief Executive Officer and Chief Financial Officer of our general partner concluded that, as of the end of the period covered by this Annual Report on Form 10-K, our disclosure controls and procedures were not effective.
Management’s Report on Internal Control Over Financial Reporting
Our management is responsible for establishing and maintaining adequate internal control over financial reporting (as defined in Rule 13a-15(f) under the Exchange Act). Our internal control system is designed to provide reasonable assurance regarding the reliability of financial reporting and the preparation of financial statements for external purposes in accordance with generally accepted accounting principles. Internal control over financial reporting includes reasonable assurance that:
• | pertain to the maintenance of records that, in reasonable detail, accurately and fairly reflect the transactions and dispositions of our assets; |
• | provide reasonable assurance that transactions are recorded as necessary to permit preparation of financial statements in accordance with generally accepted accounting principles, and that our receipts and expenditures are being made only in accordance with authorizations of management and the board of directors of our general partner; and |
• | provide reasonable assurance regarding prevention or timely detection of unauthorized acquisition, use or disposition of our assets that could have a material effect on the financial statements. |
Because of its inherent limitations, internal control over financial reporting may not prevent or detect misstatements. Projections of any evaluation of effectiveness to future periods are subject to the risks that controls may become inadequate because of changes in conditions or that the degree of compliance with the policies or procedures may deteriorate.
Management assessed the effectiveness of our internal control over financial reporting as of December 31, 2014. In making this assessment, management used the criteria set forth by the Committee of Sponsoring Organizations of the Treadway Commission, or COSO, in the Internal Control-Integrated Framework (2013). A material weakness is a deficiency, or a combination of deficiencies, in internal control over financial reporting, such that there is a reasonable possibility that a material misstatement of our annual or interim financial statements will not be prevented or detected on a timely basis. In management’s assessment of internal controls, it concluded that deficiencies exist in several key areas that, individually or in combination with one another, may not reasonably and timely detect or prevent a material misstatement in our financial reporting. Management’s findings of material weaknesses are summarized below.
Information Technology Controls
We did not effectively perform, complete, document, and track various information technology general control activities during the reporting period. This condition includes activities related to system change management, reviews, and monitoring activities. Management also observed deficiencies related to system access incompatibilities for operations and accounting personnel. In certain instances, these incompatibilities resulted in segregation of duty conflicts that are not adequately mitigated with manual compensating processes or controls. Management did not maintain a sufficient complement of information technology personnel with an appropriate level of information technology knowledge and experience and/or training commensurate with our financial reporting requirements.
91
Sand Segment Control Activities
Our Sand segment experienced a period of rapid growth in sales volume and operational complexity over the course of the year for which we were unable to sufficiently staff personnel in a timely manner. As a result, our Sand segment did not effectively perform and document certain daily and recurring activity controls in the areas of procurement and general accounting in accordance with our authorization and/or documentation retention policies. These deficiencies related to obtaining and retaining adequate documentation and authorization for expenditures, including capital expenditures and costs related to the acquisition of leased railcars, and the period end closing processes. Our Sand segment did not maintain a sufficient complement of accounting personnel with an appropriate level of accounting knowledge and experience to effectively handle the rapid growth and expanding complexities of sand operations. Management also observed deficiencies related to system access incompatibilities for operations and accounting personnel similar to the information technology access control deficiencies described above. In certain instances, these incompatibilities resulted in segregation of duty conflicts which are not adequately mitigated with manual compensating processes or controls.
As a result of these material weaknesses, management has concluded that, as of the end of the period covered by this Annual Report on Form 10-K, our internal control over financial reporting was not effective.
The effectiveness of our internal control over financial reporting as of December 31, 2014, has been audited by BDO LLP, an independent registered certified public accounting firm, as stated in their attestation report included in this Annual Report on Form 10-K.
Remediation of the Material Weakness in Internal Control over Financial Reporting
In response to the identified material weaknesses, management, with Audit Committee oversight, is in the process of dedicating resources and effort to improve the effectiveness of our information technology general controls, compensating controls for identified segregation of duties conflicts, and the Sand segment’s ability to complete control activities associated with procurement and general accounting in accordance with the authorization policies established by management and the board of directors of our general partner.
Management, with Audit Committee oversight, has begun to implement a remediation program for the remainder of 2015. To properly align the remediation process, the annual risk assessment will include a more focused attention on transaction and reporting complexities arising from rapid growth at the Sand segment. The remediation plan includes the following:
• | perform a qualitative and quantitative administrative headcount and competency gap analysis to determine the most appropriate level of staffing necessary to manage the complexity and quantity of transactions to successfully perform the required control activities in a manner that positions us to respond to external and internal demands; |
• | expand our complement of qualified accounting, monitoring, and information technology staff consistent with administrative headcount and competency gap analysis; |
• | where appropriate, incorporate training of information technology and accounting personnel to improve competencies and understanding of policies established by management and the board of directors of our general partner; and |
• | increase managerial monitoring activities over remediation efforts in the areas of information technology general controls, Sand segment procurement and general accounting controls related to capital expenditures and railcar lease acquisition costs to assure compliance with policies, procedures, and processes established by management and the board of directors of our general partner. |
Management believes the foregoing efforts will effectively remediate the material weaknesses. As we continue to evaluate and work to improve our internal control over financial reporting, management may take additional measures to address the material weaknesses or modify the remediation plan and will continue to review and make necessary changes to the overall design of its internal controls.
Changes in Internal Control Over Financial Reporting
There was no change in internal control over financial reporting during the quarter ended December 31, 2014 (as defined by Rules 13a-15(f) and 15d-15(f) under the Exchange Act) that has materially affected, or is reasonably likely to materially affect, our internal control over financial reporting.
92
REPORT OF INDEPENDENT REGISTERED PUBLIC ACCOUNTING FIRM
Board of Directors of Emerge Energy Services GP LLC, as General Partner of Emerge Energy Services LP and the Partners of Emerge Energy Services LP
Southlake, Texas
We have audited Emerge Energy Services LP’s (the “Partnership”) internal control over financial reporting as of December 31, 2014, based on criteria established in Internal Control - Integrated Framework (2013) issued by the Committee of Sponsoring Organizations of the Treadway Commission (the COSO criteria). Emerge Energy Services LP’s management is responsible for maintaining effective internal control over financial reporting and for its assessment of the effectiveness of internal control over financial reporting, included in the accompanying Item 9A, Controls and Procedures. Our responsibility is to express an opinion on the Partnership’s internal control over financial reporting based on our audit.
We conducted our audit in accordance with the standards of the Public Company Accounting Oversight Board (United States). Those standards require that we plan and perform the audit to obtain reasonable assurance about whether effective internal control over financial reporting was maintained in all material respects. Our audit included obtaining an understanding of internal control over financial reporting, assessing the risk that a material weakness exists, and testing and evaluating the design and operating effectiveness of internal control based on the assessed risk. Our audit also included performing such other procedures as we considered necessary in the circumstances. We believe that our audit provides a reasonable basis for our opinion.
A company’s internal control over financial reporting is a process designed to provide reasonable assurance regarding the reliability of financial reporting and the preparation of financial statements for external purposes in accordance with generally accepted accounting principles. A company’s internal control over financial reporting includes those policies and procedures that (1) pertain to the maintenance of records that, in reasonable detail, accurately and fairly reflect the transactions and dispositions of the assets of the company; (2) provide reasonable assurance that transactions are recorded as necessary to permit preparation of financial statements in accordance with generally accepted accounting principles, and that receipts and expenditures of the company are being made only in accordance with authorizations of management and directors of the company; and (3) provide reasonable assurance regarding prevention or timely detection of unauthorized acquisition, use, or disposition of the company’s assets that could have a material effect on the financial statements.
Because of its inherent limitations, internal control over financial reporting may not prevent or detect misstatements. Also, projections of any evaluation of effectiveness to future periods are subject to the risk that controls may become inadequate because of changes in conditions, or that the degree of compliance with the policies or procedures may deteriorate.
A material weakness is a deficiency, or a combination of deficiencies, in internal control over financial reporting, such that there is a reasonable possibility that a material misstatement of the company’s annual or interim financial statements will not be prevented or detected on a timely basis. Material weaknesses were identified and described in management’s assessment regarding: 1) design and operating effectiveness of general information technology controls over access to applications and data and the ability to make program changes and (2) failure to maintain effective controls in areas related to sand segment period end financial reporting process. These material weaknesses were considered in determining the nature, timing, and extent of audit tests applied in our audit of the 2014 consolidated financial statements, and this report does not affect our report dated March 2, 2015 on those consolidated financial statements.
In our opinion, Emerge Energy Services LP did not maintain, in all material respects, effective internal control over financial reporting as of December 31, 2014, based on the COSO criteria.
We do not express an opinion or any other form of assurance on management’s statements referring to any corrective actions taken by the Partnership after the date of management’s assessment.
/s/ BDO USA, LLP
Dallas, Texas
March 2, 2015
93
ITEM 9B. | OTHER INFORMATION |
None.
PART III
ITEM 10. | DIRECTORS, EXECUTIVE OFFICERS AND CORPORATE GOVERNANCE |
Partnership Management
We are managed and operated by the directors and executive officers of our general partner, Emerge Energy Partners GP LLC. Our general partner is not elected by our unitholders and will not be subject to re-election in the future. Our general partner has a board of directors, and our unitholders are not entitled to elect the directors or directly or indirectly participate in our management or operations. Our general partner owes certain fiduciary duties to our unitholders as well as a fiduciary duty to its owners. Our general partner is liable, as general partner, for all of our debts (to the extent not paid from our assets), except for indebtedness or other obligations that are made specifically nonrecourse to it. Whenever possible, we intend to incur indebtedness that is nonrecourse to our general partner.
Our general partner's board of directors has seven directors, four of whom are independent as defined under the independence standards established by the NYSE and the Exchange Act. Our general partner's board of directors has affirmatively determined that Messrs. Clark, Jones, Kelly, and McCarthy are independent as described in the rules of the NYSE and the Exchange Act. The NYSE does not require a listed publicly traded partnership, such as ours, to have a majority of independent directors on the board of directors of our general partner or to establish a compensation committee or a nominating committee.
Directors and Executive Officers
Directors are appointed for a term of one year and hold office until their successors have been elected or qualified or until the earlier of their death, resignation, removal or disqualification. Officers serve at the discretion of the board. The following table shows information for the directors and executive officers of our general partner.
Name | Age | Position | ||
Ted W. Beneski | 58 | Chairman of the Board and Director | ||
Rick Shearer | 64 | Chief Executive Officer | ||
Warren B. Bonham | 52 | Vice President and Director | ||
Robert Lane | 43 | Chief Financial Officer | ||
Richard DeShazo | 64 | Chief Accounting Officer | ||
Kevin Clark | 58 | Independent Director | ||
Peter Jones | 57 | Independent Director | ||
Francis Kelly | 58 | Independent Director | ||
Kevin McCarthy | 54 | Independent Director | ||
Eliot Kerlin | 40 | Director | ||
Victor L. Vescovo | 49 | Director | ||
Ted W. Beneski
Ted W. Beneski was elected Chairman of the Board and appointed as a member of the board of directors of our general partner in April 2012. Since May 2002, Mr. Beneski has served as the Chief Executive Officer and Managing Partner of Insight Equity Holdings LLC. Insight Equity has $1.3B of capital under management. Mr. Beneski also serves as Chairman of the Board of Direct Fuels and SSS, positions he has held since May 2003 and June 2008, respectively. Prior to founding Insight Equity, Mr. Beneski was a founding principal of the Carlyle Management Group, a private equity group specializing in investments in turnarounds and special situation investment opportunities, and served as Senior Vice President from January 2000 to May 2002. Mr. Beneski was also co-founder of the Dallas office of Bain & Company, or Bain, a global leader in strategy-based management consulting services, and served as a Senior Partner and Managing Director. His tenure at Bain (both in Boston and Dallas) was from September 1985 to December 1999. While at Bain, Mr. Beneski advised Fortune 100 clients across a wide range of industries in the areas of portfolio and business unit strategy, mergers and acquisitions, operational improvement, organizational and process
94
redesign, new product introduction and growth strategy. Prior to his time at Bain, Mr. Beneski worked for five years as a commercial banker with Bankers Trust in New York and Shawmut Corporation in Boston.
Mr. Beneski also serves as Chairman of the Board at the following Insight Equity portfolio companies: Vision Partners, Hirschfeld Industries, Walker Group Resources, Aviation Investment Holdings, Atwood Holdings, BFN Holdings, Versatile Processing Group Holdings, A.P. Plasman, New Star Metals Holdings, and MB Precision Holdings. Mr. Beneski also serves on the Board of Trustees of Amherst College and Trinity University. Mr. Beneski received his MBA from Harvard Business School and a BA from Amherst College, majoring in economics.
Mr. Beneski was selected to serve on the board of directors of our general partner due to his affiliation with Insight Equity, his knowledge of the industries in which we operate and his financial and business expertise.
Rick Shearer
Rick Shearer was elected Chief Executive Officer of our general partner in April 2012. Since May 2010, Mr. Shearer has served as President and Chief Executive Officer of SSS. In May 2014 Mr. Shearer was elected to serve on the board of directors of our general partner. Mr. Shearer previously served from March 2007 to May 2010 as President and Chief Executive Officer of Black Bull Resources, a company that specializes in the mining, processing and marketing of industrial minerals that is publicly traded on the TSX Venture Exchange. Mr. Shearer currently serves as the Chairman of the Board of Black Bull Resources. From January 2004 to March 2007, Mr. Shearer served as Director of Excell Minerals, a global stainless steel metals recovery company based in Pittsburgh, Pennsylvania, prior to its acquisition by Harsco Corporation in February 2007. Mr. Shearer also previously served as the President and Chief Operating Officer of U.S. Silica Company Inc., a silica sand supplier, from August 1997 to January 2004.
Mr. Shearer served as Founding Chairman of the Industrial Minerals Association of North America, as Vice Chairman of the National Industrial Sand Association and as a Board Member of the Industrial Minerals Association of Europe from 2003 to 2004. Mr. Shearer has a Bachelor of Science degree from Alderson-Broaddus College and a Masters of Business Administration degree from Eastern Michigan University. He is also a graduate of the Executive Management Program at Harvard University.
Warren B. Bonham
Warren B. Bonham was elected Vice President and appointed as a member of the board of directors of our general partner in April 2012 and currently manages the operations of our Fuel segment. Since February 2012, Mr. Bonham has been a Partner of Insight Equity Holdings LLC. Additionally, he has served as President and Chief Executive Officer of Direct Fuels since January 2008 and previously served as President from June 2006 to December 2007. Mr. Bonham also previously served as Vice President of Hirschfeld Steel, a company that specializes in the fabrication of structural steel components for construction projects such as bridges, industrial and nuclear facilities, mass transit systems, and stadiums, from September 2010 to January 2012 and from June 2006 to December 2007. From August 2002 to May 2006, Mr. Bonham served as the Chief Financial Officer of GES Exposition Services, the largest subsidiary of Viad Corporation, a publicly traded exhibition and event services company. Prior to joining GES Exposition Services, Mr. Bonham served as Chief Financial Officer of Electrolux LLC, a private equity owned direct seller of floor care equipment, from August 1998 to July 2002. From 1995 to 1998, Mr. Bonham worked as a Senior Manager at Bain, where he worked on operational improvement cases in many different industries on three different continents.
Mr. Bonham serves on the board of directors at a number of Insight Equity's portfolio companies including AEC and SSS prior to our initial public offering. Mr. Bonham received his MBA from Harvard Business School and his Bachelor of Commerce degree from Queen's University where he graduated first in his class. He is also a licensed Chartered Accountant. Mr. Bonham was selected to serve on the board of directors of our general partner due to his affiliation with Insight Equity, his knowledge of the industries in which we operate and his financial and business expertise.
Robert Lane
Robert Lane was appointed Chief Financial Officer of our general partner in November 2012. From December 2011 until his appointment as our Chief Financial Officer, Mr. Lane was a Managing Director at Global Hunter Securities LLC, where he was responsible for the origination and execution of capital markets and M&A transactions in the midstream industry. Mr. Lane previously served in various roles, most recently as Managing Director, of Sanders Morris Harris Inc. and its affiliates from November 2004 to December 2011, where he led equity research and then investment banking coverage of midstream energy companies, particularly master limited partnerships.
Mr. Lane is a Certified Public Accountant and a Chartered Financial Analyst. Mr. Lane received his MBA from the University of Pennsylvania's Wharton School and his Bachelor of Arts degree from Princeton University. He also received a Certificate in the Accountancy Program from the B.T. Bauer School of Business at the University of Houston.
95
Richard DeShazo
Richard DeShazo was appointed Chief Accounting Officer of our general partner in May 2013. Since 2009, Mr. DeShazo has also served as President and Chief Financial Officer of Allied Energy Company. Prior to joining Allied Energy Company, Mr. DeShazo served as Chief Financial Officer at Saiia Construction Company, a civil construction firm managed by Insight Equity with operations throughout the southeast United States, from 2003 to 2009. During 2009, Mr. DeShazo served as interim Chief Financial Officer at AirMed International, LLC, which operates emergency airlift services to transport and repatriate critically ill and injured patients. From 1998 to 2003 Mr. DeShazo served as Chief Financial Officer at M&J Materials, Inc., a supplier of fabricated steel products to the construction industry. Prior to 1998, Mr. DeShazo served in several senior leadership positions related to heavy manufacturing and public accounting.
Mr. DeShazo received his baccalaureate degree from Auburn University and his liberal arts M.A. from Birmingham-Southern College. Mr. DeShazo also holds an active license to practice as a CPA in the state of Alabama and is a member of Beta Gamma Sigma.
Kevin Clark
Kevin Clark has served as a member of our board of directors since March 2013. From January 2002 to May 2014 he taught classes in corporate strategy and accounting at Vanderbilt University as an Adjunct Professor, a Senior Lecturer and an Associate Professor. Prior to joining the faculty at Vanderbilt, Mr. Clark was a partner at Executive Perspectives Inc., an executive education firm focused on strategy, finance and team building, from October 1985 to November 1998. He is the co-managing partner of RG Clark Family Holdings, LLC, serving in that role since November 2011, and also serving as Secretary and Treasurer from September 2000 to the present. He is also a Director for three small private companies: Sullivan Street Development, Inc. since June 2001, Exit 33, Inc. since January 2014, and Pulaski Properties, Inc., Director and President since June 2014.
Mr. Clark holds a B.S. in physics from Amherst College and an M.S. in computer and information science from Dartmouth College. Mr. Clark was chosen to serve on the board of our general partner due to his expertise in corporate strategy and accounting.
Peter Jones
Peter Jones joined our Board of Directors in May of 2014. He is the CEO of Flanders Corporation, a leader in the air filtration industry, a position he has held since July of 2014. Since 2009, Mr. Jones has served as an independent advisor to the owners of a number of private companies while they evaluated investment opportunities, handled the operational impacts of rapid growth, reviewed management compensation plans and other deals with assorted issues. During this time, he was on occasion made an employee of employee leasing companies, such as from March to October 2009 as part of Prestige Employee Administrators and from October 2012 to October 2014 as part of Genesis HR Solutions, Inc. Prior to this period of independent contracting, Mr. Jones was involved in the management at a number of private companies, primarily those owned by venture capital and private equity firms.
From 2002 to 2008 he was the Chief Executive Officer of Prime Advantage Corporation, whose two business units included an industrial buying group and a logistics company. From 2005 to 2007, he was Chief Executive Officer of Longstreth Women’s Sports LLC, one of the leading importers and retailers of field hockey, lacrosse and softball equipment. From 2000 to 2002 he was Chief Executive Officer and President of Stratys Learning Solutions, Inc., which offered masters level degrees in technical fields though distance learning, as well as professional development courses. Mr. Jones has also run or overseen the transformation of companies in the health care, corporate training, laser, computer sales and service, consumer goods and e-commerce software industries. Mr. Jones spent three years at the start of his career with Bankers Trust Company, including a year-long classroom training program focused on accounting and finance. During and after his MBA, Mr. Jones worked for Bain and Company in their Boston office, evaluating potential acquisitions, operational enhancements and studying the venture capital and leveraged buy-out industries.
Mr. Jones received his MBA with high distinction from Harvard Business School, where he was a Baker Scholar. He also holds a B.A. and an M.A. from the University of Oxford, where he studied Mathematics. He also serves as a Board Member and President of the United States Men’s Field Hockey Foundation and as a Board Member of the International Masters Hockey Association, both of which are non-profit organizations. Mr. Jones was chosen to serve on the board of our general partner due to his expertise with high growth companies and companies in transition.
Francis J. Kelly, III
Francis J. Kelly, III was appointed as an independent director of our general partner in March 2013. Mr. Kelly is President and CEO of CEOVIEW Branding LLC, a brand strategy consulting firm. Prior to forming CEOVIEW, Mr. Kelly was with Arnold Worldwide, LLC, a large advertising agency. Mr. Kelly joined Arnold Worldwide in January 1994 as Chief Marketing officer, and advanced to become President in 2002, CEO in 2006, and eventually Vice Chairman in 2010 until his resignation in 2014. Mr. Kelly has led a number of successful branding strategies for public and private companies while helping Arnold Worldwide shape its strategic and creative philosophy. From 1989 to 1994, Mr. Kelly worked at Leonard Monahan and Lubars, an advertising agency
96
subsequently renamed Leonard Monahan Lubars and Kelly. From 1983 to 1988, Mr. Kelly developed integrated campaigns for national brands while working for Humphrey Browning MacDougall. His career in the field of branding, advertising, and integrated marketing communications also includes time at Young & Rubicam New York.
Mr. Kelly received his MBA from Harvard Business School and his Bachelor of Arts degree from Amherst College. He is the co-author of two business books and has previously served on the boards of the Boston Chamber of Commerce, the Friends of the Boston Public Library, the Boston Ad Club and the American Association of Advertising Agencies. Mr. Kelly was selected to serve on the board of directors of our general partner due to his marketing, financial and business expertise.
Kevin McCarthy
Kevin McCarthy was appointed as an independent director of our general partner in July 2012. Mr. McCarthy is Chairman, Chief Executive Officer and President of Kayne Anderson MLP Investment Company, Kayne Anderson Energy Total Return Fund, Inc., Kayne Anderson Midstream/Energy Fund, Inc. and Kayne Anderson Energy Development Company, which are each NYSE listed closed-end investment companies. Mr. McCarthy joined Kayne Anderson Capital Advisors as a Senior Managing Director in 2004 from UBS Securities LLC, where he was global head of energy investment banking. In this role, he had senior responsibility for all of UBS's energy investment banking activities, including direct responsibilities for securities underwriting and mergers and acquisitions in the energy industry. From 1995 to 2000, Mr. McCarthy led the energy investment banking activities of Dean Witter Reynolds and then PaineWebber Incorporated. He began his investment banking career in 1984. He is also on the board of directors of Range Resources Corporation, a publicly traded natural gas exploration and production company. He earned a Bachelor of Arts in Economics and Geology from Amherst College and an MBA in Finance from the University of Pennsylvania's Wharton School. Mr. McCarthy was selected to serve on the board of directors of our general partner due to his knowledge of the industries in which we operate and his financial and business expertise.
Eliot E. Kerlin, Jr.
Eliot E. Kerlin Jr. was appointed as a member of the board of directors of our general partner in March 2013. Mr. Kerlin is a Partner at Insight Equity Holdings LLC and has been a member of the firm since July 2005. During his time at Insight Equity Holdings LLC, Mr. Kerlin has led a number of acquisitions, recapitalizations, financings, and operational improvement initiatives at portfolio companies. During 2004, Mr. Kerlin served as a turnaround manager for Bay State Paper Company, a containerboard and craft paper manufacturer. From 2000 to 2003, Mr. Kerlin worked as a Senior Associate at Jupiter Partners, a middle market private equity fund. He began his career as an investment banker at Merrill Lynch Pierce Fenner & Smith.
Mr. Kerlin currently serves as an Executive Vice President and board member for a number of Insight Equity's portfolio companies, including SSS. He received his MBA from Harvard Business School and his Bachelor of Business Administration degree in finance from Texas A&M University. Mr. Kerlin also serves on several non-profit, community and professional boards of directors. Mr. Kerlin was selected to serve on the board of directors of our general partner due to his affiliation with Insight Equity, his knowledge of the industries in which we operate and his financial and business expertise.
Victor L. Vescovo
Victor L. Vescovo was appointed as a member of the board of directors of our general partner in April 2012. Since January 2003, Mr. Vescovo has served as the Chief Operating Officer and Managing Partner of Insight Equity Holdings LLC, which he co-founded with Mr. Beneski. From 1999 to 2001, Mr. Vescovo was Vice President of Product Development of Military Advantage, a venture-backed company sold to Monster Worldwide, Inc. in 2004. From 1994 to 1999, he was a Senior Manager at Bain where he focused on merger integration and operational improvement cases. Mr. Vescovo previously worked in the mergers & acquisitions department of Lehman Brothers Holdings Inc. where he was responsible for company due diligence and transaction execution, as well as working overseas in the Middle East advising the Saudi government on business investments from 1991 to 1992.
Mr. Vescovo also serves as a board member of all of Insight Equity's portfolio companies, including Allied Energy Company and Superior Silica Sands. Mr. Vescovo received his MBA from the Harvard Business School where he graduated as a Baker Scholar. He also received a Master's Degree from the Massachusetts Institute of Technology and earned a double major Bachelor of Arts in economics and political science from Stanford University. Additionally, Mr. Vescovo served 20 years in the U.S. Navy (Reserve) with specialties in operational targeting and counter-terrorism, retiring in the fall of 2013 with the rank of Commander (O-5). Mr. Vescovo was selected to serve on the board of directors of our general partner due to his affiliation with Insight Equity, his knowledge of the industries in which we operate and his financial and business expertise.
Corporate Governance
The board of directors of our general partner has adopted corporate governance guidelines to assist it in the exercise of its responsibilities to provide effective governance over our affairs for the benefit of our unitholders. In addition, we have adopted a code of business conduct and ethics, which sets forth legal and ethical standards of conduct for all our officers, directors and employees. The corporate governance guidelines, the code of business conduct and ethics and the charters of our audit and conflicts committees are available on our website at www.emergelp.com and in print without charge to any unitholder who requests any of
97
them. A unitholder may make such a request in writing by mailing such request to Robert Lane at Investor Relations, Emerge Energy Services LP, 180 State Street, Suite 225, Southlake, Texas 76092. Amendments to, or waivers from, the code of business conduct and ethics will also be available on our website and reported as may be required under SEC rules; however, any technical, administrative or other non-substantive amendments to the code of business conduct and ethics may not be posted. Please note that the preceding Internet address is for information purposes only and is not intended to be a hyperlink. Accordingly, no information found or provided at that Internet address or at our website in general is intended or deemed to be incorporated by reference herein.
Conflicts Committee
Our partnership agreement provides for the Conflicts Committee, as circumstances warrant, to review conflicts of interest between us and our general partner or between us and affiliates of our general partner. The Conflicts Committee, consisting solely of independent directors, determines if the resolution of a conflict of interest that has been presented to it by our general partner is fair and reasonable to us. The members of the Conflicts Committee may not be executive officers or employees of our general partner or directors, executive officers or employees of its affiliates. In addition, the members of the Conflicts Committee must meet the independence and experience standards established by the NYSE and the Exchange Act. Messrs. Clark and Kelly serve as the members of the Conflicts Committee. Mr. Kelly serves as the chair of our Conflicts Committee.
Audit Committee
The board of directors of our general partner has established an audit committee, or Audit Committee, that complies with the NYSE requirements and Section 3(a)(58)(A) of the Exchange Act. Our general partner is generally required to have at least three independent directors serving on its board at all times. Messrs. Clark, Jones and Kelly are independent directors and serve as the members of the Audit Committee. The board has determined that Mr. Clark, who serves as the chairman of the Audit Committee, and also Messrs. Jones and Kelly, each have such accounting or related financial management expertise sufficient to qualify him as an audit committee financial expert in accordance with Item 407(d) of Regulation S-K.
The Audit Committee meets on a regularly scheduled basis with our independent accountants at least four times each year and is available to meet upon the request of any committee member. The Audit Committee has the authority and responsibility to review our external financial reporting, to review our procedures for internal auditing and the adequacy of our internal accounting controls, to consider the qualifications and independence of our independent accountants, to engage and resolve disputes with our independent accountants, including the letter of engagement and statement of fees relating to the scope of the annual audit work and special audit work that may be recommended or required by the independent accountants, and to engage the services of any other advisors and accountants as the Audit Committee deems advisable. The Audit Committee reviews and discusses the audited financial statements with management, discusses with our independent auditors matters required to be discussed by Public Company Accounting Oversight Board Auditing Standard No. 16 (Communications with Audit Committees) and Rule 3520 (Auditor Independence), and makes recommendations to the board of directors of our general partner regarding the inclusion of our audited financial statements in this Annual Report on Form 10-K.
The Audit Committee is authorized to recommend periodically to the board of directors any changes or modifications to its charter that the Audit Committee believes may be required or desirable.
Presiding Director at Meetings of Non-Management Directors.
Section 303A.03 of the NYSE Listed Company Manual requires “non-management directors” to schedule regular executive sessions with members of management present. “Non-management directors” are defined in Section 303A.03 as all directors who are not executive officers. The Partnership schedules executive sessions on a regular basis in which the Partnership's non-management directors meet without management participation. Mr. Kevin Clark serves as the presiding director at such sessions. The Board of Directors is responsible for determining whether or not each director is independent. The Board of Directors has adopted the director independence standards contained in Section 303A.02 of the NYSE’s Listed Company Manual for the purposes of satisfying the NYSE’s applicable governance requirements.
Communication with the Board of Directors
A holder of our units or other interested party who wishes to communicate with the non-management directors or independent directors of our general partner may do so by writing to the EMES Presiding Independent Director, c/o Robert Lane, Chief Financial Officer at 180 State Street, Suite 225, Southlake, Texas 76092 or by phone at (817) 865-5830. Communications will be relayed to the intended recipient of the Board except in instances where it is deemed unnecessary or inappropriate to do so. Any communications withheld will nonetheless be recorded and available for any director who wishes to review them.
Section 16(a) Beneficial Ownership Reporting Compliance
Section 16(a) of the Exchange Act requires our general partner's board of directors and executive officers, and persons who own more than 10 percent of a registered class of our equity securities, to file with the SEC and any exchange or other system on which such securities are traded or quoted initial reports of ownership and reports of changes in ownership of our common units and
98
other equity securities. Officers, directors and greater than 10 percent unitholders are required by the SEC's regulations to furnish to us and any exchange or other system on which such securities are traded or quoted with copies of all Section 16(a) forms they filed with the SEC. To our knowledge, based solely on a review of the copies of such reports furnished to us and written representations that no other reports were required, we believe that all reporting obligations of our general partner's officers, directors and greater than 10 percent unitholders under Section 16(a) were satisfied during the year ended December 31, 2014, except as described below. Due to administrative oversight, a Form 4 filed by Mr. Shearer in connection with the grant of phantom units in 2013 was not timely filed. The grant of the units to Mr. Shearer was reported in an otherwise timely filed Form 4 on May 16, 2014. Additionally, due to administrative oversight, a Form 3 filed by Insight Equity Management Co. LLC in connection with our IPO had to be amended on June 27, 2014 in order to correctly report the common units as being held indirectly rather than directly. In addition, due to administrative oversight, a Form 4 filed by Insight Equity Management Co. LLC disclosing the sale of common units pursuant to a registered offering was not timely filed. The sale of those units was reported in an otherwise timely filing on July 23, 2014, in connection with the exercise of the underwriter’s overallotment option of the same offering.
ITEM 11. | COMPENSATION DISCUSSION AND ANALYSIS |
The board of directors of our general partner develops our executive compensation policies and determines the amounts and elements of compensation for our named executive officers. This Compensation Discussion and Analysis describes our executive compensation programs for our named executive officers for the 2014 fiscal year, who were:
• | Rick Shearer, Chief Executive Officer of Emerge Energy Services GP LLC, our general partner; |
• | Robert Lane, Chief Financial Officer of our general partner; |
• | Warren Bonham, Vice President of our general partner; and |
• | Richard DeShazo, Chief Accounting Officer of our general partner. |
Compensation Principles and Objectives
Our overall compensation program is structured to attract, motivate and retain highly qualified executive officers by paying them competitively, consistent with our success and their contribution to that success. Our ability to excel depends on the skill, creativity, integrity and teamwork of our employees. We believe compensation should be structured to ensure that a portion of compensation opportunity will be related to factors that directly and indirectly influence long-term unitholder value. Our compensation philosophy has been driven by a number of factors that are closely linked with our broader strategic objectives.
The board of directors of our general partner believes that compensation paid to our named executive officers should be aligned with our performance on both a short-term and long-term basis, linked to results intended to create value for unitholders, and that such compensation should assist us in attracting and retaining key executives critical to our long-term success.
In establishing compensation for executive officers, the following are the board of directors of our general partner’s objectives:
• | align officer and unitholder interests by providing a portion of total compensation opportunities for senior management in the form of equity awards and bonuses awarded based on the board of directors of our general partner’s review of company and individual performance; and |
• | ensure executive officer compensation is competitive within the marketplace in which we compete for executive talent by relying on the board of directors of our general partner’s judgment, expertise and personal experience with other similar companies. |
Determination of Compensation
The board of directors of our general partner is charged with the primary authority to determine the compensation available to our executive officers. Based on the directors’ collective understanding of compensation practices in similar companies in the frac sand and fuel processing and distribution industries, our executive compensation package consists of the following elements, in addition to the employee benefit plans in which all employees may participate:
• | Base salary: compensation for ongoing services throughout the year. |
• | Annual performance-based compensation and discretionary bonuses: annual incentive bonus based on the achievement of pre-established targets and/or discretionary objectives, each to recognize and reward achievement of corporate and individual performance. |
• | Long-term incentive compensation programs: equity compensation to provide an incentive to our named executive officers to manage us from the perspective of an owner with an equity stake in the business. |
99
• | Severance and change in control benefits: remuneration paid to certain executives in the event of a qualifying termination of employment and/or change in control. |
To aid the board of directors of our general partner in making its determination, our Chief Executive Officer provides recommendations annually to the board of directors of our general partner regarding the compensation of all other executive officers (other than himself) based on the overall corporate achievements during the period being assessed and his knowledge of the individual contributions to our success by each of the named executive officers. The overall performance of our named executive officers as a team is reviewed annually by the board of directors of our general partner.
We set base salary and annual bonus structures and determine grants of equity awards based on the board of directors of our general partner’s understanding of compensation practices in the frac sand and fuel processing and distribution industries and such directors’ experiences as seasoned executives, consultants, members of the board of directors of our general partner, or investors in similar frac sand and fuel processing and distribution industries companies. In addition, from time to time we may rely on compensation survey data provided by an independent compensation consultant.
Elements of Executive Compensation
Base Salaries
Base salaries of our named executive officers (other than our Chief Executive Officer) are recommended and reviewed periodically by our Chief Executive Officer, and the base salary for each named executive officer is approved by the board of directors of our general partner. Base salaries for the named executive officers are reviewed periodically by the board of directors of our general partner, and adjustments are made generally in accordance with the considerations described above and to maintain base salaries at competitive levels. These periodic reviews consider, among other things, the scope of an executive’s responsibilities, individual contribution, experience and sustained performance, general economic conditions, industry specific business conditions, base salaries for comparable positions in similar industries, the tenure of the officers, and base salaries of the officers relative to one another. Decisions regarding salary increases may take into account the named executive officer’s current salary and other compensation, and the amounts paid to individuals in comparable positions at our peer companies.
Pursuant to the letter agreement with Mr. Shearer, Mr. Shearer is entitled to a formulaic base salary increase of at least 4% each year based on satisfaction of applicable business goals. We believe this strategy is consistent with our intent of offering compensation that is cost-effective, competitive and supports the achievement of performance objectives.
In January 2014, the board of directors of our general partner approved base salary increases for Messrs. Shearer, Lane, Bonham and DeShazo of 18%, 4%, 49% and 4%, respectively, effective January 1, 2014. These increases were determined primarily based on consideration of general industry base pay increase trends for executives as reported by our independent compensation consultant. The board of directors of our general partner believed these increases in base salary were appropriate based on our strong performance and each executive’s individual achievements in 2013, including their increased responsibilities and duties as executive officers of a publicly-traded partnership. In addition, in connection with amending Mr. Lane’s employment letter, Mr. Lane’s annual base salary was further increased from $266,240 to $275,000 to recognize expanded responsibilities within the organization.
Named Executive Officer | 2014 Annual Base Salary | |
Rick Shearer | $425,000 | |
Robert Lane (1) | $275,000 | |
Warren Bonham | $200,000 | |
Richard DeShazo | $234,000 | |
(1) Mr. Lane’s annual base salary was increased from $266,240 to $275,000 effective July 1, 2014.
The actual base salaries paid to our named executive officers during 2014 are set forth in the “Summary Compensation Table” below.
In January 2015, the board of directors of our general partner increased the base salaries of Messrs. Shearer, Lane, Bonham and DeShazo to $450,000, $279,125, $210,000 and $245,700, respectively. We increased base salaries to reflect, among other things, economic conditions, the board members’ understanding of base salaries for comparable positions at peer companies, officer tenure, and base salaries of the officers relative to one another.
Annual Bonuses
In addition to base salaries, our executives are also eligible to receive annual cash bonuses. For 2014, Messrs. Shearer’s, Lane’s, Bonham’s and DeShazo’s annual incentive bonuses were targeted at 80%, 50%, 40% and 45%, respectively, of the executive’s base salary. Additionally, the board of directors of our general partner may award discretionary bonuses based on company and individual performance.
100
For 2014, each of our named executive officers was eligible to receive an annual incentive bonus based on achievement of pre-established adjusted EBITDA targets. Mr. Shearer’s annual incentive bonus was determined based on adjusted EBITDA results for SSS; Messrs. Lane’s and DeShazo’s annual incentive bonuses were determined based on adjusted EBITDA results for Emerge; and Mr. Bonham’s annual incentive bonus was determined based on adjusted EBITDA result for Direct Fuels. The applicable threshold, target, and maximum levels and associated payouts are listed below, with achievement beyond the threshold level up to the maximum level determined by straight-line interpolation.
Named Executive Officer | Adjusted EBITDA | Payout (as a percentage of base salary) (1) | ||
Rick Shearer | ||||
Threshold | $65,000,000 | 5% | ||
Target | $85,000,000 | 80% | ||
Maximum | $157,000,000 | 350% | ||
Robert Lane (1) | ||||
Threshold | $83,000,000 | 10% | ||
Target | $99,000,000 | 50% | ||
Maximum | $147,000,000 | 170% | ||
Warren Bonham | ||||
Threshold | $7,070,000 | 10% | ||
Target | $10,070,000 | 40% | ||
Maximum | $19,070,000 | 130% | ||
Richard DeShazo | ||||
Threshold | $83,000,000 | 9% | ||
Target | $99,000,000 | 45% | ||
Maximum | $147,000,000 | 153% | ||
(1) | For purposes of calculating Mr. Lane’s annual incentive bonus, the company used Mr. Lane’s base salary actually paid in 2014 of $270,620. |
Based on the 2014 adjusted EBITDA achieved by SSS ($121.9 million), Direct Fuels ($7.9 million) and Emerge ($131.9 million), we awarded the following cash bonuses to our named executive officers:
Named Executive Officer | 2014 Bonus | 2014 Bonus (as percentage of base salary) | ||
Rick Shearer | $928,886 | 219% | ||
Robert Lane | $384,178 | 142% | ||
Warren Bonham | $35,727 | 18% | ||
Richard DeShazo | $298,972 | 128% | ||
For purposes of the bonus programs, “Adjusted EBITDA” is, after deducting any bonus expense, defined as SSS’, Direct Fuel’s, or Emerge’s, as applicable, net income plus interest expense, income tax expense, depreciation, depletion and amortization expense, non-cash charges and unusual or non-recurring charges less interest income, tax benefits and selected gains that are unusual or non-recurring.
Based his individual performance in 2014, Mr. Bonham was also awarded a $200,000 discretionary bonus. We recognized and rewarded Mr. Bonham for his decisive leadership in finalizing our Form S-3 shelf registration, the secondary offering, and the expansion of our credit facility.
Our 2015 annual bonus programs will be substantially similar to our 2014 annual bonus programs.
Lane Long-Term Incentive Compensation Program
In 2014, Mr. Lane was eligible to participate in two long-term incentive programs. Under the first program (the “Distribution LTIC”), Mr. Lane was eligible to receive a cash bonus of up to $100,000 for each of 2014 and 2015 based on the amount by which our regular annual distribution exceeds $58,049,200. Under the second program (the “Unit Price LTIC”), Mr. Lane was eligible to receive a cash bonus of up to $125,000 for each of 2014 and 2015 based on the amount by which the average daily trading value of our common units for the applicable year exceeds the per unit equity value of our common units upon the completion of our
101
IPO. Each of the Distribution LTIC and the Unit Price LTIC were to be calculated on an annual basis and were scheduled to be paid in a cash lump sum amount after December 31, 2015 (but no later than March 15, 2016), subject to Mr. Lane’s continued employment through December 31, 2015.
In connection with amending his employment letter, we canceled and terminated both the Distribution LTIC and the Unit Price LTIC for 2014 and 2015. We amended Mr. Lane’s employment letter in order to align his incentive compensation with the market performance of our common units. Mr. Lane remains eligible to receive a cash payment of $146,096 under the Distribution LTIC and the Unit Price LTIC for 2013, subject to his continued employment through December 31, 2015.
Equity Awards
The goals of our long-term, equity-based incentive awards are to align the interests of our named executive officers with the interests of our common unitholders. Because vesting is generally based on continued service, our equity-based incentives also encourage the retention of our named executive officers during the award vesting period. In determining the size of the long-term equity incentives to be awarded to our named executive officers, we take into account a number of factors, such as the reason for the grant, the value of existing equity-based awards (if any), individual performance history, and prior financial contributions to us.
To reward and retain our named executive officers in a manner that aligns their interests with our unitholders’ interests, we have historically used phantom units as the incentive vehicle for long-term compensation. We have granted phantom units in connection with specific events, such as our IPO or in lieu of other forms of compensation. Because employees realize increased value from phantom units if our unit price increases, we believe phantom units provide meaningful incentives to achieve increases in the value of our units over time. Grants of phantom units may also be accompanied by grants of distribution equivalent rights (“DERs”), which entitle the holder of the award to receive distributions in an amount equal to any distributions to our common unitholders.
Phantom unit awards are typically subject to time-based vesting conditions. Vesting may also be tied to other conditions, such as the sale or disposition of common units held by Insight Equity following our IPO. In addition, phantom unit awards may be subject to accelerated vesting in connection with a change in control and/or upon a qualifying termination of service.
In 2014, in connection with amending Mr. Lane’s employment letter, we agreed to grant Mr. Lane two phantom unit awards, each covering 1,907 phantom units (which, pursuant to the terms of the employment letter, covered a number of units equal to $550,000 divided by the per-share closing price of a unit on August 29, 2014). The phantom units were and will be granted as of December 31, 2014 and December 31, 2015, respectively, and each will vest in full on December 31, 2015, subject to Mr. Lane’s continued employment, or immediately prior to a change in control. These phantom units are accompanied by tandem DERs representing the right to receive an amount equal to all or a portion of the cash distributions made on units during the period the phantom units remain outstanding.
None of our other named executive officers received an equity award in 2014.
Severance and Change in Control Arrangements
Each of our named executive officers, other than Mr. Bonham, is eligible for severance benefits pursuant to their respective employment letters. We believe that this protection serves to encourage continued attention and dedication to duties without distraction arising from the possibility of a termination of employment or change in control, and provides the business with a smooth transition in the event of such a termination of employment. These severance arrangements are designed to retain these named executive officers in their respective key positions as we compete for talented executives in the marketplace where such protections are commonly offered. For a detailed description of the severance provisions contained in our named executive officers’ employment letters, and other severance or change in control protections, see “Potential Payments Upon Termination or Change in Control” below. We do not offer Mr. Bonham severance benefits because of his association with Insight Equity.
Other Elements of Compensation and Perquisites
All of our full-time employees in the United States, including our named executive officers, are eligible to participate in our 401(k) plan and our health and welfare plans (including medical, dental, short-term and long-term disability, accidental death and dismemberment and life insurance).
Through its subsidiaries, our general partner maintains a 401(k) retirement savings plans for its employees, including Messrs. Shearer, Lane and DeShazo, who satisfy certain eligibility requirements. Mr. Bonham does not participate in our 401(k) retirement savings plans because of his association with Insight Equity. The Internal Revenue Code of 1986, as amended (the “Code”), allows eligible employees to defer a portion of their compensation, within prescribed limits, on a pre-tax basis through contributions to the 401(k) plan. We believe that providing a vehicle for tax-deferred retirement savings though a 401(k) plan, and making fully vested matching contributions, adds to the overall desirability of our executive compensation package and further incentivizes our employees, including the named executive officers, in accordance with our compensation policies.
102
In addition to the benefits provided to all of our full-time employees, Mr. Shearer is also entitled to receive company-paid annual physical exams, not to exceed $3,000 per year, which are supplemental to the health benefits provided to employees of our general partner generally.
In the future, we may provide perquisites or other personal benefits in limited circumstances, such as where we believe it is appropriate to assist an individual named executive officer in the performance of his duties, to make our named executive officers more efficient and effective, and for recruitment, motivation and/or retention purposes. Future practices with respect to perquisites or other personal benefits for our named executive officers will be approved and subject to periodic review by the board of directors of our general partner.
Tax and Accounting Considerations
Section 280G of the Code
Section 280G of the Code disallows a tax deduction with respect to excess parachute payments to certain executives of companies which undergo a change in control. In addition, Section 4999 of the Code imposes a 20% excise tax on the individual with respect to the excess parachute payment. Parachute payments are compensation linked to or triggered by a change in control and may include, but are not limited to, bonus payments, severance payments, certain fringe benefits, and payments and acceleration of vesting from long-term incentive plans including restricted units and other equity-based compensation. Excess parachute payments are parachute payments that exceed a threshold determined under Section 280G of the Code based on the executive’s prior compensation. In approving the compensation arrangements for our named executive officers in the future, the board of directors of our general partner will consider all elements of the cost to the Company of providing such compensation, including the potential impact of Section 280G of the Code. However, the board of directors of our general partner may, in its judgment, authorize compensation arrangements that could give rise to loss of deductibility under Section 280G of the Code and the imposition of excise taxes under Section 4999 of the Code when it believes that such arrangements are appropriate to attract and retain executive talent.
Accounting Standards
ASC Topic 718, Compensation-Stock Compensation (“ASC Topic 718”) requires us to recognize an expense for the fair value of equity-based compensation awards. Grants of phantom units and restricted units under our equity incentive award plan are accounted for under ASC Topic 718. The board of directors of our general partner regularly considers the accounting implications of significant compensation decisions, especially in connection with decisions that relate to our equity incentive award plan. As accounting standards change, we may revise certain programs to appropriately align accounting expenses of our equity awards with our overall executive compensation philosophy and objectives.
103
Summary Compensation Table
Name and Principal Position | Salary ($) | Bonus ($)(1) | Stock Awards ($)(2) | Non-Equity Incentive Plan Compensation ($)(3) | All Other Compensation ($)(4) | Total ($) | ||||||||||||
Rick Shearer | ||||||||||||||||||
Chief Executive Officer | ||||||||||||||||||
2014 | 425,000 | — | — | 928,886 | 17,877 | 1,371,763 | ||||||||||||
2013 | 312,940 | — | 9,019,996 | 4,653,499 | 11,582 | 13,998,017 | ||||||||||||
2012 | 245,456 | 200,000 | — | — | 10,267 | 455,723 | ||||||||||||
Robert Lane | ||||||||||||||||||
Chief Financial Officer | ||||||||||||||||||
2014 | 270,620 | — | 550,000(5) | 384,178 | 28,193 | 1,232,991 | ||||||||||||
2013 | 256,000 | 153,000 | — | — | 22,083 | 431,083 | ||||||||||||
2012 | 34,462 | 44,989 | — | — | 2,223 | 81,674 | ||||||||||||
Warren Bonham | ||||||||||||||||||
Vice President | ||||||||||||||||||
2014 | 200,000 | 200,000 | — | 35,727 | 3,500 | 439,227 | ||||||||||||
2013 | 136,577 | 1,130,080 | 2,049,996 | — | — | 3,316,653 | ||||||||||||
2012 | 149,543 | — | — | 116,436 | 8,643 | 274,622 | ||||||||||||
Richard DeShazo (6) | ||||||||||||||||||
Chief Accounting Officer | ||||||||||||||||||
2014 | 234,000 | — | — | 298,972 | 27,506 | 560,478 | ||||||||||||
(1) | For 2014, Mr. Bonham was paid a discretionary annual bonus of $200,000 that was awarded based on his individual performance. Mr. Bonham’s discretionary annual bonus earned in 2014 was paid in 2015. |
(2) | The amounts illustrated in this column reflect the aggregate grant date fair value of phantom unit awards made in 2014. The values are calculated in accordance with GAAP. For a discussion of the assumptions used to calculate the value of all phantom unit awards made to named executive officers, refer to Note 11 to our financial statements included in this Annual Report on Form 10-K for the year ended December 31, 2014. |
(3) | For 2014, the amounts include annual incentive bonuses earned in connection with the achievement of pre-established adjusted EBITDA targets. Mr. Shearer’s bonus was determined based on adjusted EBITDA results for SSS; Messrs. Lane’s and DeShazo’s bonuses were determined based on adjusted EBITDA results for Emerge; and Mr. Bonham’s bonus was determined based on adjusted EBITDA results for Direct Fuels. Annual incentive bonuses earned in 2014 were paid to the named executive officers in 2015. |
(4) | For 2014, the amount for Mr. Shearer includes $16,227 for 401(k) plan matching contributions and health savings account matching contributions of $1,650. For Mr. Lane, includes $7,293 for health insurance premium reimbursements, 401(k) matching contributions totaling $17,500 and health savings account matching contributions of $3,400. For Mr. Bonham, includes $3,500 for an executive physical. For Mr. DeShazo, includes $4,500 for health insurance premium reimbursements, 401(k) matching contributions totaling $21,356 and heath savings account matching contributions of $1,650. |
(5) | Consists of two phantom unit awards, one of which the board of directors of our general partner approved on December 31, 2014 and the other of which will be approved on December 31, 2015. The grant date of each phantom unit award for purposes of ASC Topic 718 is August 29, 2014, the date on which the terms of each award became known. |
(6) | Mr. DeShazo was not a “named executive officer” of the company in 2012 or 2013. |
Grants of Plan-Based Awards in 2014
The following table sets forth information regarding grants of plan-based awards made to our named executive officers during the year ended December 31, 2014:
104
Name | Grant Date | Estimated Possible Payouts under Non-Equity Incentive Plan Awards (1) | All Other Stock Awards: Number of Units (#) | Grant Date Fair Value of Stock Awards ($) | |||||||||||||||||
Approval Date | Threshold ($) | Target ($) | Maximum ($) | ||||||||||||||||||
Rick Shearer | — | — | 21,250 | 340,000 | 1,487,500 | — | — | ||||||||||||||
Robert Lane | — | — | 27,062 | 135,310 | 460,054 | — | — | ||||||||||||||
8/29/2014 | 8/5/2014 | — | — | — | 3,815 | 550,000 | |||||||||||||||
Warren Bonham | — | — | 20,000 | 80,000 | 260,000 | — | — | ||||||||||||||
Richard DeShazo | — | — | 21,060 | 105,300 | 358,020 | — | — | ||||||||||||||
(1) | Amounts shown in these columns represent each named executive officer’s non-discretionary incentive bonus opportunity under our 2014 bonus programs. The “Target” amount represents the named executive officer’s target bonus if the performance goal under the applicable bonus program was achieved at the target levels, and the “Threshold” and “Maximum” amounts represent the named executive officer’s minimum and maximum bonuses, respectively, if the performance goal under the applicable bonus program was achieved at the minimum or the maximum percentage levels. |
(2) | Consists of two phantom units awards, one of which the board of directors of our general partner approved on August 5, 2014. The grant date of each phantom unit award for purposes of ASC Topic 718 is August 29, 2014, the date on which the terms of each award became known. |
Narrative Disclosure to Summary Compensation Table
Employment Letters
Our general partner is a party to employment letters with Messrs. Shearer, Lane and DeShazo, each of which is described below. We have not entered into an employment letter or employment agreement with Mr. Bonham.
Rick Shearer. Our general partner and Mr. Shearer are parties to an amended employment letter agreement (the “Amended Shearer Letter”), dated May 29, 2013, that provides for Mr. Shearer's employment as Chief Executive Officer of our general partner. The Amended Shearer Letter amends and restates the employment letter agreement between SSS and Mr. Shearer, dated March 23, 2010 and amended May 17, 2011, which was assigned to our general partner in connection with our IPO. The Amended Shearer Letter expires on December 31, 2015, unless earlier terminated, and the term of the Amended Shearer Letter is subject to automatic one-year renewals unless either our general partner or Mr. Shearer gives written notice of termination at least 60 days prior to the end of the applicable term.
Under the Amended Shearer Letter, Mr. Shearer’s initial annual base salary was $360,000, which is subject to automatic annual increases of at least four percent, and Mr. Shearer is eligible to receive an annual discretionary cash performance bonus under any general partner bonus plan or program applicable to similarly-situated employees. The Amended Shearer Letter also provides that Mr. Shearer is eligible to participate in the welfare benefit plans maintained by our general partner on the same basis as similarly-situated employees, and is entitled to annual physical examinations, paid by our general partner, in an amount up to $3,000 per year.
Robert Lane. In October 2012, we entered into an employment letter with Robert Lane pursuant to which Mr. Lane currently serves as Chief Financial Officer of our general partner. We assigned this employment agreement to our general partner in connection with our IPO. On May 29, 2013 and again on August 8, 2014, our general partner amended the employment letter (as amended, the “Amended Lane Letter”). Under the Amended Lane Letter, Mr. Lane’s annual base salary is $275,000 and he will be granted, on each of December 31, 2014 and December 31, 2015 (subject to his continued employment through the applicable grant date), a phantom unit award covering a number of Emerge’s units equal to $275,000, divided by the per-share closing price of a unit on August 29, 2014. Each unit will vest in full on December 31, 2015, subject to Mr. Lane’s continued employment, and will accelerate and vest in full immediately prior to a “change in control” (as defined in Emerge’s 2013 Long-Term Incentive Plan). For financial reporting purposes under ASC Topic 718, we considered the grant date of each of these phantom unit awards to be August 29, 2014, which was the date that the terms of award became known. Mr. Lane is also entitled to participate in the health and welfare benefit plans maintained by our general partner from time to time.
In connection with amending his employment letter, we canceled and terminated both the Distribution LTIC and the Unit Price LTIC for 2014 and 2015. However, Mr. Lane remains eligible to receive a cash payment of $146,096 under the Distribution LTIC and the Unit Price LTIC for 2013, subject to his continued employment through December 31, 2015.
Richard DeShazo. On May 29, 2013, we entered into an employment letter with Richard DeShazo pursuant to which Mr. DeShazo currently serves as Chief Accounting Officer of our general partner (the “DeShazo Letter”). Under the DeShazo Letter, Mr. DeShazo’s initial annual base salary was $225,000 and he is eligible to receive an annual cash bonus targeted at 45% of his
105
base salary. Mr. DeShazo is also entitled to participate in the health and welfare benefit plans maintained by our general partner on the same basis as similarly-situated employees.
The Amended Shearer Letter, the Amended Lane Letter and the DeShazo Letter also provide for certain payments and benefits upon a termination of employment in certain circumstances by our general partner without “cause,” and, with respect to the DeShazo Letter, by Mr. DeShazo for “good reason” (each, as defined in the applicable employment letter), as described under “-Potential Payments Upon a Termination or Change of Control” below.
Outstanding Equity Awards at December 31, 2014
The following table summarizes the number of shares of our common units underlying outstanding equity incentive plan awards for each named executive officer as of December 31, 2014:
Name | Grant Date | Number of Units That Have Not Vested (#) | Market Value of Units That Have Not Vested ($)(1) | Equity Incentive Plan Awards: Number of Unearned Units That Have Not Vested (#) | Equity Incentive Plan Awards: Market or Payout Value of Unearned Units That Have Not Vested ($)(2) | |||||||||
Rick Shearer | 5/14/13 (3) | 265,294 | 14,325,876 | — | — | |||||||||
Robert Lane | 8/29/14 (4) | 3,815 | 206,010 | — | — | |||||||||
Warren Bonham | 5/14/13 (5) | — | — | 82,974 | 4,970,972 | |||||||||
Richard DeShazo | 5/14/13 (5) | — | — | 19,837 | 1,188,435 | |||||||||
(1) | The market value of phantom units that have not vested is calculated based on the closing trading price of our common units as reported on the New York Stock Exchange on December 31, 2014 ($54.00). |
(2) | The payout value for Messrs. Bonham and DeShazo includes $490,376 and $117,237, respectively, of outstanding DERs that were accrued as of December 31, 2014 and will be paid once the underlying phantom unit award and associated DERs vest. |
(3) | This phantom unit award vests, subject to continued service, in equal 50% installments on each of the first two anniversaries of the grant date. In addition, this phantom unit award may be subject to accelerated vesting immediately prior to a change in control or upon a qualifying termination of service. |
(4) | Consists of two phantom unit awards that will vest in full on December 31, 2015, subject to Mr. Lane’s continued employment. In addition, these phantom unit awards may be subject to accelerated vesting immediately prior to a change in control. |
(5) | These phantom unit awards vest subject to continued service, based on the achievement of performance, in pro-rated installments in connection with the sale or disposition of common units held by Insight Equity based on the ratio of common units sold or disposed of by Insight Equity as compared to the total number of common units held by Insight Equity immediately following the completion of our IPO. In addition, these phantom unit awards may be subject to accelerated vesting immediately prior to a change in control. The number of units that have not vested, as shown in the table, assumes a payout of the unvested portion of each phantom unit award. |
Option Exercises and Stock Vested
The following table provides information regarding the value realized by each of the named executive officers as a result of phantom units that vested during fiscal year 2014:
Name | Number of Units Acquired on Vesting (#) | Value Realized on Vesting ($)(1) | ||
Rick Shearer | 265,294 | 22,523,461 | ||
Robert Lane | — | — | ||
Warren Bonham | 37,614 | 4,003,696 | ||
Richard DeShazo | 8,987 | 956,589 | ||
(1) | Represents the product of the number of phantom units which vested and the closing price of our common units on the vesting date. Mr. Shearer’s phantom units are accompanied by tandem DERs, which were vested as of the date of grant (May 14, 2013). The values include (i) $1,806,652 distributed in 2014 to Mr. Shearer related to his DERs and (ii) $126,383 and, $30,196 of accumulated DERs distributed to Messrs. Bonham and DeShazo, respectively, related to the vesting of the underlying phantom units. |
106
Nonqualified Deferred Compensation
The following table shows the nonqualified deferred compensation activity for each named executive officer during fiscal year 2014:
Name | Executive Contributions in Last FY ($) | Registrant Contributions in Last FY ($) | Aggregate Earnings in Last FY ($) | Aggregate Withdrawals/ Distributions ($) | Aggregate Balance at Last FYE ($) | |||||
Rick Shearer | — | — | — | 4,130,586(1) | — | |||||
Robert Lane | — | — | — | — | — | |||||
Warren Bonham | — | — | — | — | — | |||||
Richard DeShazo | — | — | — | — | — | |||||
(1) | In 2013, Mr. Shearer participated in a long-term incentive compensation program maintained by SSS, referred to as the Shearer LTIC, pursuant to which Mr. Shearer was eligible to receive a cash bonus based on “net cash proceeds” received in connection with an “ultimate sale transaction” of SSS (each, as defined in the Shearer LTIC). In connection with our IPO, our general partner terminated the Shearer LTIC and in connection therewith, agreed to place $4,270,731 in a Rabbi Trust with Mr. Shearer as the sole beneficiary of the trust. In 2013, we distributed $140,145 to cover employment-related taxes associated with the termination of the Shearer LTIC. In May 2014, all funds in the Rabbi Trust were distributed to Mr. Shearer, and the Rabbi Trust was terminated. |
Potential Payments Upon a Termination or Change of Control
Employment Letters
Rick Shearer. The Amended Shearer Letter provides that if Mr. Shearer’s employment is terminated by our general partner without “cause” (as defined in the Amended Shearer Letter) during (a) the first thirty-six months after his hire date or (b) during any subsequent one-year extension (which occurs automatically unless either party provides notice at least 30 days prior to the end of the initial three-year period or subsequent one-year extension), Mr. Shearer will be entitled to receive an amount equal to twice his then-current annual base salary, payable in a cash lump sum amount within sixty days after the termination date.
Robert Lane. The Amended Lane Letter provides that if Mr. Lane’s employment is terminated by the company without “cause” (as defined in the Amended Lane Letter), then Mr. Lane will be entitled to receive (a) an amount equal to his annual base salary (or, if such termination occurs within two months following a “change in control” (as defined in the Amended Lane Letter), an amount equal to 27 months of his annual base salary) and (b) immediate vesting in, and payment of, the Distribution LTIC and Unit Price LTIC to the extent each had been earned as of the termination date. Each of the payments described in this paragraph will be paid in a cash lump sum amount on the 60th day following Mr. Lane’s termination date, subject to his timely execution and non-revocation of a release of claims.
Richard DeShazo. The DeShazo Letter provides that if Mr. DeShazo’s employment is terminated by our general partner without “cause” or Mr. DeShazo terminates his employment for “good reason,” in each case, within six months following a “change of control” (each, as defined in the DeShazo Letter), then Mr. DeShazo will be entitled to receive (a) an amount equal to his annual base salary, and (b) an amount equal to his target bonus, pro-rated to reflect the partial year of service, in each case payable in a cash lump sum amount on the 60th day following Mr. DeShazo’s termination date, subject to his timely execution and non-revocation of a release of claims.
Warren Bonham. Except with respect to his phantom unit awards (described below), Mr. Bonham is not eligible to receive any severance or change in control benefits.
Phantom Unit Awards
Phantom unit awards held by Mr. Shearer will accelerate and vest in full immediately prior to a change in control or upon a termination of service without “cause,” for “good reason” (each, as defined in the applicable award agreement) or due to Mr. Shearer’s death or disability.
Phantom unit awards held by Messrs. Lane, Bonham and DeShazo will accelerate and vest in full immediately prior to a change in control.
Summary of Potential Payments
The following table summarizes the payments that would be made to our named executive officers upon the occurrence of certain qualifying terminations of employment or a change in control event, assuming such named executive officer’s termination of employment occurred on December 31, 2014 and, where relevant, that a change in control occurred on December 31, 2014.
107
Amounts shown in the table below do not include (1) accrued but unpaid salary and (2) other benefits earned or accrued by the named executive officer during his employment that are available to all salaried employees, such as accrued vacation.
Name | Termination Due to Death or Disability ($) | Change in Control (No Termination) ($) | Qualifying Termination (Not in Connection with Change of Control) ($) | Qualifying Termination (In Connection with Change of Control) ($) | ||||||||
Rick Shearer | — | — | — | — | ||||||||
Cash Severance | — | — | 850,000 | 850,000 | ||||||||
Bonus Severance | — | — | — | — | ||||||||
Phantom Unit Acceleration | 14,325,876 | 14,325,876 | 14,325,876 | 14,325,876 | ||||||||
Total | 14,325,876 | 14,325,876 | 15,175,876 | 15,175,876 | ||||||||
Robert Lane | ||||||||||||
Cash Severance | — | — | 275,000 | 618,750 | ||||||||
Bonus Severance | — | — | 146,096 | 146,096 | ||||||||
Phantom Unit Acceleration | — | 102,978 | — | 102,978 | ||||||||
Total | — | 102,978 | 421,096 | 867,824 | ||||||||
Warren Bonham | — | — | — | |||||||||
Cash Severance | — | — | — | — | ||||||||
Bonus Severance | — | — | — | — | ||||||||
Phantom Unit Acceleration | — | 4,970,972 | — | 4,970,972 | ||||||||
Total | — | 4,970,972 | — | 4,970,972 | ||||||||
Richard DeShazo | ||||||||||||
Cash Severance | — | — | 234,000 | 234,000 | ||||||||
Bonus Severance | — | — | 105,300 | 105,300 | ||||||||
Phantom Unit Acceleration | — | 1,188,435 | — | 1,188,435 | ||||||||
Total | — | 1,188,435 | 339,300 | 1,527,735 | ||||||||
Director Compensation
On May 14, 2013, the board of directors of our general partner adopted, and in January 2015, it amended, the Emerge Energy Services LP Director Compensation Program (the “Director Plan”). Any non-employee director not affiliated with the partnership, our general partner, or certain Insight Equity affiliates is eligible to receive awards under the Director Plan.
Cash Compensation
Under the Director Plan, each eligible director is entitled to receive an annual cash retainer of $50,000. In addition, each committee chairperson receives a $10,000 annual cash retainer and each non-chair committee member receives a $2,500 annual cash retainer. Annual retainers are paid in cash quarterly in arrears, and are pro-rated to reflect any partial year of service.
Equity Compensation
Under the Director Plan, any eligible director who joins the board of directors of our general partner will receive a grant of restricted units covering a number of units having a value equal to $75,000 ($60,000 prior to the January 2015 amendment) when he or she joins the board of directors of our general partner, pro-rated to reflect any partial year of service. Each restricted unit grant will vest in full on the anniversary of the closing of our IPO (May 14, 2014) immediately following the applicable grant date, subject to the eligible director’s continued service through the applicable vesting date. An eligible director serving on the board of directors of our general partner as of an anniversary of the closing of our IPO will be granted a restricted unit award valued at $75,000 ($60,000 prior to the January 2015 amendment) on the applicable anniversary date, which will vest in full on the first anniversary of the grant date subject to continued service through the applicable vesting date.
108
2014 Director Compensation Table
Name (1) | Fees Earned in Cash ($)(2) | Stock Awards ($)(3) | Total ($) | |||
Kevin Clark | 62,500 | 61,827 | 124,327 | |||
Peter Jones (4) | 35,000 | 61,827 | 96,827 | |||
Francis J. Kelly, III | 62,500 | 61,827 | 124,327 | |||
Kevin McCarthy | 50,000 | 61,827 | 111,827 | |||
(1) | Only non-employee directors who are not affiliated with us, our general partner or certain Insight Equity affiliates are eligible to receive cash and/or equity compensation pursuant to the Director Plan. |
(2) | The amounts shown in this column include the annual retainer and any individual retainers for serving as the chair or non-chair committee member, in each case earned in 2014. |
(3) | The amounts shown in this column reflect the aggregate grant date fair value of restricted units awards granted in 2014, calculated in accordance with financial accounting standards. For a discussion of the assumptions used to calculate the value of all restricted unit awards made to directors, refer to Note 11 to our financial statements included in this Annual Report on Form 10-K for the period ended December 31, 2014. The total number of restricted units outstanding as of the end of the 2014 fiscal year for each non-employee director was 707. |
(4) | Mr. Jones joined the board of directors of our general partner in May 2014. |
Compensation Committee Report
As our general partner does not have a compensation committee, the board of directors of our general partner provides the oversight, administers and makes decisions regarding our compensation policies and plans. Additionally, the board of directors of our general partner generally reviews and discusses the Compensation Discussion and Analysis with senior management of our general partner as a part of our governance practices. Based on this review and discussion, the board of directors of our general partner has directed that the Compensation Discussion and Analysis be included in this report for filing with the SEC.
Members of the Board of Directors of Emerge Energy Services GP LLC | ||||
Ted W. Beneski | Warren B. Bonham | Kevin Clark | ||
Peter Jones | Francis J. Kelly, III | Eliot Kerlin | ||
Kevin McCarthy | Rick Shearer | Victor L. Vescovo | ||
Compensation Committee Interlocks and Insider Participation
As previously discussed, the board of directors of our general partner is not required to maintain, and does not maintain a compensation committee.
Messrs. Shearer and Bonham, who serve on the board of directors of our general partner, participate in their capacities as directors in the deliberations of the board of directors of our general partner concerning executive officer compensation. In addition, Mr. Shearer makes recommendations to the board of directors of our general partner regarding named executive officer compensation. Each of Messrs. Shearer and Bonham abstain from any decision regarding his own compensation.
ITEM 12. | SECURITY OWNERSHIP OF CERTAIN BENEFICIAL OWNERS AND MANAGEMENT AND RELATED UNITHOLDER MATTERS |
The following table sets forth certain information regarding the beneficial ownership of units as of February 23, 2015 (the “Ownership Reference Date”) by:
• | each person who is known to us to beneficially own 5% or more of such units to be outstanding; |
• | our general partner; |
• | each of the directors and named executive officers of our general partner; and |
• | all of the directors and executive officers of our general partner as a group. |
All information with respect to beneficial ownership has been furnished by the respective directors, officers or 5% or more unitholders as the case may be.
109
The amounts and percentage of units beneficially owned are reported on the basis of regulations of the SEC governing the determination of beneficial ownership of securities. Under the rules of the SEC, a person is deemed to be a “beneficial owner” of a security if that person has or shares “voting power,” which includes the power to vote or to direct the voting of such security, or “investment power,” which includes the power to dispose of or to direct the disposition of such security. In computing the number of common units beneficially owned by a person and the percentage ownership of that person, common units subject to options or warrants held by that person that are currently exercisable or exercisable within 60 days of the Ownership Reference Date, if any, are deemed outstanding, but are not deemed outstanding for computing the percentage ownership of any other person. Except as indicated by footnote, the persons named in the table below have sole voting and investment power with respect to all units shown as beneficially owned by them, subject to community property laws where applicable.
The percentage of units beneficially owned is based on a total 23,718,961 common units outstanding as of the Ownership Reference Date. Except as indicated by footnote, the persons named in the table below have sole voting and investment power with respect to all units shown as beneficially owned by them and their address is 180 State Street, Suite 225, Southlake, Texas 76092.
Name of Beneficial Owner | Common Units Beneficially Owned | Percentage of Common Units to be Beneficially Owned | |||
Insight Equity (1) | 7,168,545 | 30.2% | |||
Goldman Sachs Asset Management, L.P. (2) | 3,011,858 | 12.7% | |||
Susquehanna Financial Group, LLLP (3) | 1,340,225 | 5.7% | |||
Ted W. Beneski (4) | 563,374 | 2.4% | |||
Rick Shearer | 100,119 | * | |||
Victor L. Vescovo | 129,752 | * | |||
Warren B. Bonham | 6,899 | * | |||
Robert Lane | 2,100 | * | |||
Richard DeShazo | 1,350 | * | |||
Kevin McCarthy (5) | 4,236 | * | |||
Francis J. Kelly III (5) | 4,236 | * | |||
Kevin Clark (5) | 3,015 | * | |||
Eliot E. Kerlin, Jr. | 2,408 | * | |||
Peter Jones (5) | 774 | * | |||
All directors and officers as a group (11 persons) | 7,986,808 | 33.7% | |||
An asterisk indicates that the person or entity owns less than one percent.
(1) | As described elsewhere in this prospectus, Ted W. Beneski and Victor L. Vescovo are the controlling equity owners of Insight Equity, which owns a controlling interest in Emerge Holdings, the entity which owns Emerge Energy Services GP, LLC. Messrs. Beneski and Vescovo, by virtue of being controlling equity owners of Insight Equity, may be deemed to beneficially own the units held by Insight Equity. Messrs. Beneski and Vescovo disclaim beneficial ownership of the units held by Insight Equity except to the extent of their pecuniary interest therein. |
(2) | Goldman Sachs Asset Management, L.P. filed with the SEC a Schedule 13G/A, dated February 13, 2015. Based on this Schedule 13G/A, Goldman Sachs Asset Management, L.P. has shared voting power and shared dispositive power with respect to 3,011,858 units. The address of Goldman Sachs Asset Management, L.P. is 200 West Street, New York, NY 10282. |
(3) | Susquehanna Financial Group, LLLP file with the SEC a Schedule 13G dated February 13, 2015. Based on this Schedule 13G, Susquehanna Financial Group, LLLP has shared voting and shared dispositive power of 1,340,225 units. The address of Susquehanna Financial Group, LLLP is 401 E. City Avenue, Suite 220, Bala Cynwyd, PA 19004. |
(4) | Amounts do not include 27,522 units for which Mr. Beneski disclaims beneficial ownership, which are held in irrevocable trust accounts in favor of his sons. Mr. Beneski is the trustee of each trust account. |
(5) | Includes unvested restricted units granted to our independent directors. Such units are deemed beneficially owned because the units will vest on May 14, 2015, the second anniversary of our initial public offering, which is less than 60 days from the Ownership Reference Date. |
110
Securities Authorized for Issuance under Equity Compensation Plans
The following table summarizes certain information regarding our equity compensation plans, including our LTIP, as of December 31, 2014. Our LTIP allows for awards of options, phantom units, restricted units, unit awards, other unit awards and unit appreciation rights.
Plan Category | Number of Securities to be Issued Upon Exercise of Outstanding Options, Warrants and Rights | Weighted-Average Exercise Price of Outstanding Options, Warrants and Rights | Number of Securities Remaining Available for Future Issuance Under Equity Compensation Plans (Excluding Securities Reflected in Column(a)) | |||||||
(a)(1) | (b) | (c)(2) | ||||||||
Equity compensation plans approved by security holders | 602,836 | $ | — | 1,217,023 | ||||||
Equity compensation plans not approved by security holders | — | — | — | |||||||
Total | 602,836 | $ | — | 1,217,023 | ||||||
(1) | The amounts in column (a) of this table reflect only phantom units that have been granted (but not yet issued) under the LTIP. No unit options have been granted. Our LTIP was approved by our partners (general and limited) prior to our IPO. No value is shown in column (b) of the table, since the phantom units do not have an exercise, or strike, price. |
(2) | The LTIP was adopted by the Emerge Energy Services GP LLC Board of Directors in connection with the closing of our IPO in May 2013, and provides for awards of options, restricted units, phantom units, distribution equivalent rights, substitute awards, unit appreciation rights, unit awards, profits interest units and other unit-based awards to be available for employees, consultants and directors of our general partner and any affiliates who perform services for Emerge Energy Services LP. |
ITEM 13. | CERTAIN RELATIONSHIPS AND RELATED TRANSACTIONS, AND DIRECTOR INDEPENDENCE |
Ownership Interests of Certain Executive Officers and Directors of Our General Partner
Insight Equity owns 7,168,545 common units representing a 30.2% limited partner interest in us, and is controlled by Ted Beneski and Victor Vescovo, the Chairman of the Board and each a member of our board of directors. Emerge Energy Services Holdings LLC is the sole member of our general partner. Emerge Energy Services Holdings LLC is controlled by Insight Equity and Ted Beneski.
Distributions and Payments to Our General Partner and Its Affiliates
The following table summarizes the distributions and payments to be made by us to our general partner and its affiliates in connection with our ongoing operation and liquidation. These distributions and payments were determined by and among affiliated entities and, consequently, are not the result of arm's-length negotiations.
111
Post-IPO Stage | ||||
Distributions of available cash to our general partner and its affiliates | We make cash distributions pro rata to the holders of our common units, including affiliates of our general partner, as the holders of an aggregate of 7,168,545 common units. | |||
Payments to our general partner and its affiliates | Our general partner does not receive a management fee or other compensation for its management of us. Our general partner and its affiliates are reimbursed for expenses incurred on our behalf. Our partnership agreement provides that our general partner determines the amount of these expenses. | |||
Withdrawal or removal of our general partner | If our general partner withdraws or is removed, its general partner interest and its incentive distribution rights will either be sold to the new general partner for cash or converted into common units, in each case for an amount equal to the fair market value of those interests. | |||
Liquidation Stage | ||||
Liquidation | Upon our liquidation, the partners, including our general partner, will be entitled to receive liquidating distributions according to their particular capital account balances. | |||
Other Agreements with Affiliates
We have various agreements with certain of our affiliates, as described below. These agreements have been negotiated among affiliated parties and, consequently, are not the result of arm's-length negotiations.
We entered into an administrative services agreement with Insight Management Company LLC pursuant to which Insight Management Company LLC provides specified general and administrative services to us and our subsidiaries from time to time. Under the terms of the agreement, we reimburse Insight Management Company LLC based on agreed upon-formulas on a monthly basis for the time and materials actually spent in performing general and administrative services on our behalf. In addition, Warren B. Bonham is considered to be an employee of Insight Management Company LLC and also serves as the head of our Fuel segment. Mr. Bonham’s compensation for services provided to us are included in our normal periodic charges from our general partner for all of our employee costs. We expect that this administrative services agreement will remain in force until (i) the date we and Insight Management Company LLC mutually agree to terminate it; (ii) the final distribution in liquidation of us or our subsidiaries; or (iii) the date on which neither Insight Equity nor any of its affiliates own equity securities of us. We believe that the terms of the administrative services agreement are no less favorable to us than those generally available from unrelated third parties.
Procedures for Review, Approval and Ratification of Related-Person Transactions
Our code of business conduct and ethics provides that the board of directors of our general partner or its authorized committee periodically review all related person transactions that are required to be disclosed under SEC rules and, when appropriate, initially authorize or ratify all such transactions. In the event that the board of directors of our general partner or its authorized committee considers ratification of a related person transaction and determines not to so ratify, the code of business conduct and ethics provides that our management will make all reasonable efforts to cancel or annul the transaction.
The code of business conduct and ethics provides that, in determining whether or not to recommend the initial approval or ratification of a related person transaction, the board of directors of our general partner or its authorized committee should consider all of the relevant facts and circumstances available, including (if applicable) but not limited to: (i) whether there is an appropriate business justification for the transaction; (ii) the benefits that accrue to us as a result of the transaction; (iii) the terms available to unrelated third parties entering into similar transactions; (iv) the impact of the transaction on a director's independence (in the event the related person is a director, an immediate family member of a director or an entity in which a director or an immediately family member of a director is a partner, shareholder, member or executive officer); (v) the availability of other sources for comparable products or services; (vi) whether it is a single transaction or a series of ongoing, related transactions; and (vii) whether entering into the transaction would be consistent with the code of business conduct and ethics.
Further information required for this item is provided in Part I, Item 1. Business—Overview, Part III, Item 10. Directors, Executive Officers and Corporate Governance and Note 10, Related Party Transactions, included in the notes to the audited consolidated financial statements included in Part II, Item 8. Financial Statements and Supplementary Data.
112
ITEM 14. | PRINCIPAL ACCOUNTING FEES AND SERVICES |
We have engaged BDO USA, LLP (“BDO”) as our independent registered public accounting firm. The following table sets forth fees billed for professional serviced rendered by BDO to audit our annual financial statements and for other services in 2014 and 2013, including out-of-pocket expenses billed.
Year Ended December 31, | ||||||||
2014 | 2013 | |||||||
($ in thousands) | ||||||||
Audit fees (1) | $ | 1,825 | $ | 1,836 | ||||
Audit-related fees (2) | 68 | 227 | ||||||
Tax fees (3) | 4 | 24 | ||||||
Total | $ | 1,897 | $ | 2,087 | ||||
(1) | Consists primarily of services provided in connection with the audit of the annual financial statements, audit of internal control over financial reporting, review of quarterly financial statements, services related to offering documents and advice on accounting policies. |
(2) | Consists primarily of services performed related to business combinations. |
(3) | Represents fees for professional services in connection with tax compliance and planning. |
Pursuant to the charter of the Audit Committee, the Audit Committee is responsible for the oversight of our accounting, reporting and financial practices. The Audit Committee is responsible for the appointment, compensation, retention and oversight of the work of our external auditors; the pre-approval of all audit and non-audit services to be provided, consistent with all applicable laws, to us by our external auditors; and the establishment of the fees and other compensation to be paid to our external auditors. The Audit Committee also oversees and directs our internal auditing program and reviews our internal controls.
The Audit Committee has adopted a policy for the pre-approval of audit and permitted non-audit services provided by our principal independent accountants. The policy requires that all services provided by BDO, including audit services, audit-related services, tax services and other services, must be pre-approved by the Audit Committee.
The Audit Committee reviews the external auditors' proposed scope and approach as well as the performance of the external auditors. It also has direct responsibility for resolution of and sole authority to resolve any disagreements between our management and our external auditors regarding financial reporting, regularly reviews with the external auditors any problems or difficulties the auditors encounter.
in the course of their audit work, and, at least annually, uses its reasonable efforts to obtain and review a report from the external auditors addressing the following (among other items):
• | the external auditors' internal quality-control procedures; |
• | any material issues raised by the most recent internal quality-control review, or peer review, of the external auditors; |
• | the independence of the external auditors; |
• | the aggregate fees billed by the external auditors for each of the previous two fiscal years; and |
• | the rotation of the external auditors' lead partner. |
113
PART IV
ITEM 15. | EXHIBITS AND FINANCIAL STATEMENT SCHEDULES |
(a)(1). | Financial Statements. See “Index to Financial Statements” on page 64. |
(a)(2). | Financial Statement Schedules. Other schedules are omitted because they are not required or applicable, or the required information is included in our consolidated financial statements or related notes. |
(a)(3). | Exhibits. See “Index to Exhibits.” |
Schedules other than those listed above are omitted because they are not required, not material, not applicable or the required information is shown in the financial statements or notes thereto.
Agreements attached or incorporated herein as exhibits to this report are included to provide investors with information regarding the terms and conditions of such agreements and are not intended to provide any other factual or disclosure information about Emerge Energy Services LP or the other parties to the agreements.
Such agreements may contain representations and warranties by the parties to the applicable agreement. These representations and warranties have been made solely for the benefit of the other parties to the applicable agreement and (i) should not in all instances be treated as categorical statements of fact, but rather as a way of allocating the risk to one of the parties if those statements prove to be inaccurate, (ii) have been qualified by disclosures that were made to the other party or parties in connection with the negotiation of the applicable agreement, which disclosures are not necessarily reflected in the agreement, (iii) may apply standards of materiality in a way that is different from what may be viewed as material to you or other investors and (iv) were made only as of the date of the applicable agreement or such other date or dates as may be specified in the agreement and are subject to more recent developments. Accordingly, the representations and warranties in such agreements may not describe the actual state of affairs as of the date they were made or at any other time.
SIGNATURES
Pursuant to the requirements of Section 13 or 15(d) of the Securities Exchange Act of 1934, the registrant has duly caused this report to be signed on its behalf by the undersigned, thereunto duly authorized.
Date: September 16, 2015
EMERGE ENERGY SERVICES LP | |||
By: | EMERGE ENERGY SERVICES GP LLC, its general partner | ||
By: | /s/ Rick Shearer | ||
Rick Shearer | |||
President and Chief Executive Officer | |||
(Principal Executive Officer) | |||
By: | /s/ Joseph C. Tusa, Jr. | ||
Joseph C. Tusa, Jr. | |||
Chief Financial Officer | |||
(Principal Financial Officer) | |||
Pursuant to the requirements of the Securities Exchange Act of 1934, this report has been signed below by the following persons in their indicated capacities, which are with the general partner of the registrant, on the dates indicated.
114
Signature | Title | Date | ||
/s/ Rick Shearer | Chief Executive Officer | September 16, 2015 | ||
Rick Shearer | (principal executive officer) | |||
/s/ Joseph C. Tusa, Jr. | Chief Financial Officer | September 16, 2015 | ||
Joseph C. Tusa, Jr. | (principal financial officer and principal accounting officer) | |||
/s/ Ted W. Beneski | Chairman of the Board and | September 16, 2015 | ||
Ted W. Beneski | Director | |||
/s/ Warren B. Bonham | Director | September 16, 2015 | ||
Warren B. Bonham | ||||
/s/ Kevin Clark | Director | September 16, 2015 | ||
Kevin Clark | ||||
/s/ Mark Gottfredson | Director | September 16, 2015 | ||
Mark Gottfredson | ||||
/s/ Peter Jones | Director | September 16, 2015 | ||
Peter Jones | ||||
/s/ Francis Kelly | Director | September 16, 2015 | ||
Francis Kelly | ||||
/s/ Eliot Kerlin | Director | September 16, 2015 | ||
Eliot Kerlin | ||||
/s/ Victor L. Vescovo | Director | September 16, 2015 | ||
Victor L. Vescovo | ||||
115
INDEX TO EXHIBITS
Exhibit Number | Description | |
3.1 | Certificate of Limited Partnership of Emerge Energy Services LP (incorporated by reference to Exhibit 3.1 to the Registrant’s Registration Statement on Form S-1, Registration No. 333-187487). | |
3.2 | Amendment to Certificate of Limited Partnership of Emerge Energy Services LP (incorporated by reference to Exhibit 3.2 to the Registrant’s Registration Statement on Form S-1, Registration No. 333-187487). | |
3.3 | First Amended and Restated Limited Partnership Agreement of Emerge Energy Services LP, dated as of May 14, 2013 (incorporated by reference to Exhibit 3.1 to the Registrant’s Current Report on Form 8-K, filed with the SEC on May 20, 2013). | |
3.4 | Certificate of Limited Formation of Emerge Energy Services GP LLC (incorporated by reference to Exhibit 3.5 to the Registrant’s Registration Statement on Form S-1, Registration No. 333-187487). | |
3.5 | Amendment to Certificate of Formation of Emerge Energy Services GP LLC (incorporated by reference to Exhibit 3.6 to the Registrant’s Registration Statement on Form S-1, Registration No. 333-187487). | |
3.6 | Amended and Restated Limited Liability Company Agreement of Emerge Energy Services GP, LLC, dated as of May 14, 2013 (incorporated by reference to Exhibit 3.2 to the Registrant’s Current Report on Form 8-K, filed with the SEC on May 20, 2013). | |
4.1 | Registration Rights Agreement, dated as of May 14, 2013, by and among Emerge Energy Services LP, AEC Resources LLC, Ted W. Beneski, Superior Silica Resources LLC, Kayne Anderson Development Company and LBC Sub V, LLC (incorporated by reference to Exhibit 10.5 to the Registrant's Current Report on Form 8-K, filed with the SEC on May 20, 2013). | |
10.1 | Amended and Restated Revolving Credit and Security Agreement, dated as of June 27, 2014, among Emerge Energy Services LP, as parent guarantor, the Borrowers party thereto, PNC Bank, National Association, as administrative agent and collateral agent, and the Lenders party thereto (incorporated by reference to Exhibit 10.1 to the Registrant’s Current Report on Form 8-K, filed with the SEC on June 30, 2014). | |
10.2 | Administrative Services Agreement, dated as of May 14, 2013, by and among Emerge Energy Services LP, Emerge Energy Services GP LLC and Insight Equity Management Company LLC (incorporated by reference to Exhibit 10.6 to the Registrant's Current Report on Form 8-K, filed with the SEC on May 20, 2013). | |
10.3# | Emerge Energy Services LP 2013 Long-Term Incentive Plan (incorporated by reference to Exhibit 10.3 to the Registrant's Current Report on Form 8-K, filed with the SEC on May 20, 2013). | |
10.4# | Emerge Energy Services LP Director Compensation Program (incorporated by reference to Exhibit 10.4 to the Registrant's Annual Report on Form 10-K, filed with the SEC on March 2, 2015). | |
10.5# | Form of Emerge Energy Services LP 2013 Long-Term Incentive Plan Phantom Unit Agreement (Performance-Vesting Agreement) (incorporated by reference to Exhibit 10.7 to the Registrant's Current Report on Form 8-K, filed with the SEC on May 20, 2013). | |
10.6# | Form of Emerge Energy Services LP 2013 Long-Term Incentive Plan Phantom Unit Agreement (Time-Vesting Agreement) (incorporated by reference to Exhibit 10.8 to the Registrant's Current Report on Form 8-K, filed with the SEC on May 20, 2013). | |
10.7# | Amended Employment Letter, dated May 29, 2013, between Emerge Energy Services GP LLC and Rick Shearer (incorporated by reference to Exhibit 10.3 to the Registrant's Current Report on Form 8-K, filed with the SEC on June 4, 2013). | |
10.8# | Letter Agreement, dated May 29, 2013, between Emerge Energy Services GP LLC and Rick Shearer (incorporated by reference to Exhibit 10.1 to the Registrant's Current Report on Form 8-K, filed with the SEC on June 4, 2013). | |
10.9# | Letter Agreement, dated May 29, 2013, between Emerge Energy Services GP LLC and Jim Walker (incorporated by reference to Exhibit 10.2 to the Registrant's Current Report on Form 8-K, filed with the SEC on June 4, 2013). | |
10.10# | Employment Letter, dated October 25, 2012, between Emerge Energy Services LP and Robert Lane (incorporated by reference to Exhibit 10.4 to the Registrant's Registration Statement on Form S-1, Registration No. 333-187487). | |
116
Exhibit Number | Description | |
10.11# | Amendment to Employment Letter, dated May 29, 2013, between Emerge Energy Services GP LLC and Robert Lane (incorporated by reference to Exhibit 10.4 to the Registrant's Current Report on Form 8-K, filed with the SEC on June 4, 2013). | |
10.12# | Second Amendment to Employment Letter, dated August 5, 2014, between Emerge Energy Services GP LLC and Robert Lane (incorporated by reference to Exhibit 10.1 to the Registrant’s Current Report on Form 8-K, filed with the SEC on August 11, 2014). | |
10.13# | Employment Letter, dated May 29, 2013, between Emerge Energy Services GP LLC and Dick DeShazo (incorporated by reference to Exhibit 10.5 to the Registrant's Current Report on Form 8-K, filed with the SEC on June 4, 2013). | |
10.14 † | Sand Supply Agreement, dated as of May 31, 2011, between Superior Silica Sands LLC and Schlumberger Technology Corporation (incorporated by reference to Exhibit 10.5 to the Registrant's Registration Statement on Form S-1, Registration No. 333-187487). | |
10.15 † | Sand Supply Agreement, dated as of March 31, 2011, between Superior Silica Sands LLC and Schlumberger Technology Corporation (incorporated by reference to Exhibit 10.6 to the Registrant's Registration Statement on Form S-1, Registration No. 333-187487). | |
10.16 † | Amendment to Sand Supply Agreement, dated as of November 15, 2012 between Superior Silica Sands LLC and Schlumberger Technology Corporation (incorporated by reference to Exhibit 10.11 to the Registrant's Registration Statement on Form S-1, Registration No. 333-187487). | |
10.17 † | Second Amendment to Sand Supply Agreement, dated as of June 10, 2014, between Superior Silica Sands LLC and Schlumberger Technology Corporation (incorporated by reference to Exhibit 10.1 to the Registrant's Quarterly Report on Form 10-Q, filed with the SEC on November 7, 2014). | |
10.18 † | Memorandum of Understanding, dated May 9, 2012, between Canadian National Railway Company and Superior Silica Sands LLC (incorporated by reference to Exhibit 10.9 to the Registrant's Registration Statement on Form S-1, Registration No. 333-187487). | |
10.19 † | Wet Sand Services Agreement, dated April 7, 2011, by and between Superior Silica Sands LLC and Fred Weber, Inc. (incorporated by reference to Exhibit 10.10 to the Registrant's Registration Statement on Form S-1, Registration No. 333-187487). | |
10.20 | Contribution, Conveyance and Assumption Agreement, dated as of May 14, 2013, by and among Emerge Energy Services GP LLC, Emerge Energy Services LP, Emerge Energy Services Operating LLC, Emerge Energy Services Holdings LLC, and the other parties thereto (incorporated by reference to Exhibit 10.1 to the Registrant's Current Report on Form 8-K, filed with the SEC on May 20, 2013). | |
21.1 | List of Subsidiaries of Emerge Energy Services LP (incorporated by reference to Exhibit 21.1 to the Registrant's Annual Report on Form 10-K, filed with the SEC on March 2, 2015). | |
23.1* | Consent of BDO USA, LLP. | |
23.2* | Consent of Cooper Engineering Company, Inc. | |
23.3* | Consent of Westward Environmental, Inc. | |
31.1* | Certification of Chief Executive Officer under Section 302 of the Sarbanes-Oxley Act of 2002. | |
31.2* | Certification of Chief Financial Officer under Section 302 of the Sarbanes-Oxley Act of 2002. | |
32.1* | Certification of Chief Executive Officer under Section 906 of the Sarbanes-Oxley Act of 2002. | |
32.2* | Certification of Chief Financial Officer under Section 906 of the Sarbanes-Oxley Act of 2002. | |
95.1 | Mine Safety Disclosure Exhibit (incorporated by reference to Exhibit 95.1 to the Registrant's Annual Report on Form 10-K, filed with the SEC on March 2, 2015). | |
101 | Interactive Data Files - XBRL (incorporated by reference to Exhibit 101 to the Registrant's Annual Report on Form 10-K, filed with the SEC on March 2, 2015) | |
* Filed herewith (or furnished in the case of Exhibits 32.1 and 32.2).
# Compensatory plan or arrangement.
† | Certain portions have been omitted pursuant to a confidential treatment request. Omitted information has been separately filed with the Securities and Exchange Commission. |
117
118