Attached files
| file | filename |
|---|---|
| 8-K - 8-K - ACCURAY INC | a15-19666_28k.htm |
Exhibit 99.1
|
|
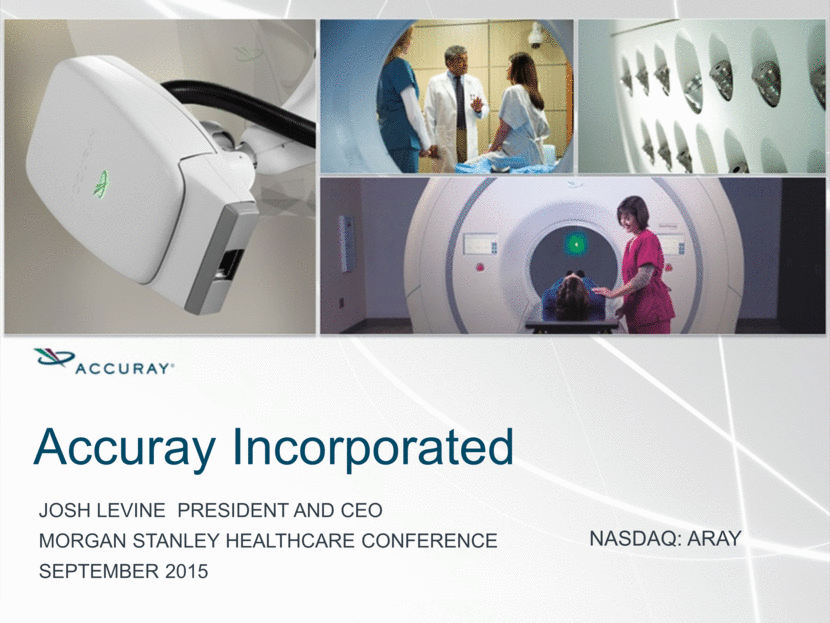
Accuray Incorporated Josh levine president and ceo Morgan Stanley Healthcare Conference september 2015 NASDAQ: ARAY |
|
|
Safe Harbor Statement Forward Looking Statements Safe Harbor Statement Statements in this presentation (including the oral commentary that accompanies it) that are not statements of historical fact are forward-looking statements and are subject to the "safe harbor” provisions of the Private Securities Litigation Reform Act of 1995. Forward-looking statements in this presentation relate, but are not limited to the size and growth of the global market for radiation therapy systems, market position of our products, product roadmap, and our business opportunities and focus, including strategies for commercial execution, product positioning, customer accounts and emerging markets, and our expected financial results for the first quarter and full fiscal year 2016. Forward-looking statements are subject to risks and uncertainties that could cause actual results to differ materially from expectations, including but not limited to: the extent of market acceptance for the company’s products and services; the company’s ability to convert backlog to revenue; the success of its worldwide sales and marketing efforts; the ability to control operating expenses; continuing uncertainty in the global economic environment; potential differences between the Company’s preliminary financial analysis and the final results for the applicable period as a result of the completion of internal reporting process and review, and other risks detailed under the heading "Risk Factors" in the company’s report on Form 10-K for fiscal 2015, filed on August 28, 2015 and as updated from time to time in our other filings with the Securities and Exchange Commission. Forward-looking statements speak only as of the date the statements are made and are based on information available to the company at the time those statements are made and/or management’s good faith belief as of that time with respect to future events. The company assumes no obligation to update forward-looking statements to reflect actual performance or results, changes in assumptions or changes in other factors affecting forward-looking information, except to the extent required by applicable securities laws. Accordingly, investors should not put undue reliance on any forward-looking statements. This presentation also contains non-GAAP financial information. Management believes that this non-GAAP financial measure provides useful supplemental information to management and investors regarding the performance of the company and facilitates a more meaningful comparison of results for current periods with previous operating results. Additionally, it will assist management in analyzing future trends, making strategic and business decisions and establishing internal budgets and forecasts. A reconciliation is available in the Appendix. |
|
|
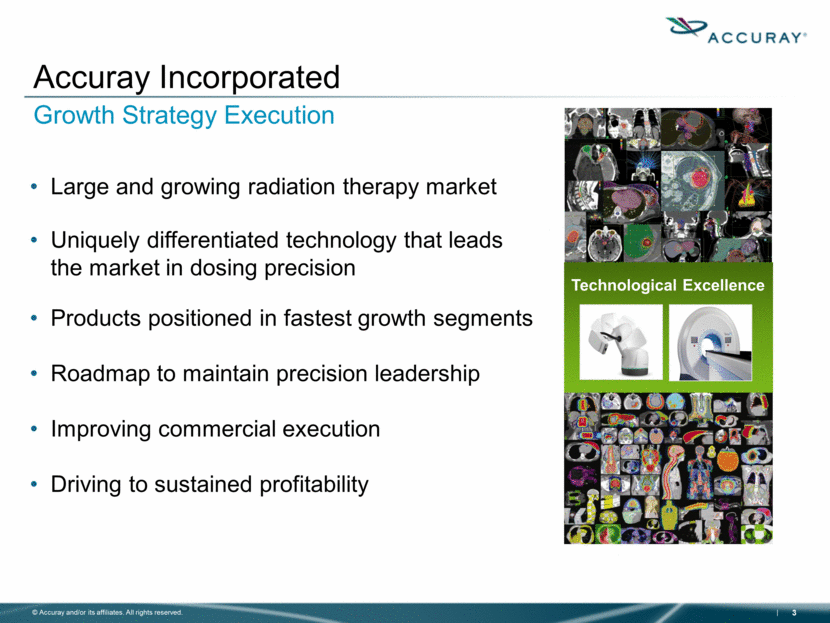
Growth Strategy Execution Large and growing radiation therapy market Uniquely differentiated technology that leads the market in dosing precision Products positioned in fastest growth segments Roadmap to maintain precision leadership Improving commercial execution Driving to sustained profitability Accuray Incorporated Technological Excellence |
|
|
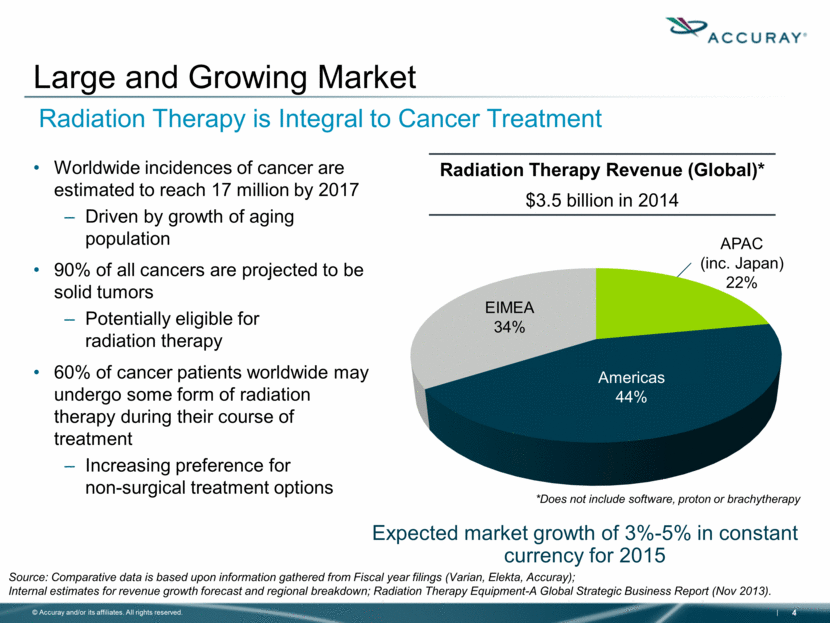
Worldwide incidences of cancer are estimated to reach 17 million by 2017 Driven by growth of aging population 90% of all cancers are projected to be solid tumors Potentially eligible for radiation therapy 60% of cancer patients worldwide may undergo some form of radiation therapy during their course of treatment Increasing preference for non-surgical treatment options Large and Growing Market Radiation Therapy Revenue (Global)* $3.5 billion in 2014 Source: Comparative data is based upon information gathered from Fiscal year filings (Varian, Elekta, Accuray); Internal estimates for revenue growth forecast and regional breakdown; Radiation Therapy Equipment-A Global Strategic Business Report (Nov 2013). Expected market growth of 3%-5% in constant currency for 2015 Americas 44% EIMEA 34% APAC (inc. Japan) 22% *Does not include software, proton or brachytherapy Radiation Therapy is Integral to Cancer Treatment |
|
|
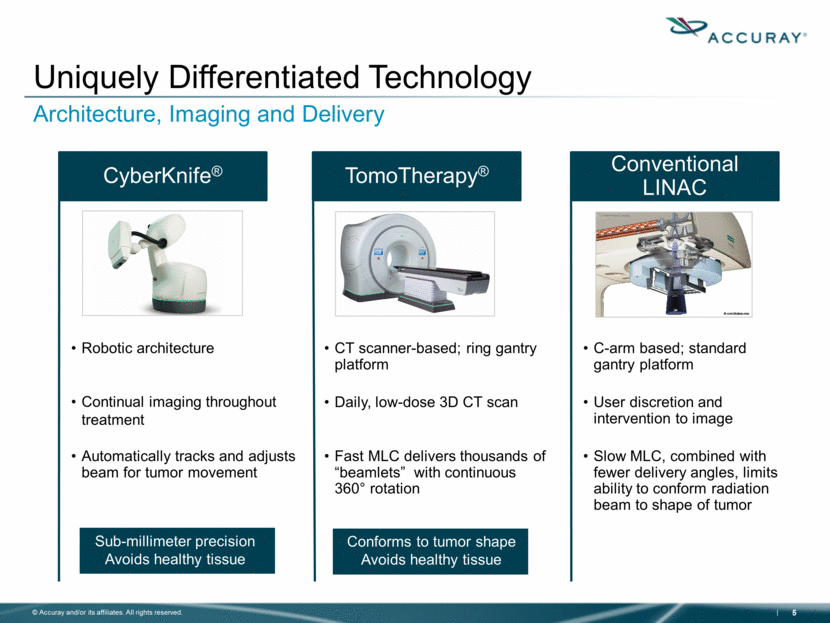
Uniquely Differentiated Technology Architecture, Imaging and Delivery Robotic architecture Continual imaging throughout treatment Automatically tracks and adjusts beam for tumor movement CyberKnife® CT scanner-based; ring gantry platform Daily, low-dose 3D CT scan Fast MLC delivers thousands of “beamlets” with continuous 360° rotation TomoTherapy® C-arm based; standard gantry platform User discretion and intervention to image Slow MLC, combined with fewer delivery angles, limits ability to conform radiation beam to shape of tumor Conventional LINAC Sub-millimeter precision Avoids healthy tissue Conforms to tumor shape Avoids healthy tissue |
|
|
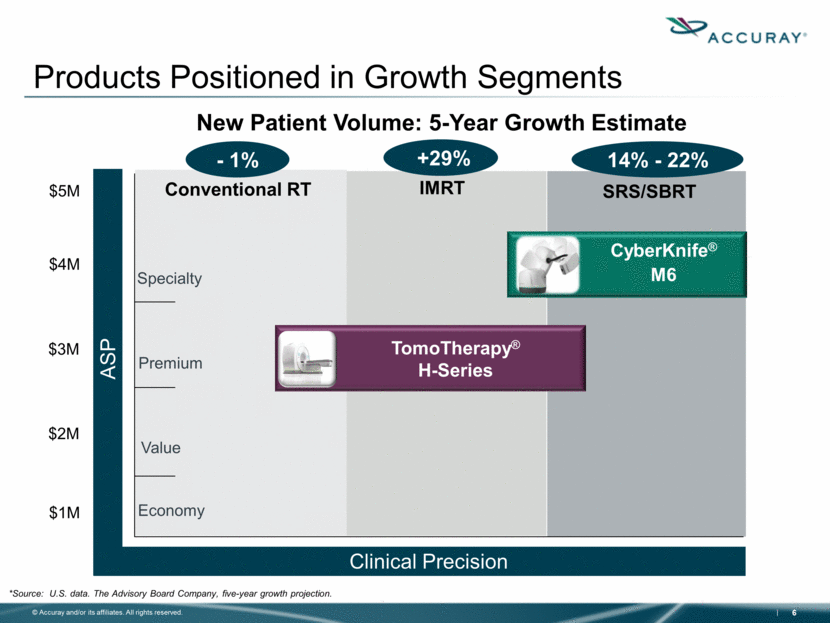
Specialty Economy Premium Value SRS/SBRT IMRT Conventional RT $1M $2M $3M $4M $5M Clinical Precision ASP CyberKnife® VSI Products Positioned in Growth Segments *Source: U.S. data. The Advisory Board Company, five-year growth projection. New Patient Volume: 5-Year Growth Estimate TomoTherapy® Hi-Art CyberKnife® M6 TomoTherapy® H-Series - 1% +29% 14% - 22% |
|
|
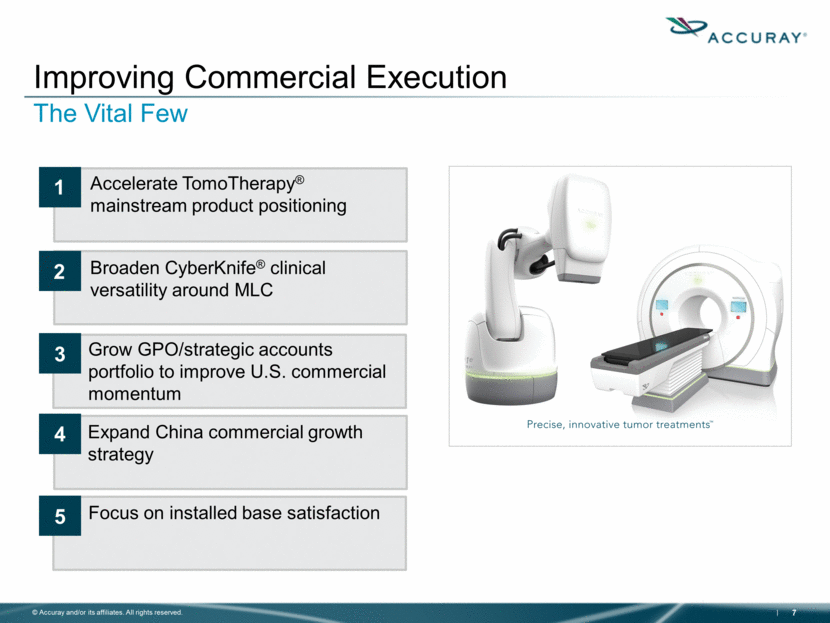
Improving Commercial Execution The Vital Few Focus on installed base satisfaction Accelerate TomoTherapy® mainstream product positioning Broaden CyberKnife® clinical versatility around MLC Expand China commercial growth strategy 1 2 3 5 4 Grow GPO/strategic accounts portfolio to improve U.S. commercial momentum |
|
|
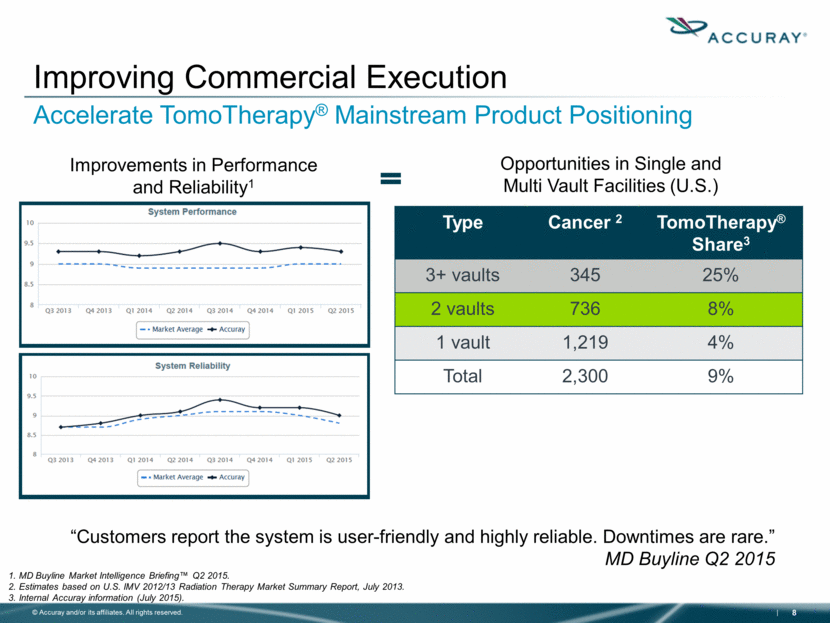
Improving Commercial Execution Accelerate TomoTherapy® Mainstream Product Positioning 1. MD Buyline Market Intelligence Briefing™ Q2 2015. 2. Estimates based on U.S. IMV 2012/13 Radiation Therapy Market Summary Report, July 2013. 3. Internal Accuray information (July 2015). Improvements in Performance and Reliability1 Opportunities in Single and Multi Vault Facilities (U.S.) Type Cancer 2 TomoTherapy® Share3 3+ vaults 345 25% 2 vaults 736 8% 1 vault 1,219 4% Total 2,300 9% “Customers report the system is user-friendly and highly reliable. Downtimes are rare.” MD Buyline Q2 2015 |
|
|
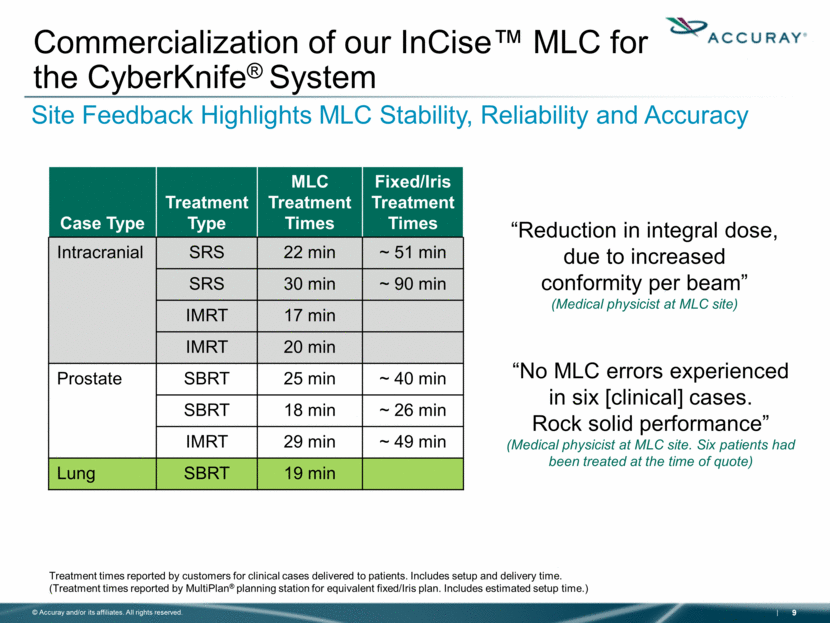
Commercialization of our InCise™ MLC for the CyberKnife® System Site Feedback Highlights MLC Stability, Reliability and Accuracy Treatment times reported by customers for clinical cases delivered to patients. Includes setup and delivery time. (Treatment times reported by MultiPlan® planning station for equivalent fixed/Iris plan. Includes estimated setup time.) Case Type Treatment Type MLC Treatment Times Fixed/Iris Treatment Times Intracranial SRS 22 min ~ 51 min SRS 30 min ~ 90 min IMRT 17 min IMRT 20 min Prostate SBRT 25 min ~ 40 min SBRT 18 min ~ 26 min IMRT 29 min ~ 49 min Lung SBRT 19 min “Reduction in integral dose, due to increased conformity per beam” (Medical physicist at MLC site) “No MLC errors experienced in six [clinical] cases. Rock solid performance” (Medical physicist at MLC site. Six patients had been treated at the time of quote) |
|
|
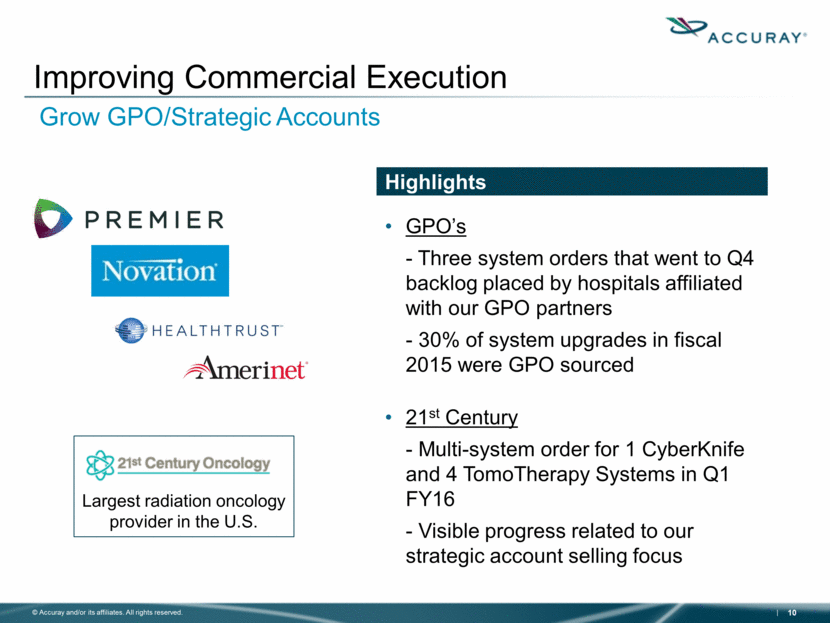
Improving Commercial Execution Grow GPO/Strategic Accounts GPO’s - Three system orders that went to Q4 backlog placed by hospitals affiliated with our GPO partners - 30% of system upgrades in fiscal 2015 were GPO sourced 21st Century - Multi-system order for 1 CyberKnife and 4 TomoTherapy Systems in Q1 FY16 - Visible progress related to our strategic account selling focus Highlights Largest radiation oncology provider in the U.S. |
|
|
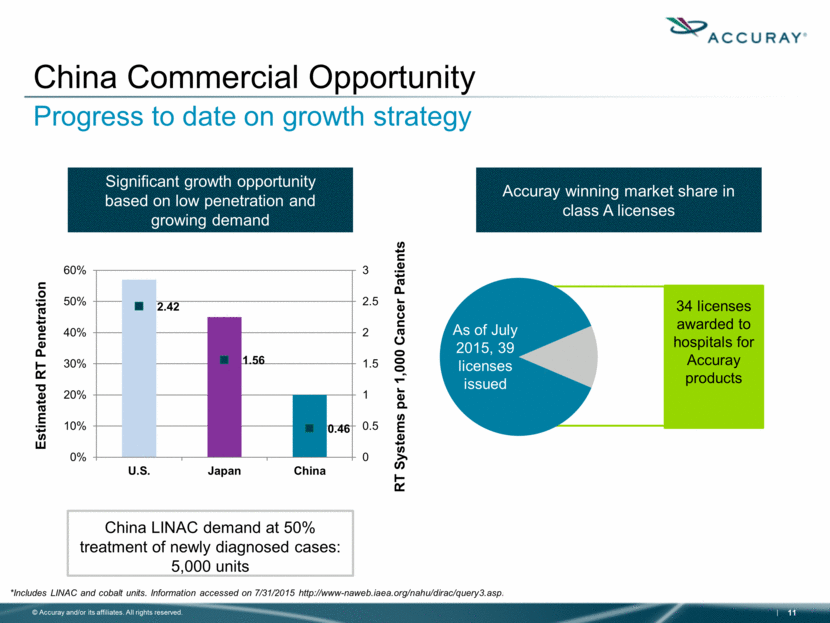
China Commercial Opportunity Progress to date on growth strategy Significant growth opportunity based on low penetration and growing demand Accuray winning market share in class A licenses RT Systems per 1,000 Cancer Patients Estimated RT Penetration 34 licenses awarded to hospitals for Accuray products China LINAC demand at 50% treatment of newly diagnosed cases: 5,000 units *Includes LINAC and cobalt units. Information accessed on 7/31/2015 http://www-naweb.iaea.org/nahu/dirac/query3.asp. As of July 2015, 39 licenses issued 2.42 1.56 0.46 0 0.5 1 1.5 2 2.5 3 0% 10% 20% 30% 40% 50% 60% U.S. Japan China |
|
|
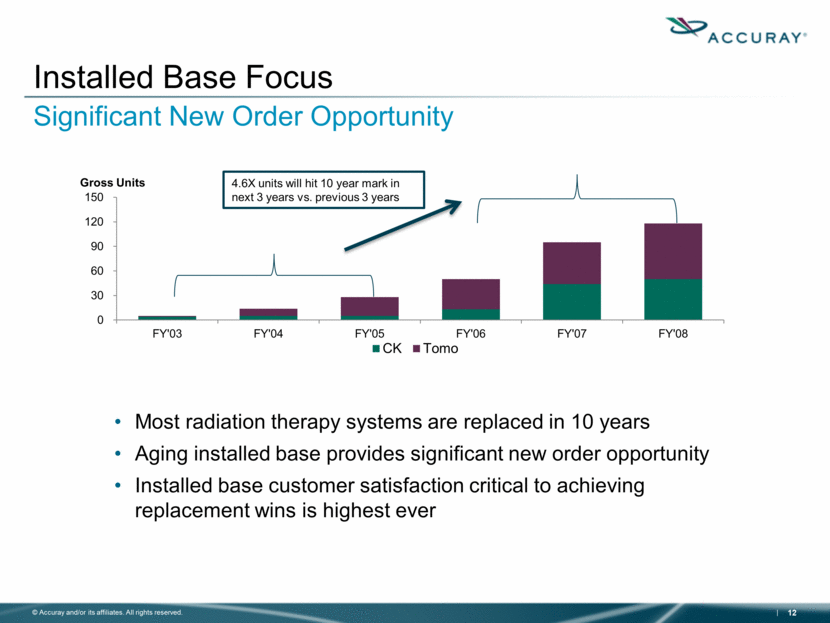
Installed Base Focus Significant New Order Opportunity 4.6X units will hit 10 year mark in next 3 years vs. previous 3 years Most radiation therapy systems are replaced in 10 years Aging installed base provides significant new order opportunity Installed base customer satisfaction critical to achieving replacement wins is highest ever 0 30 60 90 120 150 FY'03 FY'04 FY'05 FY'06 FY'07 FY'08 CK Tomo Gross Units |
|
|
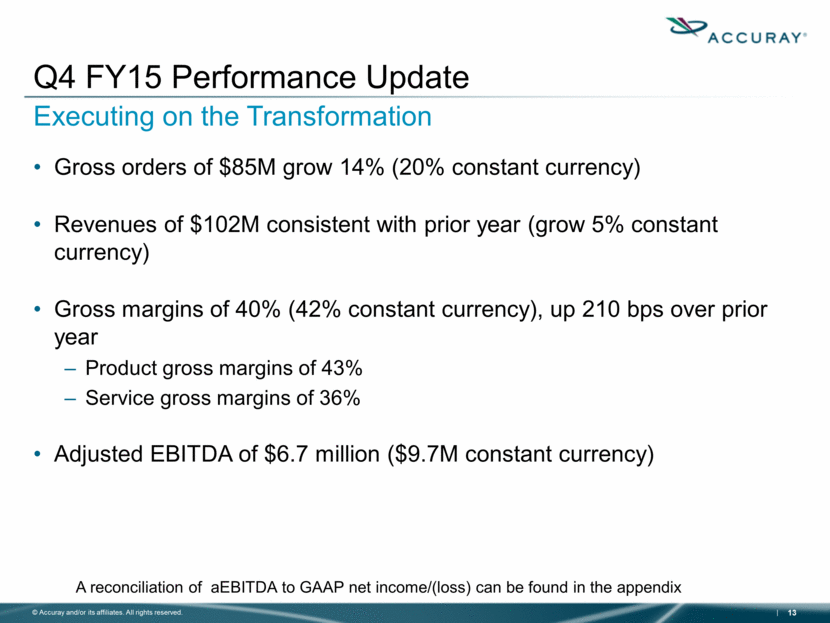
Gross orders of $85M grow 14% (20% constant currency) Revenues of $102M consistent with prior year (grow 5% constant currency) Gross margins of 40% (42% constant currency), up 210 bps over prior year Product gross margins of 43% Service gross margins of 36% Adjusted EBITDA of $6.7 million ($9.7M constant currency) Q4 FY15 Performance Update Executing on the Transformation A reconciliation of aEBITDA to GAAP net income/(loss) can be found in the appendix |
|
|
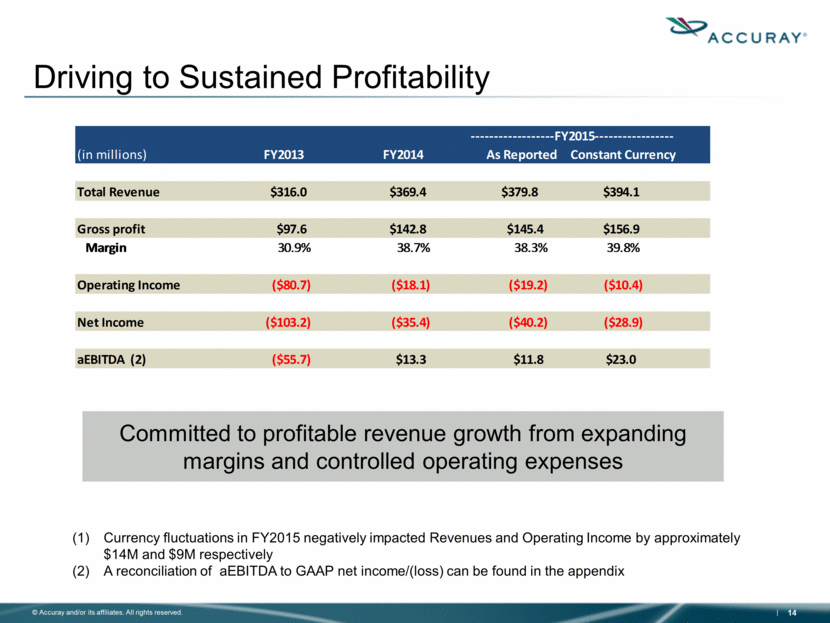
Driving to Sustained Profitability Committed to profitable revenue growth from expanding margins and controlled operating expenses Currency fluctuations in FY2015 negatively impacted Revenues and Operating Income by approximately $14M and $9M respectively A reconciliation of aEBITDA to GAAP net income/(loss) can be found in the appendix ------------------FY2015----------------- (in millions) FY2013 FY2014 As Reported Constant Currency Total Revenue $316.0 $369.4 $379.8 $394.1 Gross profit $97.6 $142.8 $145.4 $156.9 Margin 30.9% 38.7% 38.3% 39.8% Operating Income ($80.7) ($18.1) ($19.2) ($10.4) Net Income ($103.2) ($35.4) ($40.2) ($28.9) aEBITDA (2) ($55.7) $13.3 $11.8 $23.0 |
|
|
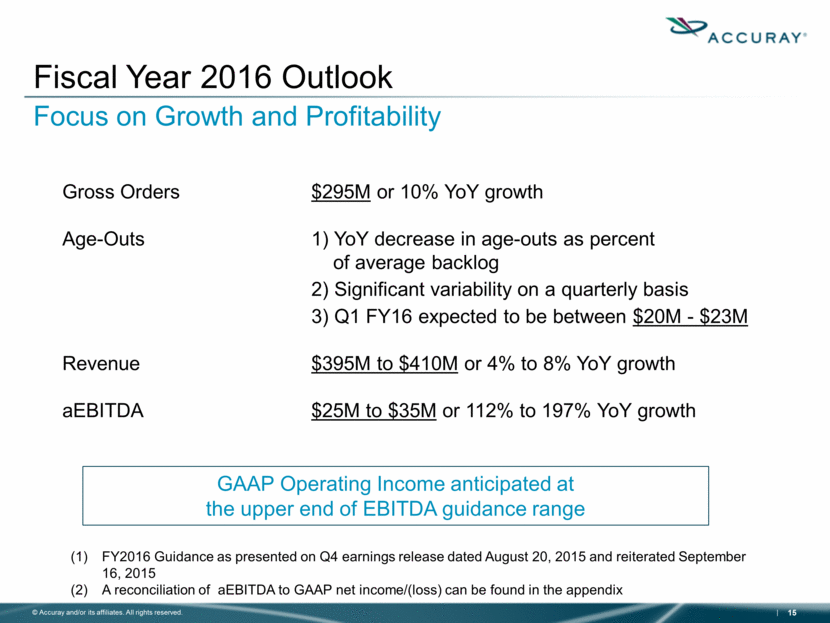
Fiscal Year 2016 Outlook Focus on Growth and Profitability Gross Orders $295M or 10% YoY growth Age-Outs 1) YoY decrease in age-outs as percent of average backlog 2) Significant variability on a quarterly basis 3) Q1 FY16 expected to be between $20M - $23M Revenue $395M to $410M or 4% to 8% YoY growth aEBITDA $25M to $35M or 112% to 197% YoY growth FY2016 Guidance as presented on Q4 earnings release dated August 20, 2015 and reiterated September 16, 2015 A reconciliation of aEBITDA to GAAP net income/(loss) can be found in the appendix GAAP Operating Income anticipated at the upper end of EBITDA guidance range |
|
|
[LOGO] |
|
|
Appendix |
|
|
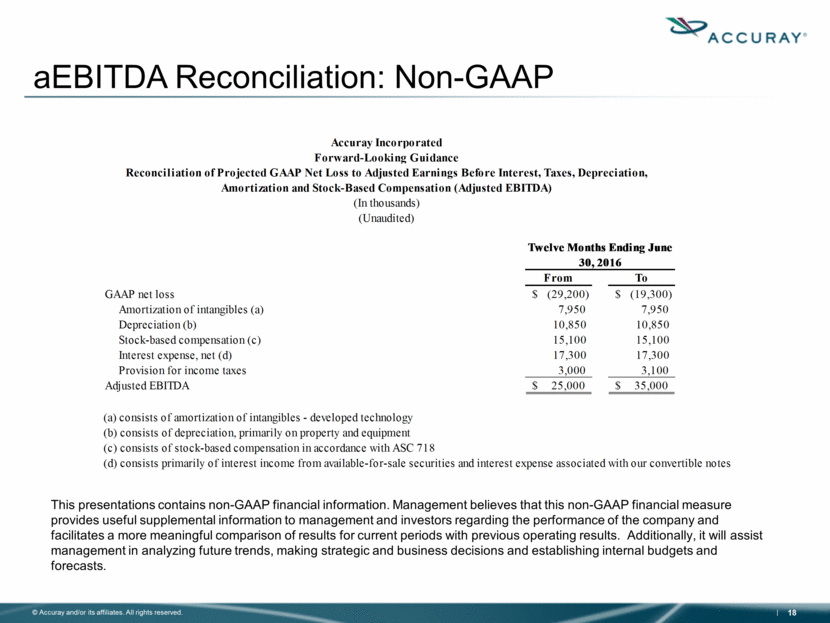
aEBITDA Reconciliation: Non-GAAP This presentations contains non-GAAP financial information. Management believes that this non-GAAP financial measure provides useful supplemental information to management and investors regarding the performance of the company and facilitates a more meaningful comparison of results for current periods with previous operating results. Additionally, it will assist management in analyzing future trends, making strategic and business decisions and establishing internal budgets and forecasts. Accuray Incorporated Forward-Looking Guidance Reconciliation of Projected GAAP Net Loss to Adjusted Earnings Before Interest, Taxes, Depreciation, Amortization and Stock-Based Compensation (Adjusted EBITDA) (In thousands) (Unaudited) Twelve Months Ending June 30, 2016 From To GAAP net loss $ (29,200) $ (19,300) Amortization of intangibles (a) 7,950 7,950 Depreciation (b) 10,850 10,850 Stock-based compensation (c) 15,100 15,100 Interest expense, net (d) 17,300 17,300 Provision for income taxes 3,000 3,100 Adjusted EBITDA $ 25,000 $ 35,000 (a) consists of amortization of intangibles - developed technology (b) consists of depreciation, primarily on property and equipment (c) consists of stock-based compensation in accordance with ASC 718 (d) consists primarily of interest income from available-for-sale securities and interest expense associated with our convertible notes |
|
|
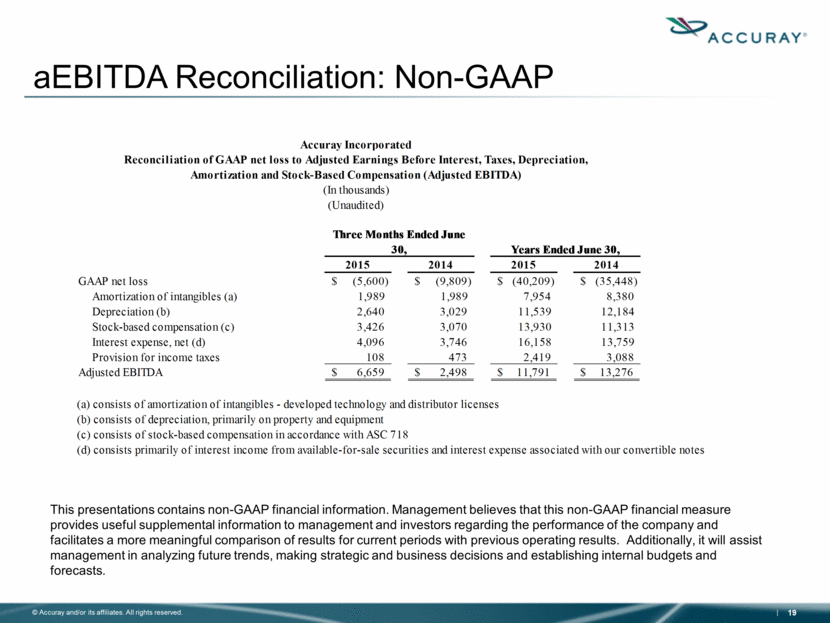
aEBITDA Reconciliation: Non-GAAP This presentations contains non-GAAP financial information. Management believes that this non-GAAP financial measure provides useful supplemental information to management and investors regarding the performance of the company and facilitates a more meaningful comparison of results for current periods with previous operating results. Additionally, it will assist management in analyzing future trends, making strategic and business decisions and establishing internal budgets and forecasts. Accuray Incorporated Reconciliation of GAAP net loss to Adjusted Earnings Before Interest, Taxes, Depreciation, Amortization and Stock-Based Compensation (Adjusted EBITDA) (In thousands) (Unaudited) Three Months Ended June 30, Years Ended June 30, 2015 2014 2015 2014 GAAP net loss $ (5,600) $ (9,809) $ (40,209) $ (35,448) Amortization of intangibles (a) 1,989 1,989 7,954 8,380 Depreciation (b) 2,640 3,029 11,539 12,184 Stock-based compensation (c) 3,426 3,070 13,930 11,313 Interest expense, net (d) 4,096 3,746 16,158 13,759 Provision for income taxes 108 473 2,419 3,088 Adjusted EBITDA $ 6,659 $ 2,498 $ 11,791 $ 13,276 (a) consists of amortization of intangibles - developed technology and distributor licenses (b) consists of depreciation, primarily on property and equipment (c) consists of stock-based compensation in accordance with ASC 718 (d) consists primarily of interest income from available-for-sale securities and interest expense associated with our convertible notes |

