Attached files
| file | filename |
|---|---|
| 8-K - FORM 8-K - NORTHWEST NATURAL GAS CO | a8-kirmaterialssept2015.htm |

Investor Presentation — September 2015

Forward-Looking Statements This and other presentations made by NW Natural from time to time, may contain forward-looking statements within the meaning of the U.S. Private Securities Litigation Reform Act of 1995. Forward-looking statements can be identified by words such as “anticipates,” “intends,” “plans,” “seeks,” “believes,” “estimates,” “expects” and similar references to future periods. Examples of forward-looking statements include, but are not limited to, statements regarding the following: plans, objectives, goals, strategies, future events including regional third-party projects, storage and pipeline expansion investments, customer and business growth, conversion potential, business risk, regulatory recovery, business development and new business initiatives, environmental remediation recoveries, gas storage markets and business opportunities, gas storage development or costs or timing related thereto, financial positions and performance, economic recovery, capital expenditures, liquidity, gas reserves and investments and regulatory recoveries related thereto, hedge efficacy, cash flows, return on invested capital, revenues and earnings and timing thereof, margins, dividends, credit ratings, the regulatory environment, effects of regulatory disallowance, timing or effects of future regulatory proceedings or future regulatory approvals, regulatory prudence reviews, effects of regulatory mechanisms, including, but not limited to, SRRM and the Company’s infrastructure investments, effects of legislation, and other statements that are other than statements of historical facts. Forward-looking statements are based on our current expectations and assumptions regarding our business, the economy and other future conditions. Because forward-looking statements relate to the future, they are subject to inherent uncertainties, risks and changes in circumstances that are difficult to predict. Our actual results may differ materially from those contemplated by the forward-looking statements, so we caution you against relying on any of these forward-looking statements. They are neither statements of historical fact nor guarantees or assurances of future performance. Important factors that could cause actual results to differ materially from those in the forward-looking statements are discussed by reference to the factors described in Part I, Item 1A “Risk Factors,” and Part II, Item 7 and Item 7A “Management’s Discussion and Analysis of Financial Condition and Results of Operations,” and “Quantitative and Qualitative Disclosure about Market Risk” in the Company’s most recent Annual Report on Form 10-K, and in Part I, Items 2 and 3 “Management’s Discussion and Analysis of Financial Condition and Results of Operations” and “Quantitative and Qualitative Disclosures About Market Risk”, and Part II, Item 1A, “Risk Factors”, in the Company’s quarterly reports filed thereafter. All forward-looking statements made in this presentation and all subsequent forward-looking statements, whether written or oral and whether made by or on behalf of the Company, are expressly qualified by these cautionary statements. Any forward-looking statement speaks only as of the date on which such statement is made, and we undertake no obligation to publicly update any forward-looking statement, whether as a result of new information, future developments or otherwise, except as may be required by law. 2
3

4 Maintaining Strong Leadership Team Gregg S. Kantor, CEO Mr. Kantor has served as Chief Executive Officer of NW Natural since January 1, 2009. Prior to 2009, he served as President of the company, President and Chief Operating Officer and as Executive Vice President. He came to NW Natural in 1996, and held various roles before being promoted to Executive Vice President in 2007. Mr. Kantor is a director of the American Gas Association, Oregon Business Council, and Greater Portland Inc., a member of Oregon Global Warming Commission, and All Hands Raised Advisory Council. He has served as Chair of the American Gas Association among other organizations. Mr. Kantor earned a Bachelor of Arts in Geography and Environmental Studies from the University of California at Santa Barbara and a Masters of Urban Planning from the University of Oregon. David H. Anderson, President and COO Mr. Anderson has served as NW Natural’s President and Chief Operating Officer since July 2015. He previously served as Executive Vice President and Chief Operating Officer, Executive Vice President of Operations and Regulation, and as Senior Vice President and Chief Financial Officer from 2004 when he joined the company. Before joining NW Natural, Mr. Anderson was Senior Vice President and Chief Financial Officer at TXU Gas. Mr. Anderson is a director on the Portland State University (PSU) Foundation Board, as well as Chair of the Investment Committee of PSU Foundation, and is a past board member of the Northwest Gas Association. Mr. Anderson holds a BBA in Accounting from Texas Tech University and is a CPA and CGMA. Greg C. Hazelton, Senior Vice President and CFO Mr. Hazelton has served as NW Natural’s Senior Vice President and Chief Financial Officer since June 2015. Before joining NW Natural, Mr. Hazelton was Vice President of Finance, Treasurer and Controller at Hawaiian Electric Industries. Mr. Hazelton has also worked at investment banking firms on Wall Street, including Merrill Lynch, Lehman Brothers and UBS Investment Bank, where he was managing director for its Global Power and Utilities group. Mr. Hazelton holds an MBA from the University of Chicago, a bachelor’s degree from Warner Pacific College, completed post-baccalaureate accounting courses at Portland State University, and is a CPA.
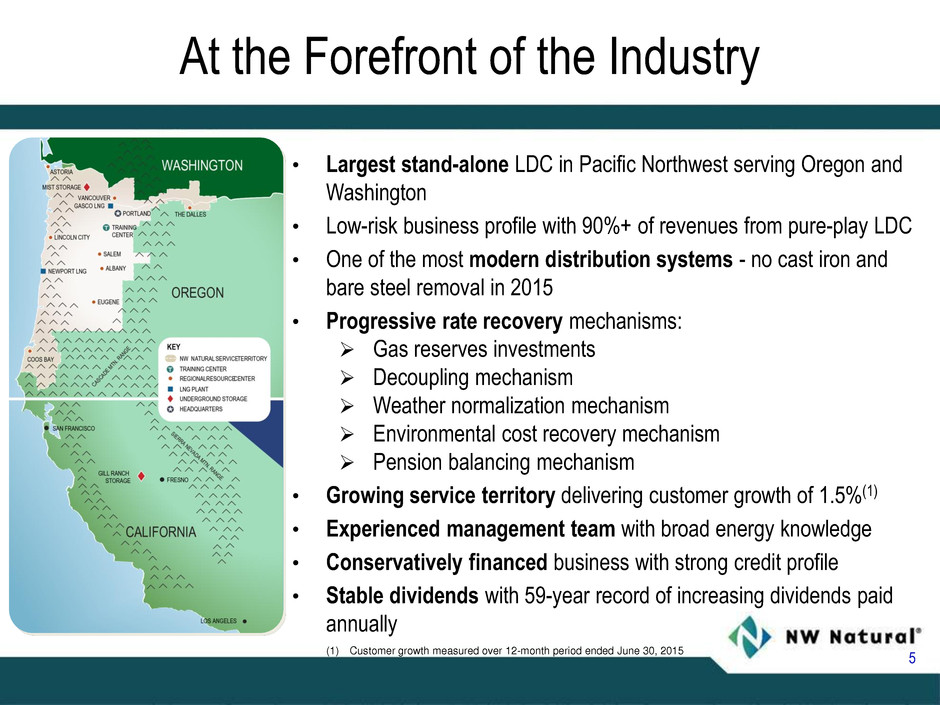
At the Forefront of the Industry • Largest stand-alone LDC in Pacific Northwest serving Oregon and Washington • Low-risk business profile with 90%+ of revenues from pure-play LDC • One of the most modern distribution systems - no cast iron and bare steel removal in 2015 • Progressive rate recovery mechanisms: Gas reserves investments Decoupling mechanism Weather normalization mechanism Environmental cost recovery mechanism Pension balancing mechanism • Growing service territory delivering customer growth of 1.5%(1) • Experienced management team with broad energy knowledge • Conservatively financed business with strong credit profile • Stable dividends with 59-year record of increasing dividends paid annually 5 (1) Customer growth measured over 12-month period ended June 30, 2015

Conservative, Low-Risk Business Strategy 6 Abundant supply of clean, affordable natural gas is creating new opportunities to grow our bottom line. — Gregg Kantor, CEO Stable utility margins through regulation Weather & decoupling mechanisms in Oregon Environmental cost tracking mechanism in Oregon Constructive relationships with regulators and customer groups Operational excellence and efficient cost structure Commitment to safety, reliability, and efficiency Continued focus on business operations footprint Long-term growth opportunities that fit NWN’s risk profile Utility: steady growth in customers and rate-base investments Mist facility: long-term contracts, asset optimization, planned expansion Gill Ranch facility: California's RPS requirement, storage value over long-term

Solid Shareholder Value 7 Market capitalization(1) $1.2B Enterprise value(1) $2.0B Total assets(1) $2.9B Total rate-base assets(2) $1.3B Years increased dividend 59 Dividend yield(1) 4.4% Total Shareholder Returns as of 12/31/2014 One year 21.6% Three year 17.5% Five year 6.1% Ten year 114.2% Solid credit ratings with good liquidity and cash flows. Increased dividends paid to shareholders every year since 1956 – one of only four companies on the NYSE or NASDAQ. (1) Metrics are as of June 30, 2015 (2) Metrics are as of December 31, 2014 $1.55 $1.60 $1.65 $1.70 $1.75 $1.80 $1.85 $1.90 2010 2011 2012 2013 2014 DIVIDENDS PAID PER SHARE (in dollars)
Utility Segment 8

Core Utility Segment 9 Pure-play LDC with over 90% of revenues, net income, and assets from utility Safe, Reliable Service • Strong safety record - modern 14,000 mile distribution and transmission system • Outstanding customer satisfaction - #1 in West, JD Power and Associates (2014) • Resource diversity - 11 Bcf regulated gas storage and 2 Bcf LNG storage Optimal Service Territory • Approximately 90% of customer base in Oregon and 10% in Washington • Territory covers over 75% of Oregon’s population • Includes Vancouver (Clark County) - the fastest growing Washington county Growth Potential • Organic opportunities - gas in approximately 60% of single-family homes • High customer growth - over 10,000 customers added in last year as of 6/30/2015 and nearing 710,000 customer mark • Positive housing fundamentals and economics in region • Supportive regulation - carbon solutions program and decoupling mechanism Operating Revenues for 2014 Assets as of 12/31/2014 Utility 97% Gas Storage 3% Other 0% Utility 91% Gas Storage 9% Other 0%

• Innovative Customer Connections Portal with customer acquisition platform and conversion plan • Rate-base investments supporting system reliability and customer growth • Utility Mist gas storage expansion due to location and need for flexible gas-fired generation • Regulated gas reserves investments securing long-term gas supply resources • Unique Carbon Solutions Program with NWN first utility in the country to attempt this kind of program Low-Risk Regulated Growth 10

High-Growth Service Territory 11 Positive Economic Signs Solid Customer Growth Rate NW Natural at 1.4% for 2014 LDCs averaged 1.2% for 2014 Strong Housing Fundamentals Home prices up 10% in Portland and 13% in Vancouver, Washington Home sales up 24% in Portland and 25% in Vancouver, Washington New construction increased almost 7% in Oregon Tight housing market Homeowner vacancy rate 1% and rental rate 3.5% in Portland and Vancouver, Washington G ross Cust om er A dd ition s N et C ustom er Gr ow th R at e 3.2% 3.4% 3.1% 2.4% 1.6% 0.8% 0.9% 0.8% 0.9% 1.3% 1.4% 1.5%* 0.0% 0.5% 1.0% 1.5% 2.0% 2.5% 3.0% 3.5% - 5,000 10,000 15,000 20,000 25,000 Conversions Construction Net Growth Percentage Customer Growth * 2015 Net Growth Percentage as of June 30, 2015

Competitive Advantage • Preferred energy source in Portland metro area • Low-cost, reliable, clean energy choice • Natural gas in approximately 60% of single-family homes Customer Connections Portal • Web-based tool for targeted conversions Launched in September 2013 Over 16,000 gas availability queries Almost 30% of conversion sales used web tool • Enhanced web services for trade allies Launched in September 2014 Over 1,000 online orders submitted Continuing Innovation • Developing new approaches targeted at rental/multi- family market Innovative Customer Acquisition Platform 12 Gas Not Currently Available Gas Available Gas Likely Available
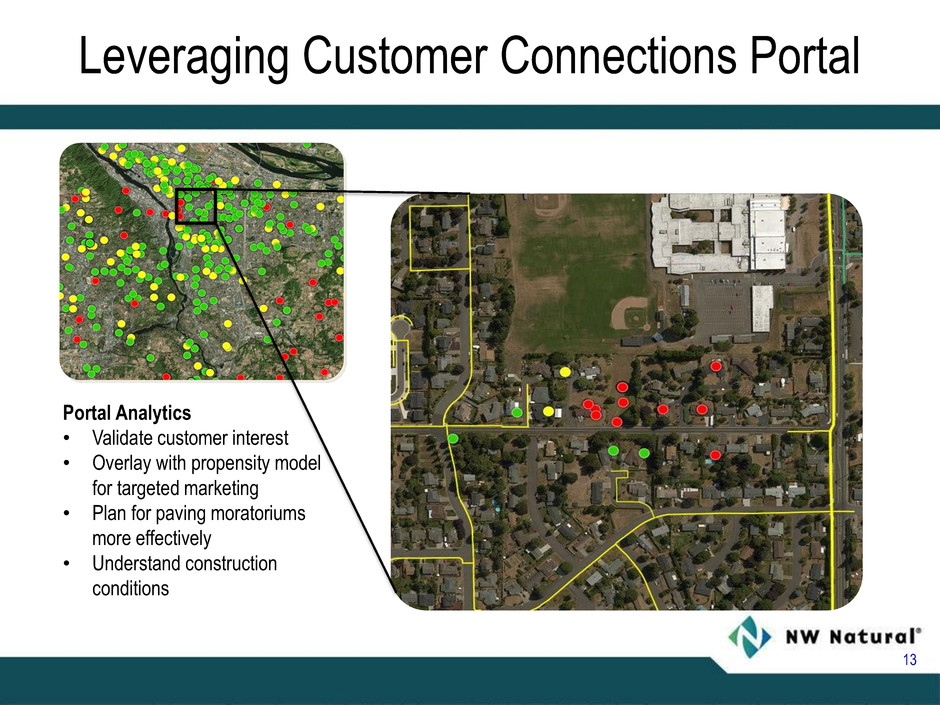
Leveraging Customer Connections Portal 13 Portal Analytics • Validate customer interest • Overlay with propensity model for targeted marketing • Plan for paving moratoriums more effectively • Understand construction conditions

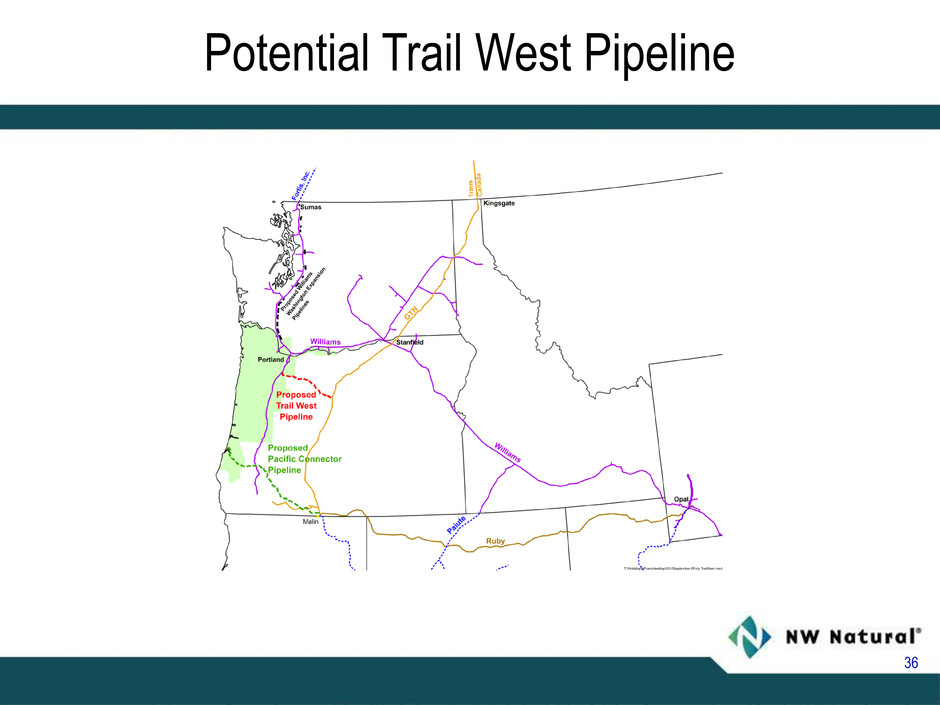
Investing for Reliability and Growth LNG Facilities Newport LNG • Facility built in 1977 with 0.9 Bcf capacity • Upgrades needed to modernize the facility • Estimated capex approximately $20-25 million over three years Portland LNG • Currently under evaluation Vancouver, Washington Infrastructure • Fastest growing region in service territory • Infrastructure needed to serve new homes and businesses • Expected investment total apprx. $25 million over five years System Integrity • New PHMSA gas safety regulation expected in 2016/2017 • Remove last three miles of known bare steel by the end of 2015 • All known cast iron was removed by 2000 Trail West – Potential Long-Term Opportunity • Large regional projects (e.g., methanol plants) could require significant increase in pipeline capacity • OPUC acknowledged in IRP a desire to keep Trail West Pipeline and Pacific Connector options open • Trail West would provide a second pipeline delivery path for reliability 14

Utility Gas Storage at Mist 15 Overview • In operation since 1989 • Interstate Storage Services (ISS) began in 2001 • Storage capacity at Mist is 16 Bcf (11 Bcf Core Utility and 5 Bcf ISS) • Recall in May 2015 of 0.7 Bcf back to utility Unique Asset • High-demand as limited storage options in Pacific NW • Part of utility’s diverse gas supply strategy for reliability • Optimize ISS portion and share with utility customers • Utility may recall ISS portion to fulfill core demand North Mist Expansion • Regulated 2.5 Bcf expansion for PGE 0.00 0.10 0.20 0.30 0.40 0.50 0.60 BCF / Day Mist Storage Deliverability Utility Utility Recall Interstate 0 3 6 9 12 15 18 BCF Mist Storage Capacity Utility Utility Recall Interstate
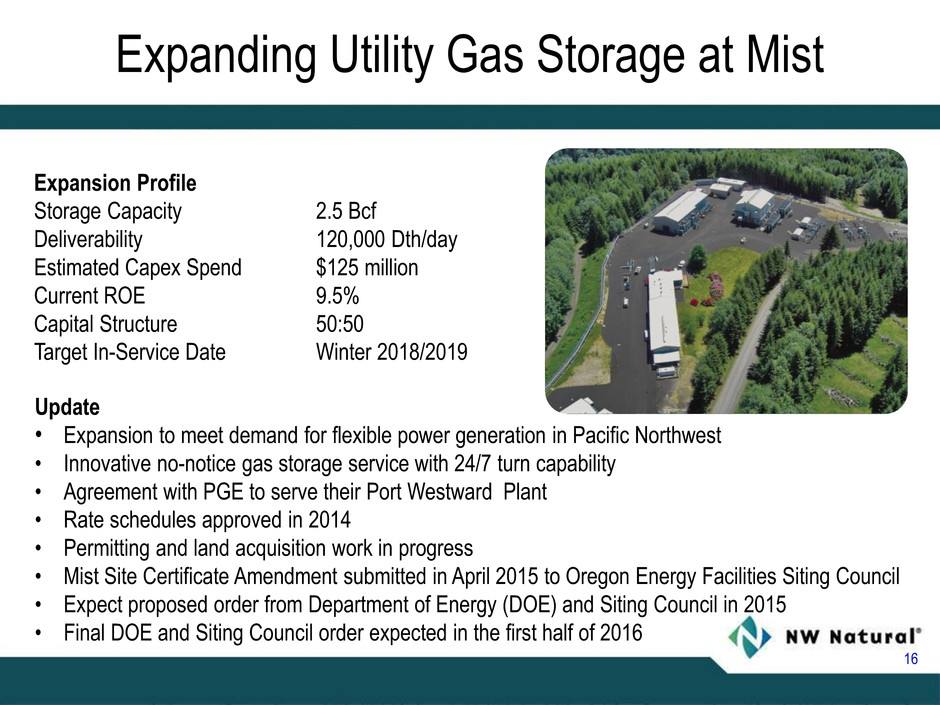
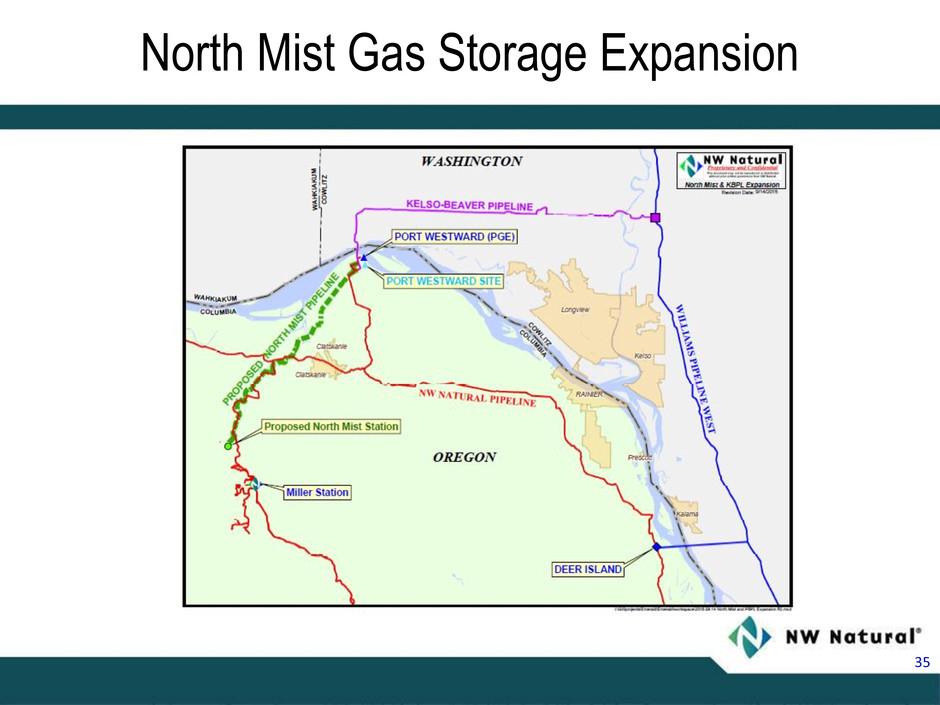
Expanding Utility Gas Storage at Mist 16 Expansion Profile Storage Capacity 2.5 Bcf Deliverability 120,000 Dth/day Estimated Capex Spend $125 million Current ROE 9.5% Capital Structure 50:50 Target In-Service Date Winter 2018/2019 Update • Expansion to meet demand for flexible power generation in Pacific Northwest • Innovative no-notice gas storage service with 24/7 turn capability • Agreement with PGE to serve their Port Westward Plant • Rate schedules approved in 2014 • Permitting and land acquisition work in progress • Mist Site Certificate Amendment submitted in April 2015 to Oregon Energy Facilities Siting Council • Expect proposed order from Department of Energy (DOE) and Siting Council in 2015 • Final DOE and Siting Council order expected in the first half of 2016

17 Investment Goals • Long-term gas price hedge for utility customers • Rate-base return on invested capital • Recovery of costs through customer rates Original Program • Deal with Encana in 2011; approved by OPUC in May 2011 • Gas costs and ROI tracked into rates with annual PGA • Encana investment totaled $178 million Amended Agreement • Field sold to Jonah Energy in 2014 • Investment on a well-by-well basis with prudence review • Jonah investment total $10 million under amendment • Total net rate-base investment $112 million as of June 30, 2015 for both deals Jonah Regulatory Update • All-party settlement filed in August 2015 on $10 million, expect decision in 2015 • Settlement proposes cost recovery at 10-year hedge rate at deal inception • New OPUC docket to review commodity hedging by Oregon utilities Regulated Gas Reserves Investments

Innovative Carbon Solutions Program 18 • Supported by state legislation and OPUC rules • Potential revenue up to 4% utility gross revenue cap • Opportunity for utility incentives • Submitted Combined Heat and Power program, expect decision by the end of 2015 • Developing oil conversion and waste-water treatment projects for potential submission in 2015

19 • Environmental Cost Recovery – OPUC order in Feb. 2015 established full recovery of costs, subject to annual prudence review and earnings test. Compliance filing open for OPUC review and approval. Secured account for insurance proceeds settled in Sept. 2015 with OPUC order. • Carbon Solutions - NWN submitted Combined Heat and Power project under SB 844 rules to OPUC in June 2015. • Prepaid Pension Assets – OPUC issued final order in August 2015 with no change to existing pension expense recovery. • Interstate Storage Sharing – OPUC issued order in March 2015 requiring a third-party cost study to be performed. • Gas Reserves – Settlement filed in Aug. 2015 regarding cost recovery of post-carry wells drilled in 2014. • Commodity Hedging - OPUC opened docket to discuss appropriate gas portfolio hedging in the state. Regulatory Update Oregon Washington Rate structures: Rate Case Year 2012 2009 ROE 9.5% 10.1% ROR 7.8% 8.4% Equity Ratio 50% 51% 2014 Rate Base $1.2B $0.1B Key mechanisms: PGA X X Incentive Sharing X WARM/Decoupling X Pension Balancing X Environ. Recovery X X(1) (1) Washington allows recovery of environmental costs. A carrying charge related to deferred amounts will be determined in a future proceeding.

Gas Storage Segment 20

• Contracted 2014-15 with short-term contracts, relatively flat price curve, & weak market conditions • 2015-16 prices are slightly higher than 2014-15 historic lows • Pursuing higher value service contracts, lower costs, and new market opportunities • Expect flexible energy resources to be needed in California to meet state’s RPS targets • Ability to expand, but will depend on California storage market conditions Interstate Storage (ISS) Portion of Mist Facility Designed Capacity 5 Bcf Max Deliverability 215,000 Dth/day In-Service Date 1989 Gill Ranch Facility Current Ownership Gill Ranch Storage, LLC (GRS) 75% and PG&E 25% Designed Capacity 20 Bcf Total (GRS portion 15 Bcf) Max Deliverability 490,000 Dth/day In-Service Date 2010 Expansion Potential 25 Bcf Total (GRS portion 7.5 Bcf) Gill Ranch Storage Trends Gas Storage Segment Outlook 21

Financial Performance 22

Consolidated Financial Results 23 YTD 2015 compared to YTD 2014 • Net income $30.7M in 2015 ($1.12/sh) vs. $39.0M in 2014 ($1.43/sh) • Adjusted net income* $39.8M ($1.45/sh) excluding $15M charge • Utility margin increase on customer growth and rate base additions • Gas storage revenue down on lower market prices for 2014/15 year • O&M increase on higher wages/benefits, offset by lower repair costs • Depreciation increase on added utility plant investments • Other reflects equity interest income on regulatory balances • Interest expense down due to debt redemptions Q2 2015 compared to Q2 2014 • Net income $2.2M in 2015 ($0.08/sh) vs. $1.1M in 2014 ($0.04/sh) • Utility margin increase on customer growth and rate base additions • Gas Storage revenue up from higher contract prices for 2015/16 year • O&M increase on higher wages/benefits, offset by lower repair costs • Depreciation increase on added utility plant investments • Other includes higher interest income on regulatory balances offset by lower other non-utility income • Interest expense down due to debt redemptions *Non-GAAP adjusted net income, EPS, and O&M excludes the after-tax regulatory disallowance related to the OPUC's Feb. 2015 environmental order. See page 26 for additional information. EPS EPS Margin $0.03 Gas Storage Op Rev $-0.05 O&M $-0.42 Deprec. $-0.02 Other Inc/Exp $0.10 Interest Exp $0.05 Adj. June 2015 $1.45* June 2014 $1.43 Actual June 2015 $1.12 $0.95 $1.05 $1.15 $1.25 $1.35 $1.45 $1.55 Env Reg Charge $-0.33* Margin $0.02 Gas Storage Op Rev $0.01 O&M $-0.01 Deprec. $-0.01 Other Inc/Exp $0.00 Interest Exp $0.03 June 2015 $0.08 June 2014 $0.04 $0.02 $0.04 $0.06 $0.08 $0.10
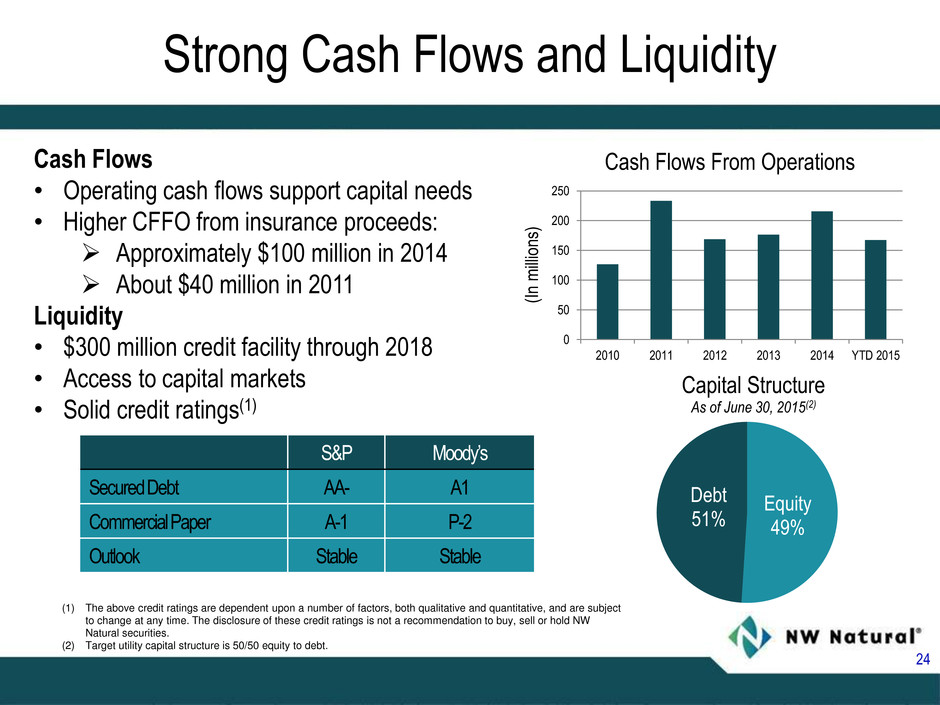
Cash Flows • Operating cash flows support capital needs • Higher CFFO from insurance proceeds: Approximately $100 million in 2014 About $40 million in 2011 Liquidity • $300 million credit facility through 2018 • Access to capital markets • Solid credit ratings(1) Strong Cash Flows and Liquidity 24 CFFO $175 M Dividend $50 M CFFO Cap-ex S&P Moody’s Secured Debt AA- A1 Commercial Paper A-1 P-2 Outlook Stable Stable (I n mi lli on s) GR Spend YTD (1) The above credit ratings are dependent upon a number of factors, both qualitative and quantitative, and are subject to change at any time. The disclosure of these credit ratings is not a recommendation to buy, sell or hold NW Natural securities. (2) Target utility capital structure is 50/50 equity to debt. 0 50 100 150 200 250 2010 2011 2012 2013 2014 YTD 2015 Cash Flows From Operations Equity 49% Debt 51% Capital Structure As of June 30, 2015(2)
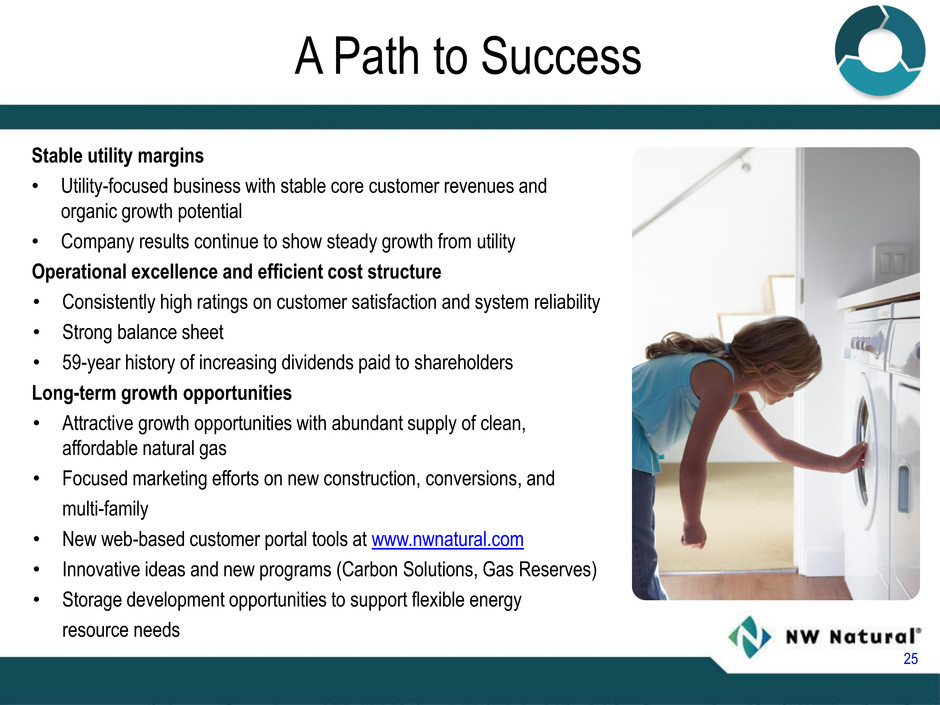
A Path to Success Stable utility margins • Utility-focused business with stable core customer revenues and organic growth potential • Company results continue to show steady growth from utility Operational excellence and efficient cost structure • Consistently high ratings on customer satisfaction and system reliability • Strong balance sheet • 59-year history of increasing dividends paid to shareholders Long-term growth opportunities • Attractive growth opportunities with abundant supply of clean, affordable natural gas • Focused marketing efforts on new construction, conversions, and • multi-family • New web-based customer portal tools at www.nwnatural.com • Innovative ideas and new programs (Carbon Solutions, Gas Reserves) • Storage development opportunities to support flexible energy • resource needs 25
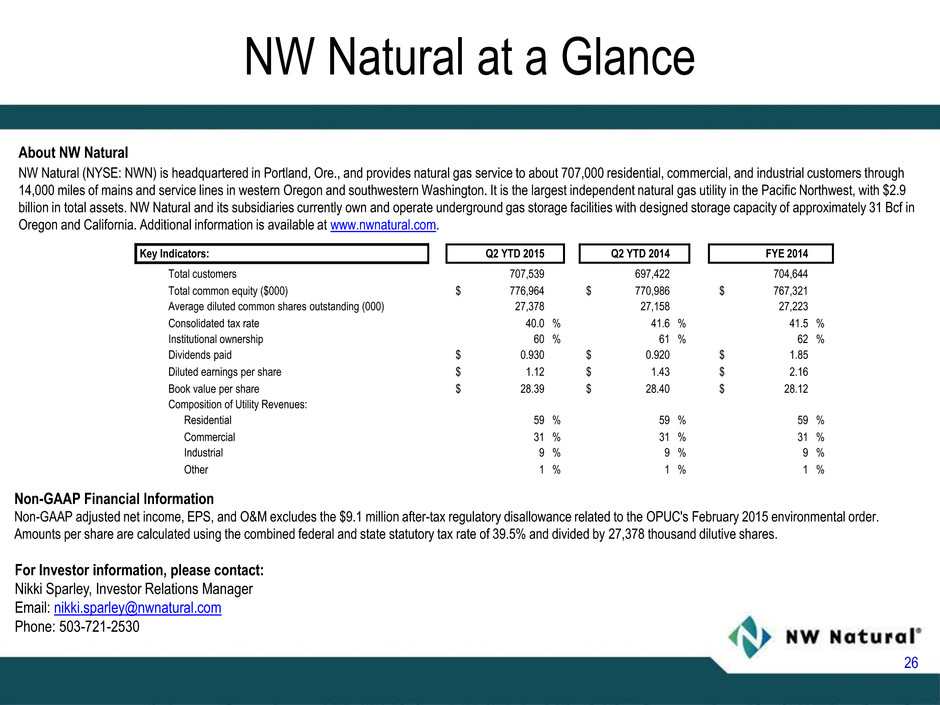
NW Natural at a Glance About NW Natural NW Natural (NYSE: NWN) is headquartered in Portland, Ore., and provides natural gas service to about 707,000 residential, commercial, and industrial customers through 14,000 miles of mains and service lines in western Oregon and southwestern Washington. It is the largest independent natural gas utility in the Pacific Northwest, with $2.9 billion in total assets. NW Natural and its subsidiaries currently own and operate underground gas storage facilities with designed storage capacity of approximately 31 Bcf in Oregon and California. Additional information is available at www.nwnatural.com. 26 For Investor information, please contact: Nikki Sparley, Investor Relations Manager Email: nikki.sparley@nwnatural.com Phone: 503-721-2530 Non-GAAP Financial Information Non-GAAP adjusted net income, EPS, and O&M excludes the $9.1 million after-tax regulatory disallowance related to the OPUC's February 2015 environmental order. Amounts per share are calculated using the combined federal and state statutory tax rate of 39.5% and divided by 27,378 thousand dilutive shares. Key Indicators: Q2 YTD 2015 Q2 YTD 2014 FYE 2014 Total customers 707,539 697,422 704,644 Total common equity ($000) $ 776,964 $ 770,986 $ 767,321 Average diluted common shares outstanding (000) 27,378 27,158 27,223 Consolidated tax rate 40.0 % 41.6 % 41.5 % Institutional ownership 60 % 61 % 62 % Dividends paid $ 0.930 $ 0.920 $ 1.85 Diluted earnings per share $ 1.12 $ 1.43 $ 2.16 Book value per share $ 28.39 $ 28.40 $ 28.12 Composition of Utility Revenues: Residential 59 % 59 % 59 % Commercial 31 % 31 % 31 % Industrial 9 % 9 % 9 % Other 1 % 1 % 1 %

Appendix 27

Dividend History $1.00 $1.10 $1.20 $1.30 $1.40 $1.50 $1.60 $1.70 $1.80 $1.90 $2.00 2005 2006 2007 2008 2009 2010 2011 2012 2013 2014 2015 Indicated • 2014 marked the 59th consecutive year of increased dividends paid to shareholders • One of the longest running dividend increase records of companies on the NYSE 28

Cap-ex Spend 29 Actuals Forecast (In millions) 2012 2013 2014 YTD June 2015 2015 Utility Capex $130 $137 $117 $56 $140 to 150 Gas Reserves $54 $54 $27 $2 $0 Utility Total $184 $191 $144 $58 $140 to 150 Gas Storage $2 $2 $3 $2 $0 to 10 Total $186 $193 $147 $60 $140 to 160 • 2015 includes spend for the IRP filed in 2014, and acknowledged by OPUC in February 2015 • 2015 also includes estimated utility N. Mist spend for permitting and land acquisition work • Five year utility cap-ex from 2015 – 2019 is estimated between $850 to $950 million

Utility Plant Investments 30 $- $500 $1,000 $1,500 $2,000 $2,500 $3,000 2005 2006 2007 2008 2009 2010 2011 2012 2013 2014 Net Utility Plant Gross Utility Plant

Rate Base Growth 31 $- $500 $1,000 $1,500 $2,000 $2,500 $3,000 2005 2006 2007 2008 2009 2010 2011 2012 2013 2014 Net Rate Base Accumulated Depreciation Deferred Tax Liability - Depreciation
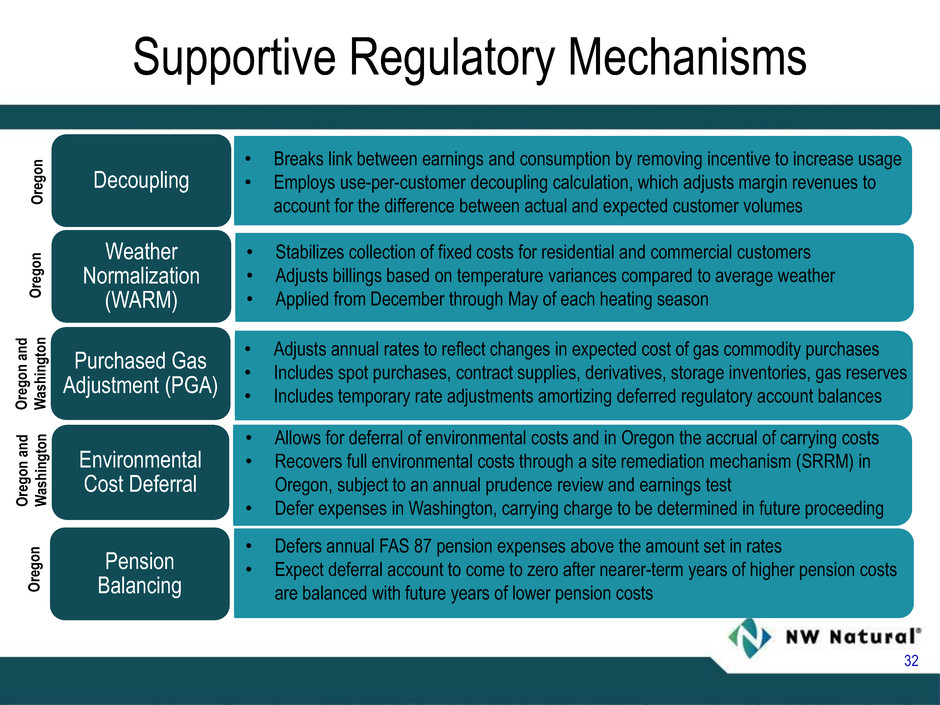
Supportive Regulatory Mechanisms 32 Decoupling Weather Normalization (WARM) Purchased Gas Adjustment (PGA) Environmental Cost Deferral Pension Balancing • Breaks link between earnings and consumption by removing incentive to increase usage • Employs use-per-customer decoupling calculation, which adjusts margin revenues to account for the difference between actual and expected customer volumes • Adjusts annual rates to reflect changes in expected cost of gas commodity purchases • Includes spot purchases, contract supplies, derivatives, storage inventories, gas reserves • Includes temporary rate adjustments amortizing deferred regulatory account balances • Stabilizes collection of fixed costs for residential and commercial customers • Adjusts billings based on temperature variances compared to average weather • Applied from December through May of each heating season • Allows for deferral of environmental costs and in Oregon the accrual of carrying costs • Recovers full environmental costs through a site remediation mechanism (SRRM) in Oregon, subject to an annual prudence review and earnings test • Defer expenses in Washington, carrying charge to be determined in future proceeding • Defers annual FAS 87 pension expenses above the amount set in rates • Expect deferral account to come to zero after nearer-term years of higher pension costs are balanced with future years of lower pension costs Or ego n a n d W as hing to n Or ego n a n d W as hing to n Or ego n Or ego n Or eg o n

Oregon and Washington Commissions Oregon Public Utility Commission (OPUC) Susan Ackerman, Chair • Originally appointed March 2010 • Reappointed March 2012 • Appointed chair June 2012 • Current term ends March 2016 John Savage, Commissioner • Originally appointed September 2003 • Reappointed three consecutive times • Current term ends March 2017 Stephen Bloom, Commissioner • Appointed December 2011 • Current term ends November 2015 Washington Utilities and Transportation Commission (WUTC) David Danner, Chair • Appointed chair February 2013 • Current term ends January 2019 Ann Rendahl, Commissioner • Appointed December 2014 • Current term ends November 2020 Philip Jones, Commissioner • Originally appointed March 2005 • Reappointed March 2011 • Current term ends February 2017 33

34 Utility Service Territory
North Mist Gas Storage Expansion 35
36 Potential Trail West Pipeline

Gill Ranch Gas Storage Facility 37
