Attached files
| file | filename |
|---|---|
| 8-K - 8-K - MACK CALI REALTY CORP | a15-19160_18k.htm |
| EX-99.2 - EX-99.2 - MACK CALI REALTY CORP | a15-19160_1ex99d2.htm |
Exhibit 99.1
|
|
Investor Day September 10, 2015 |
|
|
[LOGO] |
|
|
Disclosure Regarding Forward-looking Statements 3 Statements made in this presentation may be forward-looking statements within the meaning of Section 21E of the Securities Exchange Act of 1934, as amended. Forward-looking statements can be identified by the use of words such as “may,” “will,” “plan,” “potential,” “should,” “expect,” “anticipate,” “estimate,” “continue,” or comparable terminology. Such forward-looking statements are inherently subject to certain risks, trends and uncertainties, many of which the Company cannot predict with accuracy and some of which the Company might not even anticipate, and involve factors that may cause actual results to differ materially from those projected or suggested. Readers are cautioned not to place undue reliance on these forward-looking statements and are advised to consider the factors listed above together with the additional factors under the heading “Disclosure Regarding Forward-Looking Statements” and “Risk Factors” in the Company’s Annual Reports on Form 10-K, as may be supplemented or amended by the Company's Quarterly Reports on Form 10-Q, which are incorporated herein by reference. The Company assumes no obligation to update or supplement forward-looking statements that become untrue because of subsequent events, new information or otherwise. |
|
|
Introduction 4 On behalf of senior management and all of our 600 employees, we thank all of you who have joined us today to discuss Mack-Cali’s future. We realize that we have been the beneficiary of your confidence in our plan and we greatly appreciate your support. We have been at the process of changing Mack-Cali for the last 100 days. We do not have all the answers, but we believe we understand the problems that we face and have formulated the correct strategy to proceed on. We are a two platform company — office and multi-family with a focus on owning assets in the Waterfront area and other transit-based locations. |
|
|
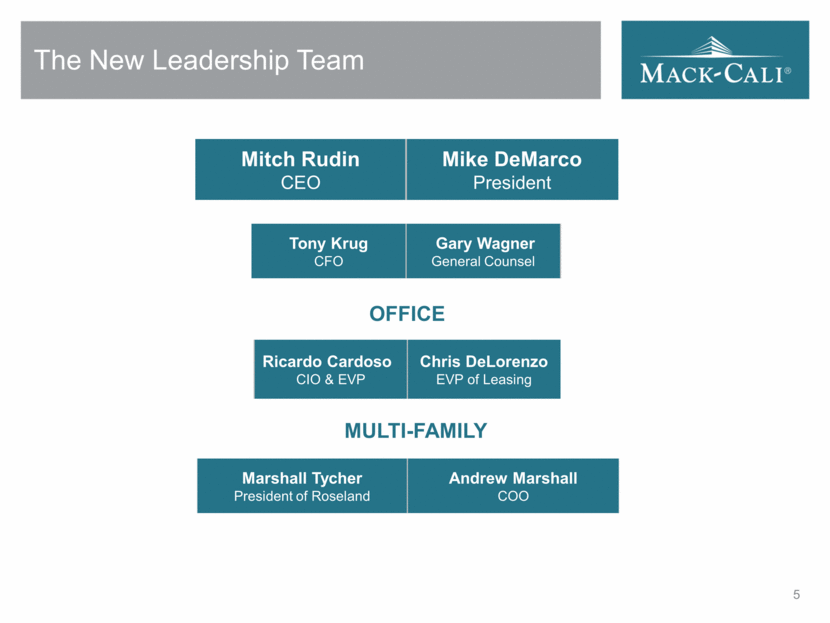
The New Leadership Team 5 Tony Krug CFO Gary Wagner General Counsel Mitch Rudin CEO Mike DeMarco President Marshall Tycher President of Roseland Andrew Marshall COO OFFICE MULTI-FAMILY Ricardo Cardoso CIO & EVP Chris DeLorenzo EVP of Leasing |
|
|
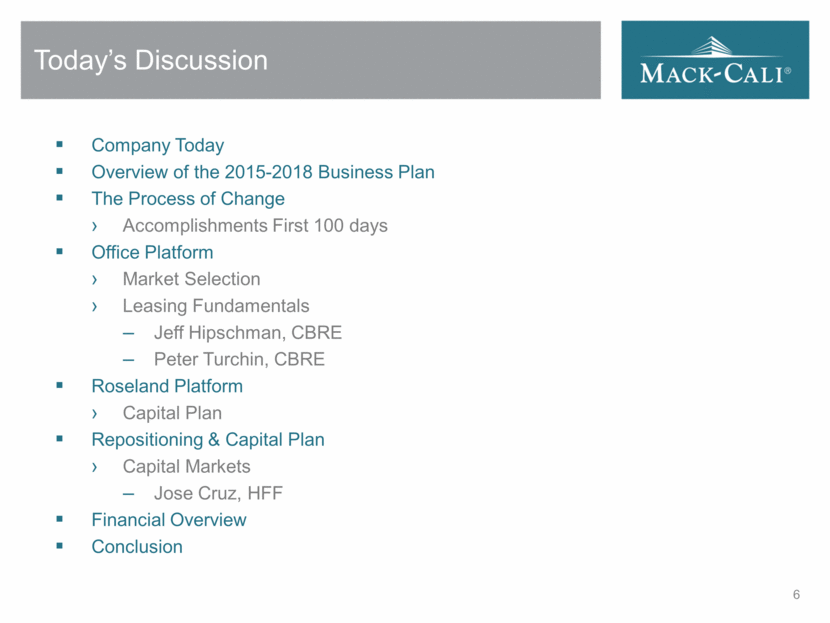
Today’s Discussion 6 Company Today Overview of the 2015-2018 Business Plan The Process of Change Accomplishments First 100 days Office Platform Market Selection Leasing Fundamentals Jeff Hipschman, CBRE Peter Turchin, CBRE Roseland Platform Capital Plan Repositioning & Capital Plan Capital Markets Jose Cruz, HFF Financial Overview Conclusion |
|
|
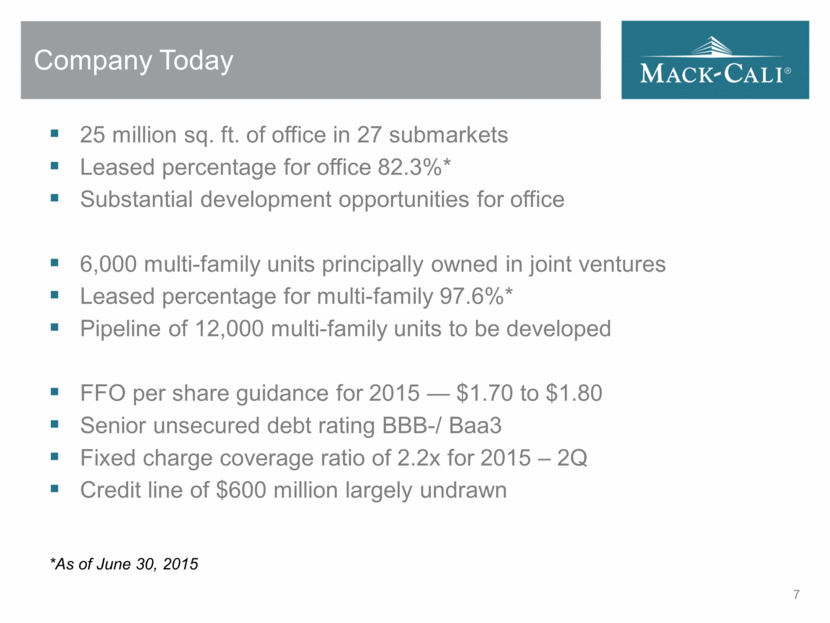
Company Today 7 25 million sq. ft. of office in 27 submarkets Leased percentage for office 82.3%* Substantial development opportunities for office 6,000 multi-family units principally owned in joint ventures Leased percentage for multi-family 97.6%* Pipeline of 12,000 multi-family units to be developed FFO per share guidance for 2015 — $1.70 to $1.80 Senior unsecured debt rating BBB-/ Baa3 Fixed charge coverage ratio of 2.2x for 2015 – 2Q Credit line of $600 million largely undrawn *As of June 30, 2015 |
|
|
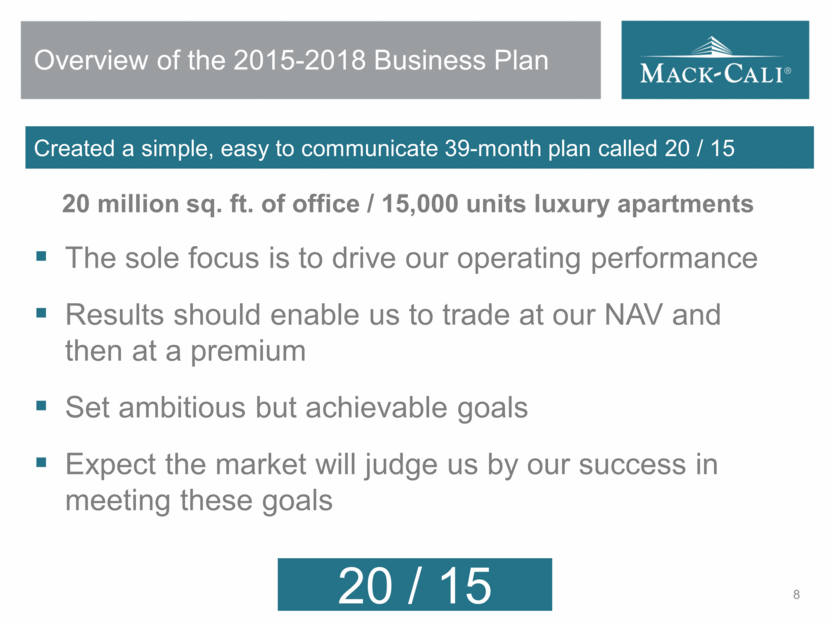
Overview of the 2015-2018 Business Plan 8 Created a simple, easy to communicate 39-month plan called 20 / 15 20 million sq. ft. of office / 15,000 units luxury apartments The sole focus is to drive our operating performance Results should enable us to trade at our NAV and then at a premium Set ambitious but achievable goals Expect the market will judge us by our success in meeting these goals |
|
|
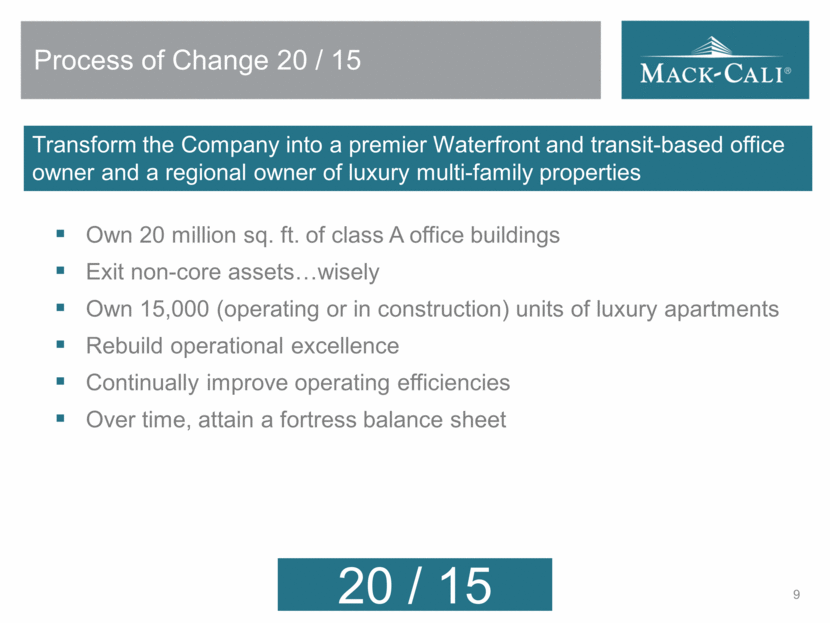
Transform the Company into a premier Waterfront and transit-based office owner and a regional owner of luxury multi-family properties 9 Process of Change 20 / 15 Own 20 million sq. ft. of class A office buildings Exit non-core assets wisely Own 15,000 (operating or in construction) units of luxury apartments Rebuild operational excellence Continually improve operating efficiencies Over time, attain a fortress balance sheet |
|
|
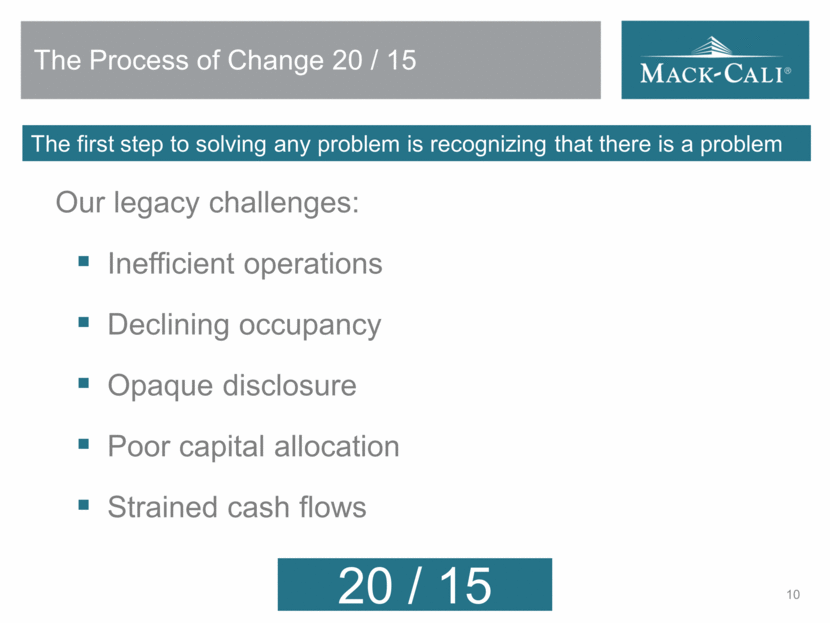
The Process of Change 20 / 15 The first step to solving any problem is recognizing that there is a problem 10 Our legacy challenges: Inefficient operations Declining occupancy Opaque disclosure Poor capital allocation Strained cash flows |
|
|
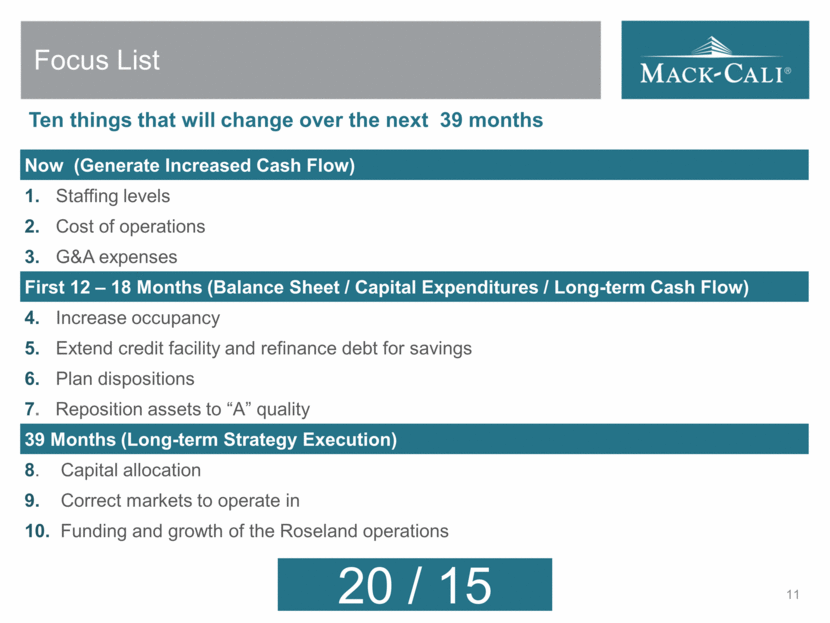
Focus List 11 Now (Generate Increased Cash Flow) 1. Staffing levels 2. Cost of operations 3. G&A expenses First 12 – 18 Months (Balance Sheet / Capital Expenditures / Long-term Cash Flow) 4. Increase occupancy 5. Extend credit facility and refinance debt for savings 6. Plan dispositions 7. Reposition assets to “A” quality 39 Months (Long-term Strategy Execution) 8. Capital allocation 9. Correct markets to operate in 10. Funding and growth of the Roseland operations Ten things that will change over the next 39 months |
|
|
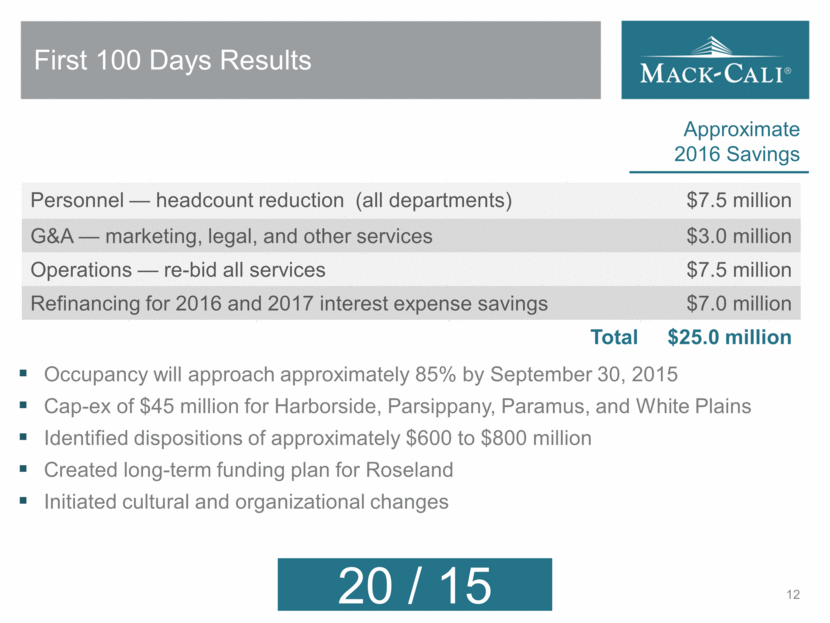
First 100 Days Results 12 Approximate 2016 Savings Personnel — headcount reduction (all departments) $7.5 million G&A — marketing, legal, and other services $3.0 million Operations — re-bid all services $7.5 million Refinancing for 2016 and 2017 interest expense savings $7.0 million Total $25.0 million Occupancy will approach approximately 85% by September 30, 2015 Cap-ex of $45 million for Harborside, Parsippany, Paramus, and White Plains Identified dispositions of approximately $600 to $800 million Created long-term funding plan for Roseland Initiated cultural and organizational changes |
|
|
Mitch Rudin Office Markets & Portfolio |
|
|
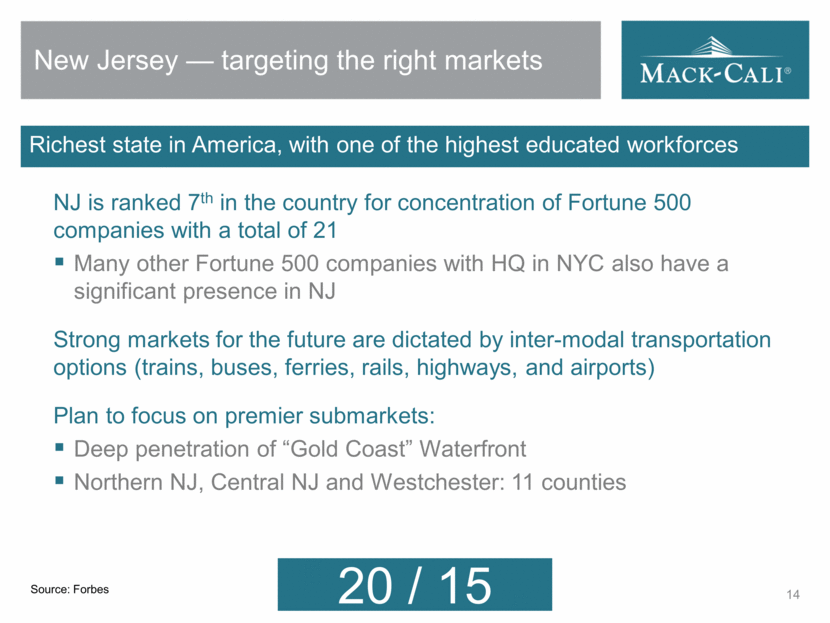
New Jersey — targeting the right markets 14 Richest state in America, with one of the highest educated workforces NJ is ranked 7th in the country for concentration of Fortune 500 companies with a total of 21 Many other Fortune 500 companies with HQ in NYC also have a significant presence in NJ Strong markets for the future are dictated by inter-modal transportation options (trains, buses, ferries, rails, highways, and airports) Plan to focus on premier submarkets: Deep penetration of “Gold Coast” Waterfront Northern NJ, Central NJ and Westchester: 11 counties Source: Forbes |
|
|
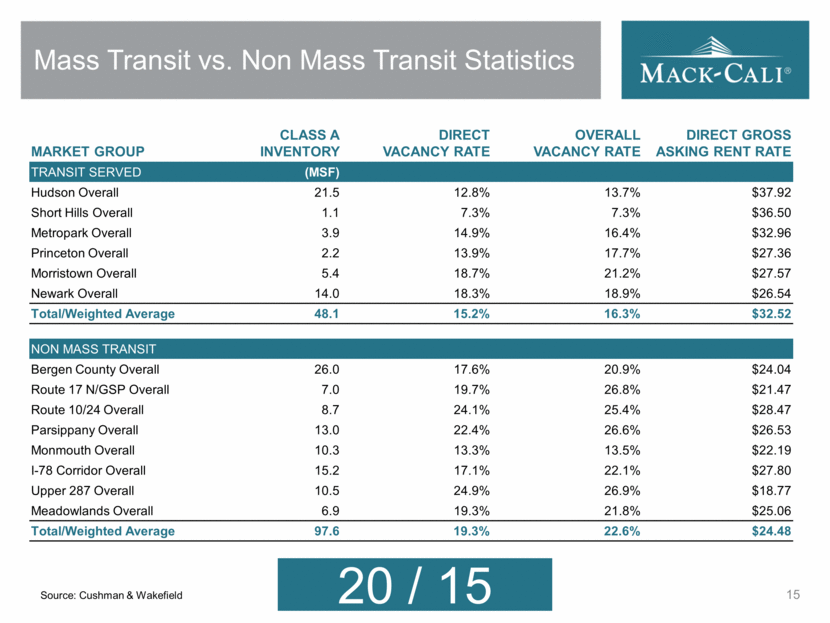
Mass Transit vs. Non Mass Transit Statistics 15 MARKET GROUP CLASS A INVENTORY DIRECT VACANCY RATE OVERALL VACANCY RATE DIRECT GROSS ASKING RENT RATE TRANSIT SERVED (MSF) Hudson Overall 21.5 12.8% 13.7% $37.92 Short Hills Overall 1.1 7.3% 7.3% $36.50 Metropark Overall 3.9 14.9% 16.4% $32.96 Princeton Overall 2.2 13.9% 17.7% $27.36 Morristown Overall 5.4 18.7% 21.2% $27.57 Newark Overall 14.0 18.3% 18.9% $26.54 Total/Weighted Average 48.1 15.2% 16.3% $32.52 NON MASS TRANSIT Bergen County Overall 26.0 17.6% 20.9% $24.04 Route 17 N/GSP Overall 7.0 19.7% 26.8% $21.47 Route 10/24 Overall 8.7 24.1% 25.4% $28.47 Parsippany Overall 13.0 22.4% 26.6% $26.53 Monmouth Overall 10.3 13.3% 13.5% $22.19 I-78 Corridor Overall 15.2 17.1% 22.1% $27.80 Upper 287 Overall 10.5 24.9% 26.9% $18.77 Meadowlands Overall 6.9 19.3% 21.8% $25.06 Total/Weighted Average 97.6 19.3% 22.6% $24.48 Source: Cushman & Wakefield |
|
|
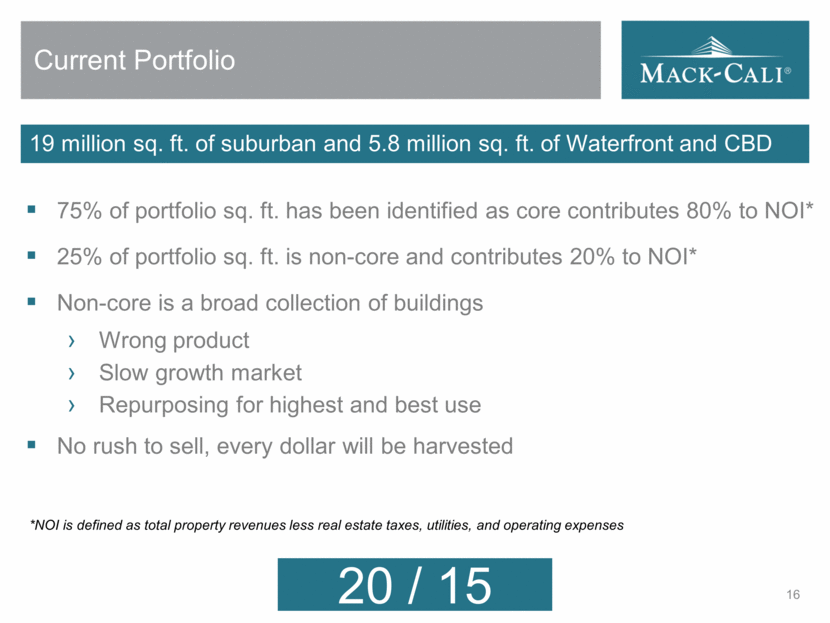
Current Portfolio 16 19 million sq. ft. of suburban and 5.8 million sq. ft. of Waterfront and CBD 75% of portfolio sq. ft. has been identified as core contributes 80% to NOI* 25% of portfolio sq. ft. is non-core and contributes 20% to NOI* Non-core is a broad collection of buildings Wrong product Slow growth market Repurposing for highest and best use No rush to sell, every dollar will be harvested *NOI is defined as total property revenues less real estate taxes, utilities, and operating expenses |
|
|
Jeff Hipschman, CBRE New Jersey Market Fundamentals |
|
|
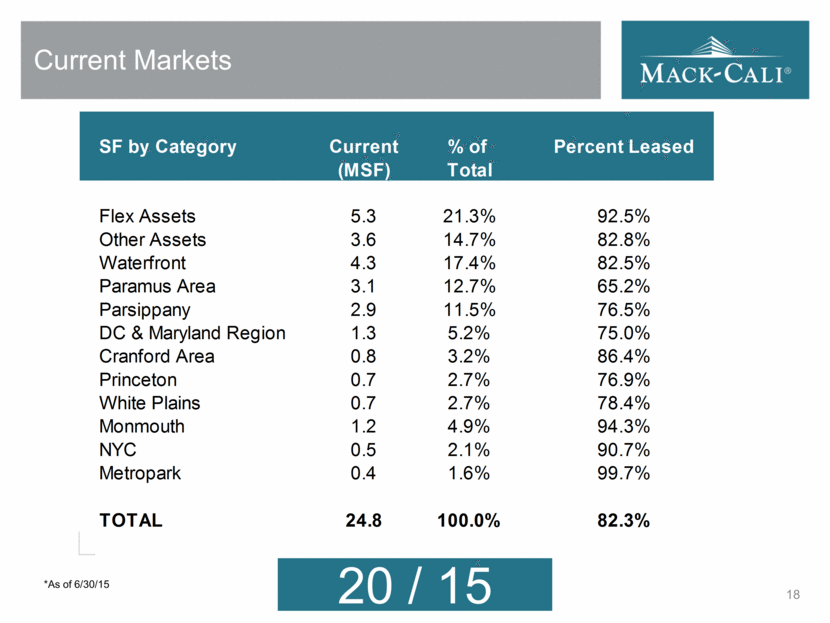
Current Markets 18 *As of 6/30/15 * * SF by Category Current % of Percent Leased (MSF) Total Flex Assets 5.3 21.3% 92.5% Other Assets 3.6 14.7% 82.8% Waterfront 4.3 17.4% 82.5% Paramus Area 3.1 12.7% 65.2% Parsippany 2.9 11.5% 76.5% DC & Maryland Region 1.3 5.2% 75.0% Cranford Area 0.8 3.2% 86.4% Princeton 0.7 2.7% 76.9% White Plains 0.7 2.7% 78.4% Monmouth 1.2 4.9% 94.3% NYC 0.5 2.1% 90.7% Metropark 0.4 1.6% 99.7% TOTAL 24.8 100.0% 82.3% |
|
|
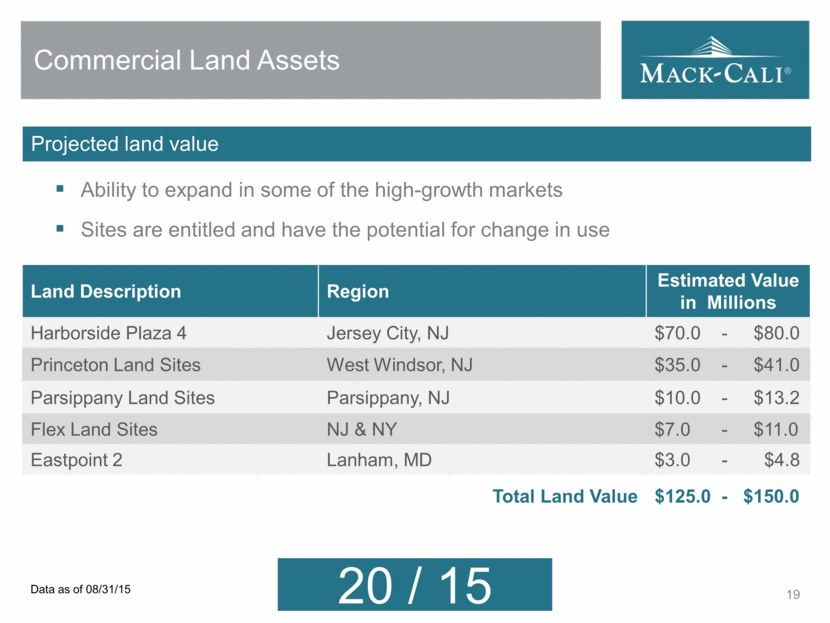
Commercial Land Assets 19 Land Description Region Estimated Value in Millions Harborside Plaza 4 Jersey City, NJ $70.0 - $80.0 Princeton Land Sites West Windsor, NJ $35.0 - $41.0 Parsippany Land Sites Parsippany, NJ $10.0 - $13.2 Flex Land Sites NJ & NY $7.0 - $11.0 Eastpoint 2 Lanham, MD $3.0 - $4.8 Total Land Value $125.0 - $150.0 Projected land value Ability to expand in some of the high-growth markets Sites are entitled and have the potential for change in use Data as of 08/31/15 |
|
|
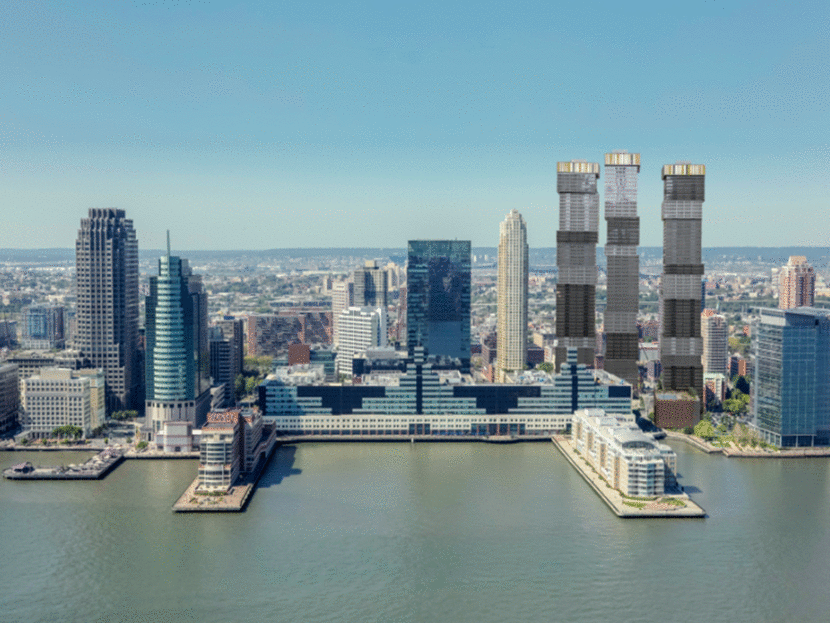
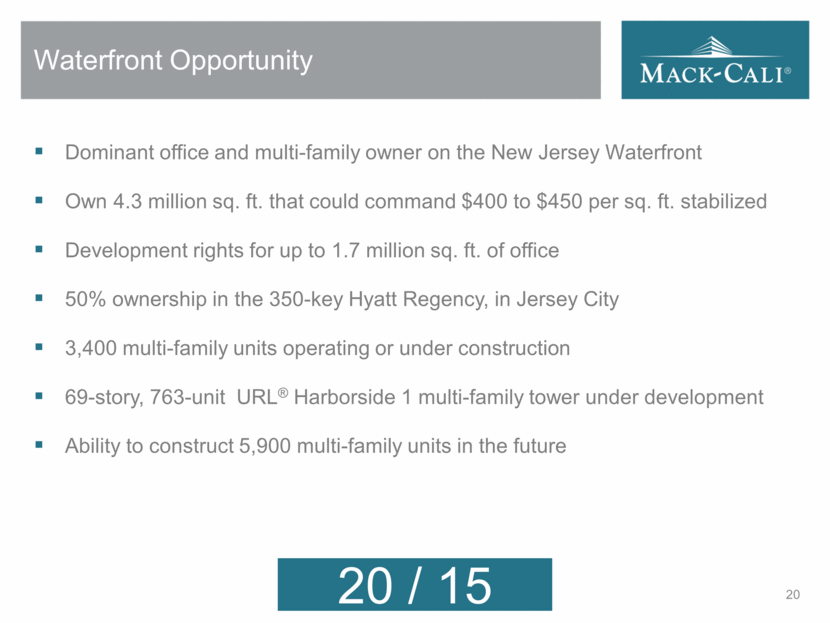
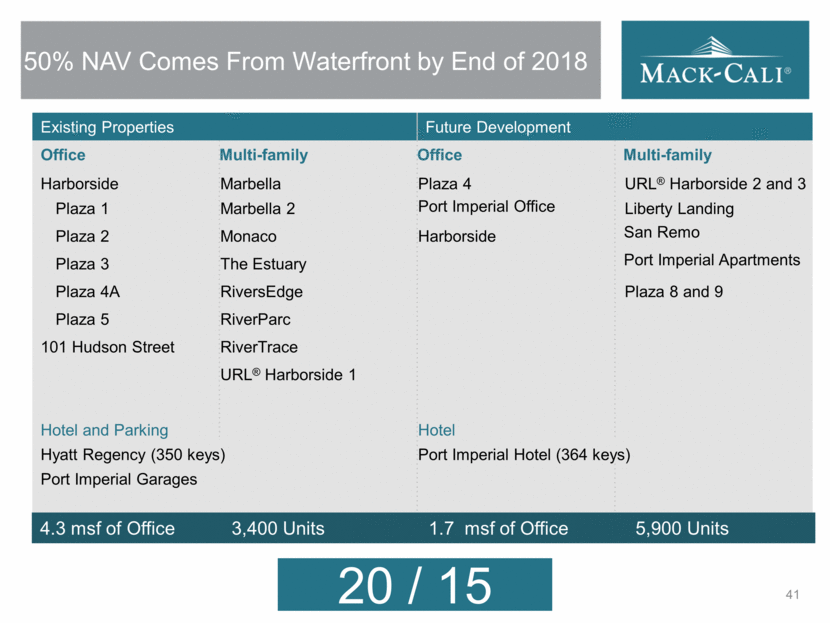
Waterfront Opportunity Dominant office and multi-family owner on the New Jersey Waterfront Own 4.3 million sq. ft. that could command $400 to $450 per sq. ft. stabilized Development rights for up to 1.7 million sq. ft. of office 50% ownership in the 350-key Hyatt Regency, in Jersey City 3,400 multi-family units operating or under construction 69-story, 763-unit URL® Harborside 1 multi-family tower under development Ability to construct 5,900 multi-family units in the future 20 |
|
|
Peter Turchin, CBRE Waterfront |
|
|
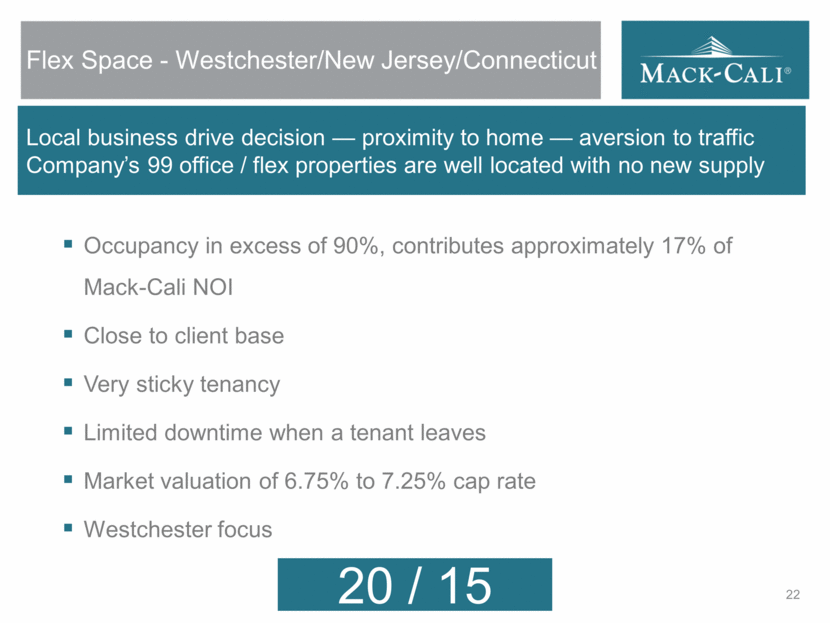
Flex Space - Westchester/New Jersey/Connecticut Local business drive decision — proximity to home — aversion to traffic Company’s 99 office / flex properties are well located with no new supply 22 Occupancy in excess of 90%, contributes approximately 17% of Mack-Cali NOI Close to client base Very sticky tenancy Limited downtime when a tenant leaves Market valuation of 6.75% to 7.25% cap rate Westchester focus |
|
|
Roseland Platform Marshall Tycher & Andrew Marshall |
|
|
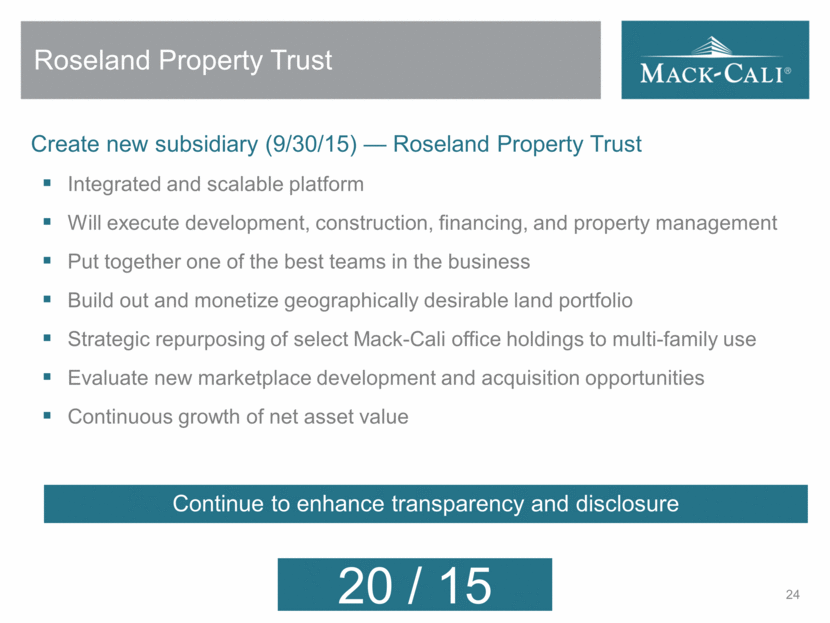
Roseland Property Trust Create new subsidiary (9/30/15) — Roseland Property Trust Integrated and scalable platform Will execute development, construction, financing, and property management Put together one of the best teams in the business Build out and monetize geographically desirable land portfolio Strategic repurposing of select Mack-Cali office holdings to multi-family use Evaluate new marketplace development and acquisition opportunities Continuous growth of net asset value 24 Continue to enhance transparency and disclosure |
|
|
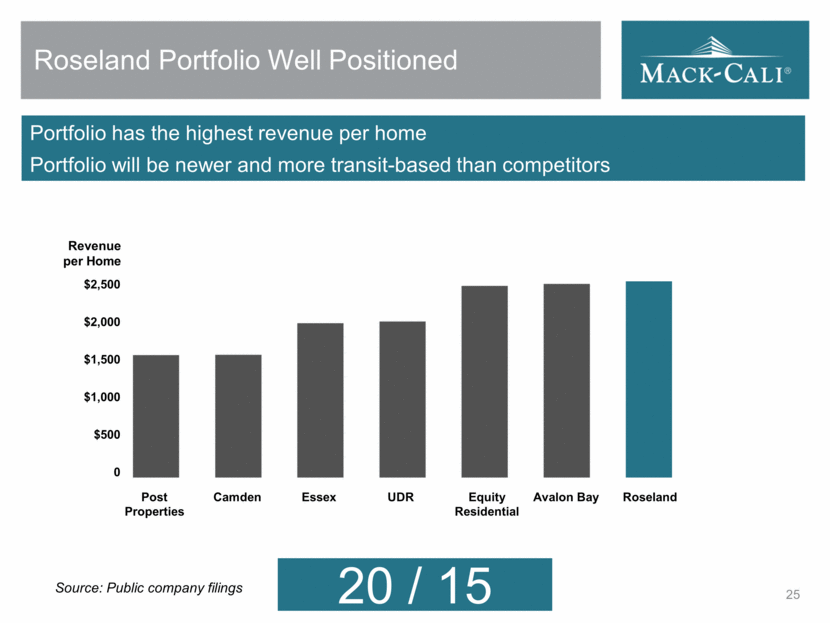
Roseland Portfolio Well Positioned 25 Portfolio has the highest revenue per home Portfolio will be newer and more transit-based than competitors 0 $500 $1,000 $1,500 $2,000 $2,500 Revenue per Home Equity Residential Post Properties Camden Essex UDR Avalon Bay Roseland Source: Public company filings |
|
|
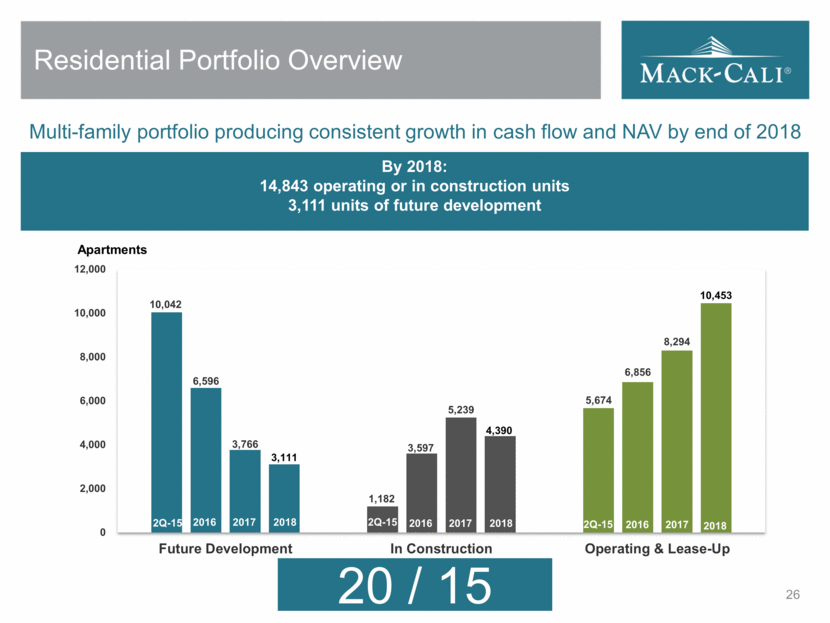
Residential Portfolio Overview 26 Multi-family portfolio producing consistent growth in cash flow and NAV by end of 2018 Apartments 2Q15 2016 2017 2018 2Q15 2016 2017 2018 By 2018: 14,843 operating or in construction units 3,111 units of future development 2Q-15 2017 2017 2017 2018 2018 2018 2016 2017 2018 2016 2017 2018 2016 2017 2018 2Q-15 2Q-15 10,042 1,182 5,674 6,596 3,597 6,856 3,766 5,239 8,294 3,111 4,390 10,453 0 2,000 4,000 6,000 8,000 10,000 12,000 Future Development In Construction Operating & Lease-Up Apartments |
|
|
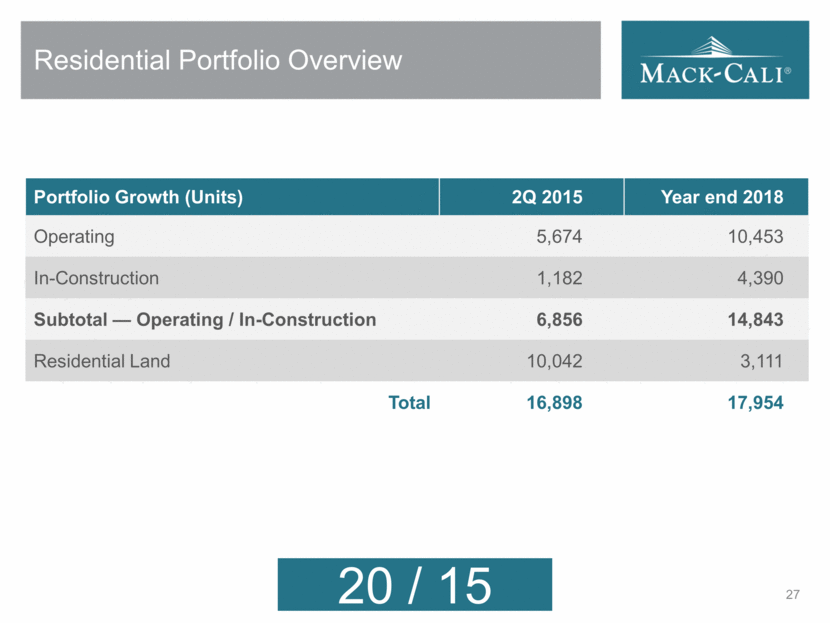
Residential Portfolio Overview 27 Portfolio Growth (Units) 2Q 2015 Year end 2018 Operating 5,674 10,453 In-Construction 1,182 4,390 Subtotal — Operating / In-Construction 6,856 14,843 Residential Land 10,042 3,111 Total 16,898 17,954 |
|
|
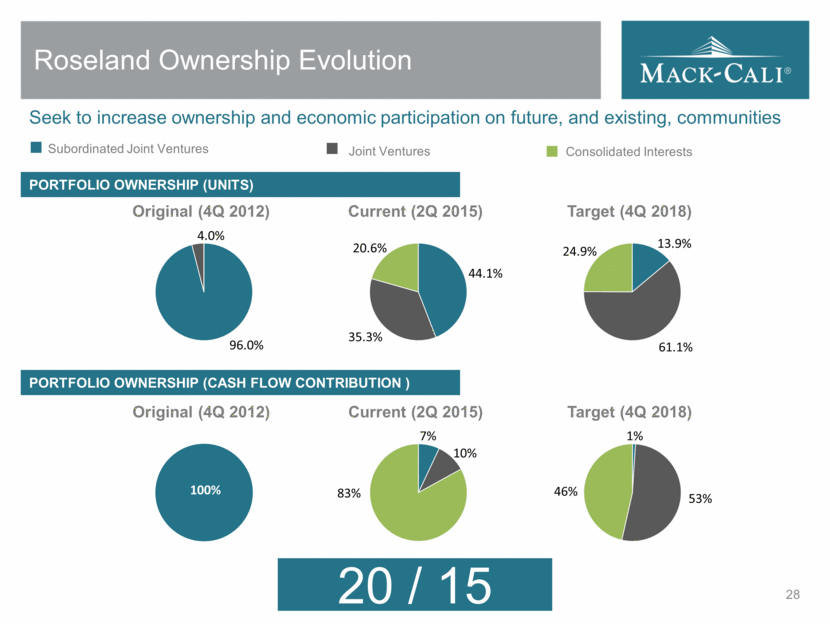
Roseland Ownership Evolution 28 PORTFOLIO OWNERSHIP (UNITS) PORTFOLIO OWNERSHIP (CASH FLOW CONTRIBUTION ) 100% Seek to increase ownership and economic participation on future, and existing, communities Subordinated Joint Ventures Joint Ventures Consolidated Interests 44.1% 35.3% 20.6% Current (2Q 2015) 96.0% 4.0% Original (4Q 2012) 13.9% 61.1% 24.9% Target (4Q 2018) 7% 10% 83% Current (2Q 2015) Original (4Q 2012) 1% 53% 46% Target (4Q 2018) |
|
|
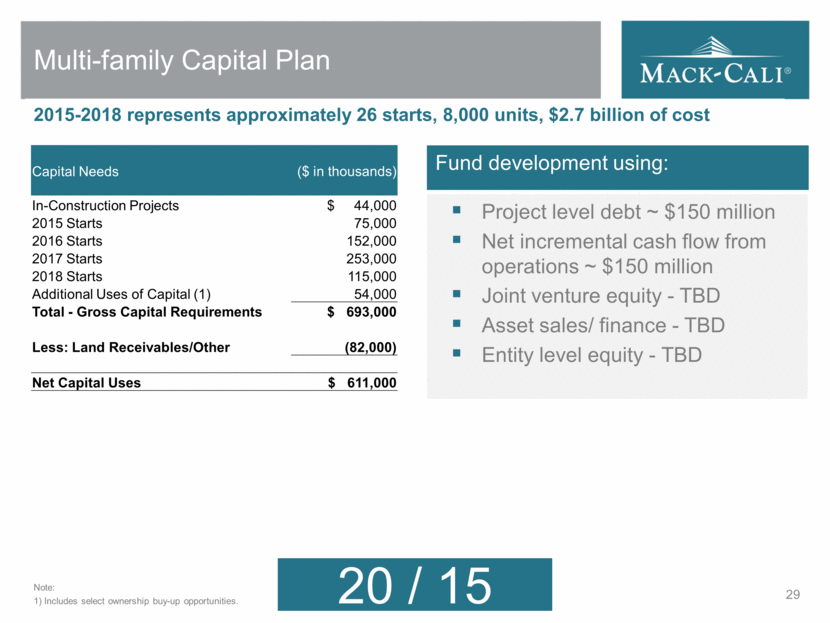
29 Note: Includes select ownership buy-up opportunities. Capital Needs ($ in thousands) In-Construction Projects $ 44,000 2015 Starts 75,000 2016 Starts 152,000 2017 Starts 253,000 2018 Starts 115,000 Additional Uses of Capital (1) 54,000 Total - Gross Capital Requirements $ 693,000 Less: Land Receivables/Other (82,000) Net Capital Uses $ 611,000 Multi-family Capital Plan Fund development using: Project level debt ~ $150 million Net incremental cash flow from operations ~ $150 million Joint venture equity - TBD Asset sales/ finance - TBD Entity level equity - TBD 2015-2018 represents approximately 26 starts, 8,000 units, $2.7 billion of cost |
|
|
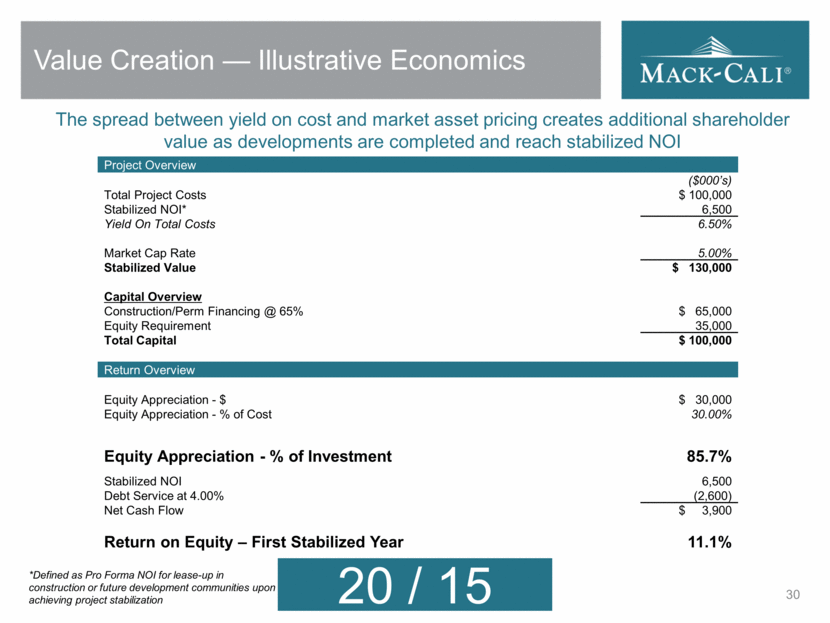
Value Creation — Illustrative Economics Project Overview ($000’s) Total Project Costs $ 100,000 Stabilized NOI* 6,500 Yield On Total Costs 6.50% Market Cap Rate 5.00% Stabilized Value $ 130,000 Capital Overview Construction/Perm Financing @ 65% $ 65,000 Equity Requirement 35,000 Total Capital $ 100,000 Return Overview Equity Appreciation - $ $ 30,000 Equity Appreciation - % of Cost 30.00% Equity Appreciation - % of Investment 85.7% Stabilized NOI 6,500 Debt Service at 4.00% (2,600) Net Cash Flow $ 3,900 Return on Equity – First Stabilized Year 11.1% 30 *Defined as Pro Forma NOI for lease-up in construction or future development communities upon achieving project stabilization The spread between yield on cost and market asset pricing creates additional shareholder value as developments are completed and reach stabilized NOI |
|
|
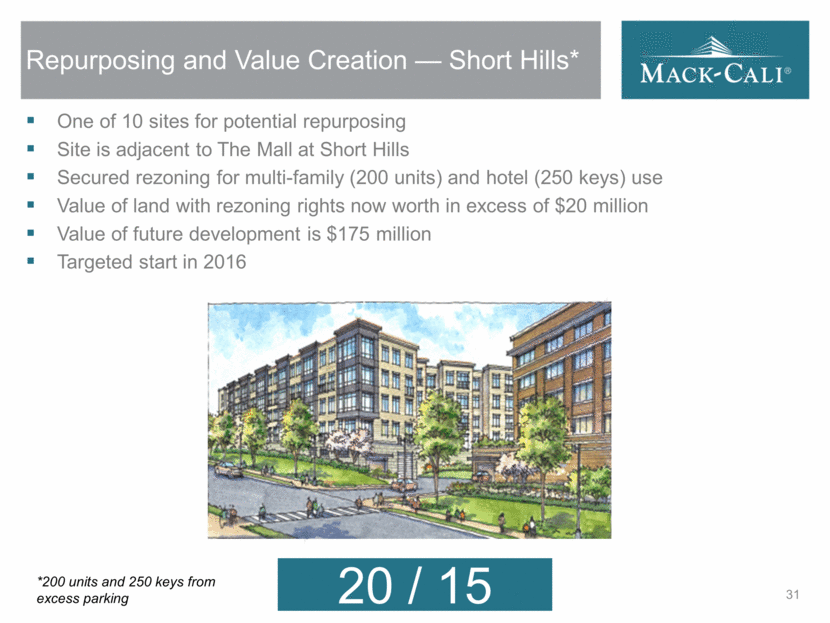
Repurposing and Value Creation — Short Hills* One of 10 sites for potential repurposing Site is adjacent to The Mall at Short Hills Secured rezoning for multi-family (200 units) and hotel (250 keys) use Value of land with rezoning rights now worth in excess of $20 million Value of future development is $175 million Targeted start in 2016 31 *200 units and 250 keys from excess parking |
|
|
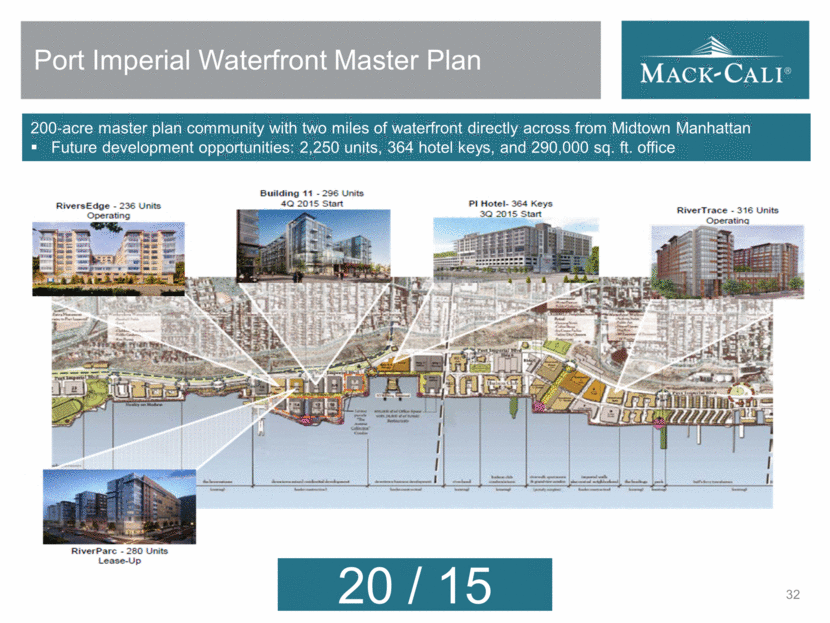
Port Imperial Waterfront Master Plan 32 200-acre master plan community with two miles of waterfront directly across from Midtown Manhattan Future development opportunities: 2,250 units, 364 hotel keys, and 290,000 sq. ft. office |
|
|
Repositioning and Capital Plan Mike DeMarco |
|
|
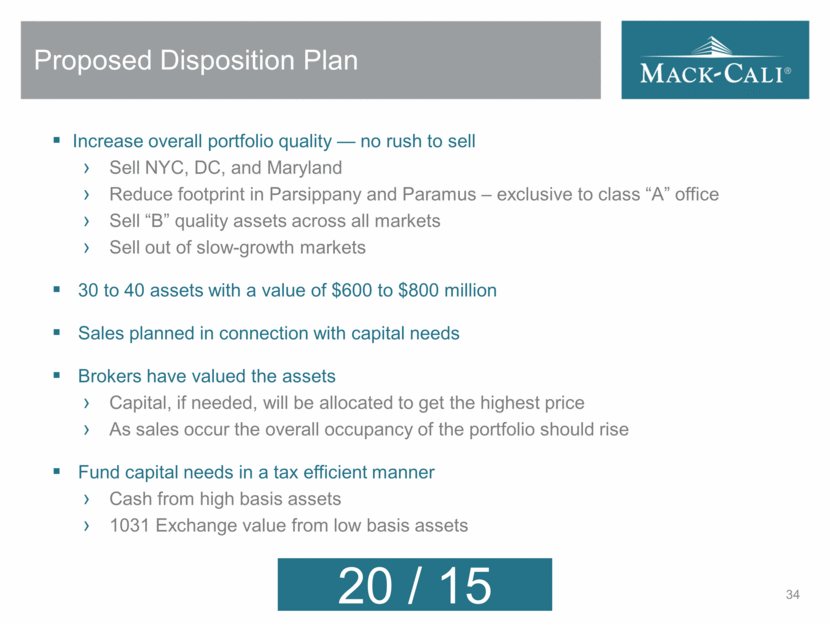
Proposed Disposition Plan 34 Increase overall portfolio quality — no rush to sell Sell NYC, DC, and Maryland Reduce footprint in Parsippany and Paramus – exclusive to class “A” office Sell “B” quality assets across all markets Sell out of slow-growth markets 30 to 40 assets with a value of $600 to $800 million Sales planned in connection with capital needs Brokers have valued the assets Capital, if needed, will be allocated to get the highest price As sales occur the overall occupancy of the portfolio should rise Fund capital needs in a tax efficient manner Cash from high basis assets 1031 Exchange value from low basis assets |
|
|
Capital Markets Jose Cruz, HFF |
|
|
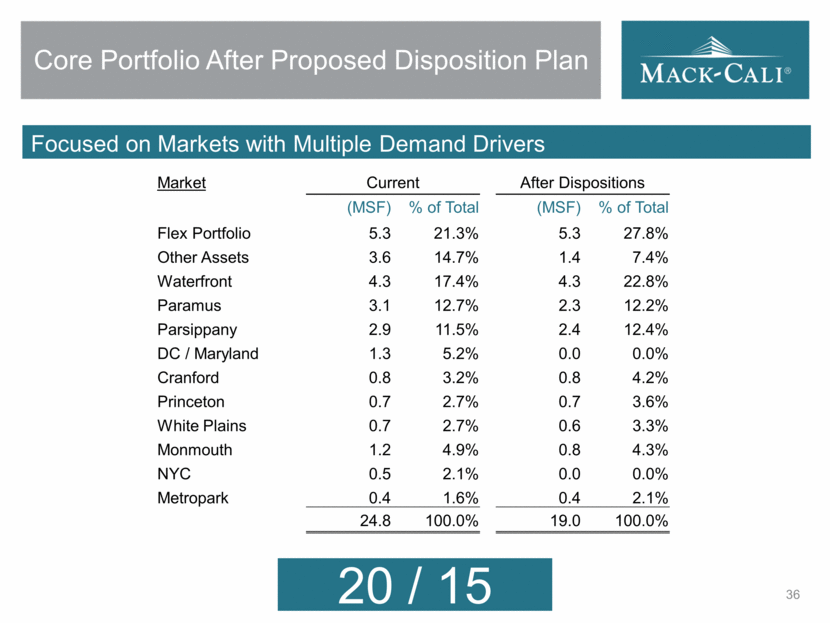
Core Portfolio After Proposed Disposition Plan Focused on Markets with Multiple Demand Drivers 36 Market Current After Dispositions (MSF) % of Total (MSF) % of Total Flex Portfolio 5.3 21.3% 5.3 27.8% Other Assets 3.6 14.7% 1.4 7.4% Waterfront 4.3 17.4% 4.3 22.8% Paramus 3.1 12.7% 2.3 12.2% Parsippany 2.9 11.5% 2.4 12.4% DC / Maryland 1.3 5.2% 0.0 0.0% Cranford 0.8 3.2% 0.8 4.2% Princeton 0.7 2.7% 0.7 3.6% White Plains 0.7 2.7% 0.6 3.3% Monmouth 1.2 4.9% 0.8 4.3% NYC 0.5 2.1% 0.0 0.0% Metropark 0.4 1.6% 0.4 2.1% 24.8 100.0% 19.0 100.0% |
|
|
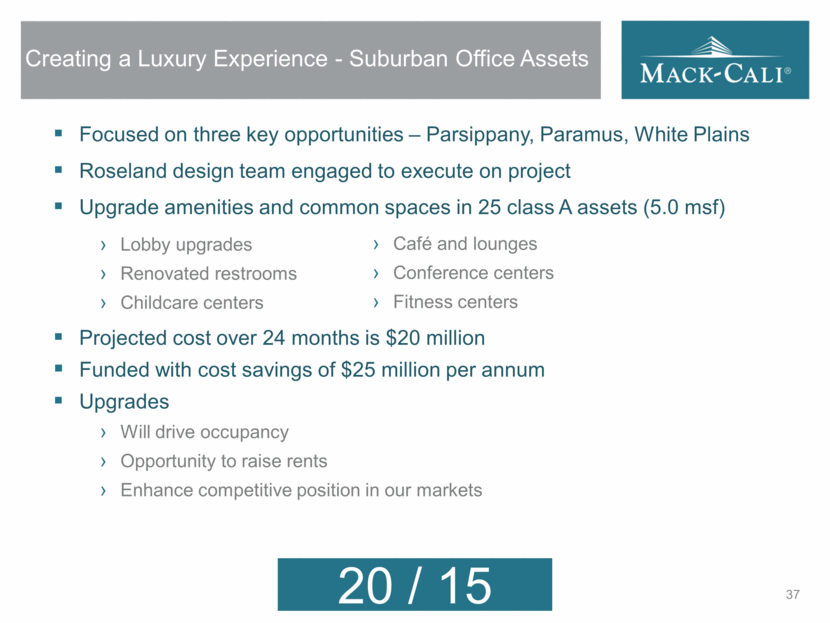
Creating a Luxury Experience - Suburban Office Assets Focused on three key opportunities – Parsippany, Paramus, White Plains Roseland design team engaged to execute on project Upgrade amenities and common spaces in 25 class A assets (5.0 msf) Lobby upgrades Renovated restrooms Childcare centers Projected cost over 24 months is $20 million Funded with cost savings of $25 million per annum Upgrades Will drive occupancy Opportunity to raise rents Enhance competitive position in our markets 37 Café and lounges Conference centers Fitness centers |
|
|
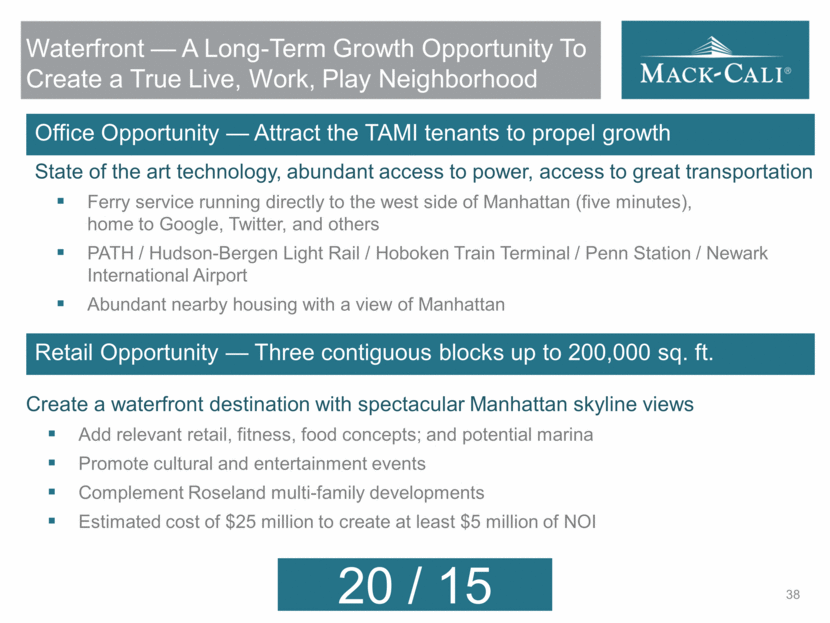
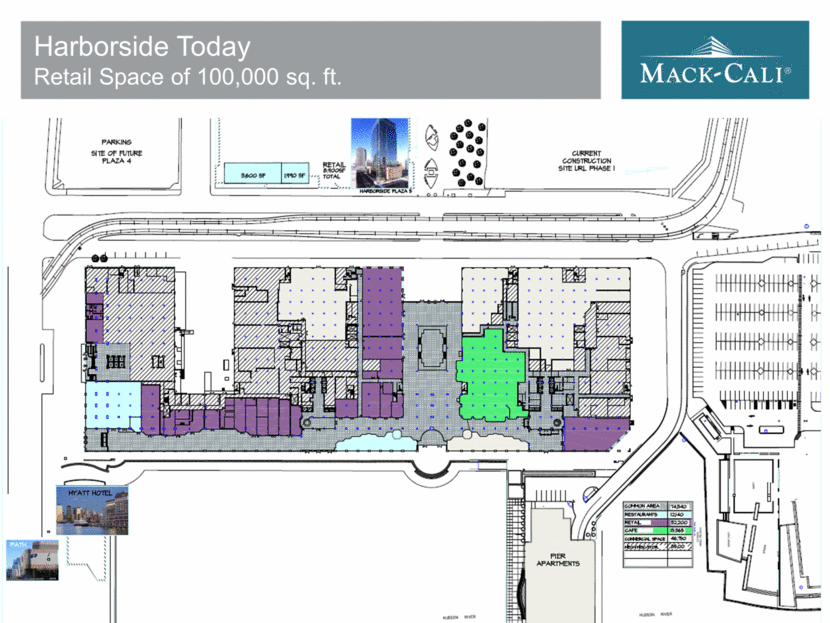
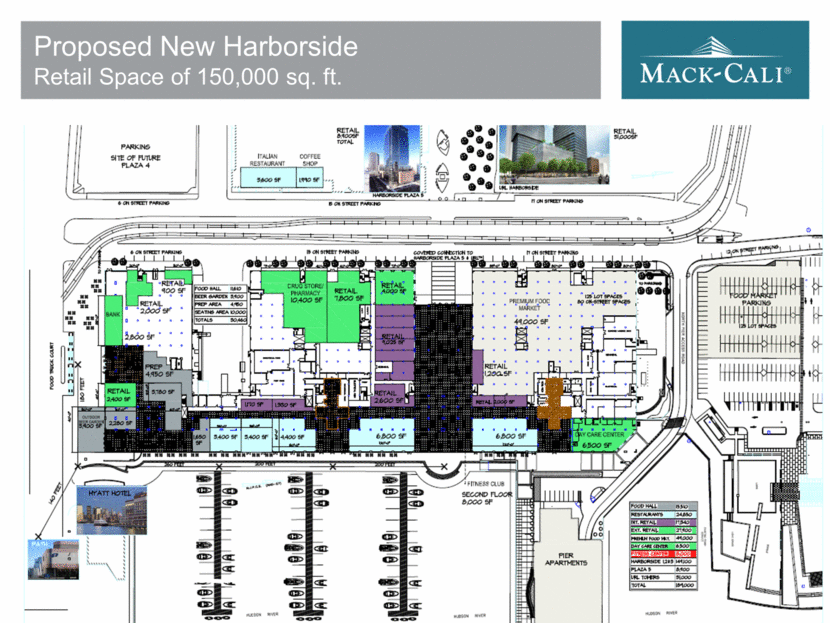
Waterfront — A Long-Term Growth Opportunity To Create a True Live, Work, Play Neighborhood Retail Opportunity — Three contiguous blocks up to 200,000 sq. ft. 38 Create a waterfront destination with spectacular Manhattan skyline views Add relevant retail, fitness, food concepts; and potential marina Promote cultural and entertainment events Complement Roseland multi-family developments Estimated cost of $25 million to create at least $5 million of NOI Office Opportunity — Attract the TAMI tenants to propel growth State of the art technology, abundant access to power, access to great transportation Ferry service running directly to the west side of Manhattan (five minutes), home to Google, Twitter, and others PATH / Hudson-Bergen Light Rail / Hoboken Train Terminal / Penn Station / Newark International Airport Abundant nearby housing with a view of Manhattan |
|
|
Harborside Today Retail Space of 100,000 sq. ft. 39 |
|
|
40 Proposed New Harborside Retail Space of 150,000 sq. ft. |
|
|
50% NAV Comes From Waterfront by End of 2018 41 Existing Properties Future Development Office Multi-family Office Multi-family Harborside Marbella Plaza 4 URL® Harborside 2 and 3 Plaza 1 Marbella 2 Port Imperial Office Liberty Landing Plaza 2 Monaco Harborside San Remo Plaza 3 The Estuary Port Imperial Apartments Plaza 4A RiversEdge Plaza 8 and 9 Plaza 5 RiverParc 101 Hudson Street RiverTrace URL® Harborside 1 Hotel and Parking Hotel Hyatt Regency (350 keys) Port Imperial Hotel (364 keys) Port Imperial Garages 4.3 msf of Office 3,400 Units 1.7 msf of Office 5,900 Units |
|
|
Financial Overview Tony Krug |
|
|
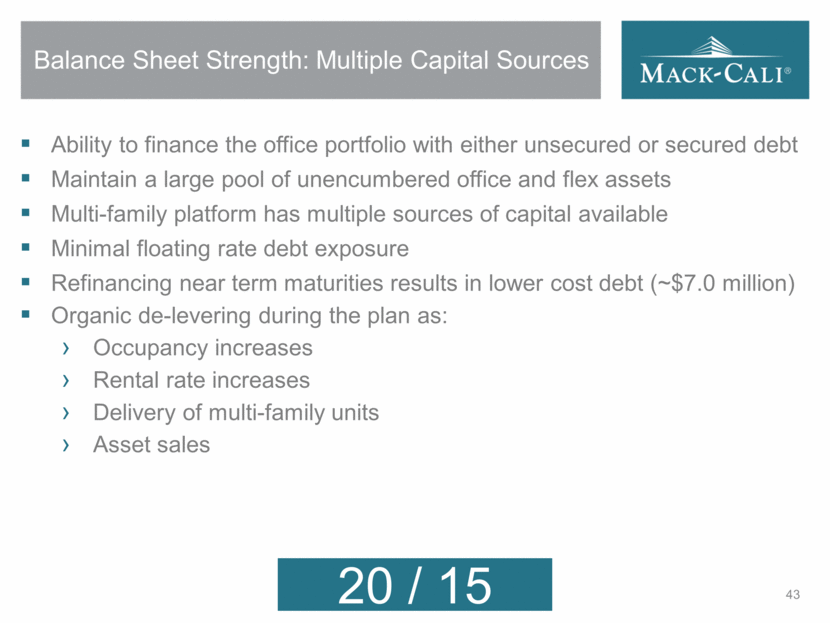
Balance Sheet Strength: Multiple Capital Sources 43 Ability to finance the office portfolio with either unsecured or secured debt Maintain a large pool of unencumbered office and flex assets Multi-family platform has multiple sources of capital available Minimal floating rate debt exposure Refinancing near term maturities results in lower cost debt (~$7.0 million) Organic de-levering during the plan as: Occupancy increases Rental rate increases Delivery of multi-family units Asset sales |
|
|
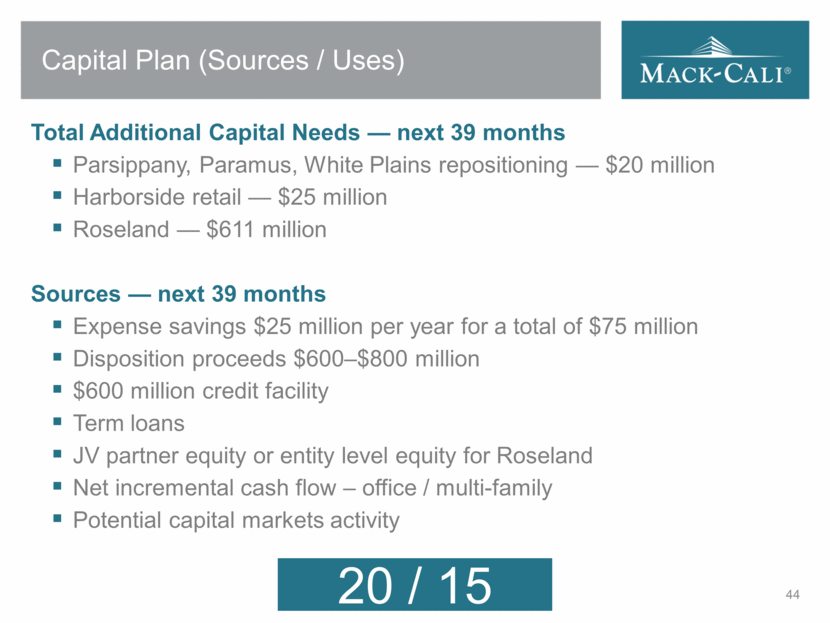
Capital Plan (Sources / Uses) Total Additional Capital Needs — next 39 months Parsippany, Paramus, White Plains repositioning — $20 million Harborside retail — $25 million Roseland — $611 million Sources — next 39 months Expense savings $25 million per year for a total of $75 million Disposition proceeds $600–$800 million $600 million credit facility Term loans JV partner equity or entity level equity for Roseland Net incremental cash flow – office / multi-family Potential capital markets activity 44 |
|
|
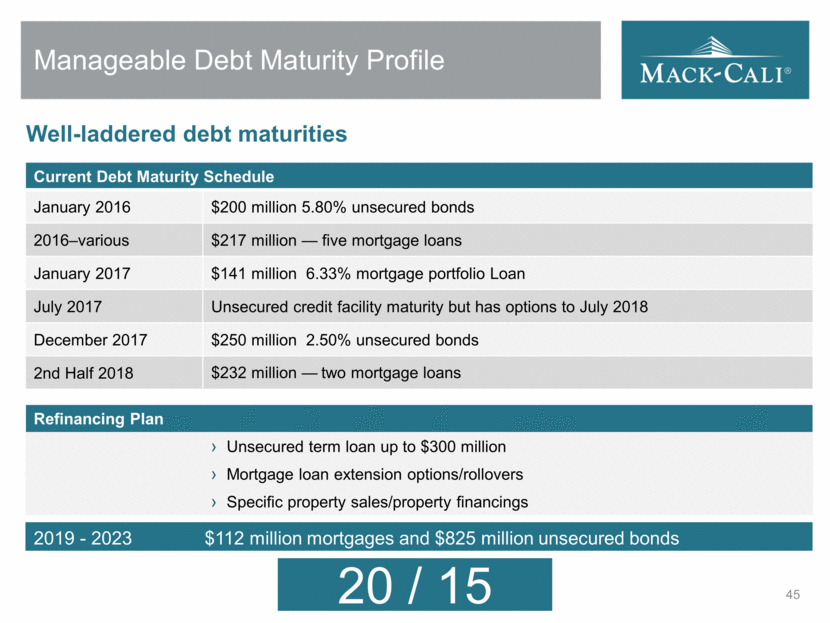
Manageable Debt Maturity Profile 45 Current Debt Maturity Schedule January 2016 $200 million 5.80% unsecured bonds 2016–various $217 million — five mortgage loans January 2017 $141 million 6.33% mortgage portfolio Loan July 2017 Unsecured credit facility maturity but has options to July 2018 December 2017 $250 million 2.50% unsecured bonds 2nd Half 2018 $232 million — two mortgage loans Refinancing Plan Unsecured term loan up to $300 million Mortgage loan extension options/rollovers Specific property sales/property financings Well-laddered debt maturities 2019 - 2023 $112 million mortgages and $825 million unsecured bonds |
|
|
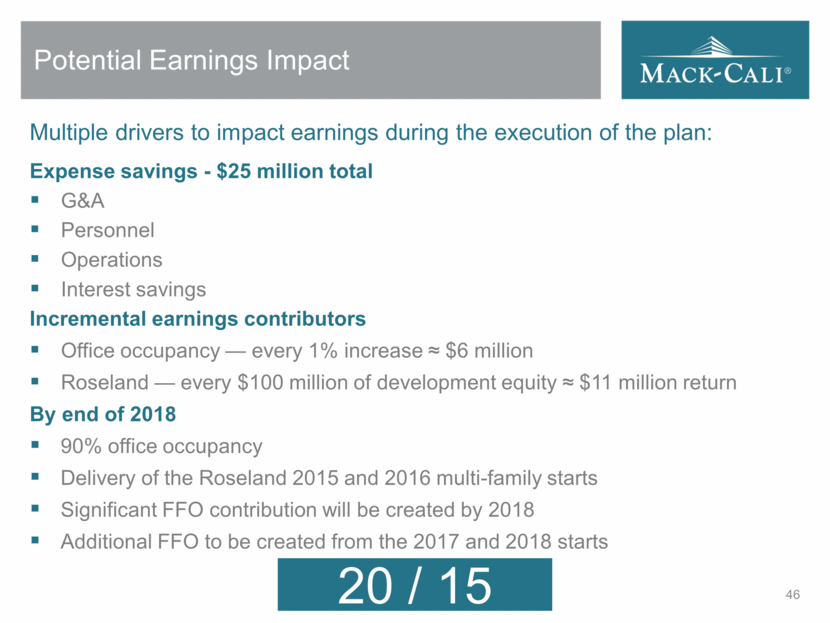
Potential Earnings Impact Multiple drivers to impact earnings during the execution of the plan: 46 Expense savings - $25 million total G&A Personnel Operations Interest savings Incremental earnings contributors Office occupancy — every 1% increase ≈ $6 million Roseland — every $100 million of development equity ≈ $11 million return By end of 2018 90% office occupancy Delivery of the Roseland 2015 and 2016 multi-family starts Significant FFO contribution will be created by 2018 Additional FFO to be created from the 2017 and 2018 starts |
|
|
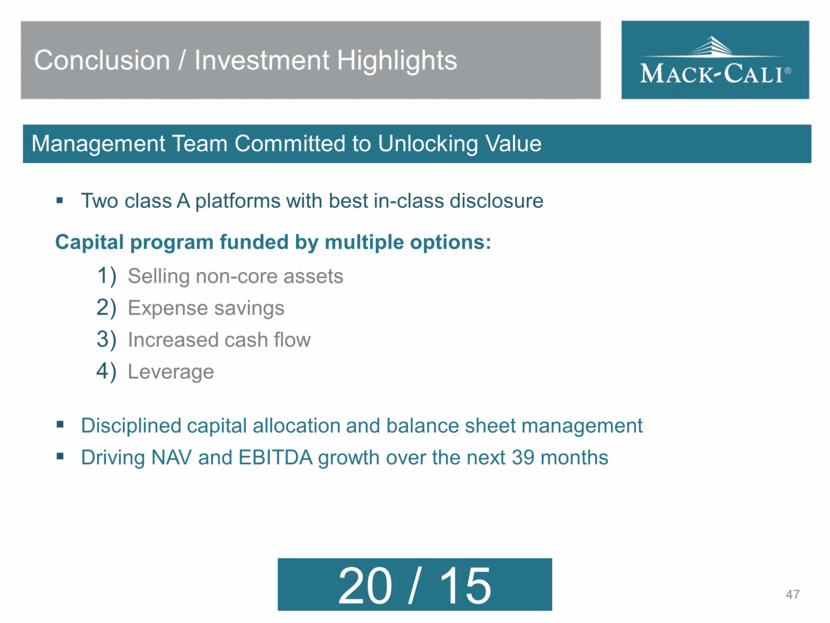
Conclusion / Investment Highlights 47 Management Team Committed to Unlocking Value Two class A platforms with best in-class disclosure Capital program funded by multiple options: Selling non-core assets Expense savings Increased cash flow Leverage Disciplined capital allocation and balance sheet management Driving NAV and EBITDA growth over the next 39 months |
|
|
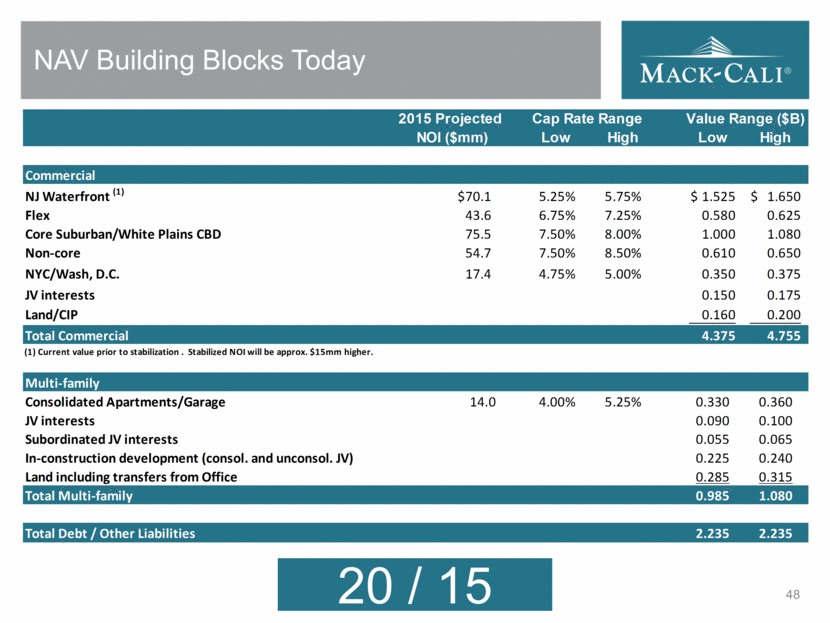
NAV Building Blocks Today 48 Low High Low High Commercial NJ Waterfront (1) $70.1 5.25% 5.75% 1.525 $ 1.650 $ Flex 43.6 6.75% 7.25% 0.580 0.625 Core Suburban/White Plains CBD 75.5 7.50% 8.00% 1.000 1.080 Non-core 54.7 7.50% 8.50% 0.610 0.650 NYC/Wash, D.C. 17.4 4.75% 5.00% 0.350 0.375 JV interests 0.150 0.175 Land/CIP 0.160 0.200 Total Commercial 4.375 4.755 (1) Current value prior to stabilization . Stabilized NOI will be approx. $15mm higher. Multi-family Consolidated Apartments/Garage 14.0 4.00% 5.25% 0.330 0.360 JV interests 0.090 0.100 Subordinated JV interests 0.055 0.065 In-construction development (consol. and unconsol. JV) 0.225 0.240 Land including transfers from Office 0.285 0.315 Total Multi-family 0.985 1.080 Total Debt / Other Liabilities 2.235 2.235 Cap Rate Range Value Range ($B) 2015 Projected NOI ($mm) |
|
|
49 |
|
|
Jeff Hipschman, CBRE New Jersey Market Fundamentals |
|
|
NJ OFFICE MARKET OVERVIEW Jeff Hipschman, Senior Managing Director September 10, 2015 |
|
|
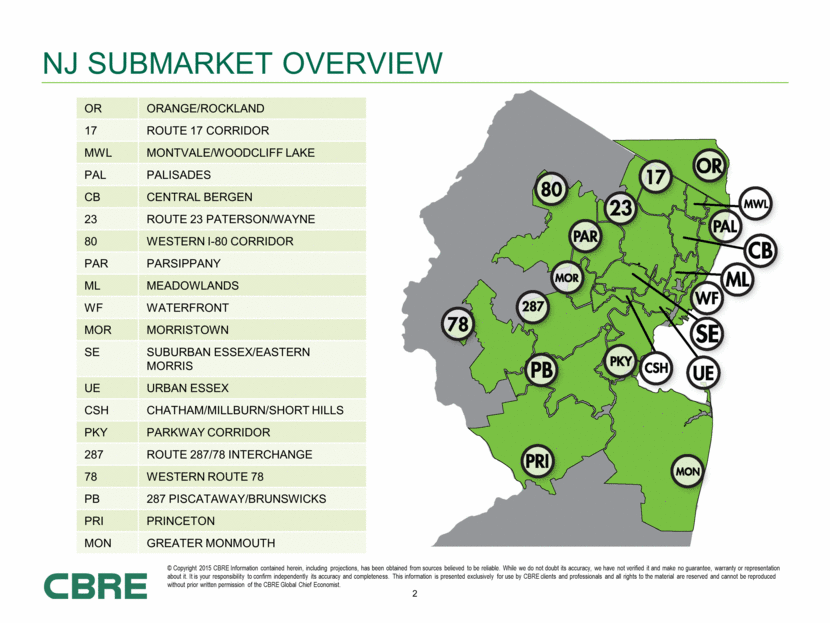
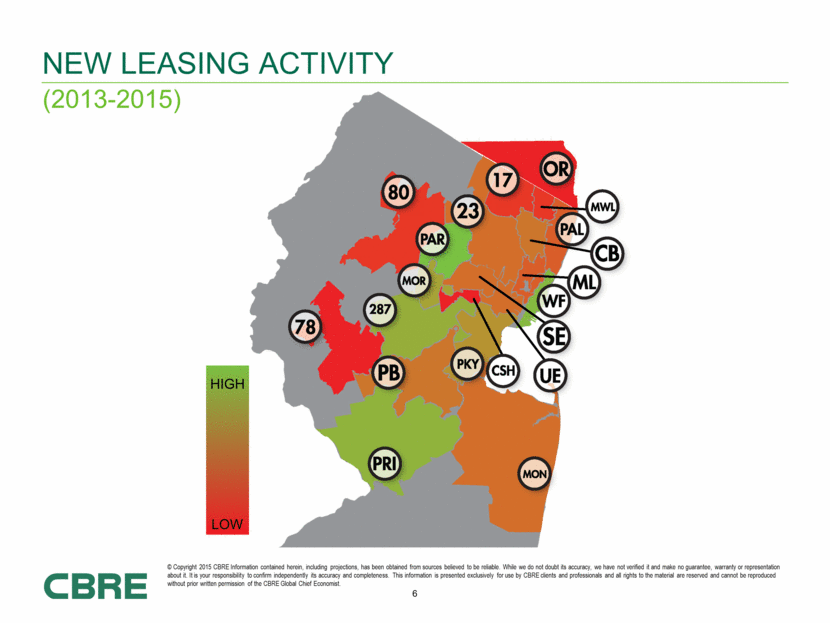
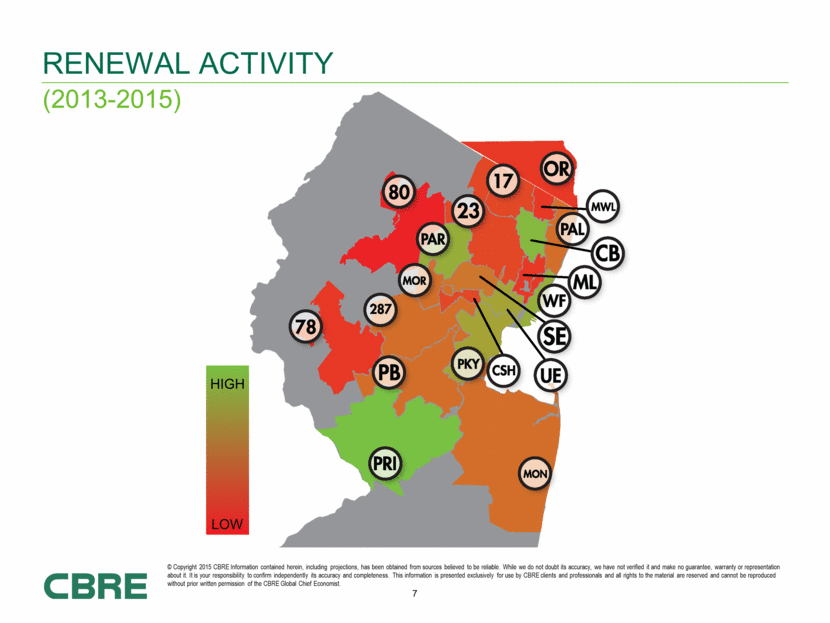
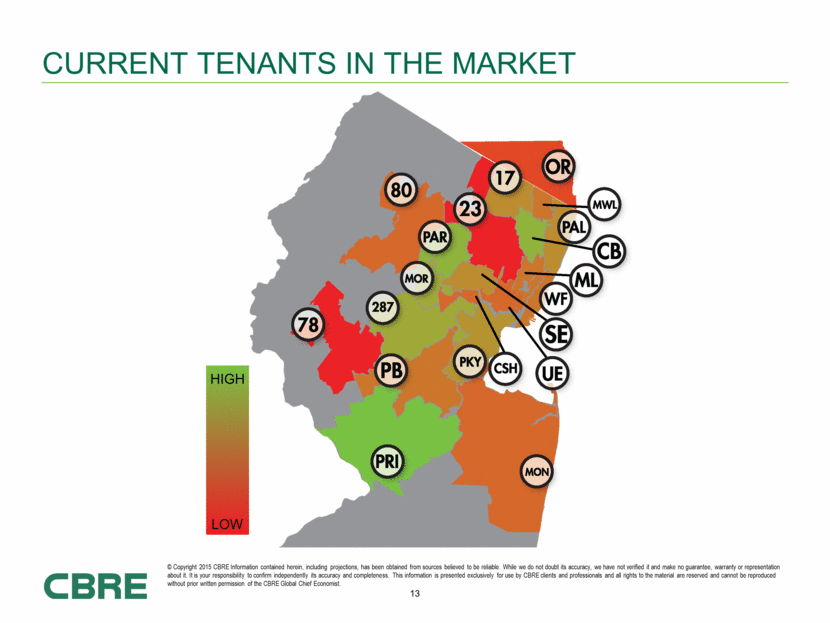
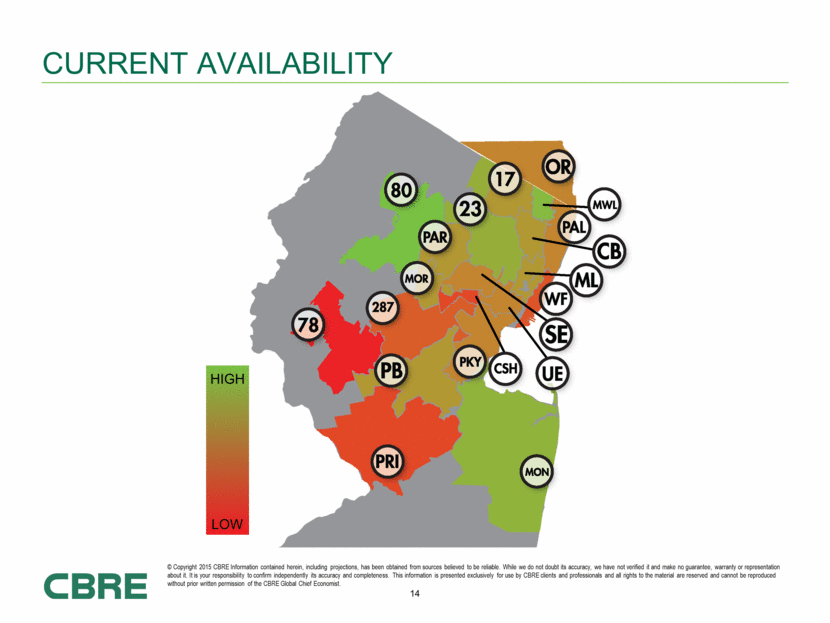
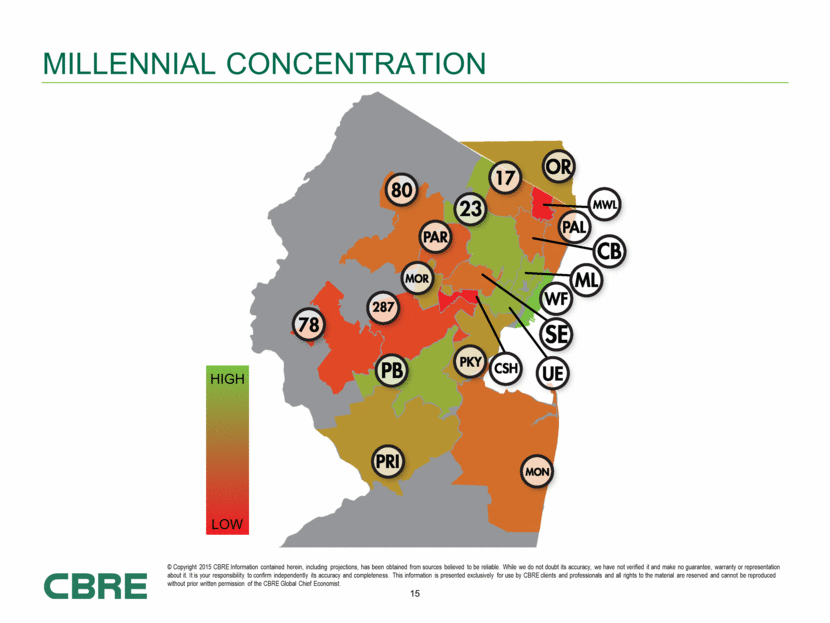
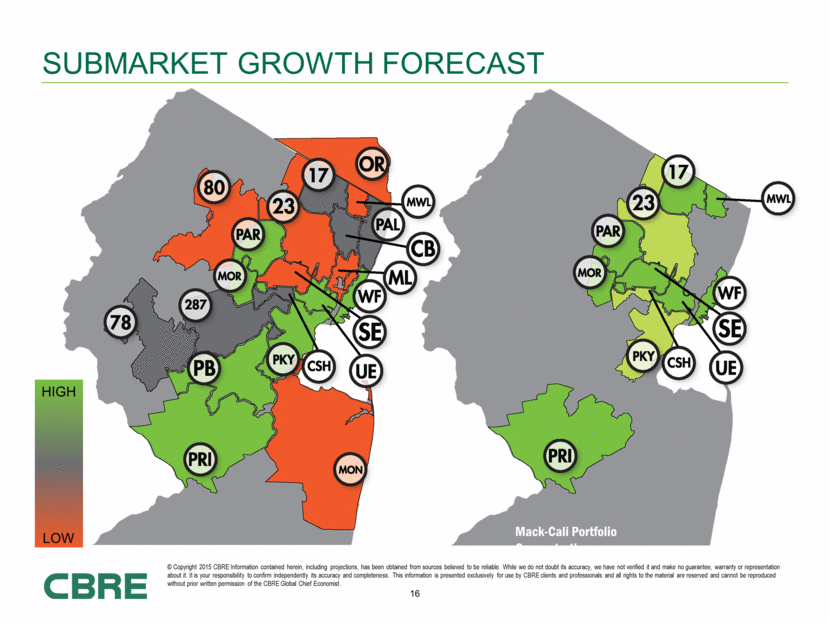
NJ SUBMARKET OVERVIEW OR ORANGE/ROCKLAND 17 ROUTE 17 CORRIDOR MWL MONTVALE/WOODCLIFF LAKE PAL PALISADES CB CENTRAL BERGEN 23 ROUTE 23 PATERSON/WAYNE 80 WESTERN I-80 CORRIDOR PAR PARSIPPANY ML MEADOWLANDS WF WATERFRONT MOR MORRISTOWN SE SUBURBAN ESSEX/EASTERN MORRIS UE URBAN ESSEX CSH CHATHAM/MILLBURN/SHORT HILLS PKY PARKWAY CORRIDOR 287 ROUTE 287/78 INTERCHANGE 78 WESTERN ROUTE 78 PB 287 PISCATAWAY/BRUNSWICKS PRI PRINCETON MON GREATER MONMOUTH © Copyright 2015 CBRE Information contained herein, including projections, has been obtained from sources believed to be reliable. While we do not doubt its accuracy, we have not verified it and make no guarantee, warranty or representation about it. It is your responsibility to confirm independently its accuracy and completeness. This information is presented exclusively for use by CBRE clients and professionals and all rights to the material are reserved and cannot be reproduced without prior written permission of the CBRE Global Chief Economist. |
|
|
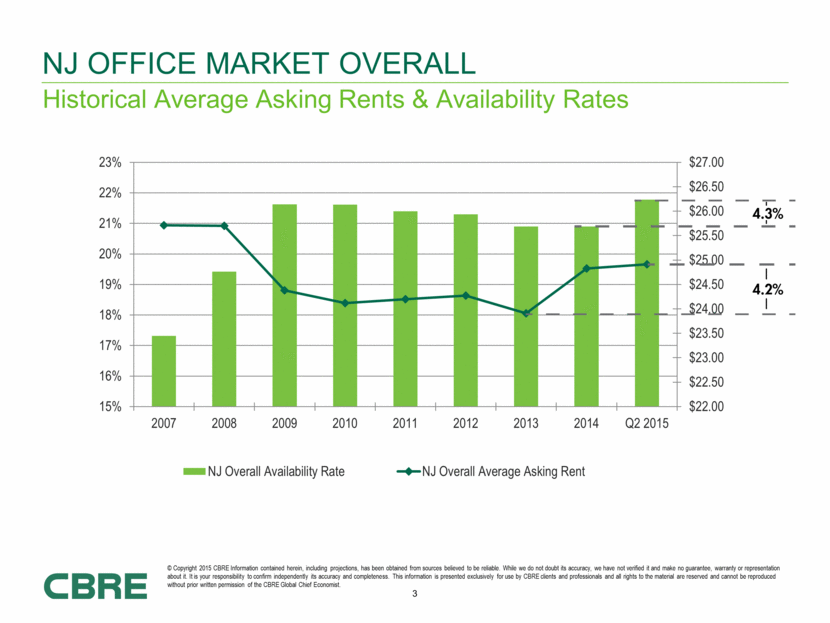
Historical Average Asking Rents & Availability Rates NJ OFFICE market Overall $22.00 $22.50 $23.00 $23.50 $24.00 $24.50 $25.00 $25.50 $26.00 $26.50 $27.00 15% 16% 17% 18% 19% 20% 21% 22% 23% 2007 2008 2009 2010 2011 2012 2013 2014 Q2 2015 NJ Overall Availability Rate NJ Overall Average Asking Rent © Copyright 2015 CBRE Information contained herein, including projections, has been obtained from sources believed to be reliable. While we do not doubt its accuracy, we have not verified it and make no guarantee, warranty or representation about it. It is your responsibility to confirm independently its accuracy and completeness. This information is presented exclusively for use by CBRE clients and professionals and all rights to the material are reserved and cannot be reproduced without prior written permission of the CBRE Global Chief Economist. |
|
|
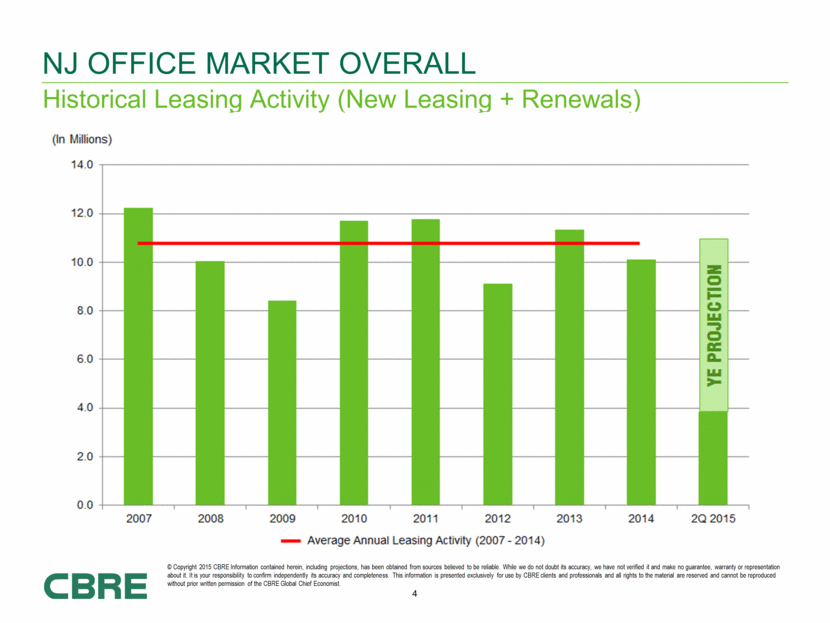
Historical Leasing Activity (New Leasing + Renewals) NJ Office Market Overall © Copyright 2015 CBRE Information contained herein, including projections, has been obtained from sources believed to be reliable. While we do not doubt its accuracy, we have not verified it and make no guarantee, warranty or representation about it. It is your responsibility to confirm independently its accuracy and completeness. This information is presented exclusively for use by CBRE clients and professionals and all rights to the material are reserved and cannot be reproduced without prior written permission of the CBRE Global Chief Economist. |
|
|
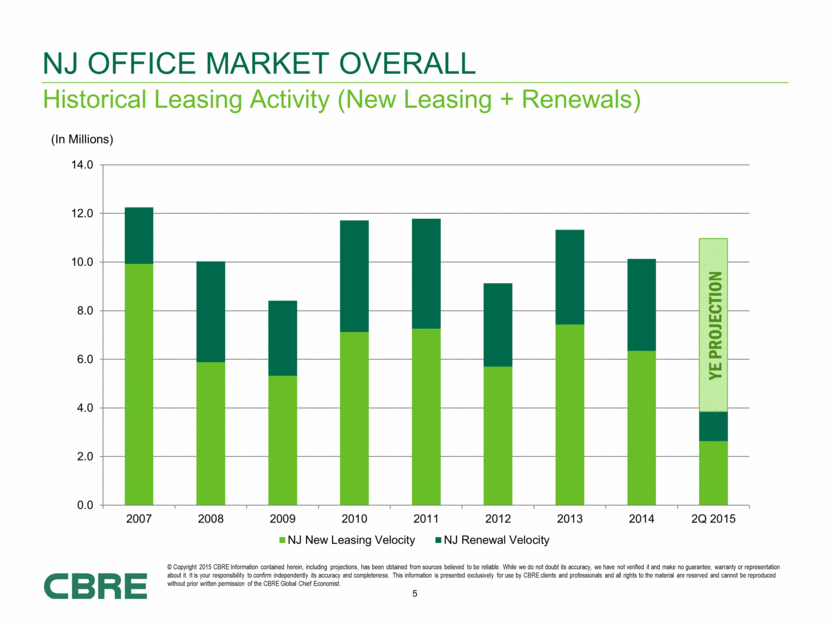
NJ office market Overall (In Millions) Historical Leasing Activity (New Leasing + Renewals) YE PROJECTION 0.0 2.0 4.0 6.0 8.0 10.0 12.0 14.0 2007 2008 2009 2010 2011 2012 2013 2014 2Q 2015 NJ New Leasing Velocity NJ Renewal Velocity © Copyright 2015 CBRE Information contained herein, including projections, has been obtained from sources believed to be reliable. While we do not doubt its accuracy, we have not verified it and make no guarantee, warranty or representation about it. It is your responsibility to confirm independently its accuracy and completeness. This information is presented exclusively for use by CBRE clients and professionals and all rights to the material are reserved and cannot be reproduced without prior written permission of the CBRE Global Chief Economist. |
|
|
new Leasing Activity HIGH LOW (2013-2015) © Copyright 2015 CBRE Information contained herein, including projections, has been obtained from sources believed to be reliable. While we do not doubt its accuracy, we have not verified it and make no guarantee, warranty or representation about it. It is your responsibility to confirm independently its accuracy and completeness. This information is presented exclusively for use by CBRE clients and professionals and all rights to the material are reserved and cannot be reproduced without prior written permission of the CBRE Global Chief Economist. |
|
|
Renewal Activity (2013-2015) HIGH LOW © Copyright 2015 CBRE Information contained herein, including projections, has been obtained from sources believed to be reliable. While we do not doubt its accuracy, we have not verified it and make no guarantee, warranty or representation about it. It is your responsibility to confirm independently its accuracy and completeness. This information is presented exclusively for use by CBRE clients and professionals and all rights to the material are reserved and cannot be reproduced without prior written permission of the CBRE Global Chief Economist. |
|
|
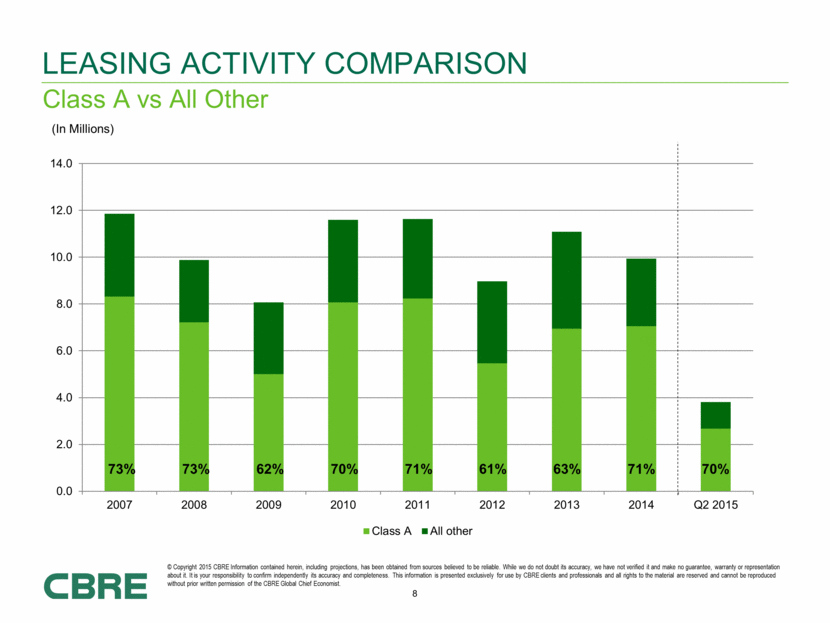
Class A vs All Other Leasing activity comparison (In Millions) 73% 73% 62% 70% 71% 61% 63% 71% 70% 0.0 2.0 4.0 6.0 8.0 10.0 12.0 14.0 2007 2008 2009 2010 2011 2012 2013 2014 Q2 2015 Class A All other © Copyright 2015 CBRE Information contained herein, including projections, has been obtained from sources believed to be reliable. While we do not doubt its accuracy, we have not verified it and make no guarantee, warranty or representation about it. It is your responsibility to confirm independently its accuracy and completeness. This information is presented exclusively for use by CBRE clients and professionals and all rights to the material are reserved and cannot be reproduced without prior written permission of the CBRE Global Chief Economist. |
|
|
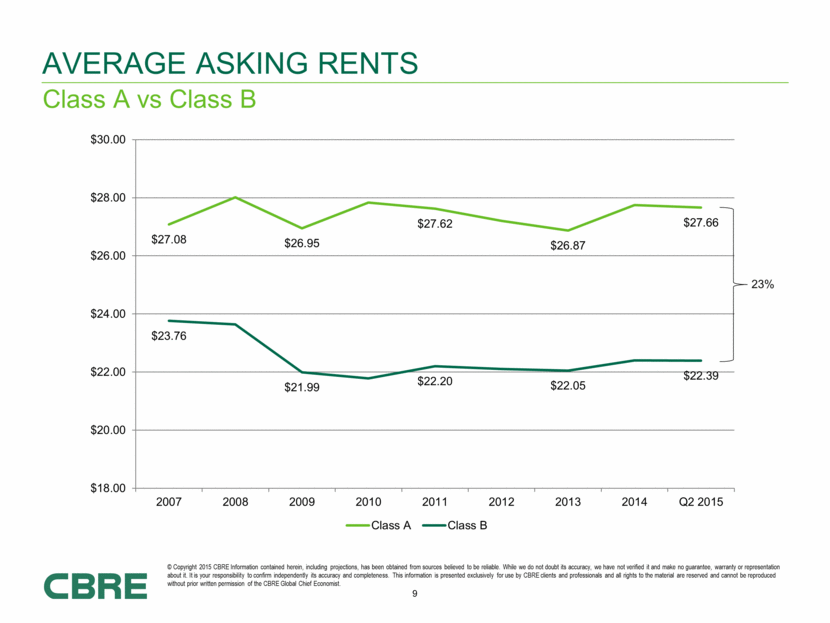
Class A vs Class B Average Asking Rents 23% $27.08 $26.95 $27.62 $26.87 $27.66 $23.76 $21.99 $22.20 $22.05 $22.39 $18.00 $20.00 $22.00 $24.00 $26.00 $28.00 $30.00 2007 2008 2009 2010 2011 2012 2013 2014 Q2 2015 Class A Class B © Copyright 2015 CBRE Information contained herein, including projections, has been obtained from sources believed to be reliable. While we do not doubt its accuracy, we have not verified it and make no guarantee, warranty or representation about it. It is your responsibility to confirm independently its accuracy and completeness. This information is presented exclusively for use by CBRE clients and professionals and all rights to the material are reserved and cannot be reproduced without prior written permission of the CBRE Global Chief Economist. |
|
|
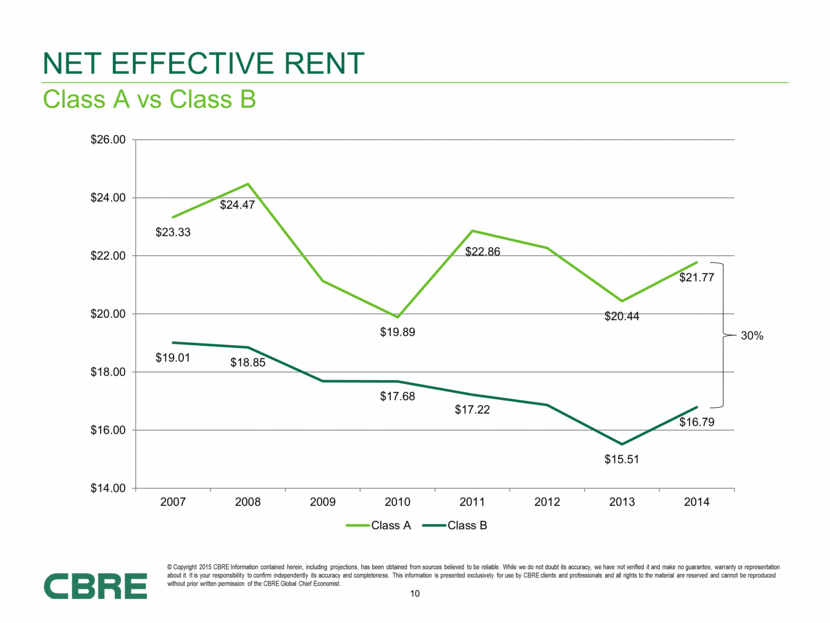
Class A vs Class B NET EFFECTIVE RENT 30% $23.33 $24.47 $19.89 $22.86 $20.44 $21.77 $19.01 $18.85 $17.68 $17.22 $15.51 $16.79 $14.00 $16.00 $18.00 $20.00 $22.00 $24.00 $26.00 2007 2008 2009 2010 2011 2012 2013 2014 Class A Class B © Copyright 2015 CBRE Information contained herein, including projections, has been obtained from sources believed to be reliable. While we do not doubt its accuracy, we have not verified it and make no guarantee, warranty or representation about it. It is your responsibility to confirm independently its accuracy and completeness. This information is presented exclusively for use by CBRE clients and professionals and all rights to the material are reserved and cannot be reproduced without prior written permission of the CBRE Global Chief Economist. |
|
|
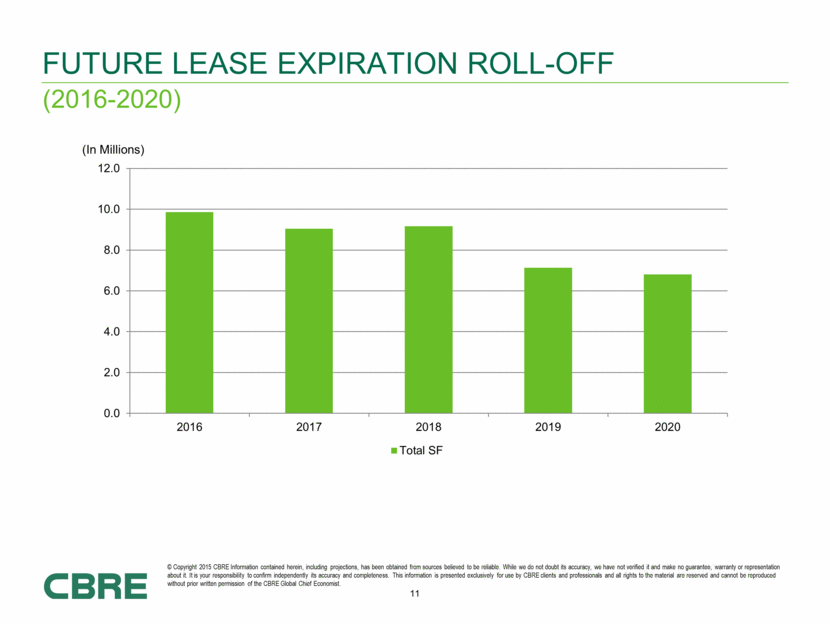
(2016-2020) Future LEASE EXPIRATION ROLL-OFF (In Millions) 0.0 2.0 4.0 6.0 8.0 10.0 12.0 2016 2017 2018 2019 2020 Total SF © Copyright 2015 CBRE Information contained herein, including projections, has been obtained from sources believed to be reliable. While we do not doubt its accuracy, we have not verified it and make no guarantee, warranty or representation about it. It is your responsibility to confirm independently its accuracy and completeness. This information is presented exclusively for use by CBRE clients and professionals and all rights to the material are reserved and cannot be reproduced without prior written permission of the CBRE Global Chief Economist. |
|
|
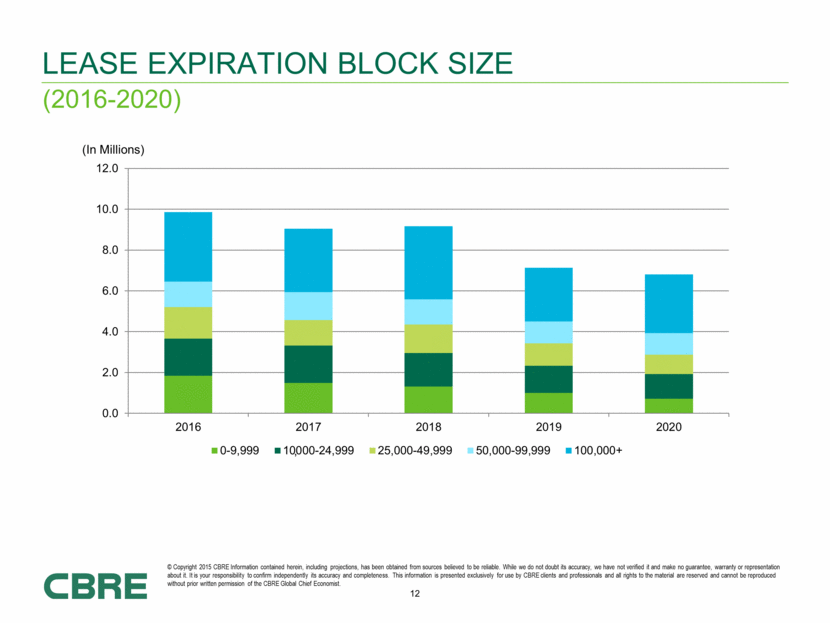
, (2016-2020) LEASE EXPIRATION Block Size (In Millions) 0.0 2.0 4.0 6.0 8.0 10.0 12.0 2016 2017 2018 2019 2020 0-9,999 10000-24,999 25,000-49,999 50,000-99,999 100,000+ © Copyright 2015 CBRE Information contained herein, including projections, has been obtained from sources believed to be reliable. While we do not doubt its accuracy, we have not verified it and make no guarantee, warranty or representation about it. It is your responsibility to confirm independently its accuracy and completeness. This information is presented exclusively for use by CBRE clients and professionals and all rights to the material are reserved and cannot be reproduced without prior written permission of the CBRE Global Chief Economist. |
|
|
Current TENANTS IN THE MARKET HIGH LOW © Copyright 2015 CBRE Information contained herein, including projections, has been obtained from sources believed to be reliable. While we do not doubt its accuracy, we have not verified it and make no guarantee, warranty or representation about it. It is your responsibility to confirm independently its accuracy and completeness. This information is presented exclusively for use by CBRE clients and professionals and all rights to the material are reserved and cannot be reproduced without prior written permission of the CBRE Global Chief Economist. |
|
|
Current availability HIGH LOW © Copyright 2015 CBRE Information contained herein, including projections, has been obtained from sources believed to be reliable. While we do not doubt its accuracy, we have not verified it and make no guarantee, warranty or representation about it. It is your responsibility to confirm independently its accuracy and completeness. This information is presented exclusively for use by CBRE clients and professionals and all rights to the material are reserved and cannot be reproduced without prior written permission of the CBRE Global Chief Economist. |
|
|
Millennial Concentration HIGH LOW © Copyright 2015 CBRE Information contained herein, including projections, has been obtained from sources believed to be reliable. While we do not doubt its accuracy, we have not verified it and make no guarantee, warranty or representation about it. It is your responsibility to confirm independently its accuracy and completeness. This information is presented exclusively for use by CBRE clients and professionals and all rights to the material are reserved and cannot be reproduced without prior written permission of the CBRE Global Chief Economist. |
|
|
Submarket Growth FOrecast HIGH LOW Mack-Cali Portfolio Concentration © Copyright 2015 CBRE Information contained herein, including projections, has been obtained from sources believed to be reliable. While we do not doubt its accuracy, we have not verified it and make no guarantee, warranty or representation about it. It is your responsibility to confirm independently its accuracy and completeness. This information is presented exclusively for use by CBRE clients and professionals and all rights to the material are reserved and cannot be reproduced without prior written permission of the CBRE Global Chief Economist. |
|
|
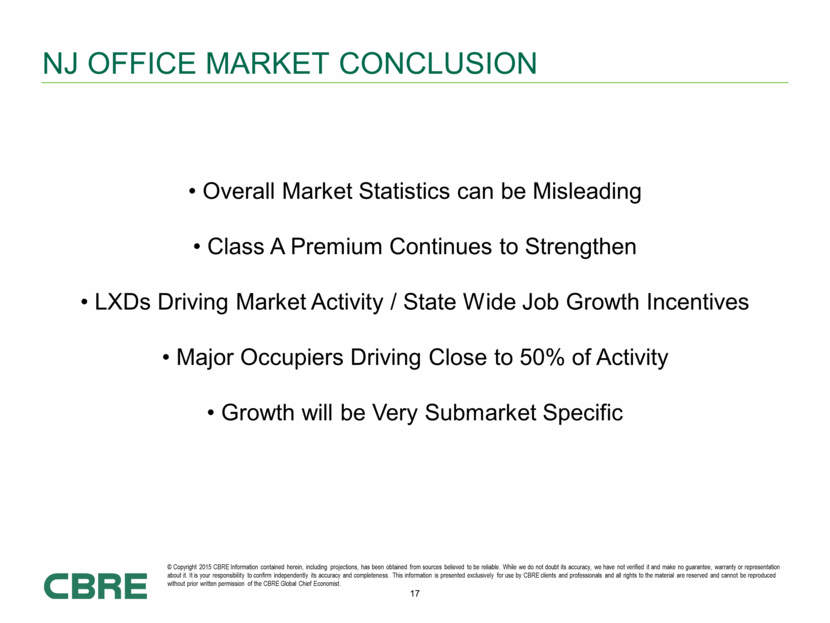
Nj office market Conclusion • Overall Market Statistics can be Misleading • Class A Premium Continues to Strengthen • LXDs Driving Market Activity / State Wide Job Growth Incentives • Major Occupiers Driving Close to 50% of Activity • Growth will be Very Submarket Specific © Copyright 2015 CBRE Information contained herein, including projections, has been obtained from sources believed to be reliable. While we do not doubt its accuracy, we have not verified it and make no guarantee, warranty or representation about it. It is your responsibility to confirm independently its accuracy and completeness. This information is presented exclusively for use by CBRE clients and professionals and all rights to the material are reserved and cannot be reproduced without prior written permission of the CBRE Global Chief Economist. |
|
|
NJ OFFICE MARKET OVERVIEW Jeff Hipschman, Senior Managing Director September 10, 2015 |
|
|
Peter Turchin, CBRE Waterfront |
|
|
[LOGO] |
|
|
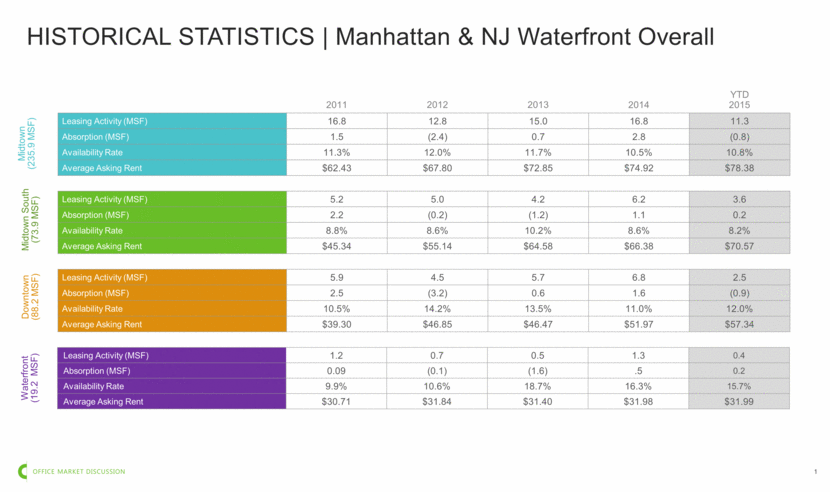
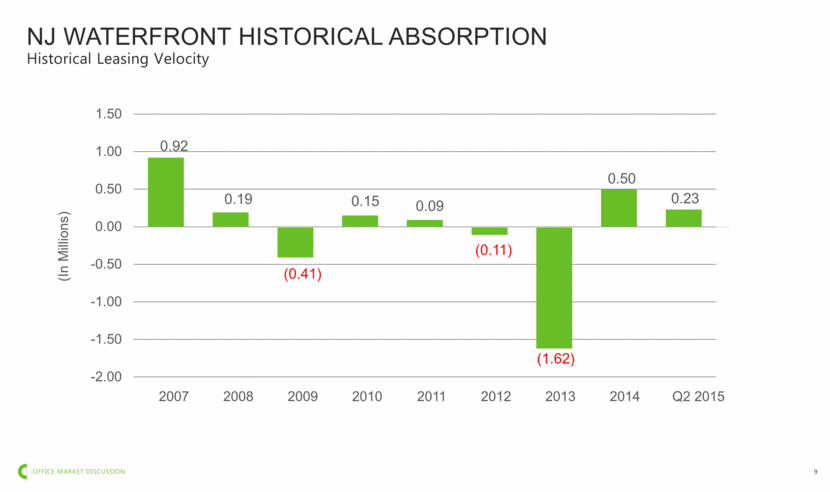
HISTORICAL STATISTICS Manhattan & NJ Waterfront Overall Waterfront (19.2 MSF) Leasing Activity (MSF) 1.2 0.7 0.5 1.3 0.4 Absorption (MSF) 0.09 (0.1) (1.6) .5 0.2 Availability Rate 9.9% 10.6% 18.7% 16.3% 15.7% Average Asking Rent $30.71 $31.84 $31.40 $31.98 $31.99 2011 2012 2013 2014 YTD 2015 Leasing Activity (MSF) 16.8 12.8 15.0 16.8 11.3 Absorption (MSF) 1.5 (2.4) 0.7 2.8 (0.8) Availability Rate 11.3% 12.0% 11.7% 10.5% 10.8% Average Asking Rent $62.43 $67.80 $72.85 $74.92 $78.38 Midtown (235.9 MSF) Leasing Activity (MSF) 5.2 5.0 4.2 6.2 3.6 Absorption (MSF) 2.2 (0.2) (1.2) 1.1 0.2 Availability Rate 8.8% 8.6% 10.2% 8.6% 8.2% Average Asking Rent $45.34 $55.14 $64.58 $66.38 $70.57 Midtown South (73.9 MSF) Leasing Activity (MSF) 5.9 4.5 5.7 6.8 2.5 Absorption (MSF) 2.5 (3.2) 0.6 1.6 (0.9) Availability Rate 10.5% 14.2% 13.5% 11.0% 12.0% Average Asking Rent $39.30 $46.85 $46.47 $51.97 $57.34 Downtown (88.2 MSF) |
|
|
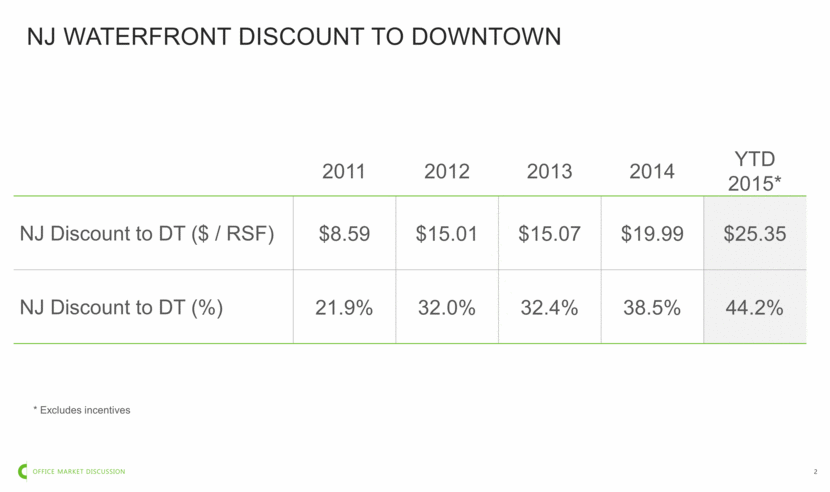
NJ WATERFRONT DISCOUNT TO DOWNTOWN 2011 2012 2013 2014 YTD 2015* NJ Discount to DT ($ / RSF) $8.59 $15.01 $15.07 $19.99 $25.35 NJ Discount to DT (%) 21.9% 32.0% 32.4% 38.5% 44.2% * Excludes incentives |
|
|
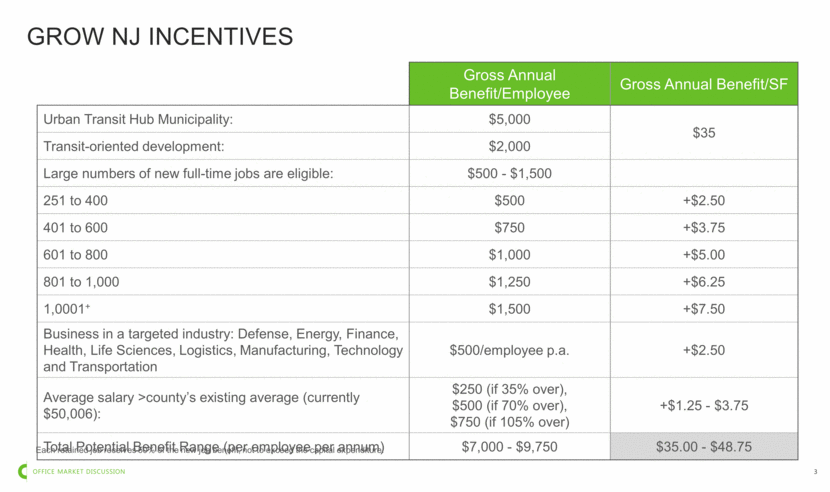
GROW NJ INCENTIVES Gross Annual Benefit/Employee Gross Annual Benefit/SF Urban Transit Hub Municipality: $5,000 $35 Transit-oriented development: $2,000 Large numbers of new full-time jobs are eligible: $500 - $1,500 251 to 400 $500 +$2.50 401 to 600 $750 +$3.75 601 to 800 $1,000 +$5.00 801 to 1,000 $1,250 +$6.25 1,0001+ $1,500 +$7.50 Business in a targeted industry: Defense, Energy, Finance, Health, Life Sciences, Logistics, Manufacturing, Technology and Transportation $500/employee p.a. +$2.50 Average salary >county’s existing average (currently $50,006): $250 (if 35% over), $500 (if 70% over), $750 (if 105% over) +$1.25 - $3.75 Total Potential Benefit Range (per employee per annum) $7,000 - $9,750 $35.00 - $48.75 Each retained job receives 50% of the new job benefit, not to exceed the capital expenditure. |
|
|
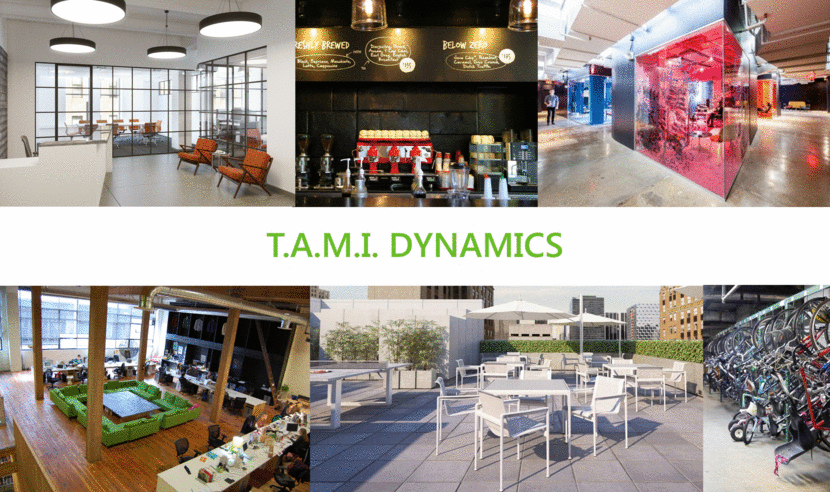
PAGE 4 T.A.M.I. DYNAMICS |
|
|
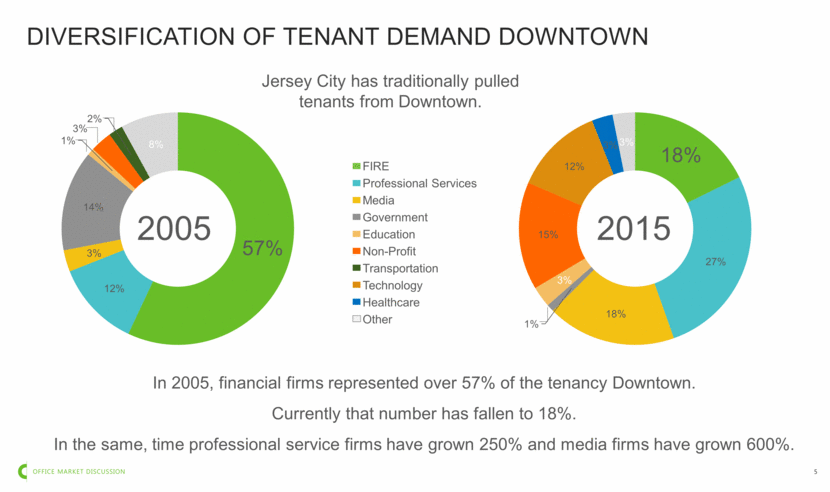
DIVERSIFICATION OF TENANT DEMAND DOWNTOWN In 2005, financial firms represented over 57% of the tenancy Downtown. Currently that number has fallen to 18%. In the same, time professional service firms have grown 250% and media firms have grown 600%. 2005 2015 FIRE Professional Services Media Government Education Non-Profit Transportation Other Technology Healthcare Jersey City has traditionally pulled tenants from Downtown. 57% 12% 3% 14% 1% 3% 2% 8% 18% 27% 18% 1% 3% 15% 12% 3% 3% |
|
|
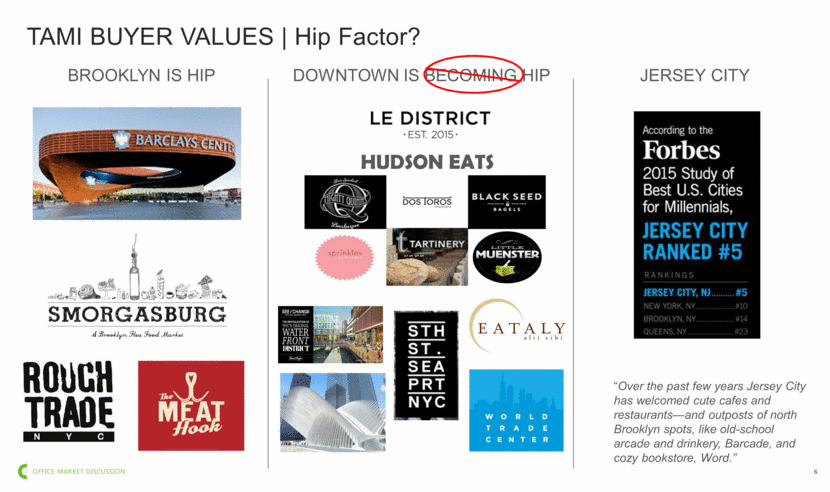
TAMI BUYER VALUES Hip Factor? BROOKLYN IS HIP DOWNTOWN IS BECOMING HIP JERSEY CITY HUDSON EATS “Over the past few years Jersey City has welcomed cute cafes and restaurants—and outposts of north Brooklyn spots, like old-school arcade and drinkery, Barcade, and cozy bookstore, Word.” |
|
|
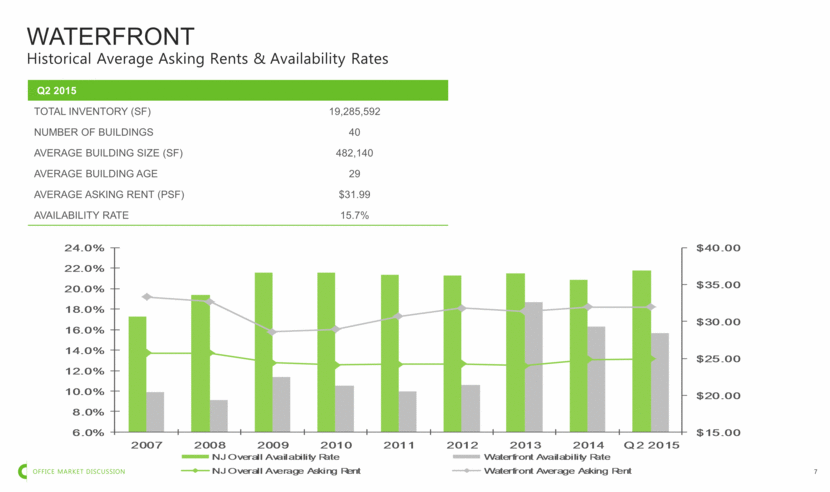
WATERFRONT Historical Average Asking Rents & Availability Rates Q2 2015 TOTAL INVENTORY (SF) 19,285,592 NUMBER OF BUILDINGS 40 AVERAGE BUILDING SIZE (SF) 482,140 AVERAGE BUILDING AGE 29 AVERAGE ASKING RENT (PSF) $31.99 AVAILABILITY RATE 15.7% $15.00 $20.00 $25.00 $30.00 $35.00 $40.00 6.0% 8.0% 10.0% 12.0% 14.0% 16.0% 18.0% 20.0% 22.0% 24.0% 2007 2008 2009 2010 2011 2012 2013 2014 Q2 2015 NJ Overall Availability Rate Waterfront Availability Rate NJ Overall Average Asking Rent Waterfront Average Asking Rent |
|
|
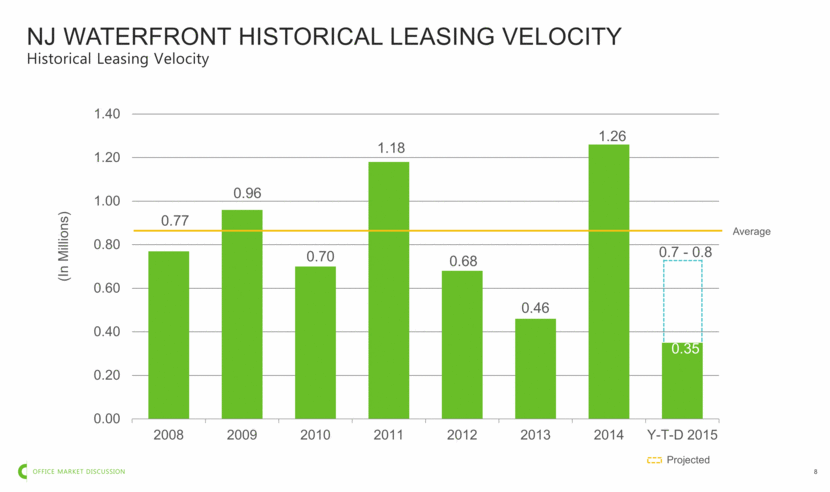
NJ WATERFRONT HISTORICAL LEASING VELOCITY Historical Leasing Velocity (In Millions) 0.35 1.26 0.46 0.68 1.18 0.70 0.96 0.77 0.7 - 0.8 Projected Average 0.00 0.20 0.40 0.60 0.80 1.00 1.20 1.40 2008 2009 2010 2011 2012 2013 2014 Y-T-D 2015 |
|
|
NJ WATERFRONT HISTORICAL ABSORPTION Historical Leasing Velocity (In Millions) 0.35 1.26 0.23 0.50 0.09 0.15 (0.41) 0.19 0.92 (0.11) (1.62) 2007 2008 2009 2010 2011 2012 2013 2014 Q2 2015 -2.00 -1.50 -1.00 -0.50 0.00 0.50 1.00 1.50 |
|
|
Capital Markets Jose Cruz, HFF |
|
|
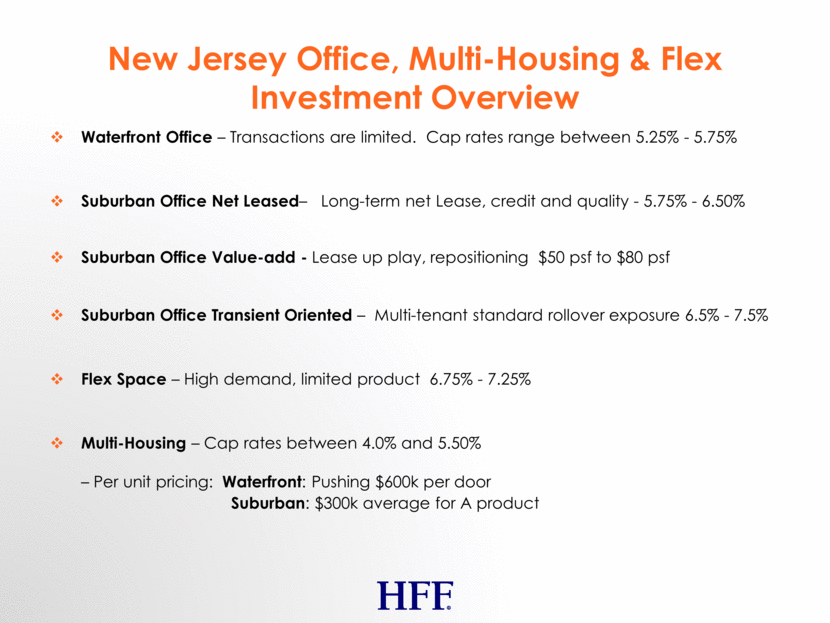
New Jersey Office, Multi-Housing & Flex Investment Overview Waterfront Office – Transactions are limited. Cap rates range between 5.25% - 5.75% Suburban Office Net Leased– Long-term net Lease, credit and quality - 5.75% - 6.50% Suburban Office Value-add - Lease up play, repositioning $50 psf to $80 psf Suburban Office Transient Oriented – Multi-tenant standard rollover exposure 6.5% - 7.5% Flex Space – High demand, limited product 6.75% - 7.25% Multi-Housing – Cap rates between 4.0% and 5.50% – Per unit pricing: Waterfront: Pushing $600k per door Suburban: $300k average for A product |

