Attached files
| file | filename |
|---|---|
| 8-K - 8-K - IRON MOUNTAIN INC | a15-19249_18k.htm |
| EX-99.2 - EX-99.2 - IRON MOUNTAIN INC | a15-19249_1ex99d2.htm |
Exhibit 99.1
|
|
Iron Mountain Investor Update J.P. Morgan 6th Annual U.S. All Stars Conference September 2015 |
|
|
Forward Looking Statements 2 Certain statements contained in this communication may constitute “forward-looking statements” within the meaning of the Private Securities Litigation Reform Act of 1995. These statements include, but are not limited to, the projections, the synergies and statements regarding our operations, economic performance, financial condition, goals, beliefs, future growth strategies, investment objectives, plans and current expectations, including anticipated 2015 investments and targeted internal rates of return, the opportunity to create value by acquiring leased space, the estimated range of our dividends, the expected timing of the transaction and the completion of the potential Scheme of Arrangement with Recall Holdings Limited (“Recall”), the benefits of the potential Scheme of Arrangement, including anticipated future financial and operating results, potential synergies, timing to realize synergies, Recall’s and Iron Mountain’s anticipated dividend payments, expectations relating to future equity and debt issuances by Iron Mountain and the combined company’s plans, objectives, expectations and other statements that are not historical facts. Such statements are based on the views and assumptions of the management of Iron Mountain and are subject to significant risks and uncertainties. Actual future events or results may differ materially from these statements. Such differences may result from the following factors: (i) our expected dividends may be materially different from our estimates; (ii) the cost to comply with current and future laws, regulations and customer demands relating to privacy issues; (iii) the impact of litigation or disputes that may arise in connection with incidents in which we fail to protect our customers' information; (iv) changes in the price for our storage and information management services relative to the cost of providing such storage and information management services; (v) changes in customer preferences and demand for our storage and information management services; (vi) the adoption of alternative technologies and shifts by our customers to storage of data through non-paper based technologies; (vii) the cost or potential liabilities associated with real estate necessary for our business; (viii) the performance of business partners upon whom we depend for technical assistance or management expertise outside the U.S.; (ix) changes in the political and economic environments in the countries in which our international subsidiaries operate; (x) claims that our technology violates the intellectual property rights of a third party; (xi) changes in the cost of our debt; (xii) the impact of alternative, more attractive investments on dividends; (xiii) our ability to qualify or remain qualified for taxation as a real estate investment trust (“REIT”); (xiv) our ability or inability to complete acquisitions on satisfactory terms and to integrate acquired companies efficiently; (xv) the ability to close the transaction with Recall on the terms and within the anticipated time period, or at all, which is dependent on the parties’ ability to satisfy certain closing conditions, including the receipt of governmental approvals; (xvi) the risk that the benefits of the potential transaction with Recall, including potential cost synergies and other synergies (including tax synergies), may not be fully realized or may take longer to realize than expected; (xvii) the impact of the transaction with Recall on third-party relationships; (xviii) actions taken by either Iron Mountain or Recall; and (xix) changes in regulatory, social and political conditions, as well as general economic conditions. Additional risks and factors that may affect results are set forth in Iron Mountain’s filings with the Securities and Exchange Commission (“SEC”), including Iron Mountain’s Annual Report on Form 10-K for the fiscal year ending December 31, 2014, and Recall’s filings with the Australian Stock Exchange (“ASX”), including Recall’s Annual Report for the fiscal year ending June 30, 2015; Iron Mountain’s current report on Form 8-K, filed with the SEC on May 7, 2015 and Iron Mountain’s quarterly report on From 10-Q filed with the SEC on July 30, 2015. Important Information and Where to Find It Iron Mountain has filed with the Securities and Exchange Commission (the “SEC”) a proxy statement in connection with the approval of the issuance of Iron Mountain common stock to Recall shareholders. Equivalent information will be included in the scheme booklet that Recall will prepare and, following approval from the Australian Court, dispatch to its shareholders in connection with the scheme meeting at which Recall shareholders will consider whether or not to support the acquisition of Recall by Iron Mountain by way of scheme of arrangement. INVESTORS AND SECURITY HOLDERS ARE URGED TO READ THE PROXY STATEMENT AND ANY OTHER RELEVANT DOCUMENTS, IF AND WHEN THEY BECOME AVAILABLE, BECAUSE THEY WILL CONTAIN IMPORTANT INFORMATION ABOUT IRON MOUNTAIN, RECALL, THE SCHEME IMPLEMENTATION DEED AND THE SCHEME OF ARRANGEMENT. Investors and security holders will be able to obtain these materials (if and when they are available) and other documents filed by Iron Mountain with the SEC free of charge at the SEC’s website, www.sec.gov, and those documents released by Recall to the Australian Securities Exchange (ASX) announcements platform free of charge at ASX's website, www.asx.com.au. In addition, stockholders will be able to obtain copies of the proxy statement and other documents filed with the SEC from Iron Mountain’s website at www.ironmountain.com or by directing such request to Iron Mountain at Iron Mountain Incorporated, One Federal Street, Boston, Massachusetts 02110, Attention: Investor Relations Participants in Potential Solicitation Iron Mountain and certain of its respective directors, executive officers and other persons may be deemed to be participants in the anticipated solicitation of proxies in respect of the vote that would be required by Iron Mountain’s shareholders in connection with the issuance of Iron Mountain common stock as contemplated by the Scheme Implementation Deed. Information regarding Iron Mountain’s directors and executive officers is available in Iron Mountain’s proxy statement filed with the SEC on April 13, 2015 in connection with its 2015 annual meeting of stockholders. Other information regarding persons who may be deemed participants in the proxy solicitation and a description of their direct and indirect interests, by security holdings or otherwise, will be contained in the proxy statement and other relevant materials to be filed with the SEC. |
|
|
Strong Growth in Standalone Cash Flow Plus Opportunity from Recall Acquisition 3 Continuing to strengthen cash available for distribution and growth investment (CAD) 2015 CAD covers dividend with excess cash to deliver organic Records Management growth of 2% Transformation (frmr. Speed & Agility) program of $100M+ over 3 years well on track Actions in July will improve Q4'15 overhead exit rate and deliver $50 mm of full year benefit in 2016; related charge to be recognized in Q3’15 2016 standalone IRM CAD represents 15% growth over 2015 Additional benefit from maintaining service gross margin in 2015, with further improvement in 2016 Transformation program plus Recall acquisition support de-leveraging and generate strong CAD growth in 2016 and beyond 2017 CAD expected to be approximately $800 million (~70% increase over 2015 level) |
|
|
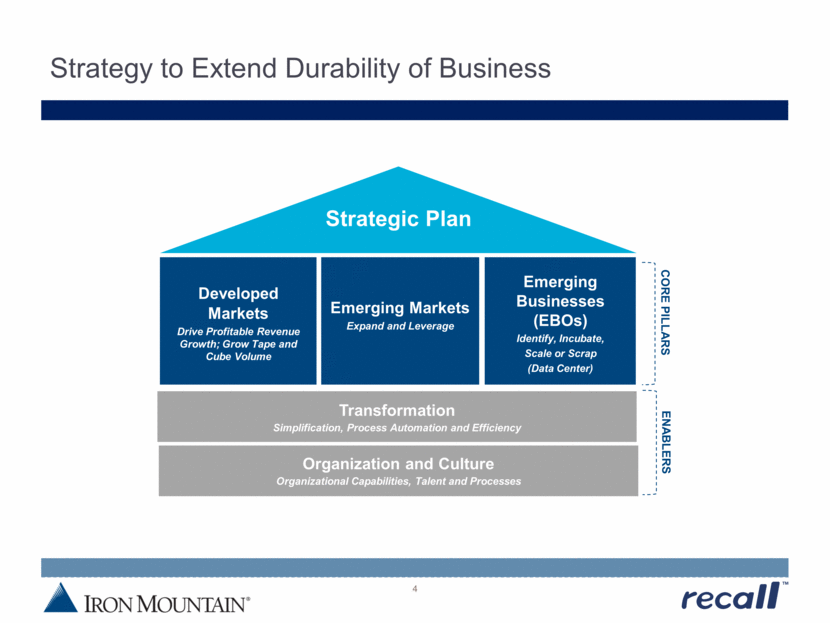
Strategy to Extend Durability of Business 4 Transformation Simplification, Process Automation and Efficiency t Developed Markets Drive Profitable Revenue Growth; Grow Tape and Cube Volume Strategic Plan Emerging Markets Expand and Leverage Emerging Businesses (EBOs) Identify, Incubate, Scale or Scrap (Data Center) Organization and Culture Organizational Capabilities, Talent and Processes CORE PILLARS ENABLERS |
|
|
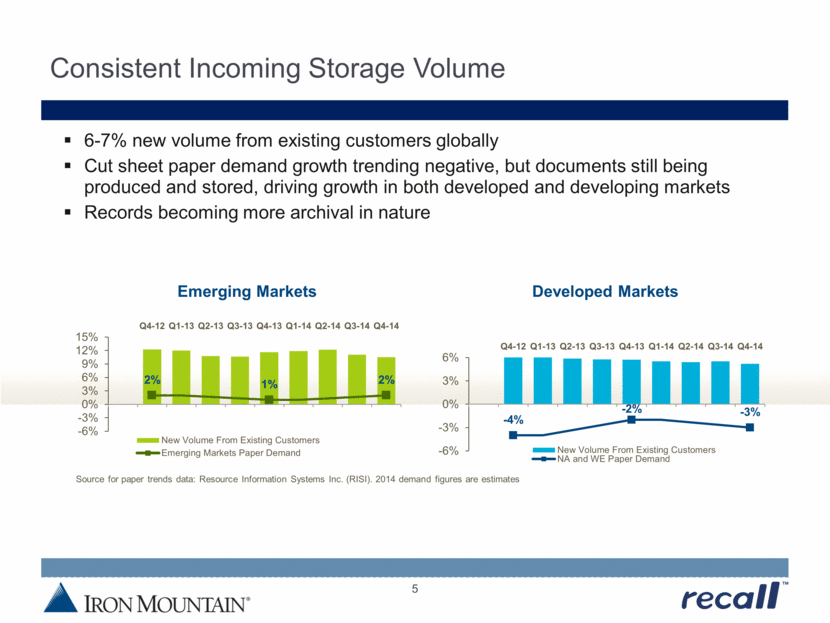
Consistent Incoming Storage Volume 5 6-7% new volume from existing customers globally Cut sheet paper demand growth trending negative, but documents still being produced and stored, driving growth in both developed and developing markets Records becoming more archival in nature Developed Markets Emerging Markets Source for paper trends data: Resource Information Systems Inc. (RISI). 2014 demand figures are estimates - 4% - 2% - 3% -6% -3% 0% 3% 6% Q4-12 Q1-13 Q2-13 Q3-13 Q4-13 Q1-14 Q2-14 Q3-14 Q4-14 New Volume From Existing Customers NA and WE Paper Demand 2% 1% 2% -6% -3% 0% 3% 6% 9% 12% 15% Q4-12 Q1-13 Q2-13 Q3-13 Q4-13 Q1-14 Q2-14 Q3-14 Q4-14 New Volume From Existing Customers Emerging Markets Paper Demand |
|
|
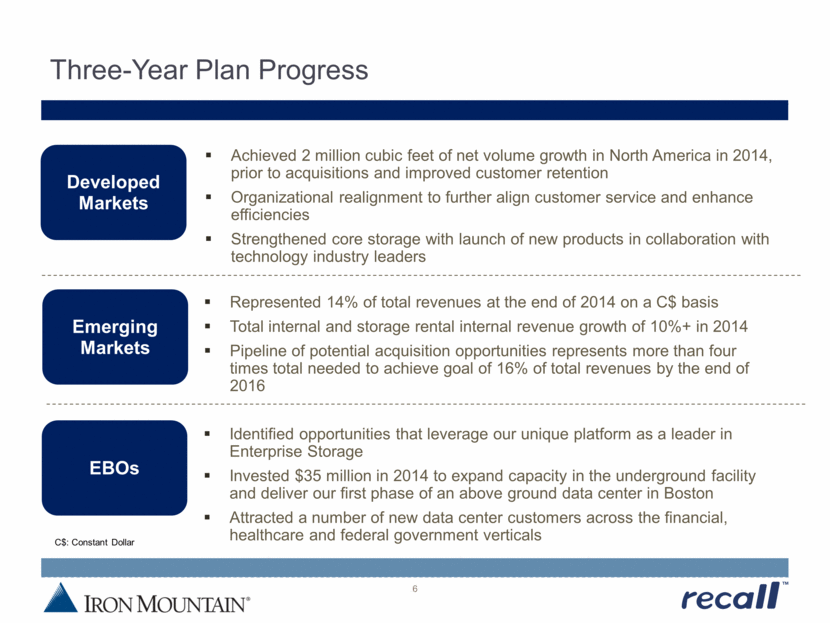
Three-Year Plan Progress 6 Achieved 2 million cubic feet of net volume growth in North America in 2014, prior to acquisitions and improved customer retention Organizational realignment to further align customer service and enhance efficiencies Strengthened core storage with launch of new products in collaboration with technology industry leaders Developed Markets Represented 14% of total revenues at the end of 2014 on a C$ basis Total internal and storage rental internal revenue growth of 10%+ in 2014 Pipeline of potential acquisition opportunities represents more than four times total needed to achieve goal of 16% of total revenues by the end of 2016 Identified opportunities that leverage our unique platform as a leader in Enterprise Storage Invested $35 million in 2014 to expand capacity in the underground facility and deliver our first phase of an above ground data center in Boston Attracted a number of new data center customers across the financial, healthcare and federal government verticals Emerging Markets EBOs C$: Constant Dollar |
|
|
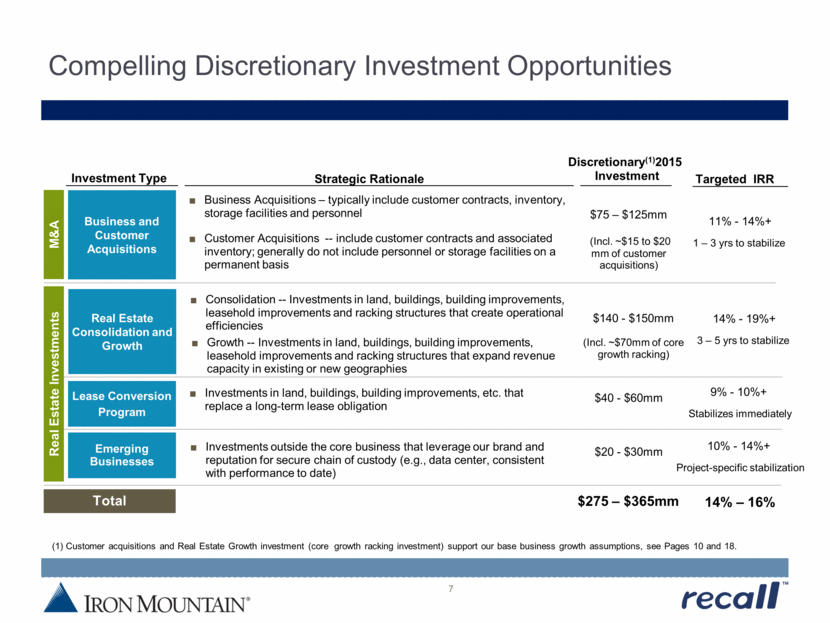
Compelling Discretionary Investment Opportunities 7 Business Acquisitions – typically include customer contracts, inventory, storage facilities and personnel Customer Acquisitions -- include customer contracts and associated inventory; generally do not include personnel or storage facilities on a permanent basis Consolidation -- Investments in land, buildings, building improvements, leasehold improvements and racking structures that create operational efficiencies Investments in land, buildings, building improvements, etc. that replace a long-term lease obligation Investments outside the core business that leverage our brand and reputation for secure chain of custody (e.g., data center, consistent with performance to date) Investment Type Strategic Rationale Business and Customer Acquisitions Real Estate Consolidation and Growth Lease Conversion Program Emerging Businesses Discretionary(1)2015 Investment $75 – $125mm (Incl. ~$15 to $20 mm of customer acquisitions) $40 - $60mm $20 - $30mm Real Estate Investments M&A Total $275 – $365mm Growth -- Investments in land, buildings, building improvements, leasehold improvements and racking structures that expand revenue capacity in existing or new geographies $140 - $150mm (Incl. ~$70mm of core growth racking) (1) Customer acquisitions and Real Estate Growth investment (core growth racking investment) support our base business growth assumptions, see Pages 10 and 18. 11% - 14%+ 1 – 3 yrs to stabilize 9% - 10%+ Stabilizes immediately 10% - 14%+ Project-specific stabilization Targeted IRR 14% – 16% 14% - 19%+ 3 – 5 yrs to stabilize |
|
|
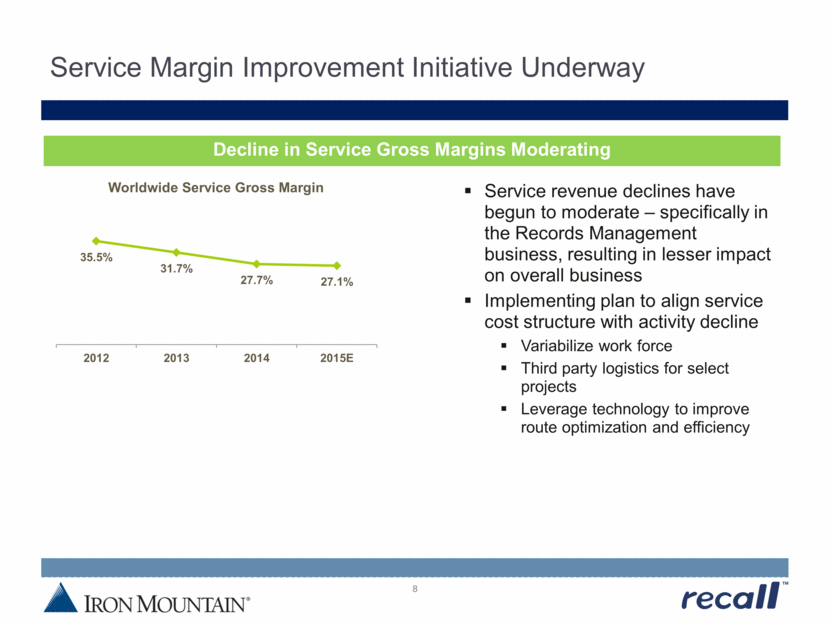
Service Margin Improvement Initiative Underway 8 Decline in Service Gross Margins Moderating Service revenue declines have begun to moderate – specifically in the Records Management business, resulting in lesser impact on overall business Implementing plan to align service cost structure with activity decline Variabilize work force Third party logistics for select projects Leverage technology to improve route optimization and efficiency Worldwide Service Gross Margin 35.5% 31.7% 27.7% 27.1% 0.0% 5.0% 10.0% 15.0% 20.0% 25.0% 30.0% 35.0% 40.0% 2012 2013 2014 2015E |
|
|
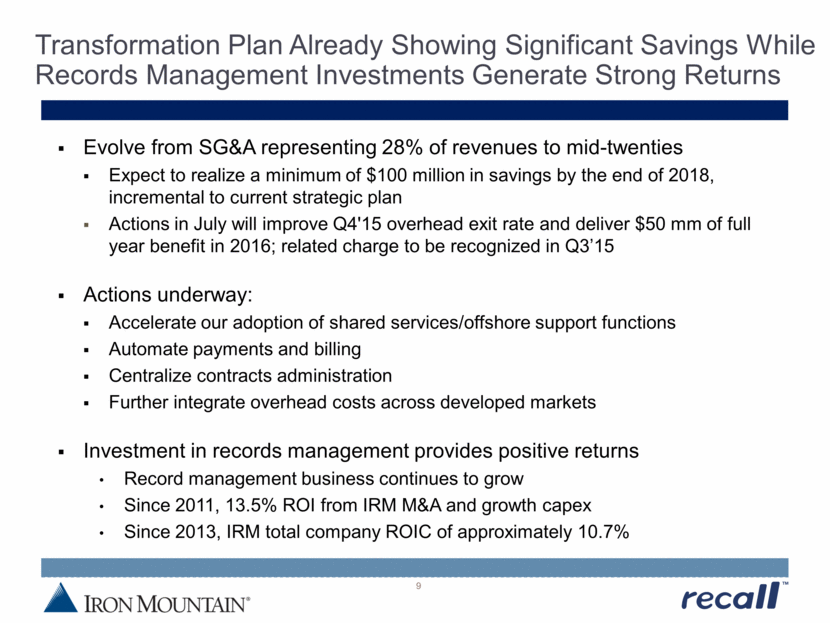
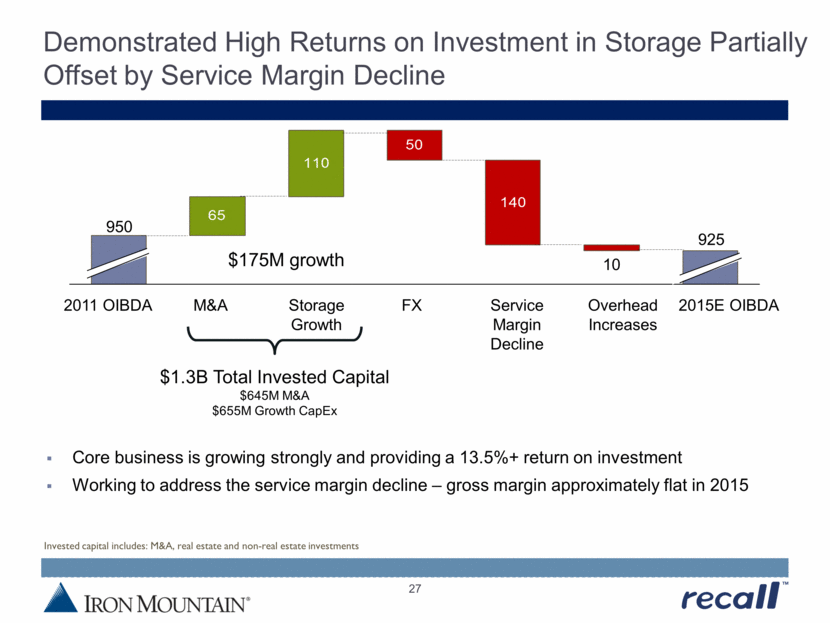
Transformation Plan Already Showing Significant Savings While Records Management Investments Generate Strong Returns Evolve from SG&A representing 28% of revenues to mid-twenties Expect to realize a minimum of $100 million in savings by the end of 2018, incremental to current strategic plan Actions in July will improve Q4'15 overhead exit rate and deliver $50 mm of full year benefit in 2016; related charge to be recognized in Q3’15 Actions underway: Accelerate our adoption of shared services/offshore support functions Automate payments and billing Centralize contracts administration Further integrate overhead costs across developed markets Investment in records management provides positive returns Record management business continues to grow Since 2011, 13.5% ROI from IRM M&A and growth capex Since 2013, IRM total company ROIC of approximately 10.7% 9 |
|
|
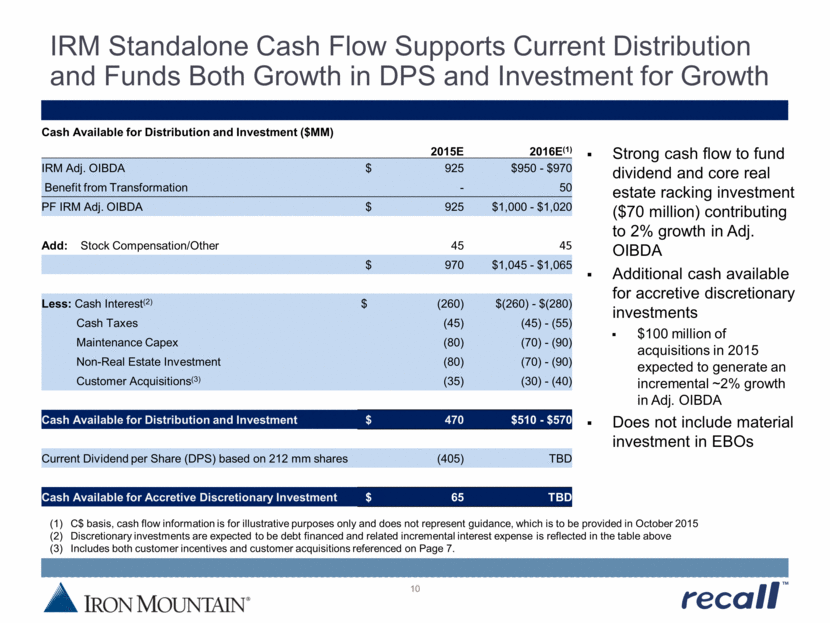
IRM Standalone Cash Flow Supports Current Distribution and Funds Both Growth in DPS and Investment for Growth 10 C$ basis, cash flow information is for illustrative purposes only and does not represent guidance, which is to be provided in October 2015 Discretionary investments are expected to be debt financed and related incremental interest expense is reflected in the table above Includes both customer incentives and customer acquisitions referenced on Page 7. Strong cash flow to fund dividend and core real estate racking investment ($70 million) contributing to 2% growth in Adj. OIBDA Additional cash available for accretive discretionary investments $100 million of acquisitions in 2015 expected to generate an incremental ~2% growth in Adj. OIBDA Does not include material investment in EBOs Cash Available for Distribution and Investment ($MM) 2015E 2016E(1) IRM Adj. OIBDA $ 925 $950 - $970 Benefit from Transformation - 50 PF IRM Adj. OIBDA $ 925 $1,000 - $1,020 Add: Stock Compensation/Other 45 45 $ 970 $1,045 - $1,065 Less: Cash Interest(2) $ (260) $(260) - $(280) Cash Taxes (45) (45) - (55) Maintenance Capex (80) (70) - (90) Non-Real Estate Investment (80) (70) - (90) Customer Acquisitions(3) (35) (30) - (40) Cash Available for Distribution and Investment $ 470 $510 - $570 Current Dividend per Share (DPS) based on 212 mm shares (405) TBD Cash Available for Accretive Discretionary Investment $ 65 TBD |
|
|
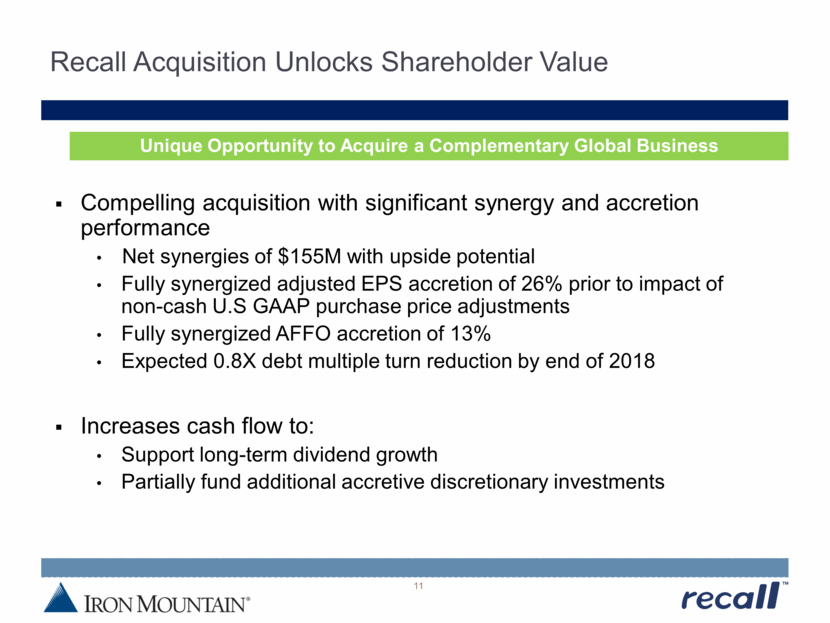
Compelling acquisition with significant synergy and accretion performance Net synergies of $155M with upside potential Fully synergized adjusted EPS accretion of 26% prior to impact of non-cash U.S GAAP purchase price adjustments Fully synergized AFFO accretion of 13% Expected 0.8X debt multiple turn reduction by end of 2018 Increases cash flow to: Support long-term dividend growth Partially fund additional accretive discretionary investments Recall Acquisition Unlocks Shareholder Value 11 Unique Opportunity to Acquire a Complementary Global Business |
|
|
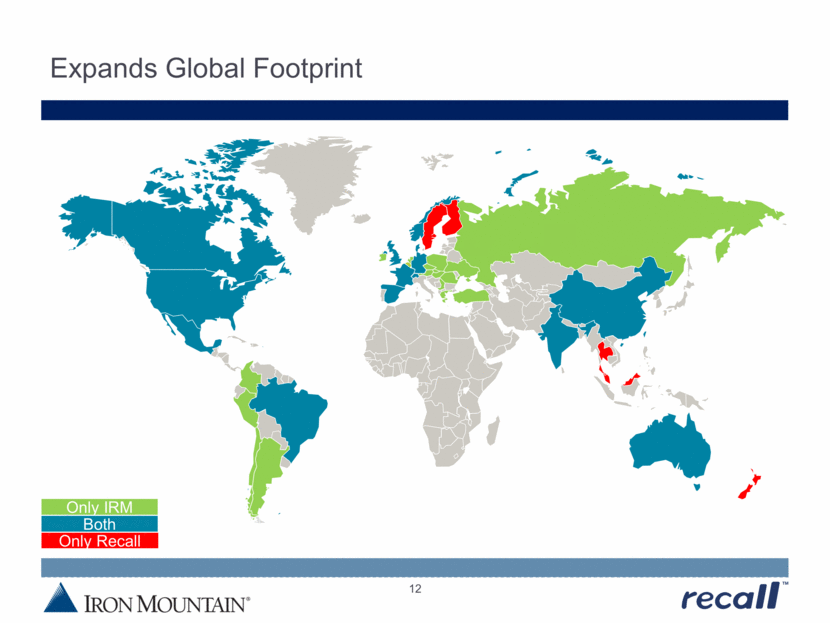
Expands Global Footprint Only Recall Only IRM Both 12 |
|
|
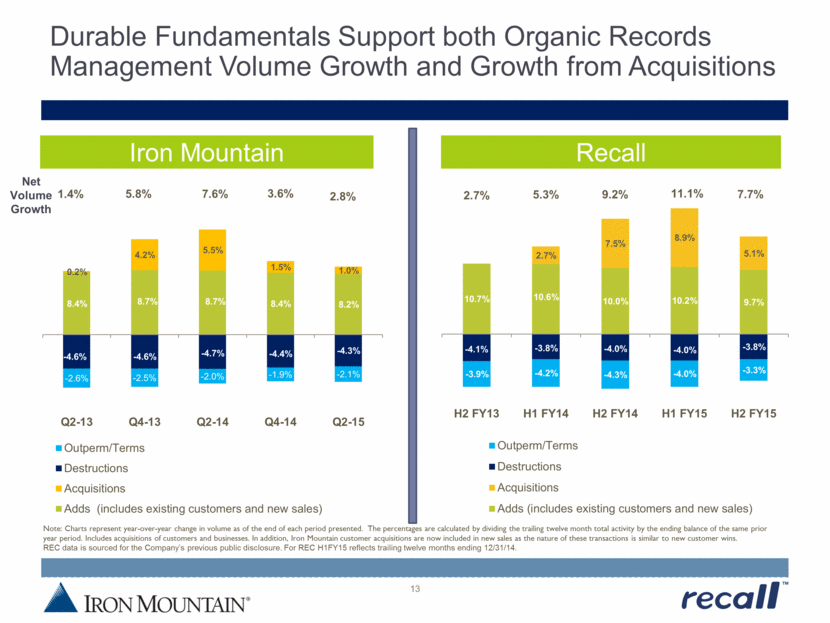
Durable Fundamentals Support both Organic Records Management Volume Growth and Growth from Acquisitions 13 Iron Mountain Recall Note: Charts represent year-over-year change in volume as of the end of each period presented. The percentages are calculated by dividing the trailing twelve month total activity by the ending balance of the same prior year period. Includes acquisitions of customers and businesses. In addition, Iron Mountain customer acquisitions are now included in new sales as the nature of these transactions is similar to new customer wins. REC data is sourced for the Company’s previous public disclosure. For REC H1FY15 reflects trailing twelve months ending 12/31/14. Net Volume Growth 10.7% 10.6% 10.0% 10.2% 9.7% 2.7% 7.5% 8.9% 5.1% - 4.1% - 3.8% - 4.0% - 4.0% - 3.8% - 3.9% - 4.2% - 4.3% - 4.0% - 3.3% 2.7% 5.3% 9.2% 11.1% 7.7% H2 FY13 H1 FY14 H2 FY14 H1 FY15 H2 FY15 Outperm/Terms Destructions Acquisitions Adds (includes existing customers and new sales) 8.4% 8.7% 8.7% 8.4% 8.2% 0.2% 4.2% 5.5% 1.5% 1.0% - 4.6% - 4.6% - 4.7% - 4.4% - 4.3% - 2.6% - 2.5% - 2.0% - 1.9% - 2.1% 1.4% 5.8% 7.6% 3.6% 2.8% Q2-13 Q4-13 Q2-14 Q4-14 Q2-15 Outperm/Terms Destructions Acquisitions Adds (includes existing customers and new sales) |
|
|
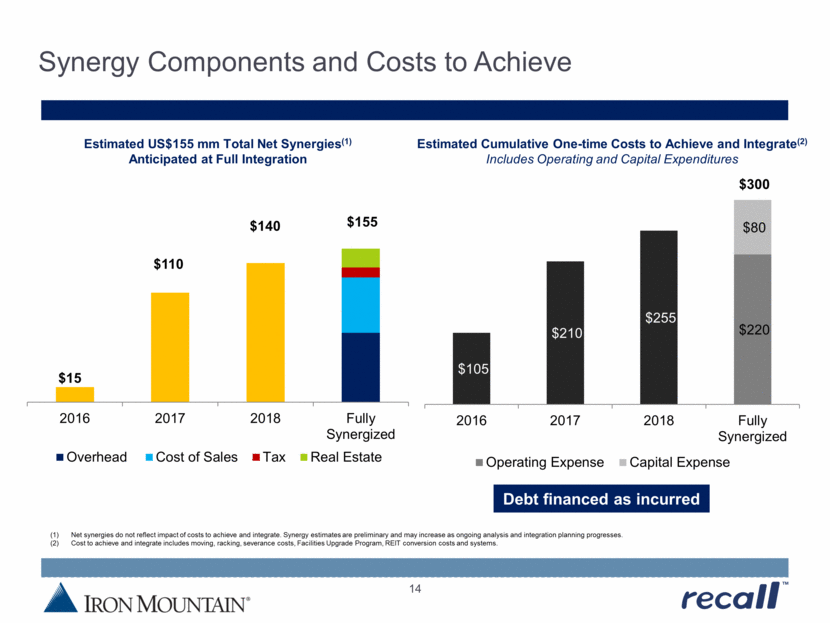
Synergy Components and Costs to Achieve 14 Net synergies do not reflect impact of costs to achieve and integrate. Synergy estimates are preliminary and may increase as ongoing analysis and integration planning progresses. Cost to achieve and integrate includes moving, racking, severance costs, Facilities Upgrade Program, REIT conversion costs and systems. Estimated US$155 mm Total Net Synergies(1) Anticipated at Full Integration Estimated Cumulative One-time Costs to Achieve and Integrate(2) Includes Operating and Capital Expenditures Debt financed as incurred $15 $110 $140 $155 2016 2017 2018 Fully Synergized Overhead Cost of Sales Tax Real Estate $105 $210 $255 $220 $80 $300 2016 2017 2018 Fully Synergized Operating Expense Capital Expense |
|
|
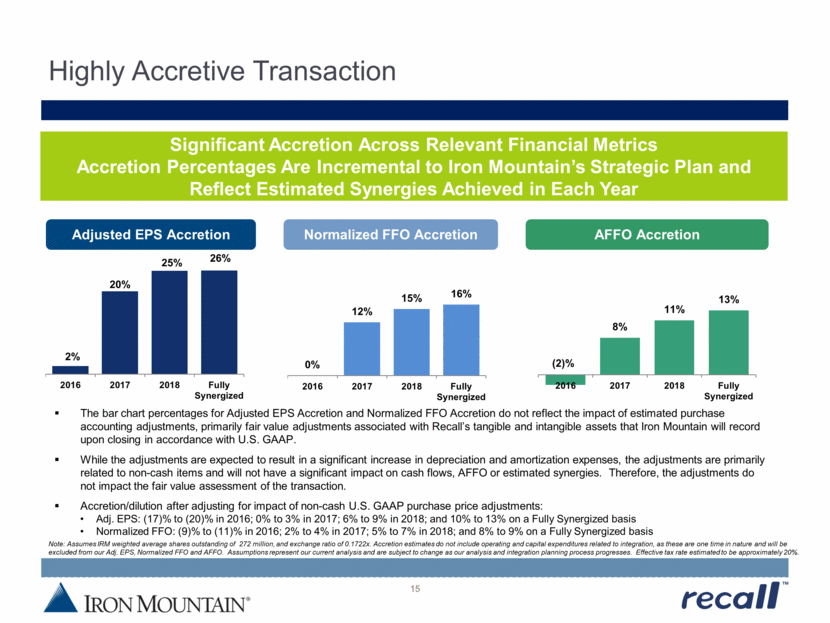
Highly Accretive Transaction 15 Note: Assumes IRM weighted average shares outstanding of 272 million, and exchange ratio of 0.1722x. Accretion estimates do not include operating and capital expenditures related to integration, as these are one time in nature and will be excluded from our Adj. EPS, Normalized FFO and AFFO. Assumptions represent our current analysis and are subject to change as our analysis and integration planning process progresses. Effective tax rate estimated to be approximately 20%. Adjusted EPS Accretion Normalized FFO Accretion AFFO Accretion Significant Accretion Across Relevant Financial Metrics Accretion Percentages Are Incremental to Iron Mountain’s Strategic Plan and Reflect Estimated Synergies Achieved in Each Year The bar chart percentages for Adjusted EPS Accretion and Normalized FFO Accretion do not reflect the impact of estimated purchase accounting adjustments, primarily fair value adjustments associated with Recall’s tangible and intangible assets that Iron Mountain will record upon closing in accordance with U.S. GAAP. While the adjustments are expected to result in a significant increase in depreciation and amortization expenses, the adjustments are primarily related to non-cash items and will not have a significant impact on cash flows, AFFO or estimated synergies. Therefore, the adjustments do not impact the fair value assessment of the transaction. Accretion/dilution after adjusting for impact of non-cash U.S. GAAP purchase price adjustments: Adj. EPS: (17)% to (20)% in 2016; 0% to 3% in 2017; 6% to 9% in 2018; and 10% to 13% on a Fully Synergized basis Normalized FFO: (9)% to (11)% in 2016; 2% to 4% in 2017; 5% to 7% in 2018; and 8% to 9% on a Fully Synergized basis (2)% 8% 11% 13% 2016 2017 2018 Fully Synergized 0% 12% 15% 16% 2016 2017 2018 Fully Synergized 2% 20% 25% 26% 2016 2017 2018 Fully Synergized |
|
|
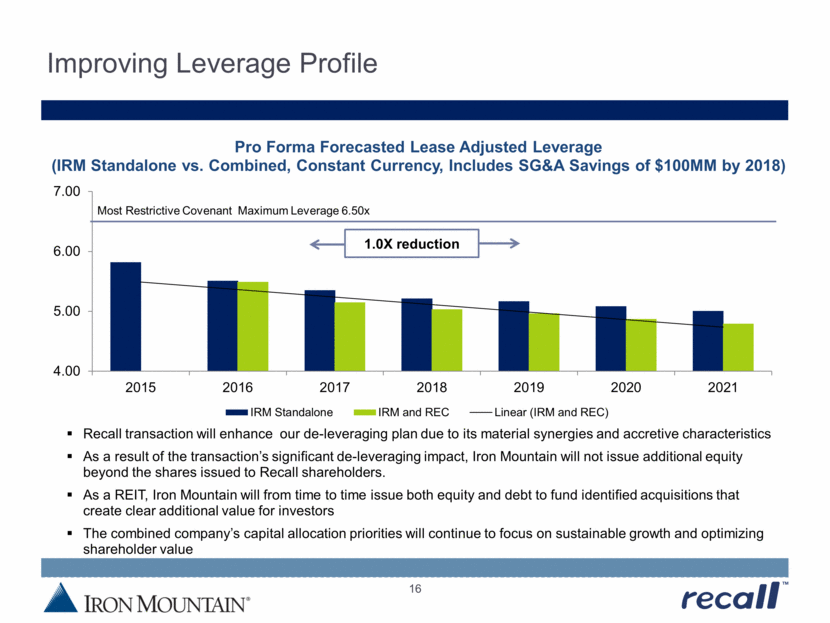
Improving Leverage Profile 16 Pro Forma Forecasted Lease Adjusted Leverage (IRM Standalone vs. Combined, Constant Currency, Includes SG&A Savings of $100MM by 2018) Most Restrictive Covenant Maximum Leverage 6.50x Recall transaction will enhance our de-leveraging plan due to its material synergies and accretive characteristics As a result of the transaction’s significant de-leveraging impact, Iron Mountain will not issue additional equity beyond the shares issued to Recall shareholders. As a REIT, Iron Mountain will from time to time issue both equity and debt to fund identified acquisitions that create clear additional value for investors The combined company’s capital allocation priorities will continue to focus on sustainable growth and optimizing shareholder value 1.0X reduction 4.00 5.00 6.00 7.00 2015 2016 2017 2018 2019 2020 2021 IRM Standalone IRM and REC Linear (IRM and REC) |
|
|
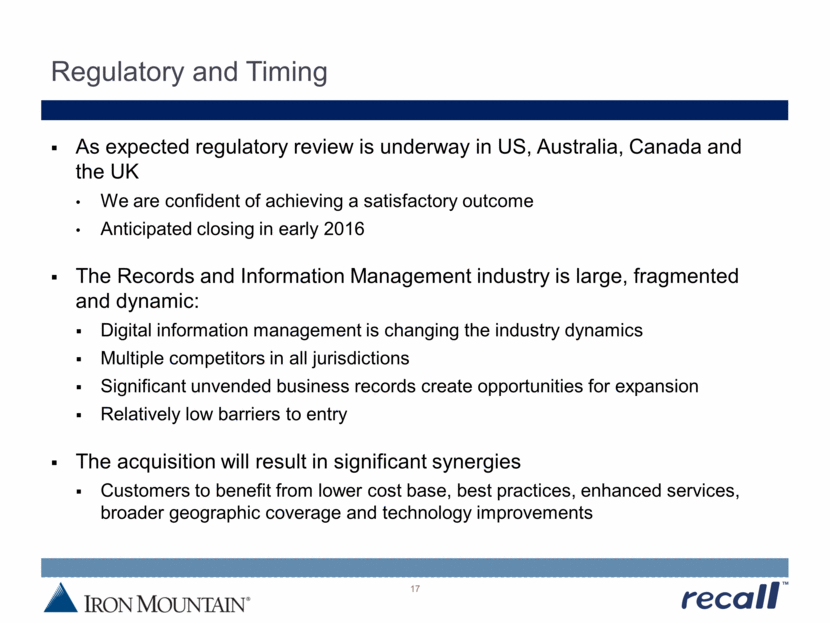
Regulatory and Timing 17 As expected regulatory review is underway in US, Australia, Canada and the UK We are confident of achieving a satisfactory outcome Anticipated closing in early 2016 The Records and Information Management industry is large, fragmented and dynamic: Digital information management is changing the industry dynamics Multiple competitors in all jurisdictions Significant unvended business records create opportunities for expansion Relatively low barriers to entry The acquisition will result in significant synergies Customers to benefit from lower cost base, best practices, enhanced services, broader geographic coverage and technology improvements |
|
|
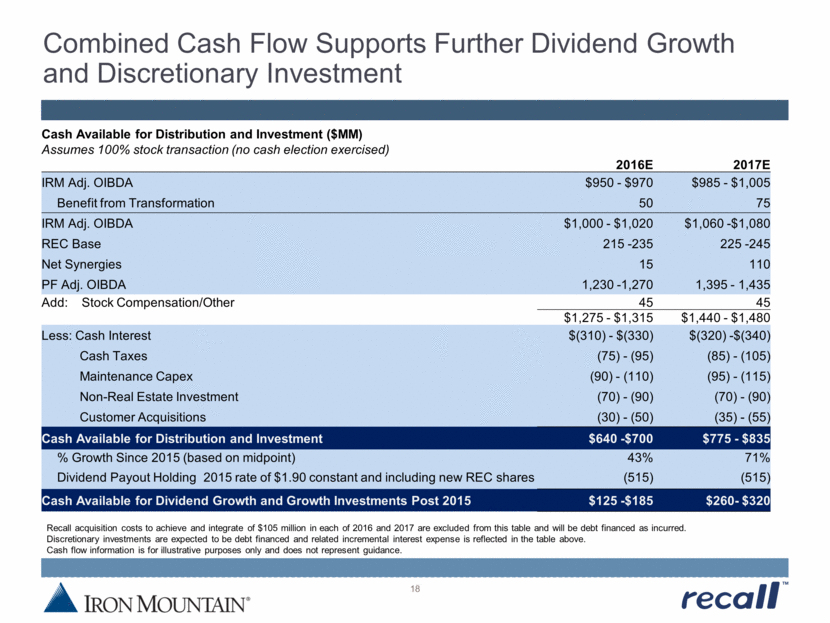
Combined Cash Flow Supports Further Dividend Growth and Discretionary Investment 18 Recall acquisition costs to achieve and integrate of $105 million in each of 2016 and 2017 are excluded from this table and will be debt financed as incurred. Discretionary investments are expected to be debt financed and related incremental interest expense is reflected in the table above. Cash flow information is for illustrative purposes only and does not represent guidance. Cash Available for Distribution and Investment ($MM) Assumes 100% stock transaction (no cash election exercised) 2016E 2017E IRM Adj. OIBDA $950 - $970 $985 - $1,005 Benefit from Transformation 50 75 IRM Adj. OIBDA $1,000 - $1,020 $1,060 -$1,080 REC Base 215 -235 225 -245 Net Synergies 15 110 PF Adj. OIBDA 1,230 -1,270 1,395 - 1,435 Add: Stock Compensation/Other 45 45 $1,275 - $1,315 $1,440 - $1,480 Less: Cash Interest $(310) - $(330) $(320) -$(340) Cash Taxes (75) - (95) (85) - (105) Maintenance Capex (90) - (110) (95) - (115) Non-Real Estate Investment (70) - (90) (70) - (90) Customer Acquisitions (30) - (50) (35) - (55) Cash Available for Distribution and Investment $640 -$700 $775 - $835 % Growth Since 2015 (based on midpoint) 43% 71% Dividend Payout Holding 2015 rate of $1.90 constant and including new REC shares (515) (515) Cash Available for Dividend Growth and Growth Investments Post 2015 $125 -$185 $260- $320 |
|
|
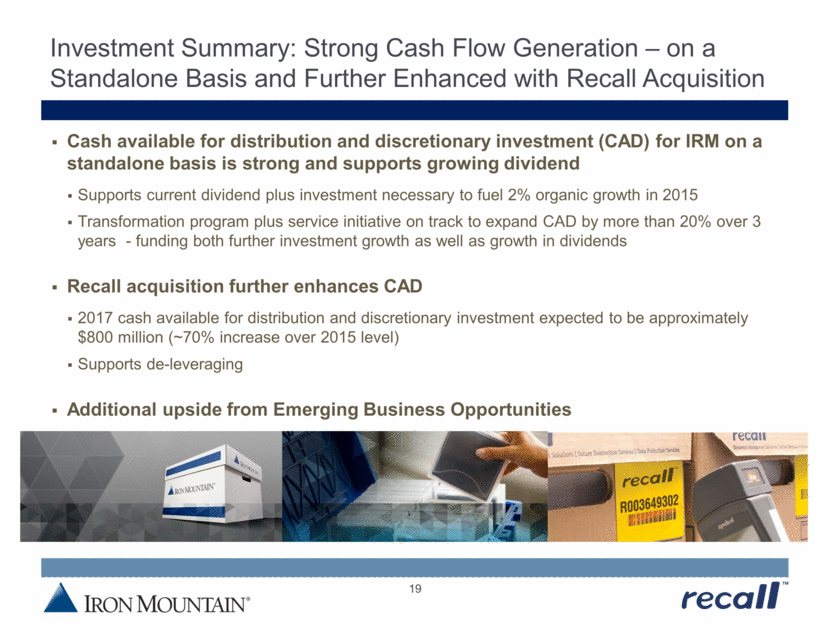
Investment Summary: Strong Cash Flow Generation – on a Standalone Basis and Further Enhanced with Recall Acquisition 19 Cash available for distribution and discretionary investment (CAD) for IRM on a standalone basis is strong and supports growing dividend Supports current dividend plus investment necessary to fuel 2% organic growth in 2015 Transformation program plus service initiative on track to expand CAD by more than 20% over 3 years - funding both further investment growth as well as growth in dividends Recall acquisition further enhances CAD 2017 cash available for distribution and discretionary investment expected to be approximately $800 million (~70% increase over 2015 level) Supports de-leveraging Additional upside from Emerging Business Opportunities |
|
|
Appendix |
|
|
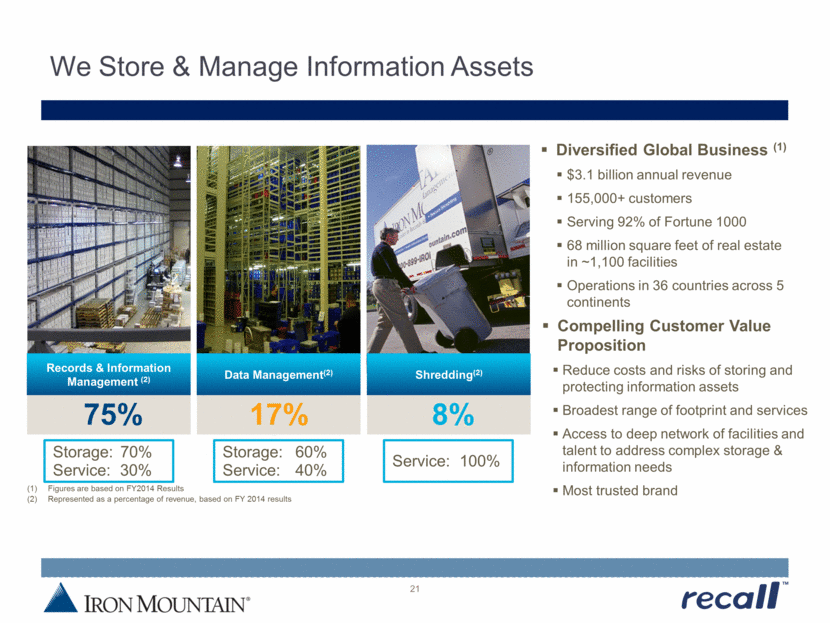
We Store & Manage Information Assets 21 75% 17% 8% Records & Information Management (2) Data Management(2) Shredding(2) Storage: 70% Service: 30% Storage: 60% Service: 40% Service: 100% Diversified Global Business (1) $3.1 billion annual revenue 155,000+ customers Serving 92% of Fortune 1000 68 million square feet of real estate in ~1,100 facilities Operations in 36 countries across 5 continents Compelling Customer Value Proposition Reduce costs and risks of storing and protecting information assets Broadest range of footprint and services Access to deep network of facilities and talent to address complex storage & information needs Most trusted brand (1) Figures are based on FY2014 (2) Results Represented as a percentage of revenue, based on FY 2014 results |
|
|
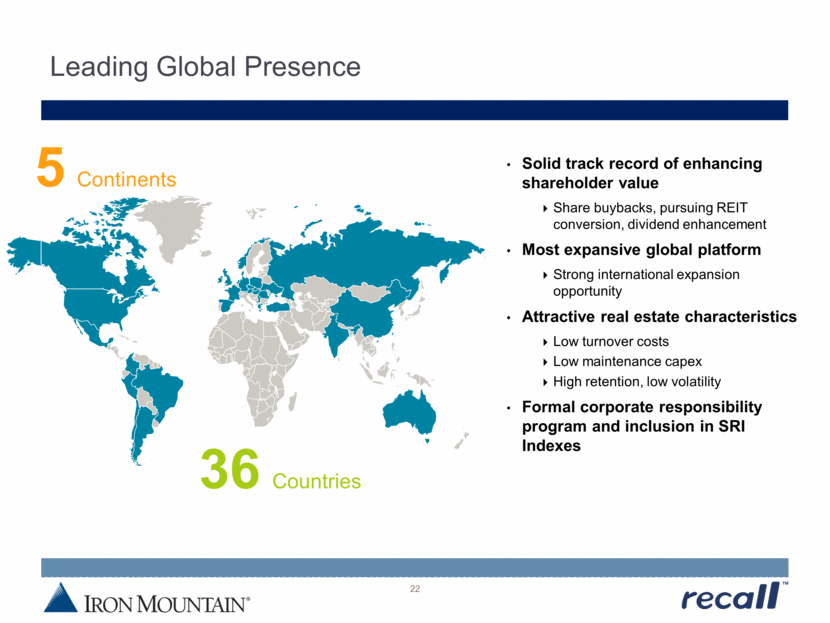
Leading Global Presence 22 36 Countries 5 Continents Solid track record of enhancing shareholder value Share buybacks, pursuing REIT conversion, dividend enhancement Most expansive global platform Strong international expansion opportunity Attractive real estate characteristics Low turnover costs Low maintenance capex High retention, low volatility Formal corporate responsibility program and inclusion in SRI Indexes |
|
|
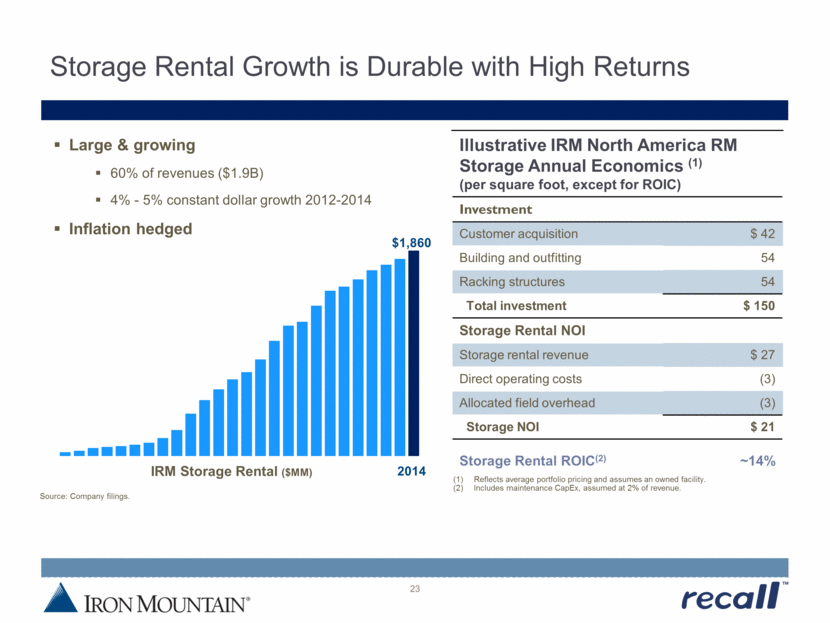
Storage Rental Growth is Durable with High Returns 23 2014 $1,860 IRM Storage Rental ($MM) Large & growing 60% of revenues ($1.9B) 4% - 5% constant dollar growth 2012-2014 Inflation hedged Source: Company filings. Illustrative IRM North America RM Storage Annual Economics (1) (per square foot, except for ROIC) Investment Customer acquisition $ 42 Building and outfitting 54 Racking structures 54 Total investment $ 150 Storage Rental NOI Storage rental revenue $ 27 Direct operating costs (3) Allocated field overhead (3) Storage NOI $ 21 Storage Rental ROIC(2) ~14% (1) Reflects average portfolio pricing and assumes an owned facility. (2) Includes maintenance CapEx, assumed at 2% of revenue. |
|
|
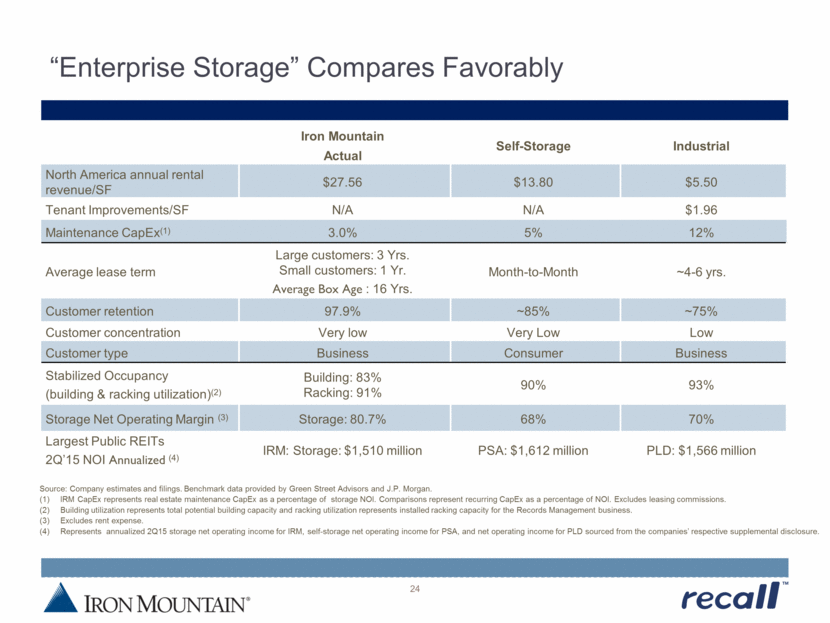
“Enterprise Storage” Compares Favorably 24 Iron Mountain Actual Self-Storage Industrial North America annual rental revenue/SF $27.56 $13.80 $5.50 Tenant Improvements/SF N/A N/A $1.96 Maintenance CapEx(1) 3.0% 5% 12% Average lease term Large customers: 3 Yrs. Small customers: 1 Yr. Average Box Age : 16 Yrs. Month-to-Month ~4-6 yrs. Customer retention 97.9% ~85% ~75% Customer concentration Very low Very Low Low Customer type Business Consumer Business Stabilized Occupancy (building & racking utilization)(2) Building: 83% Racking: 91% 90% 93% Storage Net Operating Margin (3) Storage: 80.7% 68% 70% Largest Public REITs 2Q’15 NOI Annualized (4) IRM: Storage: $1,510 million PSA: $1,612 million PLD: $1,566 million Source: Company estimates and filings. Benchmark data provided by Green Street Advisors and J.P. Morgan. (1) IRM CapEx represents real estate maintenance CapEx as a percentage of storage NOI. Comparisons represent recurring CapEx as a percentage of NOI. Excludes leasing commissions. (2) Building utilization represents total potential building capacity and racking utilization represents installed racking capacity for the Records Management business. (3) Excludes rent expense. (4) Represents annualized 2Q15 storage net operating income for IRM, self-storage net operating income for PSA, and net operating income for PLD sourced from the companies’ respective supplemental disclosure. |
|
|
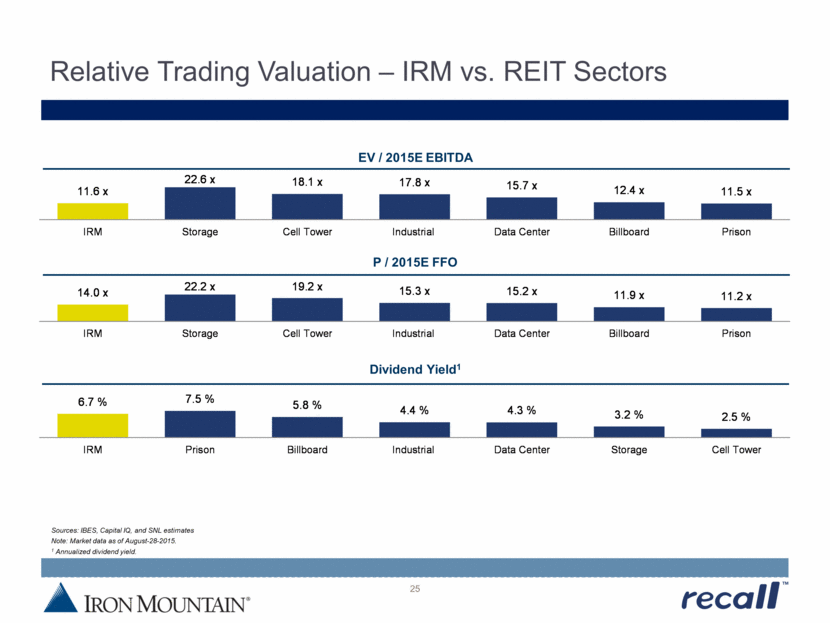
Relative Trading Valuation – IRM vs. REIT Sectors 25 EV / 2015E EBITDA P / 2015E FFO Dividend Yield1 Sources: IBES, Capital IQ, and SNL estimates Note: Market data as of August-28-2015. 1 Annualized dividend yield. 11.6 x 22.6 x 18.1 x 17.8 x 15.7 x 12.4 x 11.5 x IRM Storage Cell Tower Industrial Data Center Billboard Prison 6.7 % 7.5 % 5.8 % 4.4 % 4.3 % 3.2 % 2.5 % IRM Prison Billboard Industrial Data Center Storage Cell Tower 14.0 x 22.2 x 19.2 x 15.3 x 15.2 x 11.9 x 11.2 x IRM Storage Cell Tower Industrial Data Center Billboard Prison |
|
|
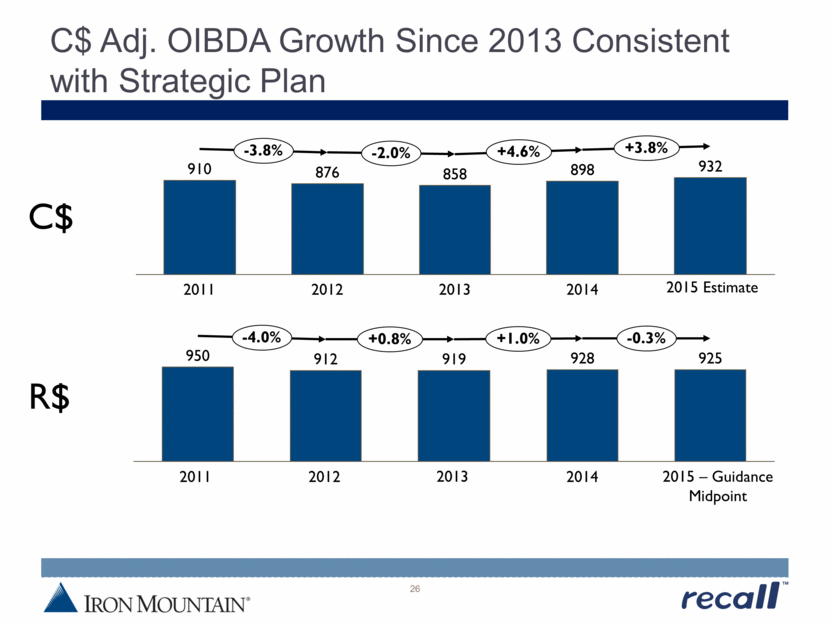
C$ Adj. OIBDA Growth Since 2013 Consistent with Strategic Plan 26 932 -2.0% +4.6% +3.8% 2015 Estimate 2014 898 2013 858 2012 876 -3.8% 2011 910 C$ -0.3% 2015 – Guidance Midpoint 925 2014 928 2013 919 2012 912 2011 950 +0.8% -4.0% +1.0% R$ |
|
|
Demonstrated High Returns on Investment in Storage Partially Offset by Service Margin Decline Core business is growing strongly and providing a 13.5%+ return on investment Working to address the service margin decline – gross margin approximately flat in 2015 Service Margin Decline FX Storage Growth M&A 2011 OIBDA 950 2015E OIBDA Overhead Increases 10 925 $1.3B Total Invested Capital $645M M&A $655M Growth CapEx $175M growth Invested capital includes: M&A, real estate and non-real estate investments 27 140 50 110 65 |
|
|
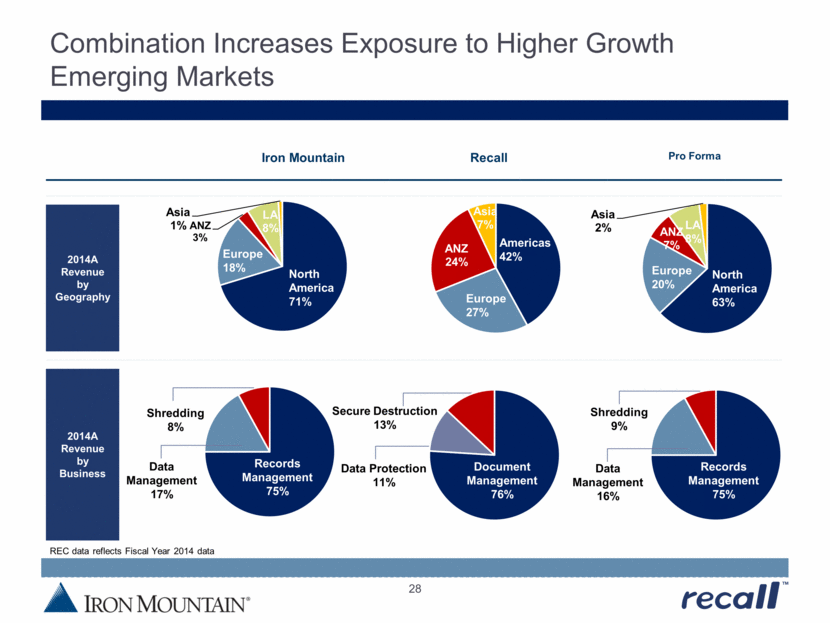
Iron Mountain Recall Pro Forma 2014A Revenue by Geography 2014A Revenue by Business Combination Increases Exposure to Higher Growth Emerging Markets North America 71% Europe 18% Americas 42% Europe 27% North America 63% Europe 20% Data Management 17% Shredding 8% Secure Destruction 13% Data Protection 11% Data Management 16% Shredding 9% 28 REC data reflects Fiscal Year 2014 data LA 8% Records Management 75% ANZ 3% LA 8% Asia 1% ANZ 24% Asia 7% ANZ 7% Asia 2% Records Management 75% Document Management 76% |
|
|
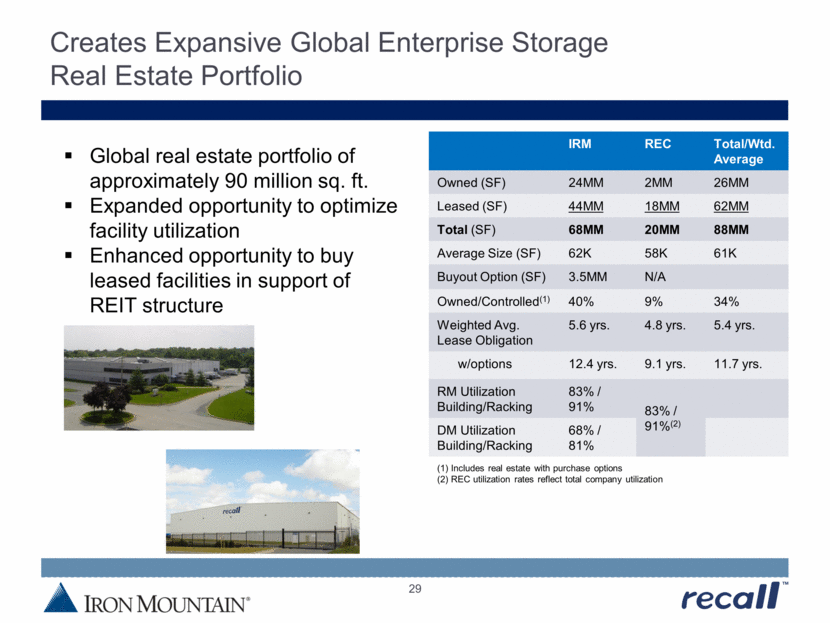
Creates Expansive Global Enterprise Storage Real Estate Portfolio IRM REC Total/Wtd. Average Owned (SF) 24MM 2MM 26MM Leased (SF) 44MM 18MM 62MM Total (SF) 68MM 20MM 88MM Average Size (SF) 62K 58K 61K Buyout Option (SF) 3.5MM N/A Owned/Controlled(1) 40% 9% 34% Weighted Avg. Lease Obligation 5.6 yrs. 4.8 yrs. 5.4 yrs. w/options 12.4 yrs. 9.1 yrs. 11.7 yrs. RM Utilization Building/Racking 83% / 91% 83% / 91%(2) DM Utilization Building/Racking 68% / 81% Global real estate portfolio of approximately 90 million sq. ft. Expanded opportunity to optimize facility utilization Enhanced opportunity to buy leased facilities in support of REIT structure (1) Includes real estate with purchase options (2) REC utilization rates reflect total company utilization 29 |
|
|
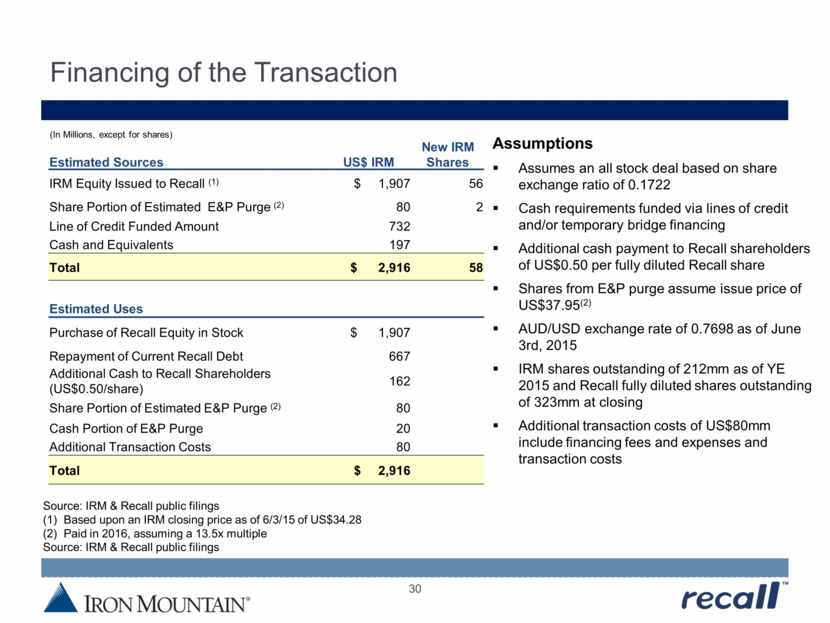
Financing of the Transaction 30 (In Millions, except for shares) Source: IRM & Recall public filings (1) Based upon an IRM closing price as of 6/3/15 of US$34.28 (2) Paid in 2016, assuming a 13.5x multiple Source: IRM & Recall public filings Assumptions Assumes an all stock deal based on share exchange ratio of 0.1722 Cash requirements funded via lines of credit and/or temporary bridge financing Additional cash payment to Recall shareholders of US$0.50 per fully diluted Recall share Shares from E&P purge assume issue price of US$37.95(2) AUD/USD exchange rate of 0.7698 as of June 3rd, 2015 IRM shares outstanding of 212mm as of YE 2015 and Recall fully diluted shares outstanding of 323mm at closing Additional transaction costs of US$80mm include financing fees and expenses and transaction costs Estimated Sources US$ IRM New IRM Shares IRM Equity Issued to Recall (1) $ 1,907 56 Share Portion of Estimated E&P Purge (2) 80 2 Line of Credit Funded Amount 732 Cash and Equivalents 197 Total $ 2,916 58 Estimated Uses Purchase of Recall Equity in Stock $ 1,907 Repayment of Current Recall Debt 667 Additional Cash to Recall Shareholders (US$0.50/share) 162 Share Portion of Estimated E&P Purge (2) 80 Cash Portion of E&P Purge 20 Additional Transaction Costs 80 Total $ 2,916 |

