Attached files
| file | filename |
|---|---|
| 8-K - 8-K - CINCINNATI BELL INC | a8-kbamlanddrexelhamiltonc.htm |

Cincinnati Bell – Conference Presentation September 9, 2015
Safe Harbor This presentation and the documents incorporated by reference herein contain forward-looking statements regarding future events and our future results that are subject to the “safe harbor” provisions of the Private Securities Litigation Reform Act of 1995. All statements, other than statements of historical facts, are statements that could be deemed forward-looking statements. These statements are based on current expectations, estimates, forecasts, and projections about the industries in which we operate and the beliefs and assumptions of our management. Words such as “expects,” “anticipates,” “predicts,” “projects,” “intends,” “plans,” “believes,” “seeks,” “estimates,” “continues,” “endeavors,” “strives,” “may,” variations of such words and similar expressions are intended to identify such forward-looking statements. In addition, any statements that refer to projections of our future financial performance, our anticipated growth and trends in our businesses, and other characterizations of future events or circumstances are forward-looking statements. Readers are cautioned these forward-looking statements are based on current expectations and assumptions that are subject to risks and uncertainties, which could cause our actual results to differ materially and adversely from those reflected in the forward-looking statements. Factors that could cause or contribute to such differences include, but are not limited to, those discussed in this release and those discussed in other documents we file with the Securities and Exchange Commission (SEC). More information on potential risks and uncertainties is available in our recent filings with the SEC, including Cincinnati Bell’s Form 10-K report, Form 10-Q reports and Form 8-K reports. Actual results may differ materially and adversely from those expressed in any forward-looking statements. We undertake no obligation to revise or update any forward- looking statements for any reason. 2
Non GAAP Financial Measures This presentation contains information about adjusted earnings before interest, taxes, depreciation and amortization (Adjusted EBITDA), Adjusted EBITDA margin, net debt and free cash flow. These are non-GAAP financial measures used by Cincinnati Bell management when evaluating results of operations and cash flow. Management believes these measures also provide users of the financial statements with additional and useful comparisons of current results of operations and cash flows with past and future periods. Non-GAAP financial measures should not be construed as being more important than comparable GAAP measures. Detailed reconciliations of Adjusted EBITDA, net debt and free cash flow (including the Company’s definition of these terms) to comparable GAAP financial measures can be found in the earnings release on our website at www.cincinnatibell.com within the Investor Relations section. 3

4 Cincinnati Bell - Overview Internet subs: 275K Video subs: 102K Voice lines: 536K Long distance lines: 350K Fiber route miles: 7,400 Homes passed with Fioptics: 382K Commercial buildings lit with fiber: 6,700 Over our 140 year history, we have embraced reinvention and constantly evolved to meet the needs of our customers and drive innovation. Our goal is to provide residential and business customers with the fastest, highest quality connection to meet all of their communication and entertainment needs. We deliver flexible, innovative, end-to-end solutions across the U.S. making us the only IT and solutions partner our customers will ever need. [1] [1] Includes 147k VoIP access line equivalents
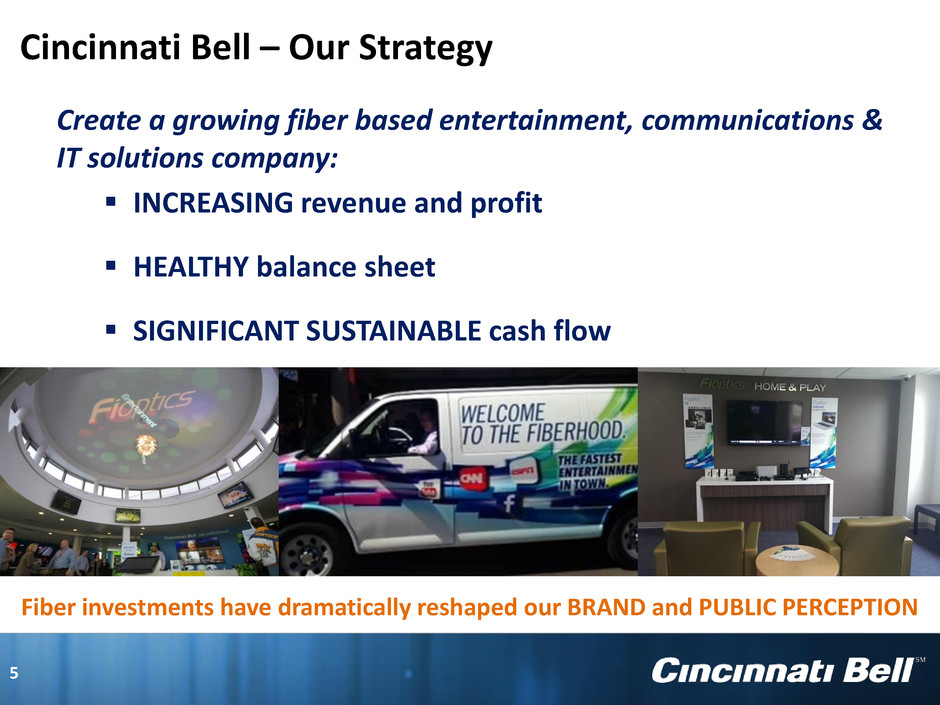
Create a growing fiber based entertainment, communications & IT solutions company: INCREASING revenue and profit HEALTHY balance sheet SIGNIFICANT SUSTAINABLE cash flow Fiber investments have dramatically reshaped our BRAND and PUBLIC PERCEPTION Cincinnati Bell – Our Strategy 5
INCREASING REVENUE AND PROFIT 6
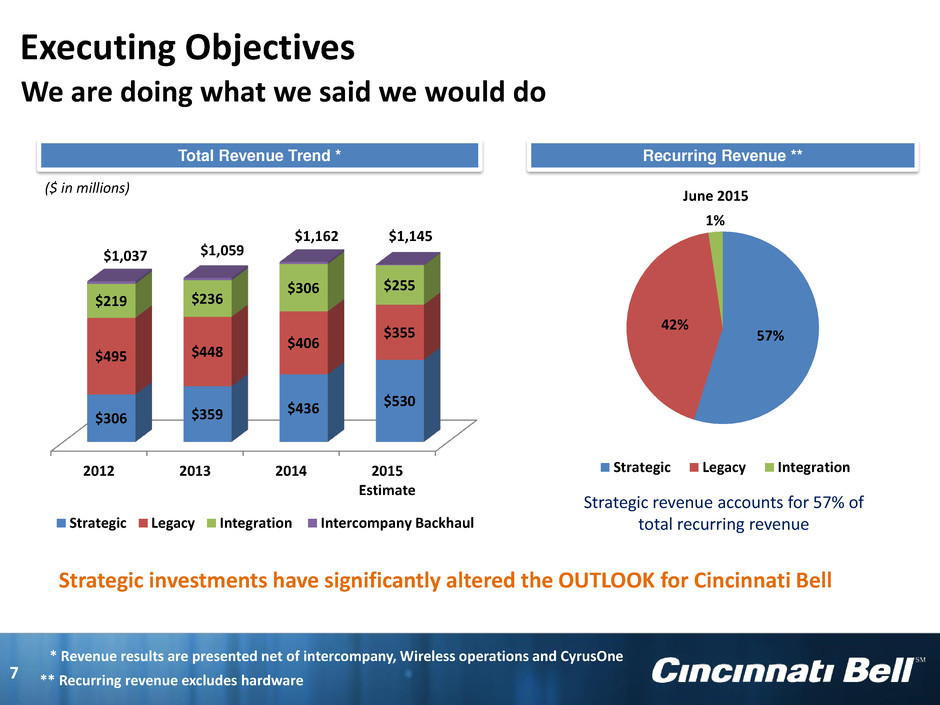
2012 2013 2014 2015 Estimate $306 $359 $436 $530 $495 $448 $406 $355 $219 $236 $306 $255 Strategic Legacy Integration Intercompany Backhaul 57% 42% 1% Strategic Legacy Integration Strategic investments have significantly altered the OUTLOOK for Cincinnati Bell Total Revenue Trend * ** Recurring revenue excludes hardware * Revenue results are presented net of intercompany, Wireless operations and CyrusOne ($ in millions) $1,037 $1,059 Strategic revenue accounts for 57% of total recurring revenue Recurring Revenue ** June 2015 $1,162 We are doing what we said we would do Executing Objectives 7 $1,145

2012 2013 2014 2015 Estimate $133 $144 $161 $170 $104 $111 $131 $170 $278 $259 $239 $215 $212 $230 $294 $245 Strategic - E&C Strategic - IT Services Legacy Integration $825 Revenue Growth - Business Business Revenue ($ in millions) $727 $744 Increase Sales & Revenues Strategic revenue for Entertainment and Communications business customers totaled $86 million YTD– up 9% compared to the prior year (after excluding $4 million of inter-company wireless backhaul) Strategic managed and professional services revenue was $81 million YTD – up 30% compared to a year ago Total business voice lines (including VoIP access line equivalents) totaled 310,000 – up more than 3,000 compared to a year ago Continue to Develop Regional Markets Increased focus on managed services and IT solutions growth Foster ongoing relationships in Louisville (7 years), Columbus (4 years), and Indianapolis (3 years) ‒ 10 gig connection to each of these markets Connected 6,700 buildings lit with fiber – including 600 multi-dwelling units 8 We have 4 times more fiber assets than our nearest competitor and a deep understanding of the local economy to ensure we continue providing premier telecommunications and IT solutions to the region’s largest enterprises. $800
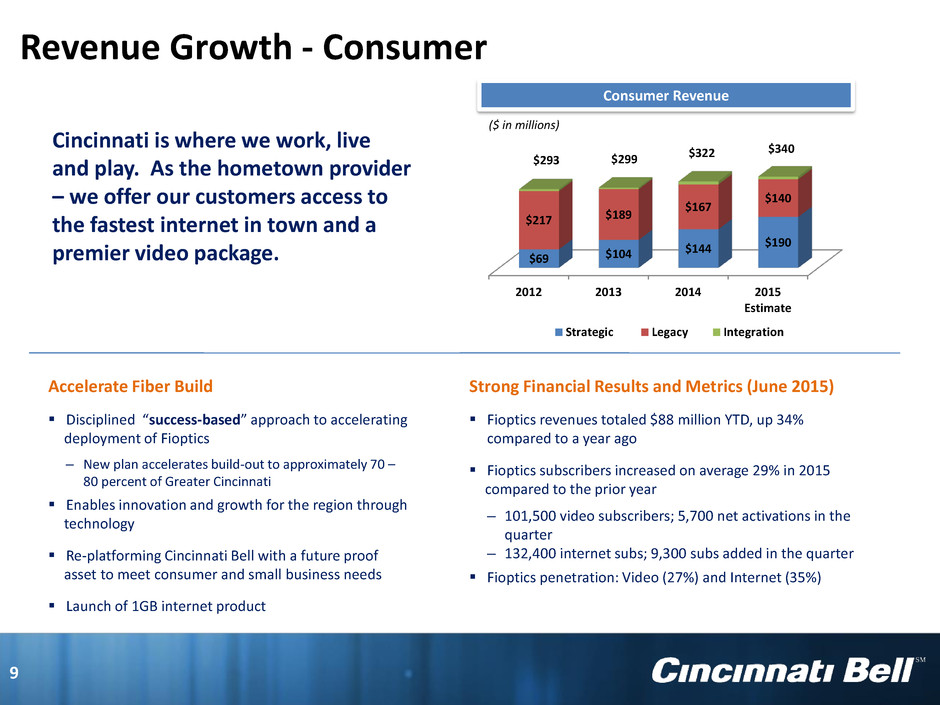
2012 2013 2014 2015 Estimate $69 $104 $144 $190 $217 $189 $167 $140 Strategic Legacy Integration Consumer Revenue 9 Revenue Growth - Consumer $322 $293 $299 Accelerate Fiber Build Disciplined “success-based” approach to accelerating deployment of Fioptics ‒ New plan accelerates build-out to approximately 70 – 80 percent of Greater Cincinnati Enables innovation and growth for the region through technology Re-platforming Cincinnati Bell with a future proof asset to meet consumer and small business needs Launch of 1GB internet product Strong Financial Results and Metrics (June 2015) Fioptics revenues totaled $88 million YTD, up 34% compared to a year ago Fioptics subscribers increased on average 29% in 2015 compared to the prior year ‒ 101,500 video subscribers; 5,700 net activations in the quarter ‒ 132,400 internet subs; 9,300 subs added in the quarter Fioptics penetration: Video (27%) and Internet (35%) ($ in millions) Cincinnati is where we work, live and play. As the hometown provider – we offer our customers access to the fastest internet in town and a premier video package. $340

HEALTHY BALANCE SHEET AND SIGNIFICANT CASH FLOWS 10

Sale of wireless spectrum licenses closed in Q3 2014 for cash totaling $194 million. Proceeds were used to repay $23 million 8.375% Senior Notes due 2020 and temporarily repay revolving facilities to later finance Fioptics investment March 2015: Transferred tower lease obligations valued at approximately $25 million to Verizon Broadened relationship with Verizon We are doing what we said we would do Executing Objectives 11

Successfully completed THREE well timed and thoughtful monetizations of our CyrusOne investment Cash proceeds used to repay $785 million in debt reducing interest payments by ~ $70 million annually Continue to evaluate monetization strategies which maximize shareholder value - Monetization has improved our credit profile and reduced risk - Current 11% ownership valued at approximately $250 million - Remaining value of NOLs (approximately $500 million) will be used to defray any tax liability We are doing what we said we would do Executing Objectives 12

4.6x 2012 2013 2014 June 2015 Leverage Leverage Adj. for CONE Sale Leverage Adj. for CONE Investment2012 2013 2014 June 2015 Net debt has decreased by more than $1.3 billion since 2012 Annual interest savings of approximately $120 million compared to 2012 Improved leverage profile provides opportunity for more efficient capital structure management. Leverage ratio adjusted for CONE stake is favorable compared to peer group Net Debt [1] $’s in millions $2,666 $2,261 $1,726 Leverage Ratio [2] 13 $1,377 Strengthening our Financial Position 4.1x 3.2x 2015 leverage calculated based on Adjusted EBITDA guidance Corporate credit agreement requires 85 percent of CyrusOne proceeds be used to repay debt [1] [2]

Proforma for July Monetization 6/30/2015 Maturity Cash & Cash Equivalents 75$ - Cash and Cash Equivalents 15$ Corporate Credit Facility 175 Revolving Credit Facility - 7/15/17 Receivables Facility 110 Receivables Facility 3 5/30/16 Liquidity (June 30, 2015) 300 Term Loan B 531 9/10/20 CyrusOne proceeds 170 Capital Leases and Other Debt 69 Various Required debt repayments (145) Various Cincinnati Bell Telephone Notes 135 12/1/28 Liquidity as Adjusted 325$ 7.25% Senior Secured Notes due 2023 40 6/15/23 Senior Secured Debt 778$ 8.375% Senior Notes Due 2020 506 10/15/20 Total Debt 1,284$ Credit Statistics 2015 EBITDA Guidance1 297$ Senior Secured Leverage/EBITDA 2.6x Total Net Debt/EBITDA 4.1x Net Debt (Net of Cone)/EBITDA2 3.2x 1 Plus or minus 2% 2 Q2 2015 value of CONE $250 million Liquidity 6/30/15 14 Capital Structure Evaluating next steps to maintain maximum flexibility at lowest risk and cost [A] Corporate credit agreement requires 85 percent of CyrusOne proceeds be used to repay debt ($ in millions) [A]
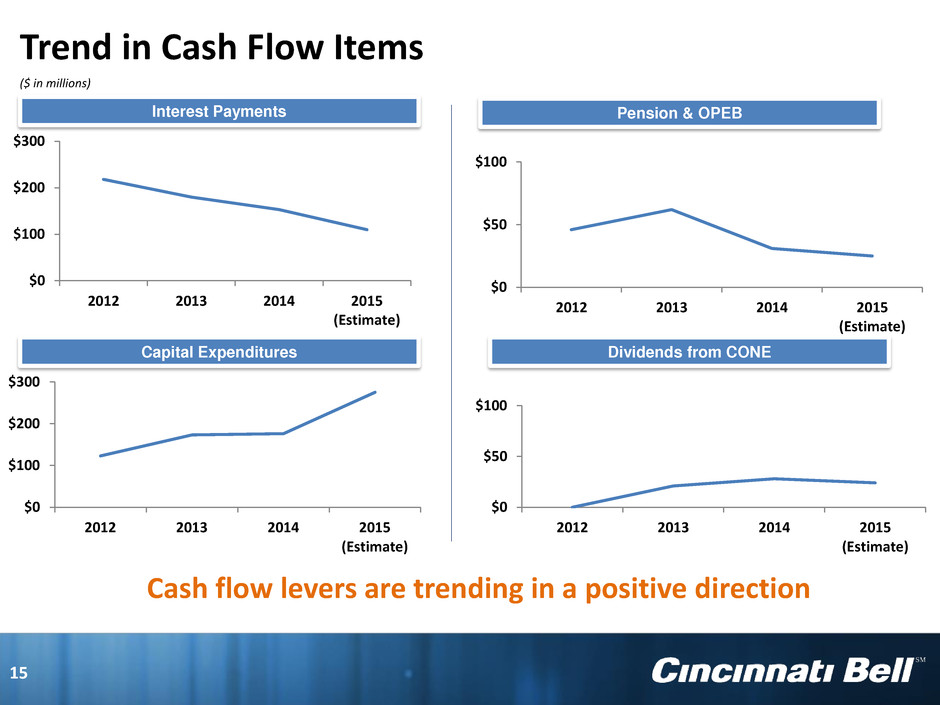
15 Trend in Cash Flow Items Interest Payments ($ in millions) Pension & OPEB Capital Expenditures Dividends from CONE Cash flow levers are trending in a positive direction $0 $100 $200 $300 2012 2013 2014 2015 (Estimate) $0 $100 $200 $300 2012 2013 2014 2015 (Estimate) $0 $50 $100 2012 2013 2014 2015 (Estimate) $0 $50 $100 2012 2013 2014 2015 (Estimate)

Reaffirming 2015 Revenue ($1.1 billion) and Adjusted EBITDA ($297 million) guidance Investments in strategic products continue to be success based Value creation will increase with both profit acceleration and multiple expansion Our plans for monetizing our investment in CyrusOne remain unchanged We are committed to our target leverage of less than 3.0x We are creating a company with unparalleled fiber assets, growing revenues, growing profits, a healthy balance sheet, and strong sustainable cash flows! Cincinnati Bell - Key Takeaways 16
