Attached files
| file | filename |
|---|---|
| 8-K - 8-K - Premier, Inc. | d19436d8k.htm |
| EX-99.1 - EX-99.1 - Premier, Inc. | d19436dex991.htm |
| EX-99.2 - EX-99.2 - Premier, Inc. | d19436dex992.htm |
 August
24, 2015 Fourth-Quarter and Fiscal Year 2015
Financial Results and Update
Exhibit 99.3 |
 2 © 2015 PREMIER, INC. Forward-looking statements—Certain statements included in this
presentation, including, but not limited to, those related to our
financial and business outlook, strategy and growth drivers, member
retention and renewal rates and revenue visibility, cross and upsell opportunities,
acquisition activities and pipeline, revenue available under contract,
and 2016 financial guidance and related assumptions, are
“forward-looking statements” within the meaning of the federal securities laws. Forward-looking statements may involve known and unknown risks, uncertainties and other factors that may cause the
actual results of Premier to be materially different from historical results or from
any future results or projections expressed or implied by such
forward-looking statements. Accordingly, readers should not place
undue reliance on any forward looking statements. Readers are urged to consider statements in the conditional or future tenses or that include terms such as “believes,” “belief,” “expects,”
“estimates,” “intends,” “anticipates” or
“plans” to be uncertain and forward-looking.
Forward-looking statements
may include comments as to Premier’s beliefs and expectations as to future events
and trends affecting its business and are necessarily subject to
uncertainties, many of which are outside Premier’s
control. More information on potential risks and other factors that could
affect Premier’s financial results is included, and updated, from
time to time, in Premier’s periodic and current filings with the
SEC, including Premier’s most recent Form 10-K for the year ended June 30, 2015, to be filed shortly thereafter. Forward-looking statements speak only as of the date they are made. Premier
undertakes no obligation to publicly update or revise any forward-looking
statements. Non-GAAP financial
measures—This presentation includes certain “non-GAAP financial measures”
as defined in Regulation G under the Securities Exchange Act of
1934. Schedules are attached that reconcile the non-GAAP financial
measures included in this presentation to the most directly comparable
financial measures calculated and presented in accordance with Generally Accepted Accounting Principles in the United States. Our Form 10-K for the year ended June 30, 2015, to be
filed shortly hereafter, provides further explanation and disclosure regarding our use
of non-GAAP financial measures and should be read in conjunction with
this presentation. Forward-looking statements and Non-GAAP financial
measures |
 Susan
DeVore, President & CEO Overview and Business Update
|
 4 © 2015 PREMIER, INC. Fiscal 2015 financial highlights * *See non-GAAP Adjusted EBITDA, Segment Adjusted EBITDA, and Adjusted Fully Distributed Earnings Per Share reconciliations to GAAP equivalents
in Appendix. Strong
performance with total revenue exceeding $1 billion Net revenue increased 16% Supply chain services revenue increased 16%
Performance services revenue increased 16%
Adjusted EBITDA increased 12% to $393.2 million
Adjusted fully distributed earnings per share increased 10% to $1.43 |
 5 © 2015 PREMIER, INC. Fiscal 2015 operating highlights Expanded our member base, finishing the year serving ~3,600 hospitals and ~120,000 other providers Achieved 99% GPO retention rate and 94% SaaS institutional renewal rate Supply chain spend through GPO increased 7% to $44 billion Expanded and enhanced PremierConnect ® platform Strong growth in Bundled Payment Collaborative Successfully integrated Theradoc and Aperek acquisitions |
 6 © 2015 PREMIER, INC. CECity acquisition expands performance improvement capabilities across the healthcare continuum Closed on August 20, 2015 Leader in performance management and improvement, pay-for-value reporting and professional education for healthcare professionals in ambulatory settings Provides the ability to deliver unique end-to-end solutions that span the continuum of care » Supporting providers as they move towards value- based payment models Purchase price of $400 million |
 7 © 2015 PREMIER, INC. Healthcare Insights acquisition enhances PremierConnect Supply Chain Closed on July 31, 2015 Integrated financial management software developer providing budgeting, forecasting, labor productivity and cost analytics capabilities Enabling a more comprehensive analytics solution to Premier’s existing cost and quality applications » Preparing for the growing movement to value-based payments to include bundling, shared savings and risk-based contracting Purchase price of $65 million |
 8 © 2015 PREMIER, INC. Healthcare is accelerating towards alternative payment models – population health is here to stay CURRENT VBP & regulatory cuts HACs & readmissions Shared savings Bundled payments Full risk sharing FUTURE HHS announces plan to accelerate payment shift » Shifting fee-for-service, Medicare payments to alternative payment models. Congress passes Medicare Access & CHIP Reauthorization Act of 2015 (MACRA) » Bill permanently reforms the Medicare physician payment system (Sustainable Growth Rate formula). Medicare payment reform – a watershed transformation Premier is well positioned to lead health systems through this transformation CMS announces plan to introduce mandatory payment model for joint replacements » Hospitals will be held accountable for the quality and costs of care from time of surgery through 90 days after discharge. |
 9 © 2015 PREMIER, INC. Positioned to lead in rapidly evolving healthcare environment Recent Medicare payment reform is a transformative trend that is accelerating healthcare to alternate payment models and away from fee-for-service. Member and Industry Needs » Total cost reduction » Quality improvement across the continuum » Evolving delivery and payment models » Actionable data and information Premier Strategic Differentiation » Scale » Co-innovation » Trusted to transform from the inside » Leadership in population health » Shared services and infrastructure |
 10 © 2015 PREMIER, INC. Continuing our momentum into fiscal 2016 Expect year-over-year double-digit revenue and adjusted EBITDA increases » Provider-centric model focused on serving our members » Developing solutions in close collaboration with members » Positioned to deliver consistent long-term value to stockholders Provider-centric and co-innovative alignment drives consistent and increasing demand for our solutions |
 Michael Alkire, Chief Operating Officer
Operations Update |
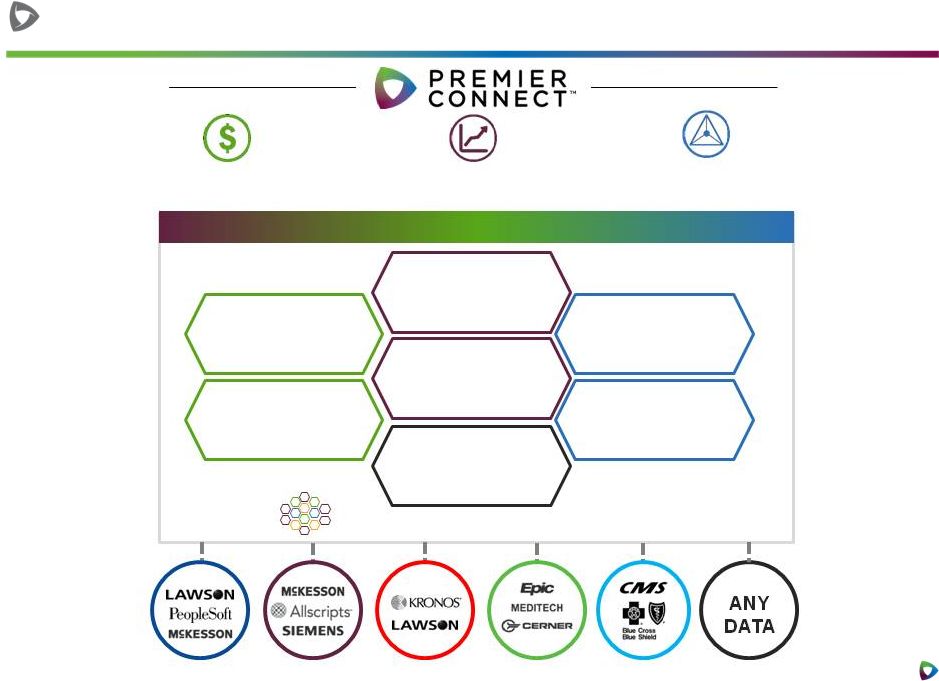 12 © 2015 PREMIER, INC. Addressing member needs for continuous improvement PREMIERCONNECT
SUPPLY CHAIN BILLING PURCHASING CLAIMS CLINICAL FINANCIAL Combines People, Process, and Technology Manage Populations Improve Quality and Safety Reduce Costs QUALITY & REGULATORY SAFETY PREMIERCONNECT
OPERATIONS PREMIERCONNECT
ENTERPRISE POPULATION HEALTH PREMIERCONNECT
RESEARCH PREMIERCONNECT
PREMIERCONNECT
PREMIERCONNECT
PREMIERCONNECT
DATA SERVICES |
 13 © 2015 PREMIER, INC. PremierConnect Quality » Premier Quality Cycle Management » Helping predict the financial impact of federal payment programs to health systems based on clinical outcomes PremierConnect Population Health » Community Focus » Assisting health systems to acquire, integrate and manage community-level health data » Creating targeted interventions to improve population health management Strengthening our platform of solutions PremierConnect Supply Chain » Enabling health systems to manage the entire procurement process across their acute and ambulatory settings |
 14 © 2015 PREMIER, INC. Rochester Regional Health » Extended GPO contract through 2020 » New PremierConnect Quality, Supply Chain and Safety relationships » Participation in QUEST and PACT performance improvement collaboratives 4Q’15 New and expanded relationships Peace Health » New PremierConnect Enterprise relationship Mercy Health » Extended PremierConnect Enterprise, Quality and Operations contracts » New specialty pharmacy member » 5-year GPO contract extension National Rural Health Association » New 5-year GPO contract University of Tennessee Medical Center » Extended agreement through 2020 to include GPO, PremierConnect Quality, Safety and Operations |
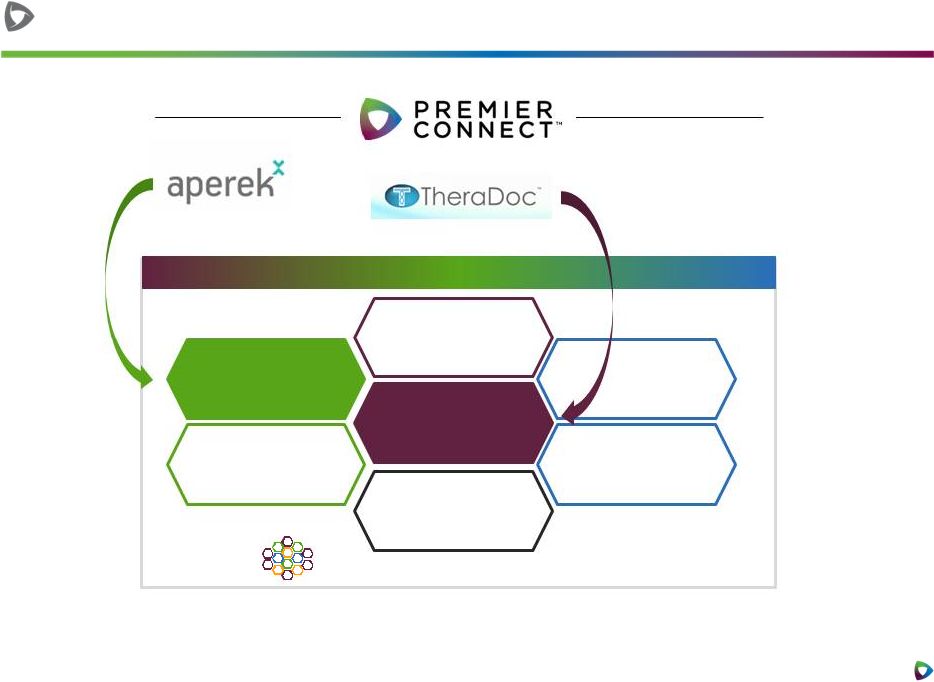 15 © 2015 PREMIER, INC. Platform provides path for successful integration Combines People, Process, and Technology PREMIERCONNECT
SUPPLY CHAIN QUALITY & REGULATORY SAFETY PREMIERCONNECT
OPERATIONS PREMIERCONNECT
ENTERPRISE PREMIERCONNECT
RESEARCH PREMIERCONNECT
POPULATION HEALTH PREMIERCONNECT DATA SERVICES PREMIERCONNECT
PREMIERCONNECT
|
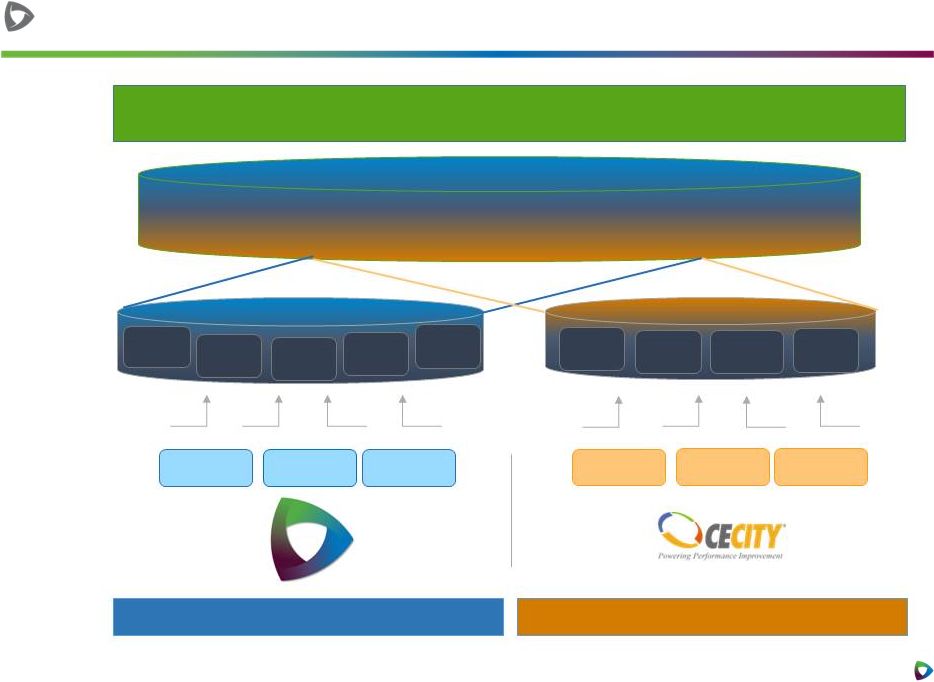 16 © 2015 PREMIER, INC. Unified Performance Management Seamless Acute to Ambulatory Platform Predictive Analytics Patient Safety Hospital Acquired Conditions Hospital eCQM HEDIS PQRS & Value Modifier ACO Ambulatory eCQM PCMH0 Acute Care Ambulatory Care Amb Clinical Amb Billing Additional Amb Systems Acute Clinical Acute Billing Additional Acute Systems PREMIER Data Sources Integrated performance management across continuum Premier CECity |
 17 © 2015 PREMIER, INC. CECity acquisition expands performance improvement capabilities across the healthcare continuum Leader in performance improvement, pay-for- value reporting and professional education for healthcare professionals in ambulatory settings End-to-end solutions spanning care continuum » Support providers as they move towards advanced payment models 1.2 million healthcare professionals 5,000 practices 100 professional societies |
 Craig
McKasson, Chief Financial Officer Financial Review
|
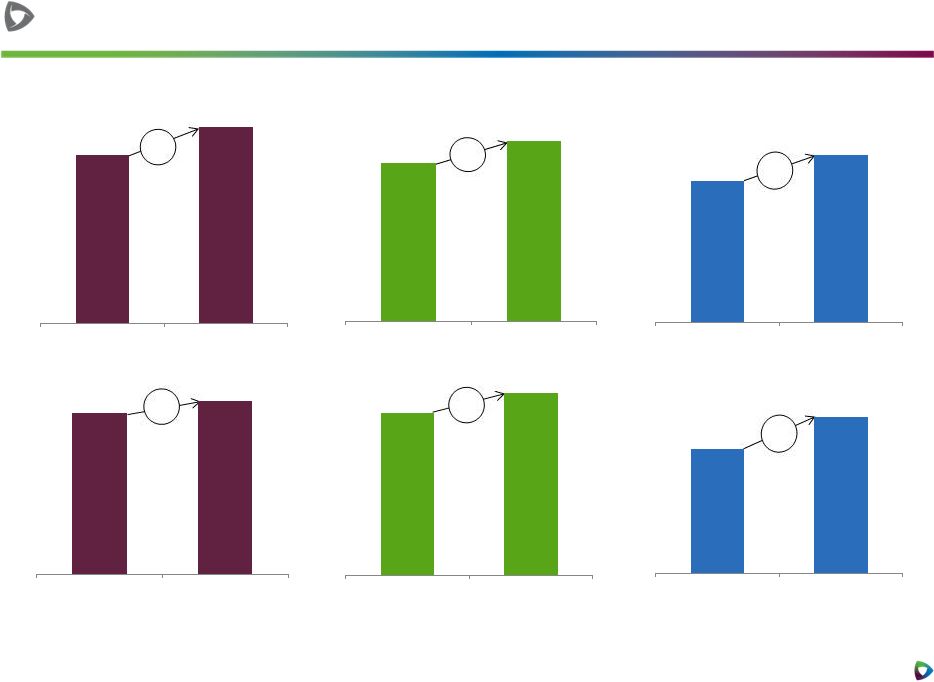 19 © 2015 PREMIER, INC. the 19.5 22.5 4Q'14 4Q'15 93.2 100.1 4Q'14 4Q'15 62.6 70.3 4Q'14 4Q'15 94.4 101.0 4Q'14 4Q'15 172.8 196.2 4Q'14 4Q'15 Fourth-quarter consolidated and segment highlights * Consolidated Net revenue ($millions) Supply Chain Services Net revenue ($millions) Performance Services Net revenue ($millions) Adjusted EBITDA ($millions) Adjusted EBITDA ($millions)
Adjusted EBITDA
($millions) *See
non-GAAP Adjusted EBITDA and non-GAAP Segment Adjusted EBITDA reconciliations to GAAP equivalents in Appendix. 235.5 266.6 4Q'14 4Q'15 13% 14% 12% 7% 7% 15% |
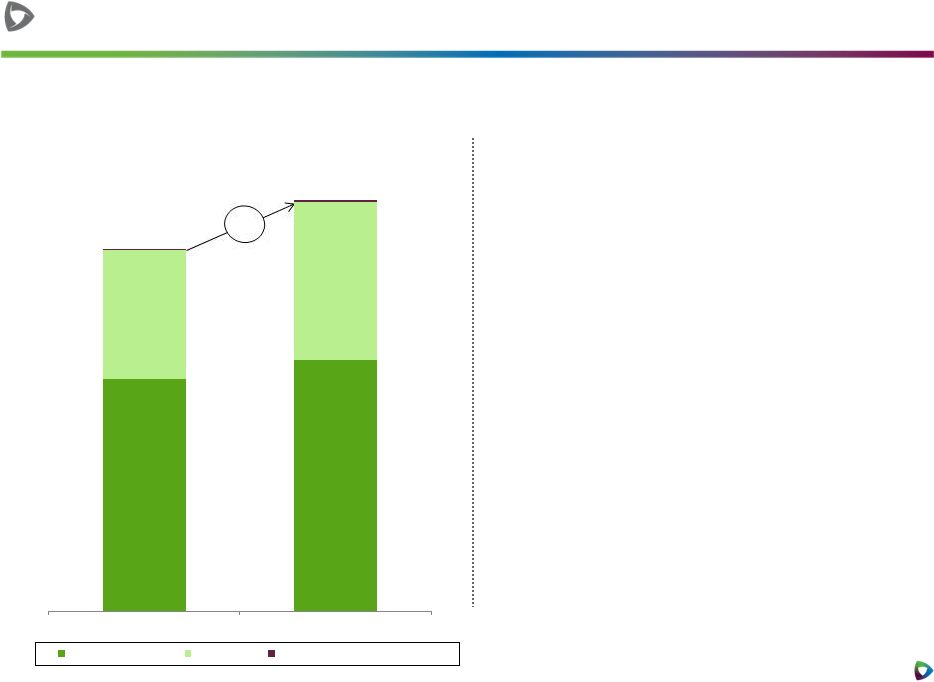 20 © 2015 PREMIER, INC. Fourth-quarter Supply Chain Services revenue 111.0 119.9 61.5 75.6 4Q'14 4Q'15 Net Admin Fees Products Other Services and Support 14% 172.8 196.2 Supply Chain Services Net revenue ($millions) Supply Chain Services revenue increased 14% » GPO net admin fees revenue increased 8% » Expanding contract penetration in both acute and alternate site » Continuing impact of the recruitment and conversion of new members » Improved utilization trends » Products revenue increased 23% » Ongoing member support for direct sourcing and specialty pharmacy businesses |
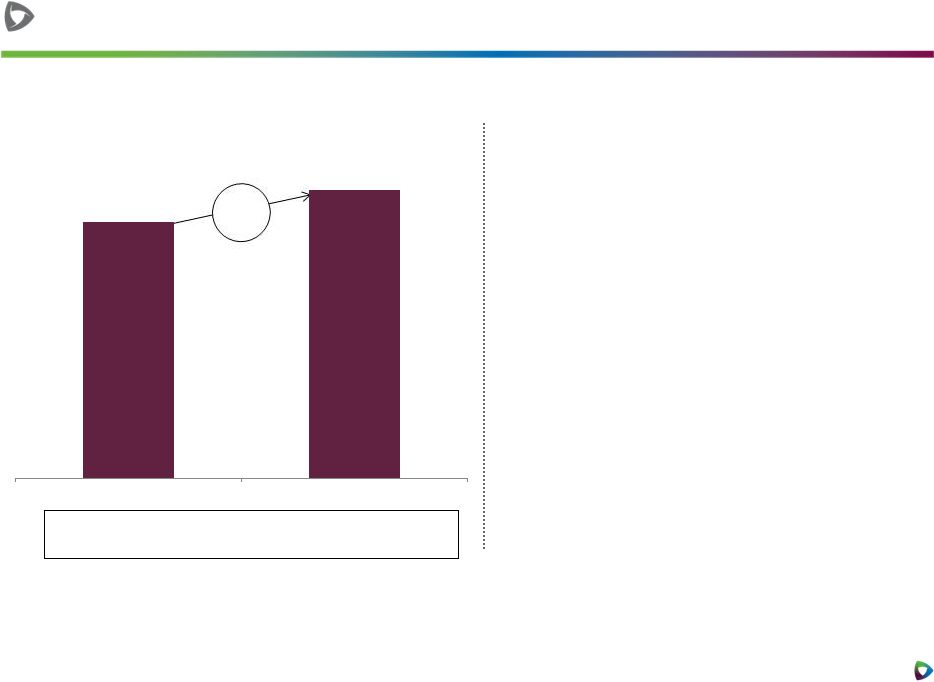
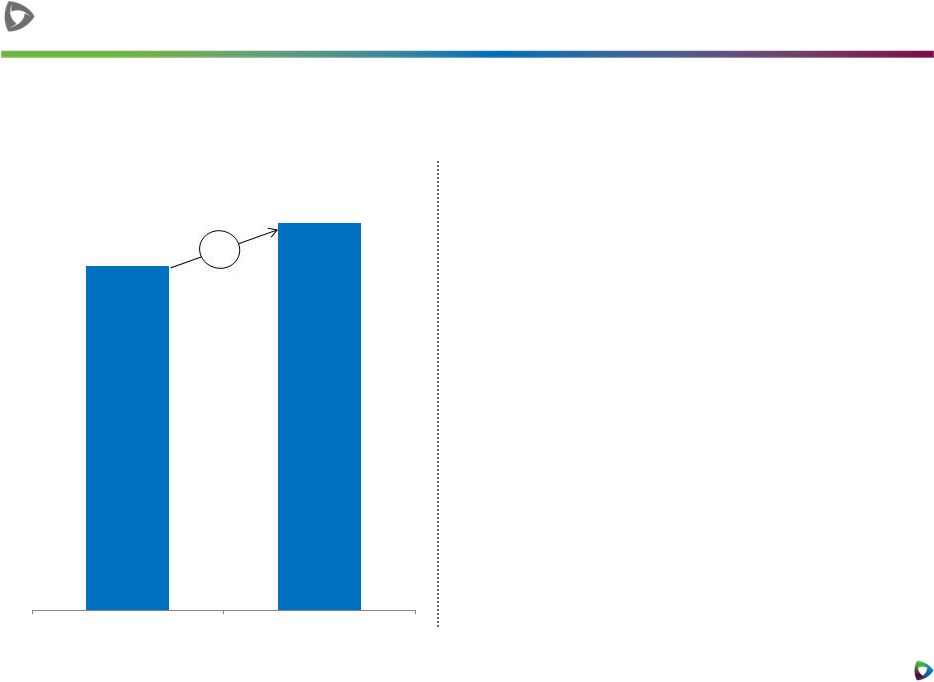 21 © 2015 PREMIER, INC. Fourth-quarter Performance Services revenue 62.6 70.3 4Q'14 4Q'15 12% Performance Services Net revenue ($millions) » Performance Services revenue increased 12% » Continued growth of PremierConnect SaaS-based subscriptions and renewals » Continued growth of Advisory Services led by engagements tied to: » Population health » Physician preference |
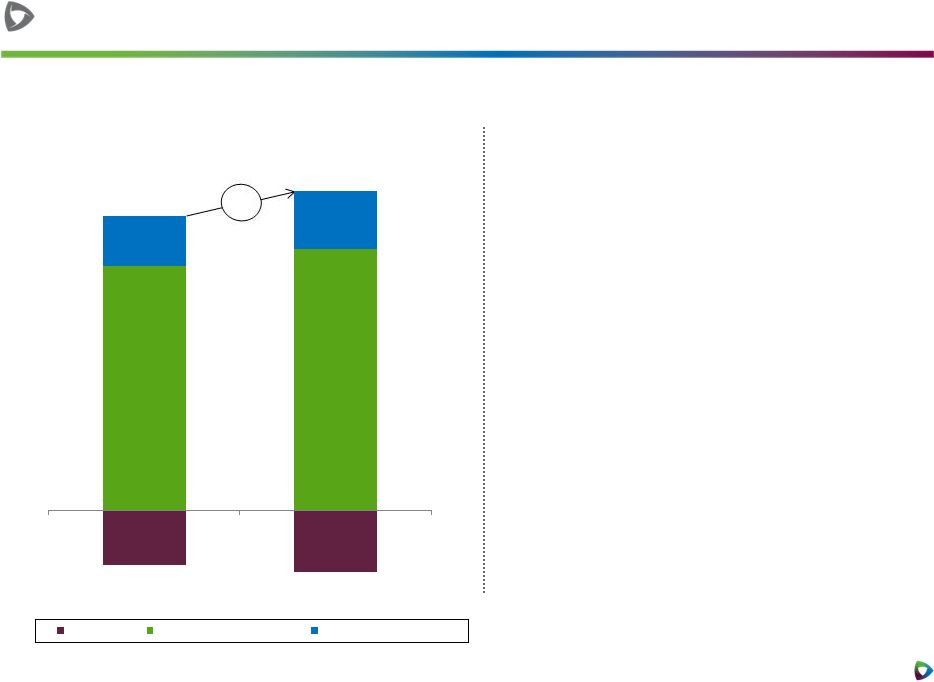 22 © 2015 PREMIER, INC. Fourth-quarter adjusted EBITDA* (20.7) (23.4) 94.4 101.0 19.5 22.5 4Q'14 4Q'15 Corporate Supply Chain Services Performance Services Adjusted EBITDA ($millions)
93.2 100.1 Consolidated adjusted EBITDA increased 7% » Supply Chain Services adjusted EBITDA increased 7% » Strong net admin fee revenue growth » Performance Services adjusted EBITDA increased 15% » New PremierConnect SaaS-based subscription sales » Contribution from Aperek and Theradoc acquisitions » Effective management of operating expenses * See non-GAAP adjusted fully distributed net income and non-GAAP earnings per share on
fully distributed net income reconciliations to GAAP equivalents in
Appendix 7% |
 23 © 2015 PREMIER, INC. Fourth-quarter non-GAAP adjusted fully distributed net income * 49.9 53.0 4Q'14 4Q'15 (in millions, except per share data) $0.34 $0.36 Non-GAAP earnings per share on adjusted fully distributed net income – diluted * See non-GAAP adjusted fully distributed net income and non-GAAP earnings per share on
fully distributed net income reconciliations to GAAP equivalents in
Appendix »
Calculates income taxes at
40% on pre-tax income,
assuming taxable C corporate
structure » Calculates adjusted fully distributed earnings per share, assuming total Class A and B common shares held by public 6% |
 24 © 2015 PREMIER, INC. Cash flow and capital flexibility at June 30, 2015 CONSIDERABLE CASH AND DEBT CAPACITY AVAILABLE AMPLE CAPITAL FLEXIBILITY FOR FUTURE ACQUISITIONS AND BUSINESS GROWTH *Three months ended June 30, 2015. Company defines free cash flow as cash provided by operating activities less distributions to limited partners
and purchases of property and equipment. See non-GAAP free cash
flow reconciliation to GAAP equivalent in Appendix. Fiscal 2015 cash flow
from operations of $364.1 million
Fourth-quarter free cash flow increases 28% to
$53.9 million * Cash, cash equivalents & marketable securities of $561.9 million No outstanding borrowings on $750 million five- year unsecured revolving credit facility Subsequent to fiscal year end, Premier used approximately $315 million in cash and $150
million from its credit facility to fund the acquisitions of Healthcare Insights and
CECity |
 25 © 2015 PREMIER, INC. Fiscal 2016 annual guidance* * Guidance is based on comparisons with prior-year non-GAAP pro forma results, which have been adjusted to reflect the impact of the
company’s reorganization and IPO. The Company does not reconcile
guidance for adjusted EBITDA and non-GAAP adjusted fully distributed net income per-share to net income (loss) or GAAP earnings per share because the Company does not provide guidance for reconciling items between net income (loss) and adjusted EBITDA and non-GAAP adjusted fully
distributed earnings per share. The Company is unable to provide guidance
for these reconciling items since certain items that impact net income (loss) are outside of the Company’s control and cannot be reasonably predicted. Accordingly, a reconciliation to net income (loss) or GAAP earnings per share is not available without unreasonable
effort. Financial guidance for year ending June 30, 2016:
Supply Chain Services growth driven by:
» Mid-single-digit net administrative fee revenue growth » 16-19% product revenue growth » Continued high GPO retention rates Guidance Assumptions: Performance Services growth driven by: » Continued demand for integrated offerings of SaaS-based subscription and licensed products, advisory services and collaboratives » Continuation of high SaaS institutional renewal rates » $30-35 million revenue and $7-9 million adjusted EBITDA contributions from CECity and Healthcare Insights acquisitions (in millions, except per share data) FY 2016 % YoY Increase Net Revenue: Supply Chain Services segment $792.0 - $813.0 7% - 10% Performance Services segment $346.0 - $355.0 29% - 32% Total Net Revenue $1,138.0 - $1,168.0 13% - 16% Non-GAAP adjusted EBITDA $425.0 - $444.0 8% - 13% Non-GAAP adjusted fully distributed EPS $1.54 - $1.62 8% - 13% Fiscal 2016 Financial Guidance Premier, Inc. introduces full-year fiscal 2016 financial guidance, as follows:
|
 26 © 2015 PREMIER, INC. Capital expenditures of ~$83M for the year
Adjusted EBITDA margin approximating
37-38% of net revenue
Effective tax rate of 40%
Additional fiscal 2016 guidance assumptions |
 27 © 2015 PREMIER, INC. Exchange update On July 31 , 2015, approximately 91,000 Class B units were exchanged for Class A common shares on 1-for-1 basis; equal number of Class B common shares retired The upcoming October 31, 2015 exchange process is underway. » Maximum of 6.2 million shares indicated for exchange » Indicated shares remain subject to retraction and purchase by other member owners under right-of- first-refusal process |
 Questions |
 Appendix |
 30 © 2015 PREMIER, INC. Fiscal 2015 and fiscal 2014 non-GAAP reconciliations 2015* 2014* 2015* 2014 Reconciliation of Pro Forma Net Revenue to Net Revenue:
Pro Forma Net Revenue
266,553
$
235,466
$
1,007,029
$
869,286
$
Pro forma adjustment for revenue share
post-IPO —
—
—
41,263
Net Revenue
266,553
$
235,466
$
1,007,029
$
910,549
$
Net income
32,061
$
66,632
$
234,785
$
332,617
$
Pro forma adjustment for revenue share
post-IPO —
—
—
(41,263)
Interest and investment income, net
(349)
(378)
(866)
(1,019)
Income tax expense
24,235
3,248
36,342
27,709
Depreciation and amortization
12,079
9,809
45,186
36,761
Amortization of purchased intangible assets
2,538
904
9,136
3,062
EBITDA
70,564
80,215
324,583
357,867
Stock-based compensation
7,369
6,358
28,498
19,476
Acquisition related expenses
2,629
711
9,037
2,014
Strategic and financial restructuring
expenses 92
146
1,373
3,760
(Gain) loss on investment
—
(522)
1,000
(38,372)
Adjustment to tax receivable agreement
liability —
6,215
—
6,215
Acquisition related adjustment -
deferred revenue
4,147
—
13,371
—
Loss on disposal of long-lived assets
15,243
15,243
Other expense (income), net
60
121
70
65
Adjusted EBITDA
100,104
$
93,244
$
393,175
$
351,025
$
Segment Adjusted EBITDA:
Supply Chain Services
100,970
$
94,394
$
391,180
$
396,470
$
Pro forma adjustment for revenue share
post-IPO —
—
—
(41,263)
Supply Chain Services
(including pro forma adjustment)
100,970
$
94,394
$
391,180
$
355,207
$
Performance Services
22,518
19,531
90,235
73,898
Corporate
(23,384)
(20,681)
(88,240)
(78,080)
Adjusted EBITDA
100,104
$
93,244
$
393,175
$
351,025
$
Depreciation and amortization
(12,079)
(9,809)
(45,186)
(36,761)
Amortization of purchased intangible assets
(2,538)
(904)
(9,136)
(3,062)
Stock-based compensation
(7,369)
(6,358)
(28,498)
(19,476)
Acquisition related expenses
(2,629)
(711)
(9,037)
(2,014)
Strategic and financial restructuring
expenses (92)
(146)
(1,373)
(3,760)
Adjustment to tax receivable agreement
liability —
(6,215)
—
(6,215)
Acquisition related adjustment -
deferred revenue
(4,147)
—
(13,371)
—
Equity in net income of unconsolidated
affiliates (6,473)
(4,805)
(21,285)
(16,976)
Deferred compensation plan expense (income)
544
(1,972)
753
(1,972)
65,321
62,324
266,042
260,789
Pro forma adjustment for revenue share
post-IPO —
—
—
41,263
Operating income
65,321
$
62,324
$
266,042
$
302,052
$
Equity in net income of unconsolidated
affiliates 6,473
4,805
21,285
16,976
Interest and investment income, net
349
378
866
1,019
(Loss) gain on investment
—
522
(1,000)
38,372
Loss on disposal of long-lived assets
(15,243)
—
(15,243)
—
Other (expense) income, net
(604)
1,851
(823)
1,907
Income before income taxes
56,296
$
69,880
$
271,127
$
360,326
$
* Note that no pro forma adjustments were made for the
three months and year ended June 30, 2015 and the three months ended June 30, 2014; as such, actual results are presented for each of these periods.
Three Months Ended
June 30,
Year Ended
June 30,
Supplemental Financial Information -
Reporting of Pro Forma Adjusted EBITDA
(Unaudited)
(In thousands)
Reconciliation of Selected Non-GAAP Measures to GAAP
Measures and Non-GAAP Adjusted Fully
Distributed Net Income Reconciliation of Net
Income to Adjusted EBITDA and Reconciliation of Segment Adjusted EBITDA to Income Before Income Taxes: |
 31 © 2015 PREMIER, INC. Fiscal 2015 and fiscal 2014 non-GAAP reconciliations 2015* 2014* 2015* 2014 Reconciliation of Non-GAAP Pro Forma Adjusted Fully Distributed Net Income:
Net income attributable to shareholders
7,990
$
8,879
$
38,743
$
28,332
$
Pro forma adjustment for revenue share
post-IPO —
—
—
(41,263)
Income tax expense
24,235
3,248
36,342
27,709
Stock-based compensation
7,369
6,358
28,498
19,476
Acquisition related expenses
2,629
711
9,037
2,014
Strategic and financial restructuring
expenses 92
146
1,373
3,760
(Gain) loss on investment
—
(522)
1,000
(38,372)
Adjustment to tax receivable agreement
liability —
6,215
—
6,215
Acquisition related adjustment -
deferred revenue
4,147
—
13,371
—
Loss on disposal of long-lived assets
15,243
—
15,243
—
Amortization of purchased intangible
assets 2,538
904
9,136
3,062
Net income attributable to noncontrolling interest in
Premier LP 24,071
57,281
194,206
303,336
Non-GAAP pro forma adjusted fully distributed
income before income taxes
88,314
83,220
346,949
314,269
Income tax expense on fully distributed income before
income taxes 35,326
33,288
138,780
125,708
Non-GAAP Pro Forma Adjusted Fully Distributed Net
Income 52,988
$
49,932
$
208,169
$
188,561
$
* Note that no pro forma adjustments were made for the
three months and year ended June 30, 2015 and the three months ended June 30, 2014; as such, actual results are presented for each of these periods.
Three Months Ended
June 30,
Year Ended
June 30,
Supplemental
Financial
Information
-
Reporting
of
Pro
Forma
Adjusted
EBITDA
(Unaudited)
(In thousands)
Reconciliation of Selected Non-GAAP Measures to GAAP
Measures and Non-GAAP Adjusted Fully
Distributed Net Income |
 32 © 2015 PREMIER, INC. Fiscal 2015 and fiscal 2014 non-GAAP reconciliations 2015 2014 Reconciliation of Non-GAAP Free Cash Flow to Net Cash Provided by Operating Activities:
Net cash provided by operating activities
108,483
$
79,431
$
Purchases of property and
equipment (19,670)
(15,898)
$
Distributions to limited partners
(23,412)
(21,299)
$
Payments to limited partners under tax receivable
agreements (11,499)
—
$
Non-GAAP
free cash flow 53,902
$
42,234
$
Supplemental Financial Information -
Reporting of Non-GAAP Free Cash Flow
Reconciliation of Selected Non-GAAP Measures to GAAP
Measures (Unaudited)
(In thousands)
Three Months Ended
June 30, |
 33 © 2015 PREMIER, INC. Fiscal 2015 and fiscal 2014 non-GAAP reconciliations 2015* 2014* 2015* 2014 Reconciliation of numerator for GAAP EPS to Non-GAAP EPS on Net Income Attributable to Stockholders
Net (loss) income attributable to stockholders after
adjustment of redeemable
(84,076)
$
491,389
$
(865,292)
$
(2,713,256)
$
Adjustment of redeemable limited partners' capital to
redemption amount 92,066
(482,510)
904,035
2,741,588
Net income attributable to stockholders
7,990
8,879
38,743
28,332 Reconciliation of
denominator for GAAP EPS to Non-GAAP EPS on Net Income Attributable to Stockholders Weighted Average: Common shares used for basic and diluted earnings per share
37,576
32,375
35,681
25,633 Potentially dilutive
shares
1,592
194
1,048
124
Weighted average fully distributed shares outstanding
- diluted
39,168
32,569
36,729
25,757 Reconciliation of GAAP EPS to
Non-GAAP EPS on Net Income Attributable to Stockholders GAAP earnings (loss) per share $ (2.24)
$
15.18
$ (24.25) $ (105.85)
Impact of adjustment of redeemable limited partners'
capital to redemption amount
$ 2.45 $ (14.90)
$ 25.34 $ 106.96
Impact of potentially dilutive shares
$ (0.01) $ (0.01)
$ (0.04) $ (0.01)
Non-GAAP earnings per share on net income attributable
to stockholders - diluted
$ 0.20 $ 0.27
$ 1.05 $ 1.10
Reconciliation of numerator for GAAP EPS to Non-GAAP
EPS on Adjusted Fully Distributed Net Income
Net (loss) income attributable to shareholders after
adjustment of redeemable limited partners'
capital to redemption amount
(84,076)
$
491,389
$
(865,292)
$
(2,713,256)
$
Adjustment of redeemable limited partners' capital to
redemption amount 92,066
(482,510)
904,035
2,741,588
Net income attributable to shareholders
7,990
8,879
38,743
28,332 Pro forma adjustment
for revenue share post-IPO
—
—
—
(41,263)
Income tax expense
24,235
3,248
36,342
27,709
Stock-based compensation
7,369
6,358
28,498
19,476
Acquisition related expenses
2,629
711
9,037
2,014
Strategic and financial restructuring
expenses 92
146
1,373
3,760
(Gain) loss on investment
—
(522)
1,000
(38,372)
Adjustment to tax receivable agreement
liability —
6,215
—
6,215
Acquisition related adjustment - deferred
revenue 4,147
—
13,371
—
Loss on disposal of long-lived assets
15,243
—
15,243
—
Amortization of purchased intangible assets
2,538
904
9,136
3,062
Net income attributable to noncontrolling interest in
Premier LP 24,071
57,281
194,206
303,336
Non-GAAP pro forma adjusted fully distributed income
before income taxes 88,314
83,220
346,949
314,269
Income tax expense on fully distributed income before
income taxes 35,326
33,288
138,780
125,708
Non-GAAP pro forma adjusted fully distributed net
income 52,988
$
49,932
$
208,169
$
188,561
$
Reconciliation of denominator for GAAP EPS to Non-GAAP
Adjusted Fully Distributed Net Income
Weighted Average:
Common shares used for basic and diluted earnings per
share
37,576
32,375
35,681
25,633 Potentially dilutive
shares
1,592
194
1,048
124 Class A common shares outstanding
-
-
-
6,742 Conversion
of Class B common units
106,471
112,511
108,518
112,584 Weighted average fully distributed
shares outstanding - diluted
145,639
145,080
145,247
145,083
Reconciliation of GAAP EPS to Adjusted Fully
Distributed EPS GAAP earnings (loss) per
share
$ (2.24) $ 15.18
$
(24.25)
$ (105.85) Impact of adjustment of redeemable limited partners' capital to redemption amount
$ 2.45 $ (14.90)
$ 25.34 $ 106.96
Impact of additions:
Pro forma adjustment for revenue share
post-IPO
$ - $ -
$ - $ (1.61)
Income tax expense
$ 0.64 $ 0.10
$ 1.02 $ 1.08
Stock-based compensation
$ 0.20 $ 0.20
$ 0.80 $ 0.76
Acquisition related expenses
$ 0.07 $ 0.02
$ 0.25 $ 0.08
Strategic and financial restructuring
expenses
$ 0.00 $ 0.00
$ 0.04 $ 0.15
(Gain) loss on investment
$ - $ (0.02)
$ 0.03 $ (1.50)
Adjustment to tax receivable agreement
liability
$ - $ 0.19
$ - $ 0.24
Acquisition related adjustment - deferred
revenue
$ 0.11 $ -
$ 0.37 $
- Loss on disposal of
long-lived assets
$ 0.41 $ -
$ 0.43 $
- Amortization of
purchased intangible assets
$ 0.07 $ 0.03
$ 0.26 $ 0.12
Net income attributable to noncontrolling interest in
Premier LP
$ 0.64 $ 1.77
$ 5.44 $ 11.83
Impact of corporation taxes
$ (0.94) $ (1.03)
$ (3.90) $ (4.90)
Impact of increased share count
$ (1.05) $ (1.20)
$ (4.40) $ (6.06)
Non-GAAP earnings per share on adjusted fully
distributed net income - diluted
$ 0.36 $ 0.34
$ 1.43 $ 1.30
* Note that no pro forma adjustments were made for the
three months and year ended June 30, 2015 and the three months ended June 30, 2014; as such, actual results are presented for each of these periods.
Three Months Ended
June 30,
Year Ended
June 30,
Supplemental Financial Information - Reporting of Net
Income and Earnings Per Share
(Unaudited)
(In thousands, except per share data)
Reconciliation of Selected Non-GAAP Measures to GAAP
Measures |