Attached files
| file | filename |
|---|---|
| EX-32.1 - EX-32.1 - VIAVI SOLUTIONS INC. | a15-16909_1ex32d1.htm |
| EX-31.1 - EX-31.1 - VIAVI SOLUTIONS INC. | a15-16909_1ex31d1.htm |
| EX-32.2 - EX-32.2 - VIAVI SOLUTIONS INC. | a15-16909_1ex32d2.htm |
| EX-10.5 - EX-10.5 - VIAVI SOLUTIONS INC. | a15-16909_1ex10d5.htm |
| EX-10.3 - EX-10.3 - VIAVI SOLUTIONS INC. | a15-16909_1ex10d3.htm |
| EX-31.2 - EX-31.2 - VIAVI SOLUTIONS INC. | a15-16909_1ex31d2.htm |
| EX-10.18 - EX-10.18 - VIAVI SOLUTIONS INC. | a15-16909_1ex10d18.htm |
| EX-10.10 - EX-10.10 - VIAVI SOLUTIONS INC. | a15-16909_1ex10d10.htm |
| EX-10.19 - EX-10.19 - VIAVI SOLUTIONS INC. | a15-16909_1ex10d19.htm |
| EX-23.1 - EX-23.1 - VIAVI SOLUTIONS INC. | a15-16909_1ex23d1.htm |
| XML - IDEA: XBRL DOCUMENT - VIAVI SOLUTIONS INC. | R9999.htm |
| EX-21.1 - EX-21.1 - VIAVI SOLUTIONS INC. | a15-16909_1ex21d1.htm |
UNITED STATES
SECURITIES AND EXCHANGE COMMISSION
Washington, D.C. 20549
FORM 10-K
(Mark One)
x ANNUAL REPORT PURSUANT TO SECTION 13 OR 15 (d) OF THE SECURITIES EXCHANGE ACT OF 1934
For the fiscal year ended June 27, 2015
OR
o TRANSITION REPORT PURSUANT TO SECTION 13 OR 15(d) OF THE SECURITIES EXCHANGE ACT OF 1934
For the transition period from to
Commission File Number 0-22874
Viavi Solutions Inc.
(Exact name of Registrant as specified in its charter)
|
Delaware |
|
94-2579683 |
|
(State or other jurisdiction of |
|
(I.R.S. Employer |
430 North McCarthy Boulevard, Milpitas, California 95035
(Address of principal executive offices including Zip code)
(408) 404-3600
(Registrant’s telephone number, including area code)
Securities registered pursuant to Section 12(b) of the Act:
|
Title of each class |
|
Name of exchange on which registered |
|
Common Stock, par value of $0.001 per share |
|
The NASDAQ Stock Market LLC |
Securities registered pursuant to Section 12(g) of the Act: None
Indicate by check mark if the registrant is a well-known seasoned issuer, as defined in Rule 405 of the Securities Act. Yes x No o
Indicate by check mark if the registrant is not required to file reports pursuant to Section 13 or 15(d) of the Act. Yes o No x
Indicate by check mark whether the Registrant (1) has filed all reports required to be filed by Section 13 or 15(d) of the Securities Exchange Act of 1934 during the preceding 12 months (or for such shorter period that the Registrant was required to file such reports), and (2) has been subject to such filing requirements for the past 90 days. Yes x No o
Indicate by check mark whether the registrant has submitted electronically and posted on its corporate Web site, if any, every Interactive Data File required to be submitted and posted pursuant to Rule 405 of Regulation S-T during the preceding 12 months (or for such shorter period that the registrant was required to submit and post such files). Yes x No o
Indicate by check mark if disclosure of delinquent filers pursuant to Item 405 of Regulation S-K is not contained herein, and will not be contained to the best of the Registrant’s knowledge, in definitive proxy or information statements incorporated by reference in Part III of this Form 10-K or any amendment to this Form 10-K. o
Indicate by check mark whether the registrant is a large accelerated filer, an accelerated filer, a non-accelerated filer, or a smaller reporting company. See definition of “large accelerated filer,” “accelerated filer” and “smaller reporting company” in Rule 12b-2 of the Exchange Act. (Check one):
|
Large accelerated filer x |
|
Accelerated filer o |
|
|
|
|
|
Non-accelerated filer o |
|
Smaller reporting company o |
Indicate by check mark whether the registrant is a shell company (as defined in Rule 12b-2 of the Exchange Act). Yes o No x
As of December 27, 2014 the aggregate market value of the voting and non-voting common equity held by non-affiliates of the Registrant was approximately $3.2 billion, based upon the closing sale prices of the common stock as reported on the NASDAQ Stock Market LLC. Shares of common stock held by executive officers and directors have been excluded from this calculation because such persons may be deemed to be affiliates. This determination of affiliate status is not necessarily a conclusive determination for other purposes.
As of July 27, 2015, the Registrant had 235,325,963 shares of common stock outstanding.
Documents Incorporated by Reference: Portions of the Registrant’s Notice of Annual Meeting of Stockholders and Proxy Statement to be filed pursuant to Regulation 14A within 120 days after Registrant’s fiscal year end of June 27, 2015 are incorporated by reference into Part III of this Report.
FORWARD-LOOKING STATEMENTS
Statements contained in this Annual Report on Form 10-K which are not historical facts are forward-looking statements within the meaning of Section 21E of the Securities Exchange Act of 1934, as amended. A forward-looking statement may contain words such as “anticipates,” “believes,” “can,” “can impact,” “could,” “continue,” “estimates,” “expects,” “intends,” “may,” “ongoing,” “plans,” “potential,” “projects,” “should,” “will,” “will continue to be,” “would,” or the negative thereof or other comparable terminology regarding beliefs, plans, expectations or intentions regarding the future. Forward-looking statements include statements such as:
· Our expectations regarding demand for our products, including continued trends in end-user behavior and technological advancements that may drive such demand and the role we will play in those advancements;
· Our plans for growth and innovation opportunities;
· The anticipated costs, benefits and other impacts of the separation of the Lumentum business;
· Financial projections and expectations, including profitability of certain business units, plans to reduce costs and improve efficiencies, the effects of seasonality on certain business units, continued reliance on key customers for a significant portion of our revenue, future sources of revenue, competition and pricing pressures, the future impact of certain accounting pronouncements and our estimation of the potential impact and materiality of litigation;
· Our plans for continued development, use and protection of our intellectual property;
· Our strategies for achieving our current business objectives, including related risks and uncertainties;
· Our plans or expectations relating to investments, acquisitions, partnerships and other strategic opportunities;
· Our strategies for reducing our dependence on sole suppliers or otherwise mitigating the risk of supply chain interruptions;
· Our research and development plans and the expected impact of such plans on our financial performance; and
· Our expectations related to our products, including costs associated with the development of new products, product yields, quality and other issues.
Management cautions that forward-looking statements are based on current expectations and assumptions and are subject to risks and uncertainties that could cause our actual results to differ materially from those projected in such forward-looking statements. These forward-looking statements are only predictions and are subject to risks and uncertainties including those set forth in Part I, Item 1A “Risk Factors” and elsewhere in this Annual Report on Form 10-K and in other documents we file with the Securities and Exchange Commission. Moreover, neither we assume nor any other person assumes responsibility for the accuracy and completeness of these forward-looking statements. Forward-looking statements are made only as of the date of this Report and subsequent facts or circumstances may contradict, obviate, undermine or otherwise fail to support or substantiate such statements. We are under no duty to update any of the forward-looking statements after the date of this Form 10-K to conform such statements to actual results or to changes in our expectations.
GENERAL
Overview
Viavi Solutions Inc. (“Viavi,” also referred to as “the Company,” “we,” “our,” and “us”), formerly JDS Uniphase Corporation (“JDSU”), is a leading provider of network and service enablement solutions and optical products for telecommunications service providers, wireless operators, cable operators, network-equipment manufacturers (“NEMs”) and enterprises. We are also an established leader in anti-counterfeiting solutions for currency authentication, and provide high-value optical components and instruments for security, safety, electronics, and other applications. In addition, we leverage our core networking and optical technology expertise to deliver high-powered commercial lasers for manufacturing applications and expand into emerging markets, including 3-D sensing solutions for consumer electronics.
On September 10, 2014, we announced plans to separate into two publicly traded companies:
· an optical components and commercial lasers company, Lumentum Holdings Inc. (“Lumentum”), consisting of our Communications and Commercial Optical Products (“CCOP”) segment and the WaveReady product line within our Network Enablement (“NE”) segment; and
· a network and service enablement and optical coatings company, renamed Viavi, consisting of our NE, Service Enablement (“SE”) and Optical Security and Performance Products (“OSP”) segments.
On August 1, 2015, we completed the distribution of approximately 80.1% of the outstanding shares of Lumentum common stock to our stockholders. We were renamed Viavi and, at the time of the distribution, retained ownership of approximately 19.9% of Lumentum’s outstanding shares. The Company’s consolidated financial statements in this Annual Report on Form 10-K include the Lumentum business which will be reported as a discontinued operation beginning in the first quarter of fiscal 2016. Except as otherwise noted, all references in this Annual Report on Form 10-K to the CCOP business are to the CCOP segment as it existed during fiscal 2015 and prior periods. Information on the strategy and business of the CCOP business is contained in the Registration Statement on Form 10, as amended (“Form 10”), for Lumentum Holdings Inc., as filed with the U.S. Securities and Exchange Commission (“SEC”). Although the contents of the Form 10 are not incorporated herein by reference, because the CCOP business is no longer part of Viavi, this Annual Report on Form 10-K is limited to historical financial reporting and other information for the CCOP business.
In addition, during the first quarter of fiscal 2015 we reorganized our Network Service and Enablement (“NSE”) reportable segment into two separate reportable segments: Network Enablement and Service Enablement. Splitting NSE into two reportable segments provides greater clarity and transparency regarding the markets, financial performance and business models of our NE and SE businesses. NE is a hardware-centric and more mature business consisting primarily of NSE’s traditional communications test instrument products. SE is a software-centric business consisting primarily of software solutions that are embedded within the network and enterprise performance management solutions. Historical segment information has been recast to conform to this new reporting structure.
To serve our markets, during fiscal 2015 we operated the following business segments:
· Network Enablement
· Service Enablement
· Communications and Commercial Optical Products
· Optical Security and Performance Products
Beginning August 1, 2015, as a result of the separation of the Lumentum business, the Company no longer sells products and services from the CCOP segment or the WaveReady product line. Net revenue from the Waveready product line represented 3.8%, 3.7% and 4.5% of NE net revenue in fiscal 2015, 2014 and 2013, respectively.
Industry Trends
The trends that drive the communications networking industry influence our NE and SE businesses, including the need for increased network capacity and faster transmission speeds. This need is driven by the growing number of connected smart mobile devices and demand for high-speed broadband access to support video and other high-bandwidth applications, which are straining networks and creating new challenges for our customers. The growing use of social networking and cloud computing also make network traffic more unpredictable, generating sudden spikes in volume, and making it increasingly more challenging to deliver a quality end-user experience. Meeting these challenges requires greater network agility and more cost-effective means to build, deploy and maintain profitable, high-performance networks. Our NE and SE enablement solutions are well positioned to benefit from these requirements as well as the deployment of next generation network technologies such as 4G/Long Term Evolution (“LTE”) and fiber-to-the-X (“FTTx”).
Trends related to the increasing threat of counterfeiting impact our OSP business. Counterfeiting of bank notes and other goods is on the rise because counterfeiters now have access to a broad range of advanced but relatively low-cost imaging technologies and printing tools giving counterfeiters the ability to create convincing simulations of actual documents and products for illicit purposes. At the same time, the penalties for counterfeiting can often be relatively modest when compared to the penalties for other crimes. The company has decades of anti-counterfeiting expertise leveraging our Optically Variable Pigment (“OVP®”), and more recently our Optically Variable Magnetic Pigment (“OVMP®”) technologies to protect the integrity of banknotes and other high-value documents by delivering optical effects that are very easy for consumers to recognize but also very difficult for counterfeiters to reproduce. We also provide optical technologies for government, healthcare, consumer electronics and industrial markets.
In addition to network and anti-counterfeiting solutions, we extend our technology expertise to solve complex problems and deliver unique solutions in other industries. For example, our laser diodes and optical coatings are used to enable emerging 3-D sensing applications which allow people to interact with technology in a more natural and intuitive manner with their body gestures instead of using a remote, mouse or other device. 3-D sensing systems, also referred to as gesture-recognition systems, were first deployed on a major gaming platform and are now getting designed into laptops and other devices.
Sales and Marketing
We market our products to telecommunications and cable service providers, NEMs, original equipment manufacturers (“OEMs”), enterprises, governmental organizations, distributors and strategic partners worldwide. We have a dedicated sales force organized around the markets our segments serve that works directly with customers’ executive, technical, manufacturing and purchasing personnel to determine design, performance, and cost requirements.
A high level of support is necessary to develop and maintain long-term collaborative relationships with our customers. We develop innovative products by engaging our customers at the initial design phase and continue to build that relationship as our customers’ needs change and develop. Service and support are provided through our offices and those of our partners worldwide.
Additional Information
We were incorporated in California in 1979 as Uniphase Corporation and reincorporated in Delaware in 1993. We are the product of several significant mergers and acquisitions including, among others, the combination of Uniphase Corporation and JDS FITEL in 1999, and the acquisition of Acterna, Inc. in 2005. We have since operated as a company comprised of a portfolio of businesses with a focus on optical innovation, communications network and service enablement, commercial lasers and anti-counterfeiting solutions. In August 2015, we separated our portfolio of businesses into two separate publicly-traded companies to gain greater strategic flexibility to address rapidly changing market dynamics and changed our name to Viavi Solutions Inc.
We are subject to the requirements of the Securities Exchange Act of 1934, as amended, or the Exchange Act, pursuant to which we file annual, quarterly and periodic reports, proxy statements and other information with the SEC. The SEC maintains a website (www.sec.gov) that contains reports, proxy and information statements, and other information regarding issuers that file electronically with the SEC. We also make available free of charge all of our SEC filings on our website at www.viavisolutions.com/investors as soon as reasonably practicable after they are electronically filed with or furnished to the SEC. The information on our web site is not part of this Annual Report on Form 10-K.
Corporate Strategy
Our objective is to continue to be a leading provider for all markets and industries we serve. In support of our business segments, we are pursuing a corporate strategy that we believe will best position us for future opportunities. The key elements of our corporate strategy include:
· Enable our customers through collaborative innovation
We are committed to working closely with our customers from initial product design and manufacturing through solution deployment and training. We strive to engage with our customers at the early stages of development to provide them with the most innovative and timely products and services and ensure that our focus remains aligned with their evolving requirements. Our sales, customer support, product marketing, and development efforts are organized to maximize effectiveness in our customer interactions.
· Maintain and improve our financial flexibility
We continue to take actions to maintain and improve our financial flexibility in order to support our global business operations and to enable additional investments in growth and innovation. Key elements of this strategy include maintaining a healthy balance sheet with a strong liquidity position, generating positive cash flow, diligently managing our cash conversion cycle, managing our capital structure to minimize cost of capital and preserve access to additional financing, managing capital market risk and refinancing risk with periodic debt issuance and/or maintenance of revolving credit facilities, and maintaining healthy bank relationships.
· Build a lean, focused and agile business
In August 2015, we completed the separation of the Lumentum business, which we believe will allow us to manage our remaining businesses with greater agility to respond to the rapidly changing dynamics of these markets. Following the separation, we plan to focus on increasing our presence in higher-growth markets and realizing cost reductions from streamlined teams, portfolio infrastructure eliminations and site consolidations.
· Invest in profitable, market-based innovation
Based on current and anticipated demand, we continue to invest in research and development (“R&D”) and pursue acquisitions and partnerships to develop new technologies, products and services that offer our customers increased value and strengthen our leadership position in our core markets. In fiscal 2015, we continued to invest in the development of our product portfolio through R&D consistent with our profitability and growth objectives. In fiscal 2014, we acquired Network Instruments, LLC (“Network Instruments”) and certain technology and other assets of Trendium Inc. (“Trendium”) which expanded our enterprise offerings and mobile networks and service enablement solutions.
· Expand our global market presence
Long term, we expect growth in Asia-Pacific, Eastern Europe and Latin America. Therefore, we are developing products, sales, marketing and customer support to meet the specific customer requirements in these regions to serve these customers.
Although we expect to successfully implement our strategy, internal and/or external factors could impact our ability to meet any, or all, of our objectives. These factors are discussed under Item 1A—Risk Factors.
Business Segments
Prior to the separation of the Lumentum business on August 1, 2015, we operated in the following business segments: NE, SE, CCOP and OSP. Each of our segments are organized with its own engineering and manufacturing, and with dedicated sales and marketing groups focused on each of the markets our segments serve to better support our customers and respond quickly to market needs. In addition, our business segments share common corporate services that provide capital, infrastructure, resources and functional support, allowing them to focus on core technological strengths to compete and innovate in their markets.
The table below discloses the percentage of our total net revenue attributable to each of our four reportable segments. In addition, it discloses the percentage of our total net revenue attributable to our Optical Communications (“OpComms”) products within our CCOP segment, which accounted for more than 10% of our consolidated net revenue in each of the last three fiscal years, and our Lasers products, which represent the remainder of our CCOP segment:
|
|
|
Years Ended |
| ||||
|
|
|
June 27, 2015 |
|
June 28, 2014 |
|
June 29, 2013 |
|
|
Network Enablement |
|
31.1 |
% |
34.5 |
% |
34.0 |
% |
|
Service Enablement |
|
9.9 |
|
8.4 |
|
9.4 |
|
|
Communications and Commercial Optical Products: |
|
|
|
|
|
|
|
|
Optical Communications |
|
39.3 |
|
38.5 |
|
37.3 |
|
|
Lasers |
|
8.4 |
|
7.1 |
|
7.0 |
|
|
Communications and Commercial Optical Products |
|
47.7 |
|
45.6 |
|
44.3 |
|
|
Optical Security and Performance Products |
|
11.3 |
|
11.5 |
|
12.3 |
|
Network Enablement
Our NE segment provides an integrated portfolio of testing solutions that access the network to perform build-out and maintenance tasks. These solutions include instruments, software and services to design, build, turn-up, certify, troubleshoot and optimize networks. They also support more profitable, higher-performing networks and help speed time-to-revenue. Our test instrument portfolio is one of the largest in the industry, with hundreds of thousands of units in active use by major NEMs, operators and services providers worldwide. Our solutions address lab and production environments, field deployment and service assurance for wireless and fixed communications networks, including storage networks.
Markets
Viavi’s NE segment provides solutions for communications service providers, enterprise networks, NEMs and cloud and data center providers that deliver and/or operate broadband/IP networks (fixed and mobile) supporting voice, video and data services as well as a wide range of applications. These solutions support the development and production of network equipment, the deployment of next generation network technologies and services, and ensure a higher-quality customer experience.
Customers
NE customers include wireless and fixed services providers, NEMs, government organizations and large corporate customers, such as major telecom, mobility and cable operators, chip and infrastructure vendors, storage-device manufacturers, storage-network and switch vendors, and deployed private enterprise customers. Our customers include Alcatel-Lucent International, América Móvil, S.A.B. de C.V., AT&T Inc., British Telecommunications, Plc., CenturyLink, Inc., Cisco Systems, Inc., Comcast Corporation, Time Warner Inc., Verizon Communications Inc., and Vodafone Group Plc.
Trends
The proliferation of connected mobile devices, including smart phones and tablets, has driven network use and dependency to all-time highs. Growing bandwidth demand combined with the rapid pace at which technology continues to evolve means that NEMs and operators require more cost-effective ways to design, build and deploy new network systems and technologies. Integrating legacy and next generation network technology and services creates new challenges for communications service providers and impact service quality and reliability.
These trends are driving shifts in capital spending in network technologies related to next-generation wireless, including 4G/LTE and Ethernet-based backhaul of mobile traffic from cell towers, higher-capacity transport solutions to support video communications, and software-defined network and service enablement solutions.
Increasing deployments of higher speed networks, the expansion of IP-based services, the need to reduce deployment time and cost, and the importance of increasing average revenue per user (“ARPU”) create opportunities for both our NE and SE solutions. These solutions support the rapid deployment of new services and sources of revenue, increase customer satisfaction by helping technicians complete installation and repair work quickly and correctly, and lower operating expenses by automating and improving network installation, maintenance, and management processes. Our broad portfolio of NE solutions positions us well to benefit from these developments.
Strategy
We plan to continue evolving our test instrument portfolio and supporting software to maintain our current leadership position in field test instrumentation. We strive to deliver customer value that includes faster time to revenue, a quality end user experience, increased ARPU, reduced customer churn and lower operating expenses.
Competition
Our NE segment competes against various companies, including Agilent Technologies, Inc., Anritsu Corporation, Exfo Inc., Ixia, NetScout Systems, Inc. and Spirent Communications plc. While we face multiple competitors for each of our product families, we continue to have one of the broadest portfolios of wireline and wireless products available in the network enablement industry.
Offerings
Viavi’s NE solutions include instruments and software that support the development and production of network systems in the lab. These solutions activate, certify, troubleshoot and optimize networks that are differentiated through superior efficiency, higher profitability, reliable performance and greater customer satisfaction. Designed to be mobile, these products include instruments and software that access the network to perform installation and maintenance tasks. They help service provider technicians assess the performance of network elements and segments and verify the integrity of the information being transmitted across the network. These instruments are highly intelligent and have user interfaces that are designed to simplify operations and minimize the training required to operate them. Our NE solutions are also used by NEMs in the design and production of next-generation network equipment. Thorough testing by NEMs plays a critical role in producing the components and equipment that are the building blocks of network infrastructure. We leverage our installed base and knowledge of network management methods and procedures to develop these advanced customer experience solutions.
The company also offers a range of product support and professional services designed to comprehensively address our customers’ requirements. These services include repair, calibration, software support and technical assistance for our products. We offer product and technology training as well as consulting services. Our professional services, provided in conjunction with system integration projects, include project management, installation and implementation.
Our NE products and services are largely organized between seven product groups that target specific network testing solutions: Cloud and Data Center, Ethernet, Fiber, Media Access and Content (“MAC”), Mobility, Services and Waveready. As discussed above, following the separation of the Lumentum business, we will no longer sell products or services from the Waveready product line.
Service Enablement
Our SE segment is a provider of embedded systems and enterprise performance management solutions that supply global service providers, enterprises and cloud operators visibility into network, service and application data. Our portfolio of SE solutions - which primarily consist of instruments, microprobes and software - address the same lab and production environments, field deployment and service assurance for wireless and fixed communications networks, including storage networks, as our NE portfolio. Our SE solutions let carriers remotely monitor performance and quality of network, service and applications performance throughout the entire network. Remote monitoring decreases operating expenses, while early detection helps increase uptime, preserve revenue, and helps operators better monetize their networks.
Markets
Our SE segment provides solutions and services primarily for communications service providers and enterprises that deliver and/or operate broadband/IP networks (fixed and mobile) supporting voice, video and data services as well as a wide range of applications. These solutions provide network and application visibility to enable more cost-effective ways to provide a higher-quality customer experience.
Customers
SE customers include the same wireless and fixed services providers, NEMs, government organizations, large corporate customers, and storage-segment customers that are served by our NE segment.
Trends
As content and application developer providers are developing new business models to expand their distribution capabilities, they are increasingly adopting on-line channels for rich broadband content such as music, gaming, video programming and movies. Network operators, in turn, seek to increase profitability and ARPU by expanding the capabilities of their packet-based networks to increase their network capacity and to deliver sophisticated, more reliable levels of service needed to meet the requirements of content providers, application developers and end users. To implement this strategy, network operators require improved network visibility and intelligence in order to ensure reliable network and service performance and to understand new opportunities to monetize their networks. Like communications service providers, enterprises that operate private networks face new challenges and complexity addressed by our SE solutions. Employees using a wide range of connected devices and business applications create an increased need for solutions that increase visibility into network and applications performance to ensure operational efficiency and productivity.
Strategy
We plan to continue investing in our portfolio to improve profitability and increase revenue in our SE segment by continuing to develop and offer higher-margin, software-based solutions that can remotely and more cost-effectively gather the network intelligence our customers need to deliver a quality end user experience, increase ARPU, and identify new revenue streams.
Competition
Our NE and SE segments compete against the same companies, including Agilent Technologies, Inc., Anritsu Corporation, Exfo Inc., Ixia, NetScout Systems, Inc. and Spirent Communications plc. While we face multiple competitors for each of our product families, we continue to have one of the broadest portfolios of wireline and wireless monitoring solutions available in the service enablement industry.
Offerings
Viavi’s SE solutions are embedded network systems—including microprobes and software—that collect and analyze network data to reveal the actual customer experience and identify opportunities for new revenue streams. These solutions provide enhanced network management, control, optimization and differentiation for our customers. Using these solutions, our customers are able to access and analyze the growing amount of network data from a single console, simplifying the process of deploying, provisioning and managing network equipment and services. These capabilities allow network operators to initiate service to new customers faster, decrease the need for technicians to make on-site service calls, help to make necessary repairs faster and, as a result, lower costs while providing higher quality and more reliable services.
Viavi’s SE products and services are largely organized between five product groups that target specific network intelligence, visibility and control solutions: Location Intelligence, Mobile Assurance and Analytics (“MAA”), Network Instruments, Packet Portal, and RAN Solutions.
Communications and Commercial Optical Products
As discussed above, beginning on August 1, 2015, Viavi no longer sells products and services from the CCOP segment.
The CCOP segment addressed a range of end markets including data communications (“Datacom”) and telecommunications (“Telecom”) networking and commercial lasers (“Lasers”) for manufacturing, inspection and life-sciences applications. The CCOP segment also expanded into emerging markets including 3-D sensing for consumer electronics and diode light sources for a variety of consumer and industrial applications. The majority of CCOP’s customers were OEMs that incorporated CCOP products into their products which then addressed end-market applications.
Markets
The CCOP segment provided products for the optical communications (“OpComms”) and Lasers markets.
The OpComms portfolio included a range of components, modules and subsystems to address two primary markets: Telecom and Datacom. Additionally, for the consumer and industrial (“Consumer and Industrial”) market CCOP’s OpComms products included certain laser diode products such as its products addressing 3-D sensing applications.
The Lasers portfolio included components and subsystems used in a variety of OEM applications.
Customers
CCOP customers included Alcatel-Lucent International, Amada Co Ltd., Ciena Corporation, Cisco Systems Inc, Coriant GmbH, DISCO Corporation, Google Inc, Huawei Technologies Co Ltd., NEC Corporation, and ZTE Corporation.
Additional information on the historical operations of the CCOP segment is included in the “Management’s Discussion and Analysis of Financial Condition and Results of Operations” included in Item 7 of this Annual Report on Form 10-K.
Optical Security and Performance Products
Our OSP segment leverages its core optical coating technologies and volume manufacturing capability to design, manufacture, and sell products targeting anti-counterfeiting, consumer and industrial, government, healthcare and other markets.
Our security offerings for the currency market include OVP®, OVMP® and banknote thread substrates. OVP® enables a color-shifting effect used by banknote issuers and security printers worldwide for anti-counterfeiting applications on banknotes and other high-value documents. Our technologies are deployed on the banknotes of more than 100 countries today. OSP also develops and delivers overt and covert anti-counterfeiting products that utilize its proprietary printing platform and are targeted primarily at the pharmaceutical and consumer-electronics markets.
Leveraging our expertise in spectral management and its unique high-precision coating capabilities, OSP provides a range of products and technologies for the consumer and industrial market, including, for example, optical filters for 3-D sensing devices designed for gaming and other platforms.
OSP value-added solutions meet the stringent requirements of commercial and government customers. Our products are used in a variety of aerospace and defense applications, including optics for guidance systems, laser eye protection and night vision systems. These products, including coatings and optical filters, are optimized for each specific application.
Markets
Our OSP segment delivers overt and covert features to protect governments and brand owners against counterfeiting, with a primary focus on the currency market. OSP also produces precise, high-performance, optical thin-film coatings for a variety of applications in consumer electronics, government, healthcare and other markets. For example, OSP’s optical filters are used in many of the same 3-D sensing products for gaming platforms and other applications that utilize CCOP’s light source product.
In addition, we offer custom color solutions that include innovative optically-based color-shifting and other features that provide product enhancement for brands in the automotive and other industries.
Customers
OSP serves customers such as 3M Company, BAE Systems plc, FLIR Systems, Lockheed Martin and SICPA.
Trends
Trends related to the increasing threat of counterfeiting impact our OSP business. Counterfeiting of banknotes and other goods is on the rise because counterfeiters now have access to a broad range of advanced but relatively low-cost imaging technologies and printing tools, giving counterfeiters the ability to create convincing simulations of actual documents and products for illicit purposes. At the same time, the penalties for counterfeiting can often be relatively modest when compared to the penalties for other crimes. As a result of these trends, demand is increasing for sophisticated overt anti-counterfeiting features, such as Viavi’s OVP® and OVMP® technologies, which are easy for consumers to validate without the use of special tools but are difficult to create or simulate using conventional printing technology.
The aerospace, defense, consumer electronics and medical/environmental instrumentation markets require customized, high-precision coated products and optical components that selectively absorb, transmit or reflect light to meet the performance requirements of sophisticated systems. Our custom optics products offer an array of advanced technologies and precision optics—from the UV to the far IR portion of the light spectrum to meet the specific requirements of our customers.
Strategy
Our strategy is to expand our position as a leading global supplier of anti-counterfeiting technologies to our customers by providing new optical features that deliver innovative visual effects and new applications which extend the range of delivery mechanisms for our technologies. We also plan to continue to advance our growth strategy in 3-D sensing and other applications for consumer electronics. In addition, Viavi plans to continue leveraging its intellectual property and leading expertise in optics, light management and material science to develop new solutions in the government and healthcare markets.
Competition
OSP’s competitors include providers of anti-counterfeiting features such as Giesecke & Devrient; special-effect pigments like Merck KGA; coating companies such as Nidek, Toppan, and Toray and optics companies such as Materion and Deposition Sciences.
Offerings
Viavi’s OSP business provides innovative optical security and performance products which serve a variety of applications for customers in the anti-counterfeiting, consumer and industrial, government, healthcare and other markets.
Anti-counterfeiting: Viavi’s OVP® technology has become a standard used by many governments worldwide for currency protection. This technology provides a color-shifting effect that enables intuitive visual verification of banknotes. We also provide other technologies to the banknote market including OVMP®, a technology that delivers depth and other visual effects for intuitive overt verification. In addition, our proprietary printing processes deliver anti-counterfeiting solutions for security labels, used by the pharmaceutical and consumer electronics industries for brand protection.
For product differentiation and brand enhancement, we provide custom color solutions for a variety of applications using our ChromaFlair® and SpectraFlair® pigments to create color effects that emphasize body contours, create dynamic environments, or enhance products in motion. These pigments are added to paints, plastics or textiles for products and packaging.
Consumer and Industrial: Viavi provides optical filters for 3-D sensing systems being used in applications for gaming, computing and home entertainment. Our OSP business manufactures and sells the second element of Viavi’s 3-D sensing offering - optical filters - which separate out ambient light from incoming data that allow such as a person’s movements or gestures.
Government: Viavi products are used in a variety of aerospace and defense applications, including optics for guidance systems, laser eye protection and night vision systems. These products, including coatings and optical filters, are optimized for each specific application.
Healthcare and Other Markets: Viavi provides multicavity and linear variable optical filters on a variety of substrates for applications including, thermal imaging, and spectroscopy and pollution monitoring. We also develop and manufacture miniature spectrometers that leverage its linear variable optical filters for use in applications for agriculture, pharmaceuticals, government and other markets.
Acquisitions
As part of our strategy, we are committed to the ongoing evaluation of strategic opportunities and, where appropriate, the acquisition of additional products, technologies or businesses that are complementary to, or strengthen, our existing products. We believe we have strengthened our business model by fortifying our core businesses through acquisition as well as through organic initiatives and will continue to seek strategic opportunities that support the ongoing development of an end-to-end platform to serve our NE and SE customers.
In January 2014, we completed the acquisition of Network Instruments, a privately-held U.S. company and leading developer of enterprise network and application-performance management solutions for global 2000 companies. The acquisition further strengthens our position as a key solutions provider to the enterprise, data center and cloud networking markets. In order to improve application performance, reduce costs and address increasing network complexity, enterprise network administrators are rapidly transforming their IT networks while embracing today’s most critical technology initiatives such as unified communications, cloud, and data center consolidation. Network Instruments helps enterprises simplify the management and optimization of their networks with high-performance solutions that provide actionable intelligence and deep network visibility. We acquired all outstanding shares of Network Instruments for a total purchase price of approximately $208.5 million in cash, including holdback payments of approximately $19.7 million, net of working capital adjustments. This acquisition was integrated into our SE segment.
Also in January 2014, we completed the acquisition of Time-Bandwidth Products AG (“Time-Bandwidth”), a privately-held provider of high powered and ultrafast lasers for industrial and scientific markets. Use of ultrafast lasers for micromachining applications is being driven primarily by increasing use of consumer electronics and connected devices globally. Manufacturers are taking advantage of high-power and ultrafast lasers to create quality micro parts for consumer electronics and to process semiconductor chips for consumer devices. Time-Bandwidth’s technology complements our current laser portfolio, while enabling Time-Bandwidth to leverage our high volume and low-cost manufacturing model, global sales team and channel relationships. We acquired all outstanding shares of Time-Bandwidth for a total purchase price of $15.0 million in cash, including a holdback payment of approximately $2.3 million. This acquisition was integrated into our CCOP segment.
In December 2013, we acquired certain technology and other assets from Trendium, a privately-held provider of real-time intelligence software solutions for customer experience assurance (“CEA”), asset optimization and monetization of big data for 4G/LTE mobile network operators. The addition of Trendium employees and technology enables the Company to introduce a new paradigm of CEA in our MAA solutions, enabling operators of 4G/LTE networks to achieve a real and relevant improvement in customer satisfaction while maximizing productivity and profitability for dynamic converged 4G/LTE networks and beyond. We acquired certain technology and other assets from Trendium for a total purchase price of approximately $26.1 million in cash, including a holdback payment of approximately $2.5 million. This acquisition was integrated into SE segment.
In March 2013, we completed the acquisition of Arieso Ltd. (“Arieso”) based in the United Kingdom. Arieso is a provider of location-aware software solutions that enable mobile network operators to boost 2G, 3G and 4G/LTE network performance and enrich the mobile subscriber experience. Arieso brings high-caliber mobile software engineering expertise to address the rapidly growing deployment of small cells and challenges associated with limited spectrum capacity. Utilized by leading wireless network operators and NEMs, Arieso’s Location Intelligence solutions locate, store and analyze data from billions of mobile connection events that translate into rich intelligence, which help enable mobile operators to optimize network performance, improve customer experience and create new revenue-generating services. We acquired tangible and intangible assets and assumed liabilities of Arieso for a total purchase price of approximately $89.7 million in cash, including holdback payments of approximately $12.8 million. This acquisition was integrated into our SE segment.
In August 2012, we completed the acquisition of GenComm Co., Ltd. (“GenComm”) based in Seoul, South Korea. GenComm is a provider of test and measurement Mobility solutions for troubleshooting, installation and maintenance of wireless base stations and repeaters. We acquired tangible and intangible assets and assumed liabilities of GenComm for a total purchase price of approximately $15.2 million in cash, including holdback payments of approximately $3.8 million. This acquisition was integrated into our NE segment.
Please refer to “Note 5. Mergers and Acquisitions” of the Notes to Consolidated Financial Statements under Item 8 of this Annual Report on Form 10-K for further discussion of the acquisitions completed during fiscal 2015, 2014 and 2013.
Restructuring Programs
We continue to engage in targeted restructuring events intended to consolidate our operations, rationalize the manufacturing of our products, and align our businesses in response to market conditions and our current investment strategy. In connection with the separation of the Lumentum business, we have recently focused on streamlining our teams to gain greater cost efficiencies as we transition from a portfolio company to a more agile company focused on our network and service enablement and optical security and performance products businesses. In fiscal 2015, we initiated plans in our shared services functions to reduce costs by eliminating certain positions, re-defining roles and transferring certain positions to lower cost regions. We also continued to restructure and reorganize our segments to eliminate certain positions by consolidating and shifting resources in our sales, manufacturing and R&D functions to focus on our strategic growth areas and optimize our operational efficiency.
Please refer to Management’s Discussion and Analysis of Financial Condition and Results of Operations under Item 7 and the Notes to Consolidated Financial Statements under Item 8 of this Annual Report on Form 10-K for further discussion on these charges.
Research and Development
During fiscal 2015, 2014 and 2013, we incurred R&D expenses of $313.2 million, $296.0 million, and $258.5 million, respectively. The number of employees engaged in R&D was approximately 1,500 as of June 27, 2015, 1,600 as of June 28, 2014 and 1,450 as of June 29, 2013.
We devote substantial resources to R&D to develop new and enhanced products to serve our markets. Once the design of a product is complete, our engineering efforts shift to enhancing both product performance and our ability to manufacture it in greater volume and at lower cost.
In our NE and SE segments, we develop portable test instruments for field service technicians, systems and software used in Network Operations Centers, and instruments used in the development, testing and production of communications network components, modules and equipment. We are increasing our focus on IP-based service assurance and customer experience management, and test instruments for wireless networks and services, while continuing to develop tools for fiber optic, optical transport, Ethernet, broadband access, video test and storage network testing. We have centers of excellence for product marketing and development in Asia, Europe and North America.
During fiscal 2015 and prior years, our CCOP segment focused on the development of Datacom products, such as 40G and 100G, and 400G transceivers and maintained investments in Telecom components and modules such as Optical Circuit Packs, ROADMs, tunable devices and pump lasers needed for long-haul and metro market segments. Additionally, CCOP integrated optics, electronics and software in their modules, subsystems and circuit packs, and subsystems. CCOP also provided optical technology for 3-D sensing systems and developed new product offerings in kilowatt fiber and diode lasers as well as in ultrafast and solid-state lasers that took advantage of the technologies and components they developed. These developments were targeted at serving customers engaged in macro and micro materials processing, biotechnology, graphics and imaging, remote sensing markets.
In our OSP segment, our R&D efforts concentrate on developing more innovative technologies and products for customers in the anti-counterfeiting, consumer electronics government, healthcare and automotive markets. Our strength in the banknote anti-counterfeiting market is complemented by our advances in developing novel pigments and foils for a variety of applications. Other areas of R&D focus for OSP include our efforts to leverage our optical coating technology expertise to develop applications for the government and defense markets as well as efforts related to new products for 3-D sensing and smart phone sensors. OSP has also introduced an innovative handheld spectrometer solution with applications in the agriculture, healthcare and defense markets.
Manufacturing
As of June 27, 2015 significant manufacturing facilities for our NE, SE and OSP segments were located in China, France, Germany and the United States and our significant contract manufacturing partners were located in China and Mexico.
As of June 27, 2015 significant manufacturing facilities for the Lumentum business were located in Switzerland and the United States and their significant contract manufacturing partners were located in China, Taiwan and Thailand.
Sources and Availability of Raw Materials
Viavi uses various suppliers and contract manufacturers to supply parts and components for the manufacture and support of multiple product lines. Although our intention is to establish at least two sources of supply for materials whenever possible, for certain components we have sole or limited source supply arrangements. We may not be able to procure these components from alternative sources at acceptable prices within a reasonable time, or at all; therefore, the loss or interruption of such arrangements could impact our ability to deliver certain products on a timely basis.
Patents and Proprietary Rights
Intellectual property rights apply to our various products include patents, trade secrets and trademarks. We do not intend to broadly license our intellectual property rights unless we can obtain adequate consideration or enter into acceptable patent cross-license agreements. As of June 27, 2015, we owned approximately 1,440 U.S. patents and approximately 1,150 foreign patents, and had approximately 530 patent applications pending throughout the world. In connection with the separation of the Lumentum business on August 1, 2015, ownership of approximately 760 U.S. patents, 260 foreign patents and 130 patent applications pending throughout the world transferred to Lumentum.
Backlog
Backlog consists of purchase orders for services and products for which we have assigned shipment dates. As of June 27, 2015 our backlog was approximately $368 million as compared to $415 million at June 28, 2014. Of our total backlog as of June 27, 2015 approximately $134 million related to Lumentum. As a result of our separation, it is expected that any unfulfilled backlog as of August 1, 2015 will be fulfilled by Lumentum.
Due to possible changes in product delivery schedules and cancellation of product orders, and because our sales often reflect orders shipped in the same quarter in which they are received, our backlog at any particular date is not necessarily indicative of actual revenue or the level of orders for any succeeding period.
Employees
We employed approximately 4,900 employees as of June 27, 2015, compared to approximately 5,100 and 4,900 as of June 28, 2014 and June 29, 2013, respectively. Our workforce as of June 27, 2015 included approximately 1,750 employees in manufacturing, 1,500 employees in R&D, 950 employees in sales and marketing, and 700 employees in general and administration. On August 1, 2015, approximately 1,700 employees were transferred to Lumentum as part of the separation of the Lumentum business which included approximately 850 employees from manufacturing, 550 employees from R&D, 150 employees from sales and marketing and 150 employees general and administration.
Similar to other technology companies, we rely upon our ability to use “Full Value Awards” (as defined below) and other forms of stock-based compensation as key components of our executive and employee compensation structure. Full Value Awards refer to Restricted Stock Units (“RSUs”) and Performance Units that are granted with the exercise price equal to zero and are converted to shares immediately upon vesting. Performance shares are granted based on the achievement of performance targets. Historically, these components have been critical to our ability to retain important personnel and offer competitive compensation packages. Without these components, we would be required to significantly increase cash compensation levels or develop alternative compensation structures to retain our key employees.
Outside of the United States, our businesses are subject to labor laws that differ from those in the United States. The Company follows statutory requirements, and in certain European countries it is common for a works council, consisting of elected employees, to represent the sites when discussing matters such as compensation, benefits or terminations of employment. We consider our employee relations to be good.
We have a history of net losses, and our future profitability is not assured.
Although we had net income of $57.0 million in fiscal 2013, we incurred net losses of $88.1 million and $17.8 million in fiscal 2015 and fiscal 2014, respectively. Historically, Viavi operated as a portfolio company comprised of many product lines, with diverse operating metrics and markets. As a result, our profitability in a particular period was impacted by both revenue and product mix due to the fact that gross margin varies significantly across our product portfolio and business segments. While we recently completed the separation of our Lumentum business, this variability continues to be a factor across our remaining business segments.
Additionally, for the last several years, we have undergone multiple manufacturing, facility, organizational and product line transitions. We expect some of these activities to continue for the foreseeable future. These activities are costly and can impair our profitability objectives while ongoing. Specific factors that may undermine our financial objectives include, among others:
· uncertain future telecom carrier and cable operator capital and R&D spending levels, which particularly affects our NE and SE segments;
· adverse changes to our product mix, both fundamentally (resulting from new product transitions, the declining profitability of certain legacy products and the termination of certain products with declining margins, among other things) and due to quarterly demand fluctuations;
pricing pressure across our product lines due to competitive forces, increasingly from Asia, and to a highly concentrated customer base for many of our product lines, which continues to offset many of the cost improvements we are realizing quarter over quarter;
· limited availability of components and resources for our products which leads to higher component prices;
· increasing commoditization of previously differentiated products, and the attendant negative effect on average selling prices and profit margins;
· execution challenges, which limit revenue opportunities and harm profitability, market opportunities and customer relations;
· decreased revenue associated with terminated or divested product lines;
· redundant costs related to periodic transitioning of manufacturing and other functions to lower-cost locations;
· ongoing costs associated with organizational transitions, consolidations and restructurings, particularly the recent separation of the Lumentum business, which are expected to continue in the nearer term;
· continuing high levels of selling, general and administrative, (“SG&A”) expenses;
· seasonal fluctuations in revenue from our NE and SE segment; and
· cyclical demand for our currency products.
Taken together, these factors limit our ability to predict future profitability levels and to achieve our long-term profitability objectives. While some of these factors may diminish over time as we improve our cost structure and focus on enhancing our product mix, several factors, such as continuous pricing pressure, increasing commoditization of previously-differentiated products, a highly concentrated customer base for many of our product lines and seasonal NE and SE segment revenue fluctuations, are likely to remain. If we fail to achieve profitability expectations, the price of our debt and equity securities, as well as our business and financial condition, may be materially adversely impacted.
The recent separation of our Lumentum business may not produce the desired benefits and may result in disruptions to, and negatively impact our relationships with, our customers and other business partners.
The separation of our CCOP business segment on August 1, 2015 required significant time and attention from management and resulted in increased operating expenses, some of which may continue to be incurred in the near term. This may prevent us from fully achieving the anticipated benefits of the separation. Additionally, uncertainty related to the separation may lead customers and other parties to terminate or attempt to negotiate changes in existing business relationships. These disruptions could have a material and adverse effect on our businesses, financial condition, results of operations, and prospects.
The separation of the CCOP business could result in substantial tax liability to us and our stockholders.
One of the conditions for completing the separation was our receipt of a tax opinion from our advisors substantially to the effect that, for U.S. federal income tax purposes, the separation will qualify as a tax-free distribution under certain sections of the Internal Revenue Code. If any of the factual representations and assumptions made in connection with obtaining the tax opinion were inaccurate or incomplete in any material respect, then we will not be able to rely on the tax opinion. Furthermore, the tax opinion is not binding on the Internal Revenue Service (IRS) or the courts. Accordingly, the IRS or the courts may challenge the conclusions stated in the tax opinion and such challenge could prevail.
If, notwithstanding our receipt of the tax opinion, the separation is determined to be taxable, then (i) we would be subject to tax as if we sold the stock distributed in the separation in a taxable sale for its fair market value; and (ii) each stockholder who received stock distributed in the separation would be treated as receiving a distribution of property in an amount equal to the fair market value of the stock that would generally result in tax liabilities for each stockholder, which may be substantial.
Management turnover creates uncertainties and could harm our business.
We recently announced the departure of Thomas Waechter, who was our President and Chief Executive Officer since January, 2009. Richard Belluzzo, Chairman of our Board, has agreed to serve as Interim President and Chief Executive Officer while we conduct a search for a replacement. Additionally, Rex Jackson, our Chief Financial Officer since January 2012, previously announced he will depart September 30, 2015. Amar Maletira will join the Company as Chief Financial Officer on September 9, 2015. Furthermore, in connection with the separation of the Lumentum business, we eliminated a number of other executive roles in our business and corporate functions during fiscal 2015. The extent of our management changes could adversely impact our results of operations and our customer relationships and may make recruiting for future management positions more difficult. If we are unable to attract and retain qualified executives and employees, or to successfully integrate any newly-hired personnel within our organization, we may be unable to achieve our operating objectives, which could negatively impact our financial performance and results of operations.
Our operating results may be adversely affected by unfavorable economic and market conditions.
Economic conditions worldwide have from time to time contributed to slowdowns in the technology industry at large, as well as to the specific segments and markets in which we operate. The global economic downturn that began in 2008, and the slow pace of economic recovery, including but not limited to the effects on global credit markets, has led to increased uncertainty in the timing and overall demand from our customers. Despite the economic recovery that has occurred in some sectors, continuing concerns about global economic conditions could decrease or delay customer spending, increase price competition for our products, increase our risk of excess and obsolete inventories and higher overhead costs as a percentage of revenue. Continued economic challenges could further negatively impact our operations by affecting the solvency of our customers, the solvency of our key suppliers or the ability of our customers to obtain credit to finance purchases of our products. In particular, we have seen recent demand for our products affected by economic uncertainty in Europe, Russia and Brazil. If the global economy and credit markets deteriorate and our future sales decline, our financial condition and results of operations would likely be materially adversely impacted.
In addition, we have significant long-lived assets recorded on our balance sheet. We will continue to evaluate the recoverability of the carrying amount of our goodwill and long-lived assets on an ongoing basis, and we may incur substantial impairment charges, which would adversely affect our financial results. There can be no assurance that the outcome of such reviews in the future will not result in substantial impairment charges. Impairment assessment inherently involves judgment as to assumptions about expected future cash flows and the impact of market conditions on those assumptions. Future events and changing market conditions may impact our assumptions as to prices, costs, holding periods or other factors that may result in changes in our estimates of future cash flows. Although we believe the assumptions we used in testing for impairment are reasonable, significant changes in any one of our assumptions could produce a significantly different result. If, in any period, our stock price decreases to the point where the fair value of the Company, as determined by our market capitalization, is less than our book value, this too could indicate a potential impairment and we may be required to record an impairment charge in that period.
The manufacture, quality and distribution of our products, as well as our customer relations, may be affected by several factors, including the rapidly changing market for our products, supply issues and internal restructuring efforts. We expect the impact of these issues will become more pronounced as we continue to introduce new product offerings and when overall demand increases.
Our success depends upon our ability to deliver both our current product offerings and new products and technologies on time and at acceptable cost to our customers. The markets for our products are characterized by rapid technological change, frequent new product introductions, substantial capital investment, changes in customer requirements and a constantly evolving industry. Our future performance will depend on the successful development, introduction and market acceptance of new and enhanced products that address these issues and provide solutions that meet our customers’ current and future needs. As a technology company, we also constantly encounter quality, volume and cost concerns such as:
· Our continuing cost reduction programs, which include site and organization consolidations, asset divestitures, outsourcing the manufacture of certain products to contract manufacturers, other outsourcing initiatives, and reductions in employee headcount, require the re-establishment and re-qualification by our customers of complex manufacturing lines, as well as modifications to systems, planning and operational infrastructure. During this process, we have experienced, and may continue to experience, additional costs, delays in re-establishing volume production levels, planning difficulties, inventory issues, factory absorption concerns and systems integration problems.
· We have experienced increases in demand for certain of our products in the midst of our cost reduction programs, which have strained our execution abilities as well as those of our suppliers. Because of this, we at times experience periodic and varying capacity, workforce and materials constraints, enhanced by the impact of our ongoing product and operational transfers.
· We have experienced variability of manufacturing yields caused by difficulties in the manufacturing process, the effects from a shift in product mix, changes in product specifications and the introduction of new product lines. These difficulties can reduce yields or disrupt production and thereby increase our manufacturing costs and adversely affect our margin.
· We may incur significant costs to correct defective products (despite rigorous testing for quality both by our customers and by us), which could include lost future sales of the affected product and other products, and potentially severe customer relations problems, litigation and damage to our reputation.
· We are dependent on a limited number of vendors, who are often small and specialized, for raw materials, packages and standard components. We also rely on contract manufacturers around the world to manufacture certain of our products. Our business and results of operations have been, and could continue to be adversely affected by this dependency. Specific concerns we periodically encounter with our suppliers include stoppages or delays of supply, insufficient vendor resources to supply our requirements, substitution of more expensive or less reliable products, receipt of defective parts or contaminated materials, increases in the price of supplies, and an inability to obtain reduced pricing from our suppliers in response to competitive pressures. Additionally, the ability of our contract manufacturers to fulfill their obligations may be affected by economic, political or other forces that are beyond our control. Any such failure could have a material impact on our ability to meet customers’ expectations and may materially impact our operating results.
· New product programs and introductions involve changing product specifications and customer requirements, unanticipated engineering complexities, difficulties in reallocating resources and overcoming resource limitations and with their increased complexity, which expose us to yield and product risk internally and with our suppliers.
These factors have caused considerable strain on our execution capabilities and customer relations. We have and could continue to see (a) periodic difficulty responding to customer delivery expectations for some of our products, (b) yield and quality problems, particularly with some of our new products and higher volume products, and (c) additional funds and other resources required to respond to these execution challenges. From time to time, we have had to divert resources from new product R&D and other functions to assist with resolving these matters. If we do not improve our performance in all of these areas, our operating results will be harmed, the commercial viability of new products may be challenged and our customers may choose to reduce or terminate their purchases of our products and purchase additional products from our competitors.
We rely on a limited number of customers for a significant portion of our sales.
We believe that we will continue to rely upon a limited number of customers for a significant portion of our revenues for the foreseeable future. Any failure by us to continue capturing a significant share of these customers could materially harm our business. Dependence on a limited number of customers exposes us to the risk that order reductions from any one customer can have a material adverse effect on periodic revenue. Further, to the extent that there is consolidation among communications equipment manufacturers and service providers, we will have increased dependence on fewer customers who may be able to exert increased pressure on our prices and other contract terms. Customer consolidation activity and periodic manufacturing and inventory initiatives could also create the potential for disruptions in demand for our products as a consequence of such customers streamlining, reducing or delaying purchasing decisions.
We have a strategic alliance with SICPA, our principal customer for our light interference microflakes that are used to, among other things, provide security features in currency. Under a license and supply agreement, we rely exclusively on SICPA to market and sell one of these product lines, optically variable pigment, for document authentication applications worldwide. The agreement requires SICPA to purchase minimum quantities of these pigments over the term of the agreement. If SICPA fails to purchase these quantities, as and when required by the agreement, our business and operating results (including, among other things, our revenue and gross margin) will be harmed as we may be unable to find a substitute marketing and sales partner or develop these capabilities ourselves.
Movement towards virtualized networks and software solutions may result in lower demand for our hardware products and increased competition.
The markets for our NE and SE segments are increasingly looking towards virtualized networks and software solutions. While we are devoting substantial resources to meet these needs, this trend may result in lower demand for our legacy hardware products. Additionally barriers to entry are generally lower for software solutions, which may lead to increased competition for our products and services.
We face a number of risks related to our strategic transactions.
Our strategy continues to include periodic acquisitions and divestitures of businesses and technologies. Strategic transactions of this nature involve numerous risks, including the following:
· difficulties and costs in integrating or disintegrating the operations, technologies, products, IT and other systems, facilities, and personnel of the affected businesses, particularly the recent separation of our CCOP business segment;
· inadequate internal control procedures and disclosure controls to comply with the requirements of Section 404 of the Sarbanes-Oxley Act of 2002, or poor integration of a target company’s or business’s procedures and controls;
· diversion of management’s attention from normal daily operations of the business;
· potential difficulties in completing projects associated with in-process R&D;
· difficulties in entering markets in which we have no or limited prior experience and where competitors have stronger market positions;
· difficulties in obtaining or providing sufficient transition services and accurately projecting the time and cost associated with providing these services;
· an acquisition may not further our business strategy as we expected or we may overpay for, or otherwise not realize the expected return on, our investments;
· insufficient net revenue to offset increased expenses associated with acquisitions;
· potential loss of key employees of the acquired companies; and
· difficulty in forecasting revenues and margins.
Acquisitions may also cause us to:
· issue common stock that would dilute our current stockholders’ percentage ownership and may decrease earnings per share;
· assume liabilities, some of which may be unknown at the time of the acquisitions;
· record goodwill and non-amortizable intangible assets that will be subject to impairment testing and potential periodic impairment charges;
· incur additional debt to finance such acquisitions;
· incur amortization expenses related to certain intangible assets; or
· acquire, assume, or become subject to litigation related to the acquired businesses or assets.
Certain of our products are subject to governmental and industry regulations, certifications and approvals.
The commercialization of certain of the products we design, manufacture and distribute through our OSP segment may be more costly due to required government approval and industry acceptance processes. Development of applications for our light interference and diffractive microflakes may require significant testing that could delay our sales. For example, certain uses in cosmetics may be regulated by the U.S. Food and Drug Administration, which has extensive and lengthy approval processes. Durability testing by the automobile industry of our decorative microflakes used with automotive paints can take up to three years. If we change a product for any reason, including technological changes or changes in the manufacturing process, prior approvals or certifications may be invalid and we may need to go through the approval process again. If we are unable to obtain these or other government or industry certifications in a timely manner, or at all, our operating results could be adversely affected.
We face risks related to our international operations and revenue.
Our customers are located throughout the world. In addition, we have significant operations outside North America, including product development, manufacturing, sales and customer support operations.
Our international presence exposes us to certain risks, including the following:
· currency fluctuations;
· our ability to comply with a wide variety of laws and regulations of the countries in which we do business, including, among other things, customs, import/export, anti-bribery, anti-competition, tax and data privacy laws, which may be subject to sudden and unexpected changes;
· difficulties in establishing and enforcing our intellectual property rights;
· tariffs and other trade barriers;
· political, legal and economic instability in foreign markets, particularly in those markets in which we maintain manufacturing and product development facilities;
· difficulties in staffing and management;
· language and cultural barriers;
· seasonal reductions in business activities in the countries where our international customers are located;
· integration of foreign operations;
· longer payment cycles;
· difficulties in management of foreign distributors; and
· potential adverse tax consequences.
Net revenue from customers outside the Americas accounted for 53.7%, 52.6% and 50.9% of our total net revenue, for fiscal 2015, 2014 and 2013 respectively. We expect that net revenue from customers outside North America will continue to account for a significant portion of our total net revenue. Lower sales levels that typically occur during the summer months in Europe and some other overseas markets may materially and adversely affect our business. In addition, the revenues we derive from many of our customers depend on international sales and further expose us to the risks associated with such international sales.
Our business and operations would be adversely impacted in the event of a failure of our information technology infrastructure.
We rely upon the capacity, reliability and security of our information technology infrastructure and our ability to expand and continually update this infrastructure in response to our changing needs. In some cases, we rely upon third party hosting and support services to meet these needs. Any failure to manage, expand and update our information technology infrastructure, any failure in the extension or operation of this infrastructure, or any failure by our hosting and support partners in the performance of their services could materially and adversely harm our business.
Despite our implementation of security measures, our systems are vulnerable to damages from computer viruses, natural disasters, unauthorized access and other similar disruptions. Additionally, we are currently running an enterprise resource planning software platform that will no longer be supported as of December 31, 2015. While we are evaluating our options for upgrading or switching platforms, we expect there to be a period of time during which the platform is unsupported. Any system failure, accident or security breach could result in disruptions to our operations. To the extent that any disruptions or security breach results in a loss or damage to our data, or in inappropriate disclosure of confidential information, it could cause significant damage to our reputation and affect our relationships with our customers and ultimately harm our business. In addition, we may be required to incur significant costs to protect against damage caused by these disruptions or security breaches in the future.
Failure to maintain effective internal controls may adversely affect our stock price.
Effective internal controls are necessary for us to provide reliable financial reports and to effectively prevent fraud. The SEC adopted rules requiring public companies to include a report by management on the effectiveness of the Company’s internal control over financial reporting in their annual reports on Form 10-K. In addition, our independent registered public accounting firm must report on the effectiveness of our internal control over financial reporting. Although we review our internal control over financial reporting in order to ensure compliance with these requirements, if we or our independent registered public accounting firm is not satisfied with our internal control over financial reporting or the level at which these controls are documented, designed, operated or reviewed, or if our independent registered public accounting firm interprets the requirements, rules and/or regulations differently from our interpretation, then they may issue a qualified report. Furthermore, we may discover that the internal controls of businesses we acquire are inadequate or changes to our existing businesses may impact the effectiveness of our internal controls. These situations could require us to make changes to our internal controls and could cause our independent registered public accounting firm to issue a qualified report, which could result in a loss of investor confidence in the reliability of our financial statements, and could negatively impact our stock price.
In August 2013, we issued $650.0 million of 0.625% Senior Convertible Notes due 2033, which could dilute our existing stockholders and lower our reported earnings per share.
We issued $650.0 million of indebtedness in August 2013 in the form of 0.625% Senior Convertible Notes due 2033 (the “2033 Notes”). The issuance of the 2033 Notes substantially increased our principal payment obligations. Additionally, in fiscal 2016 we will contribute $137.6 million in cash to Lumentum in connection with the separation of the Lumentum business, subject to the requirements as set forth in the Contribution Agreement between the Company and Lumentum Operations LLC. We anticipate this cash contribution to Lumentum will be completed by the end of the first quarter of fiscal 2016. All of the obligations related to the 2033 Notes are being retained by the Company. Following the separation we will have substantially lower cash flow which will increase our leverage. The degree to which we are leveraged could materially and adversely affect our ability to successfully obtain financing for working capital, acquisitions or other purposes and could make us more vulnerable to industry downturns and competitive pressures. In addition, the holders of the 2033 Notes are entitled to convert the 2033 Notes into shares of our common stock or a combination of cash and shares of common stock under certain circumstances which would dilute our existing stockholders and lower our reported per share earnings.
If we have insufficient proprietary rights or if we fail to protect those we have, our business would be materially harmed.
Our intellectual property rights may not be adequate to protect our products or product roadmaps.
We seek to protect our products and our product roadmaps in part by developing and/or securing proprietary rights relating to those products, including patents, trade secrets, know-how and continuing technological innovation. The steps taken by us to protect our intellectual property may not adequately prevent misappropriation or ensure that others will not develop competitive technologies or products. Other companies may be investigating or developing other technologies that are similar to our own. It is possible that patents may not be issued from any of our pending applications or those we may file in the future and, if patents are issued, the claims allowed may not be sufficiently broad to deter or prohibit others from making, using or selling products that are similar to ours. We do not own patents in every country in which we sell or distribute our products, and thus others may be able to offer identical products in countries where we do not have intellectual property protection. In addition, the laws of some territories in which our products are or may be developed, manufactured or sold, including Europe, Asia-Pacific or Latin America, may not protect our products and intellectual property rights to the same extent as the laws of the United States.
Any patents issued to us may be challenged, invalidated or circumvented. Additionally, we are currently a licensee in all of our operating segments for a number of third-party technologies, software and intellectual property rights from academic institutions, our competitors and others, and are required to pay royalties to these licensors for the use thereof. Unless we are able to obtain such licenses on commercially reasonable terms, patents or other intellectual property held by others could inhibit our development of new products, impede the sale of some of our current products, substantially increase the cost to provide these products to our customers, and could have a significant adverse impact on our operating results. In the past, licenses generally have been available to us where third-party technology was necessary or useful for the development or production of our products. In the future licenses to third-party technology may not be available on commercially reasonable terms, if at all.
Our products may be subject to claims that they infringe the intellectual property rights of others.
Lawsuits and allegations of patent infringement and violation of other intellectual property rights occur in our industry on a regular basis. We have received in the past, and anticipate that we will receive in the future, notices from third parties claiming that our products infringe their proprietary rights. Over the past several years there has been a marked increase in the number and potential severity of third-party patent infringement claims, primarily from two distinct sources. First, large technology companies, including some of our customers and competitors, are seeking to monetize their patent portfolios and have developed large internal organizations that have approached us with demands to enter into license agreements. Second, patent-holding companies, entities that do not make or sell products (often referred to as “patent trolls”), have claimed that our products infringe upon their proprietary rights. We will continue to respond to these claims in the course of our business operations. In the past, the resolution of these disputes has not had a material adverse impact on our business or financial condition, however this may not be the case in the future. Further, the litigation or settlement of these matters, regardless of the merit of the claims, could result in significant expense to us and divert the efforts of our technical and management personnel, whether or not we are successful. If we are unsuccessful, we could be required to expend significant resources to develop non-infringing technology or to obtain licenses to the technology that is the subject of the litigation. We may not be successful in such development, or such licenses may not be available on terms acceptable to us, if at all. Without such a license, we could be enjoined from future sales of the infringing product or products, which could adversely affect our revenues and operating results.
The use of open source software in our products, as well as those of our suppliers, manufacturers and customers, may expose us to additional risks and harm our intellectual property position.
Certain of the software and/or firmware that we use and distribute (as well as that of our suppliers, manufacturers and customers) may be, be derived from, or contain, “open source” software, which is software that is generally made available to the public by its authors and/or other third parties. Such open source software is often made available under licenses which impose obligations in the event the software or derivative works thereof are distributed or re-distributed. These obligations may require us to make source code for the derivative works available to the public, and/or license such derivative works under a particular type of license, rather than the forms of license customarily used to protect our own software products. While we believe we have complied with our obligations under the various applicable licenses for open source software, in the event that a court rules that these licenses are unenforceable, or in the event the copyright holder of any open source software were to successfully establish in court that we had not complied with the terms of a license for a particular work, we could be required to release the source code of that work to the public and/or stop distribution of that work. Additionally, open source licenses are subject to occasional revision. In the event future iterations of open source software are made available under a revised license, such license revisions may adversely affect our ability to use such future iterations.
We face certain litigation risks that could harm our business.
We are and may become subject to various legal proceedings and claims that arise in or outside the ordinary course of business. The results of complex legal proceedings are difficult to predict. Moreover, many of the complaints filed against us do not specify the amount of damages that plaintiffs seek, and we therefore are unable to estimate the possible range of damages that might be incurred should these lawsuits be resolved against us. While we are unable to estimate the potential damages arising from such lawsuits, certain of them assert types of claims that, if resolved against us, could give rise to substantial damages. Thus, an unfavorable outcome or settlement of one or more of these lawsuits could have a material adverse effect on our financial condition, liquidity and results of operations. Even if these lawsuits are not resolved against us, the uncertainty and expense associated with unresolved lawsuits could seriously harm our business, financial condition and reputation. Litigation is costly, time-consuming and disruptive to normal business operations. The costs of defending these lawsuits have been significant, will continue to be costly and may not be covered by our insurance policies. The defense of these lawsuits could also result in continued diversion of our management’s time and attention away from business operations, which could harm our business. For additional discussion regarding litigation, see the “Legal Proceedings” portion of this Annual Report.
We may be subject to environmental liabilities which could increase our expenses and harm our operating results.
We are subject to various federal, state and foreign laws and regulations governing the environment, including those governing pollution and protection of human health and the environment and, recently, those restricting the presence of certain substances in electronic products and holding producers of those products financially responsible for the collection, treatment, recycling and disposal of certain products. Such laws and regulations have been passed in several jurisdictions in which we operate, are often complex and are subject to frequent changes. We will need to ensure that we comply with such laws and regulations as they are enacted, as well as all environmental laws and regulations, and as appropriate or required, that our component suppliers also comply with such laws and regulations. If we fail to comply with such laws, we could face sanctions for such noncompliance, and our customers may refuse to purchase our products, which would have a materially adverse effect on our business, financial condition and results of operations.
With respect to compliance with environmental laws and regulations in general, we have incurred and in the future could incur substantial costs for the cleanup of contaminated properties, either those we own or operate or to which we have sent wastes in the past, or to comply with such environmental laws and regulations. Additionally, we could be subject to disruptions to our operations and logistics as a result of such clean-up or compliance obligations. If we were found to be in violation of these laws, we could be subject to governmental fines and liability for damages resulting from such violations. If we have to make significant capital expenditures to comply with environmental laws, or if we are subject to significant expenditures in connection with a violation of these laws, our financial condition or operating results could be materially adversely impacted.
We are subject to provisions of the Dodd-Frank Wall Street Reform and Consumer Protection Act that could subject us to additional costs and liabilities.
We are subject to the SEC rules implementing the requirements of Section 1502 of the Dodd-Frank Wall Street Reform and Consumer Protection Act which establish disclosure and reporting requirements for companies who use “conflict” minerals mined from the Democratic Republic of Congo and adjoining countries in their products. Complying with the disclosure requirements requires substantial diligence efforts to determine the source of any conflict minerals used in our products and may require third-party auditing of our diligence process. These efforts may require internal resources that would otherwise be directed towards operational activities.
Since our supply chain is complex, we may face reputational challenges if we are unable to sufficiently verify the origins of the conflict minerals used in our products. Additionally, if we are unable to satisfy those customers who require that all of the components of our products are certified as conflict free, they may choose a competitor’s products which could materially impact our financial condition and operating results.
Certain provisions in our charter and under Delaware laws could hinder a takeover attempt.
We are subject to the provisions of Section 203 of the Delaware General Corporation Law prohibiting, under some circumstances, publicly-held Delaware corporations from engaging in business combinations with some stockholders for a specified period of time without the approval of the holders of substantially all of our outstanding voting stock. Such provisions could delay or impede the removal of incumbent directors and could make more difficult a merger, tender offer or proxy contest involving us, even if such events could be beneficial, in the short-term, to the interests of the stockholders. In addition, such provisions could limit the price that some investors might be willing to pay in the future for shares of our common stock. Our certificate of incorporation and bylaws contain provisions providing for the limitations of liability and indemnification of our directors and officers, allowing vacancies on our board of directors to be filled by the vote of a majority of the remaining directors, granting our board of directors the authority to establish additional series of preferred stock and to designate the rights, preferences and privileges of such shares (commonly known as “blank check preferred”) and providing that our stockholders can take action only at a duly called annual or special meeting of stockholders, which may only be called by the Chairman of the board, the Chief Executive Officer or the board of directors. These provisions may also have the effect of deterring hostile takeovers or delaying changes in control or change in our management.
ITEM 1B. UNRESOLVED STAFF COMMENTS
None.
We own and lease various properties in the United States and in 24 other countries around the world. We use the properties for executive and administrative offices, data centers, product development offices, customer service offices, and manufacturing facilities. Our corporate headquarters of approximately 180,000 square feet is located in Milpitas, California. As of June 27, 2015, our leased and owned properties in total were approximately 1.8 million square feet, of which approximately 100,000 square feet is owned. Larger leased sites include properties located in Canada, China, France, Germany, Singapore and the United States. We believe our existing properties, including both owned and leased sites, are in good condition and suitable for the conduct of our business.
In connection with the separation of the Lumentum business, on August 1, 2015 we transferred to Lumentum approximately 600,000 square feet of leased and owned space worldwide, of which approximately 80,000 square feet was previously owned by Viavi.
While we believe our existing facilities are adequate to meet our immediate needs, it may become necessary to lease, acquire, or sell additional or alternative space to accommodate future business needs.
We are subject to a variety of claims and suits that arise from time to time in the ordinary course of our business. While management currently believes that resolving claims against us, individually or in aggregate, will not have a material adverse impact on its financial position, results of operations or statement of cash flows, these matters are subject to inherent uncertainties and management’s view of these matters may change in the future. Were an unfavorable final outcome to occur, there exists the possibility of a material adverse impact on our financial position, results of operations or cash flows for the period in which the effect becomes reasonably estimable.
ITEM 4. MINE SAFETY DISCLOSURES
None.
ITEM 5. MARKET FOR REGISTRANT’S COMMON EQUITY, RELATED STOCKHOLDER MATTERS AND ISSUER PURCHASES OF EQUITY SECURITIES
Our common stock is traded on the NASDAQ Global Select Market under the symbol “VIAV.” Prior to the separation of the Lumentum business, our common stock was traded on the NASDAQ Global Select Market under the symbol “JDSU.” As of July 27, 2015 we had 235,325,963 shares of common stock outstanding. The closing price on July 27, 2015 was $11.09. The following table summarizes the high and low intraday sales prices for our common stock as reported on the NASDAQ Global Select Market during fiscal 2015 and 2014.
|
|
|
High |
|
Low |
| ||
|
Fiscal 2015 |
|
|
|
|
| ||
|
Fourth Quarter |
|
$ |
13.65 |
|
$ |
11.85 |
|
|
Third Quarter |
|
14.12 |
|
12.00 |
| ||
|
Second Quarter |
|
14.25 |
|
11.35 |
| ||
|
First Quarter |
|
13.88 |
|
10.62 |
| ||
|
|
|
|
|
|
| ||
|
Fiscal 2014 |
|
|
|
|
| ||
|
Fourth Quarter |
|
$ |
14.54 |
|
$ |
10.29 |
|
|
Third Quarter |
|
14.99 |
|
11.68 |
| ||
|
Second Quarter |
|
16.61 |
|
11.70 |
| ||
|
First Quarter |
|
15.45 |
|
12.76 |
| ||
As of July 27, 2015, we had 3,969 holders of record of our common stock. We have not paid cash dividends on our common stock and do not anticipate paying cash dividends in the foreseeable future.
On August 1, 2015, we completed the previously announced distribution of approximately 80.1% of the outstanding shares of Lumentum common stock to Viavi’s stockholders (the “Distribution”). JDSU was renamed Viavi Solutions Inc. and, at the time of the Distribution, retained ownership of approximately 19.9% of Lumentum’s outstanding shares. We have agreed not to liquidate the retained shares during the first six months following the Distribution. However, in connection with a private letter ruling from the Internal Revenue Service, we have committed to liquidate these shares within three years from the Distribution. The Distribution was made to Viavi’s stockholders of record as of the close of business on July 27, 2015 (the “Record Date”), who received one share of Lumentum common stock for every five shares of Viavi common stock held as of the close of business on the Record Date and not sold prior to August 4, 2015. Viavi stockholders received cash in lieu of any fractional shares of Lumentum common stock. Our trading commenced “regular-way” trading on August 4, 2015 on NASDAQ under the ticker symbol “VIAV.”
STOCK PERFORMANCE GRAPH
The information contained in the following graph shall not be deemed to be “soliciting material” or to be “filed” with the Securities and Exchange Commission, nor shall such information be incorporated by reference into any future filing under the Securities Act of 1933, as amended, or the Securities Exchange Act of 1934, as amended, except to the extent that the Company specifically incorporates it by reference in such filing.
The following graph and table set forth the total cumulative return, assuming reinvestment of dividends, on an investment of $100 in June 2010 and ending June 2015 in: (i) our Common Stock, (ii) the S&P 500 Index, (iii) the NASDAQ Stock Market (U.S.) Index, and (iv) the NASDAQ Telecommunications Index. The table below presents our stock performance prior to the separation of the Lumentum business as traded on the NASDAQ Global Select Market under the symbol “JDSU.” Historical stock price performance is not necessarily indicative of future stock price performance.
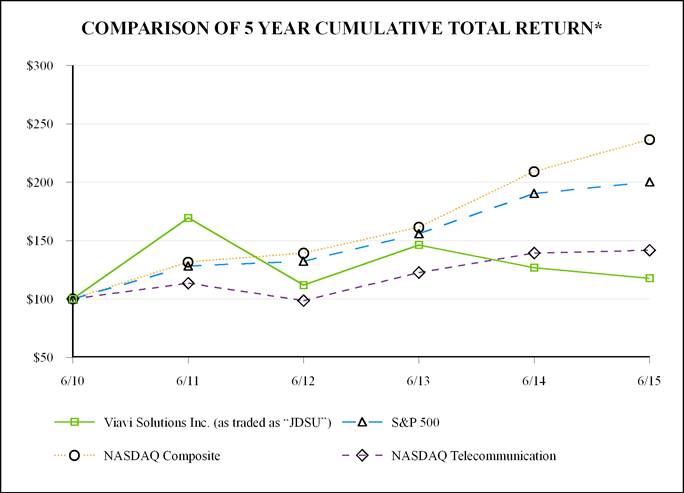
*$100 invested on 6/30/10 in stock or index.
|
|
|
6/10 |
|
6/11 |
|
6/12 |
|
6/13 |
|
6/14 |
|
6/15 |
| ||||||
|
Viavi Solutions Inc. |
|
$ |
100.00 |
|
$ |
169.31 |
|
$ |
111.79 |
|
$ |
146.24 |
|
$ |
126.73 |
|
$ |
117.68 |
|
|
S&P 500 |
|
100.00 |
|
128.13 |
|
132.16 |
|
155.84 |
|
190.18 |
|
200.16 |
| ||||||
|
NASDAQ Composite |
|
100.00 |
|
131.49 |
|
139.15 |
|
161.35 |
|
208.99 |
|
236.43 |
| ||||||
|
NASDAQ Telecommunications |
|
100.00 |
|
113.37 |
|
98.54 |
|
122.46 |
|
139.23 |
|
141.57 |
| ||||||
ITEM 6. SELECTED FINANCIAL DATA
This table sets forth selected financial data of Viavi (in millions, except share and per share amounts) for the periods indicated. This data should be read in conjunction with and is qualified by reference to “Management’s Discussion and Analysis of Financial Condition and Results of Operations” included in Item 7 of this Annual Report on Form 10-K and our audited consolidated financial statements, including the notes thereto and the other financial information included in Item 8 of this Form 10-K. The selected financial data presented in this section is not intended to replace the consolidated financial statements included in this report.
|
|
|
Years Ended |
| |||||||||||||
|
|
|
June 27, |
|
June 28, |
|
June 29, |
|
June 30, |
|
July 2, |
| |||||
|
|
|
(8) |
|
(6)(7) |
|
(2)(3)(4)(5) |
|
(2) |
|
(1)(2) |
| |||||
|
Consolidated Statement of Operations Data: |
|
|
|
|
|
|
|
|
|
|
| |||||
|
Net revenue |
|
$ |
1,709.1 |
|
$ |
1,743.2 |
|
$ |
1,676.9 |
|
$ |
1,662.4 |
|
$ |
1,781.9 |
|
|
(Loss) income from continuing operations, net of tax |
|
(88.1 |
) |
(17.8 |
) |
57.0 |
|
(26.1 |
) |
78.7 |
| |||||
|
Loss from discontinued operations, net of tax |
|
— |
|
— |
|
— |
|
(29.5 |
) |
(7.1 |
) | |||||
|
Net (loss) income |
|
$ |
(88.1 |
) |
$ |
(17.8 |
) |
$ |
57.0 |
|
$ |
(55.6 |
) |
$ |
71.6 |
|
|
|
|
|
|
|
|
|
|
|
|
|
| |||||
|
(Loss) income from continuing operations per share—basic |
|
$ |
(0.38 |
) |
$ |
(0.08 |
) |
$ |
0.24 |
|
$ |
(0.11 |
) |
$ |
0.35 |
|
|
Loss from discontinued operations per share—basic |
|
— |
|
— |
|
— |
|
(0.13 |
) |
(0.03 |
) | |||||
|
Net (loss) income per share—basic |
|
$ |
(0.38 |
) |
$ |
(0.08 |
) |
$ |
0.24 |
|
$ |
(0.24 |
) |
$ |
0.32 |
|
|
|
|
|
|
|
|
|
|
|
|
|
| |||||
|
(Loss) income from continuing operations per share—diluted |
|
$ |
(0.38 |
) |
$ |
(0.08 |
) |
$ |
0.24 |
|
$ |
(0.11 |
) |
$ |
0.34 |
|
|
Loss from discontinued operations per share—diluted |
|
— |
|
— |
|
— |
|
(0.13 |
) |
(0.03 |
) | |||||
|
Net (loss) income per share—diluted |
|
$ |
(0.38 |
) |
$ |
(0.08 |
) |
$ |
0.24 |
|
$ |
(0.24 |
) |
$ |
0.31 |
|
|
|
|
Years Ended |
| |||||||||||||
|
|
|
June 27, |
|
June 28, |
|
June 29, |
|
June 30, |
|
July 2, |
| |||||
|
|
|
|
|
(7) |
|
(2)(3)(4) |
|
|
|
|
| |||||
|
Consolidated Balance Sheets Data: |
|
|
|
|
|
|
|
|
|
|
| |||||
|
Cash, cash equivalents, short-term investments, and restricted cash |
|
$ |
839.4 |
|
$ |
881.3 |
|
$ |
515.9 |
|
$ |
752.7 |
|
$ |
728.7 |
|
|
Working capital |
|
1,004.6 |
|
1,001.1 |
|
682.6 |
|
656.1 |
|
885.5 |
| |||||
|
Total assets |
|
2,217.8 |
|
2,351.9 |
|
1,715.2 |
|
1,869.5 |
|
1,950.7 |
| |||||
|
Long-term obligations |
|
740.9 |
|
755.8 |
|
206.2 |
|
176.6 |
|
466.7 |
| |||||
|
Total stockholders’ equity |
|
1,101.4 |
|
1,187.7 |
|
1,161.3 |
|
1,038.8 |
|
1,065.4 |
| |||||
Note: The consolidated financial data above includes the Lumentum business which separated from Viavi on August 1, 2015. Lumentum will be presented as a discontinued operation in the first fiscal quarter of 2016.
(1) During the third quarter of fiscal 2011, we determined that it is more likely than not that a portion of the deferred tax assets of a foreign jurisdiction will be realized after considering all positive and negative evidence. Accordingly, a deferred tax valuation allowance release of $34.9 million was recorded as an income tax benefit during the quarter.
(2) During the first quarter of fiscal 2013, we entered into a definitive agreement to sell the hologram business (“Hologram Business”) within our OSP segment, which subsequently closed on October 12, 2012. As a result, the operations of the Hologram Business have been presented as discontinued operations for all periods presented.
(3) During the third quarter of fiscal 2013, we acquired Arieso in a transaction accounted for in accordance with the authoritative guidance on business combinations. The Consolidated Statements of Operations for fiscal 2013 included the results of Arieso subsequent to March 7, 2013 and the Consolidated Balance Sheet as of June 29, 2013 included Arieso’s financial position.
(4) During the third quarter of fiscal 2013, we approved a strategic plan to exit NSE’s legacy low-speed wireline product line, which resulted in a $2.2 million charge for accelerated amortization of related intangibles, of which $1.8 million and $0.4 million are included in Amortization of acquired technologies and Amortization of other intangibles in the Consolidated Statement of Operations, respectively. In addition, we incurred $11.3 million of inventory-related charges included in Cost of sales in the Consolidated Statement of Operations, primarily related to the write-off of inventory no longer being sold due to the legacy low-speed wireline product line exit.
(5) During the fourth quarter of fiscal 2013, we determined that it is more likely than not that a portion of the deferred tax assets of a non-U.S. jurisdiction will be realized after considering all positive and negative evidence. Accordingly, a deferred tax valuation allowance release of $107.9 million was recorded as an income tax benefit during the quarter.
(6) During the third quarter of fiscal 2014, we recognized $21.7 million of uncertain tax benefits related to deferred tax assets due to the expiration of the statute of limitations in a non-U.S. jurisdiction.
(7) During the third quarter of fiscal 2014, we acquired Network Instruments in a transaction accounted for in accordance with the authoritative guidance on business combinations. The Consolidated Statement of Operations for fiscal 2014 included the results of operations from Network Instruments subsequent to January 6, 2014 and the Consolidated Balance Sheet as of June 28, 2014 included Network Instruments’ financial position.
(8) In the third quarter of fiscal 2015 we recognized a $21.8 million tax benefit upon the settlement of an audit in a non-U.S. jurisdiction.
ITEM 7. MANAGEMENT’S DISCUSSION AND ANALYSIS OF FINANCIAL CONDITION AND RESULTS OF OPERATIONS
Our Industries and Developments
Viavi, formerly JDSU, is a leading provider of network and service enablement solutions and optical products for telecommunications service providers, wireless operators, cable operators, NEMs and enterprises. We are also an established leader in anti-counterfeiting solutions for currency authentication, and provide high-value optical components and instruments for security, safety, electronics, and other applications. In addition, we leverage our core networking and optical technology expertise to deliver high-powered commercial lasers for manufacturing applications and expand into emerging markets, including 3-D sensing solutions for consumer electronics. On September 10, 2014, we announced plans to separate into two publicly-traded companies:
· an optical components and commercial lasers company named Lumentum, consisting of our CCOP segment and the WaveReady product line within our NE segment; and
· a network and service enablement and optical coatings company, renamed Viavi, consisting of our NE, SE and OSP segments.
On August 1, 2015, we completed the distribution of approximately 80.1% of the outstanding shares of Lumentum common stock to our stockholders. We were renamed Viavi and, at the time of the distribution, retained ownership of approximately 19.9% of Lumentum’s outstanding shares. The Company’s consolidated financial statements in this Annual Report on Form 10-K include the Lumentum business which will be reported as a discontinued operation beginning in the first quarter of fiscal 2016.
In addition, during the first quarter of fiscal 2015 we reorganized our NSE reportable segment into two separate reportable segments: Network Enablement and Service Enablement. Splitting NSE into two reportable segments provides greater clarity and transparency regarding the markets, financial performance and business models of our NE and SE businesses. NE is a hardware-centric and more mature business consisting primarily of NSE’s traditional communications test instrument products. SE is a software-centric business consisting primarily of software solutions that are embedded within the network and enterprise performance management solutions. Historical segment information has been recast to conform to this new reporting structure.
To serve our markets, during fiscal 2015 we operated the following business segments:
· Network Enablement
· Service Enablement
· Communications and Commercial Optical Products
· Optical Security and Performance Products
Beginning August 1, 2015, as a result of the separation of the Lumentum business, Viavi no longer sells products and services from the CCOP segment or the WaveReady product line.
Network Enablement
NE provides an integrated portfolio of testing solutions that access the network to perform build-out and maintenance tasks. These solutions include instruments, software and services to design, build, turn-up, certify, troubleshoot, and optimize networks. They also support more profitable, higher-performing networks and help speed time-to-revenue.
Our solutions address lab and production environments, field deployment and service assurance for wireless and fixed communications networks, including storage networks. Our test instrument portfolio is one of the largest in the industry, with hundreds of thousands of units in active use by major NEMs, operators and services providers worldwide. Designed to be mobile, these products include instruments and software that access the network to perform installation and maintenance tasks that help service provider technicians assess the performance of network elements and segments and verify the integrity of the information being transmitted across the network. These instruments are highly intelligent and have user interfaces that are designed to simplify operations and minimize the training required to operate them. Our NE solutions are also used by NEMs in the design and production of next-generation network equipment.
Viavi also offers a range of product support and professional services designed to comprehensively address our customers’ requirements. These services include repair, calibration, software support and technical assistance for our products. We offer product and technology training as well as consulting services. Our professional services, provided in conjunction with system integration projects, include project management, installation and implementation.
NE customers include wireless and fixed services providers, NEMs, government organizations and large corporate customers, such as major telecom, mobility and cable operators, chip and infrastructure vendors, storage-device manufacturers, storage-network and switch vendors, and deployed private enterprise customers. Our customers include Alcatel-Lucent International, América Móvil, S.A.B. de C.V., AT&T Inc., British Telecommunications, Plc, CenturyLink, Inc., Cisco Systems, Inc., Comcast Corporation, Time Warner Inc., Verizon Communications Inc. and Vodafone Group Plc.
Service Enablement
SE provides embedded systems and enterprise performance management solutions that give global service providers, enterprises and cloud operators visibility into network, service and application data. These solutions - which primarily consist of instruments, microprobes and software - monitor, collect and analyze network data to reveal the actual customer experience and identify opportunities for new revenue streams and network optimization.
Our portfolio of SE solutions address the same lab and production environments, field deployment and service assurance for wireless and fixed communications networks, including storage networks, as our NE portfolio. Our solutions let carriers remotely monitor performance and quality of network, service and applications performance throughout the entire network. This provides our customers with enhanced network management, control, and optimization that allow network operators to initiate service to new customers faster, decrease the need for technicians to make on-site service calls, help to make necessary repairs faster and, as a result, lower costs while providing higher quality and more reliable services. Remote monitoring decreases operating expenses, while early detection helps increase uptime, preserve revenue, and helps operators better monetize their networks.
SE customers include the same wireless and fixed services providers, NEMs, government organizations, large corporate customers, and storage-segment customers that are served by our NE segment.
Communications and Commercial Optical Products
Beginning on August 1, 2015, Viavi no longer sells products and services from the CCOP segment. Except as otherwise noted, all references in this Annual Report on Form 10-K are to the CCOP segment as it existed during fiscal 2015 and prior periods.
CCOP provided optical and photonic products addressing a range of end-market applications including Datacom and Telecom networking and commercial lasers for manufacturing, inspection and life-science applications. The CCOP segment also expanded into emerging markets such as 3-D sensing for consumer electronics and diode light sources for a variety of consumer and industrial applications. CCOP’s OpComms offerings included a range of components, modules and subsystems to address two primary markets: Telecom and Datacom. The Telecom market includes carrier networks for access (local), metro (intracity), long-haul (city-to-city and worldwide) and submarine (undersea) networks. The Datacom market addresses enterprise, cloud and data center applications, including storage-access networks (“SANs”), local-area networks (“LANs”) and Ethernet wide-area networks (“WANs”). These products enabled the transmission and transport of video, audio and text data over high-capacity fiber-optic cables. CCOP’s optical communications portfolio also included ROADMs, tunable 10-gigabit small form-factor pluggable transceivers and tunable small form-factor pluggables. CCOP’s portfolio of pluggable transceivers supported LAN/SAN needs and the cloud for customers building proprietary data center networks.
In the Consumer and Industrial markets CCOP’s products included its light source product which is integrated into 3-D sensing platforms being used in applications for gaming, computing and home entertainment.
CCOP also served customers in markets and applications such as manufacturing, biotechnology, graphics and imaging, remote sensing, and precision machining such as drilling in printed circuit boards, wafer singulation and solar cell scribing. CCOP’s Lasers products were used in a variety of OEM applications.
OEM applications used CCOP’s products, including diode-pumped solid-state, fiber, diode, direct-diode and gas lasers such as argon-ion and helium-neon lasers used in biotechnology, graphics and imaging, remote sensing, materials processing and precision machining applications.
CCOP’s customers included Alcatel-Lucent International, Amada Co Ltd., Ciena Corporation, Cisco Systems Inc, Coriant GmbH, DISCO Corporation, Google Inc, Huawei Technologies Co Ltd., NEC Corporation, and ZTE Corporation.
Optical Security and Performance Products
OSP leverages its core optical coating technologies and volume manufacturing capability to design, manufacture, and sell products targeting anti-counterfeiting, consumer and industrial, government, healthcare and other markets.
OSP’s security offerings for the currency market include OVP®, OVMP® and banknote thread substrates. OVP® enables a color-shifting effect used by banknote issuers and security printers worldwide for anti-counterfeiting applications on currency and other high-value documents and products. OVP® protects the currencies of more than 100 countries today. OSP also develops and delivers overt and covert anti-counterfeiting products that utilize its proprietary printing platform and are targeted primarily at the pharmaceutical and consumer-electronics markets.
Leveraging its expertise in spectral management and its unique high-precision coating capabilities, OSP provides a range of products and technologies for the consumer-electronics market, including, for example, optical filters for 3-D sensing devices designed for gaming and other platforms.
OSP value-added solutions meet the stringent requirements of commercial and government customers in aerospace and defense. Viavi products are used in a variety of aerospace and defense applications, including optics for guidance systems, laser eye protection and night vision systems. These products, including coatings and optical filters, are optimized for each specific application.
OSP serves customers such as 3M Company, BAE Systems plc, FLIR Systems, Lockheed Martin and SICPA.
Recently Issued Accounting Pronouncements
In July 2015, the Financial Accounting Standards Board (“FASB”) issued guidance to change the subsequent measurement of inventory from lower of cost or market to lower of cost and net realizable value. The guidance is effective for the Company beginning in the first quarter of fiscal 2018. Earlier application is permitted as of the beginning of an interim or annual reporting period. The Company is evaluating the impact of adopting this new accounting guidance on its consolidated financial statements.
In May 2015, the FASB issued guidance to remove the requirement to categorize within the fair value hierarchy all investments for which fair value is measured using net asset value per share practical expedient. The guidance is effective for the Company in the first quarter of fiscal 2017, and may apply to certain pension assets. The guidance will be applied retrospectively, and earlier adoption is permitted. The Company is evaluating the impact of adopting this new accounting guidance on its consolidated financial statements.
In April 2015, the FASB issued new authoritative guidance to provide a practical expedient that permits the entity to measure defined benefit plan assets and obligations using the month-end that is closest to the entity’s fiscal year-end and apply that practical expedient consistently from year to year. Prospective application is required, and early adoption is permitted. This guidance is effective for the Company in the first quarter of fiscal 2017 and may apply to the qualified and the non-qualified pension plans in certain countries. The Company is evaluating the impact of adopting this new accounting guidance on its consolidated financial statements.
In April 2015, the FASB issued new authoritative guidance to simplify the presentation of debt issuance costs by requiring debt issuance costs to be presented as a deduction from the corresponding liability, consistent with debt discounts or premiums. This guidance is effective for the Company in the first quarter of fiscal 2017, and will be applied retrospectively. The consolidated balance sheet of each individual period presented will be adjusted to reflect the period-specific effects of applying this new guidance.
In May 2014, the FASB issued new authoritative guidance related to revenue recognition. This guidance will replace current U.S. GAAP guidance on this topic and eliminate industry-specific guidance. The new revenue recognition guidance provides a unified model to determine when and how revenue is recognized. The core principle is that a company should recognize revenue to depict the transfer of promised goods or services to customers in an amount that reflects the consideration for which the entity expects to be entitled in exchange for those goods or services. This guidance allows for either full retrospective adoption or modified retrospective adoption. The FASB deferred the effective date for this guidance by one year to December 15, 2017 for annual reporting periods beginning after that. Earlier application of this guidance is permitted but not before the original date of December 15, 2016. The Company is evaluating the impact that this new accounting guidance will have on its consolidated financial statements and the related disclosures.
In April 2014, the FASB issued authoritative guidance, which specifies that only disposals, such as a disposal of a major line of business, representing a strategic shift in operations should be presented as discontinued operations. In addition, the new guidance requires expanded disclosures about discontinued operations that will provide financial statement users with more information about the assets, liabilities, income, and expenses of discontinued operations. This guidance is effective for the Company in the first quarter of fiscal 2016 and will apply to the separation of the Lumentum business which took place on August 1, 2015.
Critical Accounting Policies and Estimates
The preparation of our consolidated financial statements in conformity with accounting principles generally accepted in the United States requires us to make estimates and judgments that affect the reported amounts of assets and liabilities, net revenue and expenses, and the related disclosures. We base our estimates on historical experience, our knowledge of economic and market factors and various other assumptions that we believe to be reasonable under the circumstances. Estimates and judgments used in the preparation of our financial statements are, by their nature, uncertain and unpredictable, and depend upon, among other things, many factors outside of our control, such as demand for our products and economic conditions. Accordingly, our estimates and judgments may prove to be incorrect and actual results may differ from these estimates under different assumptions or conditions. We believe the following critical accounting policies are affected by significant estimates, assumptions and judgments used in the preparation of our consolidated financial statements:
Revenue Recognition
We recognize revenue when it is realized or realizable and earned. We consider revenue realized or realizable and earned when there is persuasive evidence of an arrangement, delivery has occurred, the sales price is fixed or determinable, and collectability is reasonably assured. Delivery does not occur until products have been shipped or services have been provided, risk of loss has transferred and in cases where formal acceptance is required, customer acceptance has been obtained or customer acceptance provisions have lapsed. In situations where a formal acceptance is required but the acceptance only relates to whether the product meets its published specifications, revenue is recognized upon delivery provided all other revenue recognition criteria are met. The sales price is not considered to be fixed or determinable until all contingencies related to the sale have been resolved.
We reduce revenue for rebates and other similar allowances. Revenue is recognized only if these estimates can be reliably determined. Our estimates are based on historical results taking into consideration the type of customer, the type of transaction and the specifics of each arrangement.
In addition to the aforementioned general policies, the following are the specific revenue recognition policies for multiple-element arrangements and for each major category of revenue.
Multiple-Element Arrangements
When a sales arrangement contains multiple deliverables, such as sales of products that include services, the multiple deliverables are evaluated to determine whether there are one or more units of accounting. Where there is more than one unit of accounting, then the entire fee from the arrangement is allocated to each unit of accounting based on the relative selling price. Under this approach, the selling price of a unit of accounting is determined by using a selling price hierarchy which requires the use of vendor-specific objective evidence (“VSOE”) of fair value if available, third-party evidence (“TPE”) if VSOE is not available, or management’s best estimate of selling price (“BESP”) if neither VSOE nor TPE is available. Revenue is recognized when the revenue recognition criteria for each unit of accounting are met.
We establish VSOE of selling price using the price charged for a deliverable when sold separately. TPE of selling price is established by evaluating similar and interchangeable competitor goods or services in sales to similarly situated customers. When VSOE or TPE are not available then we use BESP. Generally, we are not able to determine TPE because our product strategy differs from that of others in our markets, and the extent of customization varies among comparable products or services from our peers. We establish BESP using historical selling price trends and considering multiple factors including, but not limited to geographies, market conditions, competitive landscape, internal costs, gross margin objectives, and pricing practices. When determining BESP, we apply significant judgment in establishing pricing strategies and evaluating market conditions and product lifecycles.
The determination of BESP is made through consultation with and approval by the segment management. Segment management may modify or develop new pricing practices and strategies in the future. As these pricing strategies evolve, we may modify our pricing practices in the future, which may result in changes in BESP. The aforementioned factors may result in a different allocation of revenue to the deliverables in multiple element arrangements from the current fiscal year, which may change the pattern and timing of revenue recognition for these elements but will not change the total revenue recognized for the arrangement.
To the extent a deliverable(s) in a multiple-element arrangement is subject to specific guidance (for example, software that is subject to the authoritative guidance on software revenue recognition), we allocate the fair value of the units of accounting using relative selling price and that unit of accounting is accounted for in accordance with the specific guidance. Some of our product offerings include hardware that are integrated with or sold with software that delivers the functionality of the equipment. We believe this equipment is not considered software-related and would therefore be excluded from the scope of the authoritative guidance on software revenue recognition.
Hardware
Revenue from hardware sales is typically recognized when the product meet delivery criteria.
Services
Revenue from services and system maintenance is typically recognized on a straight-line basis over the term of the contract. Revenue from professional service engagements is typically recognized once its delivery obligation is fulfilled. Revenue related to extended warranty and product maintenance contracts is deferred and recognized on a straight-line basis over the delivery period. We also generate service revenue from hardware repairs and calibration which is recognized as revenue upon completion of the service.
Software
Our software arrangements generally consist of a perpetual license fee and Post-Contract Support (“PCS”). Where we have established VSOE of fair value for PCS contracts, it is based on the renewal rate or the bell curve methodology. Revenue from maintenance, unspecified upgrades and technical support is recognized over the period such items are delivered. In multiple-element revenue arrangements that include software, software-related and non-software-related elements are accounted for in accordance with the following policies.
· Non-software and software-related products are bifurcated based on a relative selling price
· Software-related products are separated into units of accounting if all of the following criteria are met:
· The functionality of the delivered element(s) is not dependent on the undelivered element(s).
· There is VSOE of fair value of the undelivered element(s).
· Delivery of the delivered element(s) represents the culmination of the earnings process for that element(s).
If these criteria are not met, the software revenue is deferred until the earlier of when such criteria are met or when the last undelivered element is delivered. If there is VSOE of the undelivered item(s) but no such evidence for the delivered item(s), the residual method is used to allocate the arrangement consideration. Under the residual method, the amount of consideration allocated to the delivered item(s) equals the total arrangement consideration less the aggregate VSOE of the undelivered elements. Generally VSOE has not been established for PCS, and in those cases we have recognized revenue ratably over the PCS period after all software elements have been delivered and the only undelivered item is PCS.
Allowances for Doubtful Accounts
We perform credit evaluations of our customers’ financial condition. We maintain allowances for doubtful accounts for estimated losses resulting from the inability of our customers to make required payments. We record our bad debt expenses as SG&A expense. When we become aware that a specific customer is unable to meet its financial obligations to us, for example, as a result of bankruptcy or deterioration in the customer’s operating results or financial position, we record a specific allowance to reflect the level of credit risk in the customer’s outstanding receivable balance. In addition, we record additional allowances based on certain percentages of our aged receivable balances. These percentages are determined by a variety of factors including, but not limited to, current economic trends, historical payment and bad debt write-off experience. We are not able to predict changes in the financial condition of our customers, and if circumstances related to our customers deteriorate, our estimates of the recoverability of our trade receivables could be materially affected and we may be required to record additional allowances. Alternatively, if we provide more allowances than we need, we may reverse a portion of such provisions in future periods based on our actual collection experience.
Investments
Our investments in debt securities and marketable equity securities are primarily classified as available-for-sale investments or trading securities and are recorded at fair value. The cost of securities sold is based on the specific identification method. Unrealized gains and losses on available-for-sale investments, net of tax, are reported as a separate component within our Consolidated Statements of Stockholders’ Equity. Unrealized gains or losses on trading securities resulting from changes in fair value are recognized in current earnings. Our short-term investments, which are classified as current assets, include certain securities with stated maturities of longer than twelve months as they are highly liquid and available to support current operations.
We periodically review our investments for impairment. If a debt security’s market value is below amortized cost and we either intend to sell the security or it is more likely than not that we will be required to sell the security before its anticipated recovery, we record an other-than-temporary impairment charge to investment income (loss) for the entire amount of the impairment; if a debt security’s market value is below amortized cost and we do not expect to recover the entire amortized cost of the security, we separate
the other-than-temporary impairment into the portion of the loss related to credit factors, or the credit loss portion, and the portion of the loss that is not related to credit factors, or the non-credit loss portion. The credit loss portion is the difference between the amortized cost of the security and our best estimate of the present value of the cash flows expected to be collected from the debt security. The non-credit loss portion is the residual amount of the other-than-temporary impairment. The credit loss portion is recorded as a charge to income (loss), and the non-credit loss portion is recorded as a separate component of Other comprehensive income (loss).
Inventory Valuation
We assess the value of our inventory on a quarterly basis and write-down those inventories which are obsolete or in excess of our forecasted usage to their estimated realizable value. Our estimates of realizable value are based upon our analysis and assumptions including, but not limited to, forecasted sales levels by product, expected product lifecycle, product development plans and future demand requirements. Our product line management personnel play a key role in our excess review process by providing updated sales forecasts, managing product transitions and working with manufacturing to maximize recovery of excess inventory. If actual market conditions are less favorable than our forecasts or actual demand from our customers is lower than our estimates, we may be required to record additional inventory write-downs. If actual market conditions are more favorable than anticipated, inventory previously written down may be sold, resulting in lower cost of sales and higher income from operations than expected in that period.
Goodwill Valuation
We test goodwill for possible impairment on an annual basis in our fourth quarter and at any other time if events occur or circumstances indicate that the carrying amount of goodwill may not be recoverable. Circumstances that could trigger an impairment test include, but are not limited to: a significant adverse change in the business climate or legal factors, an adverse action or assessment by a regulator, changes in customers, target markets and strategy, unanticipated competition, loss of key personnel, or the likelihood that a reporting unit or significant portion of a reporting unit will be sold or otherwise disposed.
The authoritative guidance allows an entity to assess qualitative factors to determine whether it is necessary to perform the two-step quantitative goodwill impairment test. If an entity determines that as a result of the qualitative assessment that it is more likely than not (i.e. greater than 50% likelihood) that the fair value of a reporting unit is less than its carrying amount, then the quantitative test is required. Otherwise, no further testing is required. The two-step quantitative goodwill impairment test requires us to estimate the fair value of our reporting units. If the carrying value of a reporting unit exceeds its fair value, the goodwill of that reporting unit is potentially impaired and we proceed to step two of the impairment analysis. In step two of the analysis, we measure and record an impairment loss equal to the excess of the carrying value of the reporting unit’s goodwill over its implied fair value, if any.
Application of the goodwill impairment test requires judgments, including: identification of the reporting units, assigning assets and liabilities to reporting units, assigning goodwill to reporting units, a qualitative assessment to determine whether there are any impairment indicators, and determining the fair value of each reporting unit. We generally estimate the fair value of a reporting unit using a combination of the income approach, which estimates the fair value based on the future discounted cash flows, and the market approach, which estimates the fair value based on comparable market prices. Our significant estimates in the income approach include: our weighted average cost of capital, long-term rate of growth and profitability of the reporting unit’s business, and working capital effects. The market approach estimates the fair value of the business based on a comparison of the reporting unit to comparable publicly traded companies in similar lines of business. Significant estimates in the market approach include: identifying similar companies with comparable business factors such as size, growth, profitability, risk and return on investment, and assessing comparable revenue and operating income multiples in estimating the fair value of the reporting unit.
We base our estimates on historical experience and on various assumptions about the future that we believe are reasonable based on available information. Unanticipated events and circumstances may occur that affect the accuracy of our assumptions, estimates and judgments. For example, if the price of our common stock were to significantly decrease combined with other adverse changes in market conditions, thus indicating that the underlying fair value of our reporting units may have decreased, we might be required to reassess the value of our goodwill in the period such circumstances were identified.
Long-lived Asset Valuation (Property, Plant and Equipment and Intangible Assets)
Long-lived assets held and used
We test long-lived assets for recoverability, at the asset group level, when events or changes in circumstances indicate that their carrying amounts may not be recoverable. Circumstances which could trigger a review include, but are not limited to: significant decreases in the market price of the asset; significant adverse changes in the business climate or legal factors; accumulation of costs significantly in excess of the amount originally expected for the acquisition or construction of the asset; current period cash flow or operating losses combined with a history of losses or a forecast of continuing losses associated with the use of the asset; and current expectation that the asset will more likely than not be sold or disposed of significantly before the end of its estimated useful life.
Recoverability is assessed based on the difference between the carrying amount of the asset and the sum of the undiscounted cash flows expected to result from the use and the eventual disposal of the asset. An impairment loss is recognized when the carrying amount is not recoverable and exceeds fair value.
Long-lived assets held for sale
Long-lived assets are classified as held for sale when certain criteria are met, which include: management commitment to a plan to sell the assets; the availability of the assets for immediate sale in their present condition; an active program to locate buyers and other actions to sell the assets has been initiated; whether the sale of the assets is probable and their transfer is expected to qualify for recognition as a completed sale within one year; whether the assets are being marketed at reasonable prices in relation to their fair value; and how unlikely it is that significant changes will be made to the plan to sell the assets.
We measure long-lived assets to be disposed of by sale at the lower of carrying amount or fair value less cost to sell. Fair value is determined using quoted market prices or the anticipated cash flows discounted at a rate commensurate with the risk involved.
Income Taxes
In accordance with the authoritative guidance on accounting for income taxes, we recognize income taxes using an asset and liability approach. This approach requires the recognition of taxes payable or refundable for the current year and deferred tax liabilities and assets for the future tax consequences of events that have been recognized in our consolidated financial statements or tax returns. The measurement of current and deferred taxes is based on provisions of the enacted tax law and the effects of future changes in tax laws or rates are not anticipated.
The authoritative guidance provides for recognition of deferred tax assets if the realization of such deferred tax assets is more likely than not to occur based on an evaluation of both positive and negative evidence and the relative weight of the evidence. With the exception of certain international jurisdictions, we have determined that at this time it is more likely than not that deferred tax assets attributable to the remaining jurisdictions will not be realized, primarily due to uncertainties related to our ability to utilize our net operating loss carryforwards before they expire. Accordingly, we have established a valuation allowance for such deferred tax assets. If there is a change in our ability to realize our deferred tax assets for which a valuation allowance has been established, then our tax provision may decrease in the period in which we determine that realization is more likely than not. Likewise, if we determine that it is not more likely than not that its deferred tax assets will be realized, then a valuation allowance may be established for such deferred tax assets and our tax provision may increase in the period in which it makes the determination.
The authoritative guidance on accounting for uncertainty in income taxes clarifies the accounting for uncertainty in income taxes recognized in an entity’s financial statements and prescribes the recognition threshold and measurement attributes for financial statement recognition and measurement of a tax position taken or expected to be taken in a tax return. Additionally, it provides guidance on recognition, classification, and disclosure of tax positions. We are subject to income tax audits by the respective tax authorities in all of the jurisdictions in which we operate. The determination of tax liabilities in each of these jurisdictions requires the interpretation and application of complex and sometimes uncertain tax laws and regulations. We recognize liabilities based on our estimate of whether, and the extent to which, additional tax liabilities are more likely than not. If we ultimately determine that the payment of such a liability is not necessary, then we reverse the liability and recognize a tax benefit during the period in which the determination is made that the liability is no longer necessary.
The recognition and measurement of current taxes payable or refundable and deferred tax assets and liabilities requires that we make certain estimates and judgments. Changes to these estimates or a change in judgment may have a material impact on our tax provision in a future period.
Restructuring Accrual
In accordance with authoritative guidance on accounting for costs associated with exit or disposal activities, generally costs associated with restructuring activities are recognized when they are incurred. However, in the case of leases, the expense is estimated and accrued when the property is vacated. Given the significance of, and the timing of the execution of such activities, this process is complex and involves periodic reassessments of estimates made from the time the property was vacated, including evaluating real estate market conditions for expected vacancy periods and sub-lease income. Additionally, a liability for post-employment benefits for workforce reductions related to restructuring activities is recorded when payment is probable and, the amount is reasonably estimable. We continually evaluate the adequacy of the remaining liabilities under our restructuring initiatives. Although we believe that these estimates accurately reflect the costs of our restructuring plans, actual results may differ, thereby requiring us to record additional provisions or reverse a portion of such provisions.
Pension and Other Postretirement Benefits
The funded status of our retirement-related benefit plans is recognized in the Consolidated Balance Sheets. The funded status is measured as the difference between the fair value of plan assets and the benefit obligation at fiscal year end, the measurement date. For defined benefit pension plans, the benefit obligation is the projected benefit obligation (“PBO”); and for the non-pension postretirement benefit plan, the benefit obligation is the accumulated postretirement benefit obligation (“APBO”). The PBO represents the actuarial present value of benefits expected to be paid upon retirement. The APBO represents the actuarial present value of postretirement benefits attributed to employee services already rendered. Unfunded or partially funded plans, with the benefit obligation exceeding the fair value of plan assets, are aggregated and recorded as a retirement and non-pension postretirement benefit obligation equal to this excess. The current portion of the retirement-related benefit obligation represents the actuarial present value of benefits payable in the next 12 months in excess of the fair value of plan assets, measured on a plan-by-plan basis. This liability is recorded in Other current liabilities in the Consolidated Balance Sheets.
Net periodic pension cost (income) is recorded in the Consolidated Statement of Operations and includes service cost, interest cost, expected return on plan assets, amortization of prior service cost and (gains) losses previously recognized as a component of accumulated other comprehensive income. Service cost represents the actuarial present value of participant benefits attributed to services rendered by employees in the current year. Interest cost represents the time value of money cost associated with the passage of time. (Gains) losses arise as a result of differences between actual experience and assumptions or as a result of changes in actuarial assumptions. Prior service cost (credit) represents the cost of benefit improvements attributable to prior service granted in plan amendments. (Gains) losses and prior service cost (credit) not recognized as a component of net periodic pension cost (income) in the Consolidated Statement of Operations as they arise are recognized as a component of accumulated other comprehensive income on the Consolidated Balances Sheets, net of tax. Those (gains) losses and prior service cost (credit) are subsequently recognized as a component of net periodic pension period cost (income) pursuant to the recognition and amortization provisions of the authoritative guidance.
The measurement of the benefit obligation and net periodic pension cost (income) is based on our estimates and actuarial valuations, provided by third-party actuaries, which are approved by our management. These valuations reflect the terms of the plans and use participant-specific information such as compensation, age and years of service, as well as certain assumptions, including estimates of discount rates, expected return on plan assets, rate of compensation increases, and mortality rates. We evaluate these assumptions annually at a minimum. In estimating the expected return on plan assets, we consider historical returns on plan assets, adjusted for forward-looking considerations, inflation assumptions and the impact of the active management of the plan’s invested assets.
Loss Contingencies
We are subject to the possibility of various loss contingencies arising in the ordinary course of business. We consider the likelihood of loss or impairment of an asset or the incurrence of a liability, as well as our ability to reasonably estimate the amount of loss in determining loss contingencies. An estimated loss is accrued when it is probable that an asset has been impaired or a liability has been incurred and the amount of loss can be reasonably estimated. We regularly evaluate current information available to us to determine whether such accruals should be adjusted and whether new accruals are required.
RESULTS OF OPERATIONS
The results of operations for the current period are not necessarily indicative of results to be expected for future periods. The following table summarizes selected Consolidated Statements of Operations items as a percentage of net revenue:
|
|
|
Years Ended |
| ||||
|
|
|
June 27, 2015 |
|
June 28, 2014 |
|
June 29, 2013 |
|
|
Segment net revenue: |
|
|
|
|
|
|
|
|
NE |
|
31.1 |
% |
34.5 |
% |
34.0 |
% |
|
SE |
|
9.9 |
|
8.4 |
|
9.4 |
|
|
CCOP |
|
47.7 |
|
45.6 |
|
44.3 |
|
|
OSP |
|
11.3 |
|
11.5 |
|
12.3 |
|
|
Net revenue |
|
100.0 |
|
100.0 |
|
100.0 |
|
|
Cost of sales |
|
52.1 |
|
52.5 |
|
54.8 |
|
|
Amortization of acquired technologies |
|
2.3 |
|
2.5 |
|
3.8 |
|
|
Gross profit |
|
45.6 |
|
45.0 |
|
41.4 |
|
|
Operating expenses: |
|
|
|
|
|
|
|
|
Research and development |
|
18.3 |
|
17.0 |
|
15.4 |
|
|
Selling, general and administrative |
|
27.2 |
|
25.8 |
|
25.6 |
|
|
Amortization of other intangibles |
|
1.2 |
|
0.9 |
|
0.8 |
|
|
Restructuring and related charges |
|
2.0 |
|
1.4 |
|
1.1 |
|
|
Total operating expenses |
|
48.7 |
|
45.1 |
|
42.9 |
|
|
Loss from operations |
|
(3.1 |
) |
(0.1 |
) |
(1.5 |
) |
|
Interest and other income (expense), net |
|
0.2 |
|
— |
|
(0.2 |
) |
|
Interest expense |
|
(2.0 |
) |
(1.7 |
) |
(1.1 |
) |
|
Loss from continuing operations before income taxes |
|
(4.9 |
) |
(1.8 |
) |
(2.8 |
) |
|
(Benefit from) provisions for income taxes |
|
0.3 |
|
(0.8 |
) |
(6.2 |
) |
|
(Loss) income from continuing operations, net of tax |
|
(5.2 |
) |
(1.0 |
) |
3.4 |
|
|
Loss from discontinued operations, net of tax |
|
— |
|
— |
|
— |
|
|
Net (loss) income |
|
(5.2 |
)% |
(1.0 |
)% |
3.4 |
% |
Financial Data for Fiscal 2015, 2014 and 2013
The following table summarizes selected Consolidated Statement of Operations items (in millions, except for percentages):
|
|
|
2015 |
|
2014 |
|
Change |
|
Percent |
|
2014 |
|
2013 |
|
Change |
|
Percent |
| ||||||
|
Segment net revenue: |
|
|
|
|
|
|
|
|
|
|
|
|
|
|
|
|
| ||||||
|
NE |
|
$ |
532.2 |
|
$ |
602.4 |
|
$ |
(70.2 |
) |
(11.7 |
)% |
$ |
602.4 |
|
$ |
571.7 |
|
$ |
30.7 |
|
5.4 |
% |
|
SE |
|
169.0 |
|
145.9 |
|
23.1 |
|
15.8 |
|
145.9 |
|
157.2 |
|
(11.3 |
) |
(7.2 |
) | ||||||
|
CCOP |
|
815.1 |
|
794.1 |
|
21.0 |
|
2.6 |
|
794.1 |
|
742.2 |
|
51.9 |
|
7.0 |
| ||||||
|
OSP |
|
192.8 |
|
200.8 |
|
(8.0 |
) |
(4.0 |
) |
200.8 |
|
205.8 |
|
(5.0 |
) |
(2.4 |
) | ||||||
|
Net revenue |
|
$ |
1,709.1 |
|
$ |
1,743.2 |
|
$ |
(34.1 |
) |
(2.0 |
)% |
$ |
1,743.2 |
|
$ |
1,676.9 |
|
$ |
66.3 |
|
4.0 |
% |
|
|
|
|
|
|
|
|
|
|
|
|
|
|
|
|
|
|
| ||||||
|
Gross profit |
|
$ |
778.7 |
|
$ |
784.3 |
|
$ |
(5.6 |
) |
(0.7 |
)% |
$ |
784.3 |
|
$ |
694.6 |
|
$ |
89.7 |
|
12.9 |
% |
|
Gross margin |
|
45.6 |
% |
45.0 |
% |
|
|
|
|
45.0 |
% |
41.4 |
% |
|
|
|
| ||||||
|
|
|
|
|
|
|
|
|
|
|
|
|
|
|
|
|
|
| ||||||
|
Amortization of intangibles |
|
59.2 |
|
59.0 |
|
0.2 |
|
0.3 |
% |
59.0 |
|
76.0 |
|
(17.0 |
) |
(22.4 |
)% | ||||||
|
Percentage of net revenue |
|
3.5 |
% |
3.4 |
% |
|
|
|
|
3.4 |
% |
4.6 |
% |
|
|
|
| ||||||
|
|
|
|
|
|
|
|
|
|
|
|
|
|
|
|
|
|
| ||||||
|
Research and development |
|
313.2 |
|
296.0 |
|
17.2 |
|
5.8 |
% |
296.0 |
|
258.5 |
|
37.5 |
|
14.5 |
% | ||||||
|
Percentage of net revenue |
|
18.3 |
% |
17.0 |
% |
|
|
|
|
17.0 |
% |
15.4 |
% |
|
|
|
| ||||||
|
|
|
|
|
|
|
|
|
|
|
|
|
|
|
|
|
|
| ||||||
|
Selling, general and administrative |
|
463.5 |
|
450.4 |
|
13.1 |
|
2.9 |
% |
450.4 |
|
425.7 |
|
21.1 |
|
4.9 |
% | ||||||
|
Percentage of net revenue |
|
27.2 |
% |
25.8 |
% |
|
|
|
|
25.8 |
% |
25.6 |
% |
|
|
|
| ||||||
|
|
|
|
|
|
|
|
|
|
|
|
|
|
|
|
|
|
| ||||||
|
Restructuring and related charges |
|
34.5 |
|
23.8 |
|
10.7 |
|
45.0 |
% |
23.8 |
|
19.0 |
|
4.8 |
|
25.3 |
% | ||||||
|
Percentage of net revenue |
|
2.0 |
% |
1.4 |
% |
|
|
|
|
1.4 |
% |
1.1 |
% |
|
|
|
| ||||||
Foreign Currency Impact on Results of Operations
While the majority of our net revenue and operating expenses are denominated in U.S. dollar, a portion of our international operations are denominated in currencies other than the U.S. dollar. Changes in foreign exchange rates may significantly affect revenue and expenses. During the second half of fiscal 2015, the significant strengthening of the U.S. Dollar relative to certain other foreign currencies (namely the Euro, Japanese Yen and Canadian Dollar) had an unfavorable impact on our reported international net revenues but a favorable impact on our reported international operating expenses because these amounts were translated at lower rates in fiscal 2015 than in fiscal 2014. While we use foreign currency hedging contracts to mitigate some foreign currency exchange risk, these activities are limited in the protection that they provide us and can themselves result in losses.
If currency exchange rates had been constant in fiscal 2015 and fiscal 2014, our consolidated net revenue in “constant dollars” would have increased by approximately $20 million, or 1.2% of net revenue, which primarily impacted our NE and SE segments. The impact of foreign currency fluctuations on net revenue was not indicative of the impact on net income due to the offsetting foreign currency impact on operating costs and expenses. If currency exchange rates had been constant in fiscal 2015 and fiscal 2014, our consolidated operating expenses in “constant dollars” would have increased by approximately $16 million, or 0.9% of net revenue. We refer to our net sales and operating expenses excluding the impact of currency exchange rate fluctuations as “constant dollar” sales and operating expenses. Constant dollar net revenue and operating expenses are non-GAAP financial measures, which is information derived from consolidated financial information but not presented in our financial statements prepared in accordance with U.S. GAAP. Our management believes these non-GAAP measures, when considered in conjunction with the corresponding U.S. GAAP measures, facilitate a better understanding of changes in net revenue and operating expenses. The Results of Operations are presented in accordance with U.S. GAAP and not using constant dollars. Refer to Item 7A. Qualitative and Quantitative Disclosures about Market Risk of this Annual Report on Form 10-K for further details on foreign currency instruments and our related risk management strategies.
Net Revenue
Fiscal 2015 and 2014
Net revenue decreased by $34.1 million, or 2.0%, during fiscal 2015 compared to fiscal 2014. This decrease was primarily due to a decrease in our NE and OSP segments, partially offset by an increase in our SE and CCOP segments as discussed below.
NE net revenue decreased by $70.2 million, or 11.7%, during fiscal 2015 compared to fiscal 2014. This decrease was driven by $75.1 million of net revenue decreases primarily due to a reduction in carrier spending impacting our MAC and Ethernet product lines, coupled with an unfavorable foreign currency impact driven by the significant strengthening of the U.S. Dollar relative to certain foreign currencies, namely the Euro. This was partially offset by $4.9 million of net revenue increases primarily driven by higher demand for new products in our Mobility product line.
SE net revenue increased by $23.1 million, or 15.8%, during fiscal 2015 compared to fiscal 2014. This increase was driven by $35.6 million of net revenue increases primarily due to incremental net revenue from our Enterprise product line which was acquired in the third quarter of fiscal 2014, coupled with revenue growth in our Location Intelligence product line. This was partially offset by $12.5 million of net revenue decreases primarily from our MAA product line resulting from lower demand for our mature product offerings.
CCOP net revenue increased $21.0 million, or 2.6%, during fiscal 2015 compared to fiscal 2014. This increase was driven by $61.8 million of net revenue increases primarily from our products addressing our Datacom and Lasers markets. These increases were primarily due to the ramp of our new products in the Datacom market and higher demand from a key customer for our second generation fiber laser product in the Lasers market. These increases were partially offset by $40.8 million of net revenue decreases primarily from 3-D sensing products addressing our Consumer and Industrial market in fiscal 2015 compared to fiscal 2014 when our customer launched its next-generation gaming console.
OSP net revenue decreased by $8.0 million, or 4.0%, during fiscal 2015 compared to fiscal 2014. This decrease was driven by $35.1 million of net revenue decreases primarily from the planned exit of legacy products which was completed at the end of fiscal 2014 and lower demand from a key customer for 3-D sensing products in our Consumer and Industrial product line. This was partially offset by $27.1 million of net revenue increases primarily from our Anti-Counterfeiting product line driven by cyclical demand for our currency products.
Fiscal 2014 and 2013
Net revenue increased by $66.3 million, or 4.0%, during fiscal 2014 compared to fiscal 2013. This increase was primarily due to an increase in our CCOP and NE segments. This was partially offset by a decrease in our SE and OSP segments as discussed below.
NE net revenue increased by $30.7 million, or 5.4%, during fiscal 2014 compared to fiscal 2013. This increase was driven by $51.2 million of net revenue increases primarily from our MAC and Fiber product lines. These increases were primarily due to demand for new products from a key customer in our MAC product line and increased spending for the deployment of LTE networks by key customers of our Fiber product line. This was partially offset by $20.5 million of net revenue decreases primarily due to the exit of certain products in our Cloud and Data Center product line in the second half of fiscal 2013 and lower demand from a key customer in our WaveReady product line.
SE net revenue decreased by $11.3 million, or 7.2%, during fiscal 2014 compared to fiscal 2013. This decrease was driven by $42.1 million of net revenue decreases primarily from our MAA product line and Packet Portal product lines. These decreases were due to the fact that prior period reflected net revenue from a significant one-time project in our MAA product line and reduced spending in the current period from key customers in our Packet Portal product line. This was partially offset by $30.8 million of net revenue increases primarily from our Location Intelligence and Enterprise product lines driven by incremental sales of new products from our strategic acquisitions in the second half of fiscal 2013 and fiscal 2014, respectively.
CCOP net revenue increased $51.9 million, or 7.0%, during fiscal 2014 compared to fiscal 2013. This increase was driven by $68.8 million of net revenue increases primarily from products addressing the Consumer and Industrial, and Datacom markets. These increases were primarily driven by higher demand for our 3-D sensing light source product related to the launch of our customer’s next generation gaming console in the Consumer and Industrial markets, and due to demand growth for our 10G and 40G products in the Datacom market. This was partially offset by $16.9 million of net revenue decreases from products addressing the Telecom market. These decreases were primarily due to lower spending on new network developments by large service providers.
OSP net revenue decreased by $5.0 million, or 2.4% in fiscal 2014 compared to fiscal 2013. This decrease was driven by $10.2 million of net revenue decreases primarily from our Anti-Counterfeiting product line driven by lower cyclical demand in fiscal 2014. This was partially offset by $5.2 million of net revenue increases primarily from our Consumer and Industrial product line driven by increased cyclical demand for our 3-D sensing optical filters and from last-time buys during fiscal 2014 of certain legacy products which we exited in the fourth quarter of fiscal 2014.
Going forward, we expect to continue to encounter a number of industry and market risks and uncertainties that may limit our visibility, and consequently, our ability to predict future revenue, profitability and general financial performance, and that could create quarter over quarter variability in our financial measures. For example, while the majority of our net revenue and expenses are denominated in U.S. dollars, a portion of our international operations are denominated in foreign currencies. Changes in foreign exchange rates may significantly affect revenue and expenses. Additionally, continued economic issues in Europe have led to uncertain demand in our NE and SE product portfolios. We cannot predict when or to what extent these uncertainties will be resolved. Our revenues, profitability, and general financial performance may also be affected by: (a) strong pricing pressures due to, among other things, a highly concentrated customer base, increasing competition, particularly from Asia-based competitors, and a general commoditization trend for certain products; (b) high product mix variability in our NE and SE markets, which affects revenue and gross margin; (c) fluctuations in customer buying patterns, which cause demand, revenue and profitability volatility; (d) the current trend of communication industry consolidation, which is expected to continue, that directly affects our NE and SE customer bases and adds additional risk and uncertainty to our financial and business projections; and (e) the spinoff may result in disruptions to, and negatively impact our relationships with, our customers and other business partners.
Revenue by Region
We operate in three geographic regions: Americas, Asia-Pacific and Europe Middle East and Africa (“EMEA”) . Net revenue is assigned to the geographic region and country where our product is initially shipped. For example, certain customers may request shipment of our product to a contract manufacturer in one country, which may differ from the location of their end customers. The following table presents net revenue by geographic region (in millions):
|
|
|
Years Ended |
| |||||||||||||
|
|
|
June 27, 2015 |
|
June 28, 2014 |
|
June 29, 2013 |
| |||||||||
|
Net revenue: |
|
|
|
|
|
|
|
|
|
|
|
|
| |||
|
Americas |
|
$ |
791.7 |
|
46.3 |
% |
$ |
826.0 |
|
47.4 |
% |
$ |
822.5 |
|
49.1 |
% |
|
Asia-Pacific |
|
543.8 |
|
31.8 |
% |
505.4 |
|
29.0 |
% |
473.2 |
|
28.2 |
% | |||
|
EMEA |
|
373.6 |
|
21.9 |
% |
411.8 |
|
23.6 |
% |
381.2 |
|
22.7 |
% | |||
|
Total net revenue |
|
$ |
1,709.1 |
|
100.0 |
% |
$ |
1,743.2 |
|
100.0 |
% |
$ |
1,676.9 |
|
100.0 |
% |
Net revenue is assigned to geographic regions based on customer shipment locations. Net revenue from customers outside the Americas for the fiscal years ended 2015, 2014 and 2013 represented 53.7%, 52.6% and 50.9% of net revenue, respectively. Net revenue from customers in the Americas for the fiscal years ended 2015, 2014 and 2013 included net revenue from the United States of $591.3 million, $626.7 million and $630.8 million, respectively. We expect revenue from customers outside of North America to continue to be an important part of our overall net revenue and an increasing focus for net revenue growth opportunities.
During fiscal 2015, 2014 and 2013, no single customer accounted for more than 10% of the Company’s net revenue.
Gross Margin
Gross margin in fiscal 2015 increased 0.6 percentage points to 45.6% from 45.0% in fiscal 2014. This increase was primarily due to an improvement in gross margin within our SE and OSP segments driven by the addition of our higher-margin Enterprise product line acquired in the third quarter of fiscal 2014 in our SE segment, coupled with increased revenue from higher margin anti-counterfeiting products and the exit of lower margin legacy products in our OSP segment. This increase was partially offset by a change in segment mix as CCOP net revenue, which generates lower gross margin generally than our other three segments, represented a higher percentage of consolidated revenue compared to the prior year.
Gross margin in fiscal 2014 increased 3.6 percentage points to 45.0% from 41.4% in fiscal 2013. This increase was primarily due to (i) a reduction in amortization of developed technology driven by certain significant intangible assets becoming fully amortized in the first quarter of fiscal 2014, (ii) an improvement in NE gross margin driven by cost efficiencies resulting from operational, supply chain and product lifecycle management improvements, and the consolidation of our contract manufacturing partners during the second half of fiscal 2013, and (iii) an improvement in CCOP gross margin due to a more favorable product mix and cost reductions in fiscal 2014. This was partially offset by a change in segment mix as CCOP net revenue, which generates lower gross margin generally than our other two segments, represented a higher percentage of consolidated net revenue in fiscal 2014.
As discussed in more detail under “Net Revenue” above, we sell products in certain markets that are consolidating, undergoing product, architectural and business model transitions, have high customer concentrations, are highly competitive (increasingly due to Asia-Pacific-based competition), are price sensitive and/or are affected by customer seasonal and mix variant buying patterns. We expect these factors to continue to result in variability of our gross margin.
Research and Development
R&D expense increased by $17.2 million, or 5.8%, during fiscal 2015 compared to fiscal 2014. This increase was primarily driven by a $10.2 million increase in employee compensation expense primarily due to our ongoing investment in R&D and our strategic acquisitions in the second and third quarters of fiscal 2014. Also contributing to the increase was a $3.6 million IPR&D impairment charge related to a fiscal 2014 acquisition. As a percentage of net revenue, R&D increased 1.3 percentage points in fiscal 2015 as we continue to invest in our portfolio to develop new technologies, products and services that offer our customers increased value and strengthen our position in our core markets. In addition there was a minor impact from the overall decline in revenue.
R&D expense increased $37.5 million, or 14.5%, in fiscal 2014 compared to fiscal 2013. This increase was driven by a $29.2 million increase in labor and benefits expense primarily due to higher headcount and corresponding compensation associated with our ongoing investment in R&D and our strategic acquisitions. As a percentage of net revenue, R&D expense increased by 1.6 percentage points in fiscal 2014 as we continued to invest in our product portfolio through R&D and acquisitions in order to develop new technologies, products and services that offer our customers increased value and strengthen our position in our core markets.
We believe that continuing our investments in R&D is critical to attaining our strategic objectives. We plan to continue to invest in R&D and new products that will further differentiate us in the marketplace and expect our investment in dollar terms to increase in future quarters.
Selling, General and Administrative
SG&A expense increased by $13.1 million, or 2.9%, in fiscal 2015 compared to fiscal 2014. This increase was primarily driven by a $30.5 million increase in non-recurring expenses related to the separation of the Lumentum business. This was partially offset by $17.4 million of various reductions related to our continuing cost reduction efforts, including lower labor and benefit expense, primarily in connection with our strategic initiatives in preparation for the separation. As a percentage of net revenue, SG&A increased by 1.4 percentage points in fiscal 2015 primarily due to costs incurred related to the separation of the Lumentum business coupled with lower net revenue as discussed above.
SG&A expense increased $21.1 million, or 4.9%, in fiscal 2014 compared to fiscal 2013. This increase was primarily driven by a $23.9 million increase in labor and benefits expense primarily due to higher headcount and corresponding compensation related to our strategic acquisitions. This was partially offset by a $4.1 million decrease in external costs due to the insourcing of certain IT applications in the fourth quarter of fiscal 2013. As a percentage of net revenue, SG&A expense remained relatively flat, increasing by 0.2 percentage points in fiscal 2014.
We intend to continue to focus on reducing our SG&A expense as a percentage of net revenue. However, we have in the recent past experienced, and may continue to experience in the future, certain non-core expenses, such as mergers and acquisitions-related expenses, expenses related to our separation of the business into two public companies and litigation expenses, which could increase our SG&A expenses and potentially impact our profitability expectations in any particular quarter.
Amortization of Intangibles
Amortization of intangibles for fiscal 2015 increased $0.2 million, or 0.4%, to $59.2 million from $59.0 million in fiscal 2014.
Amortization of intangibles for fiscal 2014 decreased $17.0 million, or 22.4%, to $59.0 million from $76.0 million in fiscal 2013. This decrease is driven by a $20.1 million reduction in amortization of developed technology primarily due to certain significant intangible assets becoming fully amortized in the first quarter of fiscal 2014. This was partially offset by incremental amortization of intangible assets from our fiscal 2013 and fiscal 2014 acquisitions.
Acquired In-Process Research and Development (“IPR&D”)
In accordance with authoritative guidance, we recognize IPR&D at fair value as of the acquisition date, and subsequently account for it as an indefinite-lived intangible asset until completion or abandonment of the associated research and development efforts. We periodically review the stage of completion and likelihood of success of each IPR&D project. The nature of the efforts required to develop IPR&D projects into commercially viable products principally relates to the completion of all planning, designing, prototyping, verification and testing activities that are necessary to establish that the products can be produced to meet their design specifications, including functions, features and technical performance requirements.
During fiscal 2014, we acquired IPR&D through the acquisitions of Network Instruments and Trendium. The current status of our significant IPR&D projects from acquisitions is as follows:
Network Instruments Acquisition
Network Instruments was acquired in the third quarter of fiscal 2014 and was accounted for in accordance with the authoritative guidance on business combinations. At the time of acquisition, Network Instruments was in the process of developing next generation integrated network software solutions. During the first quarter of fiscal 2015, we completed our in-process research and development (“IPR&D) project related to the acquisition of Network Instruments. Accordingly, $1.7 million was transferred from indefinite life intangible assets to acquired developed technology intangible assets and began amortizing over its useful life of fifty-two months.
Trendium Acquisition
Trendium was acquired in the second quarter of fiscal 2014 and was accounted for in accordance with the authoritative guidance on business combinations. At the time of acquisition, Trendium was in the process of developing network probe software and next generation service assurance solutions. We have incurred post-acquisition costs of approximately $1.0 million in fiscal 2014 and $1.8 million in fiscal 2015, respectively, and estimate that additional investment of approximately $1.2 million in research and development will be required to complete the project. During fiscal 2015, we recorded a $3.6 million IPR&D impairment charge related to the fiscal 2014 acquisition of Trendium in accordance with the authoritative accounting guidance. The charge was recorded to Research and development (“R&D”) expense in the Consolidated Statements of Operations. The project is currently in the development stage and we expect to complete the project in the first quarter of fiscal 2016.
Restructuring and Related Charges
We continue to initiate strategic restructuring events primarily intended to reduce costs, consolidate our operations, rationalize the manufacturing of our products and align our businesses in response to market conditions. We estimate annualized cost savings of approximately $59 million excluding any one-time charge as a result of the restructuring activities initiated in the past year, of which approximately $17 million relates to savings from plans impacting the Lumentum business. Refer to “Note 11. Restructuring and Related Charges” for more information.
As of June 27, 2015, our total restructuring accrual was $32.1 million.
During fiscal 2015, we recorded $34.5 million in restructuring and related charges. The charges are a combination of new and previously announced restructuring plans and are primarily the result of the following:
i. During the second, third and fourth quarters of fiscal 2015, we (“Management”) approved a plan to eliminate certain positions in our shared services functions in connection with the separation of the Lumentum business. Further, Management consolidated our operations, sales and R&D organization and eliminated positions within NE and SE segments to align with our future product market strategy and lower manufacturing costs in connection with the separation. As a result, a restructuring charge of $24.9 million was recorded for severance and employee benefits during fiscal 2015. In total approximately 400 employees in manufacturing, R&D and SG&A functions located in North America, Latin America, Europe and Asia were impacted. Payments related to the remaining severance and benefits accrual are expected to be paid primarily by the end of the third quarter of fiscal 2018.
ii. During the second and fourth quarters of fiscal 2015, Management approved a CCOP plan to optimize operations and gain efficiencies by closing the Bloomfield, Connecticut site and consolidating roles and responsibilities across functions in connection with the separation. As a result, a restructuring charge of $5.1 million was recorded for severance and employee benefits during fiscal 2015. In total approximately 200 employees in manufacturing, R&D and SG&A functions located in North America, Europe and Asia were impacted. Payments related to the remaining severance and benefits accrual are expected to be paid by the end of the second quarter of fiscal 2017.
iii. During the first quarter of fiscal 2015, Management approved a CCOP plan to optimize operations and gain efficiencies by closing the Robbinsville, New Jersey site and consolidating roles and responsibilities across North America. As a result, a restructuring charge of $1.5 million was recorded for severance and employee benefits during fiscal 2015. In total approximately 30 employees in manufacturing, R&D and SG&A functions located in North America were impacted. Payments related to the remaining severance and benefits accrual are expected to be paid by the end of the first quarter of fiscal 2016.
A majority of the obligations related to the CCOP plans will be paid by Lumentum following the separation.
During fiscal 2014, we recorded $23.8 million in restructuring and related charges which were primarily the result of the following:
i. During the fourth quarter of fiscal 2014, Management approved a plan in the NE segment to realign its operations and strategy to allow for greater investment in high-growth areas. As a result, a restructuring charge of $4.6 million was recorded for severance and employee benefits for 123 employees in manufacturing, R&D and SG&A functions located in North America, Latin America, Asia and Europe. Payments related to the remaining severance and benefits accrual are expected to be paid by the end of the second quarter of fiscal 2016.
ii. During the fourth quarter of fiscal 2014, Management approved a plan in the CCOP segment to close the Serangoon office located in Singapore and move to a lower cost region in order to reduce manufacturing and R&D expenses. As a result, a restructuring charge of $1.7 million was recorded for severance and employee benefits for approximately 50 employees primarily in manufacturing and R&D functions. Payments related to the remaining severance and benefits accrual were paid by the end of the fourth quarter of fiscal 2015.
iii. During the fourth quarter of fiscal 2014, Management approved a plan to eliminate positions and re-define roles and responsibilities in our Shared Service function in order to reduce cost, standardize global processes and establish a more efficient organization. As a result, a restructuring charge of $1.8 million was recorded for severance and employee benefits for 48 employees primarily in general and administrative functions located in the United States, Latin America, Asia and Europe. Payments related to the remaining severance and benefits accrual are expected to be paid by the end of the second quarter of fiscal 2016.
iv. During the third quarter of fiscal 2014, Management approved a plan in the NE segment to realign its services, support and product resources in response to market conditions in the mobile assurance market and to increase focus on software products and next generation solutions through acquisitions and R&D. As a result, a year to date restructuring charge of $7.2 million was recorded for severance and employee benefits for 63 employees primarily in SG&A and manufacturing functions located in North America, Latin America, Asia and Europe. Payments related to the remaining severance and benefits accrual are expected to be paid by the end of the first quarter of fiscal 2020.
v. During the second quarter of fiscal 2014, Management approved a plan in the NE segment to exit the remaining space in Germantown, Maryland. As of June 28, 2014, the Company exited the workspace in Germantown under the plan. The fair value of the remaining contractual obligations, net of sublease income as of June 28, 2014 was $6.9 million. Payments related to the Germantown lease costs are expected to be paid by the end of the second quarter of fiscal 2019.
vi. During the second quarter of fiscal 2014, Management approved a plan to eliminate positions and re-define roles and responsibilities in the Finance and IT organization to align with the future state of the organizations under new executive management and move positions to lower-cost locations where appropriate. As a result, a year-to-date restructuring charge of $3.1 million was recorded for severance and benefits for 22 employees primarily in SG&A functions located in North America, Asia and Europe. Payments related to the remaining severance and benefits accrual are expected to be paid by the end of the third quarter of fiscal 2022.
During fiscal 2013, we recorded $19.0 million in restructuring and related charges which were primarily the result of the following:
i. During the fourth quarter of fiscal 2013, Management approved a plan to re-align certain functions related to the CCOP segment to drive organizational efficiency and enhance the product line marketing leadership. As a result, a restructuring charge of $1.2 million was recorded for severance and employee benefits for 28 employees primarily in manufacturing, R&D and SG&A functions located in the North America and Asia. Payments related to the severance and benefits accrual were paid by the end of the first quarter of fiscal 2015.
ii. During the fourth quarter of fiscal 2013, Management approved a plan in our OSP segment to realign its operations to focus on priority markets such as Anti-Counterfeiting, Consumer and Industrial and Other offerings in government, aerospace and defense which resulted in ceasing production of certain legacy products such as anti-reflection coatings and front-surface mirrors for display and office automation applications, solar cell covers, and select infrared products that use our Multi-layer Anti-reflection Coater, custom display, and some box coater production platforms which were at the end of their lifecycle. The business segment phased out production of these product offerings by the end of the second quarter of fiscal 2014 and de-commission and dispose of certain production equipment as part of the plan. This will result in consolidation of manufacturing operations and office space in our site in Santa Rosa, CA and reduction of workforce by approximately 126 employees primarily in in manufacturing, R&D and SG&A functions located in the United States. Payments related to the severance and benefits accrual were paid by the end of the first quarter of fiscal 2015.
iii. During the fourth quarter of fiscal 2013, Management approved a plan to consolidate workspace in Germantown, Maryland and Beijing, China, primarily used by the NE and SE segments. As of June 29, 2013, the Company had exited the affected facilities in both Germantown and Beijing under the plan. We accrued $4.2 million exit costs in accordance with authoritative guidance related to lease and contract terminations. The fair value of the remaining contractual obligations, net of sublease income as of June 29, 2013 was $5.0 million. Payments related to the Germantown lease costs are expected to be paid by the end of the second quarter of fiscal 2019. Final payments related to the Beijing lease costs were paid during the first quarter of fiscal 2014.
iv. During the third quarter of fiscal 2013, Management approved a plan to transition certain functions related to the CCOP segment to an offshore contract manufacturer to align with our continuous efforts for supply chain optimization. As a result, a restructuring charge of $0.9 million was recorded for severance and employee benefits for 44 employees primarily in manufacturing, R&D and SG&A functions located in the United States. Payments related to the severance and benefits accrual are expected to be paid by the end of the second quarter of fiscal 2017.
v. During the second quarter of fiscal 2013, Management approved a plan to align the Company’s investment strategy in its NE and SE segment with customer spending priorities in high-growth product lines such as wireless network assurance and eliminate positions in R&D, sales and operations organization that supported low-growth product lines. As a result, a restructuring charge of $3.0 million was recorded for severance and employee benefits for 63 employees primarily in manufacturing, R&D and SG&A functions located in North America, Europe and Asia. Payments related to the severance and benefits accrual were paid by the end of the first quarter of fiscal 2015.
vi. During the first quarter of fiscal 2013, Management approved a plan to terminate the CPV product line within the CCOP segment based on limited opportunities for market growth. As a result, a restructuring charge of $0.4 million was recorded for severance and employee benefits for 9 employees primarily in manufacturing, R&D and SG&A functions located in United States, Europe, and Asia. Payments related to the severance and benefits accrual were paid by the end of the fourth quarter of fiscal 2013.
vii. The Company also incurred restructuring and related charges from previously announced restructuring plans in fiscal 2013 on the following: (i) $4.3 million additional severance and employee benefits primarily to adjust the accrual for the NE and SE Operation and Repair Outsourcing Restructuring announced during the fourth quarters of fiscal 2012 arising from 64 employees added to the original plan; (ii) $0.8 million for transfer costs and lease construction costs in NE and SE as the result of the repair outsourcing initiative announced by management during the fourth quarter of fiscal 2012; and (iii) $0.5 million for the exit of two leased sites in NE and SE for the plan announced during the fourth quarter of fiscal 2012. Payments related to the additional severance and benefits accrual in fiscal 2013 are expected to be paid by the end of the third quarter of fiscal 2017.
Our restructuring and other lease exit cost obligations are net of sublease income or lease settlement estimates of approximately $4.4 million. Our ability to generate sublease income, as well as our ability to terminate lease obligations and recognize the anticipated related savings, is highly dependent upon the economic conditions, particularly commercial real estate market conditions in certain geographies, at the time we negotiate the lease termination and sublease arrangements with third parties as well as the performances by such third parties of their respective obligations. While the amount we have accrued represents the best estimate of the remaining obligations we expect to incur in connection with these plans, estimates are subject to change. Routine adjustments are required and may be required in the future as conditions and facts change through the implementation period. If adverse macroeconomic conditions continue, particularly as they pertain to the commercial real estate market, or if, for any reason, tenants under subleases fail to perform their obligations, we may be required to reduce estimated future sublease income and adjust the estimated amounts of future settlement agreements, and accordingly, increase estimated costs to exit certain facilities. Amounts related to the lease expense, net of anticipated sublease proceeds, will be paid over the respective lease terms through fiscal 2019.
Interest and Other Income (Expense), Net
Interest and other income (expense), net was $3.4 million in fiscal 2015 as compared to $0.5 million in fiscal 2014. This $3.0 million change was primarily driven by (i) $2.2 million of gains recorded during the current period related to our receipt of proceeds from the Fair Fund established to provide compensation for losses incurred from investments in Nortel securities in connection with the SEC’s claims against Nortel, (ii) higher sub-lease rental income in the current period and (iii) an increase in interest income of $1.0 million primarily due to balances in higher-yielding investment vehicles in our investment portfolios. This was partially offset by an increase in foreign currency exchange loss of $1.5 million as the balance sheet hedging program provided a less favorable offset to the remeasurement of underlying foreign exchange exposures during the current period.
Interest and other income (expense), net was $0.5 million in fiscal 2014 as compared to $(4.1) million in fiscal 2013. This $4.6 million change was primarily the result of a $4.1 million realized loss in the prior period in connection with the repurchase of $150.0 million aggregate principal amount of our 1% Senior Convertible Notes due 2026 (the “2026 Notes”). The 2026 Notes were fully repurchased and redeemed in fiscal 2013.
Interest Expense
Interest expense increased by $4.3 million, or 14.5%, during fiscal 2015 compared to fiscal 2014. This was primarily due to an increase of $4.6 million and $0.6 million in accretion of unamortized debt discount and contractual interest expense related to the 2033 Notes, which were issued on August 21, 2013. This was partially offset by a $1.3 million write-off of unamortized issuance cost related to the termination of our $250.0 million revolving credit facility in the first quarter of fiscal 2014.
Interest expense increased by $11.8 million, or 65.9%, in fiscal 2014 compared to fiscal 2013. This increase was primarily due to higher accretion of the debt discount and contractual interest expense recognized on our 2033 Notes in fiscal 2014 as compared to the accretion and contractual interest expense on our 2026 Notes in fiscal 2013. The increase was primarily driven by the fact that the unamortized debt discount of our 2033 Notes was significantly higher than that of our 2026 Notes in fiscal 2013. During fiscal 2014 we accreted debt discount and recognized contractual interest expense on our 2033 Notes of $20.7 million and $3.5 million, respectively. During fiscal 2013 we accreted debt discount and recognized contractual interest expense on our 2026 Notes of $12.0 million and $1.8 million, respectively.
Provision for (Benefit from) Income Tax
Fiscal 2015 Tax Expense/Benefit
We recorded an income tax expense of $5.2 million for fiscal 2015. The expected tax benefit derived by applying the federal statutory rate to our loss before income taxes for fiscal 2015 differed from the income tax expense recorded primarily as a result of domestic and foreign losses that were not realized due to valuation allowances and offset by a $21.8 million tax benefit recognized upon the settlement of an audit in a non-US jurisdiction.
Based on a jurisdiction by jurisdiction review of anticipated future income and due to the continued economic uncertainty in the industry, Management has determined that in many of our jurisdictions, it is more likely than not that our net deferred tax assets will not be realized in those jurisdictions. During fiscal 2015, the valuation allowance for deferred tax assets decreased by $11.7 million. The decrease was primarily related to the decrease in the deferred tax assets as a result of the use and expiration of foreign net operating losses. We are routinely subject to various federal, state and foreign audits by taxing authorities. We believe that adequate amounts have been provided for any adjustments that may result from these examinations.
Fiscal 2014 Tax Expense/Benefit
We recorded an income tax benefit of $13.1 million for fiscal 2014. The expected tax benefit derived by applying the federal statutory rate to our loss before income taxes for fiscal 2014 differed from the income tax benefit recorded primarily as a result of domestic and foreign losses that were not realized due to valuation allowances and offset by the recognition of $21.7 million of uncertain tax benefits related to deferred tax assets due to the expiration of the statute of limitations in a non-US jurisdiction. In addition, we recorded a tax benefit of $6.4 million related to the income tax intraperiod tax allocation rules in relation to other comprehensive income.
Based on a jurisdiction by jurisdiction review of anticipated future income and due to the continued economic uncertainty in the industry, Management has determined that in many of our jurisdictions, it is more likely than not that our net deferred tax assets will not be realized in those jurisdictions. During fiscal 2014, the valuation allowance for deferred tax assets decreased by $49.3 million. The decrease was primarily related to an increase in acquisition and debt issuance related deferred tax liabilities. We are routinely subject to various federal, state and foreign audits by taxing authorities. We believe that adequate amounts have been provided for any adjustments that may result from these examinations.
Fiscal 2013 Tax Expense/Benefit
We recorded an income tax benefit of $103.9 million for 2013. The expected tax benefit derived by applying the federal statutory rate to our loss before income taxes for fiscal 2013 differed from the income tax benefit recorded primarily due to a net reduction in our valuation allowance related to valuation allowance releases, utilization of foreign net operating losses, and the recognition of tax credits generated during the current year.
During fiscal year 2013, after considering all available evidence, both positive and negative, we determined that a valuation allowance release of $107.9 million was appropriate for a foreign subsidiary because it was more likely than not that the deferred tax assets of the foreign subsidiary would be realized.
Previously, upon considering the totality of the negative evidence that existed with respect to the realization of the foreign subsidiary’s deferred tax assets, which included its history of losses, the economic uncertainty of the foreign subsidiary’s operations existing at that time, and the fact that there was no reasonable expectation or projections of future pre-tax income to support the realization of the deferred tax assets associated with the cumulative losses, we had recorded a full valuation allowance against the deferred tax assets.
In light of the historical losses and in order to improve the profitability of the foreign subsidiary, beginning in fiscal year 2011 and continuing in later years, we implemented targeted reorganization activities and instituted a new business model for the foreign subsidiary. Under the new business model, we became the worldwide distributor for most of the products manufactured by the foreign subsidiary and the foreign subsidiary began performing certain cost-plus reimbursable services for us.
The foreign subsidiary’s operations improved as a result of the actions described above and resulted in a pre-tax profit for fiscal year 2013 and cumulative pre-tax income for the preceding three-year period. Moreover, based on the foreign subsidiary’s improved operational activities and performance under the new business model it was able to reasonably forecast continued future pre-tax earnings. The reasonableness of the foreign subsidiary’s forecast of continued future pre-tax earnings is supported by the facts that we intend to continue to use the new business model and the forecast is not dependent on any changes to the new business model, additional reorganization activities, or improvements to operational activities.
Therefore, as described above, based on all available evidence, including both positive and negative, and the weight of that evidence, we concluded that it was more likely than not that the deferred tax assets of the foreign subsidiary would be realized and that the applicable valuation allowance should be released.
In addition, during fiscal 2013 we recorded net income tax expense of $4.0 million attributable to the results of our worldwide operations.
Based on a jurisdiction by jurisdiction review of anticipated future income and due to the continued economic uncertainty in the industry, Management has determined that in many of our jurisdictions, it is more likely than not that our net deferred tax assets will not be realized in those jurisdictions. During fiscal 2013, the valuation allowance for deferred tax assets decreased by $87.9 million. The decrease was primarily related to the valuation allowance release mentioned above. We are routinely subject to various federal, state and foreign audits by taxing authorities. We believe that adequate amounts have been provided for any adjustments that may result from these examinations.
Discontinued Operations
During the second quarter of fiscal 2013, we closed the sale of the Hologram Business, previously within the OSP reportable segment, and received gross proceeds of $11.5 million in cash, subject to an earnout clause requiring the buyer to pay up to a maximum additional amount of $4.0 million if the revenue generated by the business exceeds a pre-determined target amount during the one-year period immediately following the closing. In fiscal 2015, we received a favorable arbitration ruling to resolve a dispute regarding the amount we are owed from the buyer under the earnout clause but have not received the earnout payment from the buyer. If any amount related to the earnout clause meets the recognition criteria it will be included as a component of discontinued operations in the Consolidated Statements of Operations.
Net revenue of the Hologram Business for fiscal 2013 was $5.2 million and net loss from discontinued operations was immaterial. There was no tax effect associated with the discontinued operation.
Operating Segment Information (in millions):
|
|
|
2015 |
|
2014 |
|
Change |
|
Percentage |
|
2014 |
|
2013 |
|
Change |
|
Percentage |
| ||||||
|
NE |
|
|
|
|
|
|
|
|
|
|
|
|
|
|
|
|
| ||||||
|
Net revenue |
|
$ |
532.2 |
|
$ |
602.4 |
|
$ |
(70.2 |
) |
(11.7 |
)% |
$ |
602.4 |
|
$ |
571.7 |
|
$ |
30.7 |
|
5.4 |
% |
|
Operating income |
|
90.6 |
|
105.9 |
|
(15.3 |
) |
(14.4 |
)% |
105.9 |
|
87.0 |
|
18.9 |
|
21.7 |
% | ||||||
|
Operating margin |
|
17.0 |
% |
17.6 |
% |
|
|
|
|
17.6 |
% |
15.2 |
% |
|
|
|
| ||||||
|
|
|
|
|
|
|
|
|
|
|
|
|
|
|
|
|
|
| ||||||
|
SE |
|
|
|
|
|
|
|
|
|
|
|
|
|
|
|
|
| ||||||
|
Net revenue |
|
$ |
169.0 |
|
$ |
145.9 |
|
$ |
23.1 |
|
15.8 |
% |
$ |
145.9 |
|
$ |
157.2 |
|
$ |
(11.3 |
) |
(7.2 |
)% |
|
Operating loss |
|
(18.0 |
) |
(25.6 |
) |
7.6 |
|
29.7 |
% |
(25.6 |
) |
(3.9 |
) |
(21.7 |
) |
(556.4 |
)% | ||||||
|
Operating margin |
|
(10.7 |
)% |
(17.5 |
)% |
|
|
|
|
(17.5 |
)% |
(2.5 |
)% |
|
|
|
| ||||||
|
|
|
|
|
|
|
|
|
|
|
|
|
|
|
|
|
|
| ||||||
|
CCOP |
|
|
|
|
|
|
|
|
|
|
|
|
|
|
|
|
| ||||||
|
Net revenue |
|
$ |
815.1 |
|
$ |
794.1 |
|
$ |
21.0 |
|
2.6 |
% |
$ |
794.1 |
|
$ |
742.2 |
|
$ |
51.9 |
|
7.0 |
% |
|
Operating income |
|
90.2 |
|
93.5 |
|
(3.3 |
) |
(3.5 |
)% |
93.5 |
|
82.4 |
|
11.1 |
|
13.5 |
% | ||||||
|
Operating margin |
|
11.1 |
% |
11.8 |
% |
|
|
|
|
11.8 |
% |
11.1 |
% |
|
|
|
| ||||||
|
|
|
|
|
|
|
|
|
|
|
|
|
|
|
|
|
|
| ||||||
|
OSP |
|
|
|
|
|
|
|
|
|
|
|
|
|
|
|
|
| ||||||
|
Net revenue |
|
$ |
192.8 |
|
$ |
200.8 |
|
$ |
(8.0 |
) |
(4.0 |
)% |
$ |
200.8 |
|
$ |
205.8 |
|
$ |
(5.0 |
) |
(2.4 |
)% |
|
Operating income |
|
74.9 |
|
72.0 |
|
2.9 |
|
4.0 |
% |
72.0 |
|
73.2 |
|
(1.2 |
) |
(1.6 |
)% | ||||||
|
Operating margin |
|
38.8 |
% |
35.9 |
% |
|
|
|
|
35.9 |
% |
35.6 |
% |
|
|
|
| ||||||
Network Enablement
NE operating margin decreased 0.6 percentage points during fiscal 2015 to 17.0% from 17.6% in fiscal 2014. The decrease in operating margin was primarily due to an increase in operating expenses as a percentage of net revenue driven by a decline in net revenue as discussed above and an increase in headcount coupled with our ongoing R&D investments. This was partially offset by an improvement in gross margin driven by a more favorable product mix in fiscal 2015.
NE operating margin increased 2.4 percentage points during fiscal 2014 to 17.6% from 15.2% in fiscal 2013. This increase was primarily due to an improvement in gross margin driven by cost efficiencies resulting from operational, supply chain and product lifecycle management improvements, and the consolidation of our contract manufacturing partners during the second half of fiscal 2013. This was partially offset by an increase in operating expenses as a percentage of revenue driven by (i) higher headcount, (ii) our ongoing R&D investments and (iii) higher commissions driven by the overall increase in NE net revenue as discussed above.
Service Enablement
SE operating margin increased 6.8 percentage points during fiscal 2015 to (10.7)% from (17.5)% in fiscal 2014. The increase in operating margin was primarily driven by an increase in net revenue and an improvement in gross margin due to a more favorable product mix, including higher software and maintenance revenue in fiscal 2015. This was partially offset by an increase in R&D expense as a percentage of net revenue as a result of ongoing investments in the development of our product portfolio.
SE operating margin decreased 15.0 percentage points during fiscal 2014 to (17.5)% from (2.5)% in fiscal 2013. The decrease in operating margin was primarily driven an increase in operating expenses driven by higher headcount and R&D investments primarily related to our strategic acquisitions in fiscal 2014.
Communications and Commercial Optical Products
CCOP operating margin decreased 0.7 percentage points during fiscal 2015 to 11.1% from 11.8% in fiscal 2014. The decrease in operating margin was primarily due to a decline in gross margin driven by an unfavorable product mix as our 3-D sensing products, which generally carry higher gross margin than our other offerings, represented a smaller portion of our net revenue in the current period.
CCOP operating margin increased 0.7 percentage points during fiscal 2014 to 11.8% from 11.1% in fiscal 2013. The increase was driven by an improvement in gross margin primarily due to a more favorable product mix and cost reductions, coupled with an overall increase in CCOP net revenue as referenced above. This was partially offset by an increase in R&D expense primarily due to higher headcount associated with our ongoing R&D investments and to lower R&D offsets from customer-funded development projects in the current period versus the prior period.
Optical Security and Performance Products
OSP operating margin increased 2.9% points during fiscal 2015 to 38.8% from 35.9% in fiscal 2014. The increase in operating margin was primarily due to an improvement in gross margin driven by an increase in revenue from our higher margin anti-counterfeiting product line, coupled with the exit from lower margin legacy products in the fourth quarter of fiscal 2014. This was partially offset by an increase in operating expenses as a percentage of net revenue driven by lower revenue as discussed above.
OSP operating margin remained relatively flat in fiscal 2014, increasing by 0.3 percentage points from fiscal 2013.
Liquidity and Capital Resources
Our cash investments are made in accordance with an investment policy approved by the Audit Committee of our Board of Directors. In general, our investment policy requires that securities purchased be rated A-1/P-1, A/A2 or better. Our policy allows an allocation to securities rated A-2/P-2, BBB/Baa2 or better, so long as such allocation below A-1/P-1, A/A2 but minimum A-2/P-2, BBB/Baa2 does not exceed 10% of any investment portfolio. Securities that are downgraded subsequent to purchase are evaluated and may be sold or held at management’s discretion. No security may have an effective maturity that exceeds 37 months, and the average duration of our holdings may not exceed 18 months. At any time, no more than 5.0% or $5.0 million, whichever is greater, of each of our investment portfolios may be concentrated in a single issuer other than the U.S. or sovereign governments or agencies. Our investments in debt securities and marketable equity securities are primarily classified as available-for-sale investments or trading assets and are recorded at fair value. The cost of securities sold is based on the specific identification method. Unrealized gains and losses on available-for-sale investments are recorded as other comprehensive (loss) income and are reported as a separate component of stockholders’ equity. We did not hold any investments in auction rate securities, mortgage backed securities, collateralized debt obligations, or variable rate demand notes at June 27, 2015 and virtually all debt securities held were of investment grade (at least BBB-/Baa3). As of June 27, 2015, U.S. entities owned approximately 76.2% of our cash and cash equivalents, short-term investments and restricted cash.
As of June 27, 2015, the majority of our cash investments have maturities of 90 days or less and are of high credit quality. Although we intend to hold these investments to maturity, in the event that we are required to sell any of these securities under adverse market conditions, losses could be recognized on such sales. During the year ended June 27, 2015, we have not realized material investment losses but can provide no assurance that the value or the liquidity of our investments will not be impacted by adverse conditions in the financial markets. In addition, we maintain cash balances in operating accounts that are with third party financial institutions. These balances in the U.S. may exceed the Federal Deposit Insurance Corporation (“FDIC”) insurance limits. While we monitor the cash balances in our operating accounts and adjust the cash balances as appropriate, these cash balances could be impacted if the underlying financial institutions fail.
Year Ended June 27, 2015
As of June 27, 2015 our combined balance of cash and cash equivalents, short-term investments and restricted cash decreased by $41.9 million to $839.4 million from $881.3 million as of June 28, 2014.
Cash provided by operating activities was $82.3 million, primarily resulting from $155.4 million of net income adjusted for both non-cash charges (e.g., depreciation, amortization and stock-based compensation) and changes in our deferred tax and other tax liabilities balances which are non-cash in nature, partially offset by changes in operating assets and liabilities that used $73.1 million. Our cash provided by operating activities was also impacted by our separation related activities including our restructuring events. Changes in our operating assets and liabilities related primarily to a decrease in accrued payroll and related expenses of $32.4 million due to timing of salary and bonus payments, an increase in accounts receivable of $12.5 million primarily due to collections timing, a decrease in accounts payable of $10.1 million due to higher payment activity and a decrease in accrued expenses and other current and non-current liabilities of $6.8 million.
Cash used in investing activities was $5.8 million, primarily resulting from $562.7 million of purchases of available-for-sale investments and $101.5 million of cash used for capital expenditures, partially offset by $652.4 million of proceeds from the sales and maturities of available-for-sale investments and other assets and a $6.0 million decrease in restricted cash.
Cash used in financing activities was $7.3 million, primarily resulting from holdback payments of $22.2 million related to our acquisitions in fiscal 2014 and $4.8 million of cash used to repurchase our common stock, partially offset by $20.8 million of proceeds from the exercise of stock options and the issuance of common stock under our employee stock purchase plan.
Year Ended June 28, 2014
As of June 28, 2014 our combined balance of cash and cash equivalents, short-term investments and restricted cash increased by $365.4 million, or 70.8%, to $881.3 million from $515.9 million as of June 29, 2013. The increase in the combined balance was primarily driven by $650.0 million of cash received from the issuance of the 2033 Notes and $176.6 million of cash provided by operations, partially offset by (i) $216.0 million of cash used for the acquisitions of Network Instruments, Time-Bandwidth and Trendium, (ii) $155.2 million of cash used to repurchase our common stock and (iii) $99.8 million of cash used for capital expenditures.
Cash provided by operating activities was $176.6 million, primarily resulting from $175.9 million of net income adjusted for both non-cash charges (e.g., depreciation, amortization and stock-based compensation) and changes in our deferred tax balances which are non-cash in nature, partially offset by changes in operating assets and liabilities of $0.7 million. Changes in our operating assets and liabilities related primarily to a $25.9 million increase in accounts payable due to timing and slightly slower payment activity in the fourth quarter of fiscal 2014 as compared to the same period in the prior year, partially offset by a $19.6 million decrease in accrued payroll and related expenses due to the lower commissions and variable incentive pay, and a $9.6 million increase in accounts receivable due to a year-over-year increase in revenue.
Cash used in investing activities was $651.8 million, primarily resulting from (i) $1,072.9 million of purchases of available-for-sale investments, (ii) $216.0 million of cash used for the acquisitions of Network Instruments, Time-Bandwidth and Trendium, (iii) and $99.8 million of cash used for capital expenditures, partially offset by $730.0 million of maturities and sales of available-for-sale investments, and $9.2 million of net proceeds from the sale of assets.
Cash provided by financing activities was $489.6 million, primarily resulting from $650.0 million of cash received from our issuance of the 2033 Notes, $22.5 million of cash received from the exercise of stock options and the issuance of common stock under our employee stock purchase plan, partially offset $155.2 million of cash used to repurchase our common stock, $14.2 million to pay financing obligations, and $13.5 million of cash used for the payment of issuance costs for the 2033 Notes.
Year Ended June 29, 2013
We had a combined balance of cash and cash equivalents, short-term investments and restricted cash of $515.9 million at June 29, 2013, a decrease of $236.8 million from June 30, 2012. Cash and cash equivalents decreased by $120.1 million in the twelve months ended June 29, 2013, primarily due to $306.8 million used to repurchase our 1% Senior Convertible Notes, $83.2 million used for the acquisitions of business, and $65.1 million used for the purchase of property, plant and equipment, offset by net cash inflows of $110.0 million provided by the maturities, sales and purchases of investments, and cash provided by operating activities of $187.8 million.
Cash provided by operating activities was $187.8 million, resulting from our net income adjusted for non-cash items such as depreciation, amortization and stock-based compensation of $279.4 million offset by changes in operating assets and liabilities that used $91.6 million. Changes in operating assets and liabilities related primarily to an increase in net deferred taxes of $119.5 million, due to a $107.9 million non-cash release of deferred tax valuation allowances in a non-U.S. jurisdiction, a decrease in accounts payable of $16.1 million primarily due to an increase in payments prior to year end enabled by stronger operating cash flows in fiscal 2013, and a decrease in accrued payroll and related expenses of $9.4 million, offset by a decrease in accounts receivable of $39.2 million primarily driven by our collection efforts and a decrease in inventory of $27.2 million primarily due to an increase in shipments and further leveraging our contract manufacturing supply chain management.
Cash used in investing activities was $25.0 million, primarily related to cash used for the acquisitions of GenComm and Arieso of $83.2 million, and cash used for the purchase of property, plant and equipment of $65.1 million offset by net cash inflows provided by the maturities, sales and purchases of investments of $110.0 million, and net proceeds from sale of the Hologram Business of $11.2 million. Investments made during the twelve months ended June 29, 2013 included new technology, laboratory and manufacturing equipment, the set up and improvements to facilities, and upgrading information technology systems.
Cash used in financing activities was $283.8 million, primarily related to the repurchase of our 2026 Notes in the amount of $306.8 million, offset by proceeds from the exercise of stock options and the issuance of common stock under our employee stock purchase plan of $25.7 million.
Contractual Obligations
The following summarizes our contractual obligations at June 27, 2015, and the effect such obligations are expected to have on our liquidity and cash flow over the next five years (in millions):
|
|
|
Payments due by period |
| |||||||||||||
|
|
|
Total |
|
Less than |
|
1 - 3 years |
|
3 - 5 years |
|
More |
| |||||
|
Contractual Obligations |
|
|
|
|
|
|
|
|
|
|
| |||||
|
Asset retirement obligations—expected cash payments |
|
$ |
6.5 |
|
$ |
2.0 |
|
$ |
1.2 |
|
$ |
1.2 |
|
$ |
2.1 |
|
|
Long-term debt: |
|
|
|
|
|
|
|
|
|
|
| |||||
|
2033 Notes |
|
650.0 |
|
— |
|
— |
|
650.0 |
|
— |
| |||||
|
Estimated interest payments |
|
12.7 |
|
4.1 |
|
8.1 |
|
0.5 |
|
— |
| |||||
|
Purchase obligations (1) |
|
150.9 |
|
145.9 |
|
4.9 |
|
0.1 |
|
— |
| |||||
|
Operating lease obligations (1) |
|
95.8 |
|
23.1 |
|
39.4 |
|
20.9 |
|
12.4 |
| |||||
|
Pension and post-retirement benefit payments (2) |
|
94.1 |
|
5.9 |
|
12.4 |
|
12.2 |
|
63.6 |
| |||||
|
Total (3) |
|
$ |
1,010.0 |
|
$ |
181.0 |
|
$ |
66.0 |
|
$ |
684.9 |
|
$ |
78.1 |
|
(1) Refer to “Note 16. Commitments and Contingencies” for more information.
(2) Refer to “Note 15. Employee Pension and Other Benefit Plans” for more information.
(3) The contractual obligations above do not reflect the separation of the Lumentum business from Viavi on August 1, 2015. We anticipate our total contractual obligations will decrease significantly on a going-forward basis. Of our total purchase obligations and operating lease obligations as of June 27, 2015, approximately $90 million and $30 million, respectively, related to Lumentum.
As of June 27, 2015, we have accrued on our Consolidated Balance Sheets $8.2 million in connection with restructuring and related activities relating to our operating lease obligations disclosed above, of which $2.3 million was included in Other current liabilities and $5.9 million was included in Other non-current liabilities.
Purchase obligations represent legally-binding commitments to purchase inventory and other commitments made in the normal course of business to meet operational requirements. Of the $150.9 million of purchase obligations as of June 27, 2015, $59.7 million are related to inventory and the other $91.2 million are non-inventory items.
As of June 27, 2015, our other non-current liabilities primarily relate to asset retirement obligations, pension and financing obligations which are presented in various lines in the preceding table.
Off-Balance Sheet Arrangements
We do not have any off-balance sheet arrangements, as such term is defined in rules promulgated by the SEC, that have or are reasonably likely to have a current or future effect on our financial condition, changes in financial condition, revenues or expenses, results of operations, liquidity, capital expenditures or capital resources that are material to investors.
Acquisitions
As part of our strategy, we are committed to the on-going evaluation of strategic opportunities and, where appropriate, the acquisition of additional products, technologies or businesses that are complementary to, or broaden the markets for our products. We believe we strengthened our business model by expanding our addressable market, customer base, and expertise, diversifying our product portfolio, and fortifying our core businesses through acquisition as well as through organic initiatives.
In January 2014, we completed the acquisition of Network Instruments, a privately-held U.S. company and leading developer of enterprise network and application-performance management solutions for global 2000 companies. The acquisition further strengthens our position as a key solutions provider to the enterprise, data center and cloud networking markets. In order to improve application performance, reduce costs and address increasing network complexity, enterprise network administrators are rapidly transforming their IT networks while embracing today’s most critical technology initiatives such as unified communications, cloud, and data center consolidation. Network Instruments helps enterprises simplify the management and optimization of their networks with high-performance solutions that provide actionable intelligence and deep network visibility. We acquired all outstanding shares of Network Instruments for a total purchase price of approximately $208.5 million in cash, including holdback payments of approximately $19.7 million, net of working capital adjustments. Network Instruments was integrated into our SE segment.
Also in January 2014, we completed the acquisition of Time-Bandwidth, a privately-held provider of high powered and ultrafast lasers for industrial and scientific markets. Use of ultrafast lasers for micromachining applications is being driven primarily by increasing use of consumer electronics and connected devices globally. Manufacturers are taking advantage of high-power and ultrafast lasers to create quality micro parts for consumer electronics and to process semiconductor chips for consumer devices. Time-Bandwidth’s technology complements our current laser portfolio, while enabling Time-Bandwidth to leverage our high volume and low-cost manufacturing model, global sales team and channel relationships. We acquired all outstanding shares of Time-Bandwidth for a total purchase price of $15.0 million in cash, including a holdback payment of approximately $2.3 million. Time-Bandwidth was integrated into our CCOP segment.
In December 2013, we acquired certain technology and other assets from Trendium, a privately-held provider of real-time intelligence software solutions for CEA, asset optimization and monetization of big data for 4G/LTE mobile network operators. The addition of Trendium employees and technology enables the Company to introduce a new paradigm of CEA, enabling operators of 4G/LTE networks to achieve a real and relevant improvement in customer satisfaction while maximizing productivity and profitability for dynamic converged 4G/LTE networks and beyond. We acquired certain technology and other assets from Trendium for a total purchase price of $26.1 million in cash, including a holdback payment of approximately $2.5 million. The purchased assets are included in our SE segment.
In March 2013, we completed the acquisition of Arieso based in the United Kingdom. We acquired tangible and intangible assets and assumed liabilities of Arieso for a total purchase price of approximately $89.7 million in cash, including holdback payments of approximately $12.8 million. Arieso was integrated into our SE segment.
In August 2012, we completed the acquisition of GenComm based in Seoul, South Korea. We acquired tangible and intangible assets and assumed liabilities of GenComm for a total purchase price of approximately $15.2 million in cash, including holdback payments of approximately $3.8 million. GenComm was integrated into our NE segment.
Please refer to “Note 5. Mergers and Acquisitions” of our Notes to Consolidated Financial Statements.
Employee Equity Incentive Plan
Our stock option and Full Value Award program is a broad-based, long-term retention program that is intended to attract and retain employees and align stockholder and employee interests. As of June 27, 2015, we have available for issuance 10.8 million shares of common stock for grant primarily under our Amended and Restated 2003 Equity Incentive Plan (the “2003 Plan”) and 2005 Acquisition Equity Incentive Plan (the “2005 Plan”). The exercise price for the options is equal to the fair market value of the underlying stock at the date of grant. Options generally become exercisable over a three-year or four-year period and, if not exercised, expire from five to ten years post grant date. Full Value Awards are performance-based, time-based, or a combination of both and are expected to vest over one to four years. The fair value of the time-based Full Value Awards is based on the closing market price of our common stock on the grant date of the award. Refer to “Note 14. Stock-Based Compensation” for more information.
Pension and Other Post-retirement Benefits
As a result of acquiring Acterna, Inc. (“Acterna”) in August 2005, Network Solutions Division of Agilent Technologies Inc. (“NSD”) in May 2010, and Time-Bandwidth in January 2014, we sponsor significant pension plans for certain past and present employees in the United Kingdom (“U.K.”), Germany and Switzerland. We are also responsible for the non-pension post-retirement benefit obligation assumed from a past acquisition. Most of these plans have been closed to new participants and no additional service costs are being accrued, except for certain plans in Germany and Switzerland assumed in connection with acquisitions during fiscal 2010 and the third quarter of fiscal 2014. The U.K. plan and Switzerland plan are partially funded and the German plans, which were initially established as “pay-as-you-go” plans, are unfunded. As of June 27, 2015, our pension plans were under funded by $93.1 million since the PBO exceeded the fair value of its plan assets. Similarly, we had a liability of $1.0 million related to our non-pension post-retirement benefit plan.
We anticipate future annual outlays related to the German plans will approximate estimated future benefit payments. These future benefit payments have been estimated based on the same actuarial assumptions used to measure our projected benefit obligation and currently are forecasted to range between $4.5 million and $5.0 million per annum. In addition, we expect to contribute approximately $1.1 million and $0.3 million to the U.K. and Switzerland plans during fiscal 2016.
During fiscal 2015 we contributed GBP 0.7 million, or approximately $1.1 million, while in fiscal 2014, we contributed GBP 0.5 million or approximately $0.7 million to our U.K. pension plan. These contributions allowed the Company to comply with regulatory funding requirements.
A key actuarial assumption in calculating the net periodic cost and the PBO is the discount rate. Changes in the discount rate impact the interest cost component of the net periodic benefit cost calculation and PBO due to the fact that the PBO is calculated on a net present value basis. Decreases in the discount rate will generally increase pre-tax cost, recognized expense and the PBO. Increases in the discount rate tend to have the opposite effect. We estimate a 50 basis point (“BPS”) decrease or increase in the discount rate would cause a corresponding increase or decrease, respectively, in the PBO of approximately $8.9 million based upon data as of June 27, 2015.
Liquidity and Capital Resources Requirement
We believe that our existing cash balances and investments will be sufficient to meet our liquidity and capital spending requirements over the next twelve months. However, there are a number of factors that could positively or negatively impact our liquidity position, including:
· global economic conditions which affect demand for our products and services and impact the financial stability of our suppliers and customers;
· changes in accounts receivable, inventory or other operating assets and liabilities which affect our working capital;
· increase in capital expenditure to support the revenue growth opportunity of our business;
· the tendency of customers to delay payments or to negotiate favorable payment term to manage their own liquidity positions;
· timing of payments to our suppliers;
· factoring or sale of accounts receivable;
· volatility in fixed income and credit market which impact the liquidity and valuation of our investment portfolios;
· volatility in foreign exchange market which impacts our financial results;
· possible investments or acquisitions of complementary businesses, products or technologies;
· issuance or repurchase of debt or equity securities;
· potential funding of pension liabilities either voluntarily or as required by law or regulation;
· compliance with covenants and other terms and conditions related to our financing arrangements;
· higher than expected costs associated with separating the company into two public companies; and
· contribution of cash to Lumentum so that as of the separation date Lumentum has total cash of $137.6 million, subject to the requirements set forth in the contribution agreement.
ITEM 7A. QUANTITATIVE AND QUALITATIVE DISCLOSURES ABOUT MARKET RISK
Foreign Exchange Risk
We utilize foreign exchange forward contracts and other instruments, including option contracts, to hedge foreign currency risk associated with foreign currency denominated monetary assets and liabilities, primarily certain short-term intercompany receivables and payables. Our foreign exchange forward contracts and other instruments are accounted for as derivatives whereby the fair value of the contracts are reflected as other current assets or other current liabilities and the associated gains and losses are reflected in Interest and other income (expense), net in the Consolidated Statements of Operations. Our hedging programs reduce, but do not eliminate, the impact of currency exchange rate movements. The gains and losses on those derivatives are expected to be offset by re-measurement gains and losses on the foreign currency denominated monetary assets and liabilities.
The following table provides information about our foreign currency forward contracts outstanding as of June 27, 2015. The forward contracts, most with a term of less than 120 days, were transacted near quarter end; therefore, the fair value of the contracts is not significant.
|
(in millions) |
|
Contract Amount |
|
|
Contract |
| ||
|
Canadian Dollar (contracts to buy CAD / sell USD) |
|
CAD |
131.0 |
|
|
$ |
105.7 |
|
|
Chinese Renmimbi (contracts to buy CNY / sell USD) |
|
CNY |
148.2 |
|
|
23.8 |
| |
|
British Pound (contracts to buy GBP / sell USD) |
|
GBP |
8.1 |
|
|
12.8 |
| |
|
Euro (contracts to buy EUR / sell USD) |
|
EUR |
84.7 |
|
|
94.8 |
| |
|
Singapore Dollar (contracts to sell SGD / buy USD) |
|
SGD |
43.7 |
|
|
32.5 |
| |
|
Mexican Peso (contracts to buy MXN / sell USD) |
|
MXN |
112.7 |
|
|
7.3 |
| |
|
Australian Dollar (contracts to sell AUD / buy USD) |
|
AUD |
8.9 |
|
|
6.8 |
| |
|
Brazilian Real (contracts to sell BRL / buy USD) |
|
BRL |
70.2 |
|
|
22.5 |
| |
|
Japanese Yen (contracts to buy JPY / sell USD) |
|
JPY |
744.6 |
|
|
6.0 |
| |
|
Indian Rupee (contracts to sell INR / buy USD) |
|
INR |
228.8 |
|
|
3.6 |
| |
|
South Korean Won (contracts to buy KRW / sell USD) |
|
KRW |
2,940.6 |
|
|
2.7 |
| |
|
Malaysian Ringgit (contracts to buy MYR / sell USD) |
|
MYR |
3.2 |
|
|
0.9 |
| |
|
Swiss Franc (contracts to buy CHF / sell USD) |
|
CHF |
2.7 |
|
|
2.9 |
| |
|
Swedish Krona (contracts to buy SEK / sell USD) |
|
SEK |
20.2 |
|
|
2.4 |
| |
|
Total USD notional amount of outstanding foreign exchange contracts |
|
|
|
|
$ |
324.7 |
| |
The counterparties to these hedging transactions are creditworthy multinational banks. The risk of counterparty nonperformance associated with these contracts is not considered to be material. Notwithstanding our efforts to mitigate some foreign exchange risks, we do not hedge all of our foreign currency exposures, and there can be no assurances that our mitigating activities related to the exposures that we do hedge will adequately protect us against the risks associated with foreign currency fluctuations.
Investments
We maintain an investment portfolio in a variety of financial instruments, including, but not limited to, U.S. government and agency securities, corporate obligations, money market funds, asset-backed securities, and other investment-grade securities. The majority of these investments pay a fixed rate of interest. The securities in the investment portfolio are subject to market price risk due to changes in interest rates, perceived issuer creditworthiness, marketability, and other factors. These investments are generally classified as available-for-sale and, consequently, are recorded on our Consolidated Balance Sheets at fair value with unrealized gains or losses reported as a separate component of Other comprehensive (loss) income.
Investments in both fixed-rate and floating-rate interest earning instruments carry a degree of interest rate risk. The fair market values of our fixed-rate securities decline if interest rates rise, while floating-rate securities may produce less income than expected if interest rates fall. Due in part to these factors, our future investment income may be less than expectations because of changes in interest rates or we may suffer losses in principal if we sell securities that have experienced a decline in market value because of changes in interest rates. As of June 27, 2015, a hypothetical 100 basis point increase or decrease in interest rates would not result in
a material change in the fair value of our available-for-sale debt instruments held that are sensitive to changes in interest rates, which includes U.S. treasuries, U.S. agencies, municipals, asset-backed securities and corporate securities.
We seek to mitigate the credit risk of our portfolio of fixed-income securities by holding only high-quality, investment-grade obligations with effective maturities of 36 months or less. We also seek to mitigate marketability risk by holding only highly liquid securities with active secondary or resale markets. However, the investments may decline in value or marketability due to changes in perceived credit quality or changes in market conditions.
Debt
The fair market value of our 2033 Notes is subject to interest rate and market price risk due to the convertible feature of the notes and other factors. Generally, the fair market value of fixed interest rate debt will increase as interest rates fall and decrease as interest rates rise. The fair market value of the notes may also increase as the market price of Viavi stock rises and decrease as the market price of our stock falls. Changes in interest rates and Viavi stock price affect the fair market value of the notes but does not impact our financial position, cash flows or results of operations. Based on quoted market prices, as of June 27, 2015, the fair market value of the 2033 Notes was approximately $644.0 million. Refer to “Note 10. Debts and Letters of Credit” for more information.
ITEM 8. FINANCIAL STATEMENTS AND SUPPLEMENTARY DATA
REPORT OF INDEPENDENT REGISTERED PUBLIC ACCOUNTING FIRM
To the Board of Directors and Stockholders of Viavi Solutions Inc.
In our opinion, the accompanying consolidated balance sheets and the related consolidated statements of operations, of comprehensive (loss) income, of stockholders’ equity and of cash flows present fairly, in all material respects, the financial position of Viavi Solutions Inc. and its subsidiaries at June 27, 2015 and June 28, 2014, and the results of their operations and their cash flows for each of the three years in the period ended June 27, 2015 in conformity with accounting principles generally accepted in the United States of America. In addition, in our opinion, the financial statement schedule listed in the index appearing under Item 15 (a)(2) presents fairly, in all material respects, the information set forth therein when read in conjunction with the related consolidated financial statements. Also in our opinion, the Company maintained, in all material respects, effective internal control over financial reporting as of June 27, 2015, based on criteria established in Internal Control - Integrated Framework (2013) issued by the Committee of Sponsoring Organizations of the Treadway Commission (COSO). The Company’s management is responsible for these financial statements and financial statement schedule, for maintaining effective internal control over financial reporting and for its assessment of the effectiveness of internal control over financial reporting, included in Management’s Report on Internal Control over Financial Reporting appearing under item 9A. Our responsibility is to express opinions on these financial statements, on the financial statement schedule, and on the Company’s internal control over financial reporting based on our integrated audits. We conducted our audits in accordance with the standards of the Public Company Accounting Oversight Board (United States). Those standards require that we plan and perform the audits to obtain reasonable assurance about whether the financial statements are free of material misstatement and whether effective internal control over financial reporting was maintained in all material respects. Our audits of the financial statements included examining, on a test basis, evidence supporting the amounts and disclosures in the financial statements, assessing the accounting principles used and significant estimates made by management, and evaluating the overall financial statement presentation. Our audit of internal control over financial reporting included obtaining an understanding of internal control over financial reporting, assessing the risk that a material weakness exists, and testing and evaluating the design and operating effectiveness of internal control based on the assessed risk. Our audits also included performing such other procedures as we considered necessary in the circumstances. We believe that our audits provide a reasonable basis for our opinions.
A company’s internal control over financial reporting is a process designed to provide reasonable assurance regarding the reliability of financial reporting and the preparation of financial statements for external purposes in accordance with generally accepted accounting principles. A company’s internal control over financial reporting includes those policies and procedures that (i) pertain to the maintenance of records that, in reasonable detail, accurately and fairly reflect the transactions and dispositions of the assets of the company; (ii) provide reasonable assurance that transactions are recorded as necessary to permit preparation of financial statements in accordance with generally accepted accounting principles, and that receipts and expenditures of the company are being made only in accordance with authorizations of management and directors of the company; and (iii) provide reasonable assurance regarding prevention or timely detection of unauthorized acquisition, use, or disposition of the company’s assets that could have a material effect on the financial statements.
Because of its inherent limitations, internal control over financial reporting may not prevent or detect misstatements. Also, projections of any evaluation of effectiveness to future periods are subject to the risk that controls may become inadequate because of changes in conditions, or that the degree of compliance with the policies or procedures may deteriorate.
/s/ PRICEWATERHOUSECOOPERS LLP
San Jose, California
August 25, 2015
VIAVI SOLUTIONS INC.
CONSOLIDATED STATEMENTS OF OPERATIONS
(in millions, except per share data)
|
|
|
Years Ended |
| |||||||
|
|
|
June 27, 2015 |
|
June 28, 2014 |
|
June 29, 2013 |
| |||
|
Net revenue |
|
$ |
1,709.1 |
|
$ |
1,743.2 |
|
$ |
1,676.9 |
|
|
Cost of sales |
|
891.0 |
|
915.7 |
|
919.0 |
| |||
|
Amortization of acquired technologies |
|
39.4 |
|
43.2 |
|
63.3 |
| |||
|
Gross profit |
|
778.7 |
|
784.3 |
|
694.6 |
| |||
|
Operating expenses: |
|
|
|
|
|
|
| |||
|
Research and development |
|
313.2 |
|
296.0 |
|
258.5 |
| |||
|
Selling, general and administrative |
|
463.5 |
|
450.4 |
|
429.3 |
| |||
|
Amortization of other intangibles |
|
19.8 |
|
15.8 |
|
12.7 |
| |||
|
Restructuring and related charges |
|
34.5 |
|
23.8 |
|
19.0 |
| |||
|
Total operating expenses |
|
831.0 |
|
786.0 |
|
719.5 |
| |||
|
Loss from operations |
|
(52.3 |
) |
(1.7 |
) |
(24.9 |
) | |||
|
Interest and other income (expense), net |
|
3.4 |
|
0.5 |
|
(4.1 |
) | |||
|
Interest expense |
|
(34.0 |
) |
(29.7 |
) |
(17.9 |
) | |||
|
Loss from continuing operations before income taxes |
|
(82.9 |
) |
(30.9 |
) |
(46.9 |
) | |||
|
Provision for (benefit from) income taxes |
|
5.2 |
|
(13.1 |
) |
(103.9 |
) | |||
|
Net (loss) income from continuing operations, net of tax |
|
$ |
(88.1 |
) |
$ |
(17.8 |
) |
$ |
57.0 |
|
|
Net (loss) income from discontinued operations, net of tax |
|
— |
|
— |
|
— |
| |||
|
Net (loss) income |
|
$ |
(88.1 |
) |
$ |
(17.8 |
) |
$ |
57.0 |
|
|
|
|
|
|
|
|
|
| |||
|
Basic net (loss) income per share from: |
|
|
|
|
|
|
| |||
|
Continuing operations |
|
$ |
(0.38 |
) |
$ |
(0.08 |
) |
$ |
0.24 |
|
|
Discontinued operations |
|
— |
|
— |
|
— |
| |||
|
Net (loss) income |
|
$ |
(0.38 |
) |
$ |
(0.08 |
) |
$ |
0.24 |
|
|
|
|
|
|
|
|
|
| |||
|
Diluted net (loss) income per share from: |
|
|
|
|
|
|
| |||
|
Continuing operations |
|
$ |
(0.38 |
) |
$ |
(0.08 |
) |
$ |
0.24 |
|
|
Discontinued operations |
|
— |
|
— |
|
— |
| |||
|
Net (loss) income |
|
$ |
(0.38 |
) |
$ |
(0.08 |
) |
$ |
0.24 |
|
|
|
|
|
|
|
|
|
| |||
|
Shares used in per share calculation: |
|
|
|
|
|
|
| |||
|
Basic |
|
232.7 |
|
234.2 |
|
235.0 |
| |||
|
Diluted |
|
232.7 |
|
234.2 |
|
239.3 |
| |||
See accompanying notes to consolidated financial statements.
VIAVI SOLUTIONS INC.
CONSOLIDATED STATEMENTS OF COMPREHENSIVE (LOSS) INCOME
(in millions)
|
|
|
Years Ended |
| |||||||
|
|
|
June 27, 2015 |
|
June 28, 2014 |
|
June 29, 2013 |
| |||
|
Net (loss) income |
|
$ |
(88.1 |
) |
$ |
(17.8 |
) |
$ |
57.0 |
|
|
Other comprehensive income (loss): |
|
|
|
|
|
|
| |||
|
Net change in cumulative translation adjustment, net of tax |
|
(55.4 |
) |
9.8 |
|
5.8 |
| |||
|
Net change in available-for-sale investments, net of tax: |
|
|
|
|
|
|
| |||
|
Unrealized holding (losses) gains arising during period |
|
(0.4 |
) |
0.4 |
|
0.2 |
| |||
|
Less: reclassification adjustments included in Net (loss) income |
|
— |
|
(0.1 |
) |
(0.5 |
) | |||
|
Net change in defined benefit obligation, net of tax: |
|
|
|
|
|
|
| |||
|
Unrealized actuarial losses arising during period |
|
(3.7 |
) |
(7.7 |
) |
(4.4 |
) | |||
|
Amortization of actuarial losses |
|
0.4 |
|
0.1 |
|
— |
| |||
|
Net change in Accumulated other comprehensive (loss) income |
|
$ |
(59.1 |
) |
2.5 |
|
1.1 |
| ||
|
Comprehensive (loss) income |
|
$ |
(147.2 |
) |
$ |
(15.3 |
) |
$ |
58.1 |
|
See accompanying notes to consolidated financial statements.
VIAVI SOLUTIONS INC.
(in millions, except share and par value data)
|
|
|
June 27, 2015 |
|
June 28, 2014 |
| ||
|
ASSETS |
|
|
|
|
| ||
|
Current assets: |
|
|
|
|
| ||
|
Cash and cash equivalents |
|
$ |
347.9 |
|
$ |
297.2 |
|
|
Short-term investments |
|
465.3 |
|
552.2 |
| ||
|
Restricted cash |
|
26.2 |
|
31.9 |
| ||
|
Accounts receivable, net (Note 6) |
|
302.5 |
|
296.2 |
| ||
|
Inventories, net |
|
153.8 |
|
153.3 |
| ||
|
Prepayments and other current assets |
|
84.4 |
|
78.7 |
| ||
|
Total current assets |
|
1,380.1 |
|
1,409.5 |
| ||
|
Property, plant and equipment, net |
|
294.6 |
|
288.8 |
| ||
|
Goodwill |
|
261.1 |
|
267.0 |
| ||
|
Intangibles, net |
|
112.4 |
|
177.8 |
| ||
|
Deferred income taxes |
|
147.6 |
|
183.3 |
| ||
|
Other non-current assets |
|
22.0 |
|
25.5 |
| ||
|
Total assets |
|
$ |
2,217.8 |
|
2,351.9 |
| |
|
LIABILITIES AND STOCKHOLDERS’ EQUITY |
|
|
|
|
| ||
|
Current liabilities: |
|
|
|
|
| ||
|
Accounts payable |
|
$ |
121.1 |
|
$ |
137.1 |
|
|
Accrued payroll and related expenses |
|
70.9 |
|
79.9 |
| ||
|
Income taxes payable |
|
6.8 |
|
21.4 |
| ||
|
Deferred revenue |
|
81.2 |
|
77.5 |
| ||
|
Accrued expenses |
|
41.2 |
|
34.8 |
| ||
|
Other current liabilities |
|
54.3 |
|
57.7 |
| ||
|
Total current liabilities |
|
375.5 |
|
408.4 |
| ||
|
Long-term debt |
|
561.6 |
|
536.3 |
| ||
|
Other non-current liabilities |
|
179.3 |
|
219.5 |
| ||
|
Commitments and contingencies (Note 16) |
|
|
|
|
| ||
|
Stockholders’ equity: |
|
|
|
|
| ||
|
Preferred Stock, $0.001 par value; 1 million shares authorized; 1 share at June 27, 2015 and June 28, 2014, issued and outstanding |
|
— |
|
— |
| ||
|
Common Stock, $0.001 par value; 1 billion shares authorized; 235 million shares at June 27, 2015 and 230 million shares at June 28, 2014, issued and outstanding |
|
0.2 |
|
0.2 |
| ||
|
Additional paid-in capital |
|
70,022.7 |
|
69,957.0 |
| ||
|
Accumulated deficit |
|
(68,873.5 |
) |
(68,780.6 |
) | ||
|
Accumulated other comprehensive (loss) income |
|
(48.0 |
) |
11.1 |
| ||
|
Total stockholders’ equity |
|
1,101.4 |
|
1,187.7 |
| ||
|
Total liabilities and stockholders’ equity |
|
$ |
2,217.8 |
|
$ |
2,351.9 |
|
See accompanying notes to consolidated financial statements.
VIAVI SOLUTIONS INC.
CONSOLIDATED STATEMENTS OF CASH FLOWS
(in millions)
|
|
|
Years Ended |
| |||||||
|
|
|
June 27, 2015 |
|
June 28, 2014 |
|
June 29, 2013 |
| |||
|
OPERATING ACTIVITIES: |
|
|
|
|
|
|
| |||
|
Net (loss) income |
|
$ |
(88.1 |
) |
$ |
(17.8 |
) |
$ |
57.0 |
|
|
Adjustments to reconcile net (loss) income to net cash provided by operating activities: |
|
|
|
|
|
|
| |||
|
Depreciation expense |
|
80.8 |
|
72.5 |
|
68.4 |
| |||
|
Amortization of acquired technologies and other intangibles |
|
59.2 |
|
59.0 |
|
76.2 |
| |||
|
Stock-based compensation |
|
66.9 |
|
64.1 |
|
56.5 |
| |||
|
Amortization of debt issuance costs and accretion of debt discount |
|
27.3 |
|
22.9 |
|
12.9 |
| |||
|
Amortization of discount and premium on investments, net |
|
3.2 |
|
4.2 |
|
4.1 |
| |||
|
Other |
|
8.1 |
|
4.1 |
|
4.3 |
| |||
|
Changes in operating assets and liabilities, net of impact of acquisitions of businesses: |
|
|
|
|
|
|
| |||
|
Accounts receivable |
|
(12.5 |
) |
(9.6 |
) |
39.2 |
| |||
|
Inventories |
|
(6.0 |
) |
(3.2 |
) |
27.2 |
| |||
|
Other current and non-currents assets |
|
(9.0 |
) |
5.4 |
|
(15.3 |
) | |||
|
Accounts payable |
|
(10.1 |
) |
25.9 |
|
(16.1 |
) | |||
|
Income taxes payable |
|
(21.3 |
) |
1.3 |
|
0.1 |
| |||
|
Deferred revenue, current and non-current |
|
3.2 |
|
2.7 |
|
1.1 |
| |||
|
Deferred taxes, net |
|
19.8 |
|
(33.1 |
) |
(119.5 |
) | |||
|
Accrued payroll and related expenses |
|
(32.4 |
) |
(19.6 |
) |
(9.4 |
) | |||
|
Accrued expenses and other current and non-current liabilities |
|
(6.8 |
) |
(2.2 |
) |
1.1 |
| |||
|
Net cash provided by operating activities |
|
82.3 |
|
176.6 |
|
187.8 |
| |||
|
|
|
|
|
|
|
|
| |||
|
INVESTING ACTIVITIES: |
|
|
|
|
|
|
| |||
|
Purchases of available-for-sale investments |
|
(562.7 |
) |
(1,072.9 |
) |
(466.6 |
) | |||
|
Maturities of available-for-sale investments |
|
574.8 |
|
480.9 |
|
287.7 |
| |||
|
Sales of available-for-sale investments |
|
71.4 |
|
249.1 |
|
288.9 |
| |||
|
Changes in restricted cash |
|
6.0 |
|
(2.3 |
) |
1.6 |
| |||
|
Acquisition of businesses, net of cash acquired |
|
— |
|
(216.0 |
) |
(83.2 |
) | |||
|
Capital expenditures |
|
(101.5 |
) |
(99.8 |
) |
(65.1 |
) | |||
|
Proceeds from the sale of assets |
|
6.2 |
|
9.2 |
|
11.7 |
| |||
|
Net cash used in investing activities |
|
(5.8 |
) |
(651.8 |
) |
(25.0 |
) | |||
|
|
|
|
|
|
|
|
| |||
|
FINANCING ACTIVITIES: |
|
|
|
|
|
|
| |||
|
Proceeds from issuance of senior convertible debt |
|
— |
|
650.0 |
|
— |
| |||
|
Payment of debt issuance costs |
|
— |
|
(13.5 |
) |
(0.2 |
) | |||
|
Repurchase and retirement of common stock |
|
(4.8 |
) |
(155.2 |
) |
— |
| |||
|
Redemption of senior convertible debt |
|
— |
|
— |
|
(306.8 |
) | |||
|
Payment of financing obligations |
|
(23.3 |
) |
(14.2 |
) |
(2.5 |
) | |||
|
Proceeds from exercise of employee stock options and employee stock purchase plan |
|
20.8 |
|
22.5 |
|
25.7 |
| |||
|
Net cash (used in) provided by financing activities |
|
(7.3 |
) |
489.6 |
|
(283.8 |
) | |||
|
|
|
|
|
|
|
|
| |||
|
Effect of exchange rates on cash and cash equivalents |
|
(18.5 |
) |
1.8 |
|
0.9 |
| |||
|
Net increase (decrease) in cash and cash equivalents |
|
50.7 |
|
16.2 |
|
(120.1 |
) | |||
|
Cash and cash equivalents at beginning of period |
|
297.2 |
|
281.0 |
|
401.1 |
| |||
|
Cash and cash equivalents at end of period |
|
$ |
347.9 |
|
$ |
297.2 |
|
$ |
281.0 |
|
|
Supplemental disclosure of cash flow information |
|
|
|
|
|
|
| |||
|
Cash paid for interest |
|
$ |
6.5 |
|
$ |
4.6 |
|
$ |
4.8 |
|
|
Cash paid for taxes |
|
$ |
23.8 |
|
$ |
18.7 |
|
$ |
14.3 |
|
See accompanying notes to consolidated financial statements.
VIAVI SOLUTIONS INC.
CONSOLIDATED STATEMENTS OF STOCKHOLDERS’ EQUITY
(in millions)
|
|
|
Common Stock |
|
Additional |
|
Accumulated |
|
Accumulated |
|
|
| |||||||
|
|
|
Shares |
|
Amount |
|
Capital |
|
Deficit |
|
Income |
|
Total |
| |||||
|
Balance at June 30, 2012 |
|
231.9 |
|
$ |
0.2 |
|
$ |
69,695.7 |
|
$ |
(68,664.6 |
) |
$ |
7.5 |
|
$ |
1,038.8 |
|
|
Net income |
|
— |
|
— |
|
— |
|
57.0 |
|
— |
|
57.0 |
| |||||
|
Comprehensive income |
|
— |
|
— |
|
— |
|
— |
|
1.1 |
|
1.1 |
| |||||
|
Shares issued under employee stock plans, net of tax effects |
|
5.5 |
|
— |
|
9.9 |
|
— |
|
— |
|
9.9 |
| |||||
|
Stock-based compensation |
|
— |
|
— |
|
56.5 |
|
— |
|
— |
|
56.5 |
| |||||
|
Reacquisition of equity component related to convertible debt repurchase |
|
— |
|
— |
|
(2.0 |
) |
— |
|
— |
|
(2.0 |
) | |||||
|
Balance at June 29, 2013 |
|
237.4 |
|
$ |
0.2 |
|
$ |
69,760.1 |
|
$ |
(68,607.6 |
) |
$ |
8.6 |
|
$ |
1,161.3 |
|
|
Net loss |
|
— |
|
— |
|
— |
|
(17.8 |
) |
— |
|
(17.8 |
) | |||||
|
Comprehensive income |
|
— |
|
— |
|
— |
|
— |
|
2.5 |
|
2.5 |
| |||||
|
Shares issued under employee stock plans, net of tax effects |
|
5.3 |
|
— |
|
1.4 |
|
— |
|
— |
|
1.4 |
| |||||
|
Stock-based compensation |
|
— |
|
— |
|
64.0 |
|
— |
|
— |
|
64.0 |
| |||||
|
Repurchases of common stock |
|
(12.3 |
) |
— |
|
— |
|
(155.2 |
) |
— |
|
(155.2 |
) | |||||
|
Equity component related to issuance of senior convertible notes, net of equity component issuance costs |
|
— |
|
— |
|
131.5 |
|
— |
|
— |
|
131.5 |
| |||||
|
Balance at June 28, 2014 |
|
230.4 |
|
$ |
0.2 |
|
$ |
69,957.0 |
|
$ |
(68,780.6 |
) |
$ |
11.1 |
|
$ |
1,187.7 |
|
|
Net loss |
|
— |
|
— |
|
— |
|
(88.1 |
) |
— |
|
(88.1 |
) | |||||
|
Comprehensive loss |
|
— |
|
— |
|
— |
|
— |
|
(59.1 |
) |
(59.1 |
) | |||||
|
Shares issued under employee stock plans, net of tax effects |
|
5.3 |
|
— |
|
(1.2 |
) |
— |
|
— |
|
(1.2 |
) | |||||
|
Stock-based compensation |
|
— |
|
— |
|
66.9 |
|
— |
|
— |
|
66.9 |
| |||||
|
Repurchases of common stock |
|
(0.4 |
) |
— |
|
— |
|
(4.8 |
) |
— |
|
(4.8 |
) | |||||
|
Balance at June 27, 2015 |
|
235.3 |
|
$ |
0.2 |
|
$ |
70,022.7 |
|
$ |
(68,873.5 |
) |
$ |
(48.0 |
) |
$ |
1,101.4 |
|
See accompanying notes to consolidated financial statements.
VIAVI SOLUTIONS INC.
NOTES TO CONSOLIDATED FINANCIAL STATEMENTS
Note 1. Description of Business and Summary of Significant Accounting Policies
Description of Business
Viavi Solutions Inc. (“Viavi,” also referred to as “the Company,” “we,” “our,” and “us”), formerly JDS Uniphase Corporation (“JDSU”), is a leading provider of network and service enablement solutions and optical products for telecommunications service providers, wireless operators, cable operators, network-equipment manufacturers (“NEMs”) and enterprises. We are also an established leader in anti-counterfeiting solutions for currency authentication, and provide high-value optical components and instruments for security, safety, electronics, and other applications. In addition, we leverage our core networking and optical technology expertise to deliver high-powered commercial lasers for manufacturing applications and expand into emerging markets, including 3-D sensing solutions for consumer electronics.
On September 10, 2014, we announced plans to separate into two publicly-traded companies:
· an optical components and commercial lasers company, Lumentum Holdings Inc. (“Lumentum”), consisting of our Communications and Commercial Optical Products (“CCOP”) segment and the WaveReady product line within our Network Enablement (“NE”) segment; and
· a network and service enablement and optical coatings company, renamed Viavi, consisting of our NE, Service Enablement (“SE”) and Optical Security and Performance Products (“OSP”) segments.
On August 1, 2015, we completed the distribution of approximately 80.1% of the outstanding shares of Lumentum common stock to our stockholders. We were renamed Viavi and, at the time of the distribution, retained ownership of approximately 19.9% of Lumentum’s outstanding shares. The Company’s consolidated financial statements included in this Annual Report on Form 10-K include the Lumentum business which will be reported as a discontinued operation beginning in the first quarter of fiscal 2016.
Fiscal Years
The Company utilizes a 52-53 week fiscal year ending on the Saturday closest to June 30th. In fiscal 2015, 2014 and 2013 the Company’s fiscal years were 52-weeks ending on June 27, 2015, June 28, 2014, and June 29, 2013.
Change in Reportable Segments
During fiscal 2015 the Company reorganized its Network Service and Enablement (“NSE”) reportable segment into two separate reportable segments: Network Enablement (“NE”) and Service Enablement (“SE”). This change does not impact previously reported consolidated financial information. However, historical information related to the NSE reportable segment has been recast to reflect the new NE and SE reportable segment structure. Refer to “Note 17. Operating Segments and Geographic Information.”
Principles of Consolidation
The consolidated financial statements have been prepared in accordance with accounting principles generally accepted in the United States of America (“U.S. GAAP”) and include the Company and its wholly-owned subsidiaries. All inter-company accounts and transactions have been eliminated.
Fiscal 2013 Out-of-Period Adjustments
During the year ended June 29, 2013, the Company recorded out-of-period adjustments that impacted cost of sales and other income related to prior fiscal years. The impact of the out-of-period adjustments recorded by the Company resulted in a $2.5 million increase in net income during the year ended June 29, 2013. Management and the Audit Committee have concluded these errors, both individually and in aggregate, were not material to any prior year financial statements and the impact of correcting these errors in fiscal 2013 was not material to the full year fiscal 2013 financial statements.
Discontinued Operations
During fiscal 2013, the Company closed the sale of its hologram business (“Hologram Business”) to OpSec Security Inc. (“OpSec Security”) for $11.5 million in cash. The Consolidated Statements of Operations have been recast to present the Hologram Business as discontinued operations as described in “Note 18. Discontinued Operations.” Unless noted otherwise, discussion in the Notes to Consolidated Financial Statements pertain to continuing operations.
VIAVI SOLUTIONS INC.
NOTES TO CONSOLIDATED FINANCIAL STATEMENTS (Continued)
Use of Estimates
The preparation of the Company’s consolidated financial statements in conformity with U.S. GAAP requires Company management (“Management”) to make estimates and assumptions that affect the reported amount of assets and liabilities at the date of the financial statements, the reported amount of net revenue and expenses and the disclosure of commitments and contingencies during the reporting periods. The Company bases estimates on historical experience and on various assumptions about the future believed to be reasonable based on available information. The Company’s reported financial position or results of operations may be materially different under changed conditions or when using different estimates and assumptions, particularly with respect to significant accounting policies. If estimates or assumptions differ from actual results, subsequent periods are adjusted to reflect more current information.
Cash and Cash Equivalents
The Company considers highly-liquid instruments such as treasury bills, commercial paper and other money market instruments with original maturities of 90 days or less at the time of purchase to be cash equivalents.
Restricted Cash
At June 27, 2015 and June 28, 2014, the Company’s short-term restricted cash balances were $26.2 million and $31.9 million, respectively, and the Company’s long-term restricted cash balances were $6.1 million and $6.6 million, respectively. These balances primarily include interest-bearing investments in bank certificates of deposit and money market funds which act as collateral supporting the issuance of letters of credit and performance bonds for the benefit of third parties.
Investments
The Company’s investments in debt securities and marketable equity securities are primarily classified as available-for-sale investments or trading securities and are recorded at fair value. The cost of securities sold is based on the specific identification method. Unrealized gains and losses on available-for-sale investments, net of tax, are reported as a separate component of stockholders’ equity. Unrealized gains or losses on trading securities resulting from changes in fair value are recognized in current earnings. The Company’s short-term investments, which are classified as current assets, include certain securities with stated maturities of longer than twelve months as they are highly liquid and available to support current operations.
The Company periodically reviews these investments for impairment. If a debt security’s market value is below amortized cost and the Company either intends to sell the security or it is more likely than not that the Company will be required to sell the security before its anticipated recovery, the Company records an other-than-temporary impairment charge to investment income (loss) for the entire amount of the impairment; if a debt security’s market value is below amortized cost and the Company does not expect to recover the entire amortized cost of the security, the Company separates the other-than-temporary impairment into the portion of the loss related to credit factors, or the credit loss portion, and the portion of the loss that is not related to credit factors, or the non-credit loss portion. The credit loss portion is the difference between the amortized cost of the security and the Company’s best estimate of the present value of the cash flows expected to be collected from the debt security. The non-credit loss portion is the residual amount of the other-than-temporary impairment. The credit loss portion is recorded as a charge to income (loss), and the non-credit loss portion is recorded as a separate component of Other comprehensive income (loss).
Fair Value of Financial Instruments
The carrying amounts of certain of the Company’s financial instruments, including cash equivalents, accounts receivable, accounts payable, and deferred compensation liability, approximate fair value because of their short maturities. Fair value is defined as the exit price, or the amount that would be received to sell an asset or paid to transfer a liability in an orderly transaction between market participants as of the measurement date. There is an established hierarchy for inputs used in measuring fair value that maximizes the use of observable inputs and minimizes the use of unobservable inputs by requiring the most observable inputs be used when available. Observable inputs are inputs market participants would use in valuing the asset or liability and are developed based on market data obtained from sources independent of the Company. Unobservable inputs are inputs that reflect the assumptions about the factors that market participants would use in valuing the asset or liability.
Estimates of fair value of fixed-income securities are based on third party, market-based pricing sources which the Company believes to be reliable. These estimates represent the third parties’ good faith opinion as to what a buyer in the marketplace would pay for a security in a current sale. For instruments that are not actively traded, estimates may be based on current treasury yields adjusted by an estimated market credit spread for the specific instrument. The fair market value of the Company’s 0.625% Senior Convertible Notes due 2033 (the “2033 Notes”) fluctuates with interest rates and with the market price of the stock, but does not affect the carrying value of the debt on the balance sheet. Refer to the Company’s “Note 10. Debts and Letters of Credit” for more information.
VIAVI SOLUTIONS INC.
NOTES TO CONSOLIDATED FINANCIAL STATEMENTS (Continued)
Inventories
Inventory is valued at standard cost, which approximates actual cost computed on a first-in, first-out basis, not in excess of net realizable market value. The Company assesses the valuation on a quarterly basis and writes down the value for estimated excess and obsolete inventory based upon estimates of future demand, including warranty requirements. Our inventories include material, labor, and manufacturing overhead costs.
Property, Plant and Equipment
Property, plant and equipment are stated at cost. Depreciation is computed by the straight-line method over the following estimated useful lives of the assets: 10 to 50 years for building and improvements, 2 to 20 years for machinery and equipment, and 2 to 5 years for furniture, fixtures, software and office equipment. Leasehold improvements are amortized by the straight-line method over the shorter of the estimated useful lives of the assets or the term of the lease. Demonstration units, which are Company products used for demonstration purposes for customers and/or potential customers and generally not intended to be sold, have an estimated useful life of 5 years and are amortized by the straight-line method.
Costs related to software acquired, developed or modified solely to meet the Company’s internal requirements and for which there are no substantive plans to market are capitalized in accordance with the authoritative guidance on accounting for the costs of computer software developed or obtained for internal use. Only costs incurred after the preliminary planning stage of the project and after management has authorized and committed funds to the project are eligible for capitalization. Costs capitalized for computer software developed or obtained for internal use are included in Property, plant and equipment, net on the Consolidated Balance Sheets.
Goodwill
Goodwill represents the excess of the purchase price of an acquired enterprise or assets over the fair value of the identifiable assets acquired and liabilities assumed. The Company tests for impairment of goodwill on an annual basis in the fourth quarter and at any other time when events occur or circumstances indicate that the carrying amount of goodwill may not be recoverable. Refer to “Note 8. Goodwill” for more information.
Circumstances that could trigger an impairment test include, but are not limited to: a significant adverse change in the business climate or legal factors, an adverse action or assessment by a regulator, change in customer, target market and strategy, unanticipated competition, loss of key personnel, or the likelihood that a reporting unit or significant portion of a reporting unit will be sold or otherwise disposed.
An assessment of qualitative factors may be performed to determine whether it is necessary to perform the two-step quantitative goodwill impairment test. If the result of the qualitative assessment is that it is more likely than not (i.e., greater than 50% likelihood) that the fair value of a reporting unit, is less than its carrying amount, then the quantitative test is required. Otherwise, no further testing is required.
Under the quantitative test, if the carrying amount of the reporting unit goodwill exceeds the implied fair value of that goodwill, an impairment loss is recorded in the Consolidated Statements of Operations as “Impairment of goodwill.” Measurement of the fair value of a reporting unit is based on one or more of the following fair value measures: amounts at which the unit as a whole could be bought or sold in a current transaction between willing parties, using present value techniques of estimated future cash flows, or using valuation techniques based on multiples of earnings or revenue, or a similar performance measure.
Intangible Assets
Intangible assets consist primarily of purchased intangible assets through acquisitions. Purchased intangible assets primarily include acquired developed technologies (developed and core technology), customer relationships, proprietary know-how, trade secrets, and trademarks and trade names. Intangible assets are amortized using the straight-line method over the estimated economic useful lives of the assets, which is the period during which expected cash flows support the fair value of such intangible assets.
VIAVI SOLUTIONS INC.
NOTES TO CONSOLIDATED FINANCIAL STATEMENTS (Continued)
Long-lived Asset Valuation (Property, Plant and Equipment and Intangible Assets Subject to Amortization)
Long-lived assets held and used
The Company tests long-lived assets for recoverability, at the asset group level, when events or changes in circumstances indicate that their carrying amount may not be recoverable. Circumstances which could trigger a review include, but are not limited to: significant decreases in the market price of the asset, significant adverse changes in the business climate or legal factors, accumulation of costs significantly in excess of the amount originally expected for the acquisition or construction of the asset, current period cash flow or operating losses combined with a history of losses or a forecast of continuing losses associated with the use of the asset, or current expectation that the asset will more likely than not be sold or disposed significantly before the end of its estimated useful life.
Recoverability is assessed based on the difference between the carrying amount of the asset and the sum of the undiscounted cash flows expected to result from the use and the eventual disposal of the asset. An impairment loss is recognized when the carrying amount is not recoverable and exceeds fair value.
Long-lived assets held for sale
Long-lived assets are classified as held for sale when certain criteria are met, which include: Management’s commitment to a plan to sell the assets, the availability of the assets for immediate sale in their present condition, an active program to locate buyers and other actions to sell the assets has been initiated, whether the sale of the assets is probable and their transfer is expected to qualify for recognition as a completed sale within one year, whether the assets are being marketed at reasonable prices in relation to their fair value, and how unlikely it is that significant changes will be made to the plan to sell the assets.
The Company measures long-lived assets to be disposed of by sale at the lower of carrying amount or fair value less cost to sell. Fair value is determined using quoted market prices or the anticipated cash flows discounted at a rate commensurate with the risk involved.
Pension and Other Postretirement Benefits
The funded status of the Company’s retirement-related benefit plans is recognized on the Consolidated Balance Sheets. The funded status is measured as the difference between the fair value of plan assets and the benefit obligation at fiscal year end, the measurement date. For defined benefit pension plans, the benefit obligation is the projected benefit obligation (“PBO”) and for the non-pension postretirement benefit plan the benefit obligation is the accumulated postretirement benefit obligation (“APBO”). The PBO represents the actuarial present value of benefits expected to be paid upon retirement. The APBO represents the actuarial present value of postretirement benefits attributed to employee services already rendered. Unfunded or partially funded plans, with the benefit obligation exceeding the fair value of plan assets, are aggregated and recorded as a retirement and non-pension postretirement benefit obligation equal to this excess. The current portion of the retirement-related benefit obligation represents the actuarial present value of benefits payable in the next 12 months in excess of the fair value of plan assets, measured on a plan-by-plan basis. This liability is recorded in Other current liabilities in the Consolidated Balance Sheets.
Net periodic pension cost (income) is recorded in the Consolidated Statements of Operations and includes service cost, interest cost, expected return on plan assets, amortization of prior service cost and (gains) losses previously recognized as a component of accumulated other comprehensive income. Service cost represents the actuarial present value of participant benefits attributed to services rendered by employees in the current year. Interest cost represents the time value of money cost associated with the passage of time. (Gains) losses arise as a result of differences between actual experience and assumptions or as a result of changes in actuarial assumptions. Prior service cost (credit) represents the cost of benefit improvements attributable to prior service granted in plan amendments. (Gains) losses and prior service cost (credit) not recognized as a component of net periodic pension cost (income) in the Consolidated Statements of Operations as they arise are recognized as a component of Accumulated other comprehensive income on the Consolidated Balance Sheets, net of tax. Those (gains) losses and prior service cost (credit) are subsequently recognized as a component of net periodic pension cost (income) pursuant to the recognition and amortization provisions of the authoritative guidance.
The measurement of the benefit obligation and net periodic pension cost (income) is based on the Company’s estimates and actuarial valuations provided, by third-party actuaries, which are approved by Management. These valuations reflect the terms of the plans and use participant-specific information such as compensation, age and years of service, as well as certain assumptions, including estimates of discount rates, expected return on plan assets, rate of compensation increases, and mortality rates. The Company evaluates these assumptions annually at a minimum. In estimating the expected return on plan assets, the Company considers historical returns on plan assets, adjusted for forward-looking considerations, inflation assumptions and the impact of the active management of the plan’s invested assets.
VIAVI SOLUTIONS INC.
NOTES TO CONSOLIDATED FINANCIAL STATEMENTS (Continued)
Concentration of Credit and Other Risks
Financial instruments that potentially subject the Company to concentrations of credit risk consist primarily of cash and cash equivalents, short-term investments, trade receivables and foreign currency forward contracts. The Company’s cash and cash equivalents and short-term investments are held in safekeeping by large, creditworthy financial institutions. The Company invests its excess cash primarily in U.S. government and agency bonds securities, corporate securities, money market funds, asset-backed securities, and other investment-grade securities. The Company has established guidelines relative to credit ratings, diversification and maturities that seek to maintain safety and liquidity of these investments. The Company’s foreign exchange derivative instruments expose the Company to credit risk to the extent that the counterparties may be unable to meet the terms of the agreements. The Company seeks to mitigate such risk by limiting its counterparties to major financial institutions and by spreading such risk across several major financial institutions. In addition, the potential risk of loss with any one counterparty resulting from such risk is monitored by the Company on an ongoing basis.
The Company performs credit evaluations of its customers’ financial condition and generally does not require collateral from its customers. These evaluations require significant judgment and are based on a variety of factors including, but not limited to, current economic trends, historical payment, bad debt write-off experience, and financial review of the customer.
The Company maintains an allowance for doubtful accounts for estimated losses resulting from the inability of its customers to make required payments. When the Company becomes aware that a specific customer is unable to meet its financial obligations, the Company records a specific allowance to reflect the level of credit risk in the customer’s outstanding receivable balance. In addition, the Company records additional allowances based on certain percentages of aged receivable balances. These percentages take into account a variety of factors including, but not limited to, current economic trends, historical payment and bad debt write-off experience. The Company classifies bad debt expenses as selling, general and administrative (“SG&A”) expense.
The Company is not able to predict changes in the financial stability of its customers. Any material change in the financial status of any one or a group of customers could have a material adverse effect on the Company’s results of operations and financial condition. Although such losses have been within management’s expectations to date, there can be no assurance that such allowances will continue to be adequate. The Company has significant trade receivables concentrated in the telecommunications industry. While the Company’s allowance for doubtful accounts balance is based on historical loss experience along with anticipated economic trends, unanticipated financial instability in the telecommunications industry could lead to higher than anticipated losses. No one customer accounted for greater than 10% of accounts receivables or revenue during the periods presented.
The Company relies on a limited number of suppliers for a number of key components contained in our products. The Company also relies on a limited number of significant independent contract manufacturers for the production of certain key components and subassemblies contained in our products.
The Company generally uses a rolling twelve month forecast based on anticipated product orders, customer forecasts, product order history and backlog to determine its materials requirements. Lead times for the parts and components that the Company orders vary significantly and depend on factors such as the specific supplier, contract terms and demand for a component at a given time. If the forecast does not meet actual demand, the Company may have excess or shortfalls of some materials and components, as well as excess inventory purchase commitments. The Company could experience reduced or delayed product shipments or incur additional inventory write-downs and cancellation charges or penalties, which would increase costs and could have a material adverse impact on the Company’s results of operations.
Foreign Currency Forward Contracts
The Company conducts its business and sells its products to customers primarily in North America, Europe and Asia. In the normal course of business, the Company’s financial position is routinely subject to market risks associated with foreign currency rate fluctuations due to balance sheet positions in foreign currencies. The Company evaluates foreign exchange risks and utilizes foreign currency forward contracts to reduce such risks, hedging the gains or losses generated by the re-measurement of significant foreign currency denominated monetary assets and liabilities. The fair value of these contracts is reflected as other assets or other liabilities and the change in fair value of these foreign currency forward contracts is recorded as income or loss in the Company’s Consolidated Statements of Operations as a component of Interest and other income (expense), net to largely offset the change in fair value of the foreign currency denominated monetary assets and liabilities which is also recorded as a component of Interest and other income (expense), net.
VIAVI SOLUTIONS INC.
NOTES TO CONSOLIDATED FINANCIAL STATEMENTS (Continued)
Foreign Currency Translation
Assets and liabilities of non-U.S. subsidiaries that operate in a local currency environment, where that local currency is the functional currency, are translated into U.S. dollars at exchange rates in effect at the balance sheet date, with the resulting translation adjustments directly recorded as a component of Accumulated other comprehensive income, on the Consolidated Balance Sheets. Income and expense accounts are translated at the prior month balance sheet exchange rates, which are deemed to approximate average monthly rate. Gains and losses from re-measurement of monetary assets and liabilities denominated in currencies other than the respective functional currencies are included in the Consolidated Statements of Operations as a component of Interest and other income (expense), net.
Revenue Recognition
The Company recognizes revenue when it is realized or realizable and earned. The Company considers revenue realized or realizable and earned when it has persuasive evidence of an arrangement, delivery has occurred, the sales price is fixed or determinable and collectability is reasonably assured. Delivery does not occur until products have been shipped or services have been provided, risk of loss has transferred and in cases where formal acceptance is required, customer acceptance has been obtained or customer acceptance provisions have lapsed. In situations where a formal acceptance is required but the acceptance only relates to whether the product meets its published specifications, revenue is recognized upon delivery provided all other revenue recognition criteria are met. The sales price is not considered to be fixed or determinable until all contingencies related to the sale have been resolved.
The Company reduces revenue for rebates and other similar allowances. Revenue is recognized only if these estimates can be reliably determined. The Company’s estimates are based on its historical results taking into consideration the type of customer, the type of transaction and the specifics of each arrangement.
In addition to the aforementioned general policies, the following are the specific revenue recognition policies for multiple-element arrangements and for each major category of revenue.
Multiple-Element Arrangements
When a sales arrangement contains multiple deliverables, such as sales of products that include services, the multiple deliverables are evaluated to determine whether there are one or more units of accounting. Where there is more than one unit of accounting, then the entire fee from the arrangement is allocated to each unit of accounting based on the relative selling price. Under this approach, the selling price of a unit of accounting is determined by using a selling price hierarchy which requires the use of vendor-specific objective evidence (“VSOE”) of fair value if available, third-party evidence (“TPE”) if VSOE is not available, or best estimate of selling price (“BESP”) if neither VSOE nor TPE is available. Revenue is recognized when the revenue recognition criteria for each unit of accounting are met.
The Company establishes VSOE of selling price using the price charged for a deliverable when sold separately and, in remote circumstances, using the price established by management having the relevant authority. TPE of selling price is established by evaluating similar and interchangeable competitor goods or services in sales to similarly situated customers. When VSOE or TPE are not available the Company then uses BESP. Generally, the Company is not able to determine TPE because its product strategy differs from that of others in our markets, and the extent of customization varies among comparable products or services from its peers. The Company establishes BESP using historical selling price trends and considering multiple factors including, but not limited to geographies, market conditions, competitive landscape, internal costs, gross margin objectives, and pricing practices. When determining BESP, the Company applies significant judgment in establishing pricing strategies and evaluating market conditions and product lifecycles.
To the extent a deliverable(s) in a multiple-element arrangement is subject to specific guidance (for example, software that is subject to the authoritative guidance on software revenue recognition), the Company allocates the fair value of the units of accounting using relative selling price and that unit of accounting is accounted for in accordance with the specific guidance. Some product offerings include hardware that are integrated with or sold with software that delivers the functionality of the equipment. The Company believes this equipment is not considered software-related and would therefore be excluded from the scope of the authoritative guidance on software revenue recognition.
VIAVI SOLUTIONS INC.
NOTES TO CONSOLIDATED FINANCIAL STATEMENTS (Continued)
Hardware
Revenue from hardware sales is recognized when the product is shipped to the customer and when there are no unfulfilled company obligations that affect the customer’s final acceptance of the arrangement. Any cost of warranties and remaining obligations that are inconsequential or perfunctory are accrued when the corresponding revenue is recognized.
Services
Revenue from services and system maintenance is typically recognized on a straight-line basis over the term of the contract. Revenue from professional service engagements is typically recognized once its delivery obligation is fulfilled. Revenue related to extended warranty and product maintenance contracts is deferred and recognized on a straight-line basis over the delivery period. The Company also generates service revenue from hardware repairs and calibration which is recognized as revenue upon completion of the service.
Software
The Company’s software arrangements generally consist of a perpetual license fee and Post-Contract Support (“PCS”). Where the Company has established VSOE of fair value for PCS contracts, this has generally been based on the renewal rate or the bell curve methodology. Revenue from maintenance, unspecified upgrades and technical support is recognized over the period such items are delivered. In multiple-element revenue arrangements that include software, software-related and non-software-related elements are accounted for in accordance with the following policies.
· Non-software and software-related products are bifurcated based on a relative selling price
· Software-related products are separated into units of accounting if all of the following criteria are met:
· The functionality of the delivered element(s) is not dependent on the undelivered element(s).
· There is VSOE of fair value of the undelivered element(s).
· Delivery of the delivered element(s) represents the culmination of the earnings process for that element(s).
If these criteria are not met, the software revenue is deferred until the earlier of when such criteria are met or when the last undelivered element is delivered. If there is VSOE of the undelivered item(s) but no such evidence for the delivered item(s), the residual method is used to allocate the arrangement consideration. Under the residual method, the amount of consideration allocated to the delivered item(s) equals the total arrangement consideration less the aggregate VSOE of the undelivered elements. In cases where VSOE is not established for PCS, revenue is recognized ratably over the PCS period after all software elements have been delivered and the only undelivered item is PCS.
Warranty
The Company provides reserves for the estimated costs of product warranties at the time revenue is recognized. It estimates the costs of its warranty obligations based on its historical experience of known product failure rates, use of materials to repair or replace defective products and service delivery costs incurred in correcting product failures. In addition, from time to time, specific warranty accruals may be made if unforeseen technical problems arise.
Shipping and Handling Costs
The Company records costs related to shipping and handling of revenue in cost of sales for all periods presented.
Advertising Expense
The Company expenses advertising costs as incurred. Advertising costs totaled $1.7 million, $2.2 million and $0.8 million in fiscal 2015, 2014 and 2013, respectively.
Research and Development (“R&D”) Expense
Costs related to R&D, which primarily consists of labor and benefits, supplies, facilities, consulting and outside service fees, are charged to expense as incurred. The authoritative guidance allows for capitalization of software development costs incurred after a product’s technological feasibility has been established until the product is available for general release to the public. To date, the period between achieving technological feasibility, which the Company has defined as the establishment of a working model and typically occurs when beta testing commences, and the general availability of such software has been very short. Accordingly, software development costs have been expensed as incurred.
VIAVI SOLUTIONS INC.
NOTES TO CONSOLIDATED FINANCIAL STATEMENTS (Continued)
Stock-Based Compensation
Stock-based compensation is measured at grant date, and recognized in expense over the requisite service period based on the fair value of the equity award. The fair value of the time-based Full Value Awards is based on the closing market price of the Company’s common stock on the grant date of the award. The Company uses the Monte Carlo simulation to estimate the fair value of Full Value Awards with market conditions (“MSUs”). The Company estimates the fair value of employee stock purchase plan awards (“ESPP”) using the Black-Scholes Merton (“BSM”) option-pricing model. This option-pricing model requires the input of assumptions, including the award’s expected life and the price volatility of the underlying stock.
The Company estimates the expected forfeiture rate pursuant to the authoritative guidance, and only recognizes expense for those shares expected to vest. When estimating forfeitures, the Company considers voluntary termination behavior as well as future workforce reduction programs. Estimated forfeiture is trued up to actual forfeiture as the equity awards vest. The total fair value of the equity awards, net of forfeiture, is recorded on a straight-line basis over the requisite service period of the awards, which is generally the vesting period, except for MSUs which are amortized based upon graded vesting method.
Income Taxes
In accordance with the authoritative guidance on accounting for income taxes, the Company recognizes income taxes using an asset and liability approach. This approach requires the recognition of taxes payable or refundable for the current year and deferred tax liabilities and assets for the future tax consequences of events that have been recognized in its consolidated financial statements or tax returns. The measurement of current and deferred taxes is based on provisions of the enacted tax law and the effects of future changes in tax laws or rates are not anticipated.
The authoritative guidance provides for recognition of deferred tax assets if the realization of such deferred tax assets is more likely than not to occur based on an evaluation of both positive and negative evidence and the relative weight of the evidence. With the exception of certain international jurisdictions, the Company has determined that at this time it is more likely than not that deferred tax assets attributable to the remaining jurisdictions will not be realized, primarily due to uncertainties related to its ability to utilize its net operating loss carryforwards before they expire. Accordingly, the Company has established a valuation allowance for such deferred tax assets. If there is a change in the Company’s ability to realize its deferred tax assets for which a valuation allowance has been established, then its tax provision may decrease in the period in which it determines that realization is more likely than not. Likewise, if the Company determines that it is not more likely than not that its deferred tax assets will be realized, then a valuation allowance may be established for such deferred tax assets and the Company’s tax provision may increase in the period in which it makes the determination.
The authoritative guidance on accounting for uncertainty in income taxes clarifies the accounting for uncertainty in income taxes recognized in an entity’s financial statements and prescribes the recognition threshold and measurement attributes for financial statement recognition and measurement of a tax position taken or expected to be taken in a tax return. Additionally, it provides guidance on recognition, classification, and disclosure of tax positions. The Company is subject to income tax audits by the respective tax authorities in all of the jurisdictions in which it operates. The determination of tax liabilities in each of these jurisdictions requires the interpretation and application of complex and sometimes uncertain tax laws and regulations. The Company recognizes liabilities based on its estimate of whether, and the extent to which, additional tax liabilities are more likely than not. If the Company ultimately determines that the payment of such a liability is not necessary, then it reverses the liability and recognizes a tax benefit during the period in which the determination is made that the liability is no longer necessary.
The recognition and measurement of current taxes payable or refundable and deferred tax assets and liabilities requires that the Company make certain estimates and judgments. Changes to these estimates or a change in judgment may have a material impact on the Company’s tax provision in a future period.
Restructuring Accrual
In accordance with authoritative guidance on accounting for costs associated with exit or disposal activities, generally costs associated with restructuring activities are recognized when they are incurred. However, in the case of leases, the expense is estimated and accrued when the property is vacated. Given the significance of, and the timing of the execution of such activities, this process is complex and involves periodic reassessments of estimates made from the time the property was vacated, including evaluating real estate market conditions for expected vacancy periods and sub-lease income.
VIAVI SOLUTIONS INC.
NOTES TO CONSOLIDATED FINANCIAL STATEMENTS (Continued)
Additionally, a liability for post-employment benefits for workforce reductions related to restructuring activities is recorded when payment is probable, and the amount is reasonably estimable. The Company continually evaluates the adequacy of the remaining liabilities under its restructuring initiatives. Although the Company believes that these estimates accurately reflect the costs of its restructuring plans, actual results may differ, thereby requiring the Company to record additional provisions or reverse a portion of such provisions.
Loss Contingencies
The Company is subject to the possibility of various loss contingencies arising in the ordinary course of business. The Company considers the likelihood of loss or impairment of an asset or the incurrence of a liability, as well as its ability to reasonably estimate the amount of loss in determining loss contingencies. An estimated loss is accrued when it is probable that an asset has been impaired or a liability has been incurred and the amount of loss can be reasonably estimated. The Company regularly evaluates current information available to determine whether such accruals should be adjusted and whether new accruals are required.
Asset Retirement Obligations (“ARO”)
ARO are legal obligations associated with the retirement of long-lived assets pertaining to leasehold improvements. These liabilities are initially recorded at fair value and the related asset retirement costs are capitalized by increasing the carrying amount of the related assets by the same amount as the liability. Asset retirement costs are subsequently depreciated over the useful lives of the related assets. Subsequent to initial recognition, the Company records period-to-period changes in the ARO liability resulting from the passage of time and revisions to either the timing or the amount of the original estimate of undiscounted cash flows. The Company derecognizes ARO liabilities when the related obligations are settled. As of June 27, 2015 and June 28, 2014, the Consolidated Balance Sheets included ARO of $2.0 million and $2.0 million, respectively, in Other current liabilities and $4.5 million and $5.1 million, respectively, in Other non-current liabilities.
|
(in millions) |
|
Balance at |
|
Liabilities |
|
Liabilities |
|
Accretion |
|
Revisions to |
|
Balance at |
| ||
|
Asset Retirement Obligations |
|
|
|
|
|
|
|
|
|
|
|
|
| ||
|
Year ended June 27, 2015 |
|
$ |
7.1 |
|
0.1 |
|
(0.7 |
) |
0.3 |
|
(0.3 |
) |
$ |
6.5 |
|
|
Year ended June 28, 2014 |
|
$ |
9.2 |
|
0.4 |
|
(1.0 |
) |
0.4 |
|
(1.9 |
) |
$ |
7.1 |
|
Note 2. Recently Issued Accounting Pronouncements
In July 2015, the Financial Accounting Standards Board (“FASB”) issued guidance to change the subsequent measurement of inventory from lower of cost or market to lower of cost and net realizable value. The guidance is effective for the Company in the first quarter of fiscal 2018. Earlier application is permitted as of the beginning of an interim or annual reporting period. The Company is evaluating the impact of adopting this new accounting guidance on its consolidated financial statements.
In May 2015, the FASB issued guidance to remove the requirement to categorize within the fair value hierarchy all investments for which fair value is measured using net asset value per share practical expedient. The guidance is effective for the Company in the first quarter of fiscal 2017 and may apply to certain pension assets. The guidance will be applied retrospectively and earlier adoption is permitted. The Company is evaluating the impact of adopting this new accounting guidance on its consolidated financial statements.
In April 2015, the FASB issued new authoritative guidance to provide a practical expedient that permits the entity to measure defined benefit plan assets and obligations using the month-end that is closest to the entity’s fiscal year-end and apply that practical expedient consistently from year to year. Prospective application is required and early adoption is permitted. This guidance is effective for the Company in the first quarter of fiscal 2017 and may apply to the qualified and the non-qualified pension plans in certain countries. The Company will not early adopt and is evaluating the impact of adopting this new accounting guidance on its consolidated financial statements.
In April 2015, the FASB issued new authoritative guidance to simplify the presentation of debt issuance costs by requiring debt issuance costs to be presented as a deduction from the corresponding liability, consistent with debt discounts or premiums. This guidance is effective for the Company in the first quarter of fiscal 2017 and will be applied retrospectively. The consolidated balance sheet of each individual period presented will be adjusted to reflect the period-specific effects of applying this new guidance.
VIAVI SOLUTIONS INC.
NOTES TO CONSOLIDATED FINANCIAL STATEMENTS (Continued)
In May 2014, the FASB issued new authoritative guidance related to revenue recognition. This guidance will replace current U.S. GAAP guidance on this topic and eliminate industry-specific guidance. The new revenue recognition guidance provides a unified model to determine when and how revenue is recognized. The core principle is that a company should recognize revenue to depict the transfer of promised goods or services to customers in an amount that reflects the consideration for which the entity expects to be entitled in exchange for those goods or services. This guidance allows for either full retrospective adoption or modified retrospective adoption. The FASB deferred the effective date for this guidance by one year to December 15, 2017 for annual reporting periods beginning after that. Earlier application of this guidance is permitted but not before the original date of December 15, 2016. The Company is evaluating the impact that this new accounting guidance will have on its consolidated financial statements and the related disclosures.
In April 2014, the FASB issued authoritative guidance, which specifies that only disposals, such as a disposal of a major line of business, representing a strategic shift in operations should be presented as discontinued operations. In addition, the new guidance requires expanded disclosures about discontinued operations that will provide financial statement users with more information about the assets, liabilities, income, and expenses of discontinued operations. This guidance is effective for the Company in the first quarter of fiscal 2016 and will be applied to the separation of the Lumentum business which took place on August 1, 2015.
Note 3. Earnings Per Share
The following table sets forth the computation of basic and diluted net (loss) income per share (in millions, except per share data):
|
|
|
Years Ended |
| |||||||
|
|
|
June 27, 2015 |
|
June 28, 2014 |
|
June 29, 2013 |
| |||
|
Numerator: |
|
|
|
|
|
|
| |||
|
Net (loss) income |
|
$ |
(88.1 |
) |
$ |
(17.8 |
) |
$ |
57.0 |
|
|
Loss from discontinued operations, net of tax |
|
— |
|
— |
|
— |
| |||
|
Net (loss) income |
|
$ |
(88.1 |
) |
$ |
(17.8 |
) |
$ |
57.0 |
|
|
Denominator: |
|
|
|
|
|
|
| |||
|
Weighted-average number of common shares outstanding |
|
|
|
|
|
|
| |||
|
Basic |
|
232.7 |
|
234.2 |
|
235.0 |
| |||
|
Effect of dilutive securities from stock-based benefit plans |
|
— |
|
— |
|
4.3 |
| |||
|
Diluted |
|
232.7 |
|
234.2 |
|
239.3 |
| |||
|
|
|
|
|
|
|
|
| |||
|
Basic net (loss) income per share from: |
|
|
|
|
|
|
| |||
|
Continuing operations |
|
$ |
(0.38 |
) |
$ |
(0.08 |
) |
$ |
0.24 |
|
|
Discontinued operations |
|
— |
|
— |
|
— |
| |||
|
Net (loss) income |
|
$ |
(0.38 |
) |
$ |
(0.08 |
) |
$ |
0.24 |
|
|
Diluted net (loss) income per share from: |
|
|
|
|
|
|
| |||
|
Continuing operations |
|
$ |
(0.38 |
) |
$ |
(0.08 |
) |
$ |
0.24 |
|
|
Discontinued operations |
|
— |
|
— |
|
— |
| |||
|
Net (loss) income |
|
$ |
(0.38 |
) |
$ |
(0.08 |
) |
$ |
0.24 |
|
VIAVI SOLUTIONS INC.
NOTES TO CONSOLIDATED FINANCIAL STATEMENTS (Continued)
The following table sets forth the weighted-average potentially dilutive securities excluded from the computation of the diluted net (loss) income per share because their effect would have been anti-dilutive (in millions):
|
|
|
Years Ended |
| ||||
|
|
|
June 27, 2015 |
|
June 28, 2014 |
|
June 29, 2013 |
|
|
Stock options and ESPP |
|
3.6 |
|
4.9 |
|
2.3 |
|
|
Restricted Stock Units |
|
10.3 |
|
10.1 |
|
2.2 |
|
|
Total potentially dilutive securities |
|
13.9 |
|
15.0 |
|
4.5 |
|
(1) As the Company incurred a net loss in the period, potential dilutive securities from employee stock options, ESPP and Restricted Stock Units (“RSUs”) have been excluded from the diluted net loss per share computations as their effects were deemed anti-dilutive.
(2) The Company’s 2033 Notes are not included in the table above. The par amount of convertible notes is payable in cash equal to the principal amount of the notes plus any accrued and unpaid interest and then the “in-the-money” conversion benefit feature at the conversion price above $18.83 per share is payable in cash, shares of the Company’s common stock or a combination of both. Refer to “Note 10. Debts and Letters of Credit” for more details.
(3) The Company’s 1% Senior Convertible Notes due 2026 (the “2026 Notes”) are not included in the table above. The par amount of convertible notes is payable in cash equal to the principal amount of the notes plus any accrued and unpaid interest and then the “in-the-money” conversion benefit feature at the conversion price above $30.30 per share is payable in shares of the Company’s common stock or cash. As of June 29, 2013, no amounts related to the 2026 Notes were outstanding. Refer to “Note 10. Debts and Letters of Credit” for more information.
Note 4. Accumulated Other Comprehensive (Loss) Income
The Company’s accumulated other comprehensive (loss) income consists of the accumulated net unrealized gains and losses on available-for-sale investments, foreign currency translation adjustments and defined benefit obligations.
At June 27, 2015 and June 28, 2014, balances for the components of accumulated other comprehensive (loss) income were as follows (in millions):
|
|
|
Unrealized |
|
Foreign currency |
|
Defined benefit |
|
Total |
| ||||
|
Beginning balance as of June 28, 2014 |
|
$ |
(2.8 |
) |
$ |
26.2 |
|
$ |
(12.3 |
) |
$ |
11.1 |
|
|
Other comprehensive (loss) income before reclassification |
|
(0.4 |
) |
(55.4 |
) |
(3.7 |
) |
(59.5 |
) | ||||
|
Amounts reclassified from accumulated other comprehensive (loss) income |
|
— |
|
— |
|
0.4 |
|
0.4 |
| ||||
|
Net current-period other comprehensive (loss) income |
|
(0.4 |
) |
(55.4 |
) |
(3.3 |
) |
(59.1 |
) | ||||
|
Ending balance as of June 27, 2015 |
|
$ |
(3.2 |
) |
$ |
(29.2 |
) |
$ |
(15.6 |
) |
$ |
(48.0 |
) |
(1) Amount represents the amortization of actuarial losses included as a component of Selling, general and administrative expense (“SG&A”) in the Consolidated Statement of Operations for the year ended June 27, 2015. There was no tax impact. Refer to “Note 15. Employee Pension and Other Benefit Plans” for more details on the computation of net periodic cost for pension plans.
Note 5. Mergers and Acquisitions
Fiscal 2014 Acquisitions
Network Instruments, LLC (“Network Instruments”)
On January 6, 2014 (“Network Instruments Closing Date”), the Company completed the acquisition of Network Instruments, a privately-held U.S. company. Network Instruments is a leading developer of enterprise network and application-performance management solutions for global 2000 companies. The Company acquired all outstanding shares of Network Instruments for $208.5 million in cash, subject to final cash and working capital adjustments including holdback payments of approximately $20.0 million which are reserved for potential breaches of representations and warranties. During fiscal 2015 the Company made holdback payments totaling $19.7 million, net of working capital adjustments, which were classified as a financing activity within the Consolidated Statements of Cash Flows.
VIAVI SOLUTIONS INC.
NOTES TO CONSOLIDATED FINANCIAL STATEMENTS (Continued)
The acquisition of Network Instruments further strengthens the Company’s portfolio of solutions for the enterprise, data center and cloud networking markets. In order to improve application performance, reduce costs and address increasing network complexity, enterprise network administrators are rapidly transforming their IT networks while embracing today’s most critical technology initiatives such as unified communications, cloud, and data center consolidation. Network Instruments helps enterprises simplify the management and optimization of their networks with high-performance solutions that provide actionable intelligence and deep network visibility. Network Instruments was integrated into the Company’s SE segment.
The Company accounted for the transaction in accordance with the authoritative guidance on business combinations; therefore, the tangible and intangible assets acquired and liabilities assumed were recorded at fair value on the acquisition date.
The Company finalized the purchase price allocation related to this acquisition, including measurement period adjustments with the corresponding offset to goodwill, during fiscal 2014. The purchase price was allocated as follows (in millions):
|
Net tangible assets acquired |
|
$ |
20.8 |
|
|
Intangible assets acquired: |
|
|
| |
|
Developed technology |
|
21.7 |
| |
|
Customer relationships |
|
38.3 |
| |
|
In-process research and development |
|
1.7 |
| |
|
Other |
|
0.3 |
| |
|
Goodwill |
|
125.6 |
| |
|
Total purchase price |
|
$ |
208.4 |
|
The following table summarizes the components of the tangible assets acquired at fair value (in millions):
|
Cash |
|
$ |
9.0 |
|
|
Accounts receivable |
|
13.8 |
| |
|
Inventory |
|
6.0 |
| |
|
Property and equipment |
|
1.0 |
| |
|
Accounts payable |
|
(1.5 |
) | |
|
Deferred tax liabilities, net |
|
(0.6 |
) | |
|
Other liabilities, net of other assets |
|
(4.4 |
) | |
|
Deferred revenue |
|
(2.5 |
) | |
|
Net tangible assets acquired |
|
$ |
20.8 |
|
Acquired intangible assets are classified as Level 3 assets for which fair value is derived from valuation based on inputs that are unobservable and significant to the overall fair value measurement. The fair value of acquired developed technology, customer relationships, acquired in-process research and development (“IPR&D”) and other intangible assets was determined based on an income approach using the discounted cash flow method. The intangible assets, except IPR&D, are being amortized over their estimated useful lives of five years for the majority of acquired developed technology and customer relationships and one year for trade name. Order backlog was fully amortized in fiscal 2014.
In accordance with authoritative guidance, the Company recognizes IPR&D at fair value as of the Network Instruments Closing Date. The IPR&D is accounted for as an indefinite-lived intangible asset until completion or abandonment of the associated research and development efforts. IPR&D is tested for impairment during the period it is considered an indefinite lived asset.
The goodwill arising from this acquisition is primarily attributed to sales of future products and services and the assembled workforce of Network Instruments. Goodwill has been assigned to the NE and SE segment and is not deductible for tax purposes.
VIAVI SOLUTIONS INC.
NOTES TO CONSOLIDATED FINANCIAL STATEMENTS (Continued)
Goodwill is not being amortized but is reviewed annually for impairment or more frequently if impairment indicators arise, in accordance with authoritative guidance.
The estimated amount of Network Instruments’ net revenue and net loss, included in the Company’s Consolidated Statement of Operations for the year ended June 28, 2014 was $12.6 million and $9.6 million, respectively. Network Instruments’ net revenue and net loss disclosed above reflect Management’s best estimate, based on information available at the reporting date.
The following table presents certain unaudited pro forma information, for illustrative purposes only, for fiscal 2014 and fiscal 2013 as if Network Instruments had been acquired on July 1, 2012. The unaudited estimated pro forma information combines the historical results of Network Instruments with the Company’s consolidated historical results and includes certain adjustments reflecting the estimated impact of fair value adjustments for the respective periods. The pro forma information is not indicative of what would have occurred had the acquisition taken place on July 1, 2012. Additionally, the pro forma financial information does not include the impact of possible business model changes and does not reflect pro forma adjustments to conform accounting policies between Network Instruments and the Company. Actual results will differ from the unaudited pro forma information presented below (unaudited, in millions):
|
|
|
Years Ended |
| ||||
|
|
|
June 28, |
|
June 29, |
| ||
|
Pro forma net revenue |
|
$ |
1,770.0 |
|
$ |
1,710.9 |
|
|
Pro forma net (loss) income |
|
(14.5 |
) |
47.7 |
| ||
Time-Bandwidth Products AG (“Time-Bandwidth”)
On January 27, 2014 (“Time-Bandwidth Closing Date”), the Company completed the acquisition of Time-Bandwidth, a privately-held company headquartered in Switzerland. Time-Bandwidth is a provider of high-powered and ultrafast lasers for industrial and scientific markets. The Company acquired all outstanding shares of Time-Bandwidth for $15.0 million in cash, subject to a holdback payment of approximately $2.3 million which is reserved for potential breaches of representations and warranties. The holdback payment, minus any deductions for actual or pending claims, will be released following the eighteen-month anniversary of the Time-Bandwidth Closing Date. In connection with the separation of the Lumentum business, this payment will be made by Lumentum.
Time-Bandwidth provides innovative high-powered and ultrafast laser technology that can rapidly and precisely process parts at high volumes during the manufacturing process. Use of ultrafast lasers for micromachining applications is being driven primarily by increasing use of consumer electronics and connected devices globally. Manufacturers are taking advantage of high-power and ultrafast lasers to create quality micro parts for consumer electronics and to process semiconductor chips for consumer devices. Time-Bandwidth’s technology complements the Company’s current laser portfolio, while enabling Time-Bandwidth to leverage the Company’s high volume and low-cost manufacturing model, global sales team and channel relationships. Time-Bandwidth was integrated into the Company’s CCOP segment.
The Company accounted for the transaction in accordance with the authoritative guidance on business combinations; therefore, the tangible and intangible assets acquired and liabilities assumed were recorded at fair value on the acquisition date.
The Company finalized the purchase price allocation related to this acquisition including measurement period adjustments with the corresponding offset to goodwill during fiscal 2014. The purchase price was allocated as follows (in millions):
|
Net tangible assets acquired |
|
$ |
2.0 |
|
|
Intangible assets acquired: |
|
|
| |
|
Developed technology |
|
6.7 |
| |
|
Customer relationships |
|
0.5 |
| |
|
Goodwill |
|
5.8 |
| |
|
Total purchase price |
|
$ |
15.0 |
|
VIAVI SOLUTIONS INC.
NOTES TO CONSOLIDATED FINANCIAL STATEMENTS (Continued)
The following table summarizes the components of the net tangible assets acquired at fair value (in millions):
|
Accounts receivable |
|
$ |
1.4 |
|
|
Inventories |
|
5.0 |
| |
|
Property and equipment |
|
1.5 |
| |
|
Accounts payable |
|
(0.6 |
) | |
|
Accrued expenses and other liabilities, net of other assets |
|
(3.5 |
) | |
|
Deferred tax liabilities, net |
|
(1.8 |
) | |
|
Net tangible assets acquired |
|
$ |
2.0 |
|
Acquired intangible assets are classified as Level 3 assets for which fair value is derived from valuation based on inputs that are unobservable and significant to the overall fair value measurement. The fair value of acquired developed technology and customer relationships was determined based on an income approach using the discounted cash flow method. The acquired developed technology and customer relationships are being amortized over their estimated useful lives of eight and three years, respectively.
The goodwill arising from this acquisition is primarily attributed to sales of future products and services and the assembled workforce of Time-Bandwidth. Goodwill has been assigned to the CCOP segment and is not deductible for tax purposes. Goodwill is not being amortized but is reviewed annually for impairment or more frequently if impairment indicators arise, in accordance with authoritative guidance.
Time-bandwidth’s results of operations have been included in the Company’s consolidated financial statements subsequent to the date of acquisition. Pro forma results of operations have not been presented because the effect of the acquisition was not material to prior period financial statements.
Trendium Inc. (“Trendium”)
On December 10, 2013 (“Trendium Closing Date”), the Company acquired certain technology and other assets from Trendium, a privately-held U.S. company, for a purchase price of $26.1 million in cash including a holdback payment of approximately $2.5 million which is reserved for potential breaches of representations and warranties. During fiscal 2015 the Company made the $2.5 million holdback payment following the one-year anniversary of the Trendium Closing Date. The payment is classified as a financing activity within the Consolidated Statements of Cash Flows.
Trendium provides real-time intelligence software solutions for customer experience assurance (“CEA”), asset optimization and monetization of big data for 4G/Long Term Evolution (“LTE”) mobile network operators. The addition of Trendium employees and technology enables the Company to introduce a new paradigm of CEA, enabling operators of 4G/LTE networks to achieve a real and relevant improvement in customer satisfaction while maximizing productivity and profitability for dynamic converged 4G/LTE networks and beyond. The purchased assets are included in the Company’s SE segment.
The Company accounted for the transaction in accordance with the authoritative guidance on business combinations; therefore, the tangible and intangible assets acquired were recorded at fair value on the acquisition date. The Company finalized the purchase price allocation related to this acquisition, including measurement period adjustments with the corresponding offset to goodwill, during fiscal 2014. The purchase price was allocated as follows (in millions):
|
Tangible assets acquired: |
|
|
| |
|
Property, plant and equipment |
|
$ |
0.2 |
|
|
Intangible assets acquired: |
|
|
| |
|
Developed technology |
|
6.1 |
| |
|
In-process research and development |
|
5.4 |
| |
|
Goodwill |
|
14.4 |
| |
|
Total purchase price |
|
$ |
26.1 |
|
VIAVI SOLUTIONS INC.
NOTES TO CONSOLIDATED FINANCIAL STATEMENTS (Continued)
Acquired intangible assets are classified as Level 3 assets for which fair value is derived from valuation based on inputs that are unobservable and significant to the overall fair value measurement. The fair value of acquired developed technology was determined based on an income approach using the discounted cash flow method and are being amortized over their estimated useful lives of seven years.
In accordance with authoritative guidance, the Company recognized IPR&D at fair value as of the Trendium Closing Date. The IPR&D is accounted for as an indefinite-lived intangible asset until completion or abandonment of the associated research and development efforts. IPR&D is tested for impairment during the period it is considered an indefinite lived asset.
The goodwill arising from this acquisition is primarily attributed to product synergies and the assembled workforce of Trendium. Goodwill was assigned to the NE and SE segment and is deductible for tax purposes. Goodwill is not amortized but is reviewed annually for impairment or more frequently if impairment indicators arise, in accordance with authoritative guidance.
Trendium’s results of operations have been included in the Company’s consolidated financial statements subsequent to the date of acquisition. Pro forma results of operations have not been presented because the effect of the acquisition was not material to prior period financial statements.
Fiscal 2013 Acquisitions
Arieso Ltd. (“Arieso”)
On March 7, 2013 (“Arieso Closing Date”), the Company completed the acquisition of Arieso, a privately-held company headquartered in the United Kingdom (“U.K”). Arieso is a provider of location-aware software solutions that enable mobile network operators to boost 2G, 3G and 4G/LTE network performance and enrich the mobile subscriber experience.
Arieso brings high-caliber mobile software engineering expertise to the Company to address the rapidly growing deployment of small cells and challenges associated with limited spectrum capacity. Utilized by leading wireless network operators and equipment manufacturers, Arieso’s solutions locate, store and analyze data from billions of mobile connection events that translate into rich intelligence, which help enable mobile operators to optimize network performance, improve customer experience and create new revenue-generating services. Arieso was integrated in the Company’s SE segment.
The Company acquired all outstanding shares of Arieso for approximately $89.7 million in cash, subject to holdback payments of approximately $12.8 million which are reserved for potential breaches of representations and warranties. During fiscal 2014 the Company made a holdback payment of $7.0 million classified as a financing activity within the Consolidated Statements of Cash Flows.
The Company accounted for the transaction in accordance with the authoritative guidance on business combinations; therefore, the tangible and intangible assets acquired and liabilities assumed were recorded at fair value on the acquisition date.
The Company finalized the purchase price allocation related to this acquisition during fiscal 2014. The purchase price was allocated as follows (in millions):
|
Net tangible assets acquired |
|
$ |
0.2 |
|
|
Intangible assets acquired: |
|
|
| |
|
Developed technology |
|
32.8 |
| |
|
Customer relationships |
|
14.5 |
| |
|
Order backlog |
|
1.4 |
| |
|
Goodwill |
|
40.8 |
| |
|
Total purchase price |
|
$ |
89.7 |
|
VIAVI SOLUTIONS INC.
NOTES TO CONSOLIDATED FINANCIAL STATEMENTS (Continued)
The following table summarizes the components of the tangible assets acquired at fair value (in millions):
|
Cash |
|
$ |
4.1 |
|
|
Accounts receivable |
|
8.4 |
| |
|
Property and equipment |
|
0.6 |
| |
|
Accounts payable |
|
(0.3 |
) | |
|
Accrued expenses, net of other assets |
|
(1.4 |
) | |
|
Employee related liabilities |
|
(1.4 |
) | |
|
Deferred revenue |
|
(1.7 |
) | |
|
Deferred tax liabilities, net |
|
(8.1 |
) | |
|
Net tangible assets acquired |
|
$ |
0.2 |
|
Acquired intangible assets are classified as Level 3 assets for which fair value is derived from valuation based on inputs that are unobservable and significant to the overall fair value measurement. The fair value of acquired developed technology, customer relationships and order backlog was determined based on an income approach using the discounted cash flow method. The acquired developed technology and customer relationship intangible assets are being amortized over their estimated useful lives of five years. Order backlog was fully amortized in fiscal 2013.
The goodwill arising from this acquisition is primarily attributed to sales of future products and services and the assembled workforce of Arieso. Goodwill will be assigned to the NE and SE segment and is not deductible for tax purposes. Goodwill is not being amortized but is reviewed annually for impairment or more frequently if impairment indicators arise, in accordance with authoritative guidance.
In accordance with the authoritative guidance, the Company expensed $1.8 million of acquisition-related costs incurred in fiscal 2013 as SG&A expense in the Company’s Consolidated Statements of Operations.
GenComm Co., Ltd. (“GenComm”)
On August 17, 2012 (“GenComm Closing Date”), the Company completed the acquisition of Seoul, South Korea-based GenComm, a provider of test and measurement solutions for troubleshooting, installation and maintenance of wireless base stations and repeaters. The Company acquired tangible and intangible assets and assumed liabilities of GenComm for a total purchase price of approximately $15.2 million in cash, including holdback payments of approximately $3.8 million which are reserved for potential breaches of representations and warranties. During fiscal 2014, the Company made a holdback payment of $3.3 million dollars classified as a financing activity within the Consolidated Statements of Cash Flows. GenComm was integrated in the Company’s NE segment.
The Company accounted for the transaction in accordance with the authoritative guidance on business combinations; therefore, the tangible and intangible assets acquired and liabilities assumed were recorded at fair value on the acquisition date.
The purchase price was allocated as follows (in millions):
|
Net tangible assets acquired |
|
$ |
5.9 |
|
|
Intangible assets acquired: |
|
|
| |
|
Developed technology |
|
3.2 |
| |
|
Customer relationships |
|
0.2 |
| |
|
Order backlog |
|
0.2 |
| |
|
Goodwill |
|
5.7 |
| |
|
Total purchase price |
|
$ |
15.2 |
|
Acquired intangible assets are classified as Level 3 assets for which fair value is derived from valuation based on inputs that are unobservable and significant to the overall fair value measurement.
VIAVI SOLUTIONS INC.
NOTES TO CONSOLIDATED FINANCIAL STATEMENTS (Continued)
The fair value of acquired developed technology, customer relationships and order backlog was determined based on an income approach using the discounted cash flow method. The acquired developed technology and customer relationship intangible assets are being amortized over their estimated useful lives of four years. Order backlog was fully amortized in fiscal 2013.
The goodwill arising from this acquisition is primarily attributed to sales of future products and services and the assembled workforce of GenComm. Goodwill has been assigned to the NE and SE segment and is not deductible for tax purposes. Goodwill is not being amortized but is reviewed annually for impairment or more frequently if impairment indicators arise, in accordance with authoritative guidance.
Note 6. Balance Sheet and Other Details
Accounts receivable reserves and allowances
The components of accounts receivable reserves and allowances were as follows (in millions):
|
|
|
June 27, 2015 |
|
June 28, 2014 |
| ||
|
Allowance for doubtful accounts |
|
$ |
2.8 |
|
$ |
3.0 |
|
|
Allowance for sales returns |
|
1.5 |
|
0.5 |
| ||
|
Total accounts receivable reserves and allowances |
|
$ |
4.3 |
|
$ |
3.5 |
|
The activities and balances for allowance for doubtful accounts are as follows (in millions):
|
Allowance for doubtful accounts: |
|
Balance at |
|
Charged to |
|
Deduction (1) |
|
Balance at End |
| ||||
|
Year ended June 27, 2015 |
|
$ |
3.0 |
|
$ |
0.6 |
|
$ |
(0.8 |
) |
$ |
2.8 |
|
|
Year ended June 28, 2014 |
|
2.1 |
|
1.3 |
|
(0.4 |
) |
3.0 |
| ||||
|
Year ended June 29, 2013 |
|
2.2 |
|
0.3 |
|
(0.4 |
) |
2.1 |
| ||||
(1) Represents the effect of currency translation adjustments and write-offs of uncollectible accounts, net of recoveries.
Inventories, net
The components of Inventories, net were as follows (in millions):
|
|
|
June 27, 2015 |
|
June 28, 2014 |
| ||
|
Finished goods |
|
$ |
91.8 |
|
$ |
78.4 |
|
|
Work in process |
|
30.3 |
|
40.1 |
| ||
|
Raw materials |
|
31.7 |
|
34.8 |
| ||
|
Inventories, net |
|
$ |
153.8 |
|
$ |
153.3 |
|
Prepayments and other current assets
The components of Prepayments and other current assets were as follows (in millions):
|
|
|
June 27, 2015 |
|
June 28, 2014 |
| ||
|
Prepayments |
|
$ |
36.5 |
|
$ |
33.3 |
|
|
Other current assets |
|
47.9 |
|
45.4 |
| ||
|
Prepayments and other current assets |
|
$ |
84.4 |
|
$ |
78.7 |
|
VIAVI SOLUTIONS INC.
NOTES TO CONSOLIDATED FINANCIAL STATEMENTS (Continued)
Property, plant and equipment, net
The components of Property, plant and equipment, net were as follows (in millions):
|
|
|
June 27, 2015 |
|
June 28, 2014 |
| ||
|
Land |
|
$ |
20.6 |
|
$ |
20.7 |
|
|
Buildings and improvements |
|
61.4 |
|
64.0 |
| ||
|
Machinery and equipment |
|
524.7 |
|
495.3 |
| ||
|
Furniture, fixtures, software and office equipment |
|
149.3 |
|
145.2 |
| ||
|
Leasehold improvements |
|
80.4 |
|
78.3 |
| ||
|
Construction in progress |
|
56.4 |
|
32.3 |
| ||
|
|
|
892.8 |
|
835.8 |
| ||
|
Less: Accumulated depreciation |
|
(598.2 |
) |
(547.0 |
) | ||
|
Property, plant and equipment, net |
|
$ |
294.6 |
|
$ |
288.8 |
|
Other current liabilities
The components of Other current liabilities were as follows (in millions):
|
|
|
June 27, 2015 |
|
June 28, 2014 |
| ||
|
Deferred compensation plan |
|
$ |
3.4 |
|
$ |
3.9 |
|
|
Warranty |
|
5.1 |
|
5.3 |
| ||
|
Restructuring |
|
22.3 |
|
14.5 |
| ||
|
Holdback liabilities from acquisitions |
|
2.3 |
|
22.5 |
| ||
|
Deferred income taxes |
|
7.3 |
|
1.1 |
| ||
|
Other |
|
13.9 |
|
10.4 |
| ||
|
Other current liabilities |
|
$ |
54.3 |
|
$ |
57.7 |
|
Other non-current liabilities
The components of Other non-current liabilities were as follows (in millions):
|
|
|
June 27, 2015 |
|
June 28, 2014 |
| ||
|
Pension and post-employment benefits |
|
$ |
89.3 |
|
$ |
107.3 |
|
|
Financing obligation |
|
29.1 |
|
31.4 |
| ||
|
Restructuring accrual |
|
9.8 |
|
11.7 |
| ||
|
Long-term deferred revenue |
|
23.6 |
|
22.7 |
| ||
|
Other |
|
27.5 |
|
46.4 |
| ||
|
Other non-current liabilities |
|
$ |
179.3 |
|
$ |
219.5 |
|
VIAVI SOLUTIONS INC.
NOTES TO CONSOLIDATED FINANCIAL STATEMENTS (Continued)
Interest and other income (expense), net
The components of Interest and other income (expense), net were as follows (in millions):
|
|
|
Years Ended |
| |||||||
|
|
|
June 27, 2015 |
|
June 28, 2014 |
|
June 29, 2013 |
| |||
|
Interest income |
|
$ |
4.6 |
|
3.7 |
|
$ |
2.7 |
| |
|
Foreign exchange gains (losses), net |
|
(4.1 |
) |
(2.6 |
) |
(2.5 |
) | |||
|
Proceeds from Nortel (1) |
|
2.2 |
|
— |
|
— |
| |||
|
Loss on repurchase of Convertible Notes |
|
— |
|
— |
|
(4.1 |
) | |||
|
Gain on sale from investments |
|
0.1 |
|
0.4 |
|
0.5 |
| |||
|
Other income (expense), net |
|
0.6 |
|
(1.0 |
) |
(0.7 |
) | |||
|
Interest and other income (expense), net |
|
$ |
3.4 |
|
$ |
0.5 |
|
$ |
(4.1 |
) |
(1) During the fourth quarter of fiscal 2015, the Company received proceeds of $2.2 million from the Fair Fund established to provide compensation for losses incurred in connection with investments in Nortel Networks Corporation (“Nortel”) securities from the SEC’s claims against Nortel.
Note 7. Investments and Fair Value Measurements
Available-For-Sale Investments
The Company’s investments in marketable debt and equity securities were primarily classified as available-for-sale investments.
As of June 27, 2015, the Company’s available-for-sale securities were as follows (in millions):
|
|
|
Amortized |
|
Gross Unrealized |
|
Gross Unrealized |
|
Estimated |
| ||||
|
Debt securities: |
|
|
|
|
|
|
|
|
| ||||
|
U.S. treasuries |
|
$ |
51.9 |
|
$ |
— |
|
$ |
— |
|
$ |
51.9 |
|
|
U.S. agencies |
|
96.0 |
|
— |
|
— |
|
96.0 |
| ||||
|
Municipal bonds and sovereign debt instruments |
|
4.0 |
|
— |
|
— |
|
4.0 |
| ||||
|
Asset-backed securities |
|
70.6 |
|
— |
|
(0.2 |
) |
70.4 |
| ||||
|
Corporate securities |
|
274.1 |
|
0.1 |
|
(0.1 |
) |
274.1 |
| ||||
|
Total debt available-for-sale securities |
|
$ |
496.6 |
|
$ |
0.1 |
|
$ |
(0.3 |
) |
$ |
496.4 |
|
The Company generally classifies debt securities as cash equivalents, short-term investments or other non-current assets based on the stated maturities; however, certain securities with stated maturities of longer than twelve months which are highly liquid and available to support current operations are also classified as short-term investments. As of June 27, 2015, of the total estimated fair value, $33.7 million was classified as cash equivalents, $461.9 million was classified as short-term investments and $0.8 million was classified as other non-current assets.
In addition to the amounts presented above, as of June 27, 2015, the Company’s short-term investments classified as trading securities related to the deferred compensation plan were $3.4 million, of which $0.6 million was invested in debt securities, $0.7 million was invested in money market instruments and funds and $2.1 million was invested in equity securities. Trading securities are reported at fair value, with the unrealized gains or losses resulting from changes in fair value recognized in Interest and other income (expense), net.
The Company recorded no other-than-temporary impairment charges in fiscal 2015, 2014 and 2013.
VIAVI SOLUTIONS INC.
NOTES TO CONSOLIDATED FINANCIAL STATEMENTS (Continued)
As of June 27, 2015, the Company’s total gross unrealized losses on available-for-sale securities, aggregated by type of investment instrument, were as follows (in millions):
|
|
|
Less than 12 |
|
Greater than |
|
Total |
| |||
|
Asset-backed securities |
|
$ |
— |
|
$ |
(0.2 |
) |
$ |
(0.2 |
) |
|
Corporate securities |
|
(0.1 |
) |
— |
|
(0.1 |
) | |||
|
Total gross unrealized losses |
|
$ |
(0.1 |
) |
$ |
(0.2 |
) |
$ |
(0.3 |
) |
As of June 27, 2015, contractual maturities of the Company’s debt securities classified as available-for-sale securities were as follows (in millions):
|
|
|
Amortized |
|
Estimated |
| ||
|
Amounts maturing in less than 1 year |
|
$ |
360.2 |
|
$ |
360.2 |
|
|
Amounts maturing in 1 - 5 years |
|
134.7 |
|
134.7 |
| ||
|
Amounts maturing in more than 5 years |
|
1.7 |
|
1.5 |
| ||
|
Total debt available-for-sale securities |
|
$ |
496.6 |
|
$ |
496.4 |
|
As of June 28, 2014, the Company’s available-for-sale securities were as follows (in millions):
|
|
|
Amortized |
|
Gross Unrealized |
|
Gross Unrealized |
|
Estimated |
| ||||
|
Debt securities: |
|
|
|
|
|
|
|
|
| ||||
|
U.S. treasuries |
|
$ |
36.8 |
|
$ |
— |
|
$ |
— |
|
$ |
36.8 |
|
|
U.S. agencies |
|
70.0 |
|
— |
|
— |
|
70.0 |
| ||||
|
Municipal bonds and sovereign debt instruments |
|
16.8 |
|
— |
|
— |
|
16.8 |
| ||||
|
Asset-backed securities |
|
94.7 |
|
0.1 |
|
(0.2 |
) |
94.6 |
| ||||
|
Corporate securities |
|
370.5 |
|
0.2 |
|
— |
|
370.7 |
| ||||
|
Total debt available-for-sale securities |
|
$ |
588.8 |
|
$ |
0.3 |
|
$ |
(0.2 |
) |
$ |
588.9 |
|
As of June 28, 2014, of the total estimated fair value, $39.8 million was classified as cash equivalents, $548.3 million was classified as short-term investments and $0.8 million was classified as other non-current assets.
In addition to the amounts presented above, as of June 28, 2014, the Company’s short-term investments classified as trading securities, related to the deferred compensation plan, were $3.9 million, of which $0.4 million was invested in debt securities, $0.7 million was invested in money market instruments and funds and $2.8 million was invested in equity securities. Trading securities are reported at fair value, with the unrealized gains or losses resulting from changes in fair value recognized in Interest and other income (expense), net.
As of June 28, 2014, the Company’s total gross unrealized losses on available-for-sale securities, aggregated by type of investment instrument, were as follows (in millions):
|
|
|
Less than 12 |
|
Greater than |
|
Total |
| |||
|
Asset-backed securities |
|
$ |
— |
|
$ |
0.2 |
|
$ |
0.2 |
|
|
Corporate securities |
|
— |
|
— |
|
— |
| |||
|
Total gross unrealized losses |
|
$ |
— |
|
$ |
0.2 |
|
$ |
0.2 |
|
VIAVI SOLUTIONS INC.
NOTES TO CONSOLIDATED FINANCIAL STATEMENTS (Continued)
Fair Value Measurements
Assets measured at fair value as of June 27, 2015 are summarized below (in millions):
|
|
|
Fair value measurement as of |
| |||||||
|
|
|
June 27, 2015 |
| |||||||
|
|
|
Total |
|
Quoted Prices in Active |
|
Significant Other |
| |||
|
Assets: |
|
|
|
|
|
|
| |||
|
Debt available-for-sale securities: |
|
|
|
|
|
|
| |||
|
U.S. treasuries |
|
$ |
51.9 |
|
$ |
51.9 |
|
$ |
— |
|
|
U.S. agencies |
|
96.0 |
|
— |
|
96.0 |
| |||
|
Municipal bonds and sovereign debt instruments |
|
4.0 |
|
— |
|
4.0 |
| |||
|
Asset-backed securities |
|
70.4 |
|
— |
|
70.4 |
| |||
|
Corporate securities |
|
274.1 |
|
— |
|
274.1 |
| |||
|
Total debt available-for-sale securities |
|
496.4 |
|
51.9 |
|
444.5 |
| |||
|
Money market funds |
|
220.6 |
|
220.6 |
|
— |
| |||
|
Trading securities |
|
3.4 |
|
3.4 |
|
— |
| |||
|
Total assets (1) |
|
$ |
720.4 |
|
$ |
275.9 |
|
$ |
444.5 |
|
(1) $225.4 million in cash and cash equivalents, $465.3 million in short-term investments, $25.1 million in restricted cash, and $4.6 million in other non-current assets on the Company’s Consolidated Balance Sheets.
Fair value is defined as the exit price, or the amount that would be received to sell an asset or paid to transfer a liability in an orderly transaction between market participants as of the measurement date. There is an established hierarchy for inputs used in measuring fair value that maximizes the use of observable inputs and minimizes the use of unobservable inputs by requiring the most observable inputs be used when available. Observable inputs are inputs market participants would use in valuing the asset or liability and are developed based on market data obtained from sources independent of the Company. Unobservable inputs are inputs that reflect the assumptions about the factors that market participants would use in valuing the asset or liability.
The Company’s cash and investment instruments are classified within Level 1 or Level 2 of the fair value hierarchy based on quoted prices, broker or dealer quotations, or alternative pricing sources with reasonable levels of price transparency.
· Level 1 includes financial instruments for which quoted market prices for identical instruments are available in active markets. Level 1 assets of the Company include money market funds and U.S. Treasury securities as they are traded with sufficient volume and frequency of transactions.
· Level 2 includes financial instruments for which the valuations are based on quoted prices for similar assets or liabilities, quoted prices in markets that are not active, or other inputs that are observable or can be corroborated by observable data for substantially the full term of the assets or liabilities. Level 2 instruments of the Company generally include certain U.S. and foreign government and agency securities, commercial paper, corporate and municipal bonds and notes, asset-backed securities, and foreign currency forward contracts. To estimate their fair value, the Company utilizes pricing models based on market data. The significant inputs for the valuation model usually include benchmark yields, reported trades, broker and dealer quotes, issuer spreads, two-sided markets, benchmark securities, bids, offers and reference data, and industry and economic events.
· Level 3 includes financial instruments for which fair value is derived from valuation based on inputs that are unobservable and significant to the overall fair value measurement. As of June 27, 2015 and June 28, 2014, the Company did not hold any Level 3 investment securities.
Foreign Currency Forward Contracts
The Company has foreign subsidiaries that operate and sell the Company’s products in various markets around the world. As a result, the Company is exposed to foreign exchange risks. The Company utilizes foreign exchange forward contracts and other instruments to manage foreign currency risk associated with foreign currency denominated monetary assets and liabilities, primarily certain short-term intercompany receivables and payables, and to reduce the volatility of earnings and cash flows related to foreign-currency transactions.
VIAVI SOLUTIONS INC.
NOTES TO CONSOLIDATED FINANCIAL STATEMENTS (Continued)
The forward contracts, most with a term of less than 120 days, were transacted near quarter end; therefore, the fair value of the contracts as of both June 27, 2015 and June 28, 2014 is not significant. The change in the fair value of these foreign currency forward contracts is recorded as gain or loss in the Company’s Consolidated Statements of Operations as a component of Interest and other income (expense), net.
Note 8. Goodwill
The following table presents the changes in goodwill allocated to the reportable segments (in millions):
|
|
|
Network |
|
Service |
|
Communications |
|
Optical Security |
|
Total |
| |||||
|
Balance as of June 29, 2013 (3) |
|
$ |
66.7 |
|
$ |
40.1 |
|
$ |
— |
|
$ |
8.3 |
|
$ |
115.1 |
|
|
Goodwill from Trendium Acquisition (6) |
|
9.0 |
|
5.4 |
|
— |
|
— |
|
14.4 |
| |||||
|
Good will from Network Instruments Acquisitions (6) |
|
78.6 |
|
47.1 |
|
— |
|
— |
|
125.7 |
| |||||
|
Goodwill from Time-Bandwidth Acquisition (6) |
|
— |
|
— |
|
5.8 |
|
— |
|
5.8 |
| |||||
|
Currency Translation and other adjustments |
|
3.7 |
|
2.2 |
|
0.1 |
|
— |
|
6.0 |
| |||||
|
Balance as of June 28, 2014 (4) |
|
$ |
158.0 |
|
$ |
94.8 |
|
$ |
5.9 |
|
$ |
8.3 |
|
$ |
267.0 |
|
|
Currency translation and other adjustments |
|
(3.5 |
) |
(2.1 |
) |
(0.3 |
) |
— |
|
(5.9 |
) | |||||
|
Balance as of June 27, 2015 (5) |
|
$ |
154.5 |
|
$ |
92.7 |
|
$ |
5.6 |
|
$ |
8.3 |
|
$ |
261.1 |
|
(1) In the first quarter of fiscal 2015, the Company reorganized its NSE reportable segment into two separate reportable segments, NE and SE. The goodwill of NSE was allocated between the two new segments based on their relative fair value as of June 29, 2014, the first day of fiscal 2015. The Company determined that based on its cash flow structure, organizational structure and the financial information provided to and reviewed by Management, NE and SE also represented new reporting units for fiscal 2015. Refer to “Note 17. Operating Segments and Geographic Information” for more information.
(2) The goodwill balance as of June 27, 2015 for the CCOP segment relates to the acquisition of Time-Bandwidth and has been allocated to the Lasers reporting unit.
(3) Gross goodwill balances for CCOP, NE, SE and OSP were $5,111.3 million, $368.6 million, $221.3 million and $92.8 million, respectively as of June 29, 2013. Accumulated impairment for CCOP, NE, SE and OSP were $5,111.3 million, $301.9 million, $181.2 million and $84.5 million, respectively as of June 29, 2013.
(4) Gross goodwill balances for CCOP, NE, SE and OSP were $5,117.2 million, $459.9 million, $276.0 million and $92.8 million, respectively as of June 28, 2014. Accumulated impairment for CCOP, NE, SE and OSP were $5,111.3 million, $301.9 million, $181.2 million and $84.5 million, respectively as of June 28, 2014.
(5) Gross goodwill balances for CCOP, NE, SE and OSP were $5,116.9 million, $456.4 million, $273.9 million and $92.8 million, respectively as of June 27, 2015. Accumulated impairment for CCOP, NE, SE and OSP were $5,111.3 million, $301.9 million, $181.2 million and $84.5 million, respectively as of June 27, 2015.
(6) Refer to “Note 5. Mergers and Acquisitions” of Notes to Consolidated Financial Statements for more information.
VIAVI SOLUTIONS INC.
NOTES TO CONSOLIDATED FINANCIAL STATEMENTS (Continued)
The following table presents gross goodwill and accumulated impairment balances for the fiscal years ended June 27, 2015, and June 28, 2014 (in millions):
|
|
|
Years Ended |
| ||||
|
|
|
June 27, 2015 |
|
June 28, 2014 |
| ||
|
Gross goodwill balance |
|
$ |
5,940.0 |
|
$ |
5,945.9 |
|
|
Accumulated impairment losses |
|
(5,678.9 |
) |
(5,678.9 |
) | ||
|
Net goodwill balance |
|
$ |
261.1 |
|
$ |
267.0 |
|
Impairment of Goodwill
The Company reviews goodwill for impairment annually during the fourth quarter of the fiscal year or more frequently if events or circumstances indicate that an impairment loss may have occurred. The Company determined that, based on its cash flow structure, organizational structure and the financial information that is provided to and reviewed by Management for the year ended fiscal 2015, its reporting units are: NE, SE, Optical Communications, Lasers, and OSP. For the year ended fiscal 2014, the Company’s reporting units were: NSE, Optical Communications, Lasers, and OSP. For the year ended fiscal 2013, the Company’s reporting units were: NSE, Optical Communications, Lasers and OSP.
During fiscal 2015, the Company reviewed goodwill for impairment during the first and fourth quarter of the fiscal year as discussed below. The Company reviewed goodwill for impairment during the fourth quarter of fiscal 2014 and 2013 as no triggering events were noted during the interim periods of either fiscal year.
Fiscal 2015
Interim Review
As the Company reorganized its NSE segment into two reportable segments (NE and SE) during the first quarter of fiscal 2015, goodwill allocated to the new NE and SE reporting units was reviewed under the two-step quantitative goodwill impairment test in accordance with the authoritative guidance.
The fair value of the new reporting units was determined based on a combination of the income approach, which estimates the fair value based on the future discounted cash flows, and the market approach, which estimates the fair value based on comparable market prices. Based on the first step of the analysis, the Company determined that the fair value of each reporting unit is significantly above its carrying amount. As such, the Company was not required to perform step two of the analysis. The Company recorded no impairment charge as a result of the interim period impairment test performed during the three months ended September 27, 2014. There were no events or changes in circumstances which triggered an impairment review for the remaining reporting units.
Annual Review
During the fourth quarter the Company reviewed the goodwill of all its reporting units under the qualitative assessment of the authoritative guidance for impairment testing. The Company concluded that it was more likely than not that the fair value of the reporting units that currently have goodwill recorded exceeded its carrying amount. In assessing the qualitative factors, the Company considered the impact of key factors, including: change in industry and competitive environment, market capitalization, earnings multiples, budgeted-to-actual operating performance from prior year, and consolidated company stock price and performance. As such, it was not necessary to perform the two-step goodwill impairment test at this time and hence the Company recorded no impairment charge in accordance with its annual impairment test.
Fiscal 2014
The Company reviewed goodwill under the two-step quantitative goodwill impairment test in accordance with the authoritative guidance. Under the first step of the authoritative guidance for impairment testing, the fair value of the reporting units was determined based on a combination of the income approach, which estimates the fair value based on the future discounted cash flows, and the market approach, which estimates the fair value based on comparable market prices. Based on the first step of the analysis, the Company determined that the fair value of each reporting unit is significantly above its carrying amount. As such, the Company was not required to perform step two of the analysis on any reporting unit to determine the amount of the impairment loss. The Company recorded no impairment charge in accordance with its annual impairment test.
VIAVI SOLUTIONS INC.
NOTES TO CONSOLIDATED FINANCIAL STATEMENTS (Continued)
Fiscal 2013
Under the qualitative assessment of the authoritative guidance for impairment testing, the Company concluded that it was more likely than not that the fair value of the reporting units that currently have goodwill recorded exceeded its carrying amount. In assessing the qualitative factors, the Company considered the impact of these key factors: change in industry and competitive environment, market capitalization, earnings multiples, budgeted-to-actual operating performance from prior year, and consolidated company stock price and performance. As such, it was not necessary to perform the two-step goodwill impairment test at this time and hence the Company recorded no impairment charge in accordance with its annual impairment test.
Note 9. Acquired Developed Technology and Other Intangibles
The following tables present details of the Company’s acquired developed technology, customer relationships and other intangibles (in millions):
|
As of June 27, 2015 |
|
Gross Carrying |
|
Accumulated |
|
Net |
| |||
|
Acquired developed technology |
|
$ |
522.1 |
|
$ |
(455.8 |
) |
$ |
66.3 |
|
|
Customer relationships |
|
185.4 |
|
(142.2 |
) |
43.2 |
| |||
|
Other |
|
22.2 |
|
(21.1 |
) |
1.1 |
| |||
|
Total intangibles subject to amortization |
|
729.7 |
|
(619.1 |
) |
110.6 |
| |||
|
In-process research and development intangibles |
|
1.8 |
|
— |
|
1.8 |
| |||
|
Total intangibles |
|
$ |
731.5 |
|
$ |
(619.1 |
) |
$ |
112.4 |
|
|
As of June 28, 2014 |
|
Gross Carrying |
|
Accumulated |
|
Net |
| |||
|
Acquired developed technology |
|
$ |
548.8 |
|
$ |
(443.1 |
) |
$ |
105.7 |
|
|
Customer relationships |
|
205.2 |
|
(142.3 |
) |
62.9 |
| |||
|
Other |
|
24.2 |
|
(22.1 |
) |
2.1 |
| |||
|
Total intangibles subject to amortization |
|
778.2 |
|
(607.5 |
) |
170.7 |
| |||
|
In-process research and development intangibles |
|
7.1 |
|
— |
|
7.1 |
| |||
|
Total intangibles |
|
$ |
785.3 |
|
$ |
(607.5 |
) |
$ |
177.8 |
|
Other intangibles consist of customer backlog, non-competition agreements, patents, proprietary know-how and trade secrets, trademarks and trade names.
During fiscal 2015, the Company completed its in-process research and development (“IPR&D) project related to the fiscal 2014 acquisition of Network Instruments. Accordingly, $1.7 million was transferred from indefinite life intangible assets to acquired developed technology intangible assets and the Company began amortizing over its useful life of fifty-two months. Also during fiscal 2015, the Company recorded a $3.6 million IPR&D impairment charge for an ongoing project related to the fiscal 2014 acquisition of Trendium in accordance with the authoritative accounting guidance. The charge was recorded to Research and development (“R&D”) expense in the Consolidated Statements of Operations.
During fiscal 2013, the Company approved a strategic plan to exit the low-speed wireline product line within the NE segment and incurred a $2.2 million charge for accelerated amortization of related intangible assets, of which $1.8 million and $0.4 million is included in Amortization of acquired technologies and in Amortization of other intangibles in the Consolidated Statement of Operations, respectively. Also during fiscal 2013, the Company approved a plan to exit the concentrated photovoltaic (“CPV”) product line within CCOP and incurred a $2.6 million charge for accelerated amortization of related intangibles which is included in Amortization of acquired technologies in the Consolidated Statements of Operations.
VIAVI SOLUTIONS INC.
NOTES TO CONSOLIDATED FINANCIAL STATEMENTS (Continued)
During fiscal 2015, 2014 and 2013, the Company recorded $59.2 million, $59.0 million and $76.0 million, respectively, of amortization related to acquired developed technology and other intangibles. The following table presents details of the Company’s amortization (in millions):
|
|
|
Years Ended |
| |||||||
|
|
|
June 27, 2015 |
|
June 28, 2014 |
|
June 29, 2013 |
| |||
|
Cost of sales |
|
$ |
39.4 |
|
$ |
43.2 |
|
$ |
63.3 |
|
|
Operating expense |
|
19.8 |
|
15.8 |
|
12.7 |
| |||
|
Total |
|
$ |
59.2 |
|
$ |
59.0 |
|
$ |
76.0 |
|
Based on the carrying amount of acquired developed technology, customer relationships and other intangibles as of June 27, 2015, and assuming no future impairment of the underlying assets, the estimated future amortization is as follows (in millions):
|
Fiscal Years |
|
|
| |
|
2016 |
|
$ |
38.1 |
|
|
2017 |
|
35.2 |
| |
|
2018 |
|
22.6 |
| |
|
2019 |
|
10.9 |
| |
|
Thereafter |
|
3.8 |
| |
|
Total amortization |
|
$ |
110.6 |
|
Note 10. Debts and Letters of Credit
As of June 27, 2015 and June 28, 2014, the Company’s long-term debt on the Consolidated Balance Sheets represented the carrying amount of the liability component of the 0.625% Senior Convertible Notes as discussed below. The following table presents the carrying amounts of the liability and equity components (in millions):
|
|
|
June 27, 2015 |
|
June 28, 2014 |
| ||
|
Principal amount of 0.625% Senior Convertible Notes |
|
$ |
650.0 |
|
$ |
650.0 |
|
|
Unamortized discount of liability component |
|
(88.4 |
) |
(113.7 |
) | ||
|
Carrying amount of liability component |
|
$ |
561.6 |
|
$ |
536.3 |
|
|
|
|
|
|
|
| ||
|
Carrying amount of equity component (1) |
|
$ |
134.4 |
|
$ |
134.4 |
|
(1) Included in Accumulated paid-in-capital on the Consolidated Balance Sheets.
The Company was in compliance with all debt covenants as of June 27, 2015.
0.625% Senior Convertible Notes
On August 21, 2013, the Company issued $650.0 million aggregate principal amount of 0.625% Senior Convertible Notes due 2033 in a private offering to qualified institutional buyers pursuant to Rule 144A under the Securities Act of 1933, as amended. The proceeds from the 2033 Notes amounted to $636.3 million after issuance costs. The 2033 Notes are an unsecured obligation of the Company and bear interest at an annual rate of 0.625% payable in cash semi-annually in arrears on February 15 and August 15 of each year. The 2033 Notes mature on August 15, 2033 unless earlier converted, redeemed or repurchased.
Under certain circumstances and during certain periods, the 2033 Notes may be converted at the option of the holders into cash up to the principal amount, with the remaining amount converted into cash, shares of the Company’s common stock, or a combination of cash and shares of the Company’s common stock at the Company’s election. The initial conversion price is $18.83 per share, representing a 40.0% premium to the closing sale price of the Company’s common stock on the pricing date, August 15, 2013, which will be subject to customary anti-dilution adjustments. Holders may convert the 2033 Notes at any time on or prior to the close of business on the business day immediately preceding February 15, 2033, and other than during the period from, and including, February 15, 2018 until the close of business on the business day immediately preceding August 20, 2018, in multiples of $1,000 principal amount, under the following circumstances:
VIAVI SOLUTIONS INC.
NOTES TO CONSOLIDATED FINANCIAL STATEMENTS (Continued)
· on any date during any calendar quarter beginning after December 31, 2013 (and only during such calendar quarter) if the closing price of the Company’s common stock was more than 130% of the then current conversion price for at least 20 trading days during the 30 consecutive trading-day period ending the last trading day of the previous calendar quarter;
· if the 2033 Notes are called for redemption;
· upon the occurrence of specified corporate events;
· if the Company is party to a specified transaction, a fundamental change or a make-whole fundamental change (each as defined in the indenture of the 2033 Notes); or
· during the five consecutive business-day period immediately following any 10 consecutive trading-day period in which the trading price per $1,000 principal amount of the 2033 Notes for each day of such 10 consecutive trading-day period was less than 98% of the product of the closing sale price of the Company’s common stock and the applicable conversion rate on such date.
During the periods from, and including, February 15, 2018 until the close of business on the business day immediately preceding August 20, 2018 and from, and including, February 15, 2033 until the close of business on the business day immediately preceding the maturity date, holders may convert the 2033 Notes at any time, regardless of the foregoing circumstances.
In the fourth quarter of fiscal 2015, holders of the 2033 Notes were given notice of the planned separation of the Lumentum business and the right to convert any debentures they own from the date of notice through the end of the business day preceding the ex-dividend date. No holders of the 2033 Notes exercised the conversion right before it expired. Following the separation of the Lumentum business on August 1, 2015, the conversion price per share was adjusted pursuant to the terms of the 2033 Notes relating to the occurrence of a spin-off event. Effective as of the end of the business day on August 17, 2015, the initial conversion price per share was adjusted to $11.28 per share of the Company’s common stock traded on NASDAQ under the ticker symbol “VIAV.”
Holders of the 2033 Notes may require the Company to purchase all or a portion of the 2033 Notes on each of August 15, 2018, August 15, 2023 and August 15, 2028, or upon the occurrence of a fundamental change, in each case, at a price equal to 100% of the principal amount of the 2033 Notes to be purchased, plus accrued and unpaid interest to, but excluding the purchase date. The Company may redeem all or a portion of the 2033 Notes for cash at any time on or after August 20, 2018, at a redemption price equal to 100% of the principal amount of the 2033 Notes to be redeemed, plus accrued and unpaid interest to, but excluding, the redemption date.
In accordance with the authoritative accounting guidance, the Company separated the 2033 Notes into liability and equity components. The carrying value of the liability component at issuance was calculated as the present value of its cash flows using a discount rate of 5.4% based on the 5-year swap rate plus credit spread as of the issuance date. The credit spread for the Company is based on the historical average “yield to worst” rate for BB rated issuers. The difference between the 2033 Notes principal and the carrying value of the liability component, representing the value of conversion premium assigned to the equity component, was recorded as a debt discount on the issuance date and is being accreted using the effective interest rate of 5.4% over the period from the issuance date through August 15, 2018 as a non-cash charge to interest expense. The carrying value of the liability component was determined to be $515.6 million, and the equity component, or debt discount, of the 2033 Notes was determined to be $134.4 million. As of June 27, 2015, the expected remaining term of the 2033 Notes is 3.1 years.
In connection with the issuance of the 2033 Notes, the Company incurred $13.7 million of issuance costs, which were bifurcated into the debt issuance costs, attributable to the liability component of $10.9 million and the equity issuance costs, attributable to the equity component of $2.8 million based on their relative values. The debt issuance costs were capitalized and are being amortized to interest expense using the effective interest rate method from issuance date through August 15, 2018. The equity issuance costs were netted against the equity component in additional paid-in capital at the issuance date. As of June 27, 2015, the unamortized portion of the debt issuance costs related to the 2033 Notes was $7.2 million, which was included in Other non-current assets on the Consolidated Balance Sheets.
Based on quoted market prices as of June 27, 2015 and June 28, 2014, the fair market value of the 2033 Notes was approximately $644.0 million and $653.0 million. The 2033 Notes are classified within Level 2 as they are not actively traded in markets.
VIAVI SOLUTIONS INC.
NOTES TO CONSOLIDATED FINANCIAL STATEMENTS (Continued)
The following table presents the effective interest rate and the interest expense for the contractual interest and the accretion of debt discount (in millions, except for the effective interest rate):
|
|
|
Year Ended |
| ||||
|
|
|
June 27, 2015 |
|
June 28, 2014 |
| ||
|
Effective interest rate |
|
5.4 |
% |
5.4 |
% | ||
|
Interest expense-contractual interest |
|
$ |
4.1 |
|
$ |
3.5 |
|
|
Accretion of debt discount |
|
25.3 |
|
20.7 |
| ||
1% Senior Convertible Notes
On June 5, 2006, the Company completed an offering of $425.0 million aggregate principal amount of 1% Senior Convertible Notes due 2026. Proceeds from the notes amounted to $415.9 million after issuance costs. The notes bore interest at a rate of 1.0% per year and were convertible into a combination of cash and shares of the Company’s common stock at a conversion price of $30.30 per share.
In accordance with the authoritative guidance which applies to the 2026 Notes, the Company calculated the carrying value of the liability component at issuance as the present value of its cash flows using a discount rate of 8.1%, based on the 7-year swap rate plus credit spread as of the issuance date. The carrying value of the liability component was determined to be $266.5 million. The equity component, or debt discount, of the notes was determined to be $158.5 million. The debt discount was accreted using the effective interest rate of 8.1% over the period from issuance date through May 15, 2013 as a non-cash charge to interest expense.
During fiscal 2013, the Company recognized the contractual interest expense of $1.8 million and accreted debt discount of $12.0 million. Between fiscal 2009 and fiscal 2013, the Company repurchased or redeemed $425.0 million aggregate principal amount of notes. The increase of the debt related to the interest accretion is treated as a non-cash transaction and the repayment of the carrying amount of the debt is classified as financing activity within the Consolidated Statements of Cash Flows. As of June 27, 2015 and June 28, 2014, there was no outstanding balance.
Revolving Credit Facility
On August 21, 2013, in addition to the close of the 2033 Notes offering, the Company terminated its existing $250.0 million revolving credit facility, which had no amounts outstanding upon termination. The $1.3 million of unamortized debt issuance costs was fully amortized to interest expense upon termination in the first quarter of fiscal 2014.
Outstanding Letters of Credit
As of June 27, 2015, the Company had 11 standby letters of credit totaling $29.0 million.
Note 11. Restructuring and Related Charges
The Company has initiated various strategic restructuring events primarily intended to reduce its costs, consolidate its operations, rationalize the manufacturing of its products and align its businesses in response to market conditions. As of June 27, 2015, the Company’s total restructuring accrual was $32.1 million. During fiscal 2015, 2014 and 2013 the Company recorded $34.5 million, $23.8 million and $19.0 million, respectively, in restructuring and related charges. The Company’s restructuring charges can include severance and benefit costs to eliminate a specified number of positions, facilities and equipment costs to vacate facilities and consolidate operations, and lease termination costs. The timing of associated cash payments is dependent upon the type of restructuring charge and can extend over multiple periods.
VIAVI SOLUTIONS INC.
NOTES TO CONSOLIDATED FINANCIAL STATEMENTS (Continued)
Summary of Restructuring Plans
The adjustments to the accrued restructuring expenses related to all of the Company’s restructuring plans described below for the year ended June 27, 2015 were as follows (in millions):
|
|
|
Balance |
|
Fiscal Year |
|
Cash |
|
Non-cash |
|
Balance |
| |||||
|
Fiscal 2015 Plan |
|
|
|
|
|
|
|
|
|
|
| |||||
|
NE, SE and Shared Service Separation Restructuring Plan (Workforce Reduction) |
|
$ |
— |
|
$ |
24.9 |
|
$ |
(9.8 |
) |
$ |
(0.2 |
) |
$ |
14.9 |
|
|
CCOP Separation Restructuring Plan (Workforce Reduction) |
|
— |
|
5.1 |
|
(0.5 |
) |
— |
|
4.6 |
| |||||
|
CCOP Robbinsville Closure Plan: |
|
|
|
|
|
|
|
|
|
|
| |||||
|
Workforce Reduction |
|
— |
|
1.5 |
|
(1.5 |
) |
— |
|
— |
| |||||
|
Lease Costs |
|
— |
|
0.1 |
|
(0.1 |
) |
— |
|
— |
| |||||
|
Transfer Costs |
|
— |
|
0.1 |
|
(0.1 |
) |
— |
|
— |
| |||||
|
Total CCOP Robbinsville Restructuring Plan |
|
— |
|
1.7 |
|
(1.7 |
) |
— |
|
— |
| |||||
|
Fiscal 2014 Plans |
|
|
|
|
|
|
|
|
|
|
| |||||
|
NE Realignment Plan (Workforce Reduction) |
|
4.6 |
|
0.3 |
|
(4.2 |
) |
(0.1 |
) |
0.6 |
| |||||
|
CCOP Serangoon Closure Plan |
|
|
|
|
|
|
|
|
|
|
| |||||
|
Workforce Reduction |
|
1.7 |
|
0.1 |
|
(1.8 |
) |
— |
|
— |
| |||||
|
Lease Costs |
|
— |
|
0.3 |
|
(0.3 |
) |
— |
|
— |
| |||||
|
Total CCOP Serangoon Closure Plan |
|
1.7 |
|
0.4 |
|
(2.1 |
) |
— |
|
— |
| |||||
|
Shared Services Restructuring Plan (Workforce Reduction) |
|
1.8 |
|
0.1 |
|
(1.2 |
) |
— |
|
0.7 |
| |||||
|
NE Product Strategy Restructuring Plan (Workforce Reduction) |
|
4.4 |
|
0.4 |
|
(1.9 |
) |
(0.6 |
) |
2.3 |
| |||||
|
NE Lease Restructuring Plan (first floor) |
|
6.9 |
|
0.6 |
|
(2.3 |
) |
— |
|
5.2 |
| |||||
|
Central Finance and IT Restructuring Plan (Workforce Reduction) |
|
1.5 |
|
— |
|
(0.1 |
) |
(0.3 |
) |
1.1 |
| |||||
|
Fiscal 2013 Plans |
|
|
|
|
|
|
|
|
|
|
| |||||
|
NE Lease Restructuring Plan |
|
2.1 |
|
(0.1 |
) |
(0.5 |
) |
— |
|
1.5 |
| |||||
|
Other plans |
|
0.7 |
|
0.6 |
|
(1.0 |
) |
— |
|
0.3 |
| |||||
|
Plans Prior to Fiscal 2013 |
|
2.5 |
|
0.5 |
|
(1.8 |
) |
(0.3 |
) |
0.9 |
| |||||
|
Total |
|
$ |
26.2 |
|
$ |
34.5 |
|
$ |
(27.1 |
) |
$ |
(1.5 |
) |
$ |
32.1 |
|
|
|
|
|
|
|
|
|
|
|
|
|
| |||||
|
Ottawa Lease Exit Costs |
|
$ |
3.1 |
|
$ |
(0.7 |
) |
$ |
(1.0 |
) |
$ |
(0.3 |
) |
$ |
1.1 |
|
As of June 27, 2015 and June 28, 2014, $9.8 million and $11.7 million, respectively, of our restructuring liability was long-term in nature and included as a component of Other non-current liabilities, with the remaining short-term portion included as a component of Other current liabilities on the Consolidated Balance Sheets.
The Company had also previously recorded lease exit charges, net of assumed sub-lease income in prior fiscal years related to its Ottawa facility that was included in SG&A expenses. The fair value of the remaining contractual obligations, net of sublease income, was $1.1 million and $3.1 million as of June 27, 2015 and June 28, 2014, respectively. The Company included the long-term portion of the contract obligations of $0.5 million and $2.0 million in Other non-current liabilities as of each period end, and the short-term portion in Other current liabilities on the Consolidated Balance Sheets. The payments related to these lease costs are expected to be paid by the end of the third quarter of fiscal 2018.
VIAVI SOLUTIONS INC.
NOTES TO CONSOLIDATED FINANCIAL STATEMENTS (Continued)
Fiscal 2015 Plans
NE, SE and Shared Service Separation Restructuring Plan
During the second, third and fourth quarters of fiscal 2015, Management approved a plan to eliminate certain positions in its shared services functions in connection with the Company’s plan to split into two separate public companies. Further, Management consolidated its operations, sales and R&D organization and eliminated positions within the NE and SE segments to align to the Company’s product market strategy and lower manufacturing costs in connection with the separation. As a result, a restructuring charge of $24.9 million was recorded for severance and employee benefits during fiscal 2015. In total approximately 400 employees in manufacturing, R&D and SG&A functions located in North America, Latin America, Europe and Asia were impacted. Payments related to the remaining severance and benefits accrual are expected to be paid by the end of the third quarter of fiscal 2018.
CCOP Separation Restructuring Plan
During the second and fourth quarter of fiscal 2015, Management approved a CCOP plan to optimize operations and gain efficiencies by closing the Bloomfield, Connecticut site and consolidating roles and responsibilities across functions in connection with the separation plan. As a result, a restructuring charge of $5.1 million was recorded for severance and employee benefits during fiscal 2015. In total approximately 200 employees in manufacturing, R&D and SG&A functions located in North America, Europe and Asia were impacted. Payments related to the remaining severance and benefits accrual are expected to be paid by the end of the second quarter of fiscal 2017.
CCOP Robbinsville Closure Plan
During the first quarter of fiscal 2015, Management approved a CCOP plan to optimize operations and gain efficiencies by closing the Robbinsville, New Jersey site and consolidating roles and responsibilities across North America. As a result, a restructuring charge of $1.5 million was recorded for severance and benefits during fiscal 2015. In total approximately 30 employees in manufacturing, R&D and SG&A functions located in North America were impacted. Payments related to the remaining severance and benefits accrual are expected to be paid by the end of the first quarter of fiscal 2016.
Fiscal 2014 Plans
NE Realignment Plan
During the fourth quarter of fiscal 2014, Management approved a NE plan to realign its operations and strategy to allow for greater investment in high-growth areas. As a result, approximately 100 employees in manufacturing, R&D and SG&A functions located in United States, Asia and Europe were impacted. Payments related to the remaining severance and benefits accrual are expected to be paid by the end of the second quarter of fiscal 2016.
CCOP Serangoon Closure Plan
During the fourth quarter of fiscal 2014, Management approved a CCOP plan to close the Serangoon office located in Singapore and move to a lower cost region in order to reduce manufacturing and R&D expenses. As a result, approximately 40 employees primarily in manufacturing and R&D functions were impacted. Payments related to the remaining severance and benefits accrual were paid by the end of the fourth quarter of fiscal 2015.
Shared Services Restructuring Plan
During the fourth quarter of fiscal 2014, Management approved a plan to eliminate positions and re-define roles and responsibilities in its shared services functions in order to reduce cost, standardize global processes and establish a more efficient organization. As a result, approximately 40 employees primarily in the general and administrative functions located in the United States, Asia and Europe were impacted. Payments related to the remaining severance and benefits accrual are expected to be paid by the end of the second quarter of fiscal 2016.
NE Product Strategy Restructuring Plan
During the third quarter of fiscal 2014, Management approved a NE plan to realign its services, support and product resources in response to market conditions in the mobile assurance market and to increase focus on software products and next generation solutions through acquisitions and R&D. As a result, approximately 60 employees primarily in SG&A and manufacturing functions located in North America, Latin America, Asia and Europe were impacted. Payments related to the remaining severance and benefits accrual are expected to be paid by the end of the first quarter of fiscal 2020.
VIAVI SOLUTIONS INC.
NOTES TO CONSOLIDATED FINANCIAL STATEMENTS (Continued)
NE Lease Restructuring Plan (first floor)
During the second quarter of fiscal 2014, Management approved a NE plan to exit the remaining space in Germantown, Maryland. As of June 28, 2014, the Company exited the space in Germantown under the plan. The fair value of the remaining contractual obligations, net of sublease income, as of June 27, 2015 was $5.2 million. Payments related to the Germantown lease costs are expected to be paid by the end of the second quarter of fiscal 2019.
Central Finance and Information Technology (“IT”) Restructuring Plan
During the second quarter of fiscal 2014, Management approved a plan to eliminate positions and re-define roles and responsibilities in the Finance and IT organization to align with the future state of the organizations under new executive management and move positions to lower-cost locations where appropriate. As a result, approximately 20 employees primarily in SG&A functions located in North America, Asia and Europe were impacted. Payments related to the remaining severance and benefits accrual are expected to be paid by the end of the third quarter of fiscal 2022.
Fiscal 2013 Plans
NE Lease Restructuring Plan
During the fourth quarter of fiscal 2013, Management approved a plan to consolidate space in Germantown, Maryland and Beijing, China, primarily used by the NE segment. As of June 29, 2013, the Company exited the second floor space in Germantown and Beijing under the plan. The fair value of the remaining contractual obligations, net of sublease income as of June 27, 2015 was $1.5 million. Payments related to the Germantown lease costs are expected to be paid by the end of the second quarter of fiscal 2019. Final payments related to the Beijing lease costs were paid during the first quarter of fiscal 2014.
Other Plans
Other plans account for an immaterial portion of the total restructuring accrual, with minimal or no revisions recorded.
Plans Prior to Fiscal 2013
The restructuring accrual for plans that commenced prior to fiscal year 2013 was $0.9 million, which consists of immaterial various restructuring plans that commenced prior to fiscal 2013.
Note 12. Income Taxes
The Company’s income (loss) before income taxes consisted of the following (in millions):
|
|
|
Years Ended |
| |||||||
|
|
|
June 27, 2015 |
|
June 28, 2014 |
|
June 29, 2013 |
| |||
|
Domestic |
|
$ |
(184.9 |
) |
$ |
(87.9 |
) |
$ |
(98.8 |
) |
|
Foreign |
|
102.0 |
|
57.1 |
|
51.9 |
| |||
|
(Loss) income before income taxes |
|
$ |
(82.9 |
) |
$ |
(30.8 |
) |
$ |
(46.9 |
) |
VIAVI SOLUTIONS INC.
NOTES TO CONSOLIDATED FINANCIAL STATEMENTS (Continued)
The Company’s income tax expense (benefit) consisted of the following (in millions):
|
|
|
Years Ended |
| |||||||
|
|
|
June 27, 2015 |
|
June 28, 2014 |
|
June 29, 2013 |
| |||
|
Federal: |
|
|
|
|
|
|
| |||
|
Current |
|
$ |
— |
|
$ |
(0.5 |
) |
$ |
— |
|
|
Deferred |
|
2.3 |
|
(4.5 |
) |
(0.7 |
) | |||
|
|
|
2.3 |
|
(5.0 |
) |
(0.7 |
) | |||
|
State: |
|
|
|
|
|
|
| |||
|
Current |
|
— |
|
— |
|
— |
| |||
|
Deferred |
|
0.1 |
|
(0.2 |
) |
— |
| |||
|
|
|
0.1 |
|
(0.2 |
) |
— |
| |||
|
Foreign: |
|
|
|
|
|
|
| |||
|
Current |
|
(2.7 |
) |
18.2 |
|
18.4 |
| |||
|
Deferred |
|
5.5 |
|
(26.1 |
) |
(121.6 |
) | |||
|
|
|
2.8 |
|
(7.9 |
) |
(103.2 |
) | |||
|
Total income tax (benefit) expense |
|
$ |
5.2 |
|
$ |
(13.1 |
) |
$ |
(103.9 |
) |
The federal deferred tax expense primarily relates to the amortization of tax deductible goodwill. The foreign current benefit relates to the Company’s profitable operations in certain foreign jurisdictions and offset by a $21.8 million tax benefit recognized upon the settlement of an audit in a non-U.S. jurisdiction. The foreign deferred tax expense primarily relates to the use of net operating losses in profitable foreign jurisdictions.
There was no material tax benefit associated with exercise of stock options for the fiscal years ended June 27, 2015, June 28, 2014 and June 29, 2013.
A reconciliation of the Company’s income tax expense (benefit) at the federal statutory rate to the income tax expense (benefit) at the effective tax rate is as follows (in millions):
|
|
|
Years Ended |
| |||||||
|
|
|
June 27, 2015 |
|
June 28, 2014 |
|
June 29, 2013 |
| |||
|
Income tax (benefit) expense computed at federal statutory rate |
|
$ |
(29.0 |
) |
$ |
(10.8 |
) |
$ |
(16.4 |
) |
|
Foreign rate differential |
|
(2.3 |
) |
(1.8 |
) |
(2.4 |
) | |||
|
Valuation allowance |
|
37.3 |
|
24.2 |
|
(84.5 |
) | |||
|
Statute expiration |
|
|
|
(21.7 |
) |
— |
| |||
|
Reversal of previously accrued taxes |
|
(22.6 |
) |
(1.0 |
) |
(0.7 |
) | |||
|
Research and experimentation benefits and other tax credits |
|
(4.7 |
) |
(5.0 |
) |
(3.2 |
) | |||
|
Permanent items |
|
22.8 |
|
7.6 |
|
4.4 |
| |||
|
Other |
|
3.7 |
|
(4.6 |
) |
(1.1 |
) | |||
|
Income tax (benefit) expense |
|
$ |
5.2 |
|
$ |
(13.1 |
) |
$ |
(103.9 |
) |
VIAVI SOLUTIONS INC.
NOTES TO CONSOLIDATED FINANCIAL STATEMENTS (Continued)
The components of the Company’s net deferred taxes consisted of the following (in millions):
|
|
|
Years Ended |
| |||||||
|
|
|
June 27, 2015 |
|
June 28, 2014 |
|
June 29, 2013 |
| |||
|
Gross deferred tax assets: |
|
|
|
|
|
|
| |||
|
Tax credit carryforwards |
|
$ |
172.9 |
|
$ |
158.6 |
|
$ |
150.1 |
|
|
Net operating loss carryforwards |
|
2,281.5 |
|
2,346.1 |
|
2,303.0 |
| |||
|
Inventories |
|
14.4 |
|
13.0 |
|
16.3 |
| |||
|
Accruals and reserves |
|
34.2 |
|
48.2 |
|
41.8 |
| |||
|
Other |
|
115.8 |
|
121.1 |
|
127.7 |
| |||
|
Acquisition-related items |
|
89.3 |
|
86.8 |
|
95.9 |
| |||
|
Gross deferred tax assets |
|
2,708.1 |
|
2,773.8 |
|
2,734.8 |
| |||
|
Valuation allowance |
|
(2,488.1 |
) |
(2,499.8 |
) |
(2,549.1 |
) | |||
|
Deferred tax assets |
|
220.0 |
|
274.0 |
|
185.7 |
| |||
|
Gross deferred tax liabilities: |
|
|
|
|
|
|
| |||
|
Acquisition-related items |
|
(27.6 |
) |
(40.4 |
) |
(26.5 |
) | |||
|
Undistributed foreign earnings |
|
(7.2 |
) |
(6.6 |
) |
(8.3 |
) | |||
|
Other |
|
(45.6 |
) |
(50.2 |
) |
(3.5 |
) | |||
|
Deferred tax liabilities |
|
(80.4 |
) |
(97.2 |
) |
(38.3 |
) | |||
|
Total net deferred tax assets (liabilities) |
|
$ |
139.6 |
|
$ |
176.8 |
|
$ |
147.4 |
|
As of June 27, 2015, the Company had federal, state and foreign tax net operating loss carryforwards of $6,141.6 million, $1,098.4 million and $730.4 million, respectively, and federal, state and foreign research and other tax credit carryforwards of $92.2 million, $39.0 million and $41.2 million, respectively. Of this amount, approximately $106.4 million when realized will be credited to additional paid-in capital. The Company’s policy is to account for the utilization of tax attributes under a with-and-without approach. The tax net operating loss and tax credit carryforwards will start to expire in 2016 and at various other dates through 2035 if not utilized. Utilization of the tax net operating losses may be subject to a substantial annual limitation due to the ownership change limitations provided by the Internal Revenue Code and similar state and foreign provisions. Loss carryforward limitations may result in the expiration or reduced utilization of a portion of the Company’s net operating losses.
U.S. income and foreign withholding taxes associated with the repatriation of earnings of foreign subsidiaries have not been provided on $273.1 million of undistributed earnings for certain foreign subsidiaries. The Company intends to reinvest these earnings indefinitely outside of the United States. The Company estimates that an additional $14.2 million of U.S. income or foreign withholding taxes would have to be provided if these earnings were repatriated back to the U.S.
The valuation allowance decreased by $11.7 million in fiscal 2015, decreased by $49.3 million in fiscal 2014, and decreased by $87.9 million in fiscal 2013. The decrease during fiscal 2015 was primarily related to the decrease in the deferred tax assets as a result of the use and expiration of foreign net operating losses. The decrease during fiscal 2014 was primarily related to an increase in acquisition and debt issuance related deferred tax liabilities. The decrease during fiscal 2013 was primarily due to the release of deferred tax valuation allowance for non-US. jurisdictions.
Approximately $514.7 million of the valuation allowance as of June 27, 2015 was attributable to pre-fiscal 2006 windfall stock option deductions, the benefit of which will be credited to paid-in-capital if and when realized through a reduction in income tax payable. Beginning with fiscal 2006, the Company began to track the windfall stock option deductions off-balance sheet. If and when realized, the tax benefit associated with those deductions will be credited to additional paid-in-capital.
During fiscal 2014, the Company recognized $21.7 million of uncertain tax benefits related to deferred tax assets due to the expiration of the statute of limitations in a non-US jurisdiction. In addition, the Company recorded a tax benefit of $6.4 million related to the income tax intraperiod tax allocation rules in relation to other comprehensive income.
VIAVI SOLUTIONS INC.
NOTES TO CONSOLIDATED FINANCIAL STATEMENTS (Continued)
During fiscal 2013, the Company determined that it was more likely than not that the deferred tax assets of a subsidiary in a non-U.S. jurisdiction (the “foreign subsidiary”) would be realized after considering all positive and negative evidence. Prior to fiscal 2013, because of significant negative evidence including principally continued economic uncertainty in the industry in the foreign jurisdiction specifically and reorganization activity that would adversely affect the foreign subsidiary’s future operations and profitability on a continuing basis in future years, the Company determined that it was more likely than not that the deferred tax assets would not be realized. However, during fiscal 2013, the foreign subsidiary had realized cumulative pre-tax income for the preceding three years and had forecasted future pre-tax income sufficient to realize its deferred tax assets. Upon considering the relative impact of all evidence, both negative and positive, and the weight accorded to each, the Company concluded that it was more likely than not that the deferred tax assets of the foreign subsidiary would be realized and that the applicable valuation allowance should be released.
Accordingly, a net deferred tax valuation allowance release of $107.9 million was recorded as an income tax benefit during the year. The Company’s conclusion that it is more likely than not that the deferred tax assets will be realized is strongly influenced by its forecast of the foreign subsidiary’s future taxable income. The Company believes its forecast of the foreign subsidiary’s future taxable income is reasonable; however, it is inherently uncertain. Therefore, if the foreign subsidiary realizes material unforeseen losses, then its ability to realize the deferred tax assets may become uncertain and an additional charge to increase the valuation allowance may be recorded.
A reconciliation of unrecognized tax benefits between June 30, 2012 and June 27, 2015 is as follows (in millions):
|
Balance at June 30, 2012 |
|
$ |
61.3 |
|
|
Additions based on tax positions related to current year |
|
23.7 |
| |
|
Reductions for lapse of statute of limitations or for audit settlements |
|
(1.2 |
) | |
|
Reductions due to foreign currency rate fluctuations |
|
(0.7 |
) | |
|
Reductions based on ITC expiration |
|
(2.4 |
) | |
|
Balance at June 29, 2013 |
|
80.7 |
| |
|
Additions based on tax positions related to current year |
|
3.2 |
| |
|
Additions due to foreign currency rate fluctuation |
|
0.6 |
| |
|
Reductions for lapse of statute of limitations |
|
(21.7 |
) | |
|
Reductions based on state credit expiration |
|
(1.7 |
) | |
|
Reductions based on the tax positions related to the prior year |
|
(0.8 |
) | |
|
Balance at June 28, 2014 |
|
60.3 |
| |
|
Additions based on tax positions related to current year |
|
2.3 |
| |
|
Reductions for lapse of statute of limitations |
|
(3.3 |
) | |
|
Reductions due to foreign currency rate fluctuations |
|
(3.2 |
) | |
|
Reductions based on the tax positions related to the prior year |
|
(18.7 |
) | |
|
Balance at June 27, 2015 |
|
$ |
37.4 |
|
The unrecognized tax benefits relate primarily to the allocations of revenue and costs among the Company’s global operations and the validity of some U.S. tax credits. In addition, utilization of the Company’s tax net operating losses may be subject to a substantial annual limitation due to the ownership change limitations provided by the Internal Revenue Code and similar state and foreign provisions. As a result, loss carryforward limitations may result in the expiration or reduced utilization of a portion of the Company’s net operating losses.
Included in the balance of unrecognized tax benefits at June 27, 2015 are $3.5 million of tax benefits that, if recognized, would impact the effective tax rate. Also included in the balance of unrecognized tax benefits at June 27, 2015 are $33.9 million of tax benefits that, if recognized, would result in adjustments to the valuation allowance.
The Company’s policy is to recognize accrued interest and penalties related to unrecognized tax benefits within the income tax provision. The amount of interest and penalties accrued as of June 27, 2015 and June 28, 2014 was approximately $1.6 million and $24.8 million, respectively. During fiscal 2015, the Company’s accrued interest and penalties decreased by $23.2 million primarily relating to the settlement of an audit in a non-US jurisdiction.
VIAVI SOLUTIONS INC.
NOTES TO CONSOLIDATED FINANCIAL STATEMENTS (Continued)
The Company is routinely subject to various federal, state and foreign audits by taxing authorities. The Company believes that adequate amounts have been provided for any adjustments that may result from these examinations.
The following table summarizes the Company’s major tax jurisdictions and the tax years that remain subject to examination by such jurisdictions as of June 27, 2015:
|
Tax Jurisdictions |
|
Tax Years |
|
|
United States |
|
2011 and onward |
|
|
Canada |
|
2008 and onward |
|
|
China |
|
2010 and onward |
|
|
France |
|
2010 and onward |
|
|
Germany |
|
2010 and onward |
|
|
Korea |
|
2010 and onward |
|
|
United Kingdom |
|
2009 and onward |
|
Note 13. Stockholders’ Equity
Repurchase of Common Stock
During fiscal 2014, the Company repurchased 7.4 million shares of its outstanding common stock at $13.45 per share in privately negotiated transactions concurrently with the issuance of its 2033 Notes. The repurchases were not made pursuant to any plan or program. The total purchase price of $100.0 million was reflected as a decrease to common stock based on the stated par value per share with the remainder charged to accumulated deficit.
On May 21, 2014, the Company’s Board of Directors authorized a stock repurchase program under which the Company may purchase shares of its common stock worth up to an aggregate purchase price of $100.0 million through open market or private transactions between May 27, 2014 and June 27, 2015. During the fourth quarter of fiscal 2014, the Company repurchased approximately 4.9 million shares of common stock in open market purchases at an average price of $11.37 per share. During the first quarter of fiscal 2015, the Company repurchased approximately 0.4 million shares of common stock in open market purchases at an average price of $11.93 per share. The total purchase price of these repurchases under the stock repurchase program of $60.0 million was reflected as a decrease to common stock based on the stated par value per share with the remainder charged to accumulated deficit.
All common shares repurchased during fiscal 2014 and 2015 have been canceled and retired.
Preferred Stock
The Company’s Board of Directors has authority to issue up to 1,000,000 shares of undesignated preferred stock and to determine the powers, preferences and rights and the qualifications, limitations or restrictions granted to or imposed upon any wholly unissued shares of undesignated preferred stock and to fix the number of shares constituting any series and the designation of such series, without the consent of the Company’s stockholders. The preferred stock could be issued with voting, liquidation, dividend and other rights superior to those of the holders of common stock. The issuance of any preferred stock subsequently issued by the Company’s Board of Directors, under some circumstances, could have the effect of delaying, deferring or preventing a change in control.
Exchangeable Shares of JDS Uniphase Canada Ltd.
On March 31, 2014 (“the Redemption Date”), the Company exercised its right to redeem 3,157,445 million outstanding exchangeable shares of JDS Uniphase Canada Ltd (“Exchangeable Shares”). On the Redemption Date, holders of Exchangeable Shares were entitled to receive one share of the Company’s common stock in exchange for each Exchangeable Share held. There were no Exchangeable Shares issued and outstanding as of June 27, 2015 and June 28, 2014, respectively.
VIAVI SOLUTIONS INC.
NOTES TO CONSOLIDATED FINANCIAL STATEMENTS (Continued)
Note 14. Stock-Based Compensation
Stock-Based Benefit Plans
Stock Option Plans
As of June 27, 2015, the Company had 11.3 million shares of stock options and Full Value Awards issued and outstanding to employees and directors under the Restated 2005 Acquisition Equity Incentive Plan (“the 2005 Plan”), Restated 2003 Equity Incentive Plan (“the 2003 Plan”) and various other plans the Company assumed through acquisitions. The exercise price for stock options is equal to the fair value of the underlying stock at the date of grant. The Company issues new shares of common stock upon exercise of stock options. Options generally become exercisable over a three-year or four-year period and, if not exercised, expire from five to ten years after the date of grant.
On November 14, 2012, the Company’s shareholders approved two amendments to the 2003 Plan. The first amendment increased the number of shares that may be issued under this plan by 10,000,000 shares. The second amendment extended the 2003 Plan’s terms for an additional ten year period after the date of approval of the amendment. On December 5, 2014, the Company’s shareholders approved another amendment to the 2003 Plan to increase the number of shares that may be issued under the plan by 9,000,000 shares.
As of June 27, 2015, 10.8 million shares of common stock, primarily under the 2003 Plan and the 2005 Plan, were available for grant.
Employee Stock Purchase Plans
In June 1998, the Company adopted the 1998 Employee Stock Purchase Plan, as amended (the “1998 Purchase Plan”). The 1998 Purchase Plan, which became effective August 1, 1998, provides eligible employees with the opportunity to acquire an ownership interest in the Company through periodic payroll deductions and provides a discounted purchase price as well as a look-back period. The 1998 Purchase Plan is structured as a qualified employee stock purchase plan under Section 423 of the Internal Revenue Code of 1986. However, the 1998 Purchase Plan is not intended to be a qualified pension, profit sharing or stock bonus plan under Section 401(a) of the Internal Revenue Code of 1986 and is not subject to the provisions of the Employee Retirement Income Security Act of 1974. The 1998 Purchase Plan will terminate upon the earlier of August 1, 2018 or the date on which all shares available for issuance have been sold. Of the 50.0 million shares authorized under the 1998 Purchase Plan, 3.2 million shares remained available for issuance as of June 27, 2015. The 1998 Purchase Plan provides a 5% discount and a six month look-back period.
Full Value Awards
Full Value Awards refer to RSUs and Performance Units that are granted with the exercise price equal to zero and are converted to shares immediately upon vesting. These Full Value Awards are performance-based, time-based or a combination of both and expected to vest over one to four years. The fair value of the time-based Full Value Awards is based on the closing market price of the Company’s common stock on the date of award.
Stock-Based Compensation
The impact on the Company’s results of operations of recording stock-based compensation by function for fiscal 2015, 2014 and 2013 was as follows (in millions):
|
|
|
Years Ended |
| |||||||
|
|
|
June 27, 2015 |
|
June 28, 2014 |
|
June 29, 2013 |
| |||
|
Cost of sales |
|
$ |
9.3 |
|
$ |
9.9 |
|
$ |
9.3 |
|
|
Research and development |
|
15.3 |
|
15.6 |
|
13.5 |
| |||
|
Selling, general and administrative |
|
42.3 |
|
38.6 |
|
33.5 |
| |||
|
|
|
$ |
66.9 |
|
$ |
64.1 |
|
$ |
56.3 |
|
Approximately $1.9 million of stock-based compensation was capitalized to inventory at June 27, 2015.
VIAVI SOLUTIONS INC.
NOTES TO CONSOLIDATED FINANCIAL STATEMENTS (Continued)
Impact on Stock-based Compensation Due to Amendments in the Change of Control Benefits Plan
During the year ended June 27, 2015, the Company amended its Change of Control Benefits Plan (the “Plan”) to add a spin-off of certain Company assets to the circumstances that could trigger benefits under the Plan, as well as other revisions. The Chief Executive Officer of the Company and the Chairman of the Compensation Committee approved the separation of certain executives in the current fiscal year. Pursuant to the Plan, upon termination, all unvested equity awards that have been granted or issued to certain terminated executives become immediately vested and stock options shall become fully exercisable with an extended exercise period of two years from the termination date.
The amendments resulted in a modification of equity awards for seven executives and total incremental stock-based compensation of $6.8 million, which is being amortized over the period between the modification date and the termination dates of the executives. The Company recognized $6.2 million of stock-based compensation resulting from the modification during the year ended June 27, 2015.
Stock Option Activity
The Company granted no stock options during fiscal 2015, 2014 and 2013. The total intrinsic value of options exercised during the year ended June 27, 2015 was $5.0 million. In connection with these exercises, the tax benefit realized by the Company was immaterial due to the fact that the Company has no material benefit in foreign jurisdictions and a full valuation allowance on its domestic deferred tax assets.
As of June 27, 2015 stock-based compensation cost related to stock options has been fully amortized.
The following is a summary of stock option activities (amount in millions except per share amounts):
|
|
|
Options Outstanding |
| ||
|
|
|
Number of Shares |
|
Weighted-Average |
|
|
Balance as of June 30, 2012 |
|
8.2 |
|
10.02 |
|
|
Exercised |
|
(2.0 |
) |
7.64 |
|
|
Forfeited |
|
(0.2 |
) |
10.86 |
|
|
Canceled |
|
(0.4 |
) |
15.69 |
|
|
Balance as of June 29, 2013 |
|
5.6 |
|
10.56 |
|
|
Exercised |
|
(1.6 |
) |
7.91 |
|
|
Canceled |
|
(0.5 |
) |
22.24 |
|
|
Balance as of June 28, 2014 |
|
3.5 |
|
10.13 |
|
|
Exercised |
|
(0.9 |
) |
7.58 |
|
|
Canceled |
|
(0.1 |
) |
14.54 |
|
|
Balance as of June 27, 2015 |
|
2.5 |
|
10.84 |
|
The following table summarizes significant ranges of outstanding and exercisable options as of June 27, 2015:
|
|
|
Options Outstanding |
|
Options Exercisable |
| ||||||||||||||||
|
Range of Exercise Prices |
|
Number of |
|
Weighted |
|
Weighted |
|
Aggregate |
|
Number of |
|
Weighted |
|
Weighted |
|
Aggregate |
| ||||
|
$0.00 - 10.00 |
|
816,985 |
|
1.9 |
|
$ |
5.19 |
|
$ |
5.6 |
|
816,985 |
|
1.9 |
|
$ |
5.19 |
|
$ |
5.6 |
|
|
10.01 - 20.00 |
|
1,427,879 |
|
2.9 |
|
11.87 |
|
1.7 |
|
1,427,879 |
|
2.9 |
|
11.87 |
|
1.7 |
| ||||
|
20.01 - 30.00 |
|
262,500 |
|
3.8 |
|
22.83 |
|
— |
|
262,500 |
|
3.8 |
|
22.83 |
|
— |
| ||||
|
30.01 - 100.00 |
|
— |
|
— |
|
— |
|
— |
|
— |
|
— |
|
— |
|
— |
| ||||
|
|
|
2,507,364 |
|
2.7 |
|
10.84 |
|
$ |
7.3 |
|
2,507,364 |
|
2.7 |
|
10.84 |
|
$ |
7.3 |
| ||
VIAVI SOLUTIONS INC.
NOTES TO CONSOLIDATED FINANCIAL STATEMENTS (Continued)
The aggregate intrinsic value in the table above represents the total pre-tax intrinsic value, based on the Company’s closing stock price of $12.01 as of June 27, 2015, which would have been received by the option holders had all option holders exercised their options as of that date. The total number of in-the-money options exercisable as of June 27, 2015 was 1.9 million.
Employee Stock Purchase Plan Activity
The compensation expense in connection with the Company’s ESPP for the year ended June 27, 2015 was $1.4 million. The expense related to the plan is recorded on a straight-line basis over the relevant subscription period.
The following table summarizes the shares issued and the fair market value at purchase date, pursuant to the Company’s ESPP during the year ended June 27, 2015:
|
Purchase Date |
|
May 29, 2015 |
|
January 30, 2015 |
|
July 31, 2014 |
| |||
|
Shares issued |
|
297,274 |
|
500,015 |
|
438,931 |
| |||
|
Fair market value at purchase date |
|
$ |
12.82 |
|
$ |
12.15 |
|
$ |
11.87 |
|
As of June 27, 2015, there were no unrecognized stock-based compensation costs related to ESPP to be amortized.
Full Value Awards Activity
During fiscal 2015, 2014 and 2013, the Company’s Board of Directors approved the grant of 6.0 million, 6.0 million and 6.5 million Full Value Awards to the Company’s Board of Directors and employees and recorded $64.7 million, $60.7 million, and $49.4 million of such compensation expenses, respectively.
As of June 27, 2015, $72.1 million of unrecognized stock-based compensation cost related to Full Value Awards remains to be amortized. That cost is expected to be recognized over an estimated amortization period of 2.0 years.
A summary of the status of the Company’s non-vested Full Value Awards as of June 27, 2015 and changes during the same period is presented below (amount in millions, except per share amounts):
|
|
|
Full Value Awards |
| ||||||
|
|
|
Performance |
|
Non-Performance |
|
Total Number of |
|
Weighted-average |
|
|
Non-vested at June 30, 2012 |
|
0.5 |
|
6.7 |
|
7.2 |
|
12.37 |
|
|
Awards granted |
|
0.7 |
|
5.8 |
|
6.5 |
|
12.40 |
|
|
Awards vested |
|
(0.1 |
) |
(3.6 |
) |
(3.7 |
) |
11.74 |
|
|
Awards forfeited |
|
(0.1 |
) |
(0.9 |
) |
(1.0 |
) |
12.58 |
|
|
Non-vested at June 29, 2013 |
|
1.0 |
|
8.0 |
|
9.0 |
|
12.61 |
|
|
Awards granted |
|
0.6 |
|
5.4 |
|
6.0 |
|
13.42 |
|
|
Awards vested |
|
(0.4 |
) |
(4.1 |
) |
(4.5 |
) |
12.26 |
|
|
Awards forfeited |
|
(0.1 |
) |
(1.0 |
) |
(1.1 |
) |
12.94 |
|
|
Non-vested at June 28, 2014 |
|
1.1 |
|
8.3 |
|
9.4 |
|
13.19 |
|
|
Awards granted |
|
0.7 |
|
5.3 |
|
6.0 |
|
11.78 |
|
|
Awards vested |
|
(0.8 |
) |
(4.4 |
) |
(5.2 |
) |
12.96 |
|
|
Awards forfeited |
|
— |
|
(1.4 |
) |
(1.4 |
) |
13.10 |
|
|
Non-vested at June 27, 2015 |
|
1.0 |
|
7.8 |
|
8.8 |
|
12.36 |
|
During fiscal 2015, 2014 and 2013, the Company granted 0.7 million, 0.6 million and 0.7 million MSUs. These MSUs shares represent the target amount of grants and the actual number of shares awarded upon vesting of the MSUs may be higher or lower depending upon the achievement of the relevant market conditions. The majority of MSUs vest in equal annual installments over three years based on the attainment of certain total shareholder return performance measures and the employee’s continued service through the vest date. The aggregate grant-date fair value of MSUs granted during fiscal 2015, 2014 and 2013 was estimated to be $9.4 million, $9.2 million and $10.7 million respectively, and was calculated using a Monte Carlo simulation.
VIAVI SOLUTIONS INC.
NOTES TO CONSOLIDATED FINANCIAL STATEMENTS (Continued)
Full Value Awards are converted into shares upon vesting. Shares equivalent in value to the minimum withholding taxes liability on the vested shares are withheld by the Company for the payment of such taxes. During fiscal 2015, 2014 and 2013, the Company paid $22.1 million, $21.4 million and $15.9 million, respectively, and classified the payments as operating cash outflows in the Consolidated Statements of Cash Flows.
Valuation Assumptions
The Company estimates the fair value of the MSUs on the date of grant using a Monte Carlo simulation with the following assumptions:
|
|
|
Years Ended |
| ||||
|
|
|
June 27, 2015 |
|
June 28, 2014 |
|
June 29, 2013 |
|
|
Volatility of common stock |
|
40.8 |
% |
53.9 |
% |
57.5 |
% |
|
Average volatility of peer companies |
|
53.4 |
% |
58.6 |
% |
58.3 |
% |
|
Average correlation coefficient of peer companies |
|
0.2156 |
|
0.2920 |
|
0.3208 |
|
|
Risk-free interest rate |
|
0.6 |
% |
0.8 |
% |
0.4 |
% |
The Company estimates the fair value of ESPP using a BSM valuation model. The fair value is estimated on the date of grant using the BSM option valuation model with the following weighted-average assumptions:
|
|
|
Employee Stock Purchase Plans |
| ||||
|
|
|
June 27, 2015 |
|
June 28, 2014 |
|
June 29, 2013 |
|
|
Expected term (in years) |
|
0.5 |
|
0.5 |
|
0.5 |
|
|
Expected volatility |
|
37.9 |
% |
39.5 |
% |
53.9 |
% |
|
Risk-free interest rate |
|
0.1 |
% |
0.1 |
% |
0.1 |
% |
Expected Term: The Company’s expected term is in line with the six month look-back period of its ESPP.
Expected Volatility: The Company determined that a combination of the implied volatility of its traded options and historical volatility of its stock price based on the expected term of the equity instrument most appropriately reflects market expectation of future volatility. Implied volatility is based on traded options of the Company’s common stock with a remaining maturity of six months or greater.
Risk-Free Interest Rate: The Company bases the risk-free interest rate used in the BSM valuation method on the implied yield currently available on U.S. Treasury zero-coupon issues with an equivalent remaining term.
Expected Dividend: The BSM valuation model calls for a single expected dividend yield as an input. The Company has not paid and does not anticipate paying any dividends in the near future.
Note 15. Employee Pension and Other Benefit Plans
Employee 401(k) Plans
The Company sponsors the JDS Uniphase Corporation Employee 401(k) Retirement Plan (the “401(k) Plan”), a Defined Contribution Plan under ERISA, which provides retirement benefits for its eligible employees through tax deferred salary deductions. The 401(k) Plan allows employees to contribute up to 50% of their annual compensation, with contributions limited to $18,000 in calendar year 2015 as set by the Internal Revenue Service.
For all eligible participants who have completed 180 days of service with Viavi, the 401(k) Plan provided for a 100% match of employees’ contributions up to the first 3% of annual compensation and 50% match on the next 2% of compensation. All matching contributions are made in cash and vest immediately. The Company’s matching contributions to the 401(k) Plan were $7.8 million, $7.5 million, and $7.4 million in fiscal 2015, 2014 and 2013, respectively.
VIAVI SOLUTIONS INC.
NOTES TO CONSOLIDATED FINANCIAL STATEMENTS (Continued)
Deferred Compensation Plan
The Company also provides for the benefit of certain eligible employees in the U.S. a non-qualified retirement plan. This plan is designed to permit employee deferral of a portion of salaries in excess of certain tax limits and deferral of bonuses. This plan’s assets are designated as trading securities on the Company’s Consolidated Balance Sheets. Refer to “Note 7. Investments and Fair Value Measurements” for more information. Effective January 1, 2011, the Company suspended all employee contribution into the plan.
Employee Defined Benefit Plans
The Company sponsors significant qualified and non-qualified pension plans for certain past and present employees in the U.K., Switzerland and Germany. The Company also is responsible for the non-pension post-retirement benefit obligation assumed from a past acquisition. Most of the plans have been closed to new participants and no additional service costs are being accrued, except for certain plans in Germany and Switzerland, assumed in connection with acquisitions during fiscal 2010 and fiscal 2014. Benefits are generally based upon years of service and compensation or stated amounts for each year of service. As of June 27, 2015, the U.K. and Switzerland plans were partially funded while the other plans were unfunded. The Company’s policy for funded plans is to make contributions equal to or greater than the requirements prescribed by law or regulation. For unfunded plans, the Company pays the post-retirement benefits when due. Future estimated benefit payments are summarized below. No other required contributions to defined benefit plans are expected in fiscal 2015, but the Company, at its discretion, can make contributions to one or more of the defined benefit plans.
The Company accounts for its obligations under these pension plans in accordance with the authoritative guidance which requires the Company to record its obligation to the participants, as well as the corresponding net periodic cost. The Company determines its obligation to the participants and its net periodic cost principally using actuarial valuations provided by third-party actuaries. The obligation the Company records on its Consolidated Balance Sheets is reflective of the total PBO and the fair value of plan assets.
The following table presents the components of the net periodic cost for the pension and benefits plans (in millions):
|
|
|
Years Ended |
| |||||||
|
Pension Benefits |
|
2015 |
|
2014 |
|
2013 |
| |||
|
Service cost |
|
$ |
0.5 |
|
$ |
0.5 |
|
$ |
0.3 |
|
|
Interest cost |
|
3.8 |
|
4.5 |
|
4.4 |
| |||
|
Expected return on plan assets |
|
(1.7 |
) |
(1.4 |
) |
(1.2 |
) | |||
|
Recognized net actuarial losses |
|
0.4 |
|
0.1 |
|
— |
| |||
|
Net periodic benefit cost |
|
$ |
3.0 |
|
$ |
3.7 |
|
$ |
3.5 |
|
The Company’s accumulated other comprehensive income includes unrealized net actuarial (gains)/losses. The amount expected to be recognized in net periodic benefit cost during fiscal 2016 is $0.8 million.
VIAVI SOLUTIONS INC.
NOTES TO CONSOLIDATED FINANCIAL STATEMENTS (Continued)
The changes in the benefit obligations and plan assets of the pension and benefits plans were (in millions):
|
|
|
Pension Benefit Plans |
| ||||
|
|
|
2015 |
|
2014 |
| ||
|
Change in benefit obligation |
|
|
|
|
| ||
|
Benefit obligation at beginning of year |
|
$ |
143.9 |
|
$ |
121.0 |
|
|
Service cost |
|
0.5 |
|
0.5 |
| ||
|
Interest cost |
|
3.8 |
|
4.5 |
| ||
|
Plan participants’ contributions |
|
0.3 |
|
0.1 |
| ||
|
Actuarial losses |
|
5.1 |
|
10.9 |
| ||
|
Acquisitions |
|
— |
|
3.8 |
| ||
|
Benefits paid |
|
(4.3 |
) |
(4.9 |
) | ||
|
Foreign exchange impact |
|
(21.4 |
) |
8.0 |
| ||
|
Benefit obligation at end of year |
|
$ |
127.9 |
|
$ |
143.9 |
|
|
Change in plan assets |
|
|
|
|
| ||
|
Fair value of plan assets at beginning of year |
|
33.5 |
|
25.6 |
| ||
|
Actual return on plan assets |
|
1.9 |
|
2.0 |
| ||
|
Acquisitions |
|
— |
|
2.7 |
| ||
|
Employer contributions |
|
5.8 |
|
5.1 |
| ||
|
Plan participants’ contributions |
|
0.3 |
|
0.1 |
| ||
|
Benefits paid |
|
(4.3 |
) |
(4.9 |
) | ||
|
Foreign exchange impact |
|
(2.4 |
) |
2.9 |
| ||
|
Fair value of plan assets at end of year |
|
$ |
34.8 |
|
$ |
33.5 |
|
|
Funded status |
|
$ |
(93.1 |
) |
$ |
(110.4 |
) |
|
Accumulated benefit obligation |
|
$ |
126.2 |
|
$ |
142.2 |
|
|
|
|
Pension Benefit Plans |
| ||||
|
|
|
2015 |
|
2014 |
| ||
|
Amount recognized in the Consolidated Balance Sheets at end of year: |
|
|
|
|
| ||
|
Current liabilities |
|
$ |
4.8 |
|
$ |
4.2 |
|
|
Non-current liabilities |
|
88.3 |
|
106.2 |
| ||
|
Net amount recognized at end of year |
|
$ |
93.1 |
|
$ |
110.4 |
|
|
Amount recognized in Accumulated other comprehensive income at end of year: |
|
|
|
|
| ||
|
Actuarial losses, net of tax |
|
$ |
(15.6 |
) |
$ |
(12.3 |
) |
|
Net amount recognized at end of year |
|
$ |
(15.6 |
) |
$ |
(12.3 |
) |
|
Other changes in plan assets and benefit obligations recognized in Other comprehensive loss: |
|
|
|
|
| ||
|
Net actuarial losses |
|
$ |
(3.7 |
) |
$ |
(7.7 |
) |
|
Amortization of accumulated net actuarial losses |
|
0.4 |
|
0.1 |
| ||
|
Total recognized in other comprehensive loss |
|
$ |
(3.3 |
) |
$ |
(7.6 |
) |
As of June 27, 2015 and June 28, 2014, the liability related to the post retirement benefit plan was $1.0 million and $1.1 million respectively. The balances were included in Other non-current liabilities on the Consolidated Balance Sheets.
During fiscal 2015, the Company contributed GBP 0.7 million or approximately $1.1 million, while in fiscal 2014, the Company contributed GBP 0.5 million or approximately $0.7 million to its U.K. pension plan. These contributions allowed the Company to comply with regulatory funding requirements.
VIAVI SOLUTIONS INC.
NOTES TO CONSOLIDATED FINANCIAL STATEMENTS (Continued)
Assumptions
Underlying both the calculation of the PBO and net periodic cost are actuarial valuations. These valuations use participant-specific information such as salary, age, years of service, and assumptions about interest rates, compensation increases and other factors. At a minimum, the Company evaluates these assumptions annually and makes changes as necessary.
The discount rate reflects the estimated rate at which the pension benefits could be effectively settled. In developing the discount rate, the Company considered the yield available on an appropriate AA corporate bond index, adjusted to reflect the term of the scheme’s liabilities as well as a yield curve model developed by the Company’s actuaries.
The expected return on assets was estimated by using the weighted average of the real expected long term return (net of inflation) on the relevant classes of assets based on the target asset mix and adding the chosen inflation assumption.
The following table summarizes the weighted average assumptions used to determine net periodic cost and benefit obligation for the Company’s U.K., Switzerland and German pension plans:
|
|
|
Pension Benefit Plans |
| ||||
|
|
|
2015 |
|
2014 |
|
2013 |
|
|
Weighted-average assumptions used to determine net period cost: |
|
|
|
|
|
|
|
|
Discount rate |
|
3.0 |
% |
3.6 |
% |
4.0 |
% |
|
Expected long-term return on plan assets |
|
5.5 |
|
5.2 |
|
5.2 |
|
|
Rate of pension increase |
|
2.3 |
|
2.2 |
|
2.0 |
|
|
|
|
|
|
|
|
|
|
|
Weighted-average assumptions used to determine benefit obligation at end of year: |
|
|
|
|
|
|
|
|
Discount rate |
|
2.6 |
% |
2.9 |
% |
3.7 |
% |
|
Rate of pension increase |
|
2.2 |
|
2.1 |
|
2.2 |
|
Investment Policies and Strategies
The Company’s investment objectives for its funded pension plan are to ensure that there are sufficient assets available to pay out members’ benefits as and when they arise and that should the plan be discontinued at any point in time there would be sufficient assets to meet the discontinuance liabilities.
To achieve the objectives, the trustees of the U.K. pension plan are responsible for regularly monitoring the funding position and managing the risk by investing in assets expected to outperform the increase in value of the liabilities in the long term and by investing in a diversified portfolio of assets in order to minimize volatility in the funding position. The trustees invest in a range of frequently traded funds (“pooled funds”) rather than direct holdings in individual securities to maintain liquidity, achieve diversification and reduce the potential for risk concentration. The funded plan assets are managed by professional third-party investment managers.
The Swiss pension plan assets are managed by a professional third-party service provider which provides management service in compliance with Swiss regulations. This service provider manages the plan assets of its affiliated companies as a pool and invests in a diversified portfolio of funds to maintain liquidity and reduce risk.
VIAVI SOLUTIONS INC.
NOTES TO CONSOLIDATED FINANCIAL STATEMENTS (Continued)
Fair Value Measurement of Plan Assets
The following table sets forth the U.K. and Swiss plans’ assets at fair value and the percentage of assets allocations as of June 27, 2015 (in millions, except percentage data). The fair value of U.K. and Swiss pension assets was approximately $30.2 million and $4.6 million, respectively, as of June 27, 2015.
|
|
|
|
|
|
|
|
|
Fair value measurement as of |
| |||||
|
|
|
|
|
|
|
|
|
June 27, 2015 |
| |||||
|
|
|
Target |
|
Total |
|
Percentage of |
|
Quoted Prices |
|
Significant |
| |||
|
Assets: |
|
|
|
|
|
|
|
|
|
|
| |||
|
Global equity |
|
38 |
% |
$ |
13.6 |
|
39.1 |
% |
$ |
— |
|
$ |
13.6 |
|
|
Fixed income |
|
39 |
% |
13.3 |
|
38.2 |
% |
— |
|
13.3 |
| |||
|
Other |
|
23 |
% |
7.5 |
|
21.6 |
% |
— |
|
7.5 |
| |||
|
Cash |
|
|
|
0.4 |
|
1.1 |
% |
0.4 |
|
— |
| |||
|
Total assets |
|
|
|
$ |
34.8 |
|
100.0 |
% |
$ |
0.4 |
|
$ |
34.4 |
|
The following table sets forth the plan’s assets at fair value and the percentage of assets allocations as of June 28, 2014 (in millions, except percentage data).
|
|
|
|
|
|
|
|
|
Fair value measurement as of |
| |||||
|
|
|
|
|
|
|
|
|
June 28, 2014 |
| |||||
|
|
|
Target |
|
Total |
|
Percentage of |
|
Quoted Prices |
|
Significant |
| |||
|
Assets: |
|
|
|
|
|
|
|
|
|
|
| |||
|
Global equity |
|
39 |
% |
$ |
13.0 |
|
38.8 |
% |
$ |
— |
|
$ |
13.0 |
|
|
Fixed income |
|
40 |
% |
13.3 |
|
39.7 |
% |
— |
|
13.3 |
| |||
|
Other |
|
21 |
% |
7.0 |
|
20.9 |
% |
— |
|
7.0 |
| |||
|
Cash |
|
|
|
0.2 |
|
0.6 |
% |
0.2 |
|
— |
| |||
|
Total assets |
|
|
|
$ |
33.5 |
|
100.0 |
% |
$ |
0.2 |
|
$ |
33.3 |
|
The Company’s pension assets consist of multiple institutional funds (“pension funds”) of which the fair values are based on the quoted prices of the underlying funds. Pension funds are classified as Level 2 assets since such funds are not directly traded in active markets.
Global equity consists of several index funds that invest primarily in U.K. equities, Switzerland equities and other overseas equities.
Fixed income consists of several funds that invest primarily in index-linked Gilts (over 5 year), sterling-denominated investment grade corporate bonds and overseas government bonds.
Other consists of several funds that primarily invest in global equities, bonds, private equity, global real estate and infrastructure funds.
VIAVI SOLUTIONS INC.
NOTES TO CONSOLIDATED FINANCIAL STATEMENTS (Continued)
Future Benefit Payments
The following table reflects the total expected benefit payments to defined benefit pension plan participants. These payments have been estimated based on the same assumptions used to measure the Company’s PBO at year end and include benefits attributable to estimated future compensation increases.
|
(in millions) |
|
Pension Benefit Plans |
| |
|
2016 |
|
$ |
5.9 |
|
|
2017 |
|
6.2 |
| |
|
2018 |
|
6.1 |
| |
|
2019 |
|
6.3 |
| |
|
2020 |
|
5.8 |
| |
|
2021 - 2025 |
|
32.8 |
| |
|
Thereafter |
|
30.0 |
| |
|
Total |
|
$ |
93.1 |
|
Note 16. Commitments and Contingencies
Operating Leases
The Company leases certain real and personal property from unrelated third parties under non-cancelable operating leases that expire at various dates through fiscal 2026. Certain leases require the Company to pay property taxes, insurance and routine maintenance, and include escalation clauses. As of June 27, 2015, future minimum annual lease payments under non-cancelable operating leases were as follows (in millions):
|
2016 |
|
$ |
23.1 |
|
|
2017 |
|
21.3 |
| |
|
2018 |
|
18.1 |
| |
|
2019 |
|
13.0 |
| |
|
2020 |
|
7.9 |
| |
|
Thereafter |
|
12.4 |
| |
|
Total minimum operating lease payments |
|
$ |
95.8 |
|
Included in the future minimum lease payments table above is $8.2 million related to lease commitments in connection with the Company’s restructuring and related activities. Refer to “Note 11. Restructuring and Related Charges” for more information.
The aggregate future minimum rentals to be received under non-cancelable subleases totaled $6.2 million as of June 27, 2015. Rental expense relating to building and equipment was $22.4 million, $26.6 million and $26.0 million in fiscal 2015, 2014 and 2013, respectively.
Purchase Obligations
Purchase obligations of $150.9 million as of June 27, 2015, represent legally-binding commitments to purchase inventory and other commitments made in the normal course of business to meet operational requirements. Although open purchase orders are considered enforceable and legally binding, the terms generally allow the option to cancel, reschedule and adjust the requirements based on the Company’s business needs prior to the delivery of goods or performance of services. Obligations to purchase inventory and other commitments are generally expected to be fulfilled within one year.
The Company depends on a limited number of contract manufacturers, subcontractors, and suppliers for raw materials, packages and standard components. The Company generally purchases these single or limited source products through standard purchase orders or one-year supply agreements and has no significant long-term guaranteed supply agreements with such vendors. While the Company seeks to maintain a sufficient safety stock of such products and maintains on-going communications with its suppliers to guard against interruptions or cessation of supply, the Company’s business and results of operations could be adversely affected by a stoppage or delay of supply, substitution of more expensive or less reliable products, receipt of defective parts or contaminated materials, increases in the price of such supplies, or the Company’s inability to obtain reduced pricing from its suppliers in response to competitive pressures.
VIAVI SOLUTIONS INC.
NOTES TO CONSOLIDATED FINANCIAL STATEMENTS (Continued)
Financing Obligations—Eningen and Santa Rosa
Eningen
On December 16, 2011, the Company executed and closed the sale and leaseback transaction of certain buildings and land in Eningen, Germany (the “Eningen Transactions”). The Company sold approximately 394,217 square feet of land, nine buildings with approximately 386,132 rentable square feet, and parking areas. The Company leased back approximately 158,154 rentable square feet comprised of two buildings and a portion of a basement of another building (the “Leased Premises”). The lease term is 10 years with the right to cancel a certain portion of the lease after 5 years. The gross cash proceeds received from the transaction were approximately €7.1 million.
Concurrent with the sale and lease back, the Company has provided collateral in case of a default by the Company relative to future lease payments for the Leased Premises. Due to this continuing involvement, the related portion of the cash proceeds and transaction costs, associated with the Leased Premises and other buildings which the Company continues to occupy, was recorded under the financing method in accordance with the authoritative guidance on leases and sales of real estate. Accordingly, the carrying value of these buildings and associated land will remain on the Company’s books and the buildings will continue to be depreciated over their remaining useful lives. The portion of the proceeds received have been recorded as a financing obligation, a portion of the lease payments are recorded as a decrease to the financing obligation and a portion is recognized as interest expense. Imputed rental income from the buildings sold but not leased back and currently being occupied is recorded as a reduction in the financing obligation.
As of June 27, 2015, of the total financing obligation related to the Eningen Transactions, $0.1 million was included in Other current liabilities, and $4.1 million was included in Other non-current liabilities. As of June 28, 2014, of the total financing obligation related to the Eningen Transactions, $0.1 million was included in Other current liabilities, and $5.2 million was included in Other non-current liabilities.
Santa Rosa
On August 21, 2007, the Company entered into a sale and lease back of certain buildings and land in Santa Rosa, California (the “Santa Rosa Transactions”). The Company sold approximately 45 acres of land, 13 buildings with approximately 492,000 rentable square feet, a building pad, and parking areas. The Company leased back 7 buildings with approximately 286,000 rentable square feet. The net cash proceeds received from the transaction were $32.2 million. The lease terms range from a one-year lease with multiple renewal options to a ten-year lease with two five-year renewal options.
The Company has an ongoing obligation to remediate environmental matters, impacting the entire site, as required by the North Coast Regional Water Quality Control Board which existed at the time of sale. Concurrent with the sale and lease back, the Company has issued an irrevocable letter of credit for $3.8 million as security for the remediation of the environmental matter that remains in effect until the issuance of a notice of no further action letter from the North Coast Regional Water Quality Control Board. In addition, the lease agreement for one building included an option to purchase at fair market value, at the end of the lease term. Due to these various forms of continuing involvement the transaction was recorded under the financing method in accordance with the authoritative guidance on leases and sales of real estate.
Accordingly, the value of the buildings and land will remain on the Company’s books and the buildings will continue to be depreciated over their remaining useful lives. The proceeds received have been recorded as a financing obligation, a portion of the lease payments are recorded as a decrease to the financing obligation and a portion is recognized as interest expense. Imputed rental income from the buildings sold but not leased back is recorded as a reduction in the financing obligation.
As of June 27, 2015, $1.4 million was included in Other current liabilities, and $24.8 million was included in Other non-current liabilities. As of June 28, 2014, $1.2 million was included in Other current liabilities, and $26.2 million was included in Other non-current liabilities.
The lease payments due under the agreement reset to fair market rental rates upon the Company’s execution of the renewal options.
VIAVI SOLUTIONS INC.
NOTES TO CONSOLIDATED FINANCIAL STATEMENTS (Continued)
Guarantees
In accordance with authoritative guidance which requires that upon issuance of a guarantee, the guarantor must recognize a liability for the fair value of the obligation it assumes under that guarantee. In addition, disclosures about the guarantees that an entity has issued, including a tabular reconciliation of the changes of the entity’s product warranty liabilities, are required.
The Company from time to time enters into certain types of contracts that contingently require the Company to indemnify parties against third-party claims. These contracts primarily relate to: (i) divestiture agreements, under which the Company may provide customary indemnifications to purchasers of the Company’s businesses or assets; (ii) certain real estate leases, under which the Company may be required to indemnify property owners for environmental and other liabilities, and other claims arising from the Company’s use of the applicable premises; and (iii) certain agreements with the Company’s officers, directors and employees, under which the Company may be required to indemnify such persons for liabilities arising out of their employment relationship.
The terms of such obligations vary. Generally, a maximum obligation is not explicitly stated. Because the obligated amounts of these types of agreements often are not explicitly stated, the overall maximum amount of the obligations cannot be reasonably estimated. Historically, the Company has not been obligated to make significant payments for these obligations, and no liabilities have been recorded for these obligations on the consolidated balance sheet as of June 27, 2015 and June 28, 2014.
Product Warranties
In general, the Company offers a one-year warranty for most of its products. The Company provides reserves for the estimated costs of product warranties at the time revenue is recognized. The Company estimates the costs of its warranty obligations based on its historical experience of known product failure rates, use of materials to repair or replace defective products and service delivery costs incurred in correcting product failures. In addition, from time to time, specific warranty accruals may be made if unforeseen technical problems arise with specific products. The Company periodically assesses the adequacy of its recorded warranty liabilities and adjusts the amounts as necessary.
The following table presents the changes in the Company’s warranty reserve during fiscal 2015 and fiscal 2014 (in millions):
|
|
|
Year Ended |
| ||||
|
|
|
June 27, 2015 |
|
June 28, 2014 |
| ||
|
Balance as of beginning of period |
|
$ |
6.3 |
|
$ |
6.9 |
|
|
Provision for warranty |
|
7.6 |
|
7.8 |
| ||
|
Utilization of reserve |
|
(7.0 |
) |
(6.5 |
) | ||
|
Adjustments related to pre-existing warranties (including changes in estimates) |
|
(0.2 |
) |
(1.9 |
) | ||
|
Balance as of end of period |
|
$ |
6.7 |
|
$ |
6.3 |
|
Legal Proceedings
The Company is subject to a variety of claims and suits that arise from time to time in the ordinary course of our business. While management currently believes that resolving claims against the Company, individually or in aggregate, will not have a material adverse impact on its financial position, results of operations or statement of cash flows, these matters are subject to inherent uncertainties and management’s view of these matters may change in the future. Were an unfavorable final outcome to occur, there exists the possibility of a material adverse impact on the Company’s financial position, results of operations or cash flows for the period in which the effect becomes reasonably estimable.
Note 17. Operating Segments and Geographic Information
The Company evaluates its reportable segments in accordance with the authoritative guidance on segment reporting. The Company’s Chief Executive Officer, Thomas H. Waechter, is the Company’s Chief Operating Decision Maker (“CODM”) pursuant to the guidance. The CODM allocates resources to the segments based on their business prospects, competitive factors, net revenue and operating results.
The Company is a leading provider of network service and enablement solutions and optical products for telecommunications (“Telecom”) service providers, cable operators, network equipment manufacturers (“NEMs”) and enterprises. Viavi’s diverse technology portfolio also fights counterfeiting and enables commercial lasers for a range of manufacturing applications.
VIAVI SOLUTIONS INC.
NOTES TO CONSOLIDATED FINANCIAL STATEMENTS (Continued)
In fiscal 2015, the Company reorganized its NSE reportable segment into two separate reportable segments, Network Enablement and Service Enablement. Splitting NSE into two reportable segments provides greater clarity and transparency regarding the markets, financial performance and business models of the NE and SE businesses. NE is a hardware-centric and more mature business consisting primarily of NSE’s traditional communications test instrument products. SE is a software-centric business consisting primarily of software solutions that are embedded within the network and enterprise performance management solutions. Historical segment numbers have been recast to conform to this new reporting structure in our financial statements.
The Company’s reportable segments are:
Network Enablement
NE provides an integrated portfolio of testing solutions that access the network to perform build out and maintenance tasks. These solutions include instruments, software and services to design, build, turn-up, certify, troubleshoot, and optimize networks and support more profitable, higher-performing networks and help speed time-to-revenue.
Service Enablement
SE provides embedded systems and enterprise performance management solutions that supply global service providers, enterprises and cloud operators visibility into network, service and application data. These solutions—primarily consisting of instruments, microprobes and software—monitor, collect and analyze network data to reveal the actual customer experience and to identify opportunities for new revenue streams and network optimization.
Communications and Commercial Optical Products
CCOP provides optical components, modules, subsystems, and solutions used by Telecom and data communications (“Datacom”), NEMs and both traditional and cloud/data center service providers. These products enable the transmission and transport of video, audio and text data over high-capacity fiber optic cables. Transmission products primarily consist of optical transceivers, optical transponders, and their supporting components such as modulators and source lasers, including innovative products such as the Tunable Small Form-factor Pluggable Plus transceiver. Transport products primarily consist of modules or sub-systems containing optical amplifiers, reconfigurable optical add/drop multiplexers (“ROADMs”) or Wavelength Selective Switches, Optical Channel Monitors and their supporting components. CCOP products for 3-D sensing applications, formerly referred to as our gesture recognition products, include a light source product. Customer solutions containing CCOP’s 3-D sensing products let a person control electronic or computer devices with natural body or hand gestures instead of using a remote, mouse or other device.
CCOP also provides a broad laser portfolio that serve customers in markets and applications such as manufacturing, biotechnology, graphics and imaging, remote sensing, and precision machining such as drilling in printed circuit boards, wafer singulation and solar cell scribing. These products include diode, direct-diode, diode-pumped solid-state, fiber, and gas lasers.
Optical Security and Performance Products
OSP provides innovative optical security technologies, with a strategic focus on serving the anti-counterfeiting market through advanced security pigments, thread substrates and printed features for the currency, pharmaceutical and consumer electronic segments. OSP also provides optical filters 3-D sensing and other applications.
The accounting policies of the reportable segments are the same as those described in the summary of significant accounting policies. The Company evaluates segment performance based on operating income (loss), excluding certain infrequent or unusual items.
The amounts shown as Corporate consist of certain unallocated corporate-level operating expenses. In addition, the Company does not allocate stock-based compensation, acquisition-related charges and amortization of intangibles, restructuring and related charges, non-operating income and expenses, or other non-recurring charges as highlighted in the table below.
VIAVI SOLUTIONS INC.
NOTES TO CONSOLIDATED FINANCIAL STATEMENTS (Continued)
Information on reportable segments is as follows (in millions):
|
|
|
Years Ended |
| |||||||
|
|
|
June 27, 2015 |
|
June 28, 2014 |
|
June 29, 2013 |
| |||
|
Net revenue: |
|
|
|
|
|
|
| |||
|
Network Enablement |
|
$ |
532.2 |
|
$ |
602.4 |
|
$ |
571.7 |
|
|
Service Enablement |
|
169.0 |
|
145.9 |
|
157.2 |
| |||
|
Communications and Commercial Optical Products |
|
815.1 |
|
794.1 |
|
742.2 |
| |||
|
Optical Security and Performance Products |
|
192.8 |
|
200.8 |
|
205.8 |
| |||
|
Net revenue |
|
$ |
1,709.1 |
|
$ |
1,743.2 |
|
$ |
1,676.9 |
|
|
|
|
|
|
|
|
|
| |||
|
Operating income (loss): |
|
|
|
|
|
|
| |||
|
Network Enablement |
|
$ |
90.6 |
|
$ |
105.9 |
|
$ |
87.0 |
|
|
Service Enablement |
|
(18.0 |
) |
(25.6 |
) |
(3.9 |
) | |||
|
Communications and Commercial Optical Products |
|
90.2 |
|
93.5 |
|
82.4 |
| |||
|
Optical Security and Performance Products |
|
74.9 |
|
72.0 |
|
73.2 |
| |||
|
Corporate |
|
(88.6 |
) |
(95.0 |
) |
(92.9 |
) | |||
|
Total segment operating income |
|
149.1 |
|
150.8 |
|
145.8 |
| |||
|
Unallocated amounts: |
|
|
|
|
|
|
| |||
|
Stock-based compensation |
|
(66.9 |
) |
(64.1 |
) |
(56.4 |
) | |||
|
Amortization of intangibles |
|
(59.2 |
) |
(59.0 |
) |
(76.0 |
) | |||
|
Loss on disposal of long-lived assets |
|
(1.4 |
) |
(2.0 |
) |
(3.6 |
) | |||
|
Restructuring and related charges (1) |
|
(34.5 |
) |
(23.8 |
) |
(19.0 |
) | |||
|
Other charges related to non-recurring activities (1) (2) |
|
(39.4 |
) |
(3.6 |
) |
(15.7 |
) | |||
|
Interest and other income (expense), net |
|
3.4 |
|
0.5 |
|
(4.1 |
) | |||
|
Interest expense |
|
(34.0 |
) |
(29.7 |
) |
(17.9 |
) | |||
|
Loss from operations before income taxes |
|
$ |
(82.9 |
) |
$ |
(30.9 |
) |
$ |
(46.9 |
) |
(1) Restructuring and related charges and Other charges related to non-recurring charges during fiscal 2015, primarily relate to costs incurred in connection with the separation of the Lumentum business. Refer to “Note 11. Restructuring and Related Charges” for more information.
(2) During fiscal 2013, the Company incurred $11.3 million of inventory related charges, included in Cost of sales, primarily related to a write-off of inventory no longer being sold due to a strategic plan to exit NE’s legacy low-speed wireline product line approved in the third quarter of fiscal 2013.
VIAVI SOLUTIONS INC.
NOTES TO CONSOLIDATED FINANCIAL STATEMENTS (Continued)
The table below discloses the percentage of the Company’s total net revenue attributable to each of our four reportable segments. In addition, it discloses the percentage of the Company’s total net revenue attributable to our Optical Communications (“OpComms”) products within the CCOP segment, which accounted for more than 10% of our consolidated net revenue in each of the last three fiscal years, and Laser products, which represents the remainder of the CCOP segment:
|
|
|
Years Ended |
| ||||
|
|
|
June 27, 2015 |
|
June 28, 2014 |
|
June 29, 2013 |
|
|
Network Enablement |
|
31.1 |
% |
34.5 |
% |
34.0 |
% |
|
Service Enablement |
|
9.9 |
|
8.4 |
|
9.4 |
|
|
Communications and Commercial Optical Products: |
|
|
|
|
|
|
|
|
Optical Communications |
|
39.3 |
|
38.5 |
|
37.3 |
|
|
Lasers |
|
8.4 |
|
7.1 |
|
7.0 |
|
|
Communications and Commercial Optical Products |
|
47.7 |
|
45.6 |
|
44.3 |
|
|
Optical Security and Performance Products |
|
11.3 |
|
11.5 |
|
12.3 |
|
The Company operates primarily in three geographic regions: Americas, Asia-Pacific, and Europe, Middle East and Africa (“EMEA”). Net revenue is assigned to the geographic region and country where our product is initially shipped. For example, certain customers may request shipment of our product to a contract manufacturer in one country, which may differ from the location of their end customers. The following tables present net revenue and identifiable assets by geographic regions (in millions):
|
|
|
Years Ended |
| |||||||||||||
|
|
|
June 27, 2015 |
|
June 28, 2014 |
|
June 29, 2013 |
| |||||||||
|
Net revenue: |
|
|
|
|
|
|
|
|
|
|
|
|
| |||
|
Americas |
|
$ |
791.7 |
|
46.3 |
% |
$ |
826.0 |
|
47.4 |
% |
$ |
822.5 |
|
49.1 |
% |
|
Asia-Pacific |
|
543.8 |
|
31.8 |
|
505.4 |
|
29.0 |
|
473.2 |
|
28.2 |
| |||
|
EMEA |
|
373.6 |
|
21.9 |
|
411.8 |
|
23.6 |
|
381.2 |
|
22.7 |
| |||
|
Total net revenue |
|
$ |
1,709.1 |
|
100.0 |
% |
$ |
1,743.2 |
|
100.0 |
% |
$ |
1,676.9 |
|
100.0 |
% |
Net revenue was assigned to geographic regions based on the customers’ shipment locations. Net revenue for Americas included net revenue from United States of $591.3 million, $626.7 million and $630.8 million, for the fiscal years ended June 27, 2015, June 28, 2014 and June 29, 2013, respectively, based on customers’ shipment location.
During fiscal 2015, 2014 and 2013, no customer accounted for more than 10% of net revenue.
Long-lived assets, namely net property, plant and equipment were identified based on the operations in the corresponding geographic areas (in millions):
|
|
|
Years Ended |
| ||||
|
|
|
June 27, 2015 |
|
June 28, 2014 |
| ||
|
United States |
|
$ |
157.9 |
|
$ |
144.6 |
|
|
Other Americas |
|
18.6 |
|
15.6 |
| ||
|
China |
|
66.4 |
|
72.6 |
| ||
|
Thailand |
|
29.0 |
|
29.8 |
| ||
|
Other Asia-Pacific |
|
8.0 |
|
9.2 |
| ||
|
EMEA |
|
14.7 |
|
17.0 |
| ||
|
Total long-lived assets |
|
$ |
294.6 |
|
$ |
288.8 |
|
VIAVI SOLUTIONS INC.
NOTES TO CONSOLIDATED FINANCIAL STATEMENTS (Continued)
Note 18. Discontinued Operations
During the second quarter of fiscal 2013, the Company closed the sale of the Hologram Business, previously within the OSP reportable segment, to OpSec Security. The Company received gross proceeds of $11.5 million in cash, which resulted in a $0.6 million gain recorded as a component of net income from discontinued operations that was offset by loss from the discontinued business in fiscal 2013. Net revenue of the Hologram Business for fiscal 2013 was $5.2 million and net loss from discontinued operations was insignificant. There was no tax effect associated with the discontinued operation.
In accordance with the applicable accounting guidance for the disposal of long-lived assets, the results of the Hologram Business have been excluded from both continuing operations and segment results for all periods presented.
The gain on recorded in connection with the sale of the Hologram Business was calculated as follows (in millions):
|
Gross Proceeds |
|
$ |
11.5 |
|
|
Less: carrying value of net assets |
|
(10.6 |
) | |
|
Less: selling costs |
|
(0.3 |
) | |
|
Gain |
|
$ |
0.6 |
|
The carrying value of the net assets sold as of October 12, 2012 are as follows (in millions):
|
|
|
October 12, 2012 |
| |
|
Accounts receivable, net |
|
$ |
2.7 |
|
|
Inventories, net |
|
4.4 |
| |
|
Property, plant and equipment, net |
|
0.8 |
| |
|
Intangibles, net |
|
5.8 |
| |
|
Accounts payable and accrued expenses |
|
(1.5 |
) | |
|
Other current and non-current liabilities |
|
(1.6 |
) | |
|
Net assets sold |
|
$ |
10.6 |
|
VIAVI SOLUTIONS INC.
NOTES TO CONSOLIDATED FINANCIAL STATEMENTS (Continued)
Note 19. Quarterly Financial Information (unaudited)
The following table presents the Company’s quarterly consolidated statements of operations for fiscal 2015 and 2014 (in millions, except per share data):
|
|
|
June 27, |
|
March 28, |
|
December |
|
September |
|
June 28, |
|
March 29, |
|
December |
|
September |
| ||||||||
|
Net revenue |
|
$ |
427.7 |
|
$ |
410.7 |
|
$ |
437.1 |
|
$ |
433.6 |
|
$ |
448.6 |
|
$ |
418.0 |
|
$ |
447.6 |
|
$ |
429.0 |
|
|
Cost of sales |
|
225.7 |
|
215.5 |
|
225.5 |
|
224.3 |
|
228.2 |
|
222.3 |
|
232.8 |
|
232.4 |
| ||||||||
|
Amortization of acquired technologies |
|
7.4 |
|
10.9 |
|
11.1 |
|
10.0 |
|
10.9 |
|
11.0 |
|
9.9 |
|
11.4 |
| ||||||||
|
Gross profit |
|
194.6 |
|
184.3 |
|
200.5 |
|
199.3 |
|
209.5 |
|
184.7 |
|
204.9 |
|
185.2 |
| ||||||||
|
Operating expenses: |
|
|
|
|
|
|
|
|
|
|
|
|
|
|
|
|
| ||||||||
|
Research and development |
|
80.9 |
|
76.7 |
|
79.2 |
|
76.4 |
|
80.0 |
|
74.1 |
|
72.3 |
|
69.6 |
| ||||||||
|
Selling, general and administrative |
|
121.3 |
|
116.7 |
|
114.8 |
|
110.7 |
|
120.9 |
|
113.4 |
|
109.0 |
|
107.1 |
| ||||||||
|
Amortization of other intangibles |
|
4.8 |
|
4.9 |
|
5.0 |
|
5.1 |
|
5.1 |
|
5.2 |
|
2.8 |
|
2.7 |
| ||||||||
|
Restructuring and related charges |
|
13.6 |
|
8.3 |
|
9.7 |
|
2.9 |
|
20.0 |
|
3.6 |
|
1.0 |
|
(0.8 |
) | ||||||||
|
Total operating expenses |
|
220.6 |
|
206.6 |
|
208.7 |
|
195.1 |
|
226.0 |
|
196.3 |
|
185.1 |
|
178.6 |
| ||||||||
|
(Loss) income from operations |
|
(26.0 |
) |
(22.3 |
) |
(8.2 |
) |
4.2 |
|
(16.5 |
) |
(11.6 |
) |
19.8 |
|
6.6 |
| ||||||||
|
Interest and other income (expense), net |
|
2.2 |
|
0.3 |
|
0.4 |
|
0.5 |
|
0.1 |
|
0.6 |
|
0.4 |
|
(0.6 |
) | ||||||||
|
Interest expense |
|
(8.6 |
) |
(8.6 |
) |
(8.5 |
) |
(8.3 |
) |
(8.4 |
) |
(7.7 |
) |
(8.4 |
) |
(5.2 |
) | ||||||||
|
(Loss) income before income taxes |
|
(32.4 |
) |
(30.6 |
) |
(16.3 |
) |
(3.6 |
) |
(24.8 |
) |
(18.7 |
) |
11.8 |
|
0.8 |
| ||||||||
|
Provision for (Benefit from) income taxes (2) (3) |
|
7.7 |
|
(17.4 |
) |
8.8 |
|
6.1 |
|
0.6 |
|
(17.2 |
) |
3.0 |
|
0.5 |
| ||||||||
|
Net (loss) income |
|
$ |
(40.1 |
) |
$ |
(13.2 |
) |
$ |
(25.1 |
) |
$ |
(9.7 |
) |
$ |
(25.4 |
) |
$ |
(1.5 |
) |
$ |
8.8 |
|
$ |
0.3 |
|
|
|
|
|
|
|
|
|
|
|
|
|
|
|
|
|
|
|
| ||||||||
|
Net (loss) income per share from (1): |
|
|
|
|
|
|
|
|
|
|
|
|
|
|
|
|
| ||||||||
|
Basic |
|
$ |
(0.17 |
) |
$ |
(0.06 |
) |
$ |
(0.11 |
) |
$ |
(0.04 |
) |
$ |
(0.11 |
) |
$ |
(0.01 |
) |
$ |
0.04 |
|
$ |
0.00 |
|
|
Diluted |
|
$ |
(0.17 |
) |
$ |
(0.06 |
) |
$ |
(0.11 |
) |
$ |
(0.04 |
) |
$ |
(0.11 |
) |
$ |
(0.01 |
) |
$ |
0.04 |
|
$ |
0.00 |
|
|
Shares used in per share calculation: |
|
|
|
|
|
|
|
|
|
|
|
|
|
|
|
|
| ||||||||
|
Basic |
|
234.6 |
|
233.2 |
|
232.1 |
|
230.8 |
|
234.3 |
|
234.0 |
|
233.0 |
|
235.3 |
| ||||||||
|
Diluted net income (loss) per share from: |
|
234.6 |
|
233.2 |
|
232.1 |
|
230.8 |
|
234.3 |
|
234.0 |
|
235.8 |
|
239.6 |
| ||||||||
(1) Net income (loss) per share is computed independently for each of the quarters presented. Therefore, the sum of the quarterly basic and diluted net income (loss) per share amounts do not equal the annual basic and diluted net income (loss) per share amount for fiscal 2014.
(2) During the third quarter of fiscal 2014, the Company recognized $21.7 million of uncertain tax benefits related to deferred tax assets due to the expiration of the statute of limitations in a non-U.S. jurisdiction.
(3) During the third quarter of fiscal 2015, the company recognized $21.8 million tax benefit recognized upon the settlement of an audit in a non-U.S. jurisdiction.
Note 20. Subsequent Events
Separation of the Lumentum Business
On August 1, 2015, the Company completed the previously announced separation of the Lumentum business and distributed approximately 80.1% of the outstanding shares of Lumentum common stock to Viavi shareholders who received one share of Lumentum common stock for every five shares of Viavi common stock. The Company was renamed Viavi and, at the time of the distribution, retained ownership of approximately 19.9%, or 11.7 million shares, of Lumentum’s outstanding shares. On August 4, 2015, the Company began “regular-way” trading on NASDAQ under the ticker symbol “VIAV.”
The Company expects to recognize a significant taxable gain for federal and state income tax purposes as a result of the separation of the Lumentum business. The Company also expects to utilize significant net operating losses and other tax attributes in connection with the recognition of the gain.
On July 31, 2015, in connection with the formation of Lumentum Inc., the Company received 40,000 shares of Lumentum Inc.’s Series A Preferred Stock (“Series A Preferred Stock”). Pursuant to the binding commitment to sell the Series A Preferred Stock to Amada Holdings Co., Ltd. (“Amada”), the Company sold 35,805 shares of the Series A Preferred Stock to Amada for $35.8 million and the remaining 4,195 shares of the Series A Preferred Stock were canceled.
ITEM 9. CHANGES IN AND DISAGREEMENTS WITH ACCOUNTANTS ON ACCOUNTING AND FINANCIAL DISCLOSURE
None.
ITEM 9A. CONTROLS AND PROCEDURES
(a) EVALUATION OF DISCLOSURE CONTROLS AND PROCEDURES
Based on the evaluation of our disclosure controls and procedures (as defined in the Rules 13a-15(e) and 15d-15(e) under the Securities Exchange Act of 1934, or the Exchange Act) required by Exchange Act Rules 13a-15(b) or 15d-15(b), our chief executive officer and our chief financial officer have concluded that as of the end of the period covered by this report, our disclosure controls and procedures were effective.
(b) MANAGEMENT’S REPORT ON INTERNAL CONTROL OVER FINANCIAL REPORTING
Our management is responsible for establishing and maintaining adequate internal control over financial reporting. Our management, including our chief executive officer and chief financial officer, conducted an evaluation of the effectiveness of our internal control over financial reporting based on the framework in the Internal Control—Integrated Framework (2013) issued by the Committee of Sponsoring Organizations of the Treadway Commission. Based on its evaluation under the framework in the Internal Control—Integrated Framework (2013), our management concluded that our internal control over financial reporting was effective as of June 27, 2015. The Company’s internal control over financial reporting as of June 27, 2015 has been audited by PricewaterhouseCoopers LLP, an independent registered public accounting firm, as stated in their report which appears in this Annual Report on Form 10-K under Item 8.
(c) CHANGES IN INTERNAL CONTROL OVER FINANCIAL REPORTING
There were no changes in our internal control over financial reporting as defined in Exchange Act Rule 13a-15(f) that occurred during our most recently completed fiscal quarter that have materially affected, or are reasonably likely to materially affect, our internal control over financial reporting.
None.
ITEM 10. DIRECTORS, EXECUTIVE OFFICERS AND CORPORATE GOVERNANCE
Information regarding the Company’s executive officers and directors required by this Item is incorporated by reference to the section entitled “Proposal One—Elections of Directors” in the Company’s Definitive Proxy Statement in connection with the 2015 Annual Meeting of Stockholders (the “Proxy Statement”), which will be filed with the Securities and Exchange Commission within 120 days after the fiscal year ended June 27, 2015. Information required by Item 405 of Regulation S-K is incorporated by reference to the section entitled “Beneficial Ownership Reporting Compliance” in the Proxy Statement.
The Company has adopted the “Viavi Code of Business Conduct” as its code of ethics, which is applicable to all employees, officers and directors of the Company. The full text of the Viavi Code of Business Conduct is available under Corporate Governance Information which can be found under the Investors tab on the Company’s website at www.viavisolutions.com.
ITEM 11. EXECUTIVE COMPENSATION
Information required by this Item is incorporated by reference to the sections entitled “Executive Compensation,” “Director Compensation,” “Compensation Program Risk Assessment,” “Corporate Governance—Compensation Committee Interlocks and Insider Participation,” and “Compensation Committee Report” in the Proxy Statement.
ITEM 12. SECURITY OWNERSHIP OF CERTAIN BENEFICIAL OWNERS AND MANAGEMENT AND RELATED STOCKHOLDER MATTERS
Information regarding security ownership of certain beneficial owners and management is incorporated by reference to the section entitled “Security Ownership of Certain Beneficial Owners and Management” in the Proxy Statement.
Information regarding the Company’s stockholder approved and non-approved equity compensation plans is incorporated by reference to the section entitled “Equity Compensation Plans” in the Proxy Statement.
ITEM 13. CERTAIN RELATIONSHIPS AND RELATED TRANSACTIONS, AND DIRECTOR INDEPENDENCE
Information required by this Item is incorporated by reference to the sections entitled “Certain Relationships and Related Person Transactions,” and “Code of Ethics,” “Director Independence,” and “Board Committees and Meetings” under the “Corporate Governance” heading in the Proxy Statement.
ITEM 14. PRINCIPAL ACCOUNTING FEES AND SERVICES
Information required by this item is incorporated by reference to the section entitled “Audit and Non-Audit Fees” in the Proxy Statement.
ITEM 15. EXHIBITS, FINANCIAL STATEMENT SCHEDULES
(a) The following items are filed as part of this Annual Report on Form 10-K:
(1) Financial Statements:
(2) Financial Statement Schedules:
The following additional financial statement schedule should be considered in conjunction with our consolidated financial statements. All other financial statement schedules have been omitted because the required information is not present in amounts sufficient to require submission of the schedule, not applicable, or because the required information is included in the Consolidated Financial Statements or Notes thereto.
VIAVI SOLUTIONS INC.
FINANCIAL STATEMENT SCHEDULE
SCHEDULE II - VALUATION AND QUALIFYING ACCOUNTS
|
Column A |
|
Column B |
|
Column C |
|
Column D |
|
Column E |
| ||||
|
Description |
|
Balance at |
|
Additions Charged |
|
Deductions Credited |
|
Balance at |
| ||||
|
|
|
(in millions) |
| ||||||||||
|
2015 |
|
|
|
|
|
|
|
|
| ||||
|
Deferred tax valuation allowance |
|
$ |
2,499.8 |
|
$ |
44.3 |
|
$ |
(56.0 |
) |
$ |
2,488.1 |
|
|
2014 |
|
|
|
|
|
|
|
|
| ||||
|
Deferred tax valuation allowance |
|
$ |
2,549.1 |
|
$ |
33.8 |
|
$ |
(83.1 |
) |
$ |
2,499.8 |
|
|
2013 |
|
|
|
|
|
|
|
|
| ||||
|
Deferred tax valuation allowance |
|
$ |
2,637.0 |
|
$ |
49.2 |
|
$ |
(137.1 |
) |
$ |
2,549.1 |
|
* Additions include current year additions charged to expenses and current year build due to increases in net deferred tax assets, return to provision true-ups, other adjustments and OCI impact to deferred taxes.
** Deductions include current year releases credited to expenses and current year reductions due to decreases in net deferred tax assets, return to provision true-ups, other adjustments and OCI impact to deferred taxes.
(3) Exhibits:
See Item 15(b)
(b) Exhibits:
The following exhibits are filed herewith or are incorporated by reference to exhibits previously filed with the Securities and Exchange Commission.
|
|
|
|
|
Incorporated by Reference |
|
Filed |
| ||||
|
Exhibit No. |
|
Exhibit Description |
|
Form |
|
Exhibit |
|
Filing Date |
|
Herewith |
|
|
|
|
|
|
|
|
|
|
|
|
|
|
|
2.1 |
|
Agreement and Plan of Merger, dated December 6, 2013, by and among NI Holdings I, Inc., a Delaware corporation, the Company, Jade Acquisition I, Inc., a Delaware corporation and wholly owned subsidiary of the Company, Thoma Bravo, LLC, a Delaware limited liability company, solely in its capacity as Representative for NI Holdings’ stockholders, Thoma Bravo Fund X, L.P., a Delaware limited partnership, and Thoma Bravo Fund X-A., L.P., a Delaware limited partnership. |
|
8-K |
|
2.1 |
|
12/11/2013 |
|
|
|
|
|
|
|
|
|
|
|
|
|
|
|
|
|
2.2 |
|
Contribution Agreement by and between JDS Uniphase Corporation and Lumentum Operations LLC |
|
8-K |
|
2.1 |
|
8/5/2015 |
|
|
|
|
|
|
|
|
|
|
|
|
|
|
|
|
|
2.3 |
|
Membership Interest Transfer Agreement by and between JDS Uniphase Corporation and Lumentum Inc. |
|
8-K |
|
2.2 |
|
8/5/2015 |
|
|
|
|
|
|
|
|
|
|
|
|
|
|
|
|
|
2.4 |
|
Separation and Distribution Agreement by and between JDS Uniphase Corporation, Lumentum Holdings Inc. and Lumentum Operations LLC |
|
8-K |
|
2.3 |
|
8/5/2015 |
|
|
|
|
|
|
|
|
|
|
|
|
|
|
|
|
|
3.1 |
|
Restated Certificate of Incorporation |
|
8-K |
|
3.1 |
|
11/18/2013 |
|
|
|
|
|
|
|
|
|
|
|
|
|
|
|
|
|
3.2 |
|
Certificate of Amendment to Restated Certificate of Incorporation |
|
8-K |
|
3.1 |
|
8/5/2015 |
|
|
|
|
|
|
|
|
|
|
|
|
|
|
|
|
|
3.5 |
|
Amended and Restated Bylaws of Viavi Solutions Inc. |
|
8-K |
|
3.2 |
|
8/5/2015 |
|
|
|
|
|
|
|
|
|
|
|
|
|
|
|
|
|
4.1 |
|
Indenture, dated as of August 21, 2013, between JDS Uniphase Corporation and Wells Fargo Bank, National Association, as Trustee |
|
8-K |
|
4.1 |
|
8/21/2013 |
|
|
|
|
|
|
|
|
|
|
|
|
|
|
|
|
|
4.2 |
|
Form of 0.625% Senior Convertible Debentures due 2033 |
|
8-K |
|
4.2 |
|
8/21/2013 |
|
|
|
|
|
|
|
|
|
|
|
|
|
|
|
|
|
4.3 |
|
Stockholder’s and Registration Rights Agreement by and between JDS Uniphase Corporation and Lumentum Holdings Inc. |
|
8-K |
|
4.1 |
|
8/5/2015 |
|
|
|
|
|
|
|
|
|
|
|
|
|
|
|
|
|
10.2 |
|
Amended and Restated 1993 Flexible Stock Incentive Plan (Amended and Restated as of November 9, 2001) |
|
10-Q |
|
10.1 |
|
2/11/2002 |
|
|
|
|
|
|
|
|
|
|
|
|
|
|
|
|
|
10.3 |
|
Restated 1998 Employee Stock Purchase Plan |
|
|
|
|
|
|
|
X |
|
|
|
|
|
|
|
|
|
|
|
|
|
|
|
10.4 |
|
Amended and Restated 1999 Canadian Employee Stock Purchase Plan (Amended and Restated as of July 31, 2002) |
|
10-K |
|
10.4 |
|
9/17/2002 |
|
|
|
|
|
|
|
|
|
|
|
|
|
|
|
|
|
10.5 |
|
Restated 2005 Acquisition Equity Incentive Plan |
|
|
|
|
|
|
|
X |
|
|
|
|
|
|
|
|
|
|
|
|
|
|
|
10.6 |
|
2005 Acquisition Equity Incentive Plan Form of Stock Option Award Agreement |
|
10-K |
|
10.6 |
|
9/30/2005 |
|
|
|
|
|
|
|
|
|
|
|
|
|
|
|
|
|
10.7 |
|
2005 Acquisition Equity Incentive Plan Form of Restricted Stock Unit Award Agreement |
|
10-K |
|
10.7 |
|
9/30/2005 |
|
|
|
|
|
|
|
|
|
|
|
|
|
|
|
|
|
10.8 |
|
2008 Change of Control Benefits Plan |
|
8-K |
|
10.2 |
|
10/23/2014 |
|
|
|
|
|
|
|
|
|
|
|
|
|
|
|
|
|
10.9 |
|
Form of Indemnification Agreement |
|
8-K |
|
10.9 |
|
4/20/2015 |
|
|
|
|
|
|
|
|
|
|
|
|
|
|
|
|
|
10.10 |
|
Restated 2003 Equity Incentive Plan |
|
|
|
|
|
|
|
X |
|
|
|
|
|
|
|
|
|
|
|
|
|
|
|
10.11 |
|
Separation Agreement between JDS Uniphase Corporation and Rex Jackson dated February 24, 2015 |
|
8-K |
|
10.1 |
|
2/26/2015 |
|
|
|
|
|
|
|
|
|
|
|
|
|
|
|
|
|
10.12 |
|
Separation Agreement between the JDS Uniphase Corporation and David Heard, dated October 23, 2014 |
|
8-K |
|
10.1 |
|
10/23/2014 |
|
|
|
|
10.13 |
|
Separation Agreement and General Release between Viavi Solutions Inc. and Thomas Waechter dated August 13, 2015 |
|
8-K |
|
10.1 |
|
8/19/2015 |
|
|
|
|
|
|
|
|
|
|
|
|
|
|
|
|
|
10.14 |
|
Employment Agreement between Viavi Solutions Inc. and Richard Belluzzo dated August 19, 2015 |
|
8-K |
|
10.2 |
|
8/19/2015 |
|
|
|
|
|
|
|
|
|
|
|
|
|
|
|
|
|
10.15 |
|
Tax Matters Agreement by and between JDS Uniphase Corporation and Lumentum Holdings Inc. |
|
8-K |
|
10.1 |
|
8/5/2015 |
|
|
|
|
|
|
|
|
|
|
|
|
|
|
|
|
|
10.16 |
|
Employee Matters Agreement by and between JDS Uniphase Corporation, Lumentum Holdings Inc. and Lumentum Operations LLC |
|
8-K |
|
10.2 |
|
8/5/2015 |
|
|
|
|
|
|
|
|
|
|
|
|
|
|
|
|
|
10.17 |
|
Intellectual Property Matters Agreement by and between JDS Uniphase Corporation and Lumentum Operations LLC |
|
8-K |
|
10.3 |
|
8/5/2015 |
|
|
|
|
|
|
|
|
|
|
|
|
|
|
|
|
|
10.18 |
|
JDS Uniphase Corporation 2015 Change of Control Benefits Plan (NSE), effective February 10, 2015 |
|
|
|
|
|
|
|
X |
|
|
|
|
|
|
|
|
|
|
|
|
|
|
|
10.19 |
|
JDS Uniphase Corporation 2015 Optical Security and Performance Products Change of Control Benefits Plan, effective January 15, 2015 |
|
|
|
|
|
|
|
X |
|
|
|
|
|
|
|
|
|
|
|
|
|
|
|
10.20 |
|
2003 Equity Incentive Plan Form of Stock Option Award Agreement (for the U.S) |
|
10-K |
|
10.20 |
|
8/31/2010 |
|
|
|
|
|
|
|
|
|
|
|
|
|
|
|
|
|
10.24 |
|
2003 Equity Incentive Plan Form of Restricted Stock Unit Award Agreement (for the U.S) |
|
10-K |
|
10.24 |
|
8/31/2010 |
|
|
|
|
|
|
|
|
|
|
|
|
|
|
|
|
|
21.1 |
|
Subsidiaries of Viavi Solutions Inc. |
|
|
|
|
|
|
|
X |
|
|
|
|
|
|
|
|
|
|
|
|
|
|
|
23.1 |
|
Consent of Independent Registered Public Accounting Firm (PricewaterhouseCoopers LLP) |
|
|
|
|
|
|
|
X |
|
|
|
|
|
|
|
|
|
|
|
|
|
|
|
31.1 |
|
Certification of the Chief Executive Officer pursuant to Securities Exchange Act Rules 13a-14(a) and 15d-14(a), as adopted pursuant to Section 302 of the Sarbanes-Oxley Act of 2002. |
|
|
|
|
|
|
|
X |
|
|
|
|
|
|
|
|
|
|
|
|
|
|
|
31.2 |
|
Certification of the Chief Financial Officer pursuant to Securities Exchange Act Rules 13a-14(a) and 15d-14(a), as adopted pursuant to Section 302 of the Sarbanes-Oxley Act of 2002. |
|
|
|
|
|
|
|
X |
|
|
|
|
|
|
|
|
|
|
|
|
|
|
|
32.1 |
|
Certification of the Chief Executive Officer pursuant to 18 U.S.C. Section 1350, as adopted pursuant to Section 906 of the Sarbanes-Oxley Act of 2002. |
|
|
|
|
|
|
|
X |
|
|
|
|
|
|
|
|
|
|
|
|
|
|
|
32.2 |
|
Certification of the Chief Financial Officer pursuant to 18 U.S.C. Section 1350, as adopted pursuant to Section 906 of the Sarbanes-Oxley Act of 2002. |
|
|
|
|
|
|
|
X |
|
|
|
|
|
|
|
|
|
|
|
|
|
|
|
101.INS |
|
XBRL Instance |
|
|
|
|
|
|
|
X |
|
|
|
|
|
|
|
|
|
|
|
|
|
|
|
101.SCH |
|
XBRL Taxonomy Extension Schema |
|
|
|
|
|
|
|
X |
|
|
|
|
|
|
|
|
|
|
|
|
|
|
|
101.CAL |
|
XBRL Taxonomy Extension Calculation |
|
|
|
|
|
|
|
X |
|
|
|
|
|
|
|
|
|
|
|
|
|
|
|
101.DEF |
|
XBRL Taxonomy Extension Definition Linkbase Document |
|
|
|
|
|
|
|
X |
|
|
|
|
|
|
|
|
|
|
|
|
|
|
|
101.LAB |
|
XBRL Taxonomy Extension Label Linkbase |
|
|
|
|
|
|
|
X |
|
|
|
|
|
|
|
|
|
|
|
|
|
|
|
101.PRE |
|
XBRL Taxonomy Extension Presentation |
|
|
|
|
|
|
|
X |
|
Pursuant to the requirements of Section 13 or 15(d) of the Securities Exchange Act of 1934, the Registrant has duly caused this report on Form 10-K to be signed on its behalf by the undersigned, thereunto duly authorized.
|
Date: August 25, 2015 |
VIAVI SOLUTIONS INC. | ||
|
|
| ||
|
|
By: |
|
/s/ REX S. JACKSON |
|
|
Name: |
|
Rex S. Jackson |
|
|
Title: |
|
Executive Vice President and Chief Financial Officer |
|
|
|
|
(Duly Authorized Officer and Principal Financial and Accounting Officer) |
Pursuant to the requirements of the Securities Exchange Act of 1934, this Annual Report on Form 10-K has been signed below by the following persons on behalf of the Registrant and in the capacities and on the dates indicated.
|
Signature |
|
Title |
|
Date |
|
|
|
|
|
|
|
/s/ RICHARD BELLUZZO |
|
Interim President and Chief Executive Officer |
|
August 25, 2015 |
|
Richard Belluzzo |
|
(Principal Executive Officer) and Chairman |
|
|
|
|
|
|
|
|
|
/s/ REX S. JACKSON |
|
Executive Vice President and Chief Financial Officer |
|
August 25, 2015 |
|
Rex S. Jackson |
|
(Principal Financial and Accounting Officer) |
|
|
|
|
|
|
|
|
|
/s/ KEITH BARNES |
|
Director |
|
August 25, 2015 |
|
Keith Barnes |
|
|
|
|
|
|
|
|
|
|
|
/s/ TIMOTHY E. CAMPOS |
|
Director |
|
August 25, 2015 |
|
Timothy E. Campos |
|
|
|
|
|
|
|
|
|
|
|
/s/ MASOOD JABBAR |
|
Director |
|
August 25, 2015 |
|
Masood Jabbar |
|
|
|
|
|
|
|
|
|
|
|
/s/ PAMELA STRAYER |
|
Director |
|
August 25, 2015 |
|
Pamela Strayer |
|
|
|
|